natural resources update - bnl.gov · natural resources update . tonight’s agenda 2012 site...
TRANSCRIPT

Natural Resources Update
Tim Green Environmental Protection Division
January 9, 2014

Natural Resources Update
Tonight’s Agenda 2012 Site Environmental Report – flora and fauna Deer
• Status of deer management • Status of 4-Poster
Long Island Solar Farm research Long Island bats

2012 SER Chapter 6 – flora & fauna monitoring Average by Sampling Group
Long-term Trend in Cs-137 Average On and Near Off-site Sampling
Deer Sampling – 4 on-site, 5 off-site samples (none
greater than 1 mile from BNL) – Cs-137 average for on site (0.12 pCi/g,
wet weight) is lower than average within 1 mile of the Laboratory (0.54 pCi/g, wet weight)
– Highest sample value was 1.52 pCi/g, wet weight, from sample taken on the William Floyd Parkway
– Ten-year trend for on and near off-site samples indicate stabilizing trend with average values less than 2.0 pCi/g,wet weight; 10 year average 1.05 pCi/g, wet weight
– Bone samples analyzed for Sr-90 indicate background levels, 2012 is last year for Sr-90 testing of bone
Other Wildlife – Two turkeys tested, 0.03 and 0.20
pCi/g, wet weight, respectively for Cs-137
– Single goose tested with a non-detect for Cs-137

Chapter 6 – Flora and Fauna Monitoring (continued) Fish Sampling - Surveillance
– On- and off-site fish sampling indicated low levels of Cs-137 (<0.30 pCi/g, wet weight) consistent with previous years
– Mercury (max value 1.08 mg/kg in a Largemouth Bass from on site Area D)
2012 Mercury content in Peconic River and Carmans River fish (average, maximum, and minimum values in mg/kg)

Chapter 6 – Flora and Fauna Monitoring (continued) Aquatic Sampling - Surveillance
– On-site aquatic vegetation contained non-detectable levels of Cs-137, off-site locations had levels <0.04 pCi/g, wet weight, and mercury content < 0.06 mg/kg most with levels <MDL
– Sediments over all values <0.72 pCi/g, dry weight, of Cs-137; consistent with levels in previous years
– Mercury in sediments generally < 0.19 mg/kg
Terrestrial Sampling – Garden Vegetables: no detection of Cs-137 – Garden Soils at background levels: 0.17 pCi/g, dry weight, of Cs-137 – 2012 last year for garden vegetable monitoring – Grassy Vegetation: no detection to 0.39 pCi/g, wet weight, of Cs-137 – Associated Soils: Cs-137 0.41 to 43.9 pCi/g, dry weight, most at background; high
value located at FHWMF wetland and is below clean-up goals

Chapter 6 – Flora and Fauna Monitoring (continued) Basin Sediments
– Detectable levels of Cs-137 at CSF and HT-W basins < 0.17 pCi/g, dry weight – Metals in basins were all less than SCDHS action levels or NYSDEC industrial
levels; most results within typical background levels – SVOCs were mostly less than MDLs with exception of Basin HT-W which had
several PAHs with levels greater than SCDHS action levels; additional monitoring has been implemented – source may be natural or from road runnoff.
– PCBs and pesticides found at low levels consistent with past monitoring
Precipitation Monitoring – Quarterly analysis for radiological components indicated normal background – Mercury analysis indicated depositional values between 2.92 ng/L to 11.6 ng/L
consistent with what has been seen since monitoring began in 2006

Chapter 6 – Flora and Fauna Monitoring (continued)
2012 Peconic River Post Cleanup Monitoring – First year of required reporting in SER – No fish monitoring associated with post cleanup
– alternates with surveillance monitoring. Post cleanup fish monitoring will occur in 2013. (We presented preliminary 2013 data back in September)
– Mercury sampling of sediment consisted of three samples, two below 2.0 mg/kg, one with 3.6 mg/kg mercury
– Mercury and methyl mercury sampling in water column; – 9 stations in both June and July could not be sampled due to low
water levels. – Mercury in STP effluents continued to decline with ongoing
mercury minimization efforts. – concentrations of both generally trended downward the further
from the STP outfall.
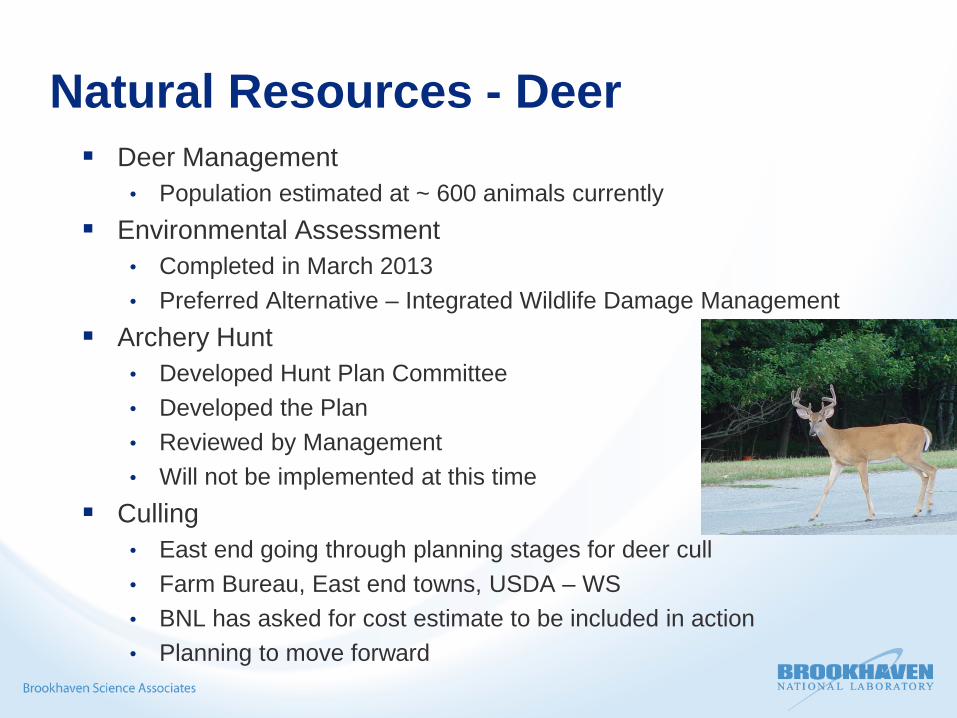
Natural Resources - Deer Deer Management
• Population estimated at ~ 600 animals currently Environmental Assessment
• Completed in March 2013 • Preferred Alternative – Integrated Wildlife Damage Management
Archery Hunt • Developed Hunt Plan Committee • Developed the Plan • Reviewed by Management • Will not be implemented at this time
Culling • East end going through planning stages for deer cull • Farm Bureau, East end towns, USDA – WS • BNL has asked for cost estimate to be included in action • Planning to move forward

Tick Management
Devices to be moved in 2014. 1, 8, 9

4 – Poster Deployment
Devices deployed March – Sept. avoiding hunting season Tick monitoring – before, during, after annual deployment
– too early to determine effectiveness Photo monitoring of each device (game cameras
deployed) • Thousands of photos taken • Photos show deer, raccoon, squirrels, turkey, and a few other
animals using the devices.

4 – Poster Deployment Other data still being tallied for annual report
• Amount of corn used • Amount of tickicide used
Operation is definitely labor intensive • Devices monitored 2x/week • Add corn, add tickicide, change rollers, repair damage • Maintain log books • Download cameras, sort photos • Conduct tick surveys

Tick Management
New tool - Metarhizium anisopliae strain F52 • Fungus than can be applied to forest understory and turf • Attacks ticks and kills them from inside out
Investigating its use in areas where the 4-Poster can’t be used
Source: planetearth.nerc.ac.uk

Long Island Solar Farm Studies Objectives Compare small mammal population inside and outside the
LISF. Compare vegetation inside and outside the solar facility to determine food sources available for small mammals.
Assess wildlife use of openings along fence bottoms and natural gaps to document species use and frequency of use by opening type.
Determine eastern box turtle and other reptile and amphibian use of the solar facility.
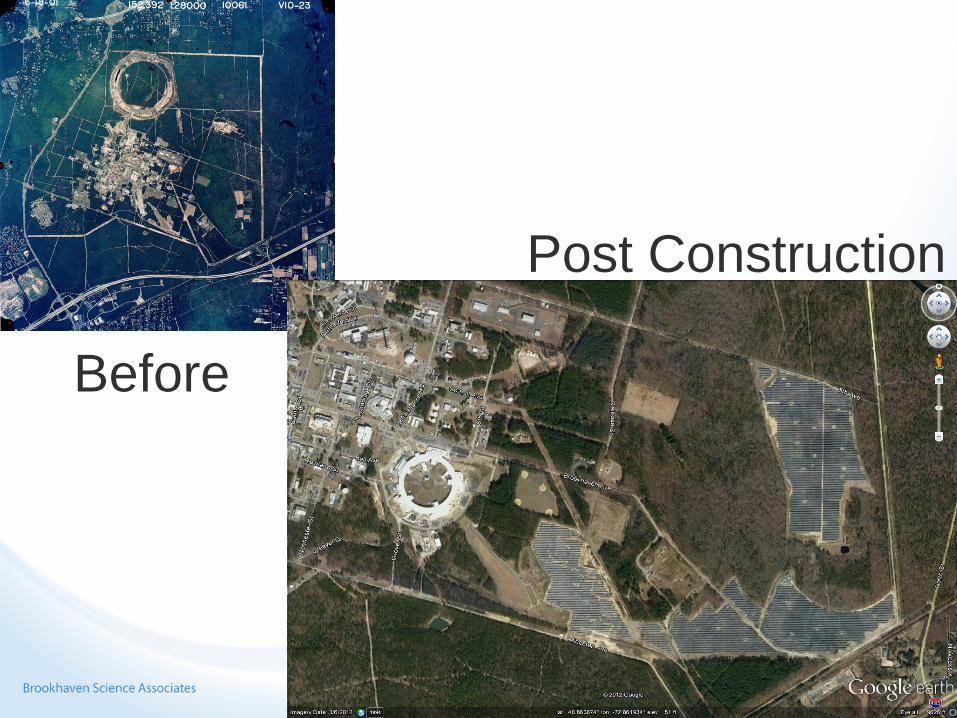
Before
Post Construction

Small Mammals
10 Locations • 5 along fences • 5 interior of solar array or habitat
8x8 trap grid – 5m apart 3 times per year

16

Small Mammals
17

Small Mammal Trapping
18
0102030405060
Summer2012
Fall 2012 Spring 2013 Summer2013
Cap
ture
s
Season
New Captures and Recaptures per Season
Inside
Outside
0
5
10
15
20
25
30
1b 2a 2b 3a 3b 4a 4b 5a 5b 6a 6b 7a 7b 11a
11b
12a
12b
13a
13b
Cap
ture
s
Area
Total Captures per Area
Species
Chipmunk (T. striatus)
Eastern Mole (S. aquaticus)
Masked Shrew
(S. cinereus)
Meadow Jumping Mouse
(Z. hudsonius)
Meadow Vole (M.
Pennsylvanicus)
Southern Flying
Squirrel (G. volans)
White Footed Mouse
(P. leucopus)
Captures 1 2 2 1 1 4 110
Recaptures
0 0 0 0 1 0 107
Array 1 - Red Array 2 - Yellow Array 4 - Green Array 5 - Purple Array 6 - Blue

Fence Openings
Fenced • 8 ft. tall with 2 ft. tip out • Reinforced bar on top and bottom • 4 x 12 in. opening every 75 ft.

Methods – Wildlife Use of Fence
11 – 8MP Trail Cameras Deployed at fence openings and natural
gaps Moved every 2 weeks Record wildlife use Natural Gaps vs. Openings

Reptiles and Amphibians
Eastern Box Turtle • Radio telemetry • 26 w/transmitters
Transect Surveys
• 30 inside • 25 outside

22

23

24

Amphibians
Frog Call Surveys • FrogWatch USA protocols
Dip Net / Seine Surveys
Egg Mass Surveys
• Salamanders

26
Species Found within the solar farm (First-hand account)
Past Sightings within the solar farm (Second hand accounts)
Fowler’s Toad Snapping Turtle (Array 2) Spade Foot Toad Eastern Box Turtle (Array 4) Green Frog Black Racer Snake (Array 2) Bull Frog Hognose Snake Gray Tree Frog Garter Snake Tadpoles (species undetermined)
Table 1: Species Observational Presence
Sun vs. Shade

Bats - update
White-nose Syndrome (WNS) identified in 2008 earliest evidence documented its presence in NY in 2006
Over 6 million bats have died to date Once plentiful species may be listed as T&E
• Northern (Long-eared) bat proposed for listing as Federally Endangered
• Would be BNL’s 1st federally endangered species

BNL and bats
2012 surveys had fair abundance of Red, Big Brown, and Northern Bat (15)
2013 surveys mostly Red and Big Brown Bats • Only one Northern Bat
Small-footed bats detected acoustically both years • Where are they roosting? Are they just passing through?
Future work to look at potential roosting sites, for Northern Bat and Small-footed bats.
NYSDEC to do work on LI in 2014.

Questions?
Photo courtesy of Mike Fishman