national water quality assessment program national fixed site
TRANSCRIPT

National Water Quality Assessment Program
National Fixed Site Network

NAWQA Cycles I and II (1991-2012)
Data and Findings Network Information About UsAnnual Water-Quality Reporting
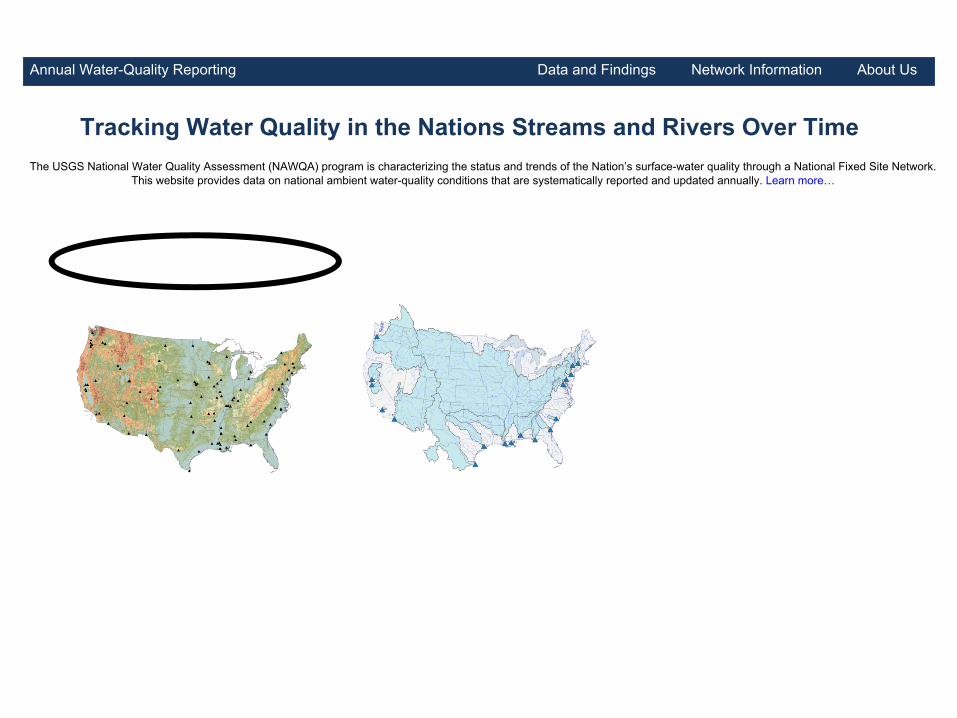
Tracking Water Quality in the Nations Streams and Rivers Over TimeThe USGS National Water Quality Assessment (NAWQA) program is characterizing the status and trends of the Nation’s surface-water quality through a National Fixed Site Network.
This website provides data on national ambient water-quality conditions that are systematically reported and updated annually. Learn more…

Data and Findings Network Information About UsAnnual Water-Quality Reporting
Potomac River at Chain Bridge, DCStation ID: 01646580
Relevant Links: ,
X
Download Data

Data and Findings Network Information About UsAnnual Water-Quality Reporting
No detections above benchmark (13 samples)
Download plot Download plot
Potomac River at Chain Bridge at Washington, DC
Station ID: 01646580
Summary of Water-Quality for 2013
Back to Map

Lowess smooth
Long-term mean
Long-term mean
Data and Findings Network Information About UsAnnual Water-Quality Reporting
❑❑❑
❑
❑
❑❑❑
Download DataDownload Graphs
Potomac River at Chain Bridge at Washington, DC
Station ID: 01646580Back to Map

Lowess smooth
Long-term mean
Long-term mean
Data and Findings Network Information About UsAnnual Water-Quality Reporting
❑❑❑
❑
❑
❑❑❑
Download DataDownload Graphs
Potomac River at Chain Bridge at Washington, DC
Station ID: 01646580
❑
❑
❑❑❑
Long-term mean
Long-term mean
Back to Map

Data and Findings Network Information About UsAnnual Water-Quality Reporting
Tracking Water Quality in the Nations Streams and Rivers Over TimeThe USGS National Water Quality Assessment (NAWQA) program is characterizing the status and trends of the Nation’s surface-water quality through a National Fixed Site Network.
This website provides data on national ambient water-quality conditions that are systematically reported and updated annually. Learn more…

Data and Findings Network Information About UsAnnual Water-Quality Reporting
Download Data
Nutrient Loads for the Mississippi-Atchafalaya River BasinThe width of each river show’s it’s relative contribution to nitrate loading (show percent contribution) Toggle Sites
Help?

Data and Findings Network Information About UsAnnual Water-Quality Reporting
Download Data
Nutrient Loads for the Mississippi-Atchafalaya River BasinThe width of each river show’s it’s relative contribution to nitrate loading (show percent contribution)
X X
Toggle Sites
Help?

Data and Findings Network Information About UsAnnual Water-Quality Reporting
Download Data
Nutrient Loads for the Mississippi-Atchafalaya River BasinThe width of each river show’s it’s relative contribution to nitrate loading (show percent contribution)
Mississippi River at Gulf
Relevant Links: ,
Toggle Sites
Help?

Data and Findings Network Information About UsAnnual Water-Quality Reporting
Nutrient Loads for the Mississippi-Atchafalaya River BasinThe width of each river show’s it’s relative contribution to nitrate loading (show percent contribution )
Download Data
Toggle Sites
Help?

Data and Findings Network Information About UsAnnual Water-Quality Reporting
Tracking Water Quality in the Nations Streams and Rivers Over TimeThe USGS National Water Quality Assessment (NAWQA) program is characterizing the status and trends of the Nation’s surface-water quality through a National Fixed Site Network.
This website provides data on national ambient water-quality conditions that are systematically reported and updated annually. Learn more…

Data and Findings Network Information About UsAnnual Water-Quality Reporting

Data and Findings Network Information About UsAnnual Water-Quality Reporting

…
