national survey results - public policy polling survey results q1 do you approve or disapprove of...
TRANSCRIPT
Feburary 2-3, 2016Survey of 1,236 registered votersFeburary 2-3, 2016Survey of 1,236 registered voters
3020 Highwoods Blvd.Raleigh, NC 27604
[email protected] / 888 621-6988
3020 Highwoods Blvd.Raleigh, NC 27604
[email protected] / 888 621-6988
National Survey Results
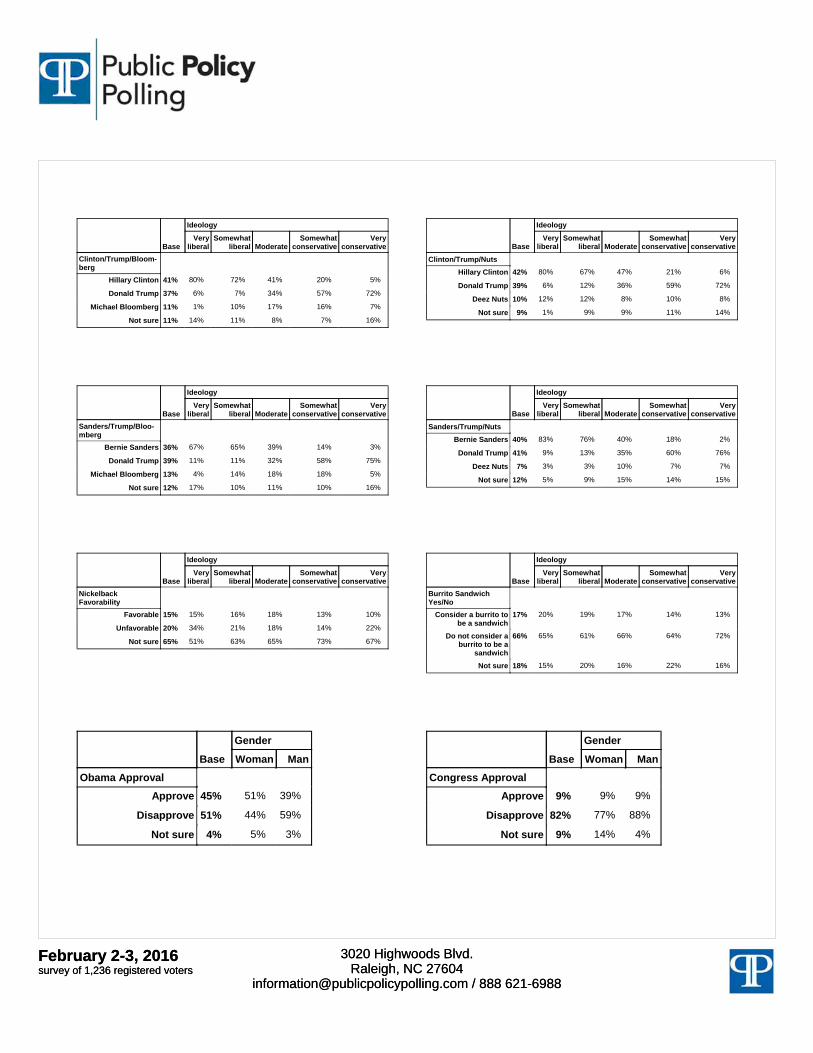
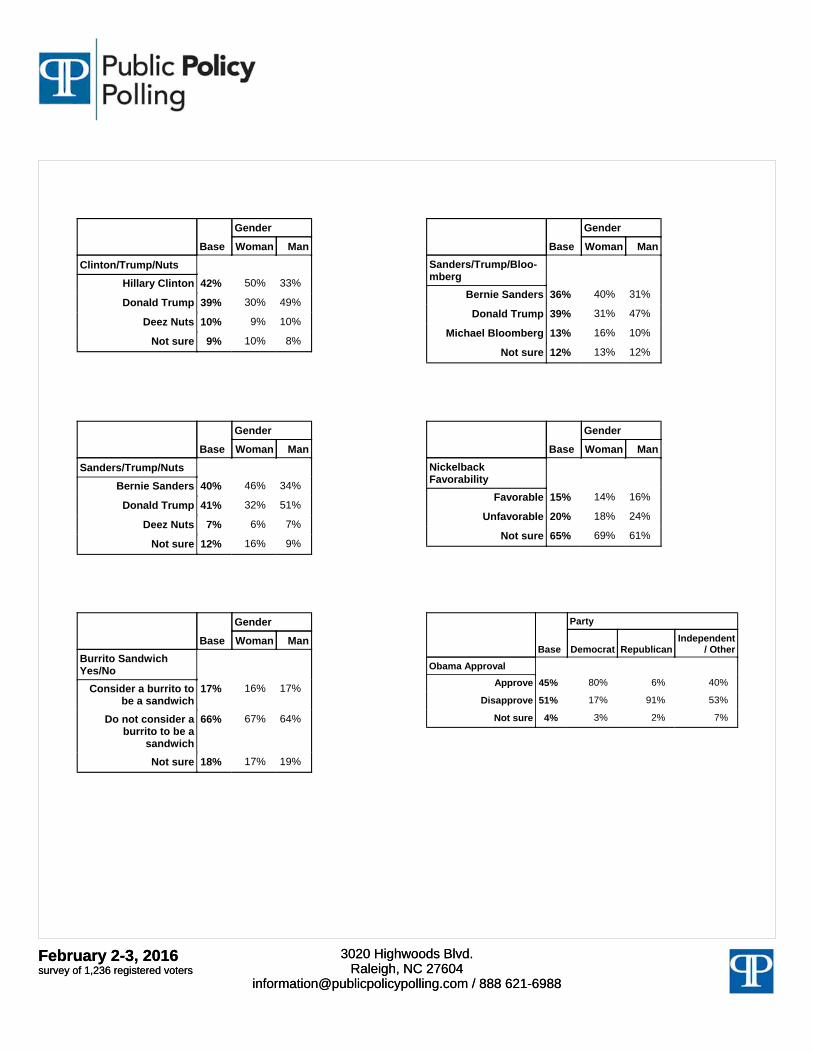
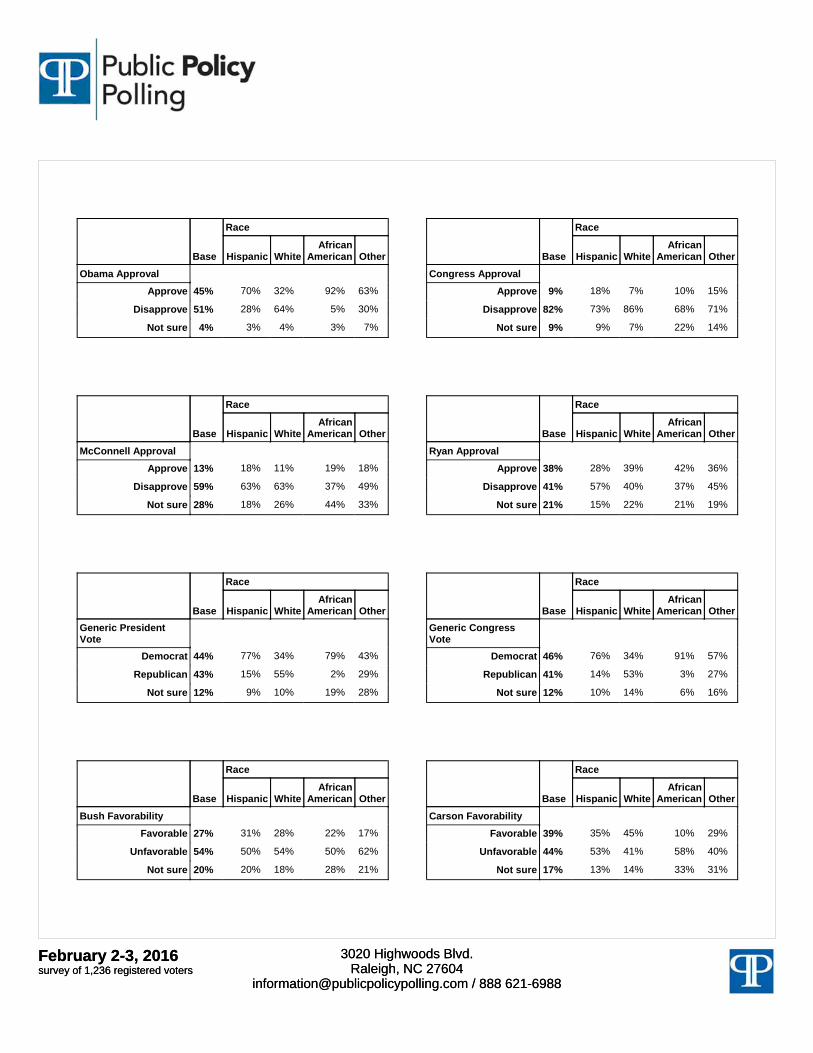
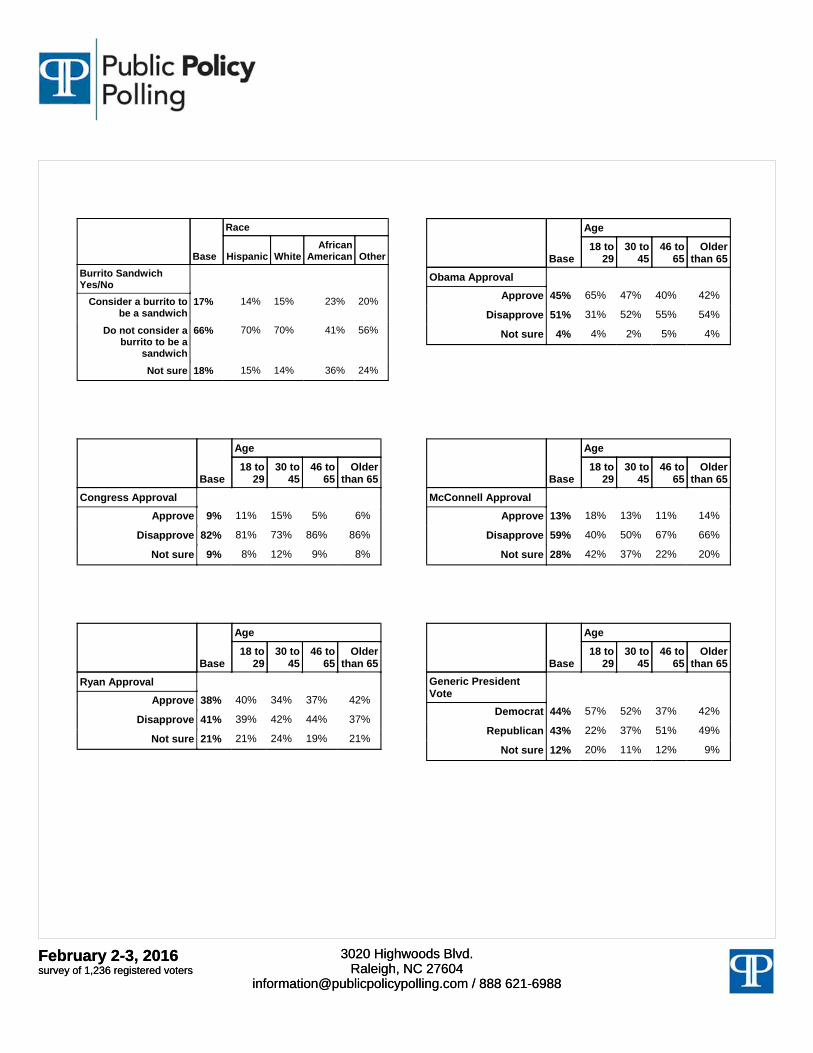
Q1 Do you approve or disapprove of President Barack Obama’s job performance?
45% Approve ..........................................................
51% Disapprove......................................................
4% Not sure ..........................................................
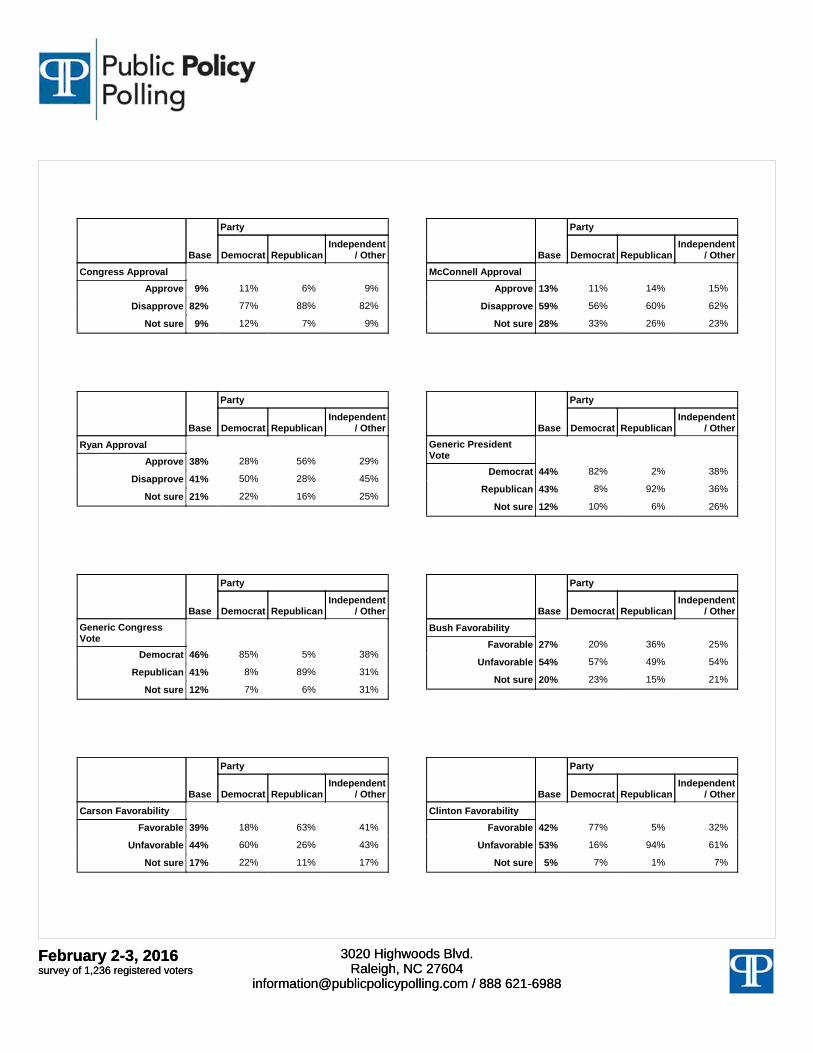
Q2 Do you approve or disapprove of the job Congress is doing?
9% Approve ..........................................................
82% Disapprove......................................................
9% Not sure ..........................................................
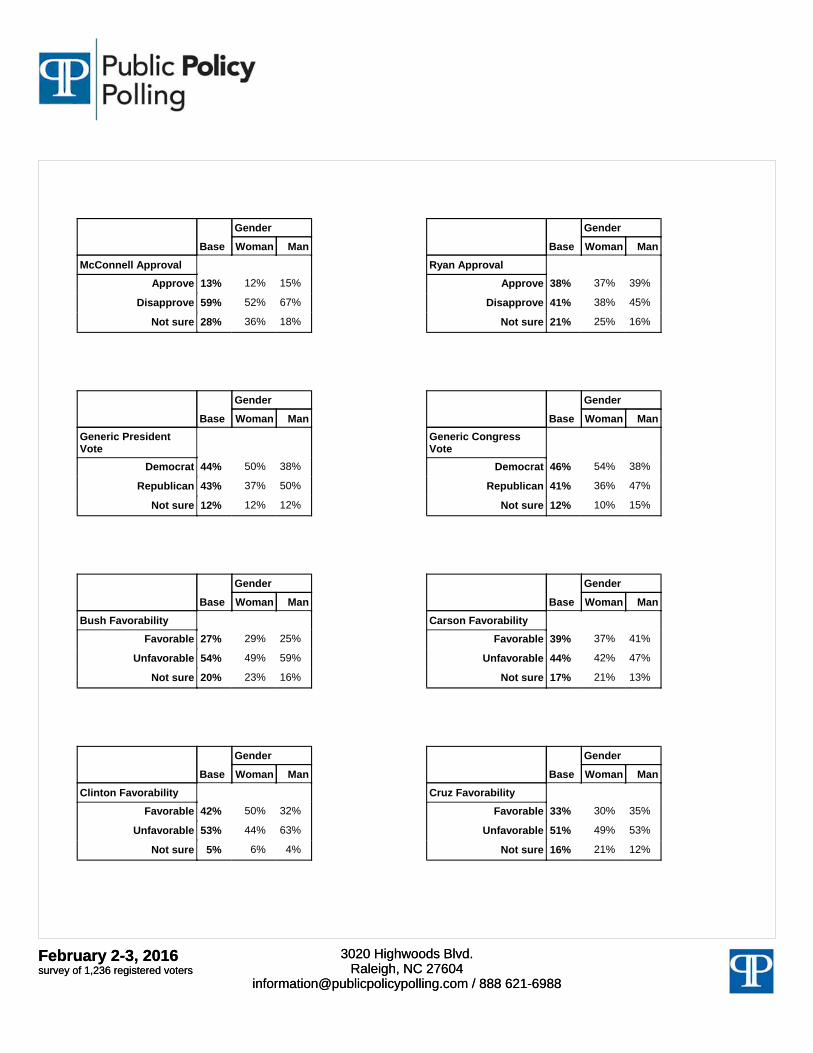
Q3 Do you approve or disapprove of the job Mitch McConnell is doing as Senate Majority Leader?
13% Approve ..........................................................
59% Disapprove......................................................
28% Not sure ..........................................................
Q4 Do you approve or disapprove of the job Paul Ryan is doing as Speaker of the House?
38% Approve ..........................................................
41% Disapprove......................................................
21% Not sure ..........................................................
Q5 Generally speaking if the election for President was today, would you vote for the Democratic or Republican candidate?
44% Democrat ........................................................
43% Republican......................................................
12% Not sure ..........................................................
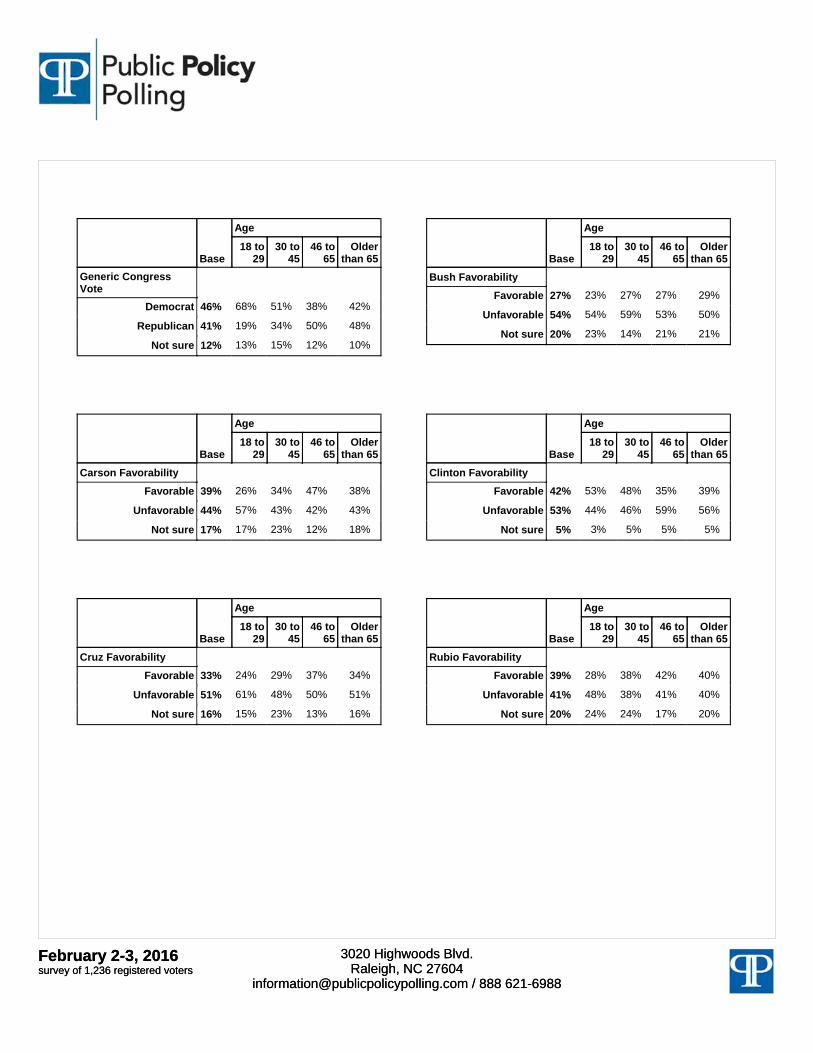
Q6 Generally speaking if there was an election for Congress today, would you vote for the Democratic or Republican candidate from your district?
47% Democrat ........................................................
41% Republican......................................................
12% Not sure ..........................................................
Q7 Do you have a favorable or unfavorable opinion of Jeb Bush?
27% Favorable........................................................
54% Unfavorable ....................................................
20% Not sure ..........................................................
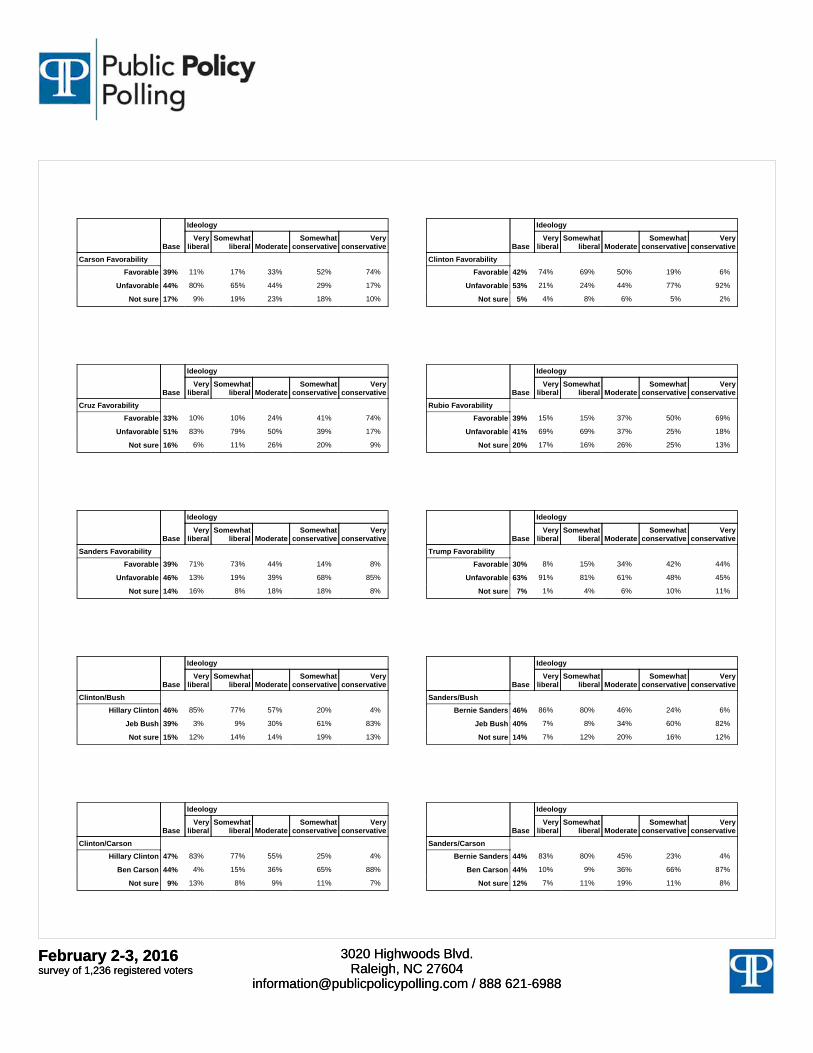
Q8 Do you have a favorable or unfavorable opinion of Ben Carson?
39% Favorable........................................................
44% Unfavorable ....................................................
17% Not sure ..........................................................
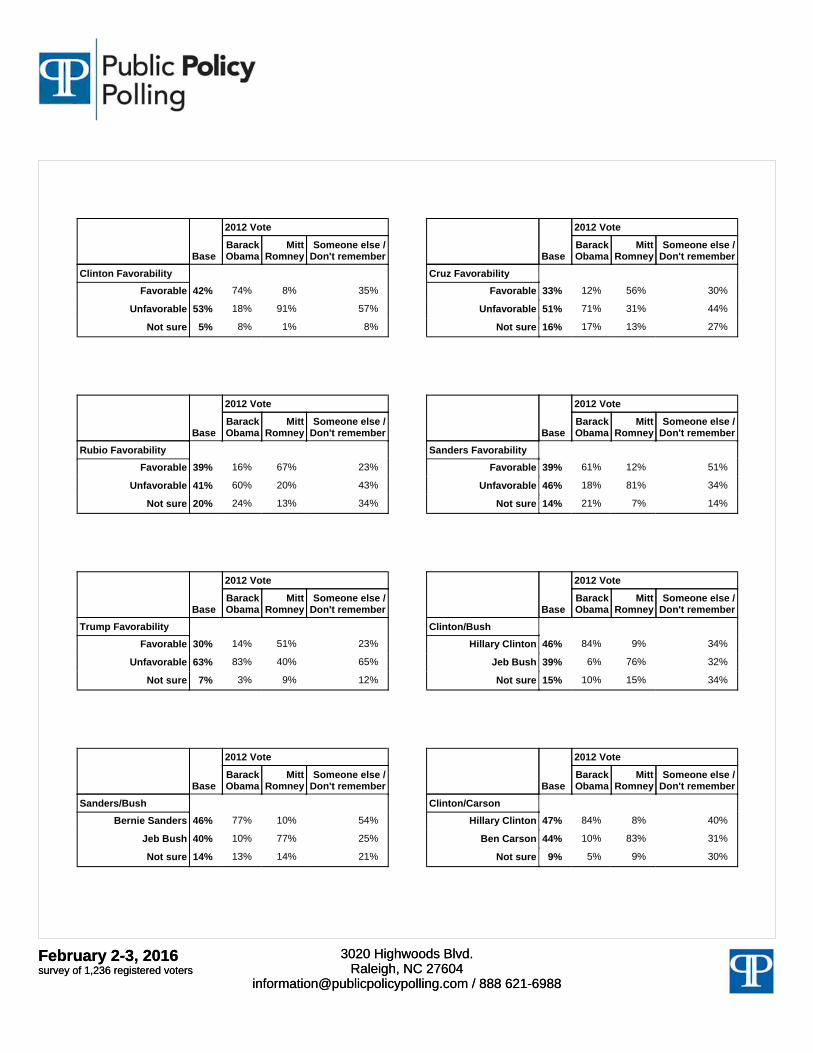
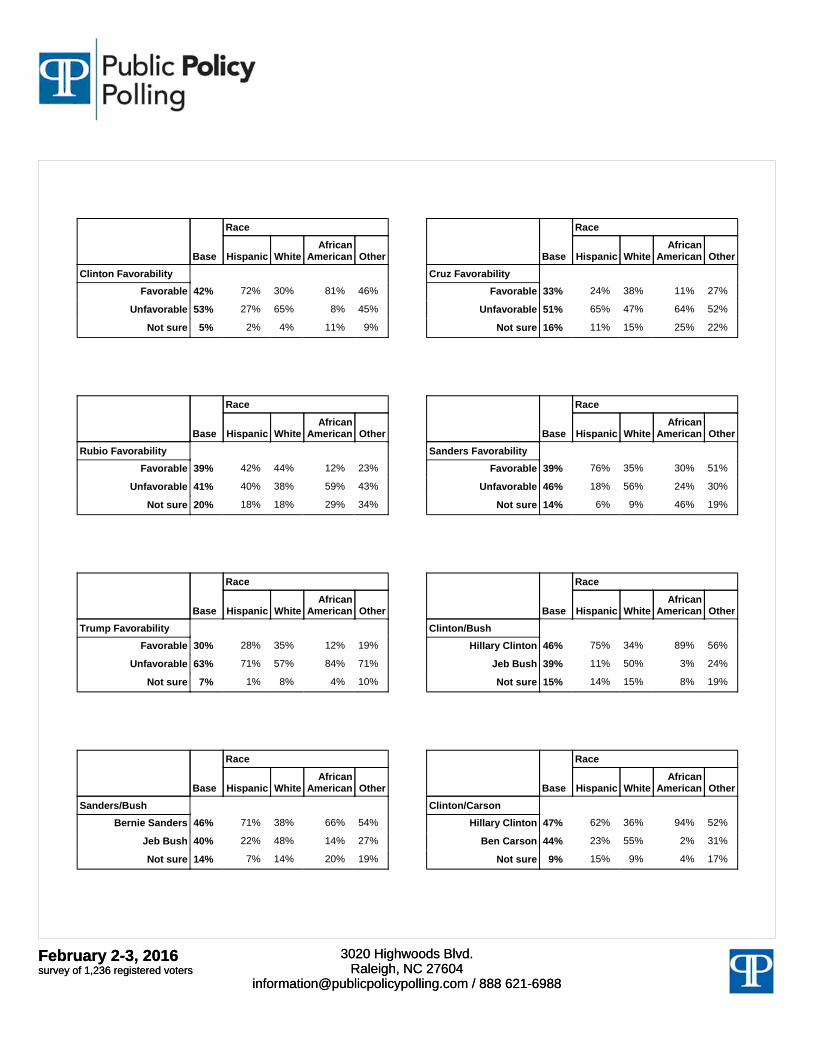
Q9 Do you have a favorable or unfavorable opinion of Hillary Clinton?
42% Favorable........................................................
53% Unfavorable ....................................................
5% Not sure ..........................................................
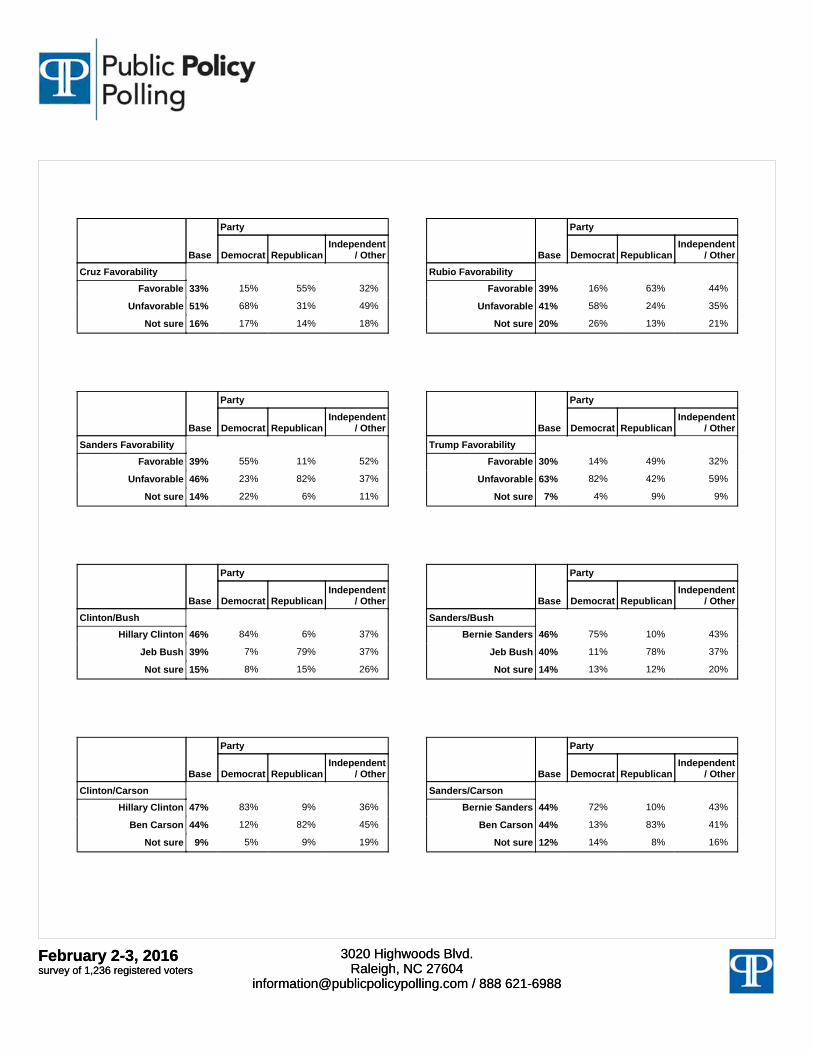
Q10 Do you have a favorable or unfavorable opinion of Ted Cruz?
33% Favorable........................................................
51% Unfavorable ....................................................
16% Not sure ..........................................................
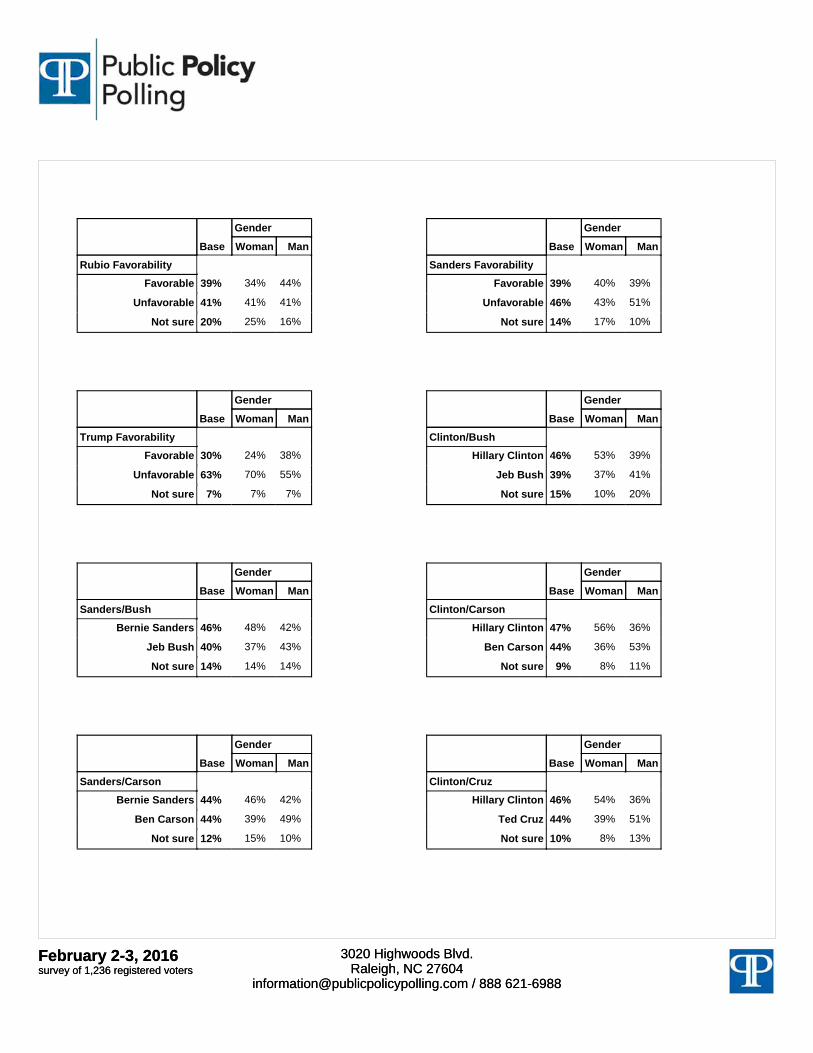
Q11 Do you have a favorable or unfavorable opinion of Marco Rubio?
39% Favorable........................................................
41% Unfavorable ....................................................
20% Not sure ..........................................................
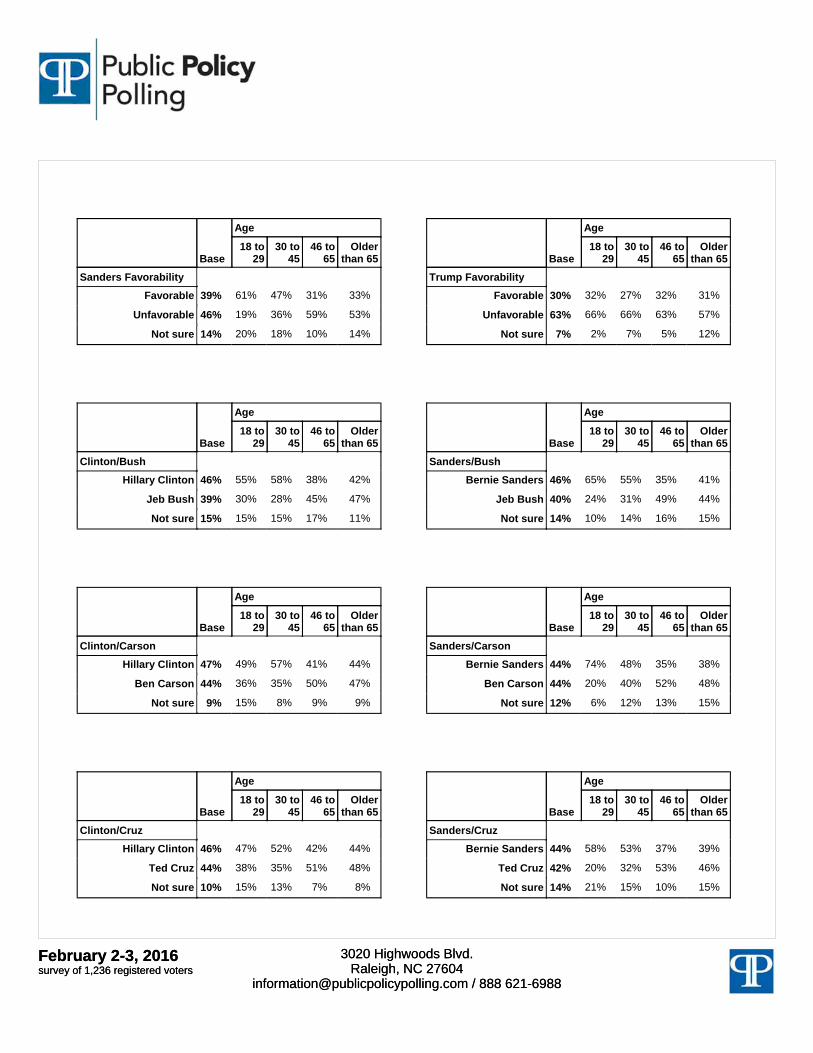
Q12 Do you have a favorable or unfavorable opinion of Bernie Sanders?
39% Favorable........................................................
46% Unfavorable ....................................................
14% Not sure ..........................................................
Feburary 2-3, 2016Survey of 1,236 registered votersFeburary 2-3, 2016Survey of 1,236 registered voters
3020 Highwoods Blvd.Raleigh, NC 27604
[email protected] / 888 621-6988
3020 Highwoods Blvd.Raleigh, NC 27604
[email protected] / 888 621-6988
Q13 Do you have a favorable or unfavorable opinion of Donald Trump?
30% Favorable........................................................
63% Unfavorable ....................................................
7% Not sure ..........................................................
Q14 If the candidates for President this fall were Democrat Hillary Clinton and Republican Jeb Bush, who would you vote for?
46% Hillary Clinton..................................................
39% Jeb Bush.........................................................
15% Not sure ..........................................................
Q15 If the candidates for President this fall were Democrat Bernie Sanders and Republican Jeb Bush, who would you vote for?
46% Bernie Sanders ...............................................
40% Jeb Bush.........................................................
14% Not sure ..........................................................
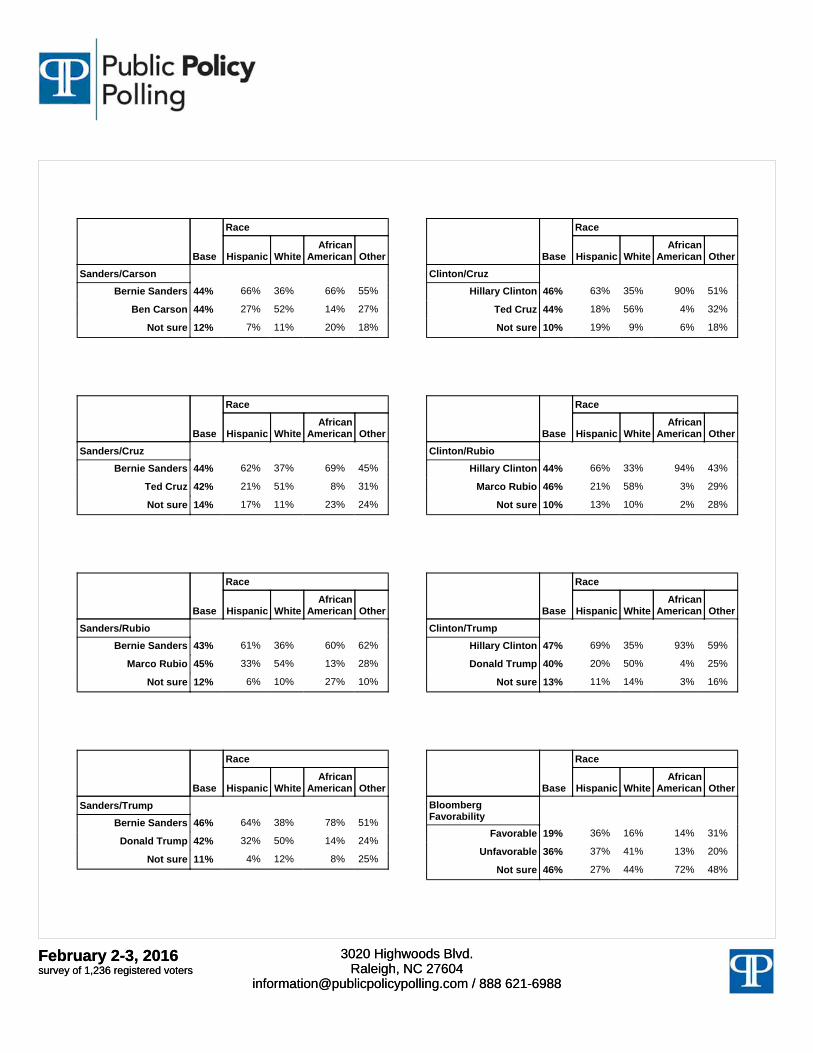
Q16 If the candidates for President this fall were Democrat Hillary Clinton and Republican Ben Carson, who would you vote for?
47% Hillary Clinton..................................................
44% Ben Carson.....................................................
9% Not sure ..........................................................
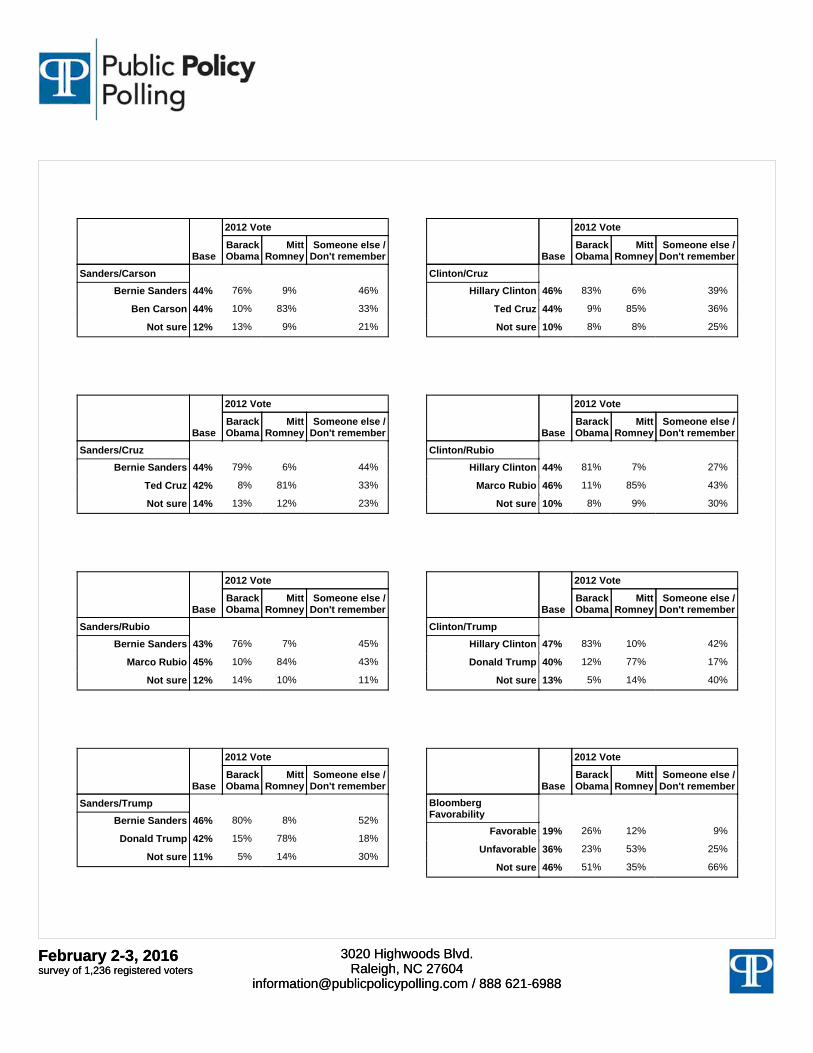
Q17 If the candidates for President this fall were Democrat Bernie Sanders and Republican Ben Carson, who would you vote for?
44% Bernie Sanders ...............................................
44% Ben Carson.....................................................
12% Not sure ..........................................................
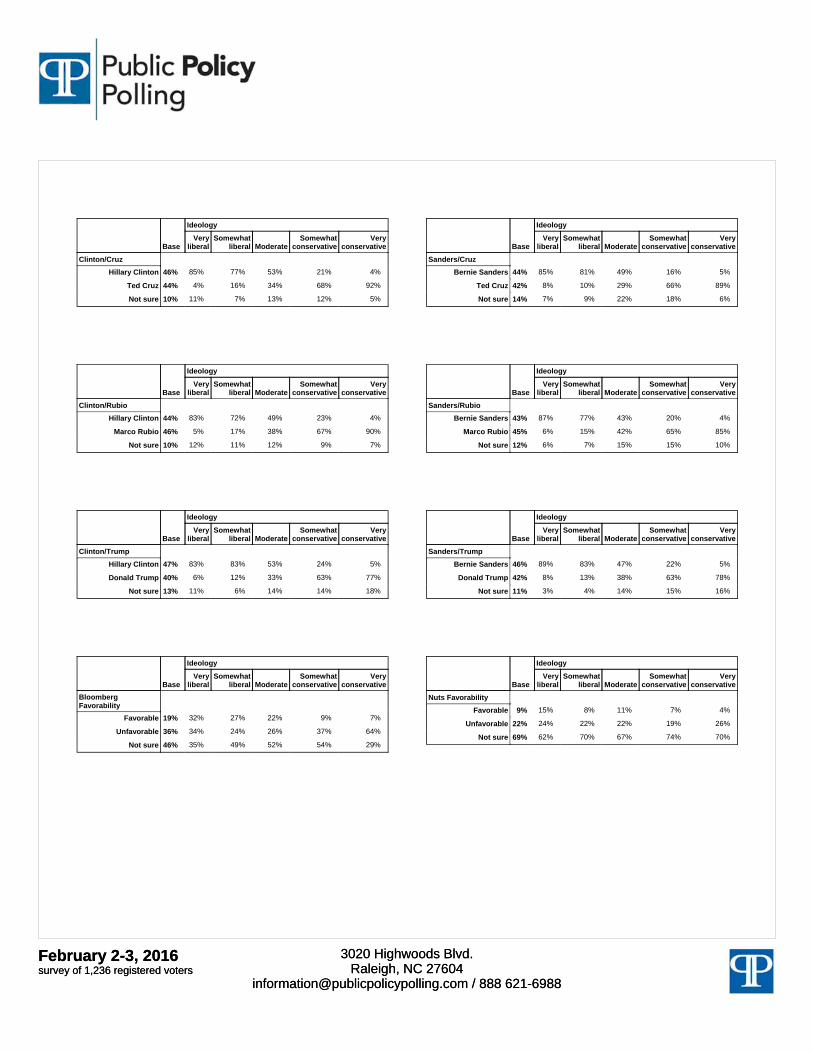
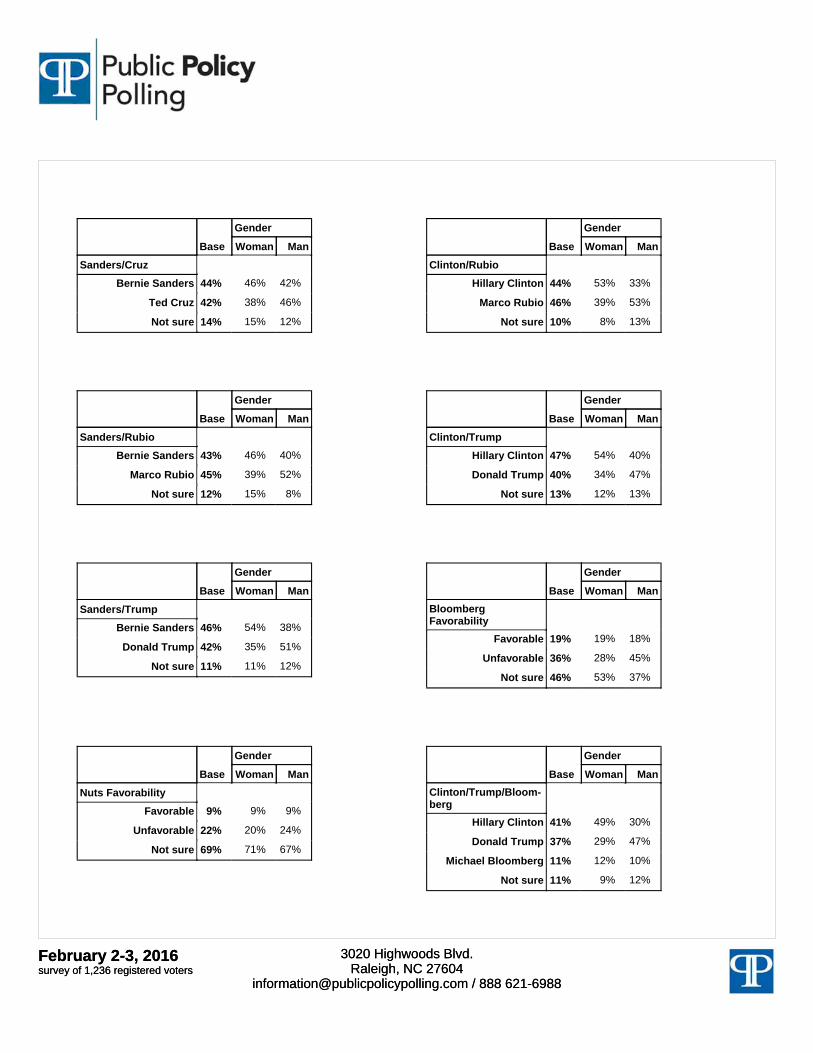
Q18 If the candidates for President this fall were Democrat Hillary Clinton and Republican Ted Cruz, who would you vote for?
46% Hillary Clinton..................................................
44% Ted Cruz .........................................................
10% Not sure ..........................................................
Q19 If the candidates for President this fall were Democrat Bernie Sanders and Republican Ted Cruz, who would you vote for?
44% Bernie Sanders ...............................................
42% Ted Cruz .........................................................
14% Not sure ..........................................................
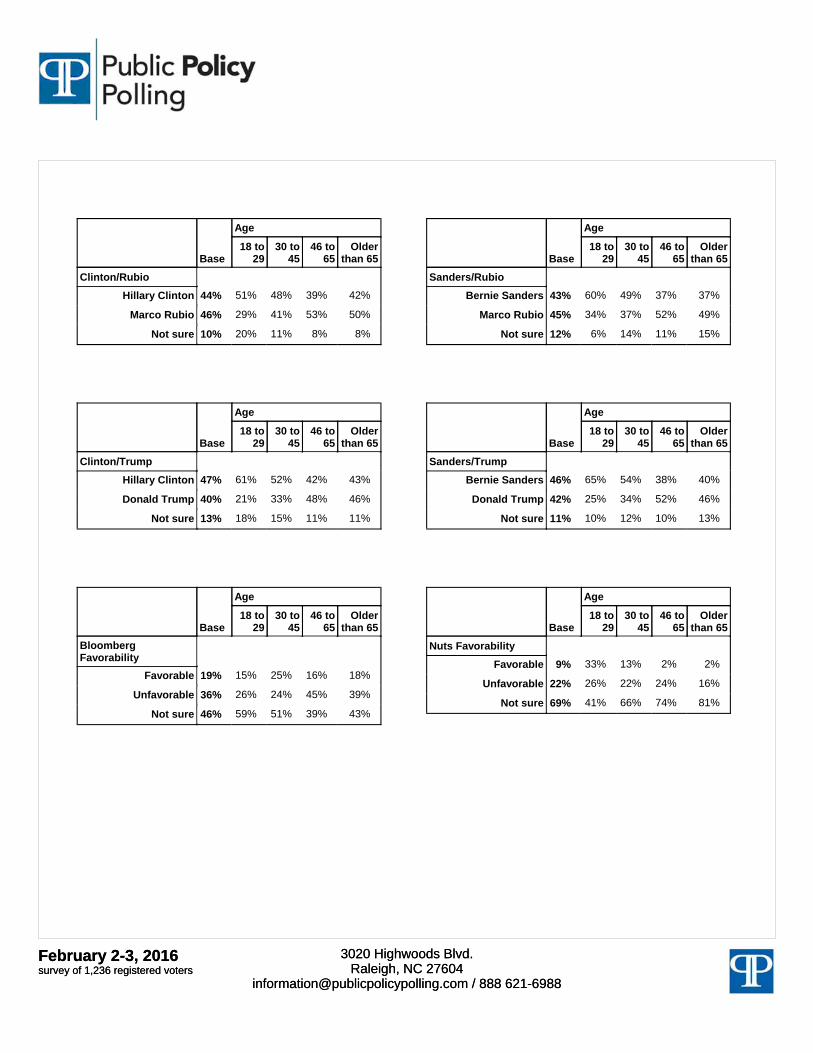
Q20 If the candidates for President this fall were Democrat Hillary Clinton and Republican Marco Rubio, who would you vote for?
44% Hillary Clinton..................................................
46% Marco Rubio ...................................................
10% Not sure ..........................................................
Q21 If the candidates for President this fall were Democrat Bernie Sanders and Republican Marco Rubio, who would you vote for?
43% Bernie Sanders ...............................................
45% Marco Rubio ...................................................
12% Not sure ..........................................................
Q22 If the candidates for President this fall were Democrat Hillary Clinton and Republican Donald Trump, who would you vote for?
47% Hillary Clinton..................................................
40% Donald Trump .................................................
13% Not sure ..........................................................
Q23 If the candidates for President next time were Democrat Bernie Sanders and Republican Donald Trump, who would you vote for?
46% Bernie Sanders ...............................................
42% Donald Trump .................................................
11% Not sure ..........................................................
Q24 Do you have a favorable or unfavorable opinion of Michael Bloomberg?
19% Favorable........................................................
36% Unfavorable ....................................................
46% Not sure ..........................................................
Feburary 2-3, 2016Survey of 1,236 registered votersFeburary 2-3, 2016Survey of 1,236 registered voters
3020 Highwoods Blvd.Raleigh, NC 27604
[email protected] / 888 621-6988
3020 Highwoods Blvd.Raleigh, NC 27604
[email protected] / 888 621-6988
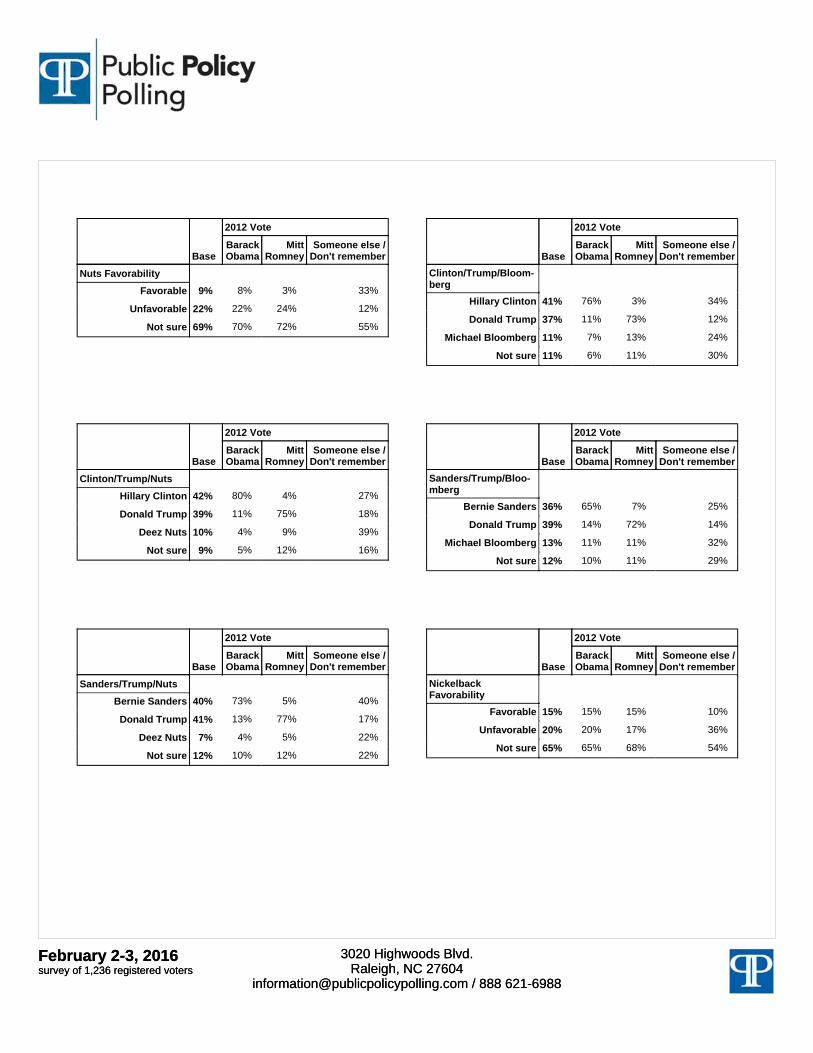
Q25 Do you have a favorable or unfavorable opinion of Deez Nuts?
9% Favorable........................................................
22% Unfavorable ....................................................
69% Not sure ..........................................................
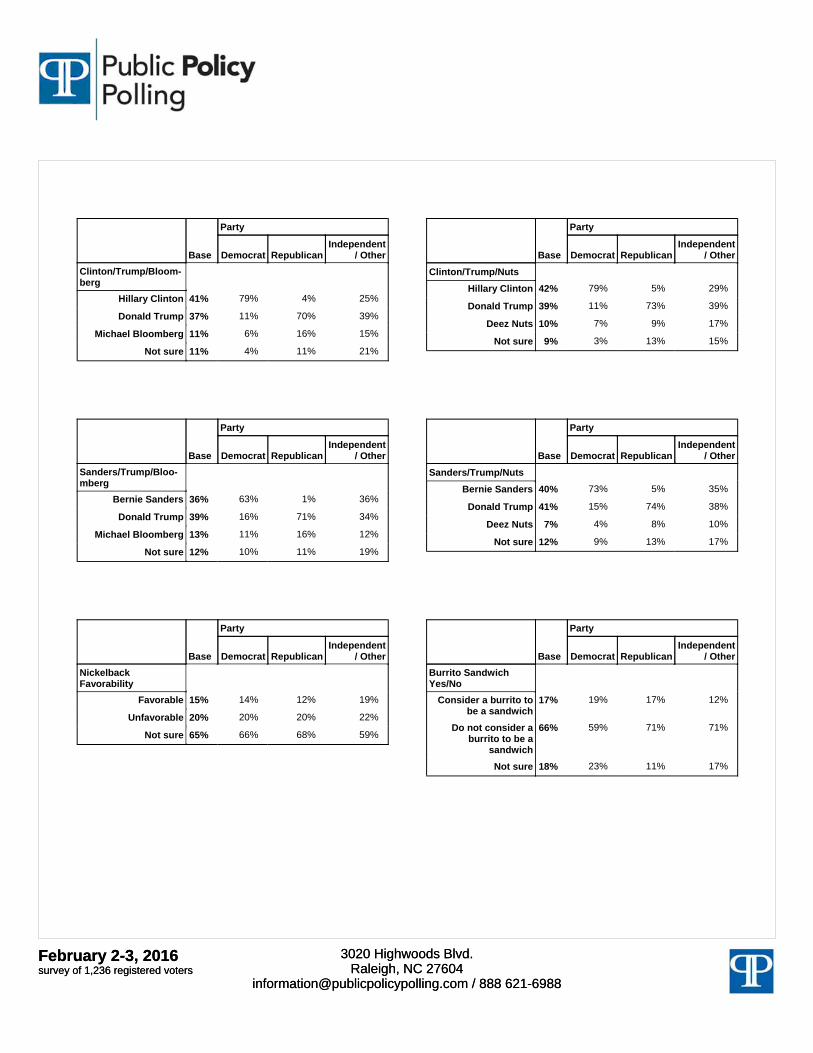
Q26 If the candidates for President this fall were Democrat Hillary Clinton, Republican Donald Trump, and independent Michael Bloomberg, who would you vote for?
41% Hillary Clinton..................................................
37% Donald Trump .................................................
11% Michael Bloomberg .........................................
11% Not sure ..........................................................
Q27 If the candidates for President this fall were Democrat Hillary Clinton, Republican Donald Trump, and independent Deez Nuts who would you vote for?
42% Hillary Clinton..................................................
39% Donald Trump .................................................
10% Deez Nuts .......................................................
9% Not sure ..........................................................
Q28 If the candidates for President this fall were Democrat Bernie Sanders, Republican Donald Trump, and independent Michael Bloomberg who would you vote for?
36% Bernie Sanders ...............................................
39% Donald Trump .................................................
13% Michael Bloomberg .........................................
12% Not sure ..........................................................
Q29 If the candidates for President this fall were Democrat Bernie Sanders, Republican Donald Trump, and independent Deez Nuts who would you vote for?
41% Bernie Sanders ...............................................
41% Donald Trump .................................................
7% Deez Nuts .......................................................
12% Not sure ..........................................................
Q30 Do you have a favorable or unfavorable opinion of Nickelback?
15% Favorable........................................................
20% Unfavorable ....................................................
65% Not sure ..........................................................
Q31 Do you consider a burrito to be a sandwich or not?
17% Consider a burrito to be a sandwich................
66% Do not consider a burrito to be a sandwich.....
18% Not sure ..........................................................
Q32 In the last presidential election, did you vote for Barack Obama or Mitt Romney?
46% Barack Obama ................................................
43% Mitt Romney....................................................
11% Someone else / Don't remember ....................
Q33 Would you describe yourself as very liberal, somewhat liberal, moderate, somewhat conservative, or very conservative?
13% Very liberal ......................................................
18% Somewhat liberal ............................................
28% Moderate.........................................................
23% Somewhat conservative..................................
18% Very conservative ...........................................
Q34 If you are a woman, press 1. If a man, press 2.
53% Woman ...........................................................
47% Man.................................................................
Q35 If you are a Democrat, press 1. If a Republican, press 2. If you are an independent or identify with another party, press 3.
42% Democrat ........................................................
34% Republican......................................................
24% Independent / Other ........................................
Feburary 2-3, 2016Survey of 1,236 registered votersFeburary 2-3, 2016Survey of 1,236 registered voters
3020 Highwoods Blvd.Raleigh, NC 27604
[email protected] / 888 621-6988
3020 Highwoods Blvd.Raleigh, NC 27604
[email protected] / 888 621-6988
Q36 If you are Hispanic, press 1. If white, press 2. If African American, press 3. If other, press 4.
10% Hispanic ..........................................................
72% White ..............................................................
12% African American.............................................
6% Other...............................................................
Q37 If you are 18 to 29 years old, press 1. If 30 to 45, press 2. If 46 to 65, press 3. If you are older than 65, press 4.
13% 18 to 29...........................................................
25% 30 to 45...........................................................
39% 46 to 65...........................................................
23% Older than 65 ..................................................
Q38 Mode
80% Phone .............................................................
20% Internet ...........................................................

February 2-3, 2016survey of 1,236 registered votersFebruary 2-3, 2016survey of 1,236 registered voters
3020 Highwoods Blvd.Raleigh, NC 27604
[email protected] / 888 621-6988
3020 Highwoods Blvd.Raleigh, NC 27604
[email protected] / 888 621-6988
Base
2012 Vote
BarackObama
MittRomney
Someone else /Don't remember
Obama Approval
Approve
Disapprove
Not sure
45% 84% 6% 31%
51% 12% 92% 57%
4% 4% 2% 12%
Base
2012 Vote
BarackObama
MittRomney
Someone else /Don't remember
Congress Approval
Approve
Disapprove
Not sure
9% 10% 6% 13%
82% 79% 87% 76%
9% 11% 7% 11%
Base
2012 Vote
BarackObama
MittRomney
Someone else /Don't remember
McConnell Approval
Approve
Disapprove
Not sure
13% 13% 15% 6%
59% 57% 61% 56%
28% 30% 23% 38%
Base
2012 Vote
BarackObama
MittRomney
Someone else /Don't remember
Ryan Approval
Approve
Disapprove
Not sure
38% 26% 52% 34%
41% 51% 31% 38%
21% 23% 17% 28%
Base
2012 Vote
BarackObama
MittRomney
Someone else /Don't remember
Generic PresidentVote
Democrat
Republican
Not sure
44% 82% 6% 35%
43% 8% 87% 25%
12% 11% 7% 40%
Base
2012 Vote
BarackObama
MittRomney
Someone else /Don't remember
Generic CongressVote
Democrat
Republican
Not sure
46% 83% 7% 44%
41% 7% 82% 25%
12% 10% 10% 31%
Base
2012 Vote
BarackObama
MittRomney
Someone else /Don't remember
Bush Favorability
Favorable
Unfavorable
Not sure
27% 20% 32% 37%
54% 59% 49% 47%
20% 21% 19% 16%
Base
2012 Vote
BarackObama
MittRomney
Someone else /Don't remember
Carson Favorability
Favorable
Unfavorable
Not sure
39% 16% 64% 39%
44% 64% 25% 33%
17% 20% 11% 28%
February 2-3, 2016survey of 1,236 registered votersFebruary 2-3, 2016survey of 1,236 registered voters
3020 Highwoods Blvd.Raleigh, NC 27604
[email protected] / 888 621-6988
3020 Highwoods Blvd.Raleigh, NC 27604
[email protected] / 888 621-6988
Base
2012 Vote
BarackObama
MittRomney
Someone else /Don't remember
Clinton Favorability
Favorable
Unfavorable
Not sure
42% 74% 8% 35%
53% 18% 91% 57%
5% 8% 1% 8%
Base
2012 Vote
BarackObama
MittRomney
Someone else /Don't remember
Cruz Favorability
Favorable
Unfavorable
Not sure
33% 12% 56% 30%
51% 71% 31% 44%
16% 17% 13% 27%
Base
2012 Vote
BarackObama
MittRomney
Someone else /Don't remember
Rubio Favorability
Favorable
Unfavorable
Not sure
39% 16% 67% 23%
41% 60% 20% 43%
20% 24% 13% 34%
Base
2012 Vote
BarackObama
MittRomney
Someone else /Don't remember
Sanders Favorability
Favorable
Unfavorable
Not sure
39% 61% 12% 51%
46% 18% 81% 34%
14% 21% 7% 14%
Base
2012 Vote
BarackObama
MittRomney
Someone else /Don't remember
Trump Favorability
Favorable
Unfavorable
Not sure
30% 14% 51% 23%
63% 83% 40% 65%
7% 3% 9% 12%
Base
2012 Vote
BarackObama
MittRomney
Someone else /Don't remember
Clinton/Bush
Hillary Clinton
Jeb Bush
Not sure
46% 84% 9% 34%
39% 6% 76% 32%
15% 10% 15% 34%
Base
2012 Vote
BarackObama
MittRomney
Someone else /Don't remember
Sanders/Bush
Bernie Sanders
Jeb Bush
Not sure
46% 77% 10% 54%
40% 10% 77% 25%
14% 13% 14% 21%
Base
2012 Vote
BarackObama
MittRomney
Someone else /Don't remember
Clinton/Carson
Hillary Clinton
Ben Carson
Not sure
47% 84% 8% 40%
44% 10% 83% 31%
9% 5% 9% 30%
February 2-3, 2016survey of 1,236 registered votersFebruary 2-3, 2016survey of 1,236 registered voters
3020 Highwoods Blvd.Raleigh, NC 27604
[email protected] / 888 621-6988
3020 Highwoods Blvd.Raleigh, NC 27604
[email protected] / 888 621-6988
Base
2012 Vote
BarackObama
MittRomney
Someone else /Don't remember
Sanders/Carson
Bernie Sanders
Ben Carson
Not sure
44% 76% 9% 46%
44% 10% 83% 33%
12% 13% 9% 21%
Base
2012 Vote
BarackObama
MittRomney
Someone else /Don't remember
Clinton/Cruz
Hillary Clinton
Ted Cruz
Not sure
46% 83% 6% 39%
44% 9% 85% 36%
10% 8% 8% 25%
Base
2012 Vote
BarackObama
MittRomney
Someone else /Don't remember
Sanders/Cruz
Bernie Sanders
Ted Cruz
Not sure
44% 79% 6% 44%
42% 8% 81% 33%
14% 13% 12% 23%
Base
2012 Vote
BarackObama
MittRomney
Someone else /Don't remember
Clinton/Rubio
Hillary Clinton
Marco Rubio
Not sure
44% 81% 7% 27%
46% 11% 85% 43%
10% 8% 9% 30%
Base
2012 Vote
BarackObama
MittRomney
Someone else /Don't remember
Sanders/Rubio
Bernie Sanders
Marco Rubio
Not sure
43% 76% 7% 45%
45% 10% 84% 43%
12% 14% 10% 11%
Base
2012 Vote
BarackObama
MittRomney
Someone else /Don't remember
Clinton/Trump
Hillary Clinton
Donald Trump
Not sure
47% 83% 10% 42%
40% 12% 77% 17%
13% 5% 14% 40%
Base
2012 Vote
BarackObama
MittRomney
Someone else /Don't remember
Sanders/Trump
Bernie Sanders
Donald Trump
Not sure
46% 80% 8% 52%
42% 15% 78% 18%
11% 5% 14% 30%
Base
2012 Vote
BarackObama
MittRomney
Someone else /Don't remember
BloombergFavorability
Favorable
Unfavorable
Not sure
19% 26% 12% 9%
36% 23% 53% 25%
46% 51% 35% 66%
February 2-3, 2016survey of 1,236 registered votersFebruary 2-3, 2016survey of 1,236 registered voters
3020 Highwoods Blvd.Raleigh, NC 27604
[email protected] / 888 621-6988
3020 Highwoods Blvd.Raleigh, NC 27604
[email protected] / 888 621-6988
Base
2012 Vote
BarackObama
MittRomney
Someone else /Don't remember
Nuts Favorability
Favorable
Unfavorable
Not sure
9% 8% 3% 33%
22% 22% 24% 12%
69% 70% 72% 55%
Base
2012 Vote
BarackObama
MittRomney
Someone else /Don't remember
Clinton/Trump/Bloom-berg
Hillary Clinton
Donald Trump
Michael Bloomberg
Not sure
41% 76% 3% 34%
37% 11% 73% 12%
11% 7% 13% 24%
11% 6% 11% 30%
Base
2012 Vote
BarackObama
MittRomney
Someone else /Don't remember
Clinton/Trump/Nuts
Hillary Clinton
Donald Trump
Deez Nuts
Not sure
42% 80% 4% 27%
39% 11% 75% 18%
10% 4% 9% 39%
9% 5% 12% 16%
Base
2012 Vote
BarackObama
MittRomney
Someone else /Don't remember
Sanders/Trump/Bloo-mberg
Bernie Sanders
Donald Trump
Michael Bloomberg
Not sure
36% 65% 7% 25%
39% 14% 72% 14%
13% 11% 11% 32%
12% 10% 11% 29%
Base
2012 Vote
BarackObama
MittRomney
Someone else /Don't remember
Sanders/Trump/Nuts
Bernie Sanders
Donald Trump
Deez Nuts
Not sure
40% 73% 5% 40%
41% 13% 77% 17%
7% 4% 5% 22%
12% 10% 12% 22%
Base
2012 Vote
BarackObama
MittRomney
Someone else /Don't remember
NickelbackFavorability
Favorable
Unfavorable
Not sure
15% 15% 15% 10%
20% 20% 17% 36%
65% 65% 68% 54%

February 2-3, 2016survey of 1,236 registered votersFebruary 2-3, 2016survey of 1,236 registered voters
3020 Highwoods Blvd.Raleigh, NC 27604
[email protected] / 888 621-6988
3020 Highwoods Blvd.Raleigh, NC 27604
[email protected] / 888 621-6988
Base
2012 Vote
BarackObama
MittRomney
Someone else /Don't remember
Burrito SandwichYes/No
Consider a burrito tobe a sandwich
Do not consider aburrito to be a
sandwich
Not sure
17% 18% 15% 17%
66% 60% 72% 68%
18% 22% 14% 15%
Base
Ideology
Veryliberal
Somewhatliberal Moderate
Somewhatconservative
Veryconservative
Obama Approval
Approve
Disapprove
Not sure
45% 90% 76% 49% 20% 6%
51% 9% 18% 45% 76% 93%
4% 1% 6% 5% 4% 1%
Base
Ideology
Veryliberal
Somewhatliberal Moderate
Somewhatconservative
Veryconservative
Congress Approval
Approve
Disapprove
Not sure
9% 14% 4% 11% 7% 8%
82% 79% 88% 80% 81% 83%
9% 7% 8% 10% 12% 9%
Base
Ideology
Veryliberal
Somewhatliberal Moderate
Somewhatconservative
Veryconservative
McConnell Approval
Approve
Disapprove
Not sure
13% 13% 11% 17% 11% 13%
59% 67% 59% 57% 51% 65%
28% 21% 30% 26% 38% 22%
Base
Ideology
Veryliberal
Somewhatliberal Moderate
Somewhatconservative
Veryconservative
Ryan Approval
Approve
Disapprove
Not sure
38% 20% 21% 35% 56% 52%
41% 60% 55% 43% 24% 33%
21% 20% 24% 22% 20% 16%
Base
Ideology
Veryliberal
Somewhatliberal Moderate
Somewhatconservative
Veryconservative
Generic PresidentVote
Democrat
Republican
Not sure
44% 89% 75% 49% 19% 5%
43% 5% 8% 33% 70% 90%
12% 5% 17% 18% 11% 4%
Base
Ideology
Veryliberal
Somewhatliberal Moderate
Somewhatconservative
Veryconservative
Generic CongressVote
Democrat
Republican
Not sure
46% 90% 75% 53% 22% 7%
41% 5% 10% 30% 64% 88%
12% 5% 15% 17% 14% 6%
Base
Ideology
Veryliberal
Somewhatliberal Moderate
Somewhatconservative
Veryconservative
Bush Favorability
Favorable
Unfavorable
Not sure
27% 18% 19% 28% 34% 31%
54% 67% 63% 47% 47% 52%
20% 15% 17% 25% 19% 17%
February 2-3, 2016survey of 1,236 registered votersFebruary 2-3, 2016survey of 1,236 registered voters
3020 Highwoods Blvd.Raleigh, NC 27604
[email protected] / 888 621-6988
3020 Highwoods Blvd.Raleigh, NC 27604
[email protected] / 888 621-6988
Base
Ideology
Veryliberal
Somewhatliberal Moderate
Somewhatconservative
Veryconservative
Carson Favorability
Favorable
Unfavorable
Not sure
39% 11% 17% 33% 52% 74%
44% 80% 65% 44% 29% 17%
17% 9% 19% 23% 18% 10%
Base
Ideology
Veryliberal
Somewhatliberal Moderate
Somewhatconservative
Veryconservative
Clinton Favorability
Favorable
Unfavorable
Not sure
42% 74% 69% 50% 19% 6%
53% 21% 24% 44% 77% 92%
5% 4% 8% 6% 5% 2%
Base
Ideology
Veryliberal
Somewhatliberal Moderate
Somewhatconservative
Veryconservative
Cruz Favorability
Favorable
Unfavorable
Not sure
33% 10% 10% 24% 41% 74%
51% 83% 79% 50% 39% 17%
16% 6% 11% 26% 20% 9%
Base
Ideology
Veryliberal
Somewhatliberal Moderate
Somewhatconservative
Veryconservative
Rubio Favorability
Favorable
Unfavorable
Not sure
39% 15% 15% 37% 50% 69%
41% 69% 69% 37% 25% 18%
20% 17% 16% 26% 25% 13%
Base
Ideology
Veryliberal
Somewhatliberal Moderate
Somewhatconservative
Veryconservative
Sanders Favorability
Favorable
Unfavorable
Not sure
39% 71% 73% 44% 14% 8%
46% 13% 19% 39% 68% 85%
14% 16% 8% 18% 18% 8%
Base
Ideology
Veryliberal
Somewhatliberal Moderate
Somewhatconservative
Veryconservative
Trump Favorability
Favorable
Unfavorable
Not sure
30% 8% 15% 34% 42% 44%
63% 91% 81% 61% 48% 45%
7% 1% 4% 6% 10% 11%
Base
Ideology
Veryliberal
Somewhatliberal Moderate
Somewhatconservative
Veryconservative
Clinton/Bush
Hillary Clinton
Jeb Bush
Not sure
46% 85% 77% 57% 20% 4%
39% 3% 9% 30% 61% 83%
15% 12% 14% 14% 19% 13%
Base
Ideology
Veryliberal
Somewhatliberal Moderate
Somewhatconservative
Veryconservative
Sanders/Bush
Bernie Sanders
Jeb Bush
Not sure
46% 86% 80% 46% 24% 6%
40% 7% 8% 34% 60% 82%
14% 7% 12% 20% 16% 12%
Base
Ideology
Veryliberal
Somewhatliberal Moderate
Somewhatconservative
Veryconservative
Clinton/Carson
Hillary Clinton
Ben Carson
Not sure
47% 83% 77% 55% 25% 4%
44% 4% 15% 36% 65% 88%
9% 13% 8% 9% 11% 7%
Base
Ideology
Veryliberal
Somewhatliberal Moderate
Somewhatconservative
Veryconservative
Sanders/Carson
Bernie Sanders
Ben Carson
Not sure
44% 83% 80% 45% 23% 4%
44% 10% 9% 36% 66% 87%
12% 7% 11% 19% 11% 8%
February 2-3, 2016survey of 1,236 registered votersFebruary 2-3, 2016survey of 1,236 registered voters
3020 Highwoods Blvd.Raleigh, NC 27604
[email protected] / 888 621-6988
3020 Highwoods Blvd.Raleigh, NC 27604
[email protected] / 888 621-6988
Base
Ideology
Veryliberal
Somewhatliberal Moderate
Somewhatconservative
Veryconservative
Clinton/Cruz
Hillary Clinton
Ted Cruz
Not sure
46% 85% 77% 53% 21% 4%
44% 4% 16% 34% 68% 92%
10% 11% 7% 13% 12% 5%
Base
Ideology
Veryliberal
Somewhatliberal Moderate
Somewhatconservative
Veryconservative
Sanders/Cruz
Bernie Sanders
Ted Cruz
Not sure
44% 85% 81% 49% 16% 5%
42% 8% 10% 29% 66% 89%
14% 7% 9% 22% 18% 6%
Base
Ideology
Veryliberal
Somewhatliberal Moderate
Somewhatconservative
Veryconservative
Clinton/Rubio
Hillary Clinton
Marco Rubio
Not sure
44% 83% 72% 49% 23% 4%
46% 5% 17% 38% 67% 90%
10% 12% 11% 12% 9% 7%
Base
Ideology
Veryliberal
Somewhatliberal Moderate
Somewhatconservative
Veryconservative
Sanders/Rubio
Bernie Sanders
Marco Rubio
Not sure
43% 87% 77% 43% 20% 4%
45% 6% 15% 42% 65% 85%
12% 6% 7% 15% 15% 10%
Base
Ideology
Veryliberal
Somewhatliberal Moderate
Somewhatconservative
Veryconservative
Clinton/Trump
Hillary Clinton
Donald Trump
Not sure
47% 83% 83% 53% 24% 5%
40% 6% 12% 33% 63% 77%
13% 11% 6% 14% 14% 18%
Base
Ideology
Veryliberal
Somewhatliberal Moderate
Somewhatconservative
Veryconservative
Sanders/Trump
Bernie Sanders
Donald Trump
Not sure
46% 89% 83% 47% 22% 5%
42% 8% 13% 38% 63% 78%
11% 3% 4% 14% 15% 16%
Base
Ideology
Veryliberal
Somewhatliberal Moderate
Somewhatconservative
Veryconservative
BloombergFavorability
Favorable
Unfavorable
Not sure
19% 32% 27% 22% 9% 7%
36% 34% 24% 26% 37% 64%
46% 35% 49% 52% 54% 29%
Base
Ideology
Veryliberal
Somewhatliberal Moderate
Somewhatconservative
Veryconservative
Nuts Favorability
Favorable
Unfavorable
Not sure
9% 15% 8% 11% 7% 4%
22% 24% 22% 22% 19% 26%
69% 62% 70% 67% 74% 70%
February 2-3, 2016survey of 1,236 registered votersFebruary 2-3, 2016survey of 1,236 registered voters
3020 Highwoods Blvd.Raleigh, NC 27604
[email protected] / 888 621-6988
3020 Highwoods Blvd.Raleigh, NC 27604
[email protected] / 888 621-6988
Base
Ideology
Veryliberal
Somewhatliberal Moderate
Somewhatconservative
Veryconservative
Clinton/Trump/Bloom-berg
Hillary Clinton
Donald Trump
Michael Bloomberg
Not sure
41% 80% 72% 41% 20% 5%
37% 6% 7% 34% 57% 72%
11% 1% 10% 17% 16% 7%
11% 14% 11% 8% 7% 16%
Base
Ideology
Veryliberal
Somewhatliberal Moderate
Somewhatconservative
Veryconservative
Clinton/Trump/Nuts
Hillary Clinton
Donald Trump
Deez Nuts
Not sure
42% 80% 67% 47% 21% 6%
39% 6% 12% 36% 59% 72%
10% 12% 12% 8% 10% 8%
9% 1% 9% 9% 11% 14%
Base
Ideology
Veryliberal
Somewhatliberal Moderate
Somewhatconservative
Veryconservative
Sanders/Trump/Bloo-mberg
Bernie Sanders
Donald Trump
Michael Bloomberg
Not sure
36% 67% 65% 39% 14% 3%
39% 11% 11% 32% 58% 75%
13% 4% 14% 18% 18% 5%
12% 17% 10% 11% 10% 16%
Base
Ideology
Veryliberal
Somewhatliberal Moderate
Somewhatconservative
Veryconservative
Sanders/Trump/Nuts
Bernie Sanders
Donald Trump
Deez Nuts
Not sure
40% 83% 76% 40% 18% 2%
41% 9% 13% 35% 60% 76%
7% 3% 3% 10% 7% 7%
12% 5% 9% 15% 14% 15%
Base
Ideology
Veryliberal
Somewhatliberal Moderate
Somewhatconservative
Veryconservative
NickelbackFavorability
Favorable
Unfavorable
Not sure
15% 15% 16% 18% 13% 10%
20% 34% 21% 18% 14% 22%
65% 51% 63% 65% 73% 67%
Base
Ideology
Veryliberal
Somewhatliberal Moderate
Somewhatconservative
Veryconservative
Burrito SandwichYes/No
Consider a burrito tobe a sandwich
Do not consider aburrito to be a
sandwich
Not sure
17% 20% 19% 17% 14% 13%
66% 65% 61% 66% 64% 72%
18% 15% 20% 16% 22% 16%
Base
Gender
Woman Man
Obama Approval
Approve
Disapprove
Not sure
45% 51% 39%
51% 44% 59%
4% 5% 3%
Base
Gender
Woman Man
Congress Approval
Approve
Disapprove
Not sure
9% 9% 9%
82% 77% 88%
9% 14% 4%
February 2-3, 2016survey of 1,236 registered votersFebruary 2-3, 2016survey of 1,236 registered voters
3020 Highwoods Blvd.Raleigh, NC 27604
[email protected] / 888 621-6988
3020 Highwoods Blvd.Raleigh, NC 27604
[email protected] / 888 621-6988
Base
Gender
Woman Man
McConnell Approval
Approve
Disapprove
Not sure
13% 12% 15%
59% 52% 67%
28% 36% 18%
Base
Gender
Woman Man
Ryan Approval
Approve
Disapprove
Not sure
38% 37% 39%
41% 38% 45%
21% 25% 16%
Base
Gender
Woman Man
Generic PresidentVote
Democrat
Republican
Not sure
44% 50% 38%
43% 37% 50%
12% 12% 12%
Base
Gender
Woman Man
Generic CongressVote
Democrat
Republican
Not sure
46% 54% 38%
41% 36% 47%
12% 10% 15%
Base
Gender
Woman Man
Bush Favorability
Favorable
Unfavorable
Not sure
27% 29% 25%
54% 49% 59%
20% 23% 16%
Base
Gender
Woman Man
Carson Favorability
Favorable
Unfavorable
Not sure
39% 37% 41%
44% 42% 47%
17% 21% 13%
Base
Gender
Woman Man
Clinton Favorability
Favorable
Unfavorable
Not sure
42% 50% 32%
53% 44% 63%
5% 6% 4%
Base
Gender
Woman Man
Cruz Favorability
Favorable
Unfavorable
Not sure
33% 30% 35%
51% 49% 53%
16% 21% 12%
February 2-3, 2016survey of 1,236 registered votersFebruary 2-3, 2016survey of 1,236 registered voters
3020 Highwoods Blvd.Raleigh, NC 27604
[email protected] / 888 621-6988
3020 Highwoods Blvd.Raleigh, NC 27604
[email protected] / 888 621-6988
Base
Gender
Woman Man
Rubio Favorability
Favorable
Unfavorable
Not sure
39% 34% 44%
41% 41% 41%
20% 25% 16%
Base
Gender
Woman Man
Sanders Favorability
Favorable
Unfavorable
Not sure
39% 40% 39%
46% 43% 51%
14% 17% 10%
Base
Gender
Woman Man
Trump Favorability
Favorable
Unfavorable
Not sure
30% 24% 38%
63% 70% 55%
7% 7% 7%
Base
Gender
Woman Man
Clinton/Bush
Hillary Clinton
Jeb Bush
Not sure
46% 53% 39%
39% 37% 41%
15% 10% 20%
Base
Gender
Woman Man
Sanders/Bush
Bernie Sanders
Jeb Bush
Not sure
46% 48% 42%
40% 37% 43%
14% 14% 14%
Base
Gender
Woman Man
Clinton/Carson
Hillary Clinton
Ben Carson
Not sure
47% 56% 36%
44% 36% 53%
9% 8% 11%
Base
Gender
Woman Man
Sanders/Carson
Bernie Sanders
Ben Carson
Not sure
44% 46% 42%
44% 39% 49%
12% 15% 10%
Base
Gender
Woman Man
Clinton/Cruz
Hillary Clinton
Ted Cruz
Not sure
46% 54% 36%
44% 39% 51%
10% 8% 13%
February 2-3, 2016survey of 1,236 registered votersFebruary 2-3, 2016survey of 1,236 registered voters
3020 Highwoods Blvd.Raleigh, NC 27604
[email protected] / 888 621-6988
3020 Highwoods Blvd.Raleigh, NC 27604
[email protected] / 888 621-6988
Base
Gender
Woman Man
Sanders/Cruz
Bernie Sanders
Ted Cruz
Not sure
44% 46% 42%
42% 38% 46%
14% 15% 12%
Base
Gender
Woman Man
Clinton/Rubio
Hillary Clinton
Marco Rubio
Not sure
44% 53% 33%
46% 39% 53%
10% 8% 13%
Base
Gender
Woman Man
Sanders/Rubio
Bernie Sanders
Marco Rubio
Not sure
43% 46% 40%
45% 39% 52%
12% 15% 8%
Base
Gender
Woman Man
Clinton/Trump
Hillary Clinton
Donald Trump
Not sure
47% 54% 40%
40% 34% 47%
13% 12% 13%
Base
Gender
Woman Man
Sanders/Trump
Bernie Sanders
Donald Trump
Not sure
46% 54% 38%
42% 35% 51%
11% 11% 12%
Base
Gender
Woman Man
BloombergFavorability
Favorable
Unfavorable
Not sure
19% 19% 18%
36% 28% 45%
46% 53% 37%
Base
Gender
Woman Man
Nuts Favorability
Favorable
Unfavorable
Not sure
9% 9% 9%
22% 20% 24%
69% 71% 67%
Base
Gender
Woman Man
Clinton/Trump/Bloom-berg
Hillary Clinton
Donald Trump
Michael Bloomberg
Not sure
41% 49% 30%
37% 29% 47%
11% 12% 10%
11% 9% 12%
February 2-3, 2016survey of 1,236 registered votersFebruary 2-3, 2016survey of 1,236 registered voters
3020 Highwoods Blvd.Raleigh, NC 27604
[email protected] / 888 621-6988
3020 Highwoods Blvd.Raleigh, NC 27604
[email protected] / 888 621-6988
Base
Gender
Woman Man
Clinton/Trump/Nuts
Hillary Clinton
Donald Trump
Deez Nuts
Not sure
42% 50% 33%
39% 30% 49%
10% 9% 10%
9% 10% 8%
Base
Gender
Woman Man
Sanders/Trump/Bloo-mberg
Bernie Sanders
Donald Trump
Michael Bloomberg
Not sure
36% 40% 31%
39% 31% 47%
13% 16% 10%
12% 13% 12%
Base
Gender
Woman Man
Sanders/Trump/Nuts
Bernie Sanders
Donald Trump
Deez Nuts
Not sure
40% 46% 34%
41% 32% 51%
7% 6% 7%
12% 16% 9%
Base
Gender
Woman Man
NickelbackFavorability
Favorable
Unfavorable
Not sure
15% 14% 16%
20% 18% 24%
65% 69% 61%
Base
Gender
Woman Man
Burrito SandwichYes/No
Consider a burrito tobe a sandwich
Do not consider aburrito to be a
sandwich
Not sure
17% 16% 17%
66% 67% 64%
18% 17% 19%
Base
Party
Democrat RepublicanIndependent
/ Other
Obama Approval
Approve
Disapprove
Not sure
45% 80% 6% 40%
51% 17% 91% 53%
4% 3% 2% 7%
February 2-3, 2016survey of 1,236 registered votersFebruary 2-3, 2016survey of 1,236 registered voters
3020 Highwoods Blvd.Raleigh, NC 27604
[email protected] / 888 621-6988
3020 Highwoods Blvd.Raleigh, NC 27604
[email protected] / 888 621-6988
Base
Party
Democrat RepublicanIndependent
/ Other
Congress Approval
Approve
Disapprove
Not sure
9% 11% 6% 9%
82% 77% 88% 82%
9% 12% 7% 9%
Base
Party
Democrat RepublicanIndependent
/ Other
McConnell Approval
Approve
Disapprove
Not sure
13% 11% 14% 15%
59% 56% 60% 62%
28% 33% 26% 23%
Base
Party
Democrat RepublicanIndependent
/ Other
Ryan Approval
Approve
Disapprove
Not sure
38% 28% 56% 29%
41% 50% 28% 45%
21% 22% 16% 25%
Base
Party
Democrat RepublicanIndependent
/ Other
Generic PresidentVote
Democrat
Republican
Not sure
44% 82% 2% 38%
43% 8% 92% 36%
12% 10% 6% 26%
Base
Party
Democrat RepublicanIndependent
/ Other
Generic CongressVote
Democrat
Republican
Not sure
46% 85% 5% 38%
41% 8% 89% 31%
12% 7% 6% 31%
Base
Party
Democrat RepublicanIndependent
/ Other
Bush Favorability
Favorable
Unfavorable
Not sure
27% 20% 36% 25%
54% 57% 49% 54%
20% 23% 15% 21%
Base
Party
Democrat RepublicanIndependent
/ Other
Carson Favorability
Favorable
Unfavorable
Not sure
39% 18% 63% 41%
44% 60% 26% 43%
17% 22% 11% 17%
Base
Party
Democrat RepublicanIndependent
/ Other
Clinton Favorability
Favorable
Unfavorable
Not sure
42% 77% 5% 32%
53% 16% 94% 61%
5% 7% 1% 7%
February 2-3, 2016survey of 1,236 registered votersFebruary 2-3, 2016survey of 1,236 registered voters
3020 Highwoods Blvd.Raleigh, NC 27604
[email protected] / 888 621-6988
3020 Highwoods Blvd.Raleigh, NC 27604
[email protected] / 888 621-6988
Base
Party
Democrat RepublicanIndependent
/ Other
Cruz Favorability
Favorable
Unfavorable
Not sure
33% 15% 55% 32%
51% 68% 31% 49%
16% 17% 14% 18%
Base
Party
Democrat RepublicanIndependent
/ Other
Rubio Favorability
Favorable
Unfavorable
Not sure
39% 16% 63% 44%
41% 58% 24% 35%
20% 26% 13% 21%
Base
Party
Democrat RepublicanIndependent
/ Other
Sanders Favorability
Favorable
Unfavorable
Not sure
39% 55% 11% 52%
46% 23% 82% 37%
14% 22% 6% 11%
Base
Party
Democrat RepublicanIndependent
/ Other
Trump Favorability
Favorable
Unfavorable
Not sure
30% 14% 49% 32%
63% 82% 42% 59%
7% 4% 9% 9%
Base
Party
Democrat RepublicanIndependent
/ Other
Clinton/Bush
Hillary Clinton
Jeb Bush
Not sure
46% 84% 6% 37%
39% 7% 79% 37%
15% 8% 15% 26%
Base
Party
Democrat RepublicanIndependent
/ Other
Sanders/Bush
Bernie Sanders
Jeb Bush
Not sure
46% 75% 10% 43%
40% 11% 78% 37%
14% 13% 12% 20%
Base
Party
Democrat RepublicanIndependent
/ Other
Clinton/Carson
Hillary Clinton
Ben Carson
Not sure
47% 83% 9% 36%
44% 12% 82% 45%
9% 5% 9% 19%
Base
Party
Democrat RepublicanIndependent
/ Other
Sanders/Carson
Bernie Sanders
Ben Carson
Not sure
44% 72% 10% 43%
44% 13% 83% 41%
12% 14% 8% 16%

February 2-3, 2016survey of 1,236 registered votersFebruary 2-3, 2016survey of 1,236 registered voters
3020 Highwoods Blvd.Raleigh, NC 27604
[email protected] / 888 621-6988
3020 Highwoods Blvd.Raleigh, NC 27604
[email protected] / 888 621-6988
Base
Party
Democrat RepublicanIndependent
/ Other
Clinton/Cruz
Hillary Clinton
Ted Cruz
Not sure
46% 82% 9% 33%
44% 10% 84% 49%
10% 8% 7% 18%
Base
Party
Democrat RepublicanIndependent
/ Other
Sanders/Cruz
Bernie Sanders
Ted Cruz
Not sure
44% 75% 9% 40%
42% 12% 83% 36%
14% 13% 8% 24%
Base
Party
Democrat RepublicanIndependent
/ Other
Clinton/Rubio
Hillary Clinton
Marco Rubio
Not sure
44% 82% 6% 31%
46% 11% 87% 47%
10% 7% 6% 22%
Base
Party
Democrat RepublicanIndependent
/ Other
Sanders/Rubio
Bernie Sanders
Marco Rubio
Not sure
43% 72% 8% 42%
45% 14% 86% 44%
12% 14% 7% 14%
Base
Party
Democrat RepublicanIndependent
/ Other
Clinton/Trump
Hillary Clinton
Donald Trump
Not sure
47% 84% 8% 39%
40% 11% 77% 40%
13% 5% 15% 22%
Base
Party
Democrat RepublicanIndependent
/ Other
Sanders/Trump
Bernie Sanders
Donald Trump
Not sure
46% 79% 7% 44%
42% 15% 77% 41%
11% 6% 16% 14%
Base
Party
Democrat RepublicanIndependent
/ Other
BloombergFavorability
Favorable
Unfavorable
Not sure
19% 22% 12% 22%
36% 24% 50% 37%
46% 54% 38% 42%
Base
Party
Democrat RepublicanIndependent
/ Other
Nuts Favorability
Favorable
Unfavorable
Not sure
9% 10% 4% 13%
22% 21% 23% 22%
69% 69% 73% 64%
February 2-3, 2016survey of 1,236 registered votersFebruary 2-3, 2016survey of 1,236 registered voters
3020 Highwoods Blvd.Raleigh, NC 27604
[email protected] / 888 621-6988
3020 Highwoods Blvd.Raleigh, NC 27604
[email protected] / 888 621-6988
Base
Party
Democrat RepublicanIndependent
/ Other
Clinton/Trump/Bloom-berg
Hillary Clinton
Donald Trump
Michael Bloomberg
Not sure
41% 79% 4% 25%
37% 11% 70% 39%
11% 6% 16% 15%
11% 4% 11% 21%
Base
Party
Democrat RepublicanIndependent
/ Other
Clinton/Trump/Nuts
Hillary Clinton
Donald Trump
Deez Nuts
Not sure
42% 79% 5% 29%
39% 11% 73% 39%
10% 7% 9% 17%
9% 3% 13% 15%
Base
Party
Democrat RepublicanIndependent
/ Other
Sanders/Trump/Bloo-mberg
Bernie Sanders
Donald Trump
Michael Bloomberg
Not sure
36% 63% 1% 36%
39% 16% 71% 34%
13% 11% 16% 12%
12% 10% 11% 19%
Base
Party
Democrat RepublicanIndependent
/ Other
Sanders/Trump/Nuts
Bernie Sanders
Donald Trump
Deez Nuts
Not sure
40% 73% 5% 35%
41% 15% 74% 38%
7% 4% 8% 10%
12% 9% 13% 17%
Base
Party
Democrat RepublicanIndependent
/ Other
NickelbackFavorability
Favorable
Unfavorable
Not sure
15% 14% 12% 19%
20% 20% 20% 22%
65% 66% 68% 59%
Base
Party
Democrat RepublicanIndependent
/ Other
Burrito SandwichYes/No
Consider a burrito tobe a sandwich
Do not consider aburrito to be a
sandwich
Not sure
17% 19% 17% 12%
66% 59% 71% 71%
18% 23% 11% 17%
February 2-3, 2016survey of 1,236 registered votersFebruary 2-3, 2016survey of 1,236 registered voters
3020 Highwoods Blvd.Raleigh, NC 27604
[email protected] / 888 621-6988
3020 Highwoods Blvd.Raleigh, NC 27604
[email protected] / 888 621-6988
Base
Race
Hispanic WhiteAfrican
American Other
Obama Approval
Approve
Disapprove
Not sure
45% 70% 32% 92% 63%
51% 28% 64% 5% 30%
4% 3% 4% 3% 7%
Base
Race
Hispanic WhiteAfrican
American Other
Congress Approval
Approve
Disapprove
Not sure
9% 18% 7% 10% 15%
82% 73% 86% 68% 71%
9% 9% 7% 22% 14%
Base
Race
Hispanic WhiteAfrican
American Other
McConnell Approval
Approve
Disapprove
Not sure
13% 18% 11% 19% 18%
59% 63% 63% 37% 49%
28% 18% 26% 44% 33%
Base
Race
Hispanic WhiteAfrican
American Other
Ryan Approval
Approve
Disapprove
Not sure
38% 28% 39% 42% 36%
41% 57% 40% 37% 45%
21% 15% 22% 21% 19%
Base
Race
Hispanic WhiteAfrican
American Other
Generic PresidentVote
Democrat
Republican
Not sure
44% 77% 34% 79% 43%
43% 15% 55% 2% 29%
12% 9% 10% 19% 28%
Base
Race
Hispanic WhiteAfrican
American Other
Generic CongressVote
Democrat
Republican
Not sure
46% 76% 34% 91% 57%
41% 14% 53% 3% 27%
12% 10% 14% 6% 16%
Base
Race
Hispanic WhiteAfrican
American Other
Bush Favorability
Favorable
Unfavorable
Not sure
27% 31% 28% 22% 17%
54% 50% 54% 50% 62%
20% 20% 18% 28% 21%
Base
Race
Hispanic WhiteAfrican
American Other
Carson Favorability
Favorable
Unfavorable
Not sure
39% 35% 45% 10% 29%
44% 53% 41% 58% 40%
17% 13% 14% 33% 31%
February 2-3, 2016survey of 1,236 registered votersFebruary 2-3, 2016survey of 1,236 registered voters
3020 Highwoods Blvd.Raleigh, NC 27604
[email protected] / 888 621-6988
3020 Highwoods Blvd.Raleigh, NC 27604
[email protected] / 888 621-6988
Base
Race
Hispanic WhiteAfrican
American Other
Clinton Favorability
Favorable
Unfavorable
Not sure
42% 72% 30% 81% 46%
53% 27% 65% 8% 45%
5% 2% 4% 11% 9%
Base
Race
Hispanic WhiteAfrican
American Other
Cruz Favorability
Favorable
Unfavorable
Not sure
33% 24% 38% 11% 27%
51% 65% 47% 64% 52%
16% 11% 15% 25% 22%
Base
Race
Hispanic WhiteAfrican
American Other
Rubio Favorability
Favorable
Unfavorable
Not sure
39% 42% 44% 12% 23%
41% 40% 38% 59% 43%
20% 18% 18% 29% 34%
Base
Race
Hispanic WhiteAfrican
American Other
Sanders Favorability
Favorable
Unfavorable
Not sure
39% 76% 35% 30% 51%
46% 18% 56% 24% 30%
14% 6% 9% 46% 19%
Base
Race
Hispanic WhiteAfrican
American Other
Trump Favorability
Favorable
Unfavorable
Not sure
30% 28% 35% 12% 19%
63% 71% 57% 84% 71%
7% 1% 8% 4% 10%
Base
Race
Hispanic WhiteAfrican
American Other
Clinton/Bush
Hillary Clinton
Jeb Bush
Not sure
46% 75% 34% 89% 56%
39% 11% 50% 3% 24%
15% 14% 15% 8% 19%
Base
Race
Hispanic WhiteAfrican
American Other
Sanders/Bush
Bernie Sanders
Jeb Bush
Not sure
46% 71% 38% 66% 54%
40% 22% 48% 14% 27%
14% 7% 14% 20% 19%
Base
Race
Hispanic WhiteAfrican
American Other
Clinton/Carson
Hillary Clinton
Ben Carson
Not sure
47% 62% 36% 94% 52%
44% 23% 55% 2% 31%
9% 15% 9% 4% 17%
February 2-3, 2016survey of 1,236 registered votersFebruary 2-3, 2016survey of 1,236 registered voters
3020 Highwoods Blvd.Raleigh, NC 27604
[email protected] / 888 621-6988
3020 Highwoods Blvd.Raleigh, NC 27604
[email protected] / 888 621-6988
Base
Race
Hispanic WhiteAfrican
American Other
Sanders/Carson
Bernie Sanders
Ben Carson
Not sure
44% 66% 36% 66% 55%
44% 27% 52% 14% 27%
12% 7% 11% 20% 18%
Base
Race
Hispanic WhiteAfrican
American Other
Clinton/Cruz
Hillary Clinton
Ted Cruz
Not sure
46% 63% 35% 90% 51%
44% 18% 56% 4% 32%
10% 19% 9% 6% 18%
Base
Race
Hispanic WhiteAfrican
American Other
Sanders/Cruz
Bernie Sanders
Ted Cruz
Not sure
44% 62% 37% 69% 45%
42% 21% 51% 8% 31%
14% 17% 11% 23% 24%
Base
Race
Hispanic WhiteAfrican
American Other
Clinton/Rubio
Hillary Clinton
Marco Rubio
Not sure
44% 66% 33% 94% 43%
46% 21% 58% 3% 29%
10% 13% 10% 2% 28%
Base
Race
Hispanic WhiteAfrican
American Other
Sanders/Rubio
Bernie Sanders
Marco Rubio
Not sure
43% 61% 36% 60% 62%
45% 33% 54% 13% 28%
12% 6% 10% 27% 10%
Base
Race
Hispanic WhiteAfrican
American Other
Clinton/Trump
Hillary Clinton
Donald Trump
Not sure
47% 69% 35% 93% 59%
40% 20% 50% 4% 25%
13% 11% 14% 3% 16%
Base
Race
Hispanic WhiteAfrican
American Other
Sanders/Trump
Bernie Sanders
Donald Trump
Not sure
46% 64% 38% 78% 51%
42% 32% 50% 14% 24%
11% 4% 12% 8% 25%
Base
Race
Hispanic WhiteAfrican
American Other
BloombergFavorability
Favorable
Unfavorable
Not sure
19% 36% 16% 14% 31%
36% 37% 41% 13% 20%
46% 27% 44% 72% 48%

February 2-3, 2016survey of 1,236 registered votersFebruary 2-3, 2016survey of 1,236 registered voters
3020 Highwoods Blvd.Raleigh, NC 27604
[email protected] / 888 621-6988
3020 Highwoods Blvd.Raleigh, NC 27604
[email protected] / 888 621-6988
Base
Race
Hispanic WhiteAfrican
American Other
Nuts Favorability
Favorable
Unfavorable
Not sure
9% 17% 7% 14% 5%
22% 27% 21% 30% 13%
69% 55% 72% 56% 82%
Base
Race
Hispanic WhiteAfrican
American Other
Clinton/Trump/Bloom-berg
Hillary Clinton
Donald Trump
Michael Bloomberg
Not sure
41% 54% 31% 90% 37%
37% 30% 46% 4% 17%
11% 2% 13% 3% 24%
11% 14% 10% 3% 22%
Base
Race
Hispanic WhiteAfrican
American Other
Clinton/Trump/Nuts
Hillary Clinton
Donald Trump
Deez Nuts
Not sure
42% 59% 32% 84% 45%
39% 29% 48% 4% 21%
10% 11% 10% 10% 11%
9% 1% 10% 2% 24%
Base
Race
Hispanic WhiteAfrican
American Other
Sanders/Trump/Bloo-mberg
Bernie Sanders
Donald Trump
Michael Bloomberg
Not sure
36% 59% 29% 46% 49%
39% 21% 48% 12% 21%
13% 8% 12% 22% 19%
12% 12% 11% 20% 12%
Base
Race
Hispanic WhiteAfrican
American Other
Sanders/Trump/Nuts
Bernie Sanders
Donald Trump
Deez Nuts
Not sure
40% 63% 33% 64% 42%
41% 31% 48% 12% 22%
7% - 7% 7% 6%
12% 6% 11% 16% 31%
Base
Race
Hispanic WhiteAfrican
American Other
NickelbackFavorability
Favorable
Unfavorable
Not sure
15% 28% 14% 9% 10%
20% 32% 20% 18% 16%
65% 40% 66% 73% 74%
February 2-3, 2016survey of 1,236 registered votersFebruary 2-3, 2016survey of 1,236 registered voters
3020 Highwoods Blvd.Raleigh, NC 27604
[email protected] / 888 621-6988
3020 Highwoods Blvd.Raleigh, NC 27604
[email protected] / 888 621-6988
Base
Race
Hispanic WhiteAfrican
American Other
Burrito SandwichYes/No
Consider a burrito tobe a sandwich
Do not consider aburrito to be a
sandwich
Not sure
17% 14% 15% 23% 20%
66% 70% 70% 41% 56%
18% 15% 14% 36% 24%
Base
Age
18 to29
30 to45
46 to65
Olderthan 65
Obama Approval
Approve
Disapprove
Not sure
45% 65% 47% 40% 42%
51% 31% 52% 55% 54%
4% 4% 2% 5% 4%
Base
Age
18 to29
30 to45
46 to65
Olderthan 65
Congress Approval
Approve
Disapprove
Not sure
9% 11% 15% 5% 6%
82% 81% 73% 86% 86%
9% 8% 12% 9% 8%
Base
Age
18 to29
30 to45
46 to65
Olderthan 65
McConnell Approval
Approve
Disapprove
Not sure
13% 18% 13% 11% 14%
59% 40% 50% 67% 66%
28% 42% 37% 22% 20%
Base
Age
18 to29
30 to45
46 to65
Olderthan 65
Ryan Approval
Approve
Disapprove
Not sure
38% 40% 34% 37% 42%
41% 39% 42% 44% 37%
21% 21% 24% 19% 21%
Base
Age
18 to29
30 to45
46 to65
Olderthan 65
Generic PresidentVote
Democrat
Republican
Not sure
44% 57% 52% 37% 42%
43% 22% 37% 51% 49%
12% 20% 11% 12% 9%
February 2-3, 2016survey of 1,236 registered votersFebruary 2-3, 2016survey of 1,236 registered voters
3020 Highwoods Blvd.Raleigh, NC 27604
[email protected] / 888 621-6988
3020 Highwoods Blvd.Raleigh, NC 27604
[email protected] / 888 621-6988
Base
Age
18 to29
30 to45
46 to65
Olderthan 65
Generic CongressVote
Democrat
Republican
Not sure
46% 68% 51% 38% 42%
41% 19% 34% 50% 48%
12% 13% 15% 12% 10%
Base
Age
18 to29
30 to45
46 to65
Olderthan 65
Bush Favorability
Favorable
Unfavorable
Not sure
27% 23% 27% 27% 29%
54% 54% 59% 53% 50%
20% 23% 14% 21% 21%
Base
Age
18 to29
30 to45
46 to65
Olderthan 65
Carson Favorability
Favorable
Unfavorable
Not sure
39% 26% 34% 47% 38%
44% 57% 43% 42% 43%
17% 17% 23% 12% 18%
Base
Age
18 to29
30 to45
46 to65
Olderthan 65
Clinton Favorability
Favorable
Unfavorable
Not sure
42% 53% 48% 35% 39%
53% 44% 46% 59% 56%
5% 3% 5% 5% 5%
Base
Age
18 to29
30 to45
46 to65
Olderthan 65
Cruz Favorability
Favorable
Unfavorable
Not sure
33% 24% 29% 37% 34%
51% 61% 48% 50% 51%
16% 15% 23% 13% 16%
Base
Age
18 to29
30 to45
46 to65
Olderthan 65
Rubio Favorability
Favorable
Unfavorable
Not sure
39% 28% 38% 42% 40%
41% 48% 38% 41% 40%
20% 24% 24% 17% 20%
February 2-3, 2016survey of 1,236 registered votersFebruary 2-3, 2016survey of 1,236 registered voters
3020 Highwoods Blvd.Raleigh, NC 27604
[email protected] / 888 621-6988
3020 Highwoods Blvd.Raleigh, NC 27604
[email protected] / 888 621-6988
Base
Age
18 to29
30 to45
46 to65
Olderthan 65
Sanders Favorability
Favorable
Unfavorable
Not sure
39% 61% 47% 31% 33%
46% 19% 36% 59% 53%
14% 20% 18% 10% 14%
Base
Age
18 to29
30 to45
46 to65
Olderthan 65
Trump Favorability
Favorable
Unfavorable
Not sure
30% 32% 27% 32% 31%
63% 66% 66% 63% 57%
7% 2% 7% 5% 12%
Base
Age
18 to29
30 to45
46 to65
Olderthan 65
Clinton/Bush
Hillary Clinton
Jeb Bush
Not sure
46% 55% 58% 38% 42%
39% 30% 28% 45% 47%
15% 15% 15% 17% 11%
Base
Age
18 to29
30 to45
46 to65
Olderthan 65
Sanders/Bush
Bernie Sanders
Jeb Bush
Not sure
46% 65% 55% 35% 41%
40% 24% 31% 49% 44%
14% 10% 14% 16% 15%
Base
Age
18 to29
30 to45
46 to65
Olderthan 65
Clinton/Carson
Hillary Clinton
Ben Carson
Not sure
47% 49% 57% 41% 44%
44% 36% 35% 50% 47%
9% 15% 8% 9% 9%
Base
Age
18 to29
30 to45
46 to65
Olderthan 65
Sanders/Carson
Bernie Sanders
Ben Carson
Not sure
44% 74% 48% 35% 38%
44% 20% 40% 52% 48%
12% 6% 12% 13% 15%
Base
Age
18 to29
30 to45
46 to65
Olderthan 65
Clinton/Cruz
Hillary Clinton
Ted Cruz
Not sure
46% 47% 52% 42% 44%
44% 38% 35% 51% 48%
10% 15% 13% 7% 8%
Base
Age
18 to29
30 to45
46 to65
Olderthan 65
Sanders/Cruz
Bernie Sanders
Ted Cruz
Not sure
44% 58% 53% 37% 39%
42% 20% 32% 53% 46%
14% 21% 15% 10% 15%
February 2-3, 2016survey of 1,236 registered votersFebruary 2-3, 2016survey of 1,236 registered voters
3020 Highwoods Blvd.Raleigh, NC 27604
[email protected] / 888 621-6988
3020 Highwoods Blvd.Raleigh, NC 27604
[email protected] / 888 621-6988
Base
Age
18 to29
30 to45
46 to65
Olderthan 65
Clinton/Rubio
Hillary Clinton
Marco Rubio
Not sure
44% 51% 48% 39% 42%
46% 29% 41% 53% 50%
10% 20% 11% 8% 8%
Base
Age
18 to29
30 to45
46 to65
Olderthan 65
Sanders/Rubio
Bernie Sanders
Marco Rubio
Not sure
43% 60% 49% 37% 37%
45% 34% 37% 52% 49%
12% 6% 14% 11% 15%
Base
Age
18 to29
30 to45
46 to65
Olderthan 65
Clinton/Trump
Hillary Clinton
Donald Trump
Not sure
47% 61% 52% 42% 43%
40% 21% 33% 48% 46%
13% 18% 15% 11% 11%
Base
Age
18 to29
30 to45
46 to65
Olderthan 65
Sanders/Trump
Bernie Sanders
Donald Trump
Not sure
46% 65% 54% 38% 40%
42% 25% 34% 52% 46%
11% 10% 12% 10% 13%
Base
Age
18 to29
30 to45
46 to65
Olderthan 65
BloombergFavorability
Favorable
Unfavorable
Not sure
19% 15% 25% 16% 18%
36% 26% 24% 45% 39%
46% 59% 51% 39% 43%
Base
Age
18 to29
30 to45
46 to65
Olderthan 65
Nuts Favorability
Favorable
Unfavorable
Not sure
9% 33% 13% 2% 2%
22% 26% 22% 24% 16%
69% 41% 66% 74% 81%

February 2-3, 2016survey of 1,236 registered votersFebruary 2-3, 2016survey of 1,236 registered voters
3020 Highwoods Blvd.Raleigh, NC 27604
[email protected] / 888 621-6988
3020 Highwoods Blvd.Raleigh, NC 27604
[email protected] / 888 621-6988
Base
Age
18 to29
30 to45
46 to65
Olderthan 65
Clinton/Trump/Bloom-berg
Hillary Clinton
Donald Trump
Michael Bloomberg
Not sure
41% 46% 48% 35% 38%
37% 25% 27% 45% 44%
11% 12% 14% 10% 10%
11% 17% 11% 10% 8%
Base
Age
18 to29
30 to45
46 to65
Olderthan 65
Clinton/Trump/Nuts
Hillary Clinton
Donald Trump
Deez Nuts
Not sure
42% 42% 46% 39% 43%
39% 23% 32% 46% 45%
10% 27% 13% 5% 4%
9% 7% 10% 10% 8%
Base
Age
18 to29
30 to45
46 to65
Olderthan 65
Sanders/Trump/Bloo-mberg
Bernie Sanders
Donald Trump
Michael Bloomberg
Not sure
36% 52% 40% 28% 33%
39% 14% 34% 47% 45%
13% 17% 10% 14% 13%
12% 16% 15% 10% 10%
Base
Age
18 to29
30 to45
46 to65
Olderthan 65
Sanders/Trump/Nuts
Bernie Sanders
Donald Trump
Deez Nuts
Not sure
40% 55% 45% 34% 38%
41% 21% 34% 49% 45%
7% 15% 9% 4% 4%
12% 9% 12% 13% 14%
Base
Age
18 to29
30 to45
46 to65
Olderthan 65
NickelbackFavorability
Favorable
Unfavorable
Not sure
15% 16% 21% 17% 2%
20% 39% 26% 15% 13%
65% 44% 53% 69% 84%
Base
Age
18 to29
30 to45
46 to65
Olderthan 65
Burrito SandwichYes/No
Consider a burrito tobe a sandwich
Do not consider aburrito to be a
sandwich
Not sure
17% 12% 15% 16% 21%
66% 67% 68% 72% 52%
18% 20% 17% 12% 26%

February 2-3, 2016survey of 1,236 registered votersFebruary 2-3, 2016survey of 1,236 registered voters
3020 Highwoods Blvd.Raleigh, NC 27604
[email protected] / 888 621-6988
3020 Highwoods Blvd.Raleigh, NC 27604
[email protected] / 888 621-6988
Base
Mode
Phone Internet
Obama Approval
Approve
Disapprove
Not sure
45% 44% 51%
51% 53% 44%
4% 3% 6%
Base
Mode
Phone Internet
Congress Approval
Approve
Disapprove
Not sure
9% 5% 22%
82% 87% 61%
9% 7% 17%
Base
Mode
Phone Internet
McConnell Approval
Approve
Disapprove
Not sure
13% 12% 19%
59% 66% 31%
28% 23% 50%
Base
Mode
Phone Internet
Ryan Approval
Approve
Disapprove
Not sure
38% 39% 33%
41% 44% 29%
21% 16% 38%
Base
Mode
Phone Internet
Generic PresidentVote
Democrat
Republican
Not sure
44% 40% 63%
43% 48% 24%
12% 12% 13%
Base
Mode
Phone Internet
Generic CongressVote
Democrat
Republican
Not sure
46% 43% 59%
41% 46% 23%
12% 11% 18%
Base
Mode
Phone Internet
Bush Favorability
Favorable
Unfavorable
Not sure
27% 26% 30%
54% 56% 44%
20% 18% 26%
Base
Mode
Phone Internet
Carson Favorability
Favorable
Unfavorable
Not sure
39% 41% 29%
44% 45% 40%
17% 13% 31%
February 2-3, 2016survey of 1,236 registered votersFebruary 2-3, 2016survey of 1,236 registered voters
3020 Highwoods Blvd.Raleigh, NC 27604
[email protected] / 888 621-6988
3020 Highwoods Blvd.Raleigh, NC 27604
[email protected] / 888 621-6988
Base
Mode
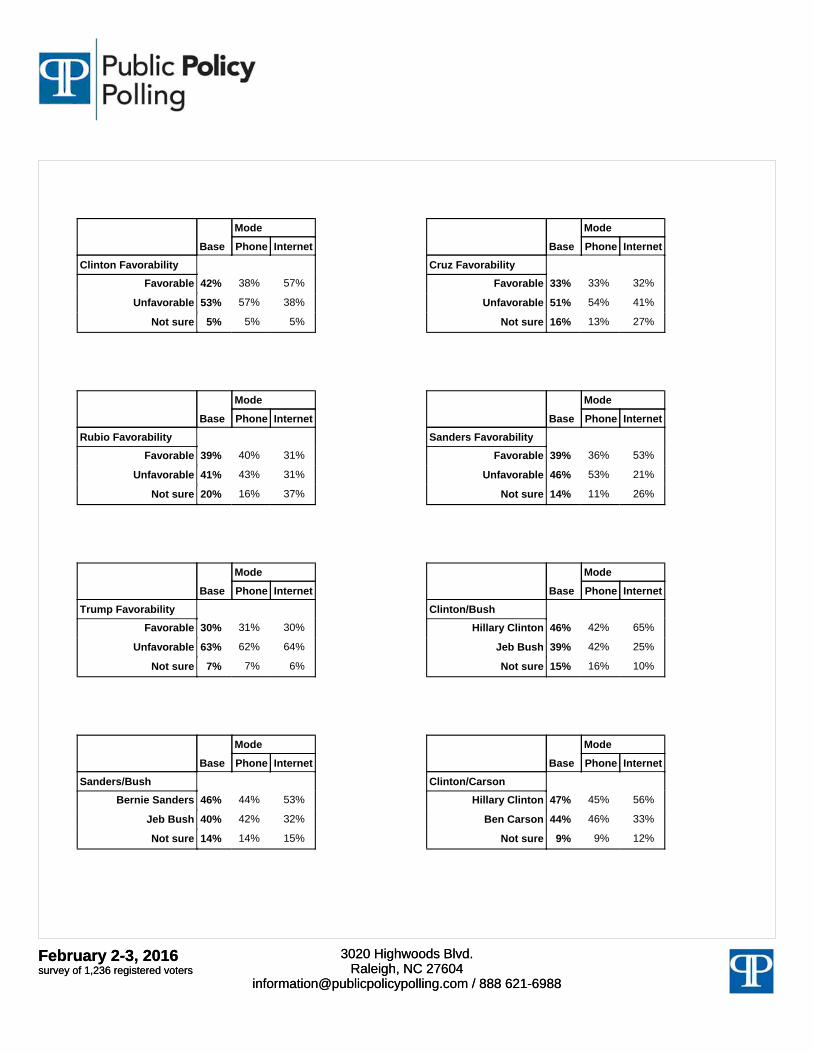
Phone Internet
Clinton Favorability
Favorable
Unfavorable
Not sure
42% 38% 57%
53% 57% 38%
5% 5% 5%
Base
Mode
Phone Internet
Cruz Favorability
Favorable
Unfavorable
Not sure
33% 33% 32%
51% 54% 41%
16% 13% 27%
Base
Mode
Phone Internet
Rubio Favorability
Favorable
Unfavorable
Not sure
39% 40% 31%
41% 43% 31%
20% 16% 37%
Base
Mode
Phone Internet
Sanders Favorability
Favorable
Unfavorable
Not sure
39% 36% 53%
46% 53% 21%
14% 11% 26%
Base
Mode
Phone Internet
Trump Favorability
Favorable
Unfavorable
Not sure
30% 31% 30%
63% 62% 64%
7% 7% 6%
Base
Mode
Phone Internet
Clinton/Bush
Hillary Clinton
Jeb Bush
Not sure
46% 42% 65%
39% 42% 25%
15% 16% 10%
Base
Mode
Phone Internet
Sanders/Bush
Bernie Sanders
Jeb Bush
Not sure
46% 44% 53%
40% 42% 32%
14% 14% 15%
Base
Mode
Phone Internet
Clinton/Carson
Hillary Clinton
Ben Carson
Not sure
47% 45% 56%
44% 46% 33%
9% 9% 12%
February 2-3, 2016survey of 1,236 registered votersFebruary 2-3, 2016survey of 1,236 registered voters
3020 Highwoods Blvd.Raleigh, NC 27604
[email protected] / 888 621-6988
3020 Highwoods Blvd.Raleigh, NC 27604
[email protected] / 888 621-6988
Base
Mode
Phone Internet
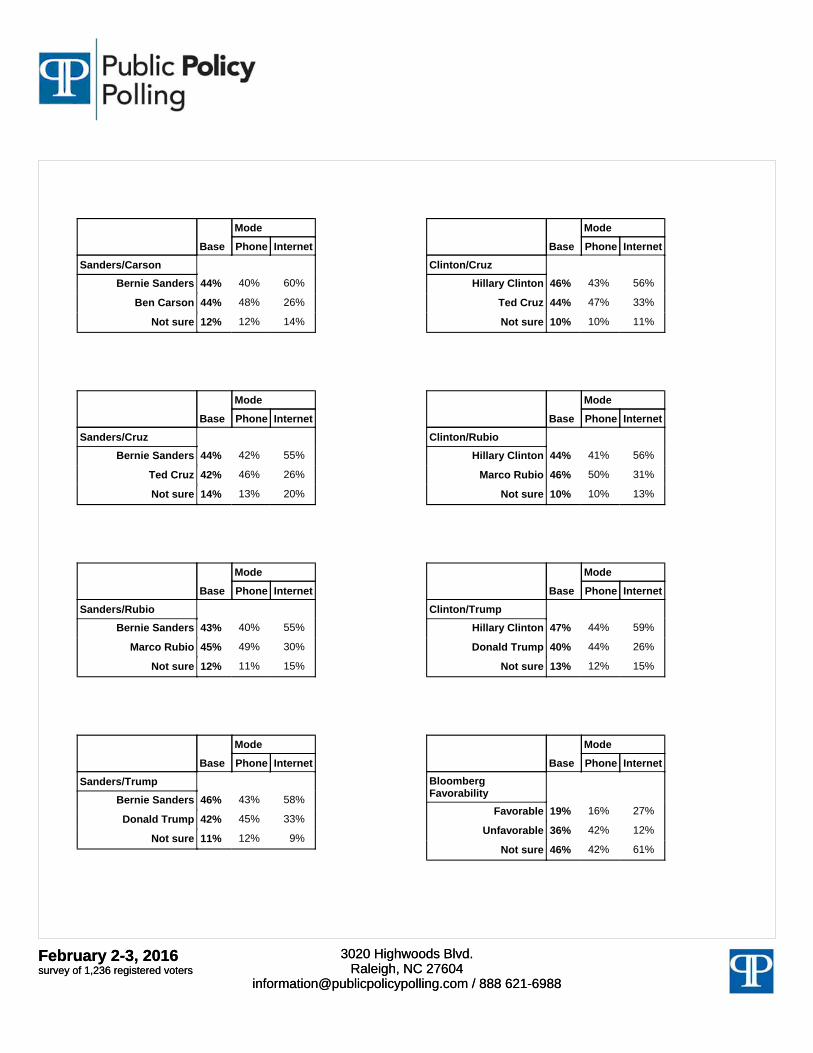
Sanders/Carson
Bernie Sanders
Ben Carson
Not sure
44% 40% 60%
44% 48% 26%
12% 12% 14%
Base
Mode
Phone Internet
Clinton/Cruz
Hillary Clinton
Ted Cruz
Not sure
46% 43% 56%
44% 47% 33%
10% 10% 11%
Base
Mode
Phone Internet
Sanders/Cruz
Bernie Sanders
Ted Cruz
Not sure
44% 42% 55%
42% 46% 26%
14% 13% 20%
Base
Mode
Phone Internet
Clinton/Rubio
Hillary Clinton
Marco Rubio
Not sure
44% 41% 56%
46% 50% 31%
10% 10% 13%
Base
Mode
Phone Internet
Sanders/Rubio
Bernie Sanders
Marco Rubio
Not sure
43% 40% 55%
45% 49% 30%
12% 11% 15%
Base
Mode
Phone Internet
Clinton/Trump
Hillary Clinton
Donald Trump
Not sure
47% 44% 59%
40% 44% 26%
13% 12% 15%
Base
Mode
Phone Internet
Sanders/Trump
Bernie Sanders
Donald Trump
Not sure
46% 43% 58%
42% 45% 33%
11% 12% 9%
Base
Mode
Phone Internet
BloombergFavorability
Favorable
Unfavorable
Not sure
19% 16% 27%
36% 42% 12%
46% 42% 61%

February 2-3, 2016survey of 1,236 registered votersFebruary 2-3, 2016survey of 1,236 registered voters
3020 Highwoods Blvd.Raleigh, NC 27604
[email protected] / 888 621-6988
3020 Highwoods Blvd.Raleigh, NC 27604
[email protected] / 888 621-6988
Base
Mode
Phone Internet
Nuts Favorability
Favorable
Unfavorable
Not sure
9% 7% 17%
22% 19% 36%
69% 75% 48%
Base
Mode
Phone Internet
Clinton/Trump/Bloom-berg
Hillary Clinton
Donald Trump
Michael Bloomberg
Not sure
41% 38% 51%
37% 41% 23%
11% 11% 13%
11% 10% 13%
Base
Mode
Phone Internet
Clinton/Trump/Nuts
Hillary Clinton
Donald Trump
Deez Nuts
Not sure
42% 40% 49%
39% 42% 28%
10% 9% 13%
9% 9% 10%
Base
Mode
Phone Internet
Sanders/Trump/Bloo-mberg
Bernie Sanders
Donald Trump
Michael Bloomberg
Not sure
36% 32% 52%
39% 43% 24%
13% 14% 9%
12% 12% 15%
Base
Mode
Phone Internet
Sanders/Trump/Nuts
Bernie Sanders
Donald Trump
Deez Nuts
Not sure
40% 39% 47%
41% 43% 29%
7% 6% 10%
12% 12% 13%
Base
Mode
Phone Internet
NickelbackFavorability
Favorable
Unfavorable
Not sure
15% 8% 39%
20% 20% 22%
65% 72% 39%
February 2-3, 2016survey of 1,236 registered votersFebruary 2-3, 2016survey of 1,236 registered voters
3020 Highwoods Blvd.Raleigh, NC 27604
[email protected] / 888 621-6988
3020 Highwoods Blvd.Raleigh, NC 27604
[email protected] / 888 621-6988
Base
Mode
Phone Internet
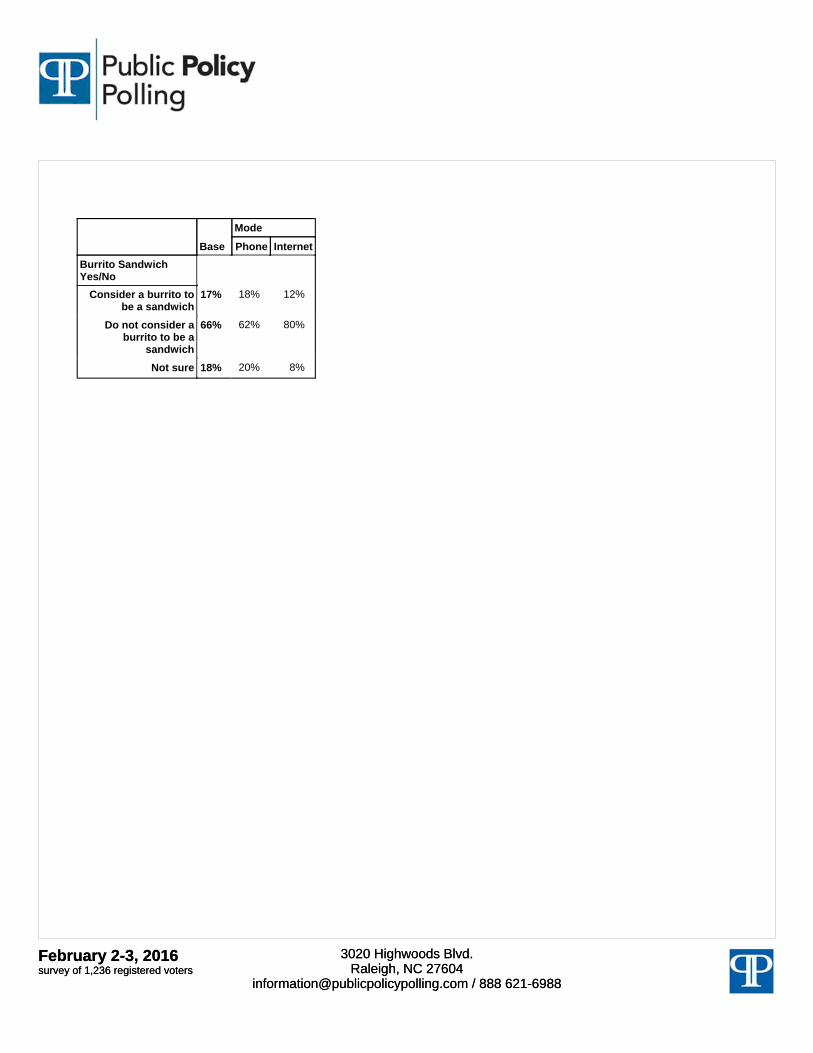
Burrito SandwichYes/No
Consider a burrito tobe a sandwich
Do not consider aburrito to be a
sandwich
Not sure
17% 18% 12%
66% 62% 80%
18% 20% 8%