national shorebird conservation assessment€¦ · national shorebird conservation assessment: ......
TRANSCRIPT
U.S. Shorebird Conservation Plan
National Shorebird Conservation Assessment:
Shorebird Conservation Status, Conservation Units, Population Estimates, Population Targets, and
Species Prioritization
May 2000
A Technical Report of the Research and Monitoring Working Group of the U.S. shorebird Conservation Plan
This report should be cited as follows: Brown, S., C. Hickey, B. Gill, L. Gorman, C. Gratto-Trevor, S. Haig, B. Harrington, C. Hunter, G. Morrison, G. Page, P. Sanzenbacher, S. Skagen, N. Warnock. 2000. National Shorebird Conservation Assessment: Shorebird Conservation Status, Conservation Units, Population Estimates, Population Targets, and Species Prioritization. Manomet Center for Conservation Sciences. http://www.Manomet.org/USSCP/files.htm
Contributing Authors: Stephen Brown, Manomet Center for Conservation Sciences Catherine Hickey, Manomet Center for Conservation Sciences Bob Gill, USGS Alaska Biological Science Center Leah Gorman, Oregon State University, USGS-Forest and Rangeland Ecosystem Science Center Cheri Gratto-Trevor, Canadian Wildlife Service Susan Haig, USGS Forest and Rangeland Ecosystem Science Center Brian Harrington, Manomet Center for Conservation Sciences Chuck Hunter, USFWS Guy Morrison, Canadian Wildlife Service Gary Page, Point Reyes Bird Observatory Peter Sanzenbacher, Oregon State University, USGS-Forest and Rangeland Ecosystem Science
Center Susan Skagen, USGS Midcontinent Ecological Science Center Nils Warnock, Point Reyes Bird Observatory Contributors to Species Assessments: Brad Andres, USFWS Keith Arnold, Texas A&M University Peter Bergstrom, U.S. Fish & Wildlife Service Mark Colwell, Humboldt State University Peter Connors, Univ. of California, Bodega Marine Lab John Cooper, Manning, Cooper & Assoc. Carol Corbat, Louisiana State Univ.-Alexandria Hector Douglas, North Carolina State University Chris Elphick, University of Connecticut Robert Gill, USGS-Alaska Biological Science Center Leah Gorman, Oregon State Univ., USGS-Forest and Rangeland Ecosystem Science Center Cheri Gratto-Trevor, Canadian Wildlife Service Susan Haig, USGS Forest and Rangeland Ecosystem Science Center, Oregon State Univ Brian Harrington, Manomet Center for Conservation Sciences Richard Holmes, Dartmouth College Joseph R. Jehl Jr., Hubbs Sea World Research Inst., San Diego Oscar Johnson, University of Montana, Bozeman Fritz Knopf, USGS-Mid-Continent Science Center David Krementz, USGS Arkansas Coop. Unit David Lank, Simon Fraser University
ii
Rick Lanctot, USGS Alaska Biological Science Center Betsy Mallory, Manomet Center for Conservation Sciences Brian McCaffery, U.S. Fish & Wildlife Service Guy. Morrison, Canadian Wildlife Service William Moskoff, Lake Forest College Erica Nol, Trent University Lewis Oring, University of Nevada-Reno Gary Page, Point Reyes Bird Observatory Dennis Paulson, University of Puget Sound Abby Powell, USGS Arkansas Coop. Unit Margaret Rubega, University of Connecticut Peter Sanzenbacher, Oregon St. Univ., USGS-FRESC Doug Schamel, Simon Fraser University Susan Skagen, USGS-Mid-Continent Science Center Lee Tibbitts, USGS-Alaska Biological Science Center Nils Warnock, Point Reyes Bird Observatory
Preface
This document presents the information collected by the U.S. Shorebird Conservation Plan technical working groups that addressed the current status of shorebirds in North America, established preliminary population estimates, and set preliminary population targets that should be achieved to meet the overall plan goal of ensuring stable, self-sustaining populations of all shorebirds that occur in the U.S.
The first section provides the results of the shorebird conservation status assessment, which brings together existing information about the conservation status and threats facing each shorebird species. Conservation activities to address these issues often requires consideration of distinct populations of birds. The second section of the report describes the subspecies of shorebirds that occur in the U.S., and discusses which subspecies or distinct populations must be considered separately to adequately protect shorebirds. One major effort conducted as part of the planning process for the United States and Canada was to develop estimates of the current size of shorebird populations, and to assess the information available for making such estimates. The methodology for making estimates of current population sizes for each species is described in section three. Planning for self-sustaining populations requires the setting of population goals that can help guide conservation actions on the ground. The methodology for setting tentative population targets for shorebirds, and the first approximation of targets for each species, is presented in section four. Carrying out conservation strategies often requires the prioritization of activities, and a system was developed to set national and regional shorebird species priorities. This system and the resulting priorities are presented in section five, including the species priorities, and the assessment of the importance of each area of the country to each species that was used in the prioritization process.
Each of these efforts is a significant part of the work done as part of the Shorebird Conservation Plan. In many cases, specific individuals took responsibility for sections of this report, and they are listed at the beginning of each section. In addition, the entire Research and
iii

Monitoring Working group, and the Regional Working Group leaders, reviewed and commented on the various parts of the document, and their assistance was critical to completion of the many tasks involved in completing this overall assessment. Taken together, these reports provide much of the technical information on which the U.S. Shorebird Conservation Plan was based, and support the rationale behind the major aspects of the plan.
iv
Table of Contents Contributing Authors: .................................................................................................................... ii Preface............................................................................................................................................ iii 1) Shorebird Conservation Status Assessment .............................................................................. 1
Assumptions................................................................................................................................ 1 Background Information ............................................................................................................. 2 Conclusions................................................................................................................................. 4
2) Shorebird Conservation Units: Subspecies and Distinct Populations ....................................... 5 3) Population Estimates ................................................................................................................. 6
Introduction ................................................................................................................................ 6 Methods ...................................................................................................................................... 8
Data compilation................................................................................................................... 10 Use of maximum counts........................................................................................................ 11 Seasonal considerations ........................................................................................................ 11 Assessing the accuracy of population estimates .................................................................... 12 Data presentation.................................................................................................................. 12
4) Population Targets................................................................................................................... 12 Rationale for setting shorebird population targets .................................................................... 13 Protocols for setting population targets..................................................................................... 13
5) Shorebird Species Conservation Priorities............................................................................... 15 National Shorebird Conservation Priorities.............................................................................. 15
Variables for National Priorities............................................................................................ 15 Criteria for National Priorities .............................................................................................. 17
Regional Shorebird Conservation Priorities.............................................................................. 18 Variables for Regional Priorities............................................................................................ 18 Criteria for Regional Priorities .............................................................................................. 19
APPENDICES............................................................................................................................... 21 Appendix 1: Conservation Assessment Matrix ....................................................................... 21 Appendix 2. Shorebird Conservation Units............................................................................. 25 Appendix 3: Population Size Estimates.................................................................................... 32 Appendix 4: Population Targets .............................................................................................. 34 Appendix 5: National Shorebird Species Priority Scores......................................................... 42 Appendix 6: Area Importance of Shorebird Planning Regions................................................ 46 Appendix 7: Area Importance of Bird Conservation Regions ................................................. 48
Literature Cited............................................................................................................................. 49
v
1
1) Shorebird Conservation Status Assessment
Susan Haig, Leah Gorman, and Peter
Sanzenbacher As part of the U.S. Shorebird
Conservation Plan and as a contribution to development of the Canadian Shorebird Plan, we collected information to assess the conservation status of the 50 shorebird species that breed in northern North America (U.S. and Canada). The overall goal of both the U.S. and Canadian Shorebird Plans is to ensure that stable and self-sustaining shorebird populations are distributed across their ranges in northern North America. In addition, the plans strive to ensure demographic and genetic stability for each species so that populations will persist far beyond the next century. Achieving this goal will result from mitigating the anthropogenic factors that currently threaten most shorebird species.
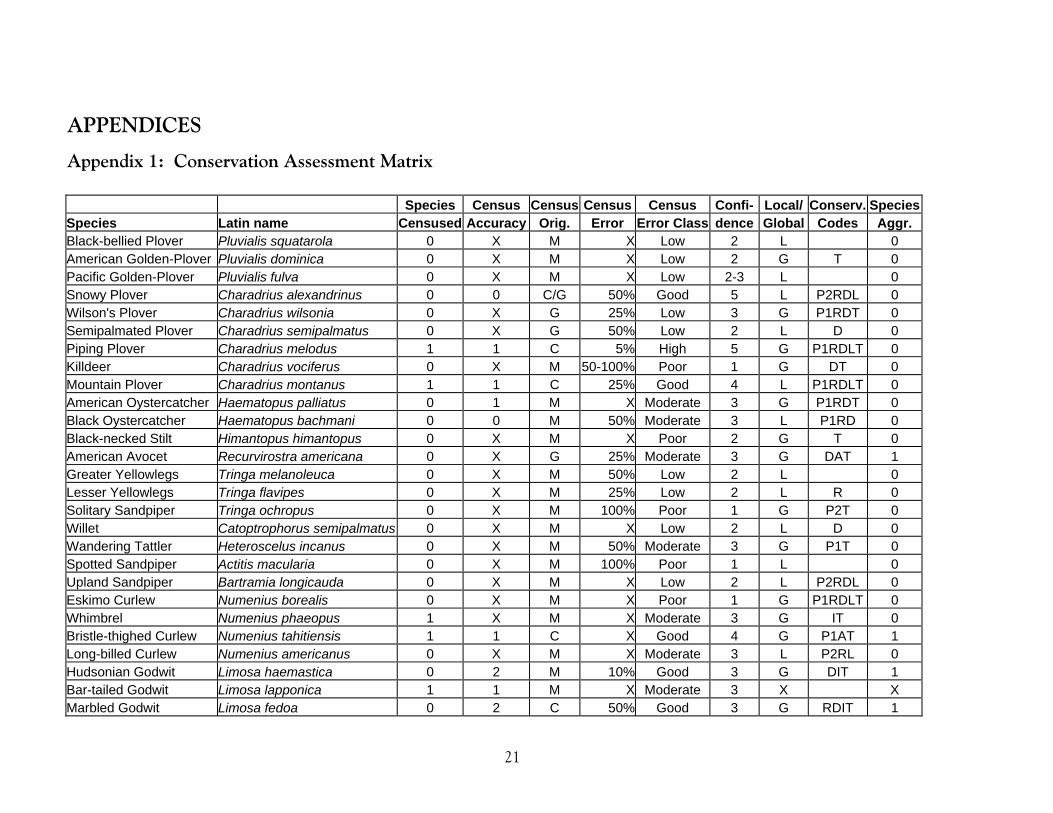
The baseline information from which these goals were determined was obtained through coordination and collection of species-specific information from 36 shorebird biologists from the U.S. and Canada. The results of this information were summarized in a matrix presenting many different variables describing the status of knowledge about each shorebird species (Appendix 1). Based on this matrix, the report below includes the following: 1) the assumptions all assessments were based on; 2) some background information derived from data provided by the species experts as well as our review of the shorebird literature; 3) conclusions and recommendations. The species experts reviewed the first draft of population estimates and provided tentative population targets. Both have been revised
by the working group and are now presented separately in Sections 3 and 4.
Assumptions 1. We considered shorebirds that breed in
the U.S. and Canada. Some of these species also breed in Mexico and the Caribbean. However, we did not consider shorebird species that breed in Mexico and the Caribbean but not in the U.S. or Canada.
2. Species conservation assessments were
based on consideration of threats to the species while they are in the United States and Canada, as well as threats encountered in other regions throughout various stages of the annual cycle. The other regions in the New World primarily included Mexico, the Caribbean, Central America, and South America; in the Old World they include Europe and the Australasian region.
3. Population estimates were based on the
North American breeding population estimates for each species, not global population estimates.
4. This conservation assessment was
conducted on a continental scale. Certain species may face significant threats to persistence at a local or regional level. Thus, priorities and objectives stated here should complement regional and local priorities, not supercede them.
5. All of these assessments are considered
to be first approximations, and will be revised in future updates of the Shorebird Plan to reflect additional information as available.
6. Use of the term significant does not
necessarily imply a statistical assessment.
Background Information A. Northern North American Shorebird
Diversity: There are 50 shorebird species breeding in the U.S. and Canada; 27 of these species also breed outside of North America to varying degrees.
B. Northern North American Shorebird
Population Estimate: The current northern North American breeding population estimate for all 50 breeding species is approximately 27,800,000 individuals (see section 3).
C. Relative Abundance: the 50
shorebird species have the following distribution of northern North American population estimates:
Species with < 10,000 individuals:
8 Species with < 100,000 individuals:
8 + 12 = 20 Species with < 1,000,000 individuals:
8 + 12 + 24 = 44 Species with > 1,000,000 individuals:
6 Species under 10,000 individuals include: Piping Plover Wandering Tattler Wilson’s Plover Bristle-thighed Curlew Mountain Plover Eskimo Curlew (possibly extinct) American Oystercatcher Black Oystercatcher
Species between 10,000 and 25,000 individuals include:
Snowy Plover Solitary Sandpiper Long-billed Curlew Pacific Golden-Plover Buff-breasted Sandpiper Purple Sandpiper D. Species-Specific Censuses: Only
10/50 (20%) species have had a significant census undertaken--most were censused during winter or migration and counts were not repeated regularly. Piping Plovers are the only species where annual, species-wide censusing takes place (with an in-depth winter and breeding census every five years). Thus, overall, we have very limited information on which to base population estimates.
E. Population Declines: In addition to
market hunting which caused large declines in many shorebird populations at the turn of the century, reviews of current information by species experts suggested that there had been a significant population decline since the 1950's in many shorebird species and subspecies. Appendix 4 includes detailed information about the status of the 73 shorebird taxa (species and subspecies) addressed by the plan. Of these, 28 show evidence of significant decline, and there is insufficient information to estimate the status of 12. Thus, almost half of all North American shorebirds are thought to have suffered a significant post-market hunting decline.
F. Breeding Range Decline: 24% (12/50) of species have undergone a
significant decline in breeding range.
2
46% (23/50) have not undergone a significant breeding range decline.
There was not sufficient information to evaluate 15 species.
Species undergoing a breeding range
decline include the following: Snowy Plover American Oystercatcher Eskimo Curlew Piping Plover Black Oystercatcher Long-billed Curlew Mountain Plover Lesser Yellowlegs Marbled Godwit Wilson’s Plover Upland Sandpiper Red Phalarope ** All but Red Phalaropes, Lesser
Yellowlegs, and Eskimo Curlews breed in the lower 48 states.
G. Threats: In 62% (31/50) of cases,
experts indicated threats to the species persistence were global, rather than just local phenomena. 34% (17/50) of species had local threats to their continued persistence. Experts felt there was not enough information to evaluate the 2 remaining species (Red-necked Phalarope, Bar-tailed Godwit).
Significant threats during breeding were
reported in 54% (27/50) of species. Significant threats during migration were
reported in 72% (36/50) of species. Significant threats during winter were
reported in 80% (40/50) species. H. Need for Population Increases: The
short-term goal of the shorebird plan for species that have declined is to halt declines
and at least maintain current population sizes. In addition, species experts called for a significant population increase in many species (see Appendix 4).
I. Specific Challenges for Species that
Aggregate: Species that aggregate face different threats than species that are widely dispersed. Many kinds of shorebirds have a tendency to aggregate during various phases of the annual cycle, leaving large proportions or all of a species vulnerable to local environmental risks or catastrophic disturbance. Therefore, identifying these species is an important aspect of setting conservation priorities. There were 8 species in which the majority or all of the species occurred at one site during the annual cycle.
These sites and species need particular
attention: American Avocet Semipalmated Sandpiper Bristle-thighed Curle Buff-breasted Sandpiper Surfbird Wilson’s Phalarope Red Knot Red-necked Phalarope During various phases of the annual cycle, 30% (15/50) of species were highly
aggregated during breeding. 72% (36/50) of species were highly
aggregated during migration. 82% (41/50) of species were highly
aggregated during winter. Likewise, the degree of patchiness in a
species distribution can play a role in assessing their vulnerability to local or global threats.
3
62% (31/50) of species were widely distributed throughout their range.
32% (16/50) of species were patchily distributed throughout their range.
6% (3/50) of species had isolated breeding populations: Whimbrel, Hudsonian Godwit, and Marbled Godwit.
J. Conservation Status Listings: The
following species are listed under the Endangered Species Act (U.S. Fish and Wildlife Service) or by the Committee on the Status of Endangered Species in Canada (Canadian Wildlife Service).
Piping Plovers are listed as endangered in the U.S. Great Lakes, threatened elsewhere in the U.S. COSEWIC lists them as endangered throughout Canada.
Snowy Plovers are listed as threatened on
the U.S. Pacific Coast and are under consideration for listing in the Southeast U.S.
Mountain Plovers are endangered in
Canada, and under review as Threatened in the U.S.
Eskimo Curlews are listed as
endangered/extinct by the IUCN, endangered in Canada and in the U.S. They are further protected under CITES.
Long-billed Curlews are listed as
vulnerable in Canada. The Conservation Assessment
Matrix presented in Appendix 1 also lists important conservation factors for each species. These include: whether the population estimate is less than 10,000, or less than 25,000 individuals; whether there has been a decline in the breeding range of the species; whether there has been a significant recent population decline;
whether the species is highly aggregated at some point in the annual cycle; whether the species is highly isolated; and whether the species is listed as threatened or endangered. This information is intended to assist in the development of specific conservation strategies for species and groups of species within regional shorebird groups and by other organizations.
Conclusions 1. The information available is not
adequate to assess with confidence the status of most, if not all, northern North American shorebirds.
2. The limited information that is
available suggests that overall, northern North American breeding shorebird numbers need to increase substantially.
3. Development of adequate
monitoring and research programs should be a high priority of both the U.S. and Canadian shorebird plans so that shorebird status issues can be properly addressed.
CONTRIBUTORS TO SPECIES
ASSESSMENTS Brad Andres, USFWS Keith Arnold, Texas A&M University Peter Bergstrom, U.S. Fish & Wildlife
Service Mark Colwell, Humboldt State University Peter Connors, Univ. of California, Bodega
Marine Lab John Cooper, Manning, Cooper & Assoc. Carol Corbat, Louisiana State Univ.-
Alexandria
4
Hector Douglas, North Carolina State University
Chris Elphick, University of Connecticut Robert Gill, USGS-Alaska Biological
Science Center Leah Gorman, Oregon State Univ.,
USGS-Forest and Rangeland Ecosystem Science Center (FRESC)
Cheri Gratto-Trevor, Canadian Wildlife Service
Susan Haig, USGS-FRESC, Oregon State Univ
Brian Harrington, Manomet Center for Conservation Sciences
Richard Holmes, Dartmouth College Joseph Jehl, Hubbs Sea World Research
Inst., San Diego Oscar Johnson, University of Montana,
Bozeman Fritz Knopf, USGS-Mid-continent Science
Center David Krementz, USGS Arkansas Coop.
Unit David Lank, Simon Fraser University Rick Lanctot, USGS Alaska Biological
Science Center Betsy Mallory, Manomet Center for
Conservation Sciences Brian McCaffery, U.S. Fish & Wildlife
Service R.I.G. Morrison, Canadian Wildlife
Service William Moskoff, Lake Forest College Erica Nol, Trent University Lewis Oring, University of Nevada-Reno Gary Page, Point Reyes Bird Observatory Dennis Paulson, University of Puget
Sound Abby Powell, USGS Arkansas Coop. Unit Margaret Rubega, University of
Connecticut Peter Sanzenbacher, Oregon St. Univ.,
USGS-FRESC Doug Schamel, Simon Fraser University
Susan Skagen, USGS-Mid-Continent Science Center
Lee Tibbitts, USGS-Alaska Biological Science Center
Nils Warnock, Point Reyes Bird Observatory
2) Shorebird Conservation Units: Subspecies and Distinct Populations
Nils Warnock and Chuck Hunter
Conservationists have grappled with the question of what is the minimum group of animals within a species that is worth identifying, dedicating resources towards, and conserving (referred to here as the conservation unit). For many species, conservation efforts at the species level overlook fundamental attributes of groups of organisms nested within species, and this potentially may lead to a loss of genetic diversity and local ecological functions (Meffe and Carroll 1994). The Endangered Species Act of 1973 and its amendments recognize and protect three biological taxa (species, subspecies, and distinct population segments), with distinct population segments as the "lowest" functional group. This recognition of the population as the minimum unit of conservation along with the ambiguous nature of the word “distinct” has generated tremendous exchange within the scientific community as to what constitutes a distinct population segment (Ryder 1986, Waples 1991, Gerber and DeMaster 1999). As an attempt to define what a distinct populations segment is, Ryder (1986) coined the term Evolutionarily Significant Units in recognition of the need to combine natural history and phenotypic
5
information with genotypic information. However, exactly how to identify Evolutionarily Significant Units also remains ambiguous (Moritz 1994, Waples 1995, Pennock and Dimmick 1997).
The U.S. Shorebird Conservation Plan addresses the 50 species of shorebirds recognized as breeding regularly in North America. The United States was split into 12 shorebird planning regions in recognition of the unique roles different regions play for different species of shorebirds. In a similar fashion, the minimum conservation unit for shorebirds in North America must acknowledge the ecological and evolutionary distinctions of this group of birds below the species level. With this in mind, shorebirds with distinct breeding populations in North America were identified, mainly from peer-reviewed, published sources (Appendix 2). For the purpose of the US Shorebird Conservation Plan, species were broken down into populations that largely fit the definition of a subspecies under the modified Biological Species Concept (O'Brien and Mayr 1991):
"Members of a subspecies share a unique geographic range or habitat, a group of phylogenetically concordant phenotypic characters, and a unique natural history relative to other subdivisions of the species."
Subspecies were identified using one or all
of the following three criteria: 1. Phenotypic/Biogeographic Criteria a) Recognized by AOU (1957) as
subspecies b) Not recognized by AOU (1957), but
breeding populations shown to be geographically isolated/disjunct and/or phenotypically distinct within North America.
2. Genetic Differentiation Criteria - populations within North America shown to have distinct genetic differentiation within species.
3. Conservation/Political Criteria - federally listed population and subspecies.
While the terms phenotypically and genotypically distinct are reserved for populations where either phenotypic or genotypic variables were statistically tested and found to be significantly different, determining whether breeding populations are geographically isolated or disjunct has been more ambiguous. This criteria was used only when populations were known to have significant breeding populations (over a few hundred breeding individuals) that are hundreds to thousands of kilometers apart. For this reason, smaller populations of shorebirds of species are not listed under the subspecies/population table, such as Upland Sandpipers or Greater Yellowlegs breeding in Oregon and Washington, even though these small populations are of ecological value to different regions.
3) Population Estimates R.I.G. Morrison, R.E Gill, B.A.
Harrington, S. Skagen, G.W. Page, C.L. Gratto-Trevor and S.M. Haig
Introduction Knowledge of the number of animals in a
population is not only of intrinsic biological interest, but for shorebirds and other waterbirds has also assumed considerable
6
practical application in conservation planning and action. Population estimates have been used, for instance, in assessing the importance of sites and habitats for protection, and for setting targets for recovery of endangered species or for maintenance of populations at desired levels. Two major tools used for conservation of wetlands and waterbird populations in the Western Hemisphere use criteria involving percentages of flyway populations of waterbirds using the site to determine its potential importance; these are the Ramsar Convention on Wetlands of International Importance Especially as Waterfowl Habitat (Ramsar Convention), and the Western Hemisphere Shorebird Reserve Network (WHSRN) (Morrison et al. 1995, Frazier 1996, Rose and Scott 1997, MCCS 1999). For “Ramsar sites”, an area can be identified as a wetland of international importance if it regularly supports 1% of a species or subspecies of waterfowl, and this criterion has been widely used in identifying wetlands for conservation and protection (Frazier 1996, Rose and Scott 1997). For WHSRN, three levels of importance have been recognized for site designation, depending on whether is supports more than 5% (Regional), 15% (International) or 30% (Hemispheric) of a flyway population of shorebirds (Morrison et al. 1995, MCCS 1999). In addition, similar criteria have been adopted by the Important Bird Areas (IBAs) program (IBA 1998). Application of these criteria clearly requires a knowledge of the population sizes of the species being considered.
For endangered species, knowledge of the population size is necessary to assess the status of the species as well as to provide a criterion or target against which the success of management efforts may be measured (e.g., for Piping Plover, Goosen et al. 1997). Target population levels were adopted for
waterfowl to measure the success of conservation initiatives undertaken through the North American Waterfowl Management Plan. The Shorebird Conservation Plans for both Canada and the United States also require knowledge of shorebird population levels, and trends, to assess their success. Knowledge of population size and status is also needed to support a variety of other conservation efforts, including maintaining global diversity under the Convention on Biological Diversity signed by many nations in Rio de Janeiro in 1992, protocols such as the Agreement on the Conservation of African-Eurasian Migratory Waterbirds (AEWA) under the Bonn Convention, and the East Asian Australasian Shorebird Reserve Network (EASRN).
On a practical level, the estimation of population sizes of shorebirds is fraught with many difficulties. Many Nearctic species migrate from breeding grounds in the North American Arctic and sub-Arctic, where they are found dispersed at low densities over vast areas, through migration areas, where they may occur in large but highly variable numbers, to wintering areas, some of which occur in remote areas as far south as Tierra del Fuego at the southern tip of South America (Morrison 1984, Morrison and Ross 1989). Attempting to count or otherwise determine the numbers of birds occurring at any one of these stages brings with it a different set of problems relating to logistics, methodology, adequacy of geographic coverage, accuracy and biases of estimates obtained, and the life history characteristics of the species being studied.
These difficulties apply to assessing shorebird numbers for flyways in most parts of the world, and it is only within the past 20 years that enough information has been obtained to address the question of population sizes in shorebirds. In Europe,
7
many shorebirds using the East Atlantic Flyway winter in or pass through areas near human populations, and a combination of internationally coordinated ground counts by networks of observers in Europe and by expeditions to more remote areas in west Africa enabled estimates of numbers occurring on this flyway to be assembled by Smit and Piersma (1989).
It is only recently that enough information on shorebird numbers has been obtained to attempt to estimate likely population sizes of different species in the Western Hemisphere. While anecdotal accounts of large numbers of shorebirds at various places in their migration ranges have been known for many years (see accounts in Bent 1929), coordinated information over wide geographical areas only started to become available after the mid 1970s, when observer networks were set up in Canada and the United States to count shorebirds during migration periods (Morrison 1984). Initial efforts were mainly in eastern Canada and the USA, and data from these programs (the Maritimes Shorebird Survey and International Shorebird Survey, respectively) have been used to identify potential Western Hemisphere Shorebird Reserve Network sites in Canada (Morrison et al. 1995) and the United States (Harrington and Perry 1995), as well as to assess shorebird population trends (Howe et al. 1989, Morrison et al. 1994). Extensive compilations of data are now also available from the interior of the United States and Canada (the Central Flyway, Skagen et al. 1998) as well as for western and Pacific areas of the United States and Canada (the Pacific Flyway, Page et al. 1992, Page and Gill 1994), including Alaska (Gill et al. 1999, R.E. Gill, unpubl.). Aerial surveys have been used to cover large and/or remote areas, for instance James Bay and Hudson Bay (Morrison and Harrington 1979) and
Delaware Bay (Clark et al. 1993); they have been especially useful on the wintering grounds, where “Atlas” projects have covered large geographical areas, including South America (Morrison and Ross 1989), Panama (Morrison et al. 1998) and Mexico (Morrison et al. 1992, 1993, 1994).
Page and Gill (1994) reviewed information on shorebird populations in western North America, and some preliminary estimates for numbers occurring in Canada were presented by Morrison et al. (1994), though these in many cases represented a best “guesstimate” or an assignment to the most likely order of magnitude. This report attempts to bring together as much information as possible from breeding, migration and wintering areas to provide an update on our current knowledge of the size of Western Hemisphere shorebird populations; this has led to considerable modification of the estimates for many species. This report covers the species of shorebirds occurring in North America, including Hawaii, and includes excerpts from the full report prepared by Morrison et al. (ms.), which should be consulted for details regarding the population estimates for each species.
Methods The data used in assembling population
estimates have been taken mostly from major regional compilations, with some additions from other published and unpublished material, as described below and in the species accounts. Material from publications on individual sites within the major regions has also been examined, and used to adjust totals from regional compilations where appropriate, though this literature review has not been exhaustive. Principal data sources are as follows.
8
1. Canada. Data from the Maritimes Shorebird
Surveys (MSS), which cover the Atlantic Provinces of Canada (NS, NB, PE, NF), were analyzed to extract the maximum count of each species at each site covered during fall and spring surveys for the years 1974-1991. Maximum counts were summed to produce a regional total for each species. Data compiled in Morrison et al. (1995) to document potential Western Hemisphere Shorebird Reserve Network (WHSRN) sites in Canada, were used for other parts of Canada. Additional information came from aerial and ground surveys carried out by the Canadian Wildlife Service in James Bay and Hudson Bay and along the St. Lawrence River estuary (Morrison and Harrington 1979, Brousseau 1981, Maisonneuve 1982, Maisonneuve et al. 1990).
2. United States. Data from the International Shorebird
Survey (ISS) for the years 1971-1998 were analyzed in a manner similar to the MSS data to produce totals for Pacific (UT, NV, AZ, CA, ID, WA, OR), central (MN, IA, MO, ND, SD, NB, KS, MT, WY, CO, OK, AR, TX, LA, NM ) and eastern (ME, NH, VT, MA, RI, CT, NY, PA, NJ, MD, DE, MI, OH, WV, VA, NC, SC, WI, IL, IN, KY, TN, MS, AL, GA, FL) regions of the USA for both spring and fall migration periods. In addition, maximum count totals were extracted for the same regions from data compiled by Harrington and Perry (1985) to document potential Western Hemisphere Shorebird Reserve Network (WHSRN) sites in the USA. Regional compilations of data produced by Harrington and Page (1992), covering areas in the three above regions, including sites in Canada, were also consulted. Clark et al. (1993) provide multi-year aerial survey data from Delaware Bay.
For the central flyway, the major compilation of data by Skagen et al. (1998),
covering sites in the central USA and Canada, provided the most extensive summary of counts from this region currently available.
For the Pacific Flyway, Page et al. (1992) provided a summary of counts from the west coast and western interior wetlands, including the USA, Baja California and parts of Canada. Page and Gill (1994) reviewed population estimates for some species occurring in western North America. For the present analysis, updated population estimates have been compiled (Page, unpubl. data) for “western North America” (and see Page et al. 1999), comprising the ISS “Pacific” states plus NM and including Baja California: in some cases, counts by Skagen et al. (1998) included counts from these states - these counts were subtracted from “central flyway” totals where overlap occurred to eliminate duplication. Where totals for wintering populations in “western North America” were used, counts in Mexico (see below) were adjusted so there would not be duplication of Baja California counts.
3. Canadian Arctic. Although estimates of breeding shorebird
densities have been made for a fairly large number of sites in the Arctic, estimates of populations occurring over wider geographical regions are less common. The current arctic estimates have been derived from early exploratory avifaunal surveys, environmental impact assessment surveys, or, more recently, extrapolations based on remote sensing studies: this material has been reviewed in Morrison (1997).
4. Alaska. Data were compiled from information on
potential WHSRN sites in Alaska (Gill et al. 1999), as well as other literature sources (e.g., Islieb 1979, Gill and Handel 1990) mentioned in the species accounts.
5. Mexico.
9
Data from the Canadian Wildlife Service “Atlas” project provided information on wintering numbers of shorebirds on both coasts of Mexico (Morrison et al. 1992, 1993, 1994). Several other studies have provided comparative data, especially from the Pacific northwest and Baja California regions of Mexico (Harrington 1993a, b, 1994, Page and Palacios 1993, Page et al. 1997, Engilis et al. 1998).
6. Central America and the Caribbean. Apart from Panama, where CWS “Atlas”
and other aerial surveys (Morrison et al. 1998, Watts et al. 1998) have provided information on key migration and wintering areas, few quantitative data are available, though wetland inventories of the area have been carried out (Scott and Carbonell 1986).
7. South America. CWS “Atlas” surveys of wintering
populations provide extensive coverage of key coastal sites in South America (Morrison and Ross 1989), while additional material is provided for interior and coastal areas in the extensive wetland inventory conducted by Scott and Carbonell (1986) and in a summary updating distributional information by Blanco and Canevari (1998).
8. Population estimates using Breeding Bird Survey (BBS) data.
Although the most common use of BBS data is in assessing population trends, it is theoretically possible to make an estimate of breeding population numbers from BBS data for those shorebird species whose ranges occur in areas covered by the BBS. BBS routes involve coverage of a known area (each route consists of 50 stops, each stop covering a non-overlapping area of radius 0.25 miles) in a known landscape type, or physiographic stratum. The mean density of the species in each physiographic stratum may be derived from the routes occurring in that stratum, and a population estimate for
the stratum obtained based on the total area of the stratum. Summing the numbers occurring in all the strata produces an overall population estimate. There are many potential sources of bias and error using this approach, however, and it is probably useful for only a few, if any, shorebird species. Population estimates for shorebird species covered by the BBS have been included in the text for comparative purposes, but are not generally used where they are clearly divergent from estimates obtained by other methods.
Data compilation The procedure used in assembling the
numbers presented in the species accounts below is as follows. First, data were tabulated separately for each species and for each of the following “seasons”: breeding, northward migration, southward migration, and wintering. Data were then compiled for major regions (e.g., Mexico, Pacific flyway, central flyway, eastern flyway (USA and Canada), Alaska, etc.) and maximum count totals extracted for each species for that region. Data from publications on specific sites within a region were in some cases compared with the totals for that site in regional summary publications, and substituted for that site if larger, though this type of comparison has not been exhaustive. Counts for Alaska were in some cases considered separately, where it was judged that birds counted at migration sites in Alaska would also have been counted in another geographical region within the same season - in such cases the larger regional total was used in assessing overall population size. Overall totals were then produced for all regions for a given season, and the largest seasonal total was taken to indicate at least a minimum likely population for that species. How these seasonal totals are used to assess
10
an estimated overall population size is discussed in each species account.
In general, we have attempted to be conservative in our assessment of population sizes. Where counts derived from observable numbers of birds differ considerably from those obtained using extrapolations, we have usually adopted the smaller estimate, particularly in cases where the species may be considered “at risk” and where the extrapolation was obtained from Breeding Bird Survey data. More quantitative approaches from arctic breeding areas, where extrapolations have been based on surveys and associated remote sensing data that provide an estimate of areas of suitable habitat, may provide useful perspectives on population numbers, and are discussed in the species accounts as appropriate.
Use of maximum counts Maximum counts were chosen as the most
practicable number for use in estimating overall populations. The maximum count does provide at least a minimum estimate of the number of birds occurring in an area: total numbers will clearly be larger, since there is considerable turnover (which varies in different geographical regions) as birds move through a site, and often adults and juveniles move through a site at different times during southward migration. On the other hand, maximum counts may be unrepresentative, for instance in cases where an exceptionally large number of birds may be found in a site for a brief period following unusual weather events (Morrison et al. 1994). Movement of birds between sites gives rise to the possibility that they may be counted multiple times. This source of error is most likely to arise during migration periods, since most populations are thought to be relatively stable or sedentary during breeding and wintering seasons. It is also difficult to assess, since it is likely to vary
with the species being counted and the region being considered. For instance, Western Sandpipers are liable to use a number of Pacific coast stopover areas during northward migration in a manner dependent on weather conditions (Iverson et al. 1995, Warnock and Bishop 1998), whereas in other areas studies have shown that some species are highly site-faithful from year to year and probably do not move a great deal on a regional scale within a single season.
It is also unlikely that all sites used by shorebirds will be covered during survey operations. Where aerial surveys have been used to determine shorebird numbers over large areas, as in the CWS “Atlas” projects (see above), flights will provide only a single “snapshot” of the birds present, and numbers are usually underestimated for a variety of reasons including counting errors, weather and tidal conditions (in coastal areas), and areas not covered during the flights. Overall, these considerations indicate that nearly all estimates of numbers derived from either ground or aerial counts are likely to be underestimates.
Seasonal considerations In addition to the phenological
considerations mentioned above, there are a number of other factors relating to shorebird biology that are liable to influence counts obtained during different periods of the year. Estimates based on numbers of nesting pairs on the breeding grounds clearly do not include non-breeding segments of the population, including sub-adult and other birds that may spend the summer south of the breeding grounds, and birds that have reached the breeding areas but do not nest. During the southward migration, numbers are likely to be at their highest, since both adults and juveniles hatched that summer will be present, resulting in a population that
11
could be perhaps double that at the beginning of the nesting season. Mortality during the fall migration and subsequent winter will lead to lower numbers during the following northward migration. These considerations may not necessarily be reflected in counts obtained in the field, for instance in cases where a species may be highly concentrated during spring migration and relatively easily counted compared to being more highly dispersed in space and time during the fall migration so that counts are lower. These points serve to emphasize the difficulties faced in assessing population numbers at different times of the year.
Assessing the accuracy of population
estimates The accuracies of estimates obtained for
different species are likely to vary considerably, since the methods used range from dedicated counts directed at a particular species (e.g., Piping Plover), to cases where almost no information is available and the estimate is essentially an educated guess. We have attempted to rate the accuracy of the estimate for each species to give some indication of the reliability of the number presented. In almost no cases were data available to present a statistically based estimate of the standard deviation or error of the estimate, and the ranges shown are intended to illustrate the likely range of uncertainty. Accuracy scores were assigned as follows.
1 (Poor): A population estimate based on an educated guess. Score 1 also given to ESCU (for species codes see Table 1) which has not been reliably seen in recent years. 2 (Low): A population estimate based on broad-scale surveys where estimated population size is likely to be in right order of magnitude. 3 (Moderate): A population estimate based on a special survey or on broad-scale surveys of a narrowly distributed
species whose populations tend to concentrate to a high degree either a) in a restricted habitat, or b) at a small number of favored sites. Estimate thought to be within 50% of the true number. 4 (Good): A calculated estimate based on broad-scale mark:recapture ratios or other systematic estimating effort resulting in estimates on which confidence limits can be placed. 5 (High): Number obtained from a dedicated census effort and thought to be accurate and precise. Sometimes an indication of the probable percentage accuracy is given, or at least a minimum population figure derived from the data.
Data presentation Data for all species are summarized in
Appendix 3. Estimates are given for the Global population, if available, taken mainly from Rose and Scott (1997) and adjusted if necessary because of revisions made to Western Hemisphere population estimates. Estimates cover North American populations, including Canada, the United States (including Alaska and Hawaii) and Mexico. The numbers represent individuals (all ages). Numbers for a given region include birds if they are likely to occur in the region at any stage of their life cycle. These numbers are all the most likely population estimate based on combinations of the data currently available, and should be considered tentative estimates that will be revised as better information becomes available.
4) Population Targets
12
Rationale for setting shorebird population targets
The vision of the U. S. Shorebird
Conservation Plan is to ensure that stable and self-sustaining populations of all shorebirds are distributed throughout their range and habitats in the U.S. and across the Western Hemisphere, and that species which have declined in distribution or abundance be restored to their former status to the extent possible at costs acceptable to society. Making this vision a reality will require halting the declines of many shorebird species, and increasing the populations of many species to the point where they are stable and self-sustaining.
The rationale for setting specific population targets is to provide an objective measure of when the overall vision of the plan has been achieved. Achieving the vision will require an understanding of how populations have changed in the past as well as estimates of approximate population levels today. However, this information is known with certainty for only a few of the shorebirds that occur in the United States. Other parts of the shorebird plan lay out procedures for monitoring shorebirds sufficiently to provide information on their population trend, and research priorities necessary to determine the factors limiting populations of shorebirds. This information will make the process of setting population targets much more precise and scientifically sound. Nevertheless, there is a current need to set approximate population goals for shorebirds to guide the early stages of implementation of the plan. The population targets provided here are only a first approximation attempt to provide these goals. Establishing verified population targets sufficient to achieve the vision of protecting shorebirds in the United States
will require sufficient funding for the monitoring and research needs outlined here, and will result in modified targets that will be revised as more detailed information becomes available.
Many of the shorebird species that occur in the United States have defined subspecies, i.e. groups which have been geographically isolated so long that they are distinct. Other geographically isolated groups exist that have not been recognized as subspecies, yet are in all likelihood genetically distinct, and possess unique characteristics that should be preserved. In some cases one subspecies within a species may be declining or facing specific threats where another is not. Because of these and other complexities, the process of setting population targets was applied to all groups of shorebirds recognized as being geographically distinct.
Much of the information on which the population targets were based was collected during the development of the conservation assessment presented in Section 1, with additional work by the participants on the Research and Monitoring working group.
Protocols for setting population targets
For most shorebird species, it is impossible
to establish scientifically supported population targets that are known to meet the goal of achieving stable and self-sustaining populations. This is because current and past population sizes are unknown, and because insufficient information about conservation risks and factors limiting populations exists. Because information is lacking but the need for conservation action is clear, the working group established a simple approach to setting population targets based on the
13
limited information available. This is not a scientific process, but a series of policy recommendations based on the simple set of assumptions and rationale outlined below.
Population targets are established based on the estimated population size, and the current estimate of the status of the species as having experienced recent population declines or not. In each case, both short term and long term goals are established.
1) Species known to be declining Population Trend = 5. The species or
population has been documented to be in decline, or is listed as threatened or endangered under the United States Endangered Species Act. Conservation actions aimed at increasing the populations of species should be prioritized according to the species priority, with restoration of the highest priority species addressed first.
Population goals. Listed Species: In the case of endangered
or threatened species, the short term goal is to achieve the level of recovery recommended in the species recovery plan prepared under the Act. Long term goals are not provided for these species because planning and management under the Act should be sufficient to support their long-term persistence as viable populations.
Short Term Goal: For remaining category
5 species the recommended short term goal is to halt the population decline.
Long Term Goal: The long term goal is to restore the population to the level that probably existed in the year when population trend analysis began (for most species in the early 1970’s). This level was calculated by using the known rate of decline, and back calculating the population size to the year
when data were first collected, using the current population estimate as the starting point. For example, Black-bellied Plovers have a current population estimate of 150,000, with a 45% decline. The long term target is to restore the population to 272,000, the level that would have existed before the decline took place (272,000 – 45% = 150,000). For many species, these restoration targets are extremely conservative because historical declines are thought to have been large, but monitoring data are available only recently.
2) Species thought to be declining Population Trend = 4. The species is
thought by experts to have substantially declined, but lack of useful data has prevented statistical verification.
Population goals. Short-term goal: The short-term goal for
these species is to determine with certainty if declines are actually occurring, and to halt any declines that are occurring.
Long-term goal: The long-term target recommended for these species is restoration of the populations to the level likely held in the early 1970’s, established by estimating the percentage of habitat loss the species has endured, and to increase from the currently estimated population size by a commensurate amount.
3) Species with no decline suspected, or
known to be stable These species have population trend scores
of 3, 2, or 1. Population Trend = 3. There is no
information on population change, or insufficient information to assess past declines, but the species is thought to face future risks such as habitat loss.
Population goals. Maintain population at current levels, with special attention to any
14
declines that result from risks, or future information which indicates that the population status was actually declining when thought to be stable.
Population Trend = 2. The species
population is not declining, and is thought to be at historic levels. No population decline is expected, and the population is thought to be stable and self sustaining.
Population goals. Maintain population at current levels.
Population Trend = 1. The species’
population size may be increasing above historic (i.e. pre-1800) levels .
The conservation assessment indicated that no shorebird species are in this category.
The specific population targets established
for each species and population of shorebirds are shown in Appendix 4.
5) Shorebird Species Conservation Priorities
National Shorebird Conservation Priorities
This system for prioritizing shorebird
species of concern was developed as part of the U.S. Shorebird Conservation Plan with input from many individuals participating in the Research and Monitoring working group, including representatives from across the country and from Canada. The goal of the system is to provide a clearly organized method for categorizing the various risk factors that affect the conservation status of each species in a format that can be easily updated as additional information becomes available. The system was designed in
collaboration with Partners In Flight to ensure that it was as compatible as possible with existing approaches to bird species prioritization (Carter et al. 2000), while reflecting the unique conservation risks for shorebirds. Modifications suggested by Beissinger et al. (2000), including the use of categories for species priorities, were incorporated.
Even though there is widespread agreement that the variables used in this system affect the conservation status of bird species, they are difficult to estimate. Nevertheless, prioritization is important to ensure that species more at risk are given the attention needed to avoid significant declines. Because appropriate data is often lacking, the classifications produced by this system are considered estimates of the actual conservation status of each species. Further study is needed for most species with respect to most of these variables. The classifications presented here will be revised at regular intervals as appropriate, and should not be considered final. Current national priority scores for each species and subspecies are presented in Appendix 5.
Variables for National Priorities 1) Population Trend, PT, and Population
Trend Uncertainty PTU The population trend variable uses
existing information on shorebird trends to estimate broad categories of population decline. Species with known declines in populations are likely to be at higher risk than species where ongoing study has detected no risk. However, many species may be declining even though trends have not been detected using current monitoring techniques. This is particularly true for species under-represented in ongoing monitoring programs. Only species with
15
documented significant population declines (p<0.10) are included in category 5.
PT 5 Significant population decline
(p<0.10) 4 Apparent population decline 3 Apparently stable population or
status unknown* 2 Apparent population increase 1 Significant population increase *Note: If the population trend cannot be
classified at all due to the lack of appropriate data, the PT score is represented as "U" for Unknown.
Population Trend Uncertainty rates the
relative level of uncertainty associated with the estimate of population. We rate uncertainty scores on a scale of 1-5. These scores emphasize the need for additional monitoring, and uncertainties associated with decisions based on reported trends, but do not enter into the categorization process for determining conservation priorities. High uncertainty about the trend estimate results in a high score. For the purposes of determining how representative available data are for the entire species, the data are classified into one of two categories: 1) comprehensiveness high = data estimated to represent more than half of the species range and/or half of the estimated population; or 2) comprehensiveness low = data represent less than half of both. Scores for these uncertainty estimates are being developed.
PTU 5 No information about population
trend 4 Significance test has medium or low
power (<0.8) and comprehensiveness is low; or, no data but informed estimates about population trend possible
3 Significance test has medium or low power (<0.8), and comprehensiveness is high
2 Significance test has high power (>0.8), but comprehensiveness is low
1 Significance test has high power (>0.8), and comprehensiveness is high
2) Relative Abundance This variable uses population size estimates
to classify each species into 5 categories based on breaks in the distribution of population sizes among shorebirds. Species with smaller absolute population sizes are likely to be more at risk, either as a result of historic declines or from catastrophic disturbances. Population estimates were developed by Morrison et al. (ms.). For some species the population estimates may be low due to lower counts resulting from higher dispersion. For these species, the estimates may be inaccurate. However, most of these species are near the midpoints of their categories, so this factor may not result in misclassification. With increasing data about current population sizes, these estimates will be revised.
RA 5 <25,000 4 25,000 - <150,000 3 150,000 - <300,000 2 300,000 - <1,000,000 1 ≥1,000,000 3) Threats During Breeding Season, TB This variable ranks the threats known to
exist for each species, and the categories reflect the limited knowledge available for determining threats to most shorebirds. Species are scored as follows:
16
5 Known threats are actually occurring (i.e. significant loss of critical habitat), and can be documented.
4 Significant potential threats exist (i.e. oil spills) but have not actually occurred
3 No known threats, or information not available
2 Threats assumed to be low 1 Demonstrably secure 4) Threats During Non-breeding Season, TN This score uses the same criteria listed
above for TB scores, with the additional factor of concentration risk explicitly considered as follows:
5 Known threats are actually occurring
(i.e. significant loss of critical habitat), and can be documented. Concentration results in actual risk.
4 Significant potential threats exist (i.e. oil spills) but have not actually occurred. Concentration results in high potential risk.
3 No known threats, or concentration not a risk, or information not available
2 Threats assumed to be low from all factors including concentration
1 Demonstrably secure 5) Breeding Distribution, BD This variable ranks the size of the breeding
range for species that breed in North America, and only applies during the actual breeding season. The assumption is that species with relatively more restricted ranges are more susceptible to breeding failure from natural or human-induced causes. Threats that occur during migration to or from the breeding grounds are addressed in ND below.
BD
5 <2.5% of North America (212,880 sq. mi., or 551,493 km2)
4 2.5-4.9% of North America 3 5-9.9% of North America 2 10-20% of North America 1 >20% of North America (1,703,008
sq. mi., or 4,411,940 km2) 6) Non-breeding Distribution, ND This variable refers to distribution during
the non-breeding season, which includes migration to and from the breeding grounds. Threats resulting from concentration at some point during migration are addressed in TN above. This variable rates the relative risks associated with having a smaller absolute range size during the non-breeding season. Because different risk factors occur during the non-breeding season, the absolute sizes of these categories are different from those for BD. In addition, the added variable of length of coastline is used for coastal species where measuring area is not as representative of distribution.
ND 5 Highly restricted ≤ 50,000 sq. mi., or
very restricted coastal areas, or interior uplands,
4 Local = 50,000 - 200,000 sq. mi., or ≤ 1,000 mi. of coast
3 Intermediate = 200,000 - 2,000,000 sq. mi., or along 1,000 - 3,000 mi. of coast
2 Widespread = 2,000,000 - 4,000,000 sq. mi., or along 3,000 - 5,000 mi. of coast
1 Very widespread = 4,000,000 - 7,000,000 sq. mi., or along 5,000 - 9,000 mi. of coast
Criteria for National Priorities
17
The following categories are modified from those proposed in Beissinger et al. (ms.), developed by the AOU committee established to review the PIF prioritization system. The primary change is to move species with high PT scores and some other high score into the highest category. In addition,
Priority Categories: 5) Highly Imperiled All species listed as threatened or
endangered nationally, plus all species with significant population declines and either low populations or some other high risk factor.
a. PT=5 and RA, BD, TB, or TN=5
4) Species of High concern Populations of these species are
known or thought to be declining, and have some other known or potential threat as well:
a. PT = 4 or 5 and either RA, BD, TB, or TN = 4 or 5
b. RA = 4 or 5 and either TB or TN = 4 or 5
For regional lists only: c. AI = 5 and RA >3 3) Species of Moderate concern Populations of these species are
either a) declining with moderate threats or distributions; b) stable with known or potential threats and moderate to restricted distributions; c) and d) relatively small and restricted; or e) declining but with no other known threats.
a. PT = 4 or 5 and RA, BD, ND, TN, or TB = 3
b. PT = 3 and RA, BD, ND, TN, or TB = 4 or 5
c. RA = 3 and BD or ND = 4, or 5
d. RA = 4 and BD and ND <4 e. PT=5 and RA, BD, ND, TN, or TB >
1 For regional lists only f. AI=4 and RA>3 2) Species of Low Concern Populations of these species are either a)
stable with moderate threats and distributions; b) increasing but with known or potential threats and moderate to restricted distributions; or c) of moderate size.
a. PT = 3 and RA, BD, ND, TN, or TB=3
b. PT = 2 and RA, BD, ND, TN, or TB=4 or 5
c. RA = 3 For regional lists only: d. AI = 3 1) Species Not at Risk All other species
Regional Shorebird Conservation Priorities
Variables for Regional Priorities A matrix showing species life history
stages, and the relative importance of each Planning Region compared to other Regions, is provided in Appendix 6. Considering area importance at the regional scale ensures that conservation effort will not be misdirected toward species that are rare in a particular region only because it is close to the edge of their range. In addition to this matrix, the regional shorebird groups have participated in the development of a finer scale matrix showing the relative importance to each shorebird species of each Bird Conservation Region (Appendix 7), which are the smaller areas within Planning Regions (i.e. the
18
Mississippi Alluvial Valley BCR and the Gulf Coast BCR are both within the Lower Miss./Western Gulf Coast Planning Region). Regional priorities have been calculated by the regional groups, and are presented in their individual regional reports. The matrix of area importance within each BCR can be used for finer scale planning and prioritization needs within BCR’s.
1) Area Importance, AI Area importance scores are based on
knowledge of distributions, expert opinion, and data on distributions for species where it is available. Species are ranked on a relative scale within each BCR.
Because management decisions based on
species priorities must often be conducted at appropriate seasons, the scores for these variables are reported using a system that reflects both the relative area importance and the season or seasons during which the area is important, including breeding, wintering, and migration (spring and fall). This system is used at two scales, for describing the importance of both the Shorebird Planning Regions and also the smaller Bird Conservation Regions included in each Planning Region.
For each score, a description is provided of
the frequency of occurrence within BCR or Planning Region, including relative abundance, importance relative to other regions, and importance of management and protection activities.
Score Symbol 5 B, W, M High concentrations known to occur.
Area of high importance to the species relative to the majority of other regions.
The area is critical for supporting hemispheric populations of the species.
4 B, W, M Common or locally abundant, with large
numbers occurring or suspected to occur. Area of known or suspected importance relative to other regions, especially within the same flyway. The area is important to supporting hemispheric or regional populations.
3 b, w, m Uncommon to fairly common. Area is
within the primary range of the species, and it occurs regularly, but the species is present in low relative abundance.
2 * Rare occurrences. Area is within the
expected range of the species, but it occurs at a low frequency. (In general, management for these species is not warranted within the region.)
1 Blank Does not occur in the area, or only
unpredictable, irregular occurrence as a vagrant. Area is outside of expected range.
Criteria for Regional Priorities The regional prioritization system uses the
same criteria as for national priorities, with the additional rule that species can be assigned to a different category based on their area importance within the region. In addition, regions may remove species from their lists if the regional area importance score is less than 3 to ensure that conservation priority is given to species with significant populations within the region. For simplicity, the criteria are listed above with the national criteria lists, under the regional headings for categories 2, 3, and 4.
19

Species in the highest conservation category are high priority wherever they occur. Each region determined whether to leave species with AI scores less than 3 off their regional priority lists to concentrate conservation effort on the species with higher area importance.
20
21
APPENDICES
Appendix 1: Conservation Assessment Matrix Species Census Census Census Census Confi- Local/ Conserv. SpeciesSpecies Latin name Censused Accuracy Orig. Error Error Class dence Global Codes Aggr. Black-bellied Plover Pluvialis squatarola 0 X M X Low 2 L 0 American Golden-Plover Pluvialis dominica 0 X M X Low 2 G T 0 Pacific Golden-Plover Pluvialis fulva 0 X M X Low 2-3 L 0 Snowy Plover Charadrius alexandrinus 0 0 C/G 50% Good 5 L P2RDL 0 Wilson's Plover Charadrius wilsonia 0 X G 25% Low 3 G P1RDT 0 Semipalmated Plover Charadrius semipalmatus 0 X G 50% Low 2 L D 0 Piping Plover Charadrius melodus 1 1 C 5% High 5 G P1RDLT 0 Killdeer Charadrius vociferus 0 X M 50-100% Poor 1 G DT 0 Mountain Plover Charadrius montanus 1 1 C 25% Good 4 L P1RDLT 0 American Oystercatcher Haematopus palliatus 0 1 M X Moderate 3 G P1RDT 0 Black Oystercatcher Haematopus bachmani 0 0 M 50% Moderate 3 L P1RD 0 Black-necked Stilt Himantopus himantopus 0 X M X Poor 2 G T 0 American Avocet Recurvirostra americana 0 X G 25% Moderate 3 G DAT 1 Greater Yellowlegs Tringa melanoleuca 0 X M 50% Low 2 L 0 Lesser Yellowlegs Tringa flavipes 0 X M 25% Low 2 L R 0 Solitary Sandpiper Tringa ochropus 0 X M 100% Poor 1 G P2T 0 Willet Catoptrophorus semipalmatus 0 X M X Low 2 L D 0 Wandering Tattler Heteroscelus incanus 0 X M 50% Moderate 3 G P1T 0 Spotted Sandpiper Actitis macularia 0 X M 100% Poor 1 L 0 Upland Sandpiper Bartramia longicauda 0 X M X Low 2 L P2RDL 0 Eskimo Curlew Numenius borealis 0 X M X Poor 1 G P1RDLT 0 Whimbrel Numenius phaeopus 1 X M X Moderate 3 G IT 0 Bristle-thighed Curlew Numenius tahitiensis 1 1 C X Good 4 G P1AT 1 Long-billed Curlew Numenius americanus 0 X M X Moderate 3 L P2RL 0 Hudsonian Godwit Limosa haemastica 0 2 M 10% Good 3 G DIT 1 Bar-tailed Godwit Limosa lapponica 1 1 M X Moderate 3 X X Marbled Godwit Limosa fedoa 0 2 C 50% Good 3 G RDIT 1
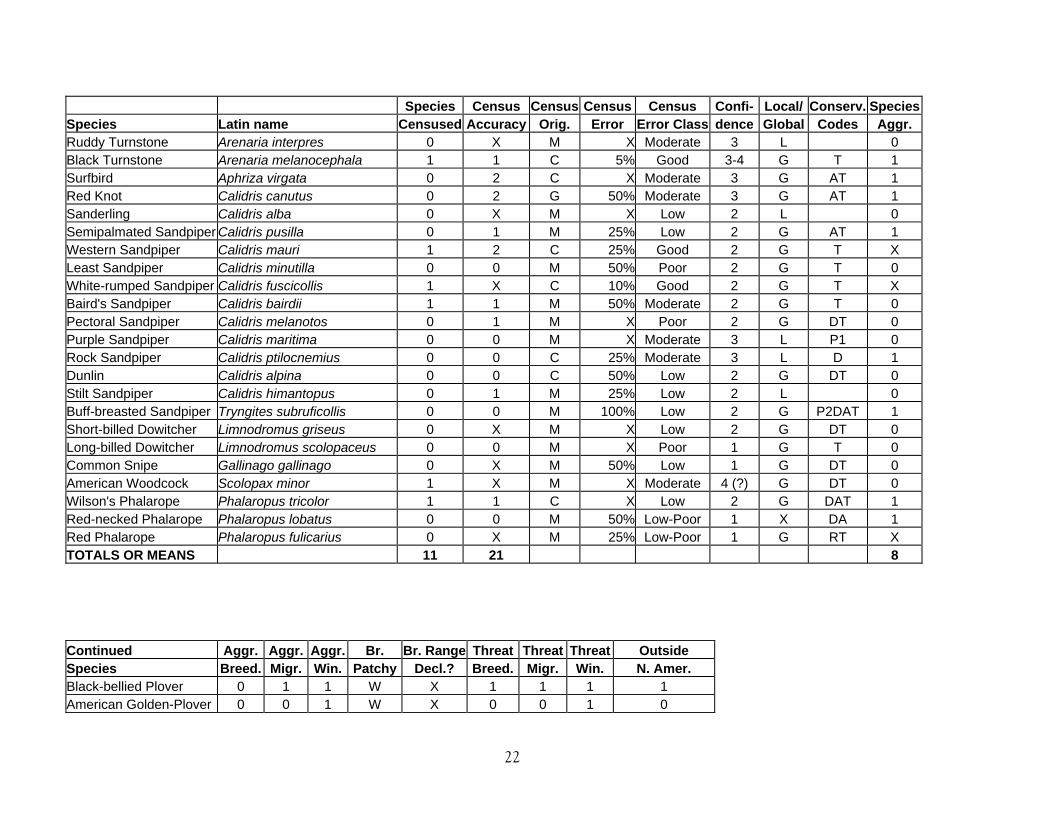
Species Census Census Census Census Confi- Local/ Conserv. SpeciesSpecies Latin name Censused Accuracy Orig. Error Error Class dence Global Codes Aggr. Ruddy Turnstone Arenaria interpres 0 X M X Moderate 3 L 0 Black Turnstone Arenaria melanocephala 1 1 C 5% Good 3-4 G T 1 Surfbird Aphriza virgata 0 2 C X Moderate 3 G AT 1 Red Knot Calidris canutus 0 2 G 50% Moderate 3 G AT 1 Sanderling Calidris alba 0 X M X Low 2 L 0 Semipalmated Sandpiper Calidris pusilla 0 1 M 25% Low 2 G AT 1 Western Sandpiper Calidris mauri 1 2 C 25% Good 2 G T X Least Sandpiper Calidris minutilla 0 0 M 50% Poor 2 G T 0 White-rumped Sandpiper Calidris fuscicollis 1 X C 10% Good 2 G T X Baird's Sandpiper Calidris bairdii 1 1 M 50% Moderate 2 G T 0 Pectoral Sandpiper Calidris melanotos 0 1 M X Poor 2 G DT 0 Purple Sandpiper Calidris maritima 0 0 M X Moderate 3 L P1 0 Rock Sandpiper Calidris ptilocnemius 0 0 C 25% Moderate 3 L D 1 Dunlin Calidris alpina 0 0 C 50% Low 2 G DT 0 Stilt Sandpiper Calidris himantopus 0 1 M 25% Low 2 L 0 Buff-breasted Sandpiper Tryngites subruficollis 0 0 M 100% Low 2 G P2DAT 1 Short-billed Dowitcher Limnodromus griseus 0 X M X Low 2 G DT 0 Long-billed Dowitcher Limnodromus scolopaceus 0 0 M X Poor 1 G T 0 Common Snipe Gallinago gallinago 0 X M 50% Low 1 G DT 0 American Woodcock Scolopax minor 1 X M X Moderate 4 (?) G DT 0 Wilson's Phalarope Phalaropus tricolor 1 1 C X Low 2 G DAT 1 Red-necked Phalarope Phalaropus lobatus 0 0 M 50% Low-Poor 1 X DA 1 Red Phalarope Phalaropus fulicarius 0 X M 25% Low-Poor 1 G RT X TOTALS OR MEANS 11 21 8 Continued Aggr. Aggr. Aggr. Br. Br. Range Threat Threat Threat Outside Species Breed. Migr. Win. Patchy Decl.? Breed. Migr. Win. N. Amer. Black-bellied Plover 0 1 1 W X 1 1 1 1 American Golden-Plover 0 0 1 W X 0 0 1 0
22
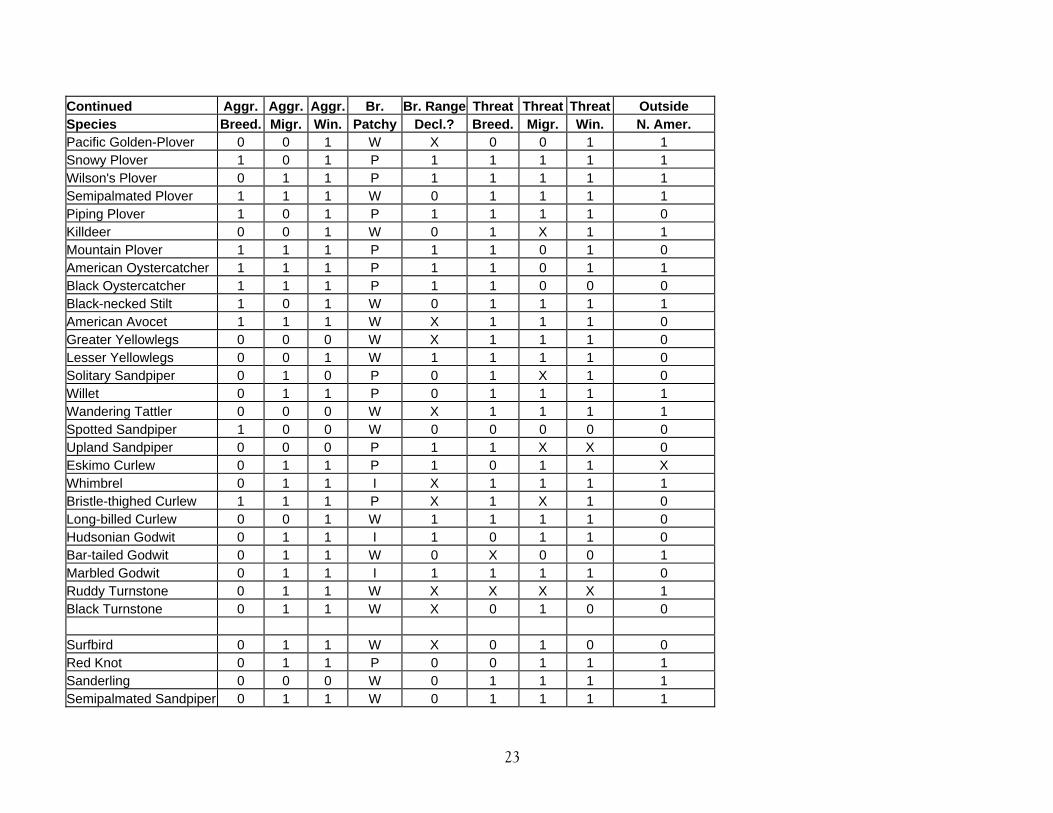
Continued Aggr. Aggr. Aggr. Br. Br. Range Threat Threat Threat Outside Species Breed. Migr. Win. Patchy Decl.? Breed. Migr. Win. N. Amer. Pacific Golden-Plover 0 0 1 W X 0 0 1 1 Snowy Plover 1 0 1 P 1 1 1 1 1 Wilson's Plover 0 1 1 P 1 1 1 1 1 Semipalmated Plover 1 1 1 W 0 1 1 1 1 Piping Plover 1 0 1 P 1 1 1 1 0 Killdeer 0 0 1 W 0 1 X 1 1 Mountain Plover 1 1 1 P 1 1 0 1 0 American Oystercatcher 1 1 1 P 1 1 0 1 1 Black Oystercatcher 1 1 1 P 1 1 0 0 0 Black-necked Stilt 1 0 1 W 0 1 1 1 1 American Avocet 1 1 1 W X 1 1 1 0 Greater Yellowlegs 0 0 0 W X 1 1 1 0 Lesser Yellowlegs 0 0 1 W 1 1 1 1 0 Solitary Sandpiper 0 1 0 P 0 1 X 1 0 Willet 0 1 1 P 0 1 1 1 1 Wandering Tattler 0 0 0 W X 1 1 1 1 Spotted Sandpiper 1 0 0 W 0 0 0 0 0 Upland Sandpiper 0 0 0 P 1 1 X X 0 Eskimo Curlew 0 1 1 P 1 0 1 1 X Whimbrel 0 1 1 I X 1 1 1 1 Bristle-thighed Curlew 1 1 1 P X 1 X 1 0 Long-billed Curlew 0 0 1 W 1 1 1 1 0 Hudsonian Godwit 0 1 1 I 1 0 1 1 0 Bar-tailed Godwit 0 1 1 W 0 X 0 0 1 Marbled Godwit 0 1 1 I 1 1 1 1 0 Ruddy Turnstone 0 1 1 W X X X X 1 Black Turnstone 0 1 1 W X 0 1 0 0 Surfbird 0 1 1 W X 0 1 0 0 Red Knot 0 1 1 P 0 0 1 1 1 Sanderling 0 0 0 W 0 1 1 1 1 Semipalmated Sandpiper 0 1 1 W 0 1 1 1 1
23
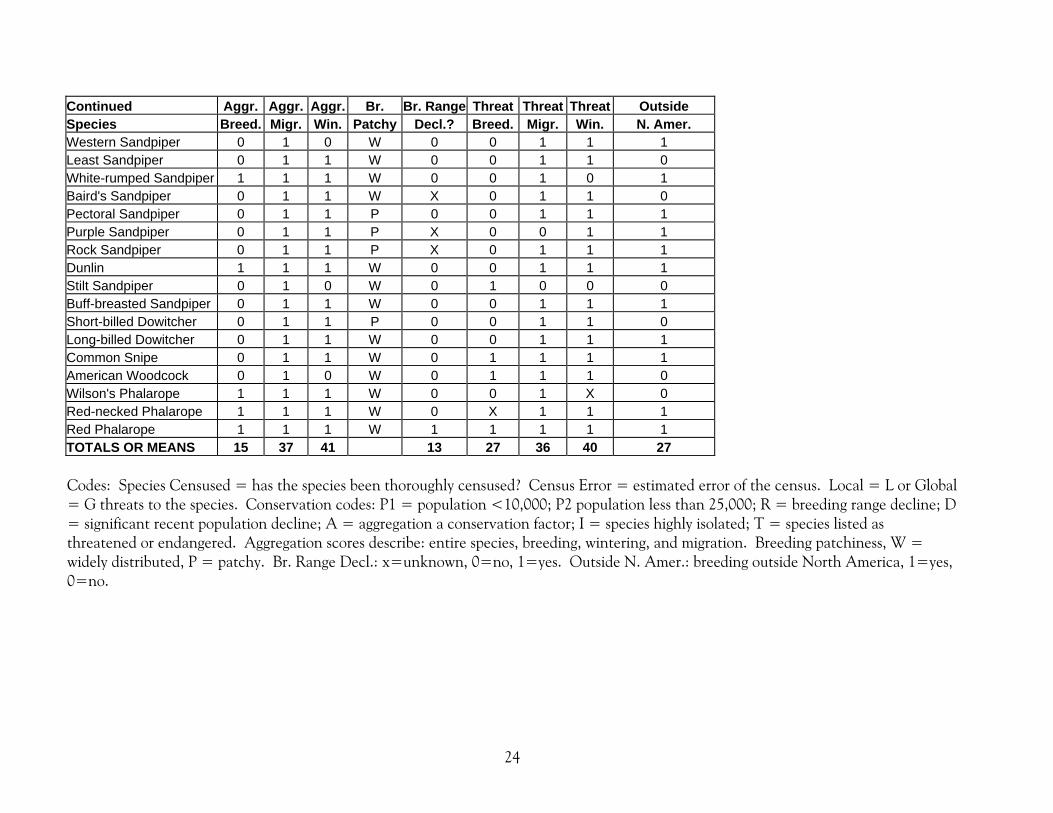
Continued Aggr. Aggr. Aggr. Br. Br. Range Threat Threat Threat Outside Species Breed. Migr. Win. Patchy Decl.? Breed. Migr. Win. N. Amer. Western Sandpiper 0 1 0 W 0 0 1 1 1 Least Sandpiper 0 1 1 W 0 0 1 1 0 White-rumped Sandpiper 1 1 1 W 0 0 1 0 1 Baird's Sandpiper 0 1 1 W X 0 1 1 0 Pectoral Sandpiper 0 1 1 P 0 0 1 1 1 Purple Sandpiper 0 1 1 P X 0 0 1 1 Rock Sandpiper 0 1 1 P X 0 1 1 1 Dunlin 1 1 1 W 0 0 1 1 1 Stilt Sandpiper 0 1 0 W 0 1 0 0 0 Buff-breasted Sandpiper 0 1 1 W 0 0 1 1 1 Short-billed Dowitcher 0 1 1 P 0 0 1 1 0 Long-billed Dowitcher 0 1 1 W 0 0 1 1 1 Common Snipe 0 1 1 W 0 1 1 1 1 American Woodcock 0 1 0 W 0 1 1 1 0 Wilson's Phalarope 1 1 1 W 0 0 1 X 0 Red-necked Phalarope 1 1 1 W 0 X 1 1 1 Red Phalarope 1 1 1 W 1 1 1 1 1 TOTALS OR MEANS 15 37 41 13 27 36 40 27 Codes: Species Censused = has the species been thoroughly censused? Census Error = estimated error of the census. Local = L or Global = G threats to the species. Conservation codes: P1 = population <10,000; P2 population less than 25,000; R = breeding range decline; D = significant recent population decline; A = aggregation a conservation factor; I = species highly isolated; T = species listed as threatened or endangered. Aggregation scores describe: entire species, breeding, wintering, and migration. Breeding patchiness, W = widely distributed, P = patchy. Br. Range Decl.: x=unknown, 0=no, 1=yes. Outside N. Amer.: breeding outside North America, 1=yes, 0=no.
24
25
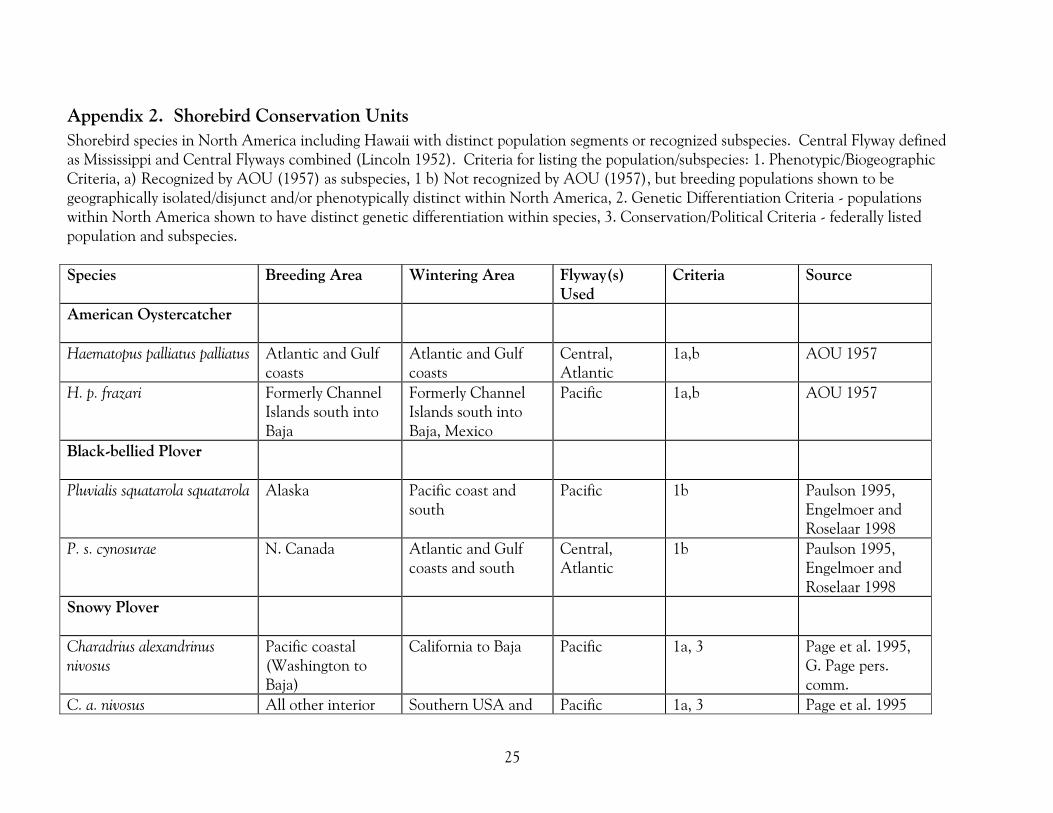
Appendix 2. Shorebird Conservation Units Shorebird species in North America including Hawaii with distinct population segments or recognized subspecies. Central Flyway defined as Mississippi and Central Flyways combined (Lincoln 1952). Criteria for listing the population/subspecies: 1. Phenotypic/Biogeographic Criteria, a) Recognized by AOU (1957) as subspecies, 1 b) Not recognized by AOU (1957), but breeding populations shown to be geographically isolated/disjunct and/or phenotypically distinct within North America, 2. Genetic Differentiation Criteria - populations within North America shown to have distinct genetic differentiation within species, 3. Conservation/Political Criteria - federally listed population and subspecies. Species Breeding Area Wintering Area Flyway(s)
Used Criteria Source
American Oystercatcher
Haematopus palliatus palliatus
Atlantic and Gulf coasts
Atlantic and Gulf coasts
Central, Atlantic
1a,b AOU 1957
H. p. frazari Formerly Channel Islands south into Baja
Formerly Channel Islands south into Baja, Mexico
Pacific 1a,b AOU 1957
Black-bellied Plover
Pluvialis squatarola squatarola Alaska Pacific coast and south
Pacific 1b Paulson 1995, Engelmoer and Roselaar 1998
P. s. cynosurae N. Canada Atlantic and Gulf coasts and south
Central, Atlantic
1b Paulson 1995, Engelmoer and Roselaar 1998
Snowy Plover
Charadrius alexandrinus nivosus
Pacific coastal (Washington to Baja)
California to Baja Pacific 1a, 3 Page et al. 1995, G. Page pers. comm.
C. a. nivosus All other interior Southern USA and Pacific 1a, 3 Page et al. 1995
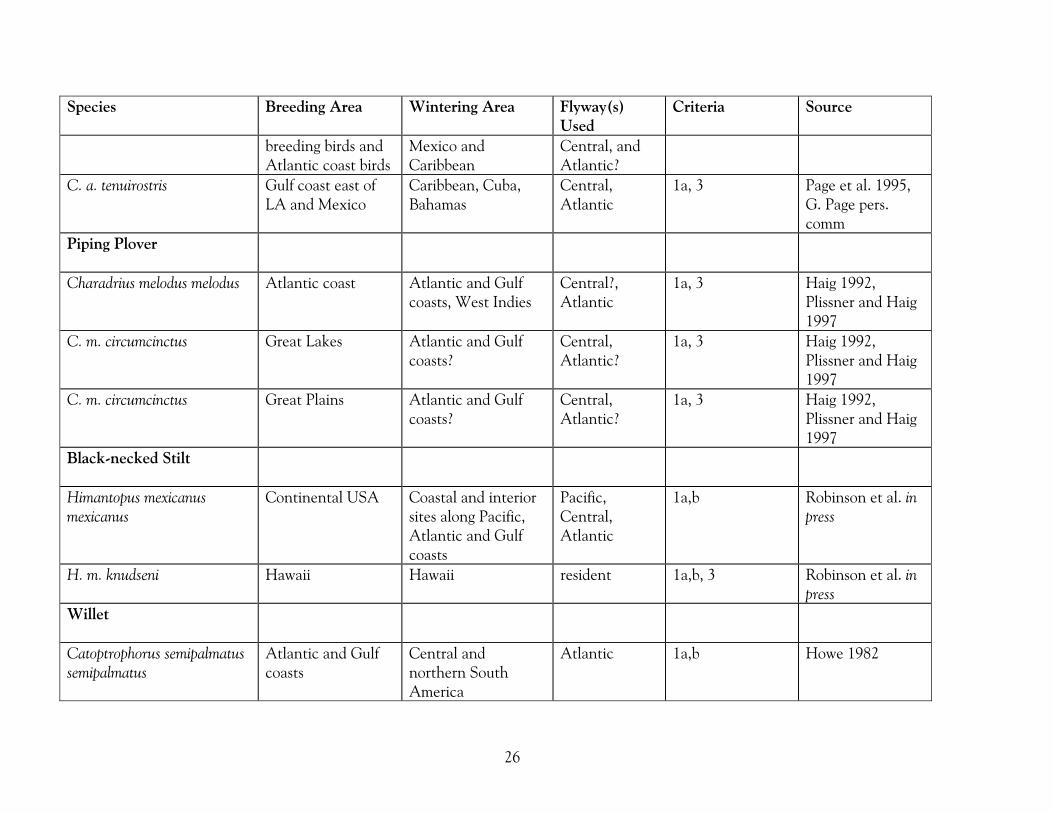
Species Breeding Area Wintering Area Flyway(s) Used
Criteria Source
breeding birds and Atlantic coast birds
Mexico and Caribbean
Central, and Atlantic?
C. a. tenuirostris Gulf coast east of LA and Mexico
Caribbean, Cuba, Bahamas
Central, Atlantic
1a, 3 Page et al. 1995, G. Page pers. comm
Piping Plover
Charadrius melodus melodus Atlantic coast Atlantic and Gulf coasts, West Indies
Central?, Atlantic
1a, 3 Haig 1992, Plissner and Haig 1997
C. m. circumcinctus Great Lakes Atlantic and Gulf coasts?
Central, Atlantic?
1a, 3 Haig 1992, Plissner and Haig 1997
C. m. circumcinctus Great Plains Atlantic and Gulf coasts?
Central, Atlantic?
1a, 3 Haig 1992, Plissner and Haig 1997
Black-necked Stilt
Himantopus mexicanus mexicanus
Continental USA Coastal and interior sites along Pacific, Atlantic and Gulf coasts
Pacific, Central, Atlantic
1a,b Robinson et al. in press
H. m. knudseni Hawaii Hawaii resident 1a,b, 3 Robinson et al. in press
Willet
Catoptrophorus semipalmatus semipalmatus
Atlantic and Gulf coasts
Central and northern South America
Atlantic 1a,b Howe 1982
26
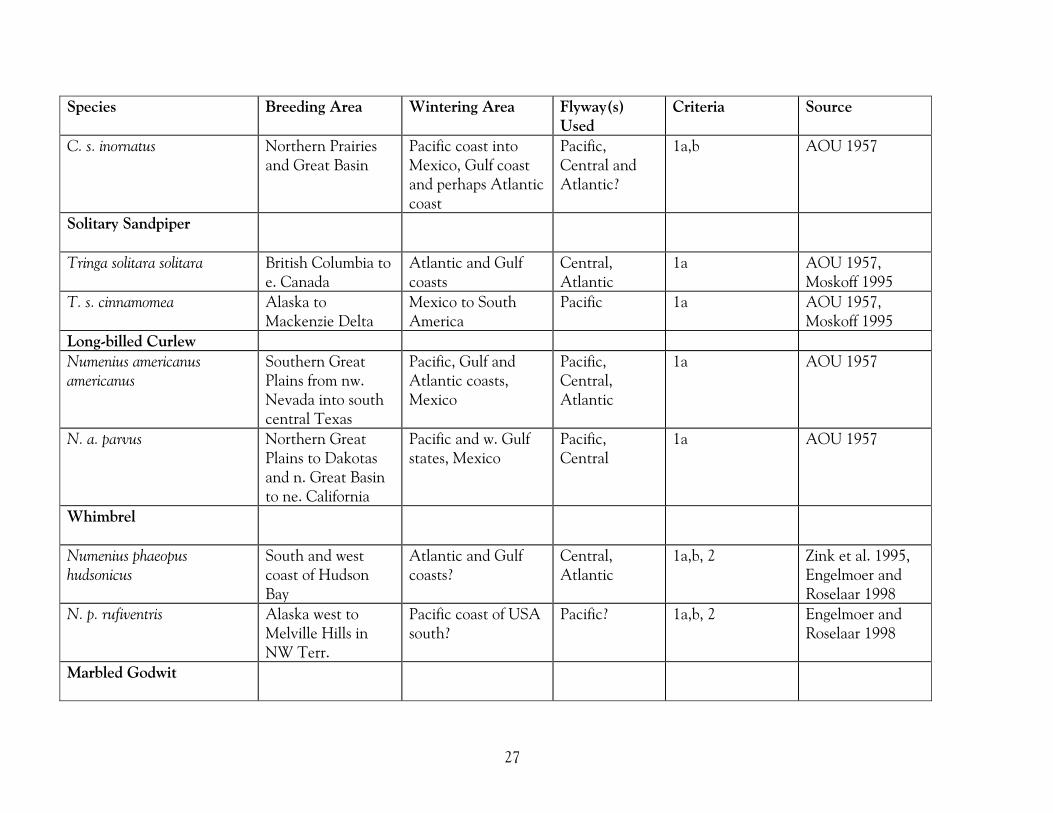
Species Breeding Area Wintering Area Flyway(s) Used
Criteria Source
C. s. inornatus Northern Prairies and Great Basin
Pacific coast into Mexico, Gulf coast and perhaps Atlantic coast
Pacific, Central and Atlantic?
1a,b AOU 1957
Solitary Sandpiper
Tringa solitara solitara British Columbia to e. Canada
Atlantic and Gulf coasts
Central, Atlantic
1a AOU 1957, Moskoff 1995
T. s. cinnamomea Alaska to Mackenzie Delta
Mexico to South America
Pacific 1a AOU 1957, Moskoff 1995
Long-billed Curlew Numenius americanus americanus
Southern Great Plains from nw. Nevada into south central Texas
Pacific, Gulf and Atlantic coasts, Mexico
Pacific, Central, Atlantic
1a AOU 1957
N. a. parvus Northern Great Plains to Dakotas and n. Great Basin to ne. California
Pacific and w. Gulf states, Mexico
Pacific, Central
1a AOU 1957
Whimbrel
Numenius phaeopus hudsonicus
South and west coast of Hudson Bay
Atlantic and Gulf coasts?
Central, Atlantic
1a,b, 2 Zink et al. 1995, Engelmoer and Roselaar 1998
N. p. rufiventris Alaska west to Melville Hills in NW Terr.
Pacific coast of USA south?
Pacific? 1a,b, 2 Engelmoer and Roselaar 1998
Marbled Godwit
27
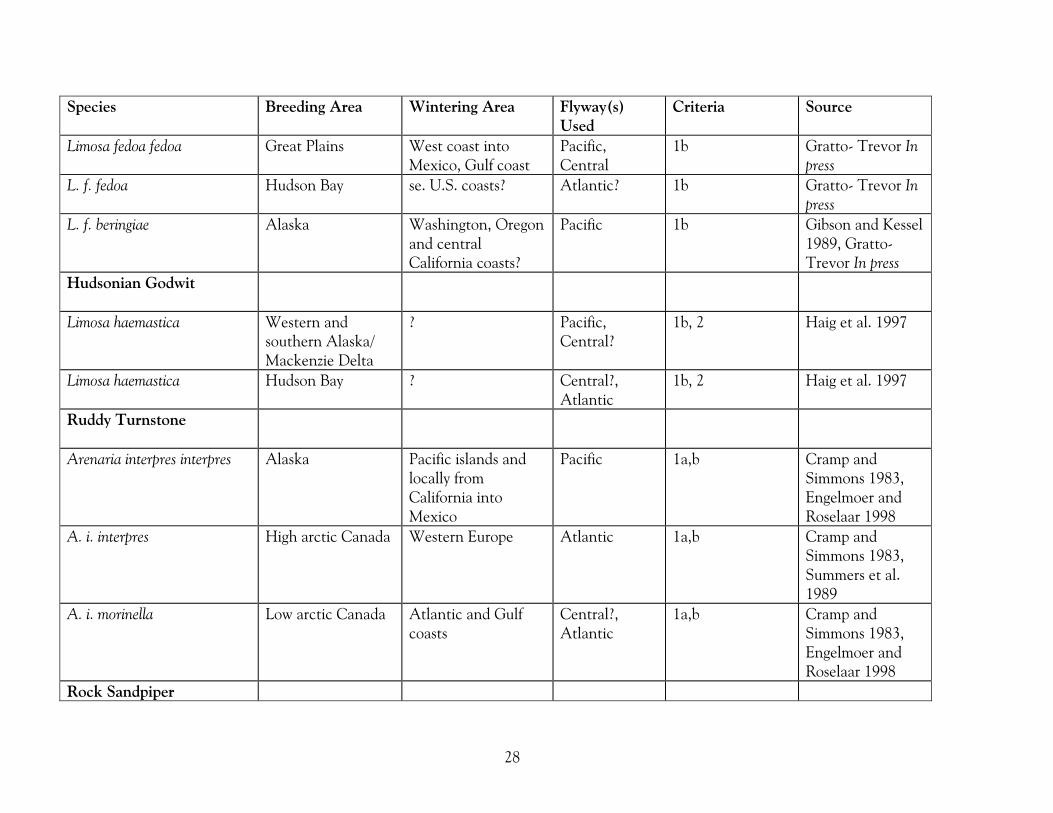
Species Breeding Area Wintering Area Flyway(s) Used
Criteria Source
Limosa fedoa fedoa Great Plains West coast into Mexico, Gulf coast
Pacific, Central
1b Gratto- Trevor In press
L. f. fedoa Hudson Bay se. U.S. coasts? Atlantic? 1b Gratto- Trevor In press
L. f. beringiae Alaska Washington, Oregon and central California coasts?
Pacific 1b Gibson and Kessel 1989, Gratto- Trevor In press
Hudsonian Godwit
Limosa haemastica Western and southern Alaska/ Mackenzie Delta
? Pacific, Central?
1b, 2 Haig et al. 1997
Limosa haemastica
Hudson Bay ? Central?, Atlantic
1b, 2 Haig et al. 1997
Ruddy Turnstone
Arenaria interpres interpres Alaska Pacific islands and locally from California into Mexico
Pacific 1a,b Cramp and Simmons 1983, Engelmoer and Roselaar 1998
A. i. interpres High arctic Canada Western Europe Atlantic 1a,b Cramp and Simmons 1983, Summers et al. 1989
A. i. morinella Low arctic Canada Atlantic and Gulf coasts
Central?, Atlantic
1a,b Cramp and Simmons 1983, Engelmoer and Roselaar 1998
Rock Sandpiper
28
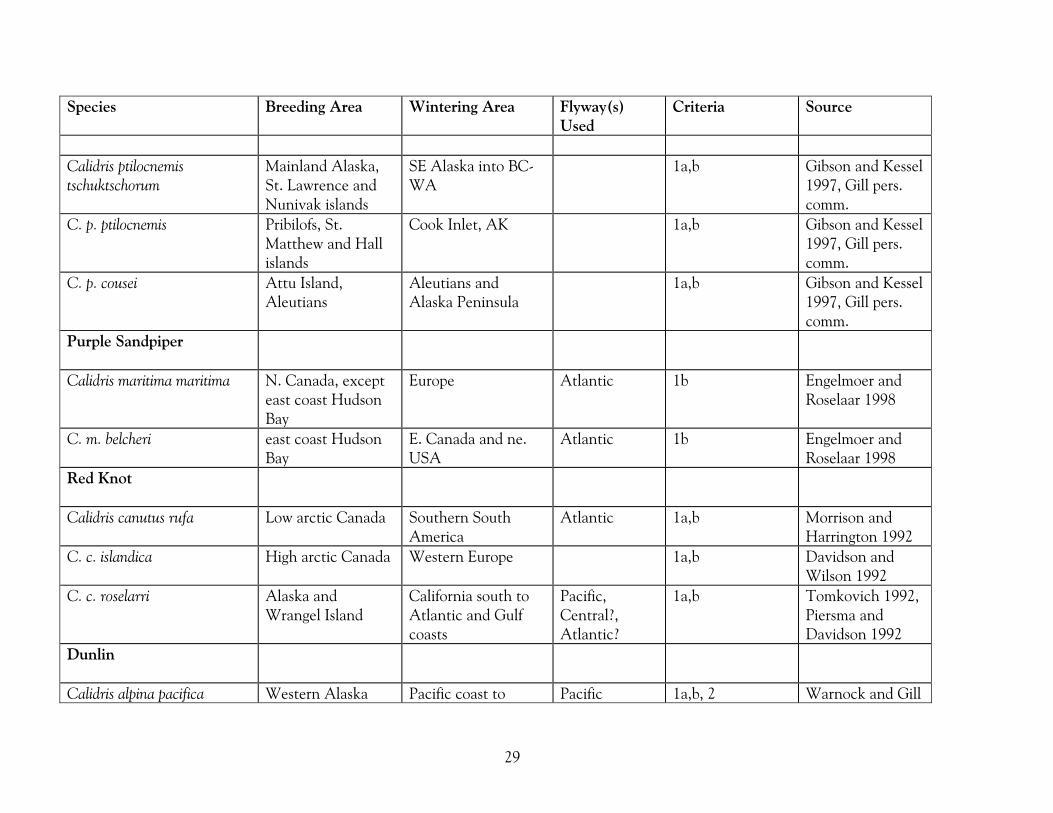
Species Breeding Area Wintering Area Flyway(s) Used
Criteria Source
Calidris ptilocnemis tschuktschorum
Mainland Alaska, St. Lawrence and Nunivak islands
SE Alaska into BC-WA
1a,b Gibson and Kessel 1997, Gill pers. comm.
C. p. ptilocnemis Pribilofs, St. Matthew and Hall islands
Cook Inlet, AK 1a,b Gibson and Kessel 1997, Gill pers. comm.
C. p. cousei Attu Island, Aleutians
Aleutians and Alaska Peninsula
1a,b Gibson and Kessel 1997, Gill pers. comm.
Purple Sandpiper
Calidris maritima maritima N. Canada, except east coast Hudson Bay
Europe Atlantic 1b Engelmoer and Roselaar 1998
C. m. belcheri east coast Hudson Bay
E. Canada and ne. USA
Atlantic 1b Engelmoer and Roselaar 1998
Red Knot
Calidris canutus rufa Low arctic Canada Southern South America
Atlantic 1a,b Morrison and Harrington 1992
C. c. islandica High arctic Canada Western Europe 1a,b Davidson and Wilson 1992
C. c. roselarri Alaska and Wrangel Island
California south to Atlantic and Gulf coasts
Pacific, Central?, Atlantic?
1a,b Tomkovich 1992, Piersma and Davidson 1992
Dunlin
Calidris alpina pacifica Western Alaska Pacific coast to Pacific 1a,b, 2 Warnock and Gill
29
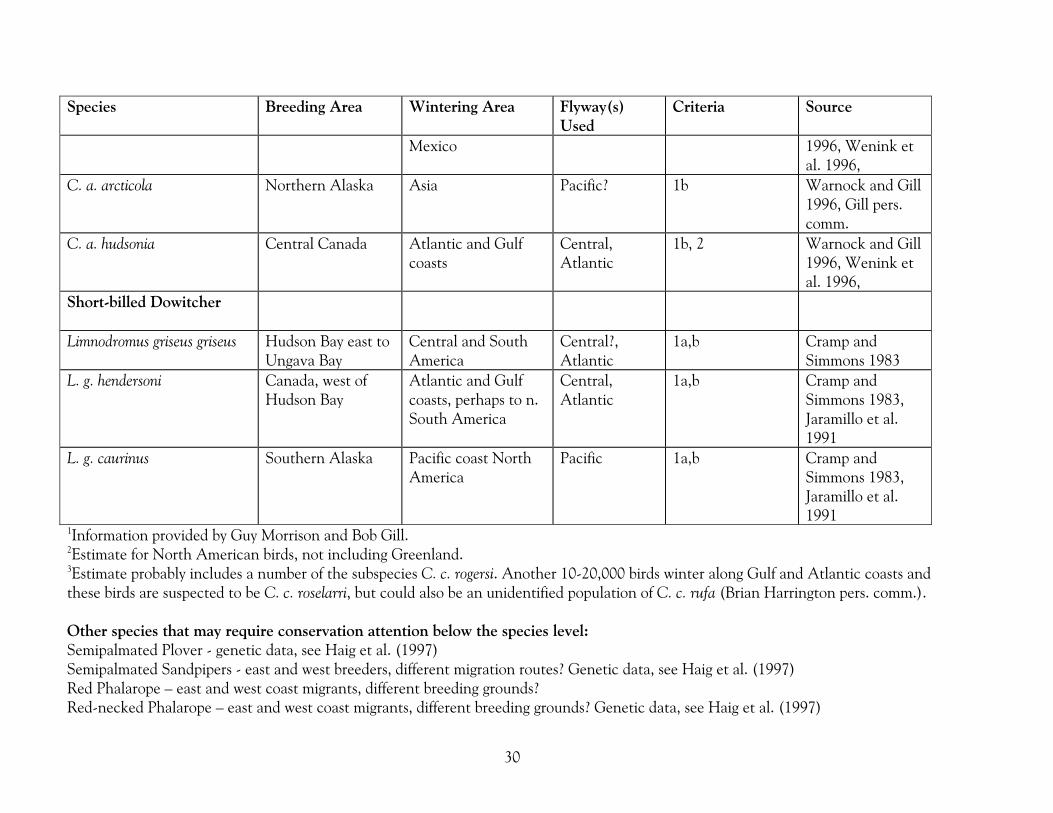
Species Breeding Area Wintering Area Flyway(s) Used
Criteria Source
Mexico 1996, Wenink et al. 1996,
C. a. arcticola Northern Alaska Asia Pacific? 1b Warnock and Gill 1996, Gill pers. comm.
C. a. hudsonia Central Canada Atlantic and Gulf coasts
Central, Atlantic
1b, 2 Warnock and Gill 1996, Wenink et al. 1996,
Short-billed Dowitcher
Limnodromus griseus griseus Hudson Bay east to Ungava Bay
Central and South America
Central?, Atlantic
1a,b Cramp and Simmons 1983
L. g. hendersoni Canada, west of Hudson Bay
Atlantic and Gulf coasts, perhaps to n. South America
Central, Atlantic
1a,b Cramp and Simmons 1983, Jaramillo et al. 1991
L. g. caurinus Southern Alaska Pacific coast North America
Pacific 1a,b Cramp and Simmons 1983, Jaramillo et al. 1991
1Information provided by Guy Morrison and Bob Gill. 2Estimate for North American birds, not including Greenland. 3Estimate probably includes a number of the subspecies C. c. rogersi. Another 10-20,000 birds winter along Gulf and Atlantic coasts and these birds are suspected to be C. c. roselarri, but could also be an unidentified population of C. c. rufa (Brian Harrington pers. comm.). Other species that may require conservation attention below the species level: Semipalmated Plover - genetic data, see Haig et al. (1997) Semipalmated Sandpipers - east and west breeders, different migration routes? Genetic data, see Haig et al. (1997) Red Phalarope – east and west coast migrants, different breeding grounds? Red-necked Phalarope – east and west coast migrants, different breeding grounds? Genetic data, see Haig et al. (1997)
30
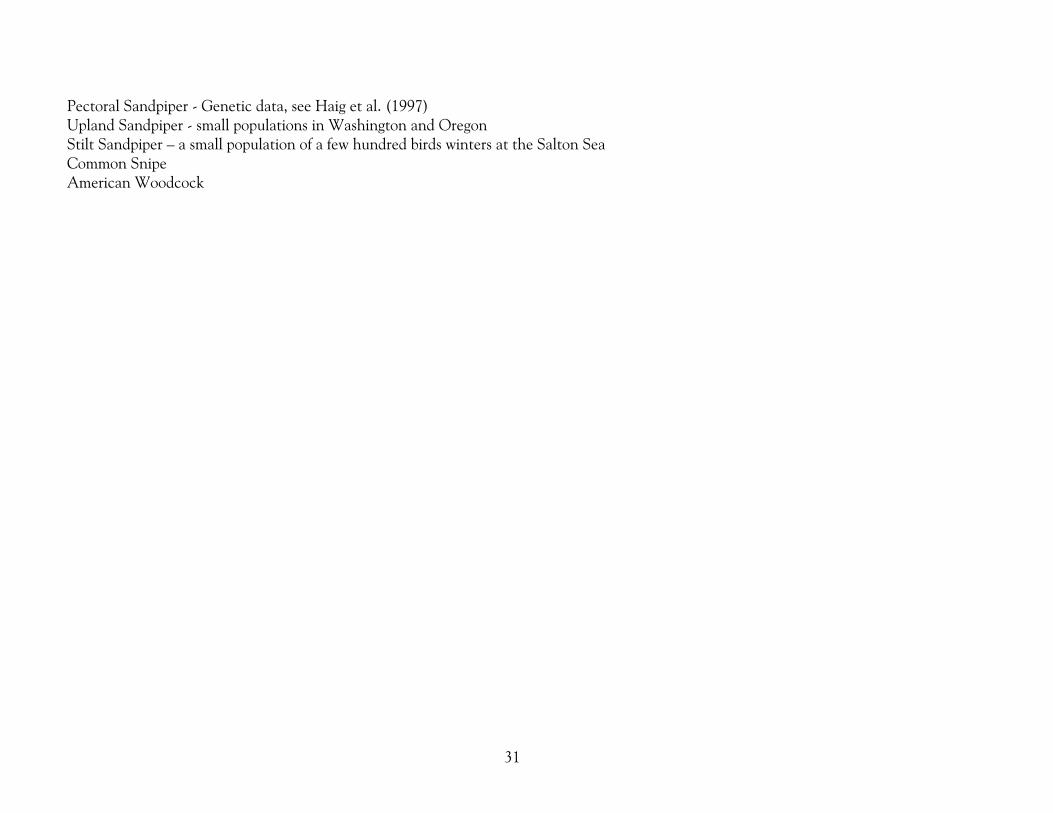
Pectoral Sandpiper - Genetic data, see Haig et al. (1997) Upland Sandpiper - small populations in Washington and Oregon Stilt Sandpiper – a small population of a few hundred birds winters at the Salton Sea Common Snipe American Woodcock
31
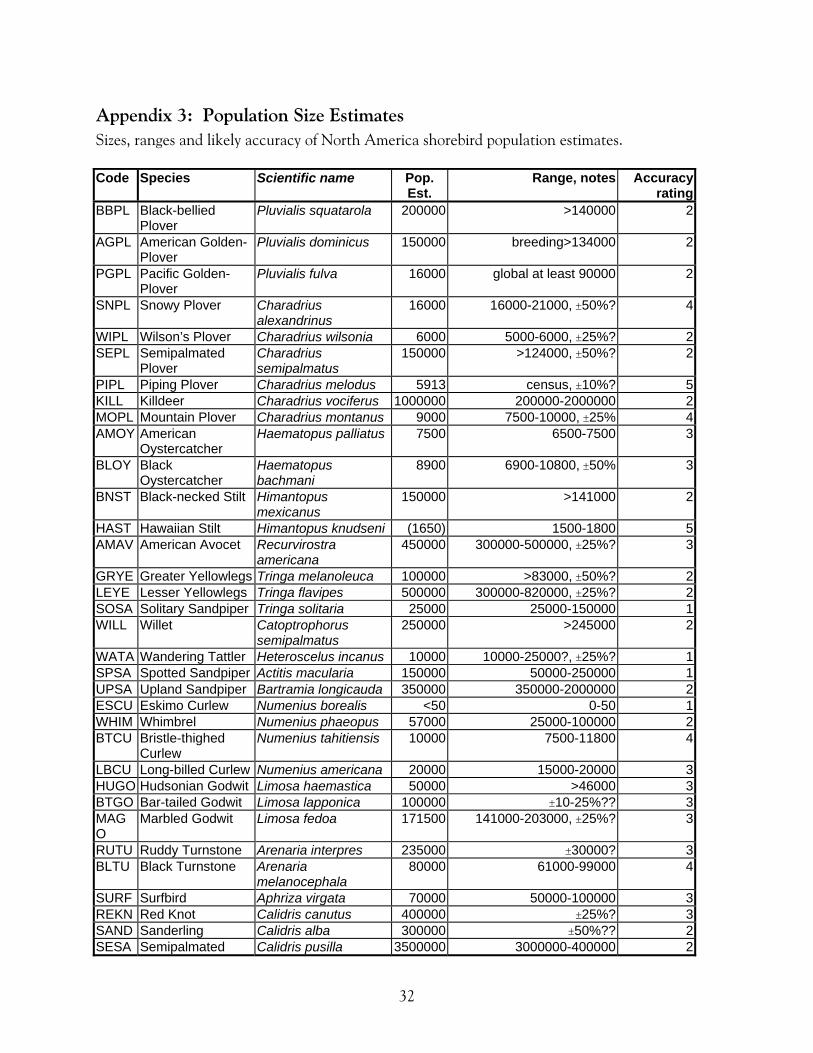
32
Appendix 3: Population Size Estimates Sizes, ranges and likely accuracy of North America shorebird population estimates. Code Species Scientific name Pop.
Est. Range, notes Accuracy
ratingBBPL Black-bellied
Plover Pluvialis squatarola 200000 >140000 2
AGPL American Golden-Plover
Pluvialis dominicus 150000 breeding>134000 2
PGPL Pacific Golden-Plover
Pluvialis fulva 16000 global at least 90000 2
SNPL Snowy Plover Charadrius alexandrinus
16000 16000-21000, ±50%? 4
WIPL Wilson’s Plover Charadrius wilsonia 6000 5000-6000, ±25%? 2SEPL Semipalmated
Plover Charadrius semipalmatus
150000 >124000, ±50%? 2
PIPL Piping Plover Charadrius melodus 5913 census, ±10%? 5KILL Killdeer Charadrius vociferus 1000000 200000-2000000 2MOPL Mountain Plover Charadrius montanus 9000 7500-10000, ±25% 4AMOY American
Oystercatcher Haematopus palliatus 7500 6500-7500 3
BLOY Black Oystercatcher
Haematopus bachmani
8900 6900-10800, ±50% 3
BNST Black-necked Stilt Himantopus mexicanus
150000 >141000 2
HAST Hawaiian Stilt Himantopus knudseni (1650) 1500-1800 5AMAV American Avocet Recurvirostra
americana 450000 300000-500000, ±25%? 3
GRYE Greater Yellowlegs Tringa melanoleuca 100000 >83000, ±50%? 2LEYE Lesser Yellowlegs Tringa flavipes 500000 300000-820000, ±25%? 2SOSA Solitary Sandpiper Tringa solitaria 25000 25000-150000 1WILL Willet Catoptrophorus
semipalmatus 250000 >245000 2
WATA Wandering Tattler Heteroscelus incanus 10000 10000-25000?, ±25%? 1SPSA Spotted Sandpiper Actitis macularia 150000 50000-250000 1UPSA Upland Sandpiper Bartramia longicauda 350000 350000-2000000 2ESCU Eskimo Curlew Numenius borealis <50 0-50 1WHIM Whimbrel Numenius phaeopus 57000 25000-100000 2BTCU Bristle-thighed
Curlew Numenius tahitiensis 10000 7500-11800 4
LBCU Long-billed Curlew Numenius americana 20000 15000-20000 3HUGO Hudsonian Godwit Limosa haemastica 50000 >46000 3BTGO Bar-tailed Godwit Limosa lapponica 100000 ±10-25%?? 3MAGO
Marbled Godwit Limosa fedoa 171500 141000-203000, ±25%? 3
RUTU Ruddy Turnstone Arenaria interpres 235000 ±30000? 3BLTU Black Turnstone Arenaria
melanocephala 80000 61000-99000 4
SURF Surfbird Aphriza virgata 70000 50000-100000 3REKN Red Knot Calidris canutus 400000 ±25%? 3SAND Sanderling Calidris alba 300000 ±50%?? 2SESA Semipalmated Calidris pusilla 3500000 3000000-400000 2
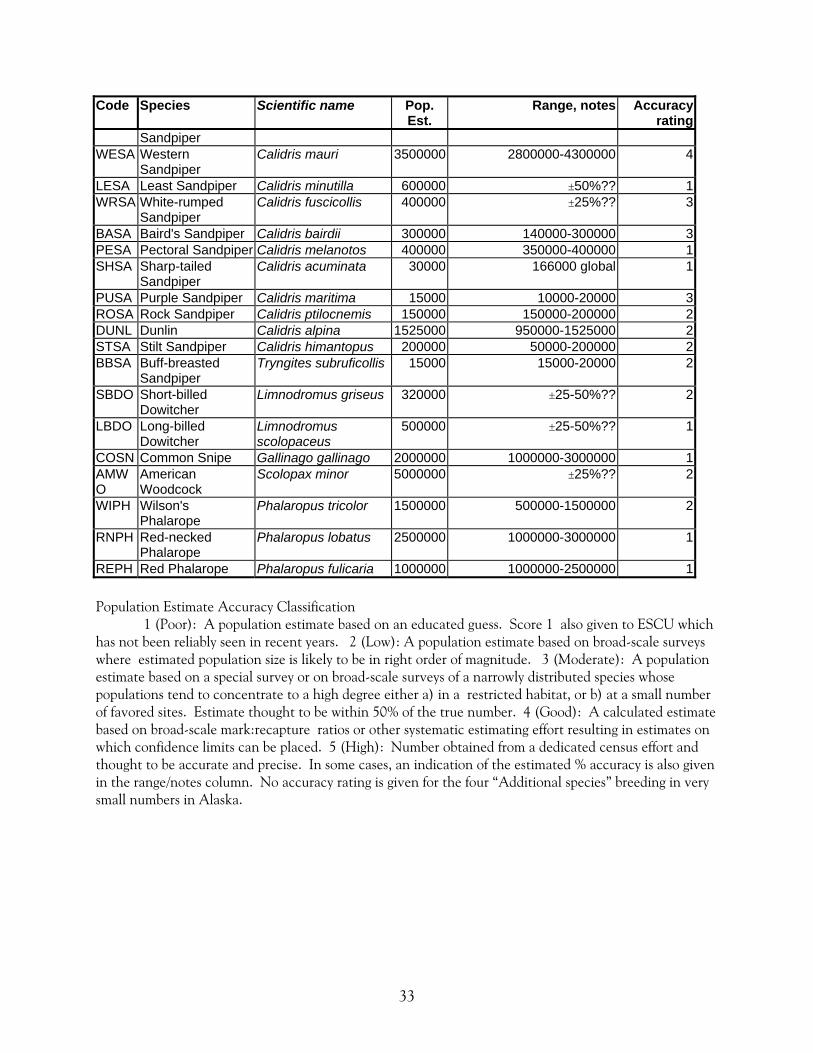
Code Species Scientific name Pop. Est.
Range, notes Accuracy rating
Sandpiper WESA Western
Sandpiper Calidris mauri 3500000 2800000-4300000 4
LESA Least Sandpiper Calidris minutilla 600000 ±50%?? 1WRSA White-rumped
Sandpiper Calidris fuscicollis 400000 ±25%?? 3
BASA Baird's Sandpiper Calidris bairdii 300000 140000-300000 3PESA Pectoral Sandpiper Calidris melanotos 400000 350000-400000 1SHSA Sharp-tailed
Sandpiper Calidris acuminata 30000 166000 global 1
PUSA Purple Sandpiper Calidris maritima 15000 10000-20000 3ROSA Rock Sandpiper Calidris ptilocnemis 150000 150000-200000 2DUNL Dunlin Calidris alpina 1525000 950000-1525000 2STSA Stilt Sandpiper Calidris himantopus 200000 50000-200000 2BBSA Buff-breasted
Sandpiper Tryngites subruficollis 15000 15000-20000 2
SBDO Short-billed Dowitcher
Limnodromus griseus 320000 ±25-50%?? 2
LBDO Long-billed Dowitcher
Limnodromus scolopaceus
500000 ±25-50%?? 1
COSN Common Snipe Gallinago gallinago 2000000 1000000-3000000 1AMWO
American Woodcock
Scolopax minor 5000000 ±25%?? 2
WIPH Wilson's Phalarope
Phalaropus tricolor 1500000 500000-1500000 2
RNPH Red-necked Phalarope
Phalaropus lobatus 2500000 1000000-3000000 1
REPH Red Phalarope Phalaropus fulicaria 1000000 1000000-2500000 1 Population Estimate Accuracy Classification
1 (Poor): A population estimate based on an educated guess. Score 1 also given to ESCU which has not been reliably seen in recent years. 2 (Low): A population estimate based on broad-scale surveys where estimated population size is likely to be in right order of magnitude. 3 (Moderate): A population estimate based on a special survey or on broad-scale surveys of a narrowly distributed species whose populations tend to concentrate to a high degree either a) in a restricted habitat, or b) at a small number of favored sites. Estimate thought to be within 50% of the true number. 4 (Good): A calculated estimate based on broad-scale mark:recapture ratios or other systematic estimating effort resulting in estimates on which confidence limits can be placed. 5 (High): Number obtained from a dedicated census effort and thought to be accurate and precise. In some cases, an indication of the estimated % accuracy is also given in the range/notes column. No accuracy rating is given for the four “Additional species” breeding in very small numbers in Alaska.
33
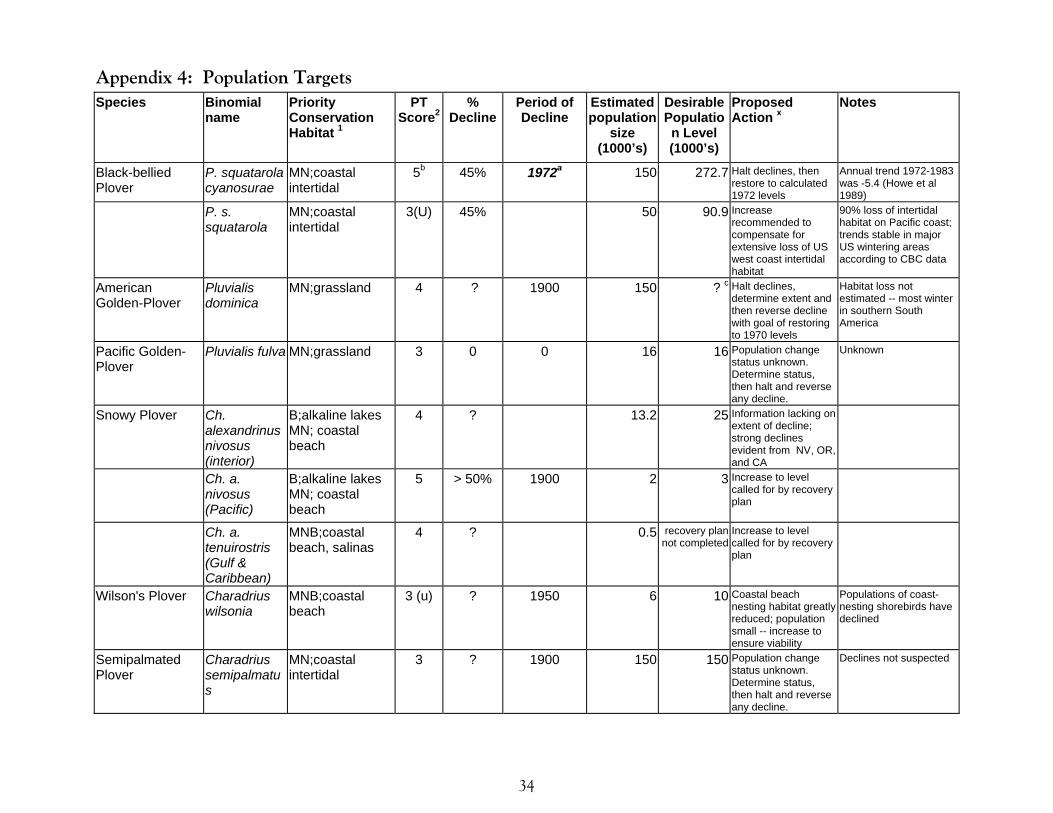
34
Appendix 4: Population Targets Species Binomial
name Priority Conservation Habitat 1
PT Score2
% Decline
Period of Decline
Estimated population
size (1000’s)
Desirable Population Level (1000’s)
Proposed Action x
Notes
Black-bellied Plover
P. squatarola cyanosurae
MN;coastal intertidal
5b 45% 1972a 150 272.7 Halt declines, then restore to calculated 1972 levels
Annual trend 1972-1983 was -5.4 (Howe et al 1989)
P. s. squatarola
MN;coastal intertidal
3(U) 45% 50 90.9 Increase recommended to compensate for extensive loss of US west coast intertidal habitat
90% loss of intertidal habitat on Pacific coast; trends stable in major US wintering areas according to CBC data
American Golden-Plover
Pluvialis dominica
MN;grassland 4 ? 1900 150 ? c Halt declines, determine extent and then reverse decline with goal of restoring to 1970 levels
Habitat loss not estimated -- most winter in southern South America
Pacific Golden-Plover
Pluvialis fulva MN;grassland 3 0 0 16 16 Population change status unknown. Determine status, then halt and reverse any decline.
Unknown
Snowy Plover Ch. alexandrinus nivosus (interior)
B;alkaline lakes MN; coastal beach
4 ? 13.2 25 Information lacking on extent of decline; strong declines evident from NV, OR, and CA
Ch. a. nivosus (Pacific)
B;alkaline lakes MN; coastal beach
5 > 50% 1900 2 3 Increase to level called for by recovery plan
Ch. a. tenuirostris (Gulf & Caribbean)
MNB;coastal beach, salinas
4 ? 0.5 recovery plan not completed
Increase to level called for by recovery plan
Wilson's Plover Charadrius wilsonia
MNB;coastal beach
3 (u) ? 1950 6 10 Coastal beach nesting habitat greatly reduced; population small -- increase to ensure viability
Populations of coast-nesting shorebirds have declined
Semipalmated Plover
Charadrius semipalmatus
MN;coastal intertidal
3 ? 1900 150 150 Population change status unknown. Determine status, then halt and reverse any decline.
Declines not suspected
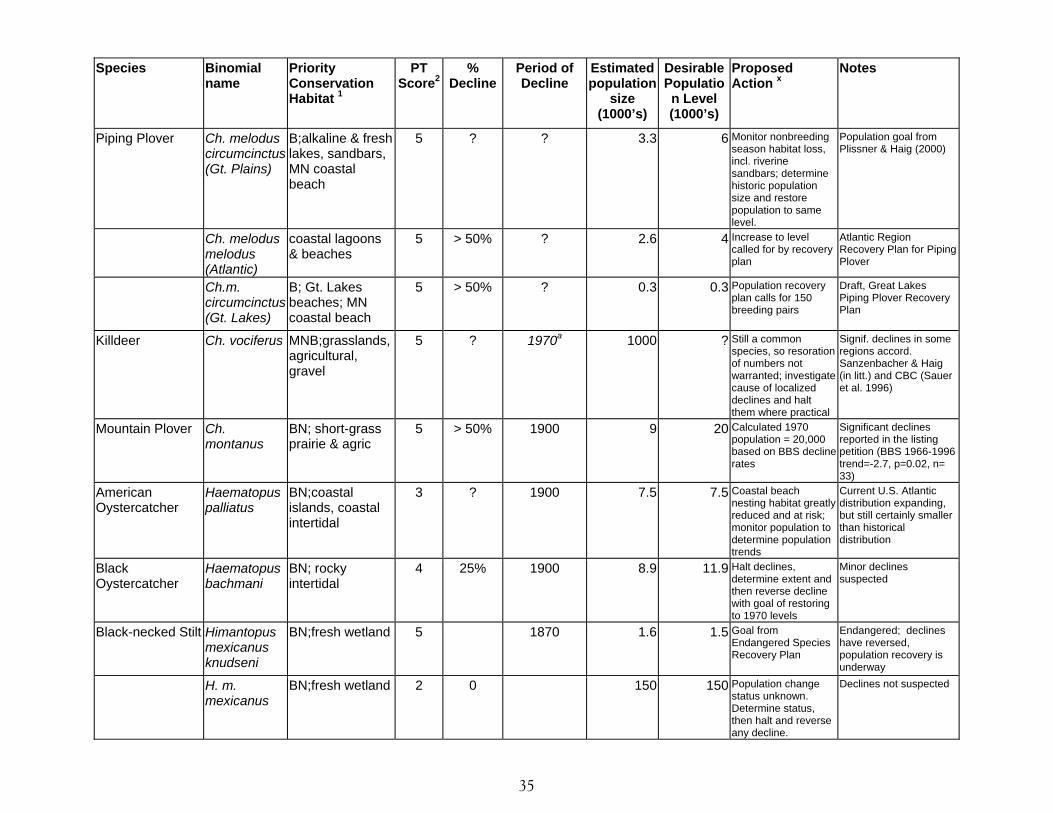
Species Binomial name
Priority Conservation Habitat 1
PT Score2
% Decline
Period of Decline
Estimated population
size (1000’s)
Desirable Population Level (1000’s)
Proposed Action x
Notes
Piping Plover Ch. melodus circumcinctus (Gt. Plains)
B;alkaline & fresh lakes, sandbars, MN coastal beach
5 ? ? 3.3 6 Monitor nonbreeding season habitat loss, incl. riverine sandbars; determine historic population size and restore population to same level.
Population goal from Plissner & Haig (2000)
Ch. melodus melodus (Atlantic)
coastal lagoons & beaches
5 > 50% ? 2.6 4 Increase to level called for by recovery plan
Atlantic Region Recovery Plan for Piping Plover
Ch.m. circumcinctus (Gt. Lakes)
B; Gt. Lakes beaches; MN coastal beach
5 > 50% ? 0.3 0.3 Population recovery plan calls for 150 breeding pairs
Draft, Great Lakes Piping Plover Recovery Plan
Killdeer Ch. vociferus MNB;grasslands, agricultural, gravel
5 ? 1970a 1000 ? Still a common species, so resoration of numbers not warranted; investigate cause of localized declines and halt them where practical
Signif. declines in some regions accord. Sanzenbacher & Haig (in litt.) and CBC (Sauer et al. 1996)
Mountain Plover Ch. montanus
BN; short-grass prairie & agric
5 > 50% 1900 9 20 Calculated 1970 population = 20,000 based on BBS decline rates
Significant declines reported in the listing petition (BBS 1966-1996 trend=-2.7, p=0.02, n= 33)
American Oystercatcher
Haematopus palliatus
BN;coastal islands, coastal intertidal
3 ? 1900 7.5 7.5 Coastal beach nesting habitat greatly reduced and at risk; monitor population to determine population trends
Current U.S. Atlantic distribution expanding, but still certainly smaller than historical distribution
Black Oystercatcher
Haematopus bachmani
BN; rocky intertidal
4 25% 1900 8.9 11.9 Halt declines, determine extent and then reverse decline with goal of restoring to 1970 levels
Minor declines suspected
Black-necked Stilt Himantopus mexicanus knudseni
BN;fresh wetland 5 1870 1.6 1.5 Goal from Endangered Species Recovery Plan
Endangered; declines have reversed, population recovery is underway
H. m. mexicanus
BN;fresh wetland 2 0 150 150 Population change status unknown. Determine status, then halt and reverse any decline.
Declines not suspected
35
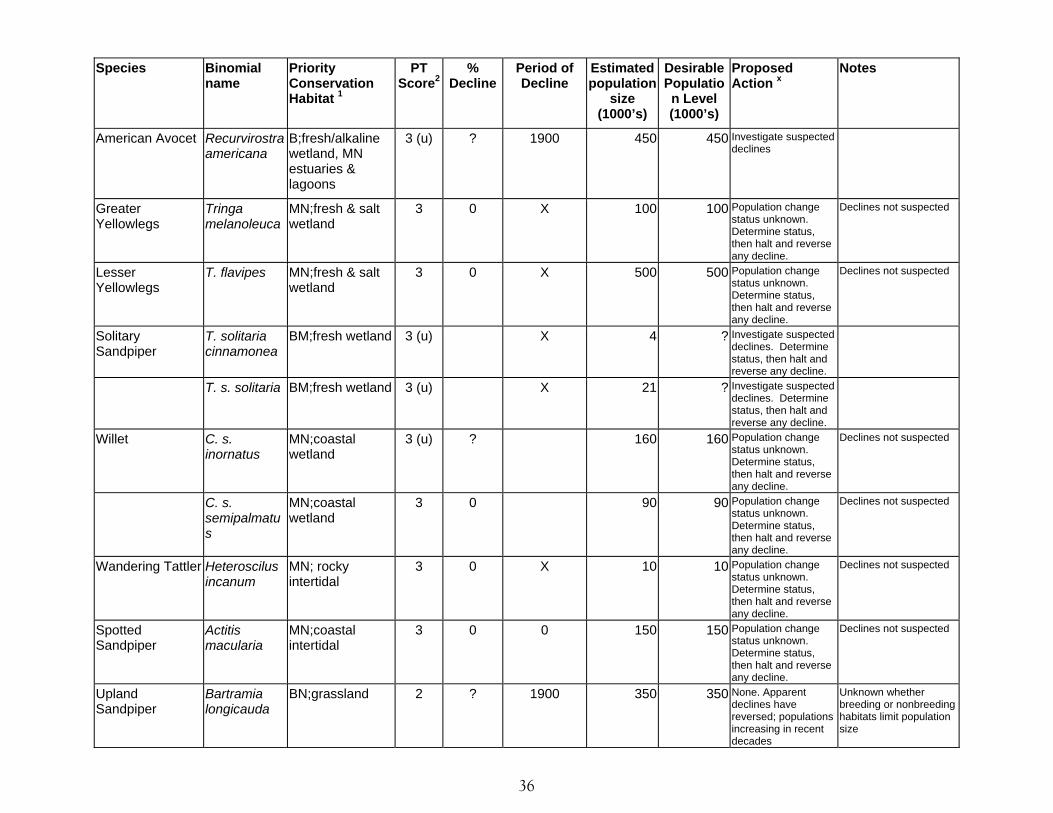
Species Binomial name
Priority Conservation Habitat 1
PT Score2
% Decline
Period of Decline
Estimated population
size (1000’s)
Desirable Population Level (1000’s)
Proposed Action x
Notes
American Avocet Recurvirostra americana
B;fresh/alkaline wetland, MN estuaries & lagoons
3 (u) ? 1900 450 450 Investigate suspected declines
Greater Yellowlegs
Tringa melanoleuca
MN;fresh & salt wetland
3 0 X 100 100 Population change status unknown. Determine status, then halt and reverse any decline.
Declines not suspected
Lesser Yellowlegs
T. flavipes MN;fresh & salt wetland
3 0 X 500 500 Population change status unknown. Determine status, then halt and reverse any decline.
Declines not suspected
Solitary Sandpiper
T. solitaria cinnamonea
BM;fresh wetland 3 (u) X 4 ? Investigate suspected declines. Determine status, then halt and reverse any decline.
T. s. solitaria BM;fresh wetland 3 (u) X 21 ? Investigate suspected declines. Determine status, then halt and reverse any decline.
Willet C. s. inornatus
MN;coastal wetland
3 (u) ? 160 160 Population change status unknown. Determine status, then halt and reverse any decline.
Declines not suspected
C. s. semipalmatus
MN;coastal wetland
3 0 90 90 Population change status unknown. Determine status, then halt and reverse any decline.
Declines not suspected
Wandering Tattler Heteroscilus incanum
MN; rocky intertidal
3 0 X 10 10 Population change status unknown. Determine status, then halt and reverse any decline.
Declines not suspected
Spotted Sandpiper
Actitis macularia
MN;coastal intertidal
3 0 0 150 150 Population change status unknown. Determine status, then halt and reverse any decline.
Declines not suspected
Upland Sandpiper
Bartramia longicauda
BN;grassland 2 ? 1900 350 350 None. Apparent declines have reversed; populations increasing in recent decades
Unknown whether breeding or nonbreeding habitats limit population size
36
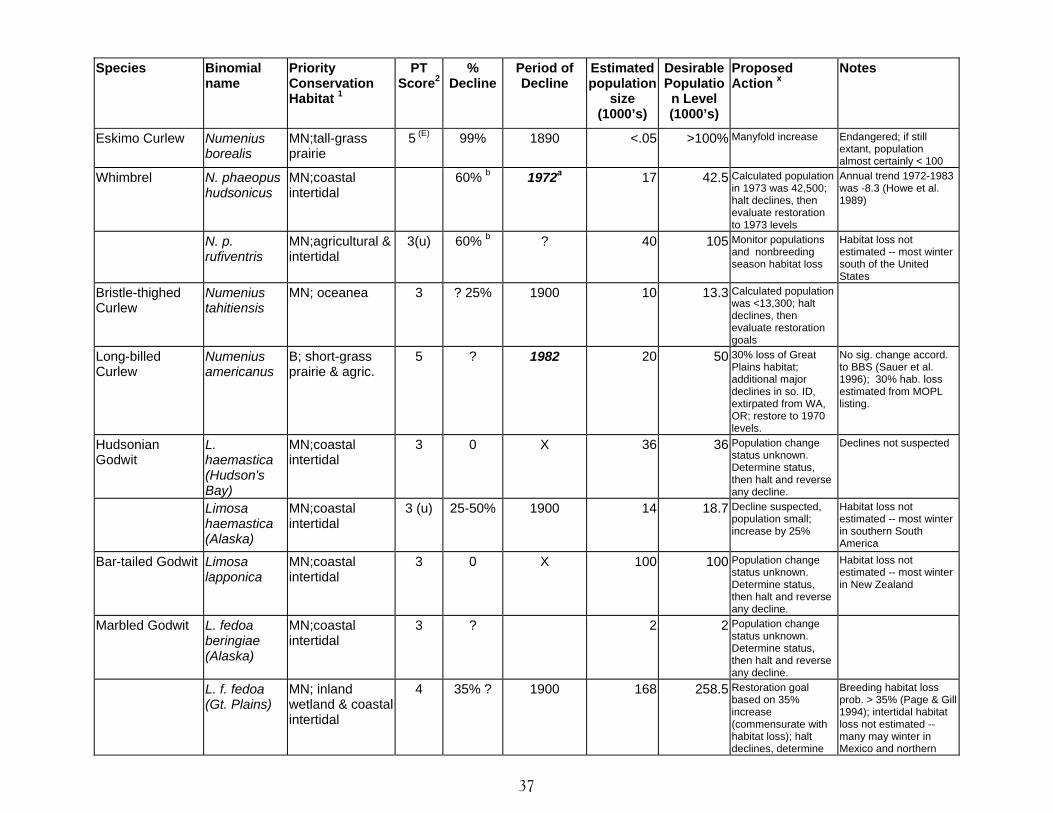
Species Binomial name
Priority Conservation Habitat 1
PT Score2
% Decline
Period of Decline
Estimated population
size (1000’s)
Desirable Population Level (1000’s)
Proposed Action x
Notes
Eskimo Curlew Numenius borealis
MN;tall-grass prairie
5 (E) 99% 1890 <.05 >100% Manyfold increase Endangered; if still extant, population almost certainly < 100
Whimbrel N. phaeopus hudsonicus
MN;coastal intertidal
60% b 1972a 17 42.5 Calculated population in 1973 was 42,500; halt declines, then evaluate restoration to 1973 levels
Annual trend 1972-1983 was -8.3 (Howe et al. 1989)
N. p. rufiventris
MN;agricultural & intertidal
3(u) 60% b ? 40 105 Monitor populations and nonbreeding season habitat loss
Habitat loss not estimated -- most winter south of the United States
Bristle-thighed Curlew
Numenius tahitiensis
MN; oceanea 3 ? 25% 1900 10 13.3 Calculated population was <13,300; halt declines, then evaluate restoration goals
Long-billed Curlew
Numenius americanus
B; short-grass prairie & agric.
5 ? 1982 20 50 30% loss of Great Plains habitat; additional major declines in so. ID, extirpated from WA, OR; restore to 1970 levels.
No sig. change accord. to BBS (Sauer et al. 1996); 30% hab. loss estimated from MOPL listing.
Hudsonian Godwit
L. haemastica (Hudson's Bay)
MN;coastal intertidal
3 0 X 36 36 Population change status unknown. Determine status, then halt and reverse any decline.
Declines not suspected
Limosa haemastica (Alaska)
MN;coastal intertidal
3 (u) 25-50% 1900 14 18.7 Decline suspected, population small; increase by 25%
Habitat loss not estimated -- most winter in southern South America
Bar-tailed Godwit Limosa lapponica
MN;coastal intertidal
3 0 X 100 100 Population change status unknown. Determine status, then halt and reverse any decline.
Habitat loss not estimated -- most winter in New Zealand
Marbled Godwit L. fedoa beringiae (Alaska)
MN;coastal intertidal
3 ? 2 2 Population change status unknown. Determine status, then halt and reverse any decline.
L. f. fedoa (Gt. Plains)
MN; inland wetland & coastal intertidal
4 35% ? 1900 168 258.5 Restoration goal based on 35% increase (commensurate with habitat loss); halt declines, determine
Breeding habitat loss prob. > 35% (Page & Gill 1994); intertidal habitat loss not estimated -- many may winter in Mexico and northern
37
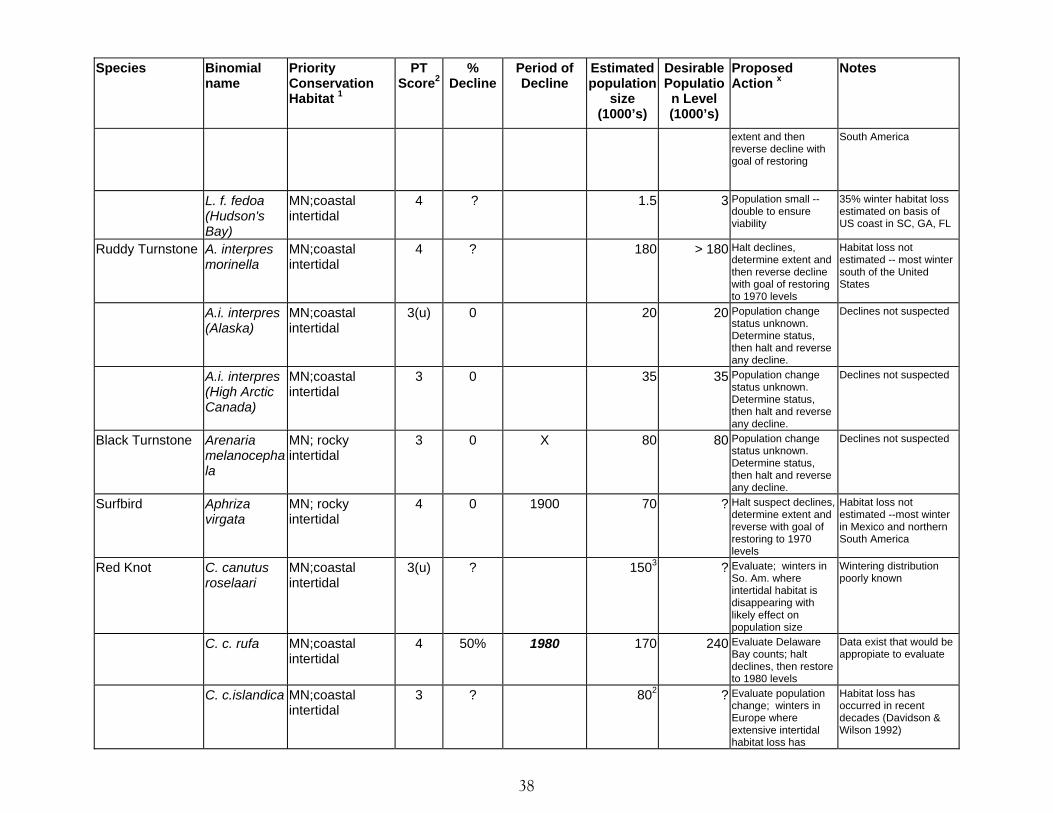
Species Binomial name
Priority Conservation Habitat 1
PT Score2
% Decline
Period of Decline
Estimated population
size (1000’s)
Desirable Population Level (1000’s)
Proposed Action x
Notes
extent and then reverse decline with goal of restoring
South America
L. f. fedoa (Hudson's Bay)
MN;coastal intertidal
4 ? 1.5 3 Population small -- double to ensure viability
35% winter habitat loss estimated on basis of US coast in SC, GA, FL
Ruddy Turnstone A. interpres morinella
MN;coastal intertidal
4 ? 180 > 180 Halt declines, determine extent and then reverse decline with goal of restoring to 1970 levels
Habitat loss not estimated -- most winter south of the United States
A.i. interpres (Alaska)
MN;coastal intertidal
3(u) 0 20 20 Population change status unknown. Determine status, then halt and reverse any decline.
Declines not suspected
A.i. interpres (High Arctic Canada)
MN;coastal intertidal
3 0 35 35 Population change status unknown. Determine status, then halt and reverse any decline.
Declines not suspected
Black Turnstone Arenaria melanocephala
MN; rocky intertidal
3 0 X 80 80 Population change status unknown. Determine status, then halt and reverse any decline.
Declines not suspected
Surfbird Aphriza virgata
MN; rocky intertidal
4 0 1900 70 ? Halt suspect declines, determine extent and reverse with goal of restoring to 1970 levels
Habitat loss not estimated --most winter in Mexico and northern South America
Red Knot C. canutus roselaari
MN;coastal intertidal
3(u) ? 1503 ? Evaluate; winters in So. Am. where intertidal habitat is disappearing with likely effect on population size
Wintering distribution poorly known
C. c. rufa MN;coastal intertidal
4 50% 1980 170 240 Evaluate Delaware Bay counts; halt declines, then restore to 1980 levels
Data exist that would be appropiate to evaluate
C. c.islandica MN;coastal intertidal
3 ? 802 ? Evaluate population change; winters in Europe where extensive intertidal habitat loss has
Habitat loss has occurred in recent decades (Davidson & Wilson 1992)
38
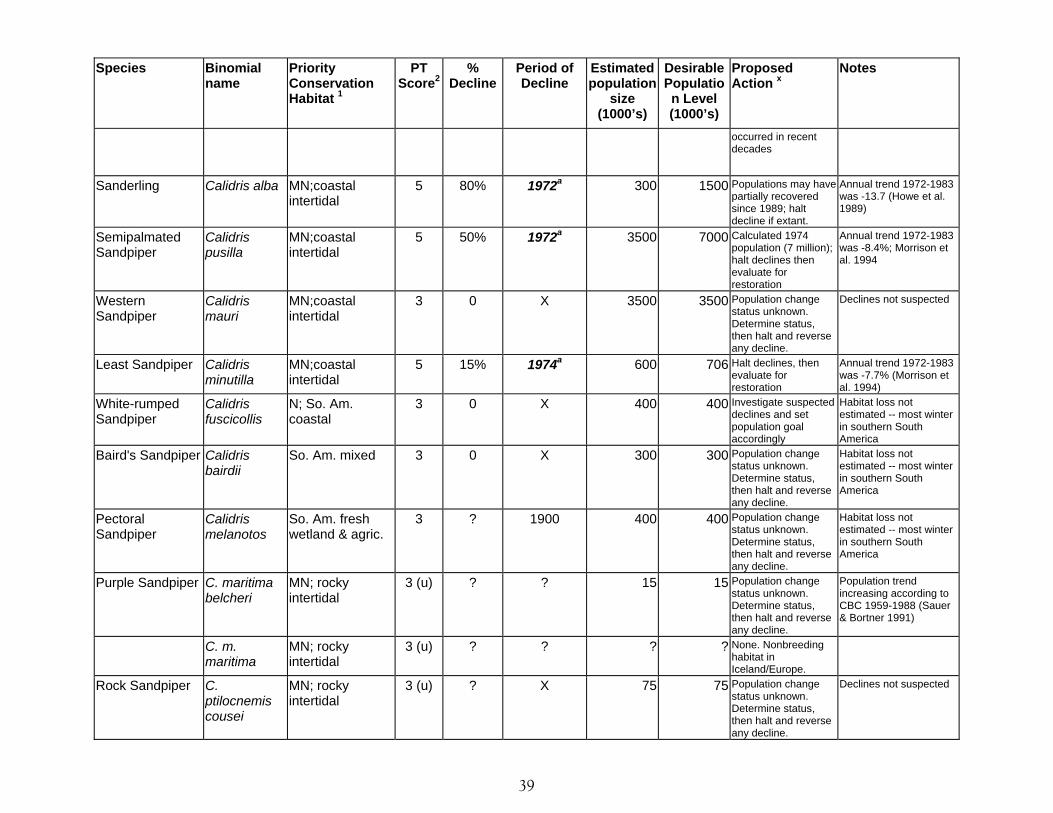
Species Binomial name
Priority Conservation Habitat 1
PT Score2
% Decline
Period of Decline
Estimated population
size (1000’s)
Desirable Population Level (1000’s)
Proposed Action x
Notes
occurred in recent decades
Sanderling Calidris alba MN;coastal intertidal
5 80% 1972a 300 1500 Populations may have partially recovered since 1989; halt decline if extant.
Annual trend 1972-1983 was -13.7 (Howe et al. 1989)
Semipalmated Sandpiper
Calidris pusilla
MN;coastal intertidal
5 50% 1972a 3500 7000 Calculated 1974 population (7 million); halt declines then evaluate for restoration
Annual trend 1972-1983 was -8.4%; Morrison et al. 1994
Western Sandpiper
Calidris mauri
MN;coastal intertidal
3 0 X 3500 3500 Population change status unknown. Determine status, then halt and reverse any decline.
Declines not suspected
Least Sandpiper Calidris minutilla
MN;coastal intertidal
5 15% 1974a 600 706 Halt declines, then evaluate for restoration
Annual trend 1972-1983 was -7.7% (Morrison et al. 1994)
White-rumped Sandpiper
Calidris fuscicollis
N; So. Am. coastal
3 0 X 400 400 Investigate suspected declines and set population goal accordingly
Habitat loss not estimated -- most winter in southern South America
Baird's Sandpiper Calidris bairdii
So. Am. mixed 3 0 X 300 300 Population change status unknown. Determine status, then halt and reverse any decline.
Habitat loss not estimated -- most winter in southern South America
Pectoral Sandpiper
Calidris melanotos
So. Am. fresh wetland & agric.
3 ? 1900 400 400 Population change status unknown. Determine status, then halt and reverse any decline.
Habitat loss not estimated -- most winter in southern South America
Purple Sandpiper C. maritima belcheri
MN; rocky intertidal
3 (u) ? ? 15 15 Population change status unknown. Determine status, then halt and reverse any decline.
Population trend increasing according to CBC 1959-1988 (Sauer & Bortner 1991)
C. m. maritima
MN; rocky intertidal
3 (u) ? ? ? ? None. Nonbreeding habitat in Iceland/Europe.
Rock Sandpiper C. ptilocnemis cousei
MN; rocky intertidal
3 (u) ? X 75 75 Population change status unknown. Determine status, then halt and reverse any decline.
Declines not suspected
39
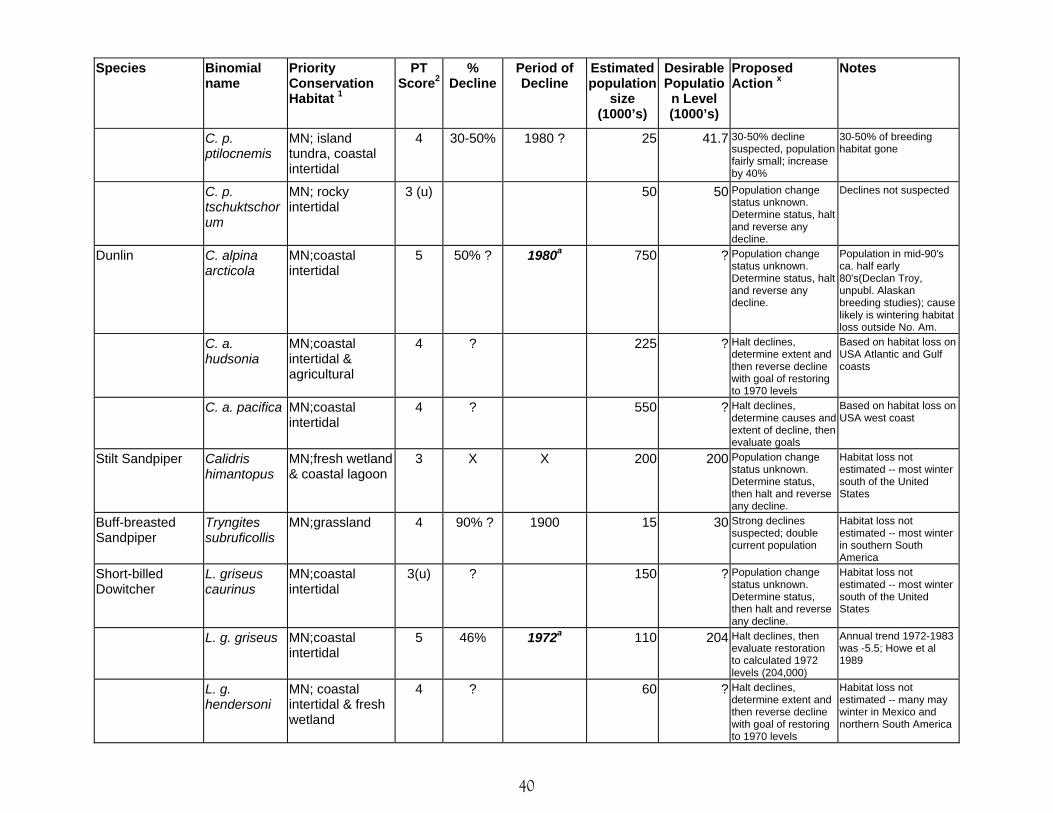
Species Binomial name
Priority Conservation Habitat 1
PT Score2
% Decline
Period of Decline
Estimated population
size (1000’s)
Desirable Population Level (1000’s)
Proposed Action x
Notes
C. p. ptilocnemis
MN; island tundra, coastal intertidal
4 30-50% 1980 ? 25 41.7 30-50% decline suspected, population fairly small; increase by 40%
30-50% of breeding habitat gone
C. p. tschuktschorum
MN; rocky intertidal
3 (u) 50 50 Population change status unknown. Determine status, halt and reverse any decline.
Declines not suspected
Dunlin C. alpina arcticola
MN;coastal intertidal
5 50% ? 1980a 750 ? Population change status unknown. Determine status, halt and reverse any decline.
Population in mid-90's ca. half early 80's(Declan Troy, unpubl. Alaskan breeding studies); cause likely is wintering habitat loss outside No. Am.
C. a. hudsonia
MN;coastal intertidal & agricultural
4 ? 225 ? Halt declines, determine extent and then reverse decline with goal of restoring to 1970 levels
Based on habitat loss on USA Atlantic and Gulf coasts
C. a. pacifica MN;coastal intertidal
4 ? 550 ? Halt declines, determine causes and extent of decline, then evaluate goals
Based on habitat loss on USA west coast
Stilt Sandpiper Calidris himantopus
MN;fresh wetland & coastal lagoon
3 X X 200 200 Population change status unknown. Determine status, then halt and reverse any decline.
Habitat loss not estimated -- most winter south of the United States
Buff-breasted Sandpiper
Tryngites subruficollis
MN;grassland 4 90% ? 1900 15 30 Strong declines suspected; double current population
Habitat loss not estimated -- most winter in southern South America
Short-billed Dowitcher
L. griseus caurinus
MN;coastal intertidal
3(u) ? 150 ? Population change status unknown. Determine status, then halt and reverse any decline.
Habitat loss not estimated -- most winter south of the United States
L. g. griseus MN;coastal intertidal
5 46% 1972a 110 204 Halt declines, then evaluate restoration to calculated 1972 levels (204,000)
Annual trend 1972-1983 was -5.5; Howe et al 1989
L. g. hendersoni
MN; coastal intertidal & fresh wetland
4 ? 60 ? Halt declines, determine extent and then reverse decline with goal of restoring to 1970 levels
Habitat loss not estimated -- many may winter in Mexico and northern South America
40
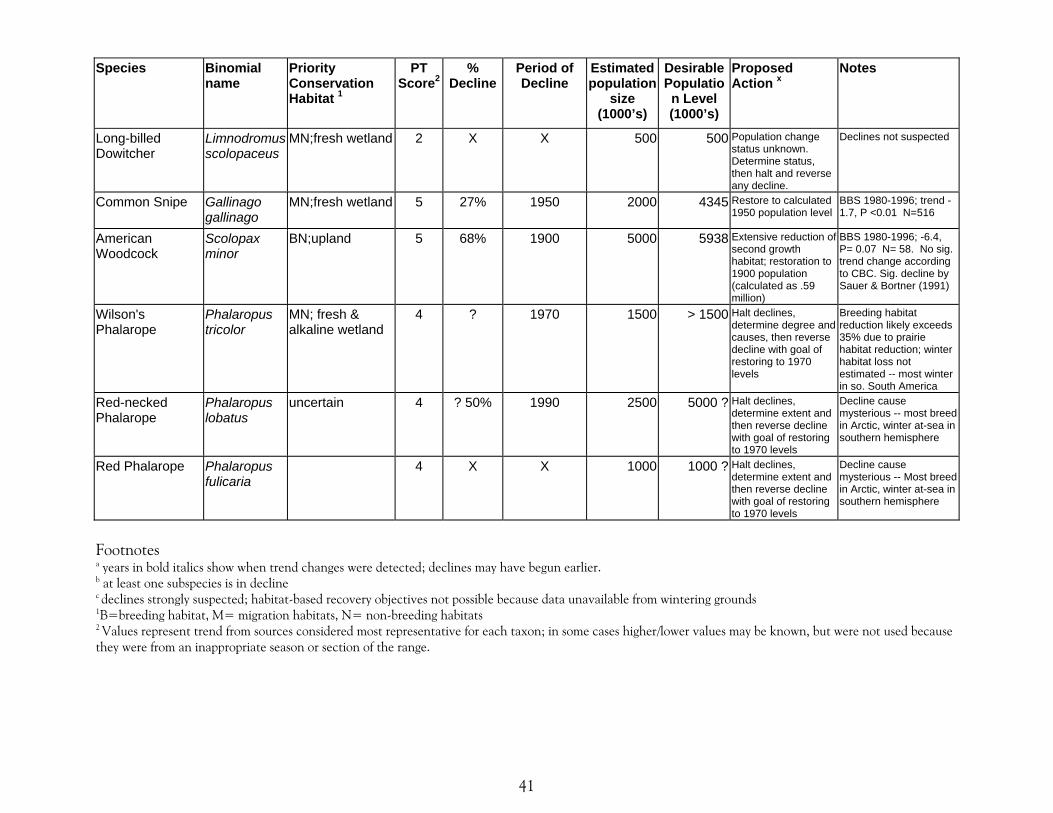
Species Binomial name
Priority Conservation Habitat 1
PT Score2
% Decline
Period of Decline
Estimated population
size (1000’s)
Desirable Population Level (1000’s)
Proposed Action x
Notes
Long-billed Dowitcher
Limnodromus scolopaceus
MN;fresh wetland 2 X X 500 500 Population change status unknown. Determine status, then halt and reverse any decline.
Declines not suspected
Common Snipe Gallinago gallinago
MN;fresh wetland 5 27% 1950 2000 4345 Restore to calculated 1950 population level
BBS 1980-1996; trend -1.7, P <0.01 N=516
American Woodcock
Scolopax minor
BN;upland 5 68% 1900 5000 5938 Extensive reduction of second growth habitat; restoration to 1900 population (calculated as .59 million)
BBS 1980-1996; -6.4, P= 0.07 N= 58. No sig. trend change according to CBC. Sig. decline by Sauer & Bortner (1991)
Wilson's Phalarope
Phalaropus tricolor
MN; fresh & alkaline wetland
4 ? 1970 1500 > 1500 Halt declines, determine degree and causes, then reverse decline with goal of restoring to 1970 levels
Breeding habitat reduction likely exceeds 35% due to prairie habitat reduction; winter habitat loss not estimated -- most winter in so. South America
Red-necked Phalarope
Phalaropus lobatus
uncertain 4 ? 50% 1990 2500 5000 ? Halt declines, determine extent and then reverse decline with goal of restoring to 1970 levels
Decline cause mysterious -- most breed in Arctic, winter at-sea in southern hemisphere
Red Phalarope Phalaropus fulicaria
4 X X 1000 1000 ? Halt declines, determine extent and then reverse decline with goal of restoring to 1970 levels
Decline cause mysterious -- Most breed in Arctic, winter at-sea in southern hemisphere
Footnotes a years in bold italics show when trend changes were detected; declines may have begun earlier. b at least one subspecies is in decline c declines strongly suspected; habitat-based recovery objectives not possible because data unavailable from wintering grounds 1B=breeding habitat, M= migration habitats, N= non-breeding habitats 2 Values represent trend from sources considered most representative for each taxon; in some cases higher/lower values may be known, but were not used because they were from an inappropriate season or section of the range.
41
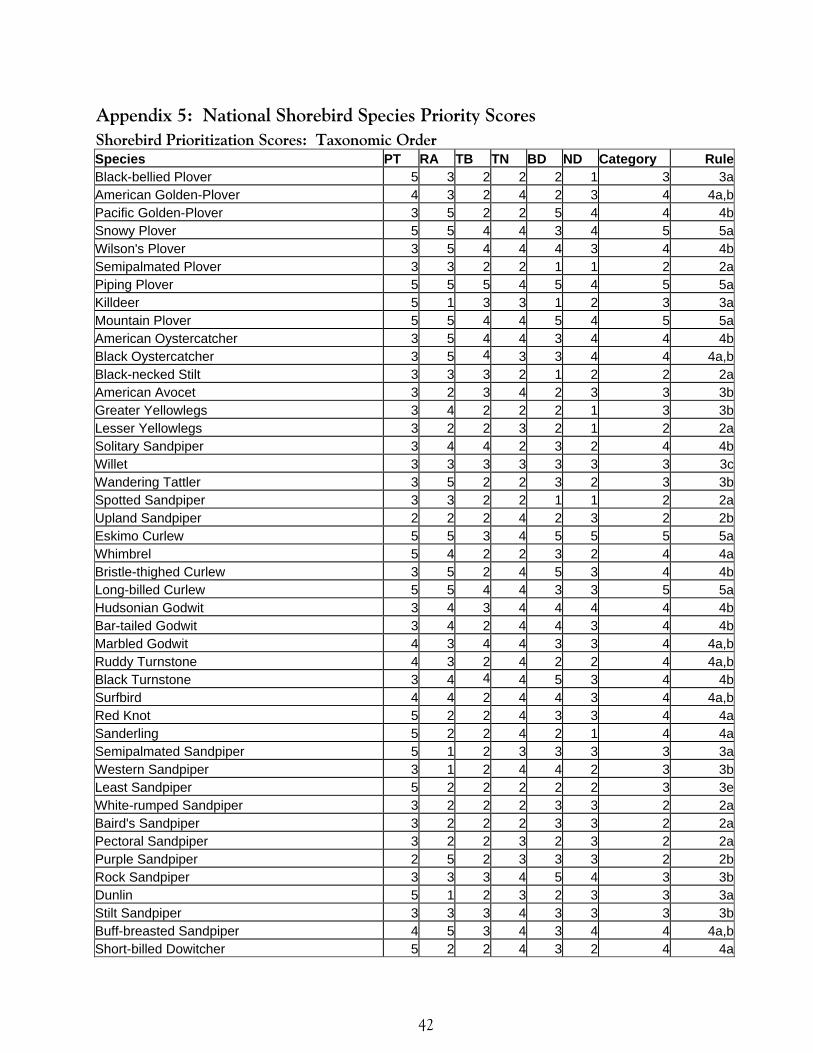
42
Appendix 5: National Shorebird Species Priority Scores Shorebird Prioritization Scores: Taxonomic Order Species PT RA TB TN BD ND Category RuleBlack-bellied Plover 5 3 2 2 2 1 3 3aAmerican Golden-Plover 4 3 2 4 2 3 4 4a,bPacific Golden-Plover 3 5 2 2 5 4 4 4bSnowy Plover 5 5 4 4 3 4 5 5aWilson's Plover 3 5 4 4 4 3 4 4bSemipalmated Plover 3 3 2 2 1 1 2 2aPiping Plover 5 5 5 4 5 4 5 5aKilldeer 5 1 3 3 1 2 3 3aMountain Plover 5 5 4 4 5 4 5 5aAmerican Oystercatcher 3 5 4 4 3 4 4 4bBlack Oystercatcher 3 5 4 3 3 4 4 4a,bBlack-necked Stilt 3 3 3 2 1 2 2 2aAmerican Avocet 3 2 3 4 2 3 3 3bGreater Yellowlegs 3 4 2 2 2 1 3 3bLesser Yellowlegs 3 2 2 3 2 1 2 2aSolitary Sandpiper 3 4 4 2 3 2 4 4bWillet 3 3 3 3 3 3 3 3cWandering Tattler 3 5 2 2 3 2 3 3bSpotted Sandpiper 3 3 2 2 1 1 2 2aUpland Sandpiper 2 2 2 4 2 3 2 2bEskimo Curlew 5 5 3 4 5 5 5 5aWhimbrel 5 4 2 2 3 2 4 4aBristle-thighed Curlew 3 5 2 4 5 3 4 4bLong-billed Curlew 5 5 4 4 3 3 5 5aHudsonian Godwit 3 4 3 4 4 4 4 4bBar-tailed Godwit 3 4 2 4 4 3 4 4bMarbled Godwit 4 3 4 4 3 3 4 4a,bRuddy Turnstone 4 3 2 4 2 2 4 4a,bBlack Turnstone 3 4 4 4 5 3 4 4bSurfbird 4 4 2 4 4 3 4 4a,bRed Knot 5 2 2 4 3 3 4 4aSanderling 5 2 2 4 2 1 4 4aSemipalmated Sandpiper 5 1 2 3 3 3 3 3aWestern Sandpiper 3 1 2 4 4 2 3 3bLeast Sandpiper 5 2 2 2 2 2 3 3eWhite-rumped Sandpiper 3 2 2 2 3 3 2 2aBaird's Sandpiper 3 2 2 2 3 3 2 2aPectoral Sandpiper 3 2 2 3 2 3 2 2aPurple Sandpiper 2 5 2 3 3 3 2 2bRock Sandpiper 3 3 3 4 5 4 3 3bDunlin 5 1 2 3 2 3 3 3aStilt Sandpiper 3 3 3 4 3 3 3 3bBuff-breasted Sandpiper 4 5 3 4 3 4 4 4a,bShort-billed Dowitcher 5 2 2 4 3 2 4 4a
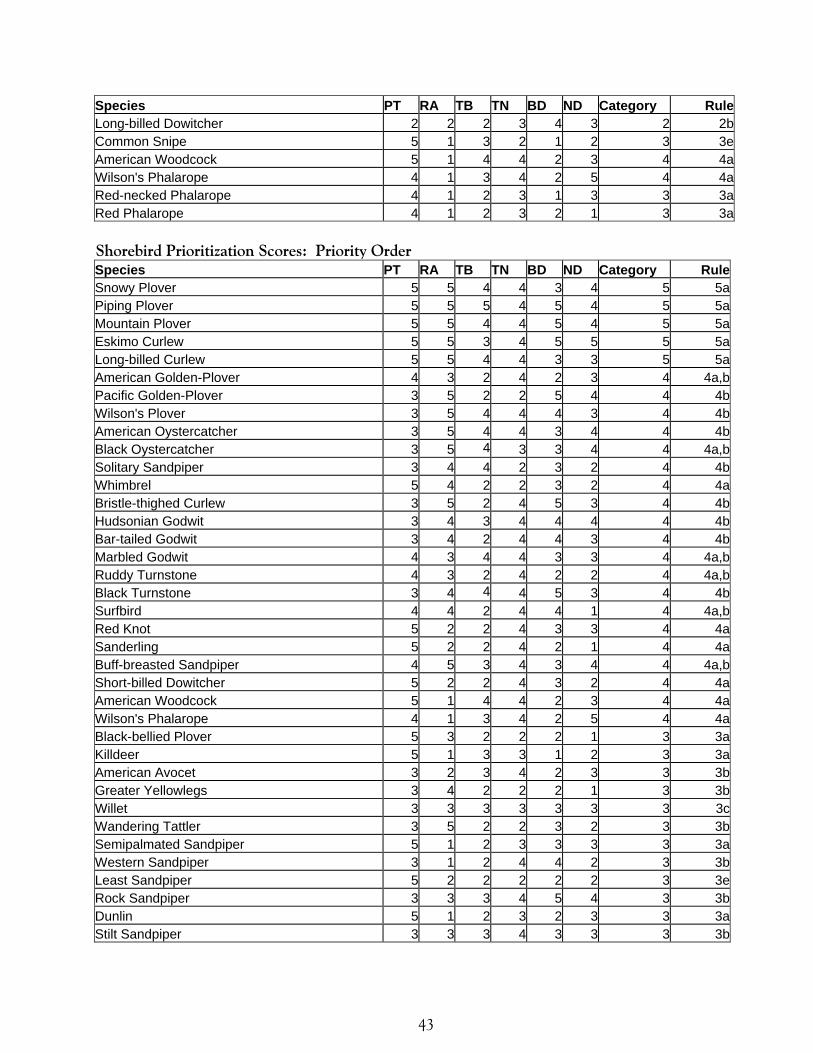
Species PT RA TB TN BD ND Category RuleLong-billed Dowitcher 2 2 2 3 4 3 2 2bCommon Snipe 5 1 3 2 1 2 3 3eAmerican Woodcock 5 1 4 4 2 3 4 4aWilson's Phalarope 4 1 3 4 2 5 4 4aRed-necked Phalarope 4 1 2 3 1 3 3 3aRed Phalarope 4 1 2 3 2 1 3 3a Shorebird Prioritization Scores: Priority Order Species PT RA TB TN BD ND Category RuleSnowy Plover 5 5 4 4 3 4 5 5aPiping Plover 5 5 5 4 5 4 5 5aMountain Plover 5 5 4 4 5 4 5 5aEskimo Curlew 5 5 3 4 5 5 5 5aLong-billed Curlew 5 5 4 4 3 3 5 5aAmerican Golden-Plover 4 3 2 4 2 3 4 4a,bPacific Golden-Plover 3 5 2 2 5 4 4 4bWilson's Plover 3 5 4 4 4 3 4 4bAmerican Oystercatcher 3 5 4 4 3 4 4 4bBlack Oystercatcher 3 5 4 3 3 4 4 4a,bSolitary Sandpiper 3 4 4 2 3 2 4 4bWhimbrel 5 4 2 2 3 2 4 4aBristle-thighed Curlew 3 5 2 4 5 3 4 4bHudsonian Godwit 3 4 3 4 4 4 4 4bBar-tailed Godwit 3 4 2 4 4 3 4 4bMarbled Godwit 4 3 4 4 3 3 4 4a,bRuddy Turnstone 4 3 2 4 2 2 4 4a,bBlack Turnstone 3 4 4 4 5 3 4 4bSurfbird 4 4 2 4 4 1 4 4a,bRed Knot 5 2 2 4 3 3 4 4aSanderling 5 2 2 4 2 1 4 4aBuff-breasted Sandpiper 4 5 3 4 3 4 4 4a,bShort-billed Dowitcher 5 2 2 4 3 2 4 4aAmerican Woodcock 5 1 4 4 2 3 4 4aWilson's Phalarope 4 1 3 4 2 5 4 4aBlack-bellied Plover 5 3 2 2 2 1 3 3aKilldeer 5 1 3 3 1 2 3 3aAmerican Avocet 3 2 3 4 2 3 3 3bGreater Yellowlegs 3 4 2 2 2 1 3 3bWillet 3 3 3 3 3 3 3 3cWandering Tattler 3 5 2 2 3 2 3 3bSemipalmated Sandpiper 5 1 2 3 3 3 3 3aWestern Sandpiper 3 1 2 4 4 2 3 3bLeast Sandpiper 5 2 2 2 2 2 3 3eRock Sandpiper 3 3 3 4 5 4 3 3bDunlin 5 1 2 3 2 3 3 3aStilt Sandpiper 3 3 3 4 3 3 3 3b
43
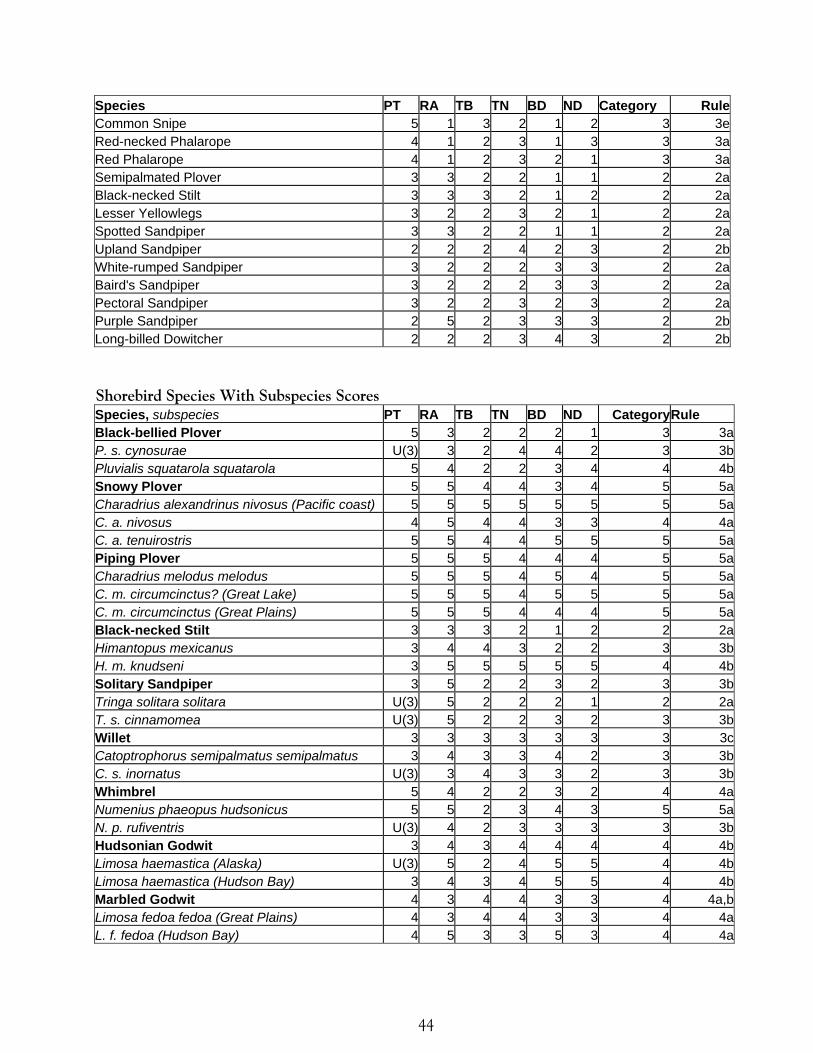
Species PT RA TB TN BD ND Category RuleCommon Snipe 5 1 3 2 1 2 3 3eRed-necked Phalarope 4 1 2 3 1 3 3 3aRed Phalarope 4 1 2 3 2 1 3 3aSemipalmated Plover 3 3 2 2 1 1 2 2aBlack-necked Stilt 3 3 3 2 1 2 2 2aLesser Yellowlegs 3 2 2 3 2 1 2 2aSpotted Sandpiper 3 3 2 2 1 1 2 2aUpland Sandpiper 2 2 2 4 2 3 2 2bWhite-rumped Sandpiper 3 2 2 2 3 3 2 2aBaird's Sandpiper 3 2 2 2 3 3 2 2aPectoral Sandpiper 3 2 2 3 2 3 2 2aPurple Sandpiper 2 5 2 3 3 3 2 2bLong-billed Dowitcher 2 2 2 3 4 3 2 2b Shorebird Species With Subspecies Scores Species, subspecies PT RA TB TN BD ND CategoryRule Black-bellied Plover 5 3 2 2 2 1 3 3aP. s. cynosurae U(3) 3 2 4 4 2 3 3bPluvialis squatarola squatarola 5 4 2 2 3 4 4 4bSnowy Plover 5 5 4 4 3 4 5 5aCharadrius alexandrinus nivosus (Pacific coast) 5 5 5 5 5 5 5 5aC. a. nivosus 4 5 4 4 3 3 4 4aC. a. tenuirostris 5 5 4 4 5 5 5 5aPiping Plover 5 5 5 4 4 4 5 5aCharadrius melodus melodus 5 5 5 4 5 4 5 5aC. m. circumcinctus? (Great Lake) 5 5 5 4 5 5 5 5aC. m. circumcinctus (Great Plains) 5 5 5 4 4 4 5 5aBlack-necked Stilt 3 3 3 2 1 2 2 2aHimantopus mexicanus 3 4 4 3 2 2 3 3bH. m. knudseni 3 5 5 5 5 5 4 4bSolitary Sandpiper 3 5 2 2 3 2 3 3bTringa solitara solitara U(3) 5 2 2 2 1 2 2aT. s. cinnamomea U(3) 5 2 2 3 2 3 3bWillet 3 3 3 3 3 3 3 3cCatoptrophorus semipalmatus semipalmatus 3 4 3 3 4 2 3 3bC. s. inornatus U(3) 3 4 3 3 2 3 3bWhimbrel 5 4 2 2 3 2 4 4aNumenius phaeopus hudsonicus 5 5 2 3 4 3 5 5aN. p. rufiventris U(3) 4 2 3 3 3 3 3bHudsonian Godwit 3 4 3 4 4 4 4 4bLimosa haemastica (Alaska) U(3) 5 2 4 5 5 4 4bLimosa haemastica (Hudson Bay) 3 4 3 4 5 5 4 4bMarbled Godwit 4 3 4 4 3 3 4 4a,bLimosa fedoa fedoa (Great Plains) 4 3 4 4 3 3 4 4aL. f. fedoa (Hudson Bay) 4 5 3 3 5 3 4 4a
44
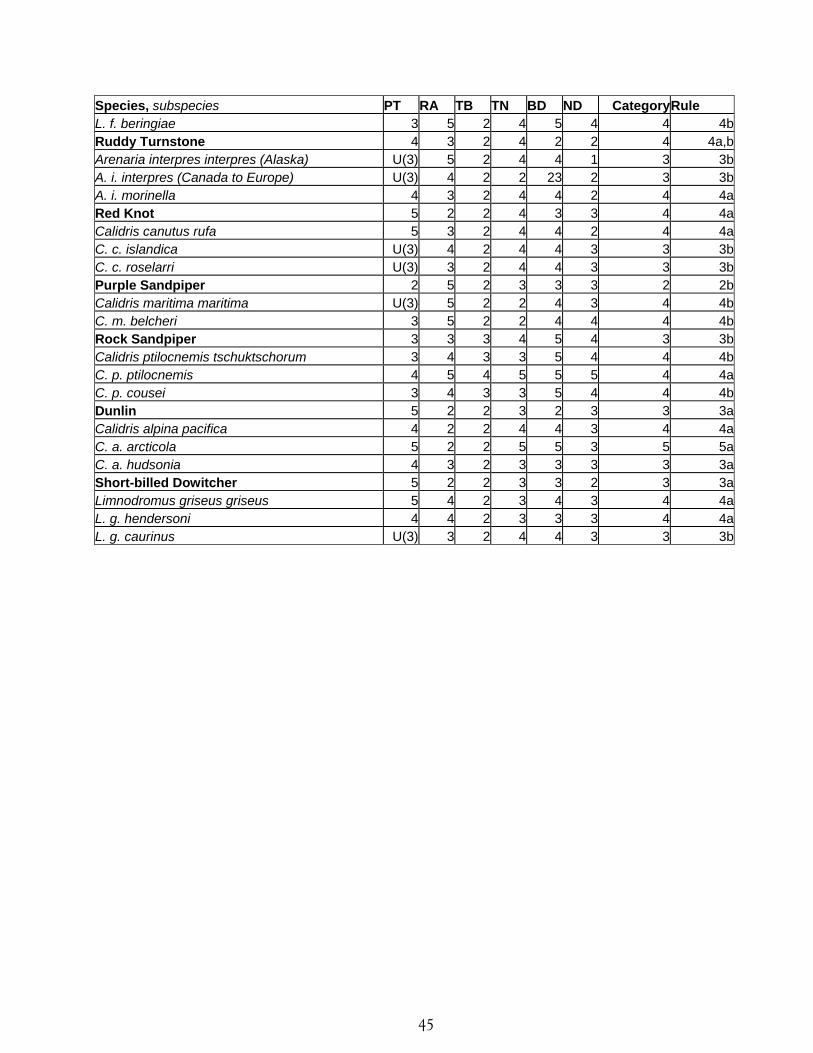
Species, subspecies PT RA TB TN BD ND CategoryRule L. f. beringiae 3 5 2 4 5 4 4 4bRuddy Turnstone 4 3 2 4 2 2 4 4a,bArenaria interpres interpres (Alaska) U(3) 5 2 4 4 1 3 3bA. i. interpres (Canada to Europe) U(3) 4 2 2 23 2 3 3bA. i. morinella 4 3 2 4 4 2 4 4aRed Knot 5 2 2 4 3 3 4 4aCalidris canutus rufa 5 3 2 4 4 2 4 4aC. c. islandica U(3) 4 2 4 4 3 3 3bC. c. roselarri U(3) 3 2 4 4 3 3 3bPurple Sandpiper 2 5 2 3 3 3 2 2bCalidris maritima maritima U(3) 5 2 2 4 3 4 4bC. m. belcheri 3 5 2 2 4 4 4 4bRock Sandpiper 3 3 3 4 5 4 3 3bCalidris ptilocnemis tschuktschorum 3 4 3 3 5 4 4 4bC. p. ptilocnemis 4 5 4 5 5 5 4 4aC. p. cousei 3 4 3 3 5 4 4 4bDunlin 5 2 2 3 2 3 3 3aCalidris alpina pacifica 4 2 2 4 4 3 4 4aC. a. arcticola 5 2 2 5 5 3 5 5aC. a. hudsonia 4 3 2 3 3 3 3 3aShort-billed Dowitcher 5 2 2 3 3 2 3 3aLimnodromus griseus griseus 5 4 2 3 4 3 4 4aL. g. hendersoni 4 4 2 3 3 3 4 4aL. g. caurinus U(3) 3 2 4 4 3 3 3b
45
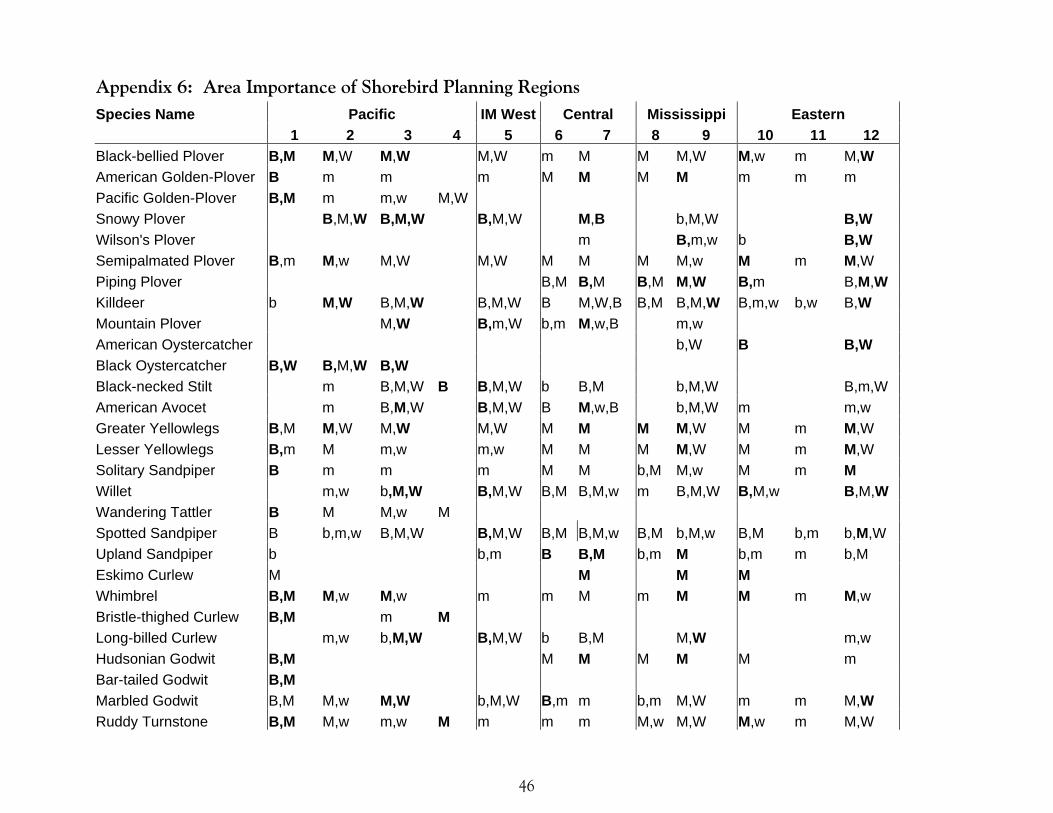
46
Appendix 6: Area Importance of Shorebird Planning Regions Species Name Pacific IM West Central Mississippi Eastern 1 2 3 4 5 6 7 8 9 10 11 12 Black-bellied Plover B,M M,W M,W M,W m M M M,W M,w m M,W American Golden-Plover B m m m M M M M m m m Pacific Golden-Plover B,M m m,w M,W Snowy Plover B,M,W B,M,W B,M,W M,B b,M,W B,W Wilson's Plover m B,m,w b B,W Semipalmated Plover B,m M,w M,W M,W M M M M,w M m M,W Piping Plover B,M B,M B,M M,W B,m B,M,W Killdeer b M,W B,M,W B,M,W B M,W,B B,M B,M,W B,m,w b,w B,W Mountain Plover M,W B,m,W b,m M,w,B m,w American Oystercatcher b,W B B,W Black Oystercatcher B,W B,M,W B,W Black-necked Stilt m B,M,W B B,M,W b B,M b,M,W B,m,W American Avocet m B,M,W B,M,W B M,w,B b,M,W m m,w Greater Yellowlegs B,M M,W M,W M,W M M M M,W M m M,W Lesser Yellowlegs B,m M m,w m,w M M M M,W M m M,W Solitary Sandpiper B m m m M M b,M M,w M m M Willet m,w b,M,W B,M,W B,M B,M,w m B,M,W B,M,w B,M,W Wandering Tattler B M M,w M Spotted Sandpiper B b,m,w B,M,W B,M,W B,M B,M,w B,M b,M,w B,M b,m b,M,W Upland Sandpiper b b,m B B,M b,m M b,m m b,M Eskimo Curlew M M M M Whimbrel B,M M,w M,w m m M m M M m M,w Bristle-thighed Curlew B,M m M Long-billed Curlew m,w b,M,W B,M,W b B,M M,W m,w Hudsonian Godwit B,M M M M M M m Bar-tailed Godwit B,M Marbled Godwit B,M M,w M,W b,M,W B,m m b,m M,W m m M,W Ruddy Turnstone B,M M,w m,w M m m m M,w M,W M,w m M,W
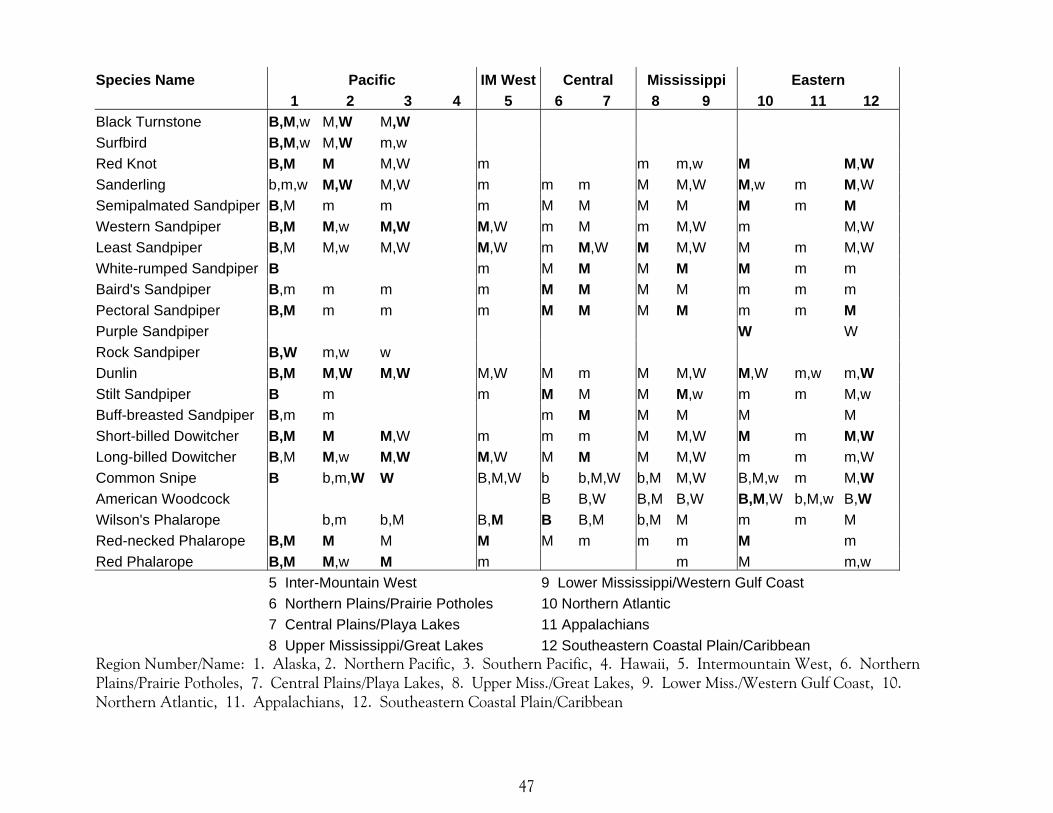
Species Name Pacific IM West Central Mississippi Eastern 1 2 3 4 5 6 7 8 9 10 11 12 Black Turnstone B,M,w M,W M,W Surfbird B,M,w M,W m,w Red Knot B,M M M,W m m m,w M M,W Sanderling b,m,w M,W M,W m m m M M,W M,w m M,W Semipalmated Sandpiper B,M m m m M M M M M m M Western Sandpiper B,M M,w M,W M,W m M m M,W m M,W Least Sandpiper B,M M,w M,W M,W m M,W M M,W M m M,W White-rumped Sandpiper B m M M M M M m m Baird's Sandpiper B,m m m m M M M M m m m Pectoral Sandpiper B,M m m m M M M M m m M Purple Sandpiper W W Rock Sandpiper B,W m,w w Dunlin B,M M,W M,W M,W M m M M,W M,W m,w m,W Stilt Sandpiper B m m M M M M,w m m M,w Buff-breasted Sandpiper B,m m m M M M M M Short-billed Dowitcher B,M M M,W m m m M M,W M m M,W Long-billed Dowitcher B,M M,w M,W M,W M M M M,W m m m,W Common Snipe B b,m,W W B,M,W b b,M,W b,M M,W B,M,w m M,W American Woodcock B B,W B,M B,W B,M,W b,M,w B,W Wilson's Phalarope b,m b,M B,M B B,M b,M M m m M Red-necked Phalarope B,M M M M M m m m M m Red Phalarope B,M M,w M m m M m,w 5 Inter-Mountain West 9 Lower Mississippi/Western Gulf Coast 6 Northern Plains/Prairie Potholes 10 Northern Atlantic
7 Central Plains/Playa Lakes 11 Appalachians 8 Upper Mississippi/Great Lakes 12 Southeastern Coastal Plain/Caribbean
Region Number/Name: 1. Alaska, 2. Northern Pacific, 3. Southern Pacific, 4. Hawaii, 5. Intermountain West, 6. Northern Plains/Prairie Potholes, 7. Central Plains/Playa Lakes, 8. Upper Miss./Great Lakes, 9. Lower Miss./Western Gulf Coast, 10. Northern Atlantic, 11. Appalachians, 12. Southeastern Coastal Plain/Caribbean
47
48
Appendix 7: Area Importance of Bird Conservation Regions See draft table at http://www.manomet.org/USSCP/files.htm Filename BCRSCORES
Literature Cited American Ornithologist’s Union. 1957. Check-list of North American Birds. 5th ed. Washington, D.C.
Beissinger, S.R., J.M. Reed, J.M. Wunderle Jr., S.K. Robinson, and D.M. Finch. 2000. Report of the AOU Conservation Committee on the Partners In Flight species prioritization plan. Auk 117(2):549-561.
Bent, A.C. 1929. Life histories of North American shorebirds. Vol. 2. U.S. National Museum Bulletin No. 146.
Blanco, D.E. and Canevari, P. Identifying wetlands of critical value to shorebirds in South America. An updated panorama about distribution and numbers. 66 pp. Wetlands for the Americas, Buenos Aires, Argentina.
Brousseau, P. 1981. Distribution et abondance des oiseaux de rivage le long du Saint-Laurent. Canadian Wildlife Service Report, 132 pp. Canadian Wildlife Service, Quebec City, Quebec.
Carter, M.F., W.C. Hunter, D.N. Pashley, and K.V. Rosenberg. 2000. Setting conservation priorities for landbirds in the United States: The Partners In Flight approach. Auk 117(2):541-548.
Clark, K. E., Niles, L. J., and Burger, J. 1993. Abundance and distribution of migrant shorebirds in Delaware Bay. Condor 95: 694-705.
Conover, H. B. 1944. The North Pacific allies of the Purple Sandpiper. Zoological. Ser., Field Museum of Natural History 29:169-179.
Cramp, S., and K. E. L. Simmons. 1983. The birds of the western Palearctic. Vol. III. Oxford University Press, Oxford.
Davidson, N. C. and J. R. Wilson. 1992. The migration system of European-wintering Knots Calidris canutus islandica. Wader Study Group Bull. 64, Suppl.:39-51.
Engelmoer, M., and C. S. Roselaar. 1998. Geographical variation in waders. Kluwer Academic Publishers, Dortrecht.
Engilis, A., Oring, L. W., Carrera, E., Nelson, J. W, and Lopez, A. M. 1998. Shorebird surveys in Ensenada Pabellones and Bahia Santa Maria, Sinaloa, Mexico: critical winter habitats for Pacific Flyway shorebirds. Wilson Bulletin 110: 332-341.
Frazier, S. 1996. An Overview of the World's Ramsar Sites. Wetlands International Publication No. 39. 58 pp. Wetlands International, Slimbridge.
Gerber, L. R., and D. P. DeMaster. 1999. A quantitative approach to endangered species act classification of long-lived vertebrates: application to the North Pacific Humpback Whale. Cons. Bio. 13:1203-1214.
Gibson, D. D., and B. Kessel. 1989. Geographic variations in the Marbled Godwit and description of an Alaska subspecies. Condor 91:436-443.
Gibson, D. D., and B. Kessel. 1997. Inventory of the species and subspecies of Alaska birds. Western Birds 28:45-95.
49
Gill, R. E. and Handel, C. M. 1990. The importance of subarctic intertidal habitats to shorebirds: a study of the central Yukon-Kuskokwim Delta, Alaska. Condor 9: 709-725.
Gill, R.E., Tibbitts, T.L., and Handel, C.M. 1999. Profiles of Potential Western Hemisphere Shorebird Reserve Network Sites in Alaska. Unpublished Report. 134 pp. Alaska Biological Science Center, U.S. Geological Survey, Anchorage.
Goosen, J. P., Amirault, D. L., Arndt, J. E., Boates, S., Brazil, J., Bjorge, R., Brechtel, S., Corbett, G. N., Curley, F. R., Flemming, S. P., Harris, W., Heyens, L., Hjertaas, D., Huot, M., Jones, R., Koonz, W., Laporte, P., McAskill, D., Morrison, R. I. G., Richard, S. G., and Wiltse, E. 1997. Revised Canadian Piping Plover Recovery Plan (Draft). 50 pp. Recovery of Nationally Endangered Wildlife, Canadian Nature Federation, Ottawa.
Gratto-Trevor, C. L. In press. Marbled Godwit (Limosa fedoa). In The Birds of North America (A. Poole and F. Gill, Eds.). Philadelphia: The Academy of Natural Sciences; Washington D. C.: The American Ornithologists' Union.
Haig, S. M. 1992. Piping Plover (Charadrius melodus). In The Birds of North America No. 2 (A. Poole and F. Gill, Eds.). Philadelphia: The Academy of Natural Sciences; Washington D. C.: The American Ornithologists' Union.
Haig, S. M., C. L. Gratto-Trevor, T. D. Mullins, and M. A. Colwell. 1997. Population identification of western hemisphere shorebirds throughout the annual cycle. Mol. Ecol. 6:203-215.
Harrington, B. A. 1993a. A coastal, aerial winter shorebird survey in Sonora and Sinaloa, Mexico, January 1993. Manomet Observatory for Conservation Sciences, Manomet, Massachusetts.
Harrington, B. A. 1993b. A coastal, aerial winter shorebird survey on the Sonora and Sinaloa coasts of Mexico. Wader Study Group Bulletin 67: 44-49.
Harrington, B. A. 1994. A coastal, aerial winter shorebird survey in Sonora, Sinaloa, and Nayarit, Mexico, January 1994. Manomet Observatory for Conservation Sciences, Manomet, Massachusetts.
Harrington, B. and Perry, E. 1995. Important Shorebird Staging Sites Meeting Western Hemisphere Shorebird Reserve Network Criteria in the United States. 121 pp. U.S. Department of the Interior, Washington, D.C.
Howe, M. A. 1982. Social organization in a nesting population of eastern Willets (Catoptrophorus semipalmatus). Auk 99:88-102.
IBA 1998. The Important Bird Areas Program. Internet Web Site, address ”http://www.ibacanada.com”, updated 2 February 1998.
Islieb, M. E. 1979. Migratory shorebird populations on the Copper River Delta and eastern Prince William Sound, Alaska. Studies in Avian Biology No. 2: 125-129.
Iverson, G. C., S. E. Warnock, R. W. Butler, M. A. Bishop, And N. Warnock. 1996. Spring migration of Western Sandpipers (Calidris mauri) along the Pacific coast of North America: a telemetry study. Condor 98:10–21.
Maisonneuve, C. 1982. Distribution et abondance des oiseaux de rivage le long du Saint-Laurent. (Estuarie moyen, estuaire maritime, Gaspesie, Baie des Chaleurs, Cote Nord et Iles-de-la-
50
Madeleine). Rapport de service canadien de la faune. 81 pp. Service canadien de la faune, Ste.-Foy, Quebec.
Maisonneuve, C., Brousseau, P., and Lahoux, D. 1990. Critical fall staging sites for shorebirds migrating through the St. Lawrence system, Quebec. Canadian Field-Naturalist 104: 372-378.
MCCS (Manomet Center for Conservation Sciences) 1999. Western Hemisphere Shorebird Reserve Network Selection Criteria. Internet site: http://www.manomet.org/Wetlands/criteria.htm. (rev. 5 April 1999).
Meffe, G. K., and C. R. Carroll. 1994. Principles of conservation biology. Sinauer Associates, Inc., Sunderland, MA.
Moritz, C. 1994. Defining 'evolutionarily significant units' for conservation. TREE 9:373-375.
Morrison, R. I. G. 1984. Migration systems of some New World shorebirds. Behavior of Marine Animals 6: 125-202.
Morrison, R. I. G. 1992. Avifauna of the Ellesmere Island National Park Reserve. Canadian Wildlife Service Technical Report Series No. 158, 110 pp. Canadian Wildlife Service, Ottawa.
Morrison, R. I. G. 1993. Shorebird population status and trends in Canada. Bird Trends No. 3: 3-6. Canadian Wildlife Service, Ottawa.
Morrison, R. I. G. 1997. The use of remote sensing to evaluate shorebird habitats and populations on Prince Charles Island, Foxe Basin, Canada. Arctic 50: 55-75.
Morrison, R. I. G. and Harrington, B. A. 1979. Critical shorebird resources in James Bay and eastern North America. Pp. 498-507 in Trans. 44th N. Am. Wildl. and Nat. Resources Conf. Wildlife Management Institute, Washington, D.C.
Morrison, R. I. G. and Harrington, B. A. 1992. The migration system of the Red Knot Calidris canutus rufa in the New World. Wader Study Group Bull. 64, Suppl.: 71-84.
Morrison, R. I. G. and Ross, R. K. 1989. Atlas of Nearctic shorebirds on the coast of South America. 2 vols. 325 pp. Canadian Wildlife Service Special Publication, Ottawa.
Morrison, R. I. G., and B. A. Harrington. 1992. The migration system of the Red Knot Calidris canutus rufa in the New World. Wader Study Group Bull. 64, Suppl.:71-84.
Morrison, R. I. G., Bourget, A., Butler, R., Dickson, H. L., Gratto-Trevor, C., Hicklin, P., Hyslop, C., and Ross, R. K. 1994. A preliminary assessment of the status of shorebird populations in Canada. Can.Wildl.Serv.Progress Notes 208: 1-19.
Morrison, R. I. G., Butler, R. W., Beyersbergen, G. W., Dickson, H. L., Bourget, A., Hicklin, P. W., Goosen, J. P., Ross, R. K., and Gratto-Trevor, C. L. 1995. Potential Western Hemisphere Shorebird Reserve Network sites for shorebirds in Canada: Second Edition 1995. Canadian Wildlife Service Technical Report No. 227, 104 pp. Canadian Wildlife Service, Headquarters, Ottawa.
Morrison, R. I. G., Butler, R. W., Delgado, F. S., and Ross, R. K. 1998. Atlas of Nearctic shorebirds and other waterbirds on the coast of Panama. Canadian Wildlife Service Special Publication. 112 pp. Canadian Wildlife Service, Ottawa.
51
Morrison, R. I. G., Ross, R. K., Antas, P. T. Z., and Nascimento, I. 1997. The distribution and abundance of Nearctic and Neotropical shorebirds and other waterbirds in the Pantanal, Brasil, in October 1996. 71 pp. Unpublished Report, World Wildlife Fund, Toronto and Canadian Wildlife Service, Ottawa.
Morrison, R.I.G., R.E. Gill, B.A. Harrington, S. Skagen, G. Page, C.L. Gratto-Trevor., ms. Estimates of shorebird populations in Canada and the Western Hemisphere
Morrison, R.I.G., R.E. Gill, B.A. Harrington, S. Skagen, G. Page, C.L. Gratto-Trevor., ms. Estimates of shorebird populations in Canada and the Western Hemisphere
Moskoff, W. 1996. Solitary sandpiper (Tringa solitaria) In The Birds of North America No. 156 (A. Poole and F. Gill, Eds.). Philadelphia: The Academy of Natural Sciences; Washington D. C.: The American Ornithologists' Union.
O'Brien, S. J., and E. Mayr. 1991. Bureaucratic mischief: recognizing endangered species and subspecies. Science 25:1187-11788.
Page, G. W. and Palacios, E. 1993. Winter shorebird numbers in wetlands along the west coast of Baja California. 17 pp. Point Reyes Bird Observatory and CICESE, Stinson Beach, California and Ensenada, Mexico.
Page, G. W. and Gill, R. E. 1994. Shorebirds in western North America: late 1800s to late 1900s. Studies in Avian Biology 15: 147-160.
Page, G. W., J. S. Warriner, J. C. Warriner, and P. W. C. Paton. 1995. Snowy Plover (Charadrius alexandrinus). In The Birds of North America No. 154 (A. Poole and F. Gill, Eds.). Philadelphia: The Academy of Natural Sciences; Washington D. C.: The American Ornithologists' Union.
Page, G. W., Palacios, E., Alfaro, L., Gonzalez, S., Stenzel, L. E., and Jungers, M. 1997. Numbers of wintering shorebirds in coastal wetlands of Baja California, Mexico. J. Field Ornithol. 68: 562-574.
Page, G. W., Shuford, W. D., Kjelmyr, J. E., and Stenzel, L. E. 1992. Shorebird numbers in wetlands of the Pacific flyway: a summary of counts from April 1988 to January 1992. 20 pp + appendices. Point Reyes Bird Observatory, Stinson Beach, California.
Page, G. W., Stenzel, L. E., and Kjelmyr, J. E. 1999. Overview of shorebird abundance and distribution in wetlands of the Pacific coast of the contiguous United States. Condor 101: 461-471.
Paulson, D. R. 1995. Black-bellied Plover (Pluvialis squatarola). In The Birds of North America No. 186 (A. Poole and F. Gill, Eds.). Philadelphia: The Academy of Natural Sciences; Washington D. C.: The American Ornithologists' Union.
Pennock, D. S., and W. W. Dimmick. 1997. Critique of the evolutionarily significant unit as a definition for "distinct population segments" under the U.S. Endangered Species Act. Cons. Bio. 11:611-619.
Piersma, T., and N. C. Davidson. 1992. The migrations and annual cycles of five subspecies of Knots in perspective. Wader Study Group Bull. 64, Suppl.:187-197.
52
Plissner, J. H., and S. M. Haig. 1997. 1996 International Piping Plover census. Report to US Geological Survey, Biological Resources Division, Forest and Rangeland Ecosystem Science Center, Corvallis, OR. 231 pp.
Robinson, J. A., J. M. Reed, J. P. Skorupa, and L. W. Oring. In press. Black-necked Stilt (Himantopus mexicanus). In The Birds of North America (A. Poole and F. Gill, Eds.). Philadelphia: The Academy of Natural Sciences; Washington D. C.: The American Ornithologists' Union.
Rose, P. M. and Scott, D. A. 1994. Waterfowl Population Estimates. 102 pp. International Waterfowl and Wetlands Research Bureau, Slimbridge, U.K.
Rose, P. M. and Scott, D. A. 1997. Waterfowl Population Estimates - Second Edition. 106 pp. Wetlands International, Wageningen, The Netherlands.
Ryder, O. A. 1986. Species conservation and systematics: the dilemma of subspecies. TREE 1:9-10.
Scott, D. A. and Carbonell, M. 1986. A Directory of Neotropical Wetlands. 684 pp. IUCN, Cambridge and IWRB, Slimbridge,
Skagen, S. K., Sharpe, P. B., and Waltermire, R. G. 1998. Biogeographical profiles of shorebird migration in midcontinental North America. Unpublished Report, unpaged. U.S. Geological Survey, Fort Collins, Colorado. Also published on website as: Skagen, S.K., Sharpe, P.B., Waltermire, R.G. and Dillon, M.B. 1999. Biogeographical profiles of shorebird migration in midcontinental North America. Http://www.mesc.usgs.gov/shorebirds.
Smit, C. J. and Piersma, T. 1989. Numbers, midwinter distribution, and migration of wader populations using the East Atlantic Flyway. Pp. 24-63, in Flyways and reserve networks for water birds. IWRB Special Publication No. 9, ed. by Boyd, H. and Pirot, J.-Y. 109 pp. Canadian Wildlife Service and International Waterfowl and Wetlands Research Bureau, Ottawa.
Summers, R. W., L. G. Underhill, C. F. Clinning, and M. Nicoll. 1989. Populations, migrations, biometrics and moult of the turnstone Arenaria i. interpres on the east Atlantic coastline, with special reference to the Siberian population. Ardea 77:145-168.
Tomkovich, P. S. 1992. An analysis of the geographic variability in Knots Calidris canutus based on museum skins. Wader Study Group Bull. 64, Suppl.:17-23.
Waples, R. S. 1995. Evolutionarily significant units and the conservation of biological diversity under the Endangered Species Act. Pp. 8-27 In Evolution and the aquatic ecosystem: defining unique units in population conservation (J. L. Nielsen, ed.). Symposium 17, American Fisheries Society, Bethesda, MD.
Warnock, N. and R.E. Gill, Jr. 1996. Dunlin (Calidris alpina). In The Birds of North America No. 203 (A. Poole and F. Gill, Eds.). Philadelphia: The Academy of Natural Sciences; Washington D. C.: The American Ornithologists' Union.
Warnock, N., and M. A. Bishop. 1998. Spring stopover ecology of migrant Western Sandpipers. Condor 100:456–467.
Watts, B. D., Bradshaw, D. S., and Watts, M. U. 1998. Migrant shorebirds within the upper Bay of Panama. 16 pp. Centre for Conservation Biology, College of William and Mary,
53

54
Wenink, P. W., A. J. Baker, H.-U. Rösner, and M. G. J. Tilanus. 1996. Global mitochondrial DNA phylogeny of Holarctic breeding dunlins (Calidris alpina). Evolution 50:318-330.
Zink, R. M., S. Rohwer, A. V. Andreev, and D. L. Dittmann. 1995. Trans-Beringia comparisons of mitochondrial DNA differentiation in birds. Condor 97:639-649.