national road users’ satisfaction survey...in 2018-19 the overall satisfaction score was 88.4 per...
TRANSCRIPT
National Road Users’ Satisfaction Survey
2018-19
ALAMY

3
ContentsForeword 4
Key findings 6Journey times 10Roadworks 15Signage 19Upkeep 23Safety 27
Appendix 33
4
National Road Users’ Satisfaction Survey 2018-19 Foreword
This is the third year that Transport Focus has been responsible for the National Road Users’
Satisfaction Survey (NRUSS), which it inherited from Highways England in 2016.
NRUSS measures satisfaction among around 2000 users of the motorways and major ‘A’ roads managed by Highways England based on their most recent journey. To maintain comparability with previous years, Transport Focus has kept NRUSS methodology unchanged.
The level of overall satisfaction calculated by NRUSS is used by the Office of Rail and Road to monitor Highways England’s delivery as part of the performance specification set for Highways England by Government.
NRUSS user satisfaction 2018-2019 was 88.4 per cent, the lowest it has been over the past five years and below the target of 90 per cent set by Government.
Highways England must seek improvements
to user satisfaction across the roads it manages, although Transport Focus recognises this task must be achieved against a backdrop of rising usage of these roads and resulting congestion.
Transport Focus has developed a new Strategic Roads User Survey (SRUS), now running for over a year, which is set to replace NRUSS as the formal measure of satisfaction for Road Period 2 (April 2020 to March 2025).
After two years of parallel running between SRUS and NRUSS, the latter will be discontinued in March 2020. SRUS has improved methodology and seeks the views of over four times more road users. It provides greater insight for Highways England to understand where satisfaction is weaker and target its efforts to drive up user satisfaction.
Anthony SmithChief Executive
ForewordAround 2000 road users took part in the 2018-19 National Road Users’ Satisfaction Survey (NRUSS).
5
A194(M)
A1(M)
M180
M32
M49
M2M3
M18M62
M54
M50
M69
M26M23
M27
M11
M606M621
A69
A19
A64
A13
A21
A23
A23
A31A35
A30
A36
A12
A47
A12
A11
A43
A40
A46
A50
A5
A3
A4
A55
A49
A42
A63
A66A66
A595
A590
A585
A5036 A616A628M67
A453
A120
A249
A303
A419
A417
A500
A449A458
A483
A550
A174
A696
A180A160
M1
A46
M4
M5
A30
A38
M4
M40
A27A3(M)
A2070
M20
A2
A34
A34
A120
A259
A2
A20
A421
A428
A1
A5
A5
A5
M5
M5A303
A40
M42
M42
M6M6
M45A45
M1
A5
A38
A38
A404
A483
M6
M53 M60M57
M58
M55
M62 M62
M56
A52A6
A46
A46
A50
A30
M1
A1(M)
A1(M)
A663
A627(M)M61
M65
M66A56
A1
A168
A66
A66(M)
A184
A19
A1
M25
M25
A1
A1
A1(M)
A1
A30
A1(M)
A14
A14
A45
M6
A556
A26
A20
M271
M48
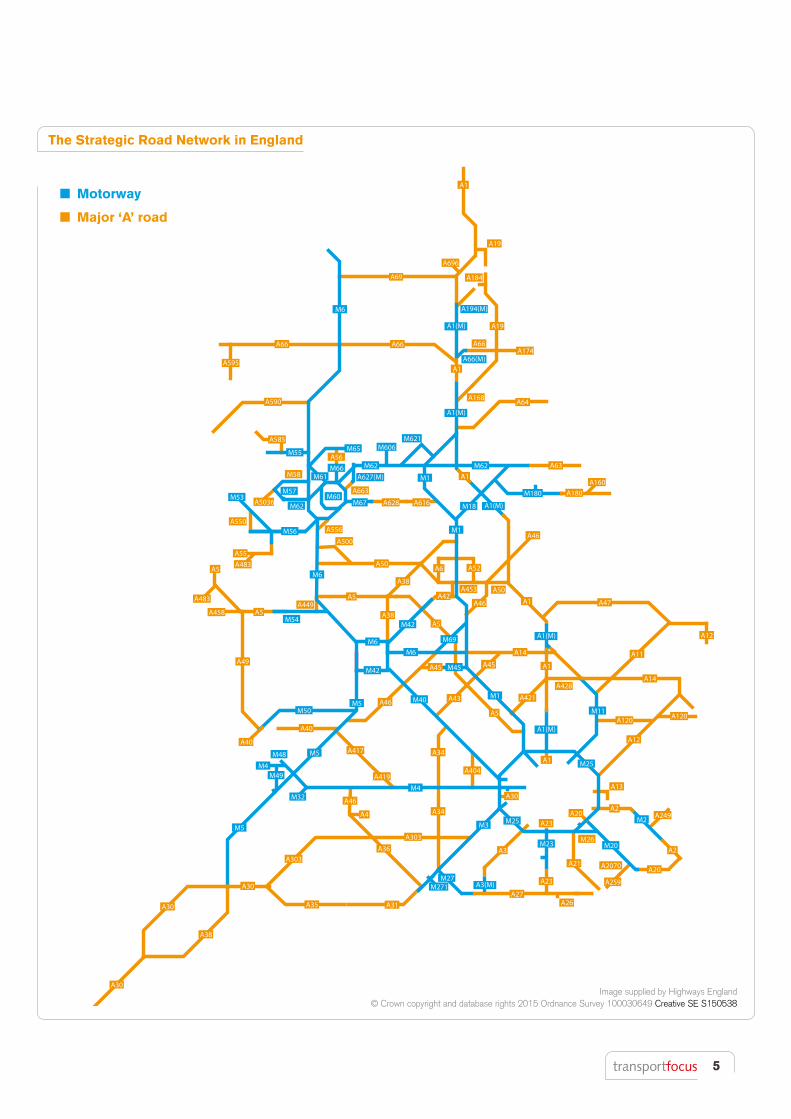
Image supplied by Highways England© Crown copyright and database rights 2015 Ordnance Survey 100030649 Creative SE S150538
Motorway
Major ‘A’ road
The Strategic Road Network in England
6
National Road Users’ Satisfaction Survey 2018-19 Key findings
Introduction
The National Road Users’ Satisfaction Survey (NRUSS) measures users’ satisfaction with journeys on the motorways and major ‘A’ roads managed by Highways England. The NRUSS customer satisfaction result is a Key Performance Indicator for Highways England. The target is 90 per cent very or fairly satisfied. The NRUSS overall satisfaction score is derived from five core areas of user experience: journey time; safety; information/signage; roadworks management; and general upkeep of the road. Around 2000 users are interviewed in their homes in randomly selected locations across England so that each of the seven Highways England regions is covered equally. More detail on the methodology is provided in the appendix.
Key findings
Overall satisfaction
In 2018-19 the overall satisfaction score was 88.4 per cent, the lowest score in the last five years and 0.3 of a percentage point lower than last year. Motorway scores increased from the previous year’s score by 0.3 of a percentage point to 87.8 per cent, largely due to an
increase in roadworks scores. However, for the major ‘A’ roads the scores decreased by 1.0 percentage point on last year, down to 89.1 per cent, with the drop caused by lower ratings on roadworks, maintenance and general upkeep.
Overall satisfaction (% satisfied)
2014
-15
2015
-16
2016
-17
2017
-18
2018
-19
2014
-15
2015
-16
2016
-17
2017
-18
2018
-19
2014
-15
2015
-16
2016
-17
2017
-18
2018
-19
MotorwaysMotorways and major ‘A’ roads combined
95
90
85
80
Major ‘A’ roads
88.5 88.3 88.889.3 89.1 89.589.1 88.488.787.588.1 87.8
90.3 89.190.1
7
Yorkshire and
North East
North West
Midlands
M25
East
South EastSouth West
91
84
88
87
86
90
89
Overall satisfaction by region
The highest overall satisfaction was in Yorkshire and the North East at 91 per cent, an increase from 88 per cent in 2017-18. Satisfaction in the North West remains the lowest at 84 per cent, however its score has increased from 78 per cent in the previous year, coinciding with the completion of a set of smart motorway construction roadworks in the region.
Journey time
Satisfaction of 88 per cent was achieved for journey time for the second consecutive year, with the score having remained similar since 2012. Major ‘A’ road scores remained at 90 per cent for the fourth consecutive year,
Satisfaction by region (%) 2014-15 2015-16 2016-17 2017-18 2018-19
Yorks and North East 89 86 88 88 91
North West 83 84 83 78 84
Midlands 87 89 87 89 88
M25 89 90 89 90 87
East 92 92 91 90 90
South East 88 89 88 91 86
South West 86 91 91 89 89
while motorway scores dropped to 85 per cent. Key reasons for dissatisfaction with journey times were delays being a high proportion of journey time and delay due to accidents.
Journey time (% satisfied)
2014
-15
2015
-16
2016
-17
2017
-18
2018
-19
2014
-15
2015
-16
2016
-17
2017
-18
2018
-19
2014
-15
2015
-16
2016
-17
2017
-18
2018
-19
MotorwaysMotorways and major ‘A’ roads combined
95
90
85
80
Major ‘A’ roads
8786
8888 88 8886 86
90
8785 85
90 9090
8
Signage (% satisfied)
Roadworks (% satisfied)
2014
-15
2015
-16
2016
-17
2017
-18
2018
-19
2014
-15
2015
-16
2016
-17
2017
-18
2018
-19
2014
-15
2015
-16
2016
-17
2017
-18
2018
-19
2014
-15
2015
-16
2016
-17
2017
-18
2018
-19
2014
-15
2015
-16
2016
-17
2017
-18
2018
-19
2014
-15
2015
-16
2016
-17
2017
-18
2018
-19
Motorways
Motorways
Motorways and major ‘A’ roads combined
Motorways and major ‘A’ roads combined
95
90
85
80
75
70
65
60
55
Major ‘A’ roads
Major ‘A’ roads
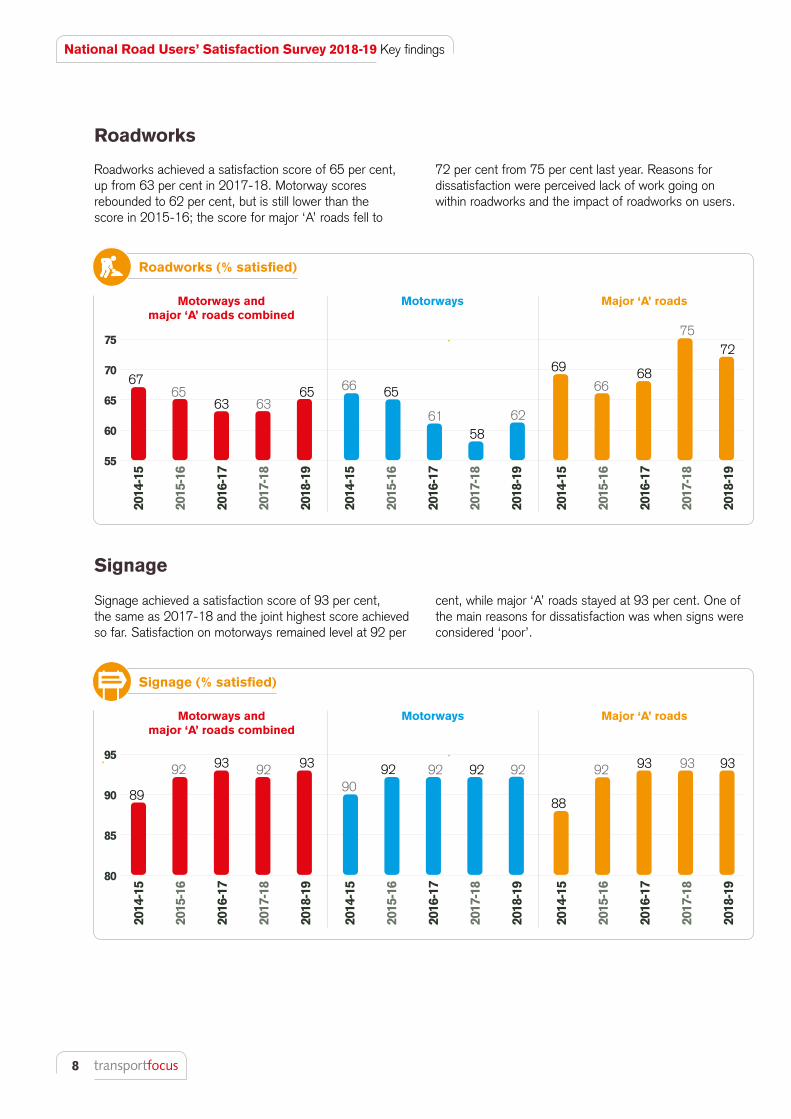
Roadworks
Roadworks achieved a satisfaction score of 65 per cent, up from 63 per cent in 2017-18. Motorway scores rebounded to 62 per cent, but is still lower than the score in 2015-16; the score for major ‘A’ roads fell to
72 per cent from 75 per cent last year. Reasons for dissatisfaction were perceived lack of work going on within roadworks and the impact of roadworks on users.
Signage
Signage achieved a satisfaction score of 93 per cent, the same as 2017-18 and the joint highest score achieved so far. Satisfaction on motorways remained level at 92 per
cent, while major ‘A’ roads stayed at 93 per cent. One of the main reasons for dissatisfaction was when signs were considered ‘poor’.
89
92 9293 93
9092 92 92
88
92 93 9392 93
National Road Users’ Satisfaction Survey 2018-19 Key findings
72
6765 65
6363
66 65
5861 62
6966
75
68
9
Journey time (% satisfied)
Upkeep (% satisfied)
2014
-15
2015
-16
2016
-17
2017
-18
2018
-19
2014
-15
2015
-16
2016
-17
2017
-18
2018
-19
2014
-15
2015
-16
2016
-17
2017
-18
2018
-19
2014
-15
2015
-16
2016
-17
2017
-18
2018
-19
2014
-15
2015
-16
2016
-17
2017
-18
2018
-19
2014
-15
2015
-16
2016
-17
2017
-18
2018
-19
Motorways
Motorways
Motorways and major ‘A’ roads combined
Motorways and major ‘A’ roads combined
95
90
85
80
95
90
85
80
Major ‘A’ roads
Major ‘A’ roads
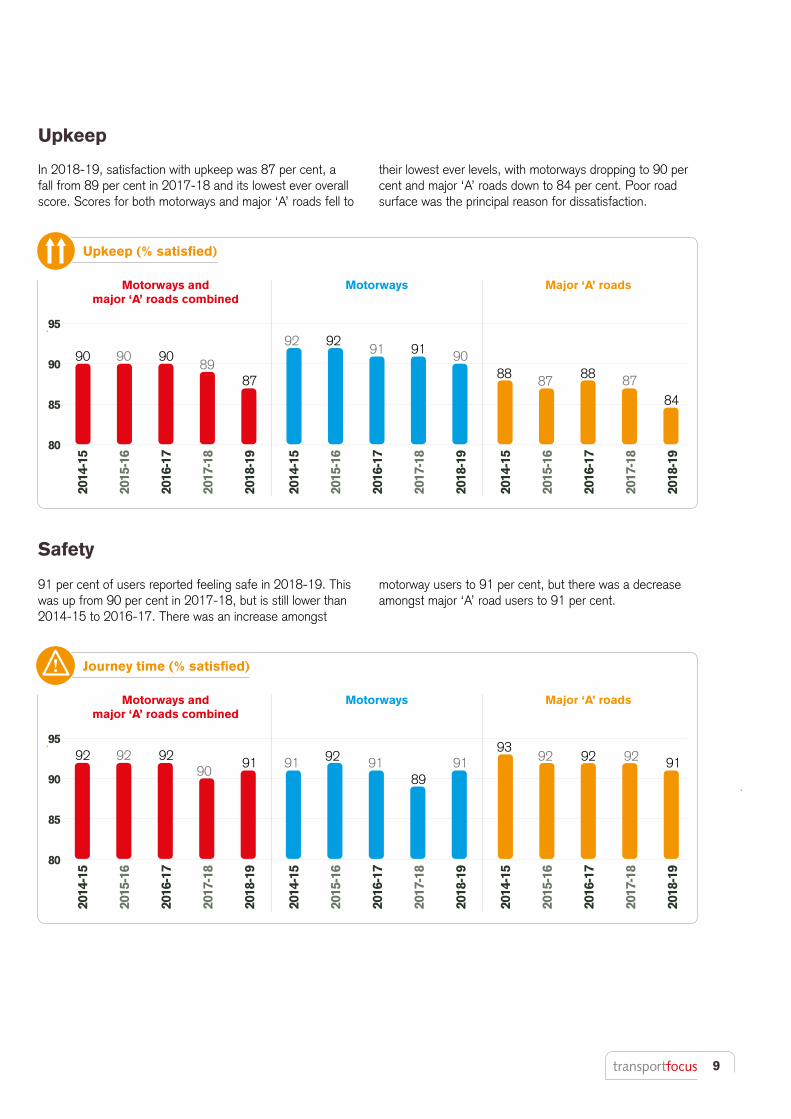
Safety
91 per cent of users reported feeling safe in 2018-19. This was up from 90 per cent in 2017-18, but is still lower than 2014-15 to 2016-17. There was an increase amongst
motorway users to 91 per cent, but there was a decrease amongst major ‘A’ road users to 91 per cent.
92 92 9290
9191 9192 91 9189
9392 92 92
Upkeep
In 2018-19, satisfaction with upkeep was 87 per cent, a fall from 89 per cent in 2017-18 and its lowest ever overall score. Scores for both motorways and major ‘A’ roads fell to
their lowest ever levels, with motorways dropping to 90 per cent and major ‘A’ roads down to 84 per cent. Poor road surface was the principal reason for dissatisfaction.
90 90 909089
92 9291 91
88 87 8787 88
84
10
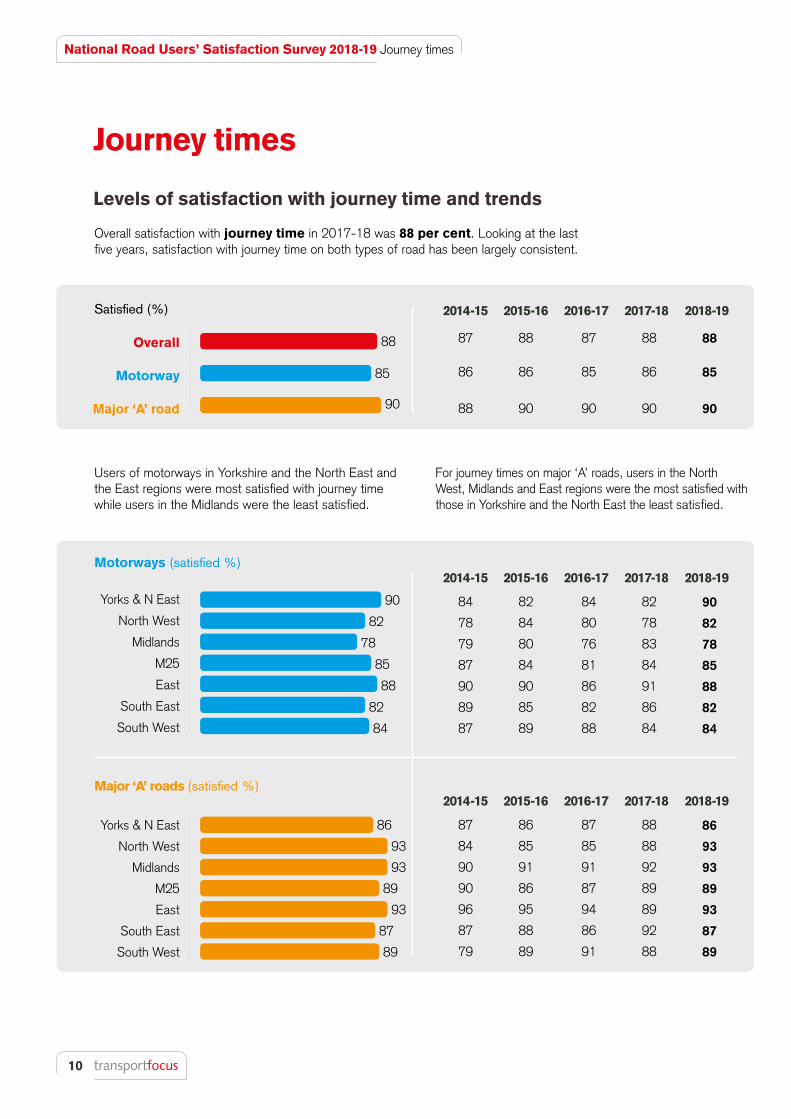
National Road Users’ Satisfaction Survey 2018-19 Journey times
2014-15 2015-16 2016-17 2017-18 2018-19
87 88 87 88 88
86 86 85 86 85
88 90 90 90 90
Overall
Motorway
Major ‘A’ road
Satisfied (%)
Motorways (satisfied %)
Yorks & N East
North West
Midlands
M25
East
South East
South West
2014-15 2015-16 2016-17 2017-18 2018-19
84 82 84 82 90
78 84 80 78 82
79 80 76 83 78
87 84 81 84 85
90 90 86 91 88
89 85 82 86 82
87 89 88 84 84
2014-15 2015-16 2016-17 2017-18 2018-19
87 86 87 88 86
84 85 85 88 93
90 91 91 92 93
90 86 87 89 89
96 95 94 89 93
87 88 86 92 87
79 89 91 88 89
Major ‘A’ roads (satisfied %)
Yorks & N East
North West
Midlands
M25
East
South East
South West
Users of motorways in Yorkshire and the North East and the East regions were most satisfied with journey time while users in the Midlands were the least satisfied.
Overall satisfaction with journey time in 2017-18 was 88 per cent. Looking at the last five years, satisfaction with journey time on both types of road has been largely consistent.
Journey times
Levels of satisfaction with journey time and trends
For journey times on major ‘A’ roads, users in the North West, Midlands and East regions were the most satisfied with those in Yorkshire and the North East the least satisfied.
88
85
90
90
82
78
85
88
82
84
86
93
93
89
93
87
89
11
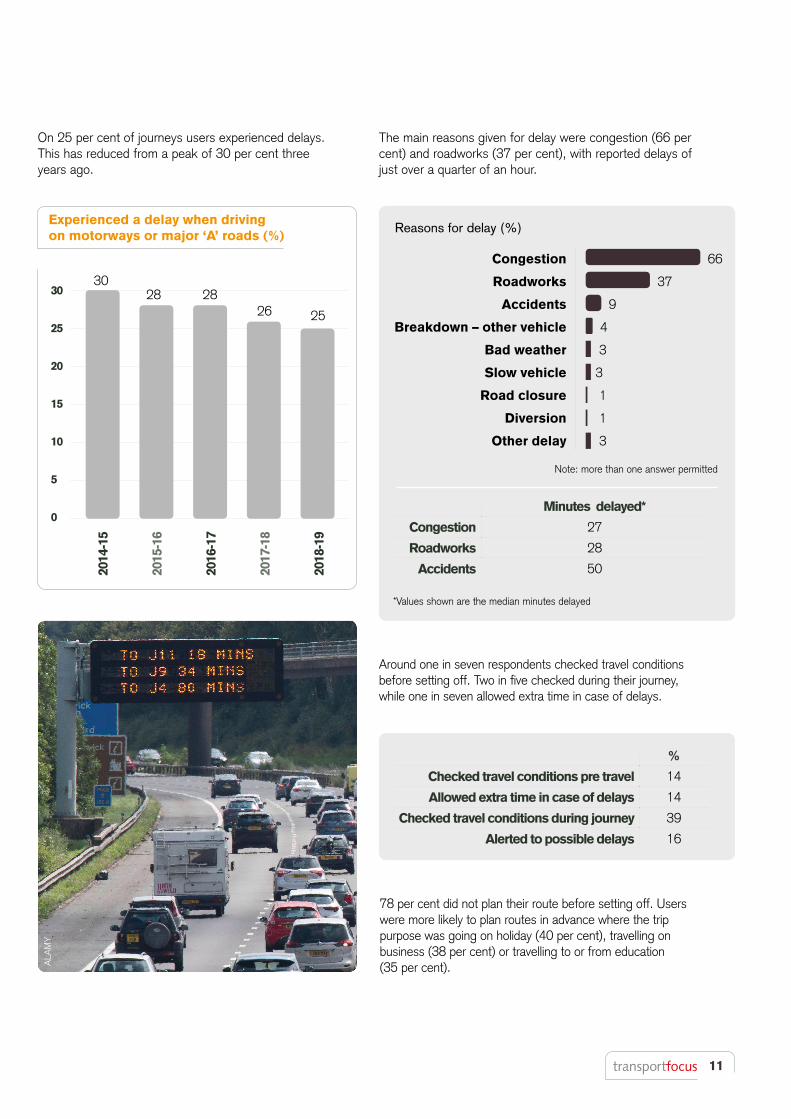
78 per cent did not plan their route before setting off. Users were more likely to plan routes in advance where the trip purpose was going on holiday (40 per cent), travelling on business (38 per cent) or travelling to or from education (35 per cent).
Minutes delayed*
Congestion 27
Roadworks 28
Accidents 50
%
Checked travel conditions pre travel 14
Allowed extra time in case of delays 14
Checked travel conditions during journey 39
Alerted to possible delays 16
On 25 per cent of journeys users experienced delays. This has reduced from a peak of 30 per cent three years ago.
Congestion
Roadworks
Accidents
Breakdown – other vehicle
Bad weather
Slow vehicle
Road closure
Diversion
Other delay
The main reasons given for delay were congestion (66 per cent) and roadworks (37 per cent), with reported delays of just over a quarter of an hour.
Around one in seven respondents checked travel conditions before setting off. Two in five checked during their journey, while one in seven allowed extra time in case of delays.
Reasons for delay (%)
Note: more than one answer permitted
30
25
20
15
10
5
0
2826 25
2830
2014
-15
2015
-16
2016
-17
2017
-18
2018
-19
Experienced a delay when driving on motorways or major ‘A’ roads (%)
*Values shown are the median minutes delayed
66
37
9
4
3
3
1
1
3
ALA
MY
12
National Road Users’ Satisfaction Survey 2018-19 Journey times
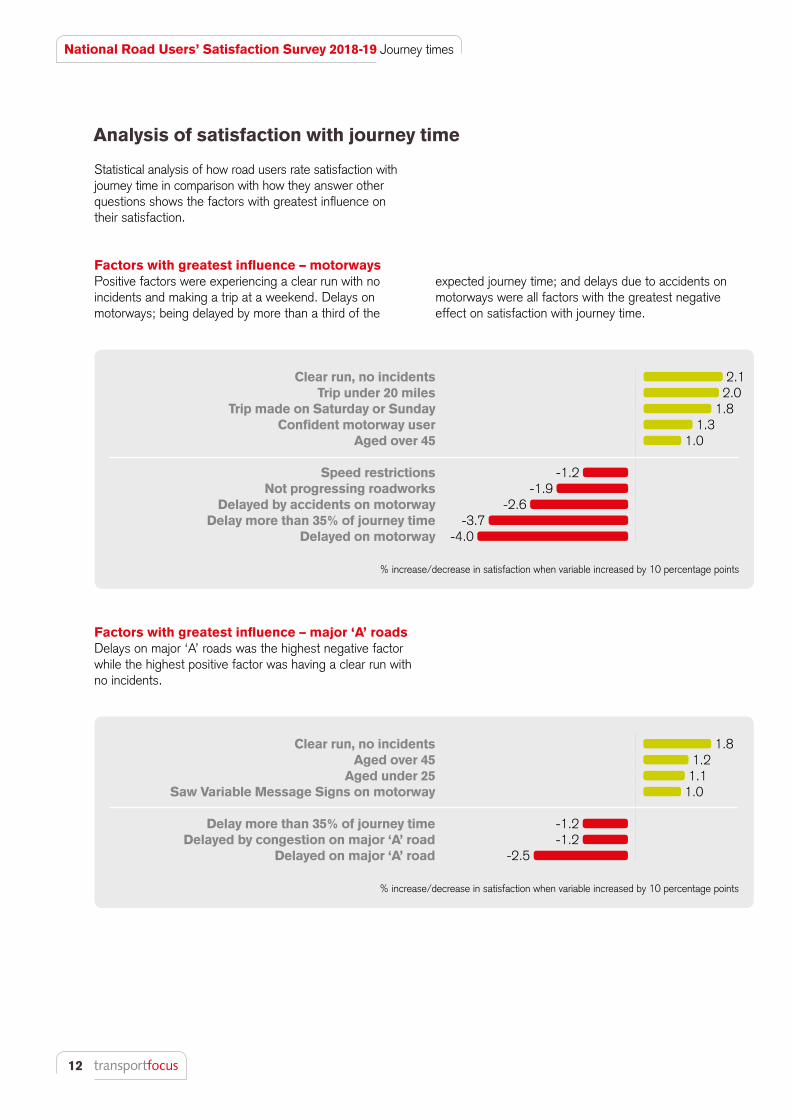
Analysis of satisfaction with journey time
Statistical analysis of how road users rate satisfaction with journey time in comparison with how they answer other questions shows the factors with greatest influence on their satisfaction.
% increase/decrease in satisfaction when variable increased by 10 percentage points
% increase/decrease in satisfaction when variable increased by 10 percentage points
2.1 2.0
1.8 1.3
1.0
-1.2 -1.9
-2.6 -3.7
-4.0
Clear run, no incidentsTrip under 20 miles
Trip made on Saturday or SundayConfident motorway user
Aged over 45
Speed restrictionsNot progressing roadworks
Delayed by accidents on motorwayDelay more than 35% of journey time
Delayed on motorway
Factors with greatest influence – major ‘A’ roadsDelays on major ‘A’ roads was the highest negative factor while the highest positive factor was having a clear run with no incidents.
Factors with greatest influence – motorwaysPositive factors were experiencing a clear run with no incidents and making a trip at a weekend. Delays on motorways; being delayed by more than a third of the
1.8 1.2
1.1 1.0
-1.2 -1.2
-2.5
Clear run, no incidentsAged over 45
Aged under 25Saw Variable Message Signs on motorway
Delay more than 35% of journey time Delayed by congestion on major ‘A’ road
Delayed on major ‘A’ road
expected journey time; and delays due to accidents on motorways were all factors with the greatest negative effect on satisfaction with journey time.
13
Roadworks Roadworks were frequently noted as the reason for the delays experienced by a number of respondents and this caused some dissatisfaction. Poor management of roadworks and a perception that no one was working contributed to dissatisfaction.
“This is a problem that's never been addressed, the congestion always between Bristol and Weston Super Mare and it's volume of traffic.” (Leisure, motorway)
“It should only take 15 minutes, it takes longer because of the amount of traffic not necessarily incidents or if accidents occur it can take longer, it's ridiculous and frustrating.” (Other, motorway)
“It took me 10 minutes to do a mile, the traffic was dreadful.” (Leisure, ‘A’ road)
“The queuing was endless, the journey was very slow.” (Leisure, ‘A’ road)
“Literally you have to be stressed for the whole journey debating whether you will get delayed or make your meeting, you just don't know through the sheer volume of traffic.” (Business, motorways)
“Took so long and for no apparent reason.” (Business, motorways)
“It was all the hanging about and not knowing, it said long delays but I've had that on there before and it was only 15 minutes which I was happy to accept but didn't expect nearly 2 hours. If they would have said over an hour’s delay earlier I would have come off the M42 onto the M6 toll then back on the M6 further up!” (Leisure, motorways)
“There were so many times we seemed to stop and queue for no apparent reason, there was no accident or breakdown.” (Leisure, ‘A’ road)
“It took longer than necessary because of the 9 miles of roadworks around Swindon, nobody is ever working on them.” (Leisure, motorway)
“Speed restrictions in place, not much work going on.” (Commuting, motorway)
“Roadworks on the M4, there are at least 3 sections, there are tree surgeons on either side of the road and there are width restrictions bringing it down 3 lanes and they are narrow and are literally just the width of a lorry so you can’t get past. It slows everything up, but I don’t see anyone working very often.” (Business, motorway)
“It was a very long journey, we just seemed to get through one lot of roadworks and then another lot of roadworks sprung up.” (Leisure, motorway)
CongestionGeneral congestion and the volume of traffic led to high levels of dissatisfaction with journey time for many respondents as they noted that this led to their journey time being extended.
Accidents and unexplained incidentsMany respondents were frustrated by not knowing what was going on up ahead and what was causing the delay. This not knowing contributed to high levels of dissatisfaction amongst respondents.
What users tell us about delays
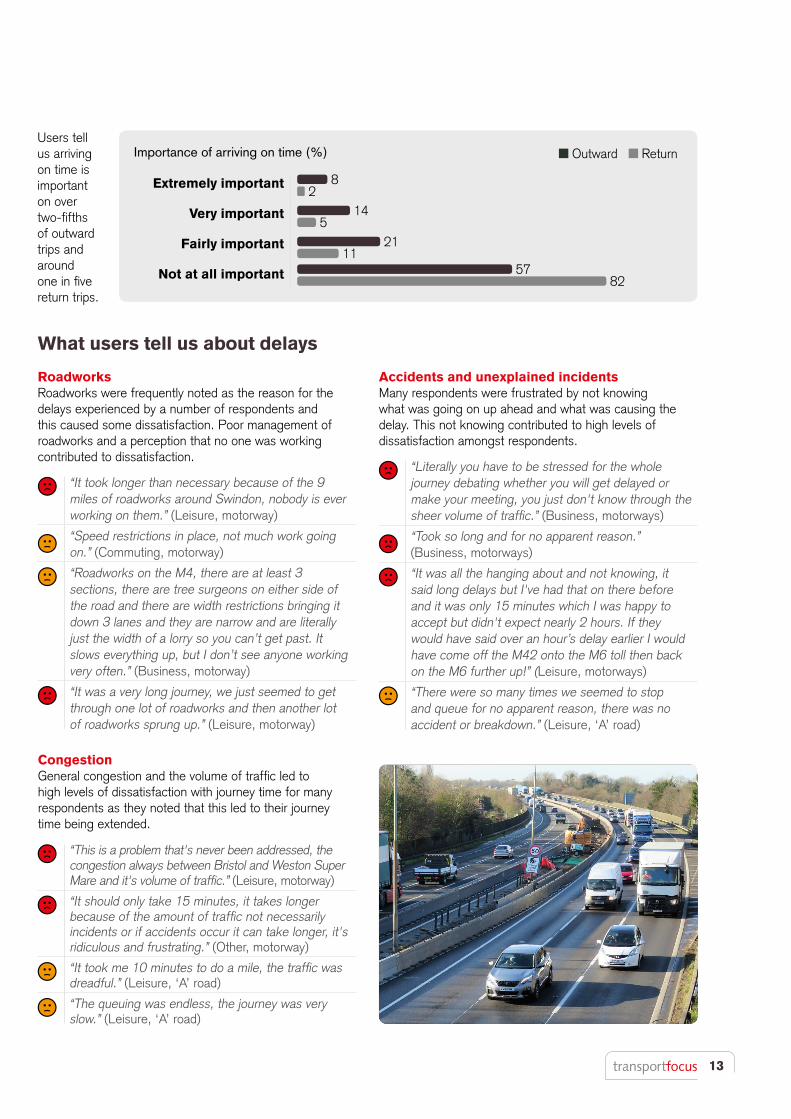
Users tell us arriving on time is important on over two-fifths of outward trips and around one in five return trips.
Outward Return
8 2
14 5
21 11
57 82
Extremely important
Very important
Fairly important
Not at all important
Importance of arriving on time (%)
14
National Road Users’ Satisfaction Survey 2018-19 Journey times
When a delay is no worse than expected Some users were still satisfied with a delayed journey when it was no worse than expected. Road users expect delays on the motorways and major ‘A’ roads if travelling at certain times or on certain routes, generally based on previous experience.
Are delays expected?
An important dimension is the extent to which a delay is expected.
“The traffic moved slower in parts but didn’t cause any noticeable delays.” (Leisure, motorways)
“No hold ups and I was surprised at how good it was.” (Leisure, motorways)
“A few delays on the M25 area but they were expected.” (Leisure, motorways)
“It was OK as they go, just a normal amount of traffic.” (Leisure, ‘A’ road)
“It's just a normal busy journey.” (Commuting, ‘A’ road)
“Very congested but I expected it.” (Business, ‘A’ road)
“Always delays, you expect it.” (Business, motorway)
“It was what I expected.” (Commuting, motorway)
“I travel so early in the morning, so it's a clear run and quiet at this time of the morning. If I left later, congestion would be horrendous, especially on a Friday.” (Commuting, motorway)
“Not much traffic that early in the morning.” (Personal business, motorway)
“Got there early to avoid the traffic and got back again, smooth trip.” (Leisure, ‘A’ road)
“It took so much longer than usual.” (Leisure, motorways)
“It took almost 3 times as long as I expected it to.” (Other, motorways)
“Got through the roadworks OK, traffic was flowing.” (Leisure, motorways)
“Bit slow to start with as there were roadworks and speed restrictions.” (Leisure, motorways)
When a delay is expectedCommuters or those travelling on business had lower expectations of journey time from familiarity with routes and typical levels of congestion. Over a quarter (26 per cent) of users travelling to work or on business typically allowed an additional 30 minutes for their journey.
Avoided delayMany respondents chose to travel at a time that they perceived to be quieter, therefore reducing the risk of being delayed. This contributed to higher levels of satisfaction amongst these respondents.
When the delay is unexpected or worse than expectedIf a delay was unexpected then dissatisfaction levels were extremely high among respondents as this had a big impact on their journey time.
Speed restrictionsSpeed restrictions due to roadworks or general volume of traffic were mentioned by a number of respondents. However, some respondents did not perceive these restrictions to cause a delay.
15
Users passed through roadworks on 22 per cent of journeys on motorways; on major ‘A’ roads it was 11 per cent.
71 per cent of those who passed through roadworks had known about them before their journey, an increase from 65 per cent in the previous year. Nearly three-quarters (73 per cent) had driven through the roadworks
on a previous occasion, while a further 10 per cent had found out through road signs.
Only three per cent of all road users planned their journey specifically to avoid roadworks. Of those passing through roadworks, the main features road users noticed were speed restrictions (79 per cent), narrowed lanes (52 per cent) and closed lanes (30 per cent).
30
25
20
15
10
5
0
Motorways Major ‘A’ roads
In 2018-19 roadworks achieved an overall satisfaction score of 65 per cent. This is an increase from 63 per cent in the previous year, although roadworks remain the lowest of all the measures. The score for motorways increased for the first time in five years. On major ‘A’ roads the score decreased from 75 per cent to 72 per cent, however this is still higher than in 2014-15, 2015-16 or 2016-17.
Roadworks
Levels of satisfaction with roadworks
2014-15 2015-16 2016-17 2017-18 2018-19
67 65 63 63 65
66 65 61 58 62
69 65 68 75 72
65
62
72
2014
-15
2015
-16
2016
-17
2017
-18
2018
-19
2014
-15
2015
-16
2016
-17
2017
-18
2018
-19
Experienced roadworks (%)
23
13
21
24
10 119
22
26
12
Overall
Motorway
Major ‘A’ road
Satisfied (%)
16
National Road Users’ Satisfaction Survey 2018-19 Roadworks
Users saw work being carried out on 36 per cent of journeys which passed through roadworks, down three percentage points on 2017-18. This is lower than the level of 44 per cent in 2014-15.
Statistical analysis of how road users rate satisfaction with roadworks in comparison with how they answer other questions shows the factors with greatest influence on their satisfaction.
Analysis of satisfaction with roadworks management
3.2 2.9
2.0
-1.3 -2.1
-3.0 -3.6
-4.7
Saw signage for roadworksChecked travel conditions in advance
Observed work in progress
In full-time employmentDelay more than 35% of journey timeLack of information about roadworks
Impact of delay – frustrationNot progressing roadworks
50
40
30
20
0
38 3937 36
44
Factors with greatest influenceFactors that led to increased satisfaction with roadworks were seeing signs about the works; having checked travel conditions in advance; and having observed work in progress.
However the causes of dissatisfaction with roadworks were perceived lack of progress with the work; the impact of delay from frustration about the roadworks; and lack of information about the roadworks.
2014
-15
2015
-16
2016
-17
2017
-18
2018
-19
Roadworks activity was seen (%)
% increase/decrease in satisfaction when variable increased by 10 percentage points
17
Being delayedFor a large proportion of respondents, roadworks were mentioned as a reason for why they were delayed, mainly because of added journey time due to speed restrictions.
Information provisionA number of road users told us they had seen signs explaining the roadworks and felt more satisfied.
Roadworks going on over a long periodMany respondents complained that road workers are rarely seen and that little progress appears to be being made when passing through roadworks. In addition, some roadworks seem to take years to complete.
Users who were dissatisfied listed four main reasons:
What users tell us about roadworks management
Very dissatisfied - Too many lots of roadworks, especially on the M6, no sooner are you out of one lot than another set starts.” (Leisure, motorways)
Fairly dissatisfied - They have them spread out along the M62 instead of concentrating on one area.” (Leisure, motorways)
Fairly dissatisfied - Nothing happened for weeks after it started and it should be done in sections, not the whole 11 mile stretch in one go.” (Commuting, motorways)
“All flowed and clearly marked.” (Commuting, ‘A’ road)
“The 50mph restrictions at times are not necessary as this causes more hold ups.” (Leisure, motorways)
“It took far too long to get past the roadworks.” (Leisure, motorways)
“It caused such delays and left the motorway without lights.” (Leisure, motorways)
“The roadworks are too long a stretch causing delays and frustration.” (Business, motorways)
“Signs and information were all OK, just wished they would get on with it.” (Leisure, Motorways)
“Clear signs, little delays.” (Leisure, motorways)
“Enough information to get through safely.” (Business, motorways)
“Signs up before you get there, it tells when it is going to happen and about bumps etc.” (Personal business, ‘A’ roads)
“Should have people working on them at all times.” (Commuting, motorways)
“Nothing worse than going past and seeing nobody working.” (Leisure, motorways)
Very Dissatisfied - Too many roadworks alterations going on not being completed like this for years.” (Leisure, motorways)
“They've been going on forever and I don't know what they're doing.” (Education, ‘A’ road)
“They seem to put cones up but never do anything so no improvement.” (Business, ‘A’ road)
Some road users appreciate it if they keep moving, albeit at a slower pace and therefore their levels of satisfaction while passing through roadworks were less affected.
There was frustration with long stretches of roadworks and/or encountering several successive sets of roadworks on a journey.
18
National Road Users’ Satisfaction Survey 2018-19 Roadworks
Less negative views of roadworks management There was some positive feedback about the management of roadworks. Some road users accept that they just have to be done and there is no gain without pain.
Road users being aware of progress, either by being told about it or by seeing it, encourage higher levels of satisfaction.
“Some roads need improvement and they inform you in advance which is good.” (Business, motorways)
“There weren't any huge delays and I know the work has to be carried out at some point.” (Leisure, motorways)
“It's always going to be a bit of an inconvenience but improvements have to be made.” (Personal business, motorways)
“They have got to be done and they have tried to keep 2 lanes going rather than shutting one.” (Commuting, ‘A’ road)
“All under control, seemed fine and safe.” (Leisure, motorways)
“They were really good because there the traffic flow was still good even with the speed restrictions.” (Leisure, ‘A’ road)
“Nearly finished the work just tidying the verges and had the inside lane closed to protect the workforce.” (Leisure, ‘A’ road)
“Plenty of signs, they were working on the other side of crash barrier.” (Leisure, motorways)
19
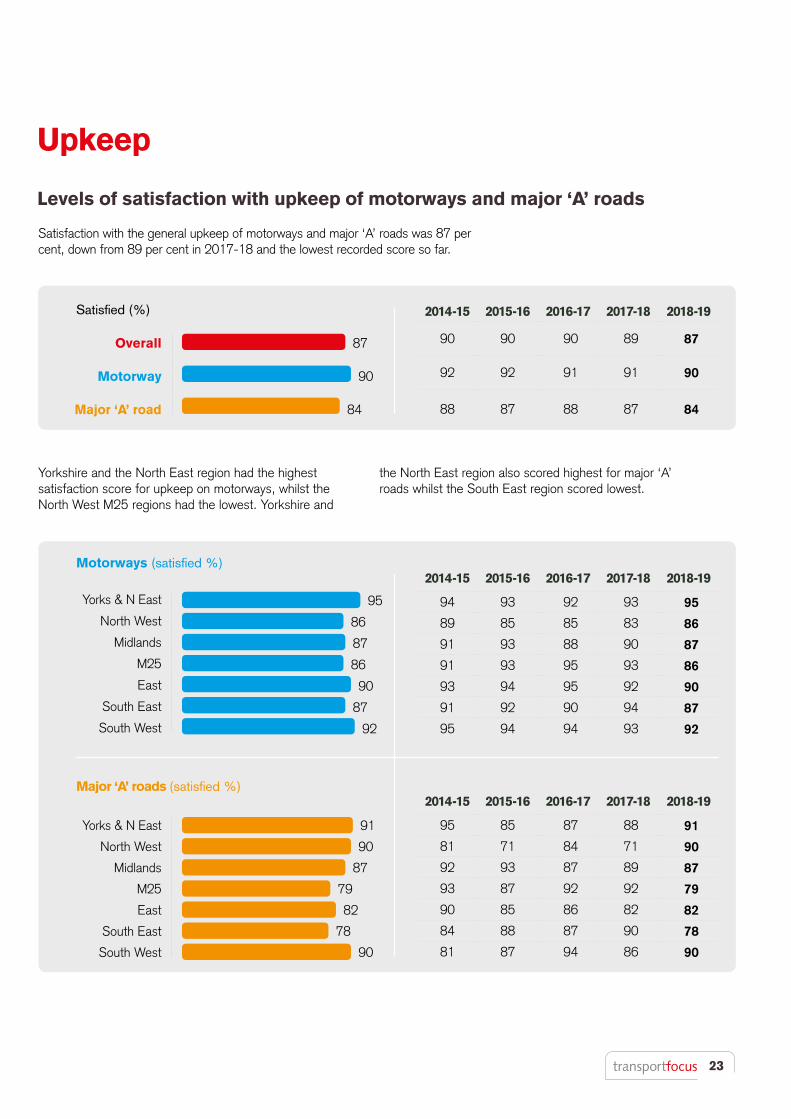
2014-15 2015-16 2016-17 2017-18 2018-19
89 92 93 92 93
90 92 92 92 92
89 92 93 93 93
93
92
93
Overall
Motorway
Major ‘A’ road
Satisfied (%)
Motorways (satisfied %)
Yorks & N East
North West
Midlands
M25
East
South East
South West
2014-15 2015-16 2016-17 2017-18 2018-19
96 93 91 92 97
82 82 82 80 85
93 90 95 96 95
89 94 96 95 90
93 94 97 99 94
90 92 96 94 94
88 96 97 92 91
2014-15 2015-16 2016-17 2017-18 2018-19
93 88 92 92 93
83 67 86 75 84
88 95 98 97 96
87 94 98 96 94
94 96 94 95 97
86 91 91 93 92
80 92 93 95 90
Major ‘A’ roads (satisfied %)
Yorks & N East
North West
Midlands
M25
East
South East
South West
Yorkshire and the North East region scored the highest for signage on motorways, with the North West scoring the
Satisfaction with signage overall was at 93 per cent in 2018-19, the joint highest score recorded. Satisfaction with signage on major ‘A’ roads remains marginally better than on motorways, and signage remains the highest scoring of the five key areas of user experience.
Signage
Levels of satisfaction with signage
97
85
95
90
94
94
91
93
84
96
94
97
92
90
lowest. The North West region also scored the lowest for major ‘A’ roads, whilst users rated the East region best for signage.
20
National Road Users’ Satisfaction Survey 2018-19 Signage
Statistical analysis of how road users rate satisfaction with signage in comparison with how they answer other questions, shows the factors with greatest influence on their satisfaction.
Analysis of satisfaction with signage
0.9 0.7 0.7 0.7
0.6
1.2 1.0
0.9 0.8
0.7
-0.5 -1.5
-1.7
Saw Variable Message Signs on motorway Leisure trip
Work or business tripObserved work in progress
Confident motorway user
Delayed on motorwayPoor signage
Good surfaceClear run, no incidents
Bad surfaceConfident major ‘A’ road user Saw variable message signs
Poor signage
Factors with greatest influence – motorways Factors with a positive link to satisfaction include seeing an electronic variable message sign and undertaking a trip for
Factors with greatest influence – major ‘A’ roads Factors with a positive link to satisfaction were good road surface and having a clear run with no incidents. Factors leading to dissatisfaction included poor signage.
% increase/decrease in satisfaction when variable increased by 10 percentage points
% increase/decrease in satisfaction when variable increased by 10 percentage points
leisure, work or business. Factors leading to dissatisfaction were poor signage and delays on motorways.
21
Lack of sufficient information to make a journey safelySafety concerns were mentioned by respondents in relation to journeys where there had been confusion due to a lack of information. This also meant that there was a higher chance of getting lost or ending up going in the wrong direction which added to the stress of the journey.
Signs not clearly visibleThere were issues with maintenance and the ability to see some signs due to being dirty, obscured by vegetation, poorly lit, or vandalised. Therefore being unable to see signs or read information contributed to high levels of dissatisfaction.
Accuracy of informationIn order to reduce frustrations that road users might have, many would prefer to know the reason for delays and roadworks when they encounter them.
Trust is a big issue for respondents when it comes to the information they are given. Some road users have a poor impression of the accuracy of messages or variable speed limits shown.
A small minority of road users felt there were locations with too many signs.
While road users were generally satisfied with signage, they became dissatisfied when information was given too late, or was unclear. The comments below illustrate some issues with signage on Highways England’s roads.
What users tell us about signage
“The VMS signs are hopeless, they are out of date and don't give you proper information if you're in a jam to turn off etc. They say queues ahead when there aren't any too.” (Personal business, motorways)
“When the variable speed signs come it is very confusing to know what speed you are supposed to be at.” (Personal business, motorways)
“Lots of miles of signs saying 50mph but no reason for it.” (Leisure, motorways)
“Sometimes you get speed restrictions when the road is all fine.” (Business, motorways)
“Should have been more signs telling us why there were delays.” (Leisure, motorways)
“Little confusing on the M6 for the signs for the centre of Birmingham.” (Leisure, motorways)
“Diversion signs were poor, needed more signs and an explanation of how you were going to get where you needed to get to.” (Leisure, ‘A’ road)
“Lack of visibility and the signs are too confusing to react to in time. They should impose a lower speed limit near the signs so people have time to react.” (Leisure, ‘A’ roads)
“Can be areas where there are too many signs. Also the VMS are left on too long after the event.” (Commuting, motorways)
“Too many, when you come into a village all you see is signs rather than the road.” (Leisure, ‘A’ road)
“Sometimes there's too much to take in, especially if you're at a busy junction and you're on your own.” (Leisure, motorways)
“Some are partially hidden by overhanging trees and bushes.” (Personal business, motorways)
“The direction signs on the side of the roads because if you get lorries on the inside you can miss your turn off, need to give more warning or more overhead signs.” (Leisure, motorways)
“There is a left turn off the A303 at Axminster - it is very badly signed and we missed the turn off.” (Leisure, ‘A’ road)
“There is a road sign telling people to get into lane but you can't see it because it is covered by a bush.” (Commuting, ‘A’ roads)
22
Good signage There were many positive comments about signage. A number of respondents liked that signage was clear, easy to see and stood out to them when driving.
Variable message signsVariable message signs (VMS) are electronic signs which many users, specifically those who had travelled on a motorway, focused on when asked about signage.
Getting information early increased satisfaction as this gave users sufficient warning to get in the correct lane or go in the right direction.
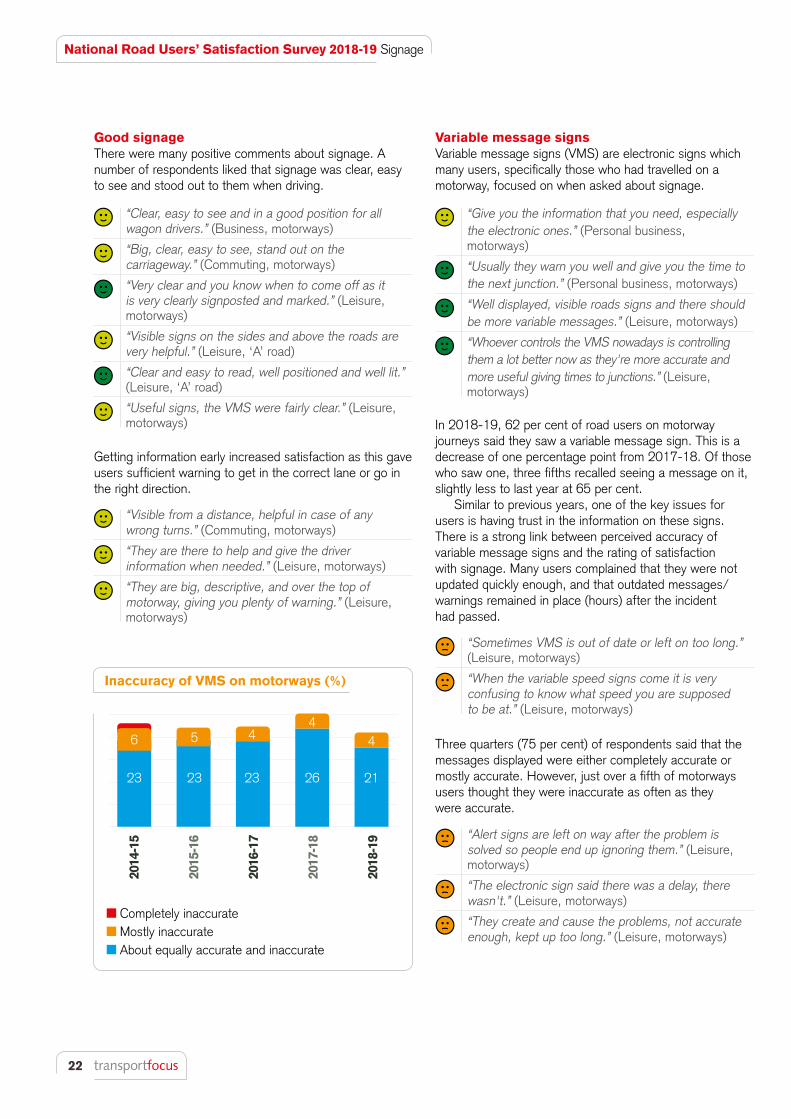
In 2018-19, 62 per cent of road users on motorway journeys said they saw a variable message sign. This is a decrease of one percentage point from 2017-18. Of those who saw one, three fifths recalled seeing a message on it, slightly less to last year at 65 per cent.
Similar to previous years, one of the key issues for users is having trust in the information on these signs. There is a strong link between perceived accuracy of variable message signs and the rating of satisfaction with signage. Many users complained that they were not updated quickly enough, and that outdated messages/ warnings remained in place (hours) after the incident had passed.
Three quarters (75 per cent) of respondents said that the messages displayed were either completely accurate or mostly accurate. However, just over a fifth of motorways users thought they were inaccurate as often as they were accurate.
“Visible from a distance, helpful in case of any wrong turns.” (Commuting, motorways)
“They are there to help and give the driver information when needed.” (Leisure, motorways)
“They are big, descriptive, and over the top of motorway, giving you plenty of warning.” (Leisure, motorways)
“Sometimes VMS is out of date or left on too long.” (Leisure, motorways)
“When the variable speed signs come it is very confusing to know what speed you are supposed to be at.” (Leisure, motorways)
“Alert signs are left on way after the problem is solved so people end up ignoring them.” (Leisure, motorways)
“The electronic sign said there was a delay, there wasn't.” (Leisure, motorways)
“They create and cause the problems, not accurate enough, kept up too long.” (Leisure, motorways)
National Road Users’ Satisfaction Survey 2018-19 Signage
“Clear, easy to see and in a good position for all wagon drivers.” (Business, motorways)
“Big, clear, easy to see, stand out on the carriageway.” (Commuting, motorways)
“Very clear and you know when to come off as it is very clearly signposted and marked.” (Leisure, motorways)
“Visible signs on the sides and above the roads are very helpful.” (Leisure, ‘A’ road)
“Clear and easy to read, well positioned and well lit.” (Leisure, ‘A’ road)
“Useful signs, the VMS were fairly clear.” (Leisure, motorways)
“Give you the information that you need, especially the electronic ones.” (Personal business, motorways)
“Usually they warn you well and give you the time to the next junction.” (Personal business, motorways)
“Well displayed, visible roads signs and there should be more variable messages.” (Leisure, motorways)
“Whoever controls the VMS nowadays is controlling them a lot better now as they're more accurate and more useful giving times to junctions.” (Leisure, motorways)
Completely inaccurate Mostly inaccurate About equally accurate and inaccurate
Inaccuracy of VMS on motorways (%)
2014
-15
2015
-16
2016
-17
2017
-18
2018
-19
6 5 4
23 23 23 26 21
44
23
2014-15 2015-16 2016-17 2017-18 2018-19
90 90 90 89 87
92 92 91 91 90
88 87 88 87 84
87
90
84
Overall
Motorway
Major ‘A’ road
Satisfied (%)
Motorways (satisfied %)
Yorks & N East
North West
Midlands
M25
East
South East
South West
2014-15 2015-16 2016-17 2017-18 2018-19
94 93 92 93 95
89 85 85 83 86
91 93 88 90 87
91 93 95 93 86
93 94 95 92 90
91 92 90 94 87
95 94 94 93 92
2014-15 2015-16 2016-17 2017-18 2018-19
95 85 87 88 91
81 71 84 71 90
92 93 87 89 87
93 87 92 92 79
90 85 86 82 82
84 88 87 90 78
81 87 94 86 90
Major ‘A’ roads (satisfied %)
Yorks & N East
North West
Midlands
M25
East
South East
South West
Yorkshire and the North East region had the highest satisfaction score for upkeep on motorways, whilst the North West M25 regions had the lowest. Yorkshire and
Satisfaction with the general upkeep of motorways and major ‘A’ roads was 87 per cent, down from 89 per cent in 2017-18 and the lowest recorded score so far.
Upkeep
Levels of satisfaction with upkeep of motorways and major ‘A’ roads
95
86
87
86
90
87
92
91
90
87
79
82
78
90
the North East region also scored highest for major ‘A’ roads whilst the South East region scored lowest.
24
National Road Users’ Satisfaction Survey 2018-19 Upkeep
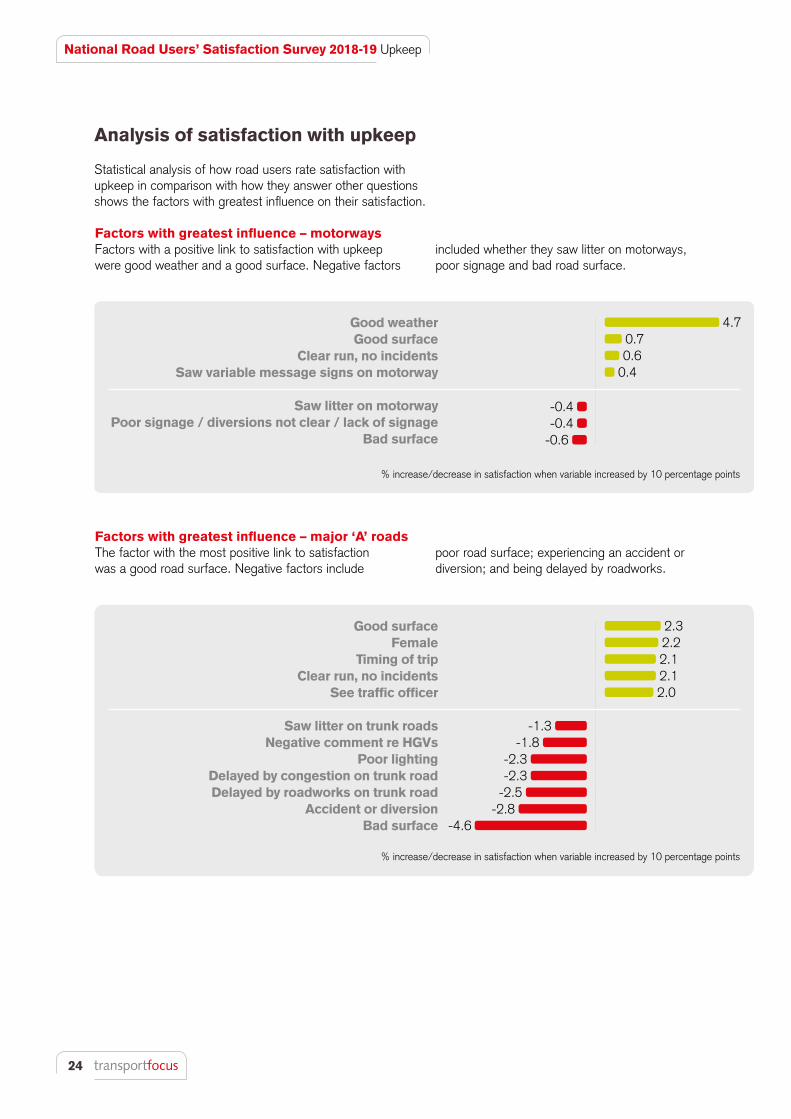
Statistical analysis of how road users rate satisfaction with upkeep in comparison with how they answer other questions shows the factors with greatest influence on their satisfaction.
Analysis of satisfaction with upkeep
4.7 0.7 0.6
0.4
2.3 2.2 2.1 2.1 2.0
-0.4 -0.4
-0.6
-1.3 -1.8
-2.3 -2.3
-2.5 -2.8
-4.6
Good surfaceFemale
Timing of tripClear run, no incidents
See traffic officer
Saw litter on trunk roadsNegative comment re HGVs
Poor lighting Delayed by congestion on trunk roadDelayed by roadworks on trunk road
Accident or diversionBad surface
Factors with greatest influence – motorways Factors with a positive link to satisfaction with upkeep were good weather and a good surface. Negative factors
Factors with greatest influence – major ‘A’ roads The factor with the most positive link to satisfaction was a good road surface. Negative factors include
% increase/decrease in satisfaction when variable increased by 10 percentage points
% increase/decrease in satisfaction when variable increased by 10 percentage points
Good weatherGood surface
Clear run, no incidentsSaw variable message signs on motorway
Saw litter on motorwayPoor signage / diversions not clear / lack of signage
Bad surface
poor road surface; experiencing an accident or diversion; and being delayed by roadworks.
included whether they saw litter on motorways, poor signage and bad road surface.
25
A poor road surface, specifically potholes, were mentioned by a number of respondents in addition to the noisy surfaces which all contributed to low levels of satisfaction.
Debris and overgrowthDebris was highlighted, with respondents referring to untidy areas at the roadside contributing to lower levels of satisfaction with upkeep.
Worn lines and road markingsThere were sections on the network where road users were dissatisfied with the quality of the road markings.
Poor lightingSome road users mention that poor lighting increases their opinion that the surface is poor and can also raise safety concerns.
A good surface is thought to be a bonus, and is a source of high satisfaction.
Dissatisfied road users principally mention the following in relation to upkeep:• poor road surface• poor lighting• debris/overgrowth • worn lines/road markings.
Users’ comments on their satisfaction and dissatisfaction
“Better than average, smooth road and my impression was there was not much rubbish but it was dark.” (Leisure, ‘A’ road)
“Since it has all been resurfaced, it is brilliant.” (Business, ‘A’ roads)
“Done loads of work recently, it's well tarmacked.” (Leisure, motorways)
“Some potholes and lane markings at junctions worn baldly.” (Leisure, motorways)
“Worn surfaces in places, the edging of lanes develops potholes and grooves.” (Business, motorways)
“White lines need re-doing, too much litter and some potholes too.” (Leisure, ‘A’ roads)
“Rubbish. Lot of potholes, a lot of paint that's gone from the road markings.” (Leisure, ‘A’ roads)
Potholes
“Potholes, rough surfaces, poor lighting, litter, tyres, a few dead animals like foxes.” (Commuting, motorways)
“The M54 is terrible for potholes.” (Leisure, motorways)
“These potholes are dangerous and need repairing.” (Leisure, ‘A’ roads)
“Poor lighting. Not indicating junctions, road not to a high standard. They do nothing to make road safe.” (Leisure, ‘A’ roads)
“Not well lit up and the surface is not very good.” (Leisure, ‘A’ roads)
“Lot of rubbish on the road, potholes, hedges need cutting back, they let grass grow too long and it attracts litter to settle in it.” (Leisure, ‘A’ roads)
“Vegetation at the side of the road needs cutting back more as sometimes you can't read the signs.” (Leisure, ‘A’ roads)
Noise
“Some horrible bumpy and noisy road surfaces.” (Leisure, motorways)
“Potholes and sound changes on rough parts of the road that make you worry about your tyres.” (Leisure, motorways)
“It has a poor surface that's noisy and bumpy, a lot of potholes and debris on it.” (Commuting, ‘A’ roads)
Rough and rutted surfaces
“Too many stones on the road and just general poor road maintenance.” (Leisure, motorways)
“M25 poor road surface in places.” (Business, motorways)
“So many potholes and the surface between the inside lane and the hard shoulder is just not fit for purpose. Too many HGV lorries have driven along it and made ruts between the lanes. Hard shoulder is not wide enough for wagons.” (Leisure, motorways)
“Terrible potholes, no lights on as well, general poor maintenance and too many poor foreign drivers on the A2 etc, especially lorries in overtaking lanes.” (Leisure, ‘A’ roads)
26
National Road Users’ Satisfaction Survey 2018-19 Upkeep
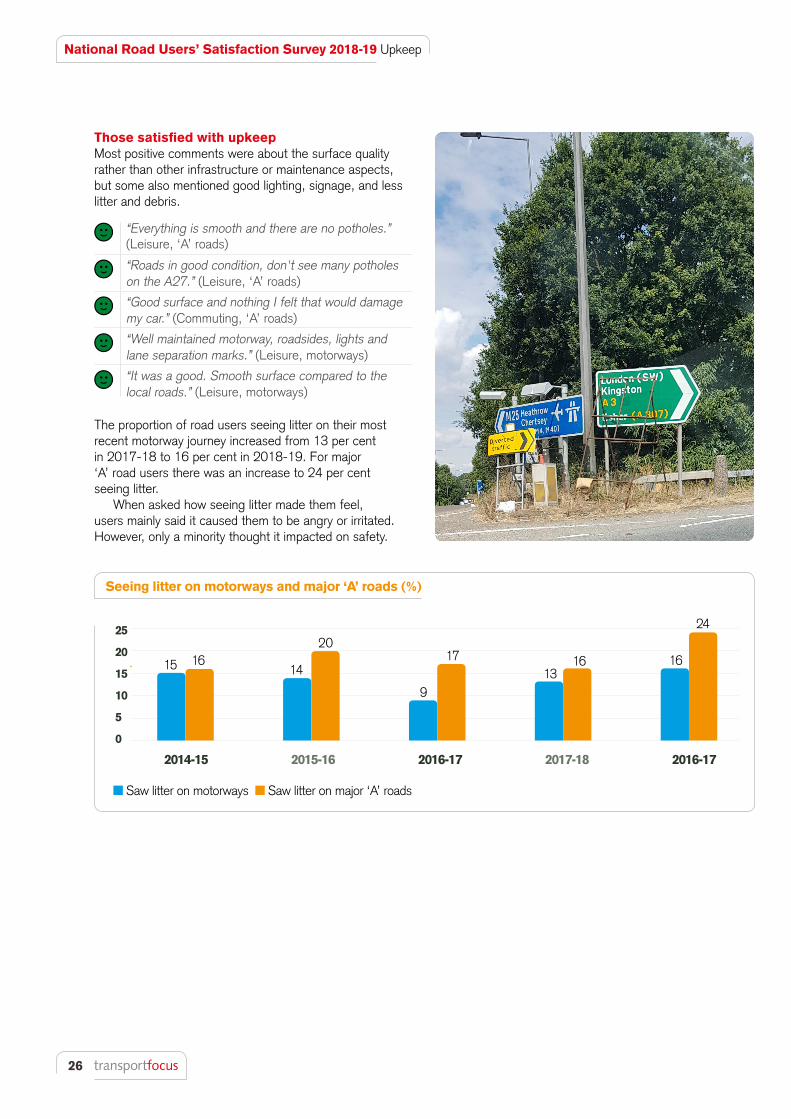
Those satisfied with upkeepMost positive comments were about the surface quality rather than other infrastructure or maintenance aspects, but some also mentioned good lighting, signage, and less litter and debris.
The proportion of road users seeing litter on their most recent motorway journey increased from 13 per cent in 2017-18 to 16 per cent in 2018-19. For major ‘A’ road users there was an increase to 24 per cent seeing litter.
When asked how seeing litter made them feel, users mainly said it caused them to be angry or irritated. However, only a minority thought it impacted on safety.
“Everything is smooth and there are no potholes.” (Leisure, ‘A’ roads)
“Roads in good condition, don't see many potholes on the A27.” (Leisure, ‘A’ roads)
“Good surface and nothing I felt that would damage my car.” (Commuting, ‘A’ roads)
“Well maintained motorway, roadsides, lights and lane separation marks.” (Leisure, motorways)
“It was a good. Smooth surface compared to the local roads.” (Leisure, motorways)
Seeing litter on motorways and major ‘A’ roads (%)
Saw litter on motorways Saw litter on major ‘A’ roads
2014-15 2015-16 2016-17 2017-18 2016-17
25
20
15
10
5
0
15 1614
20
9
1713
16
24
16
27
2014-15 2015-16 2016-17 2017-18 2018-19
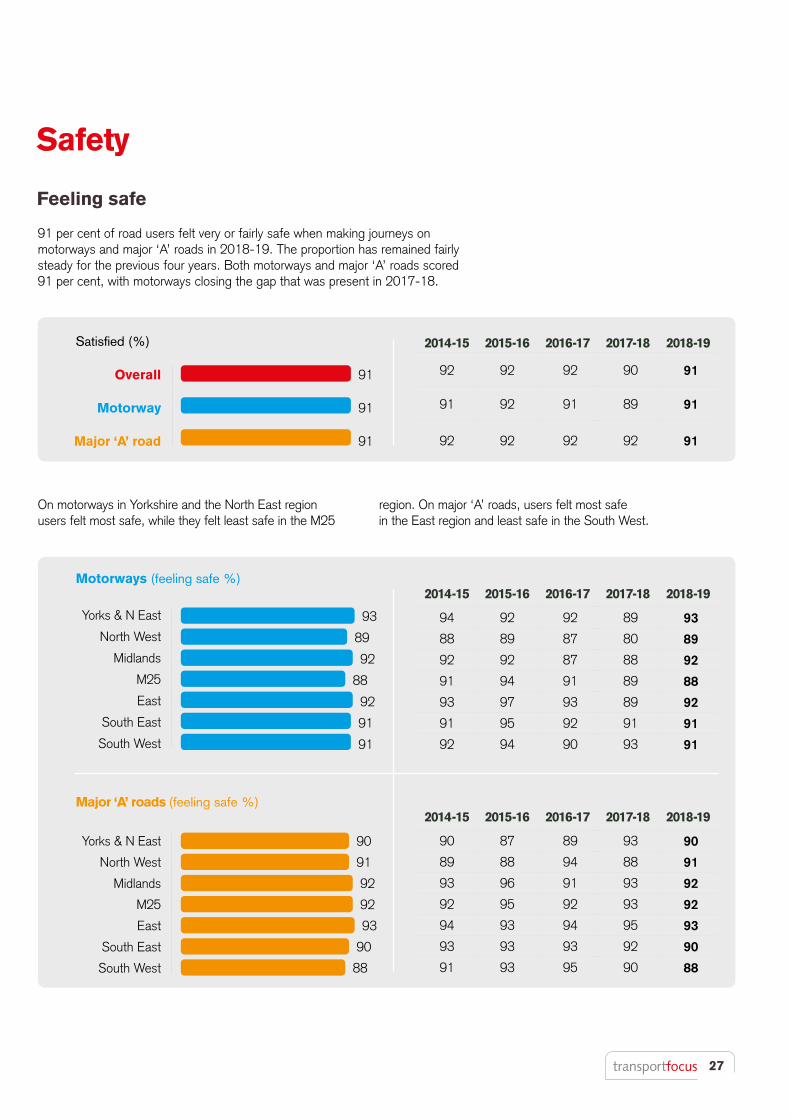
92 92 92 90 91
91 92 91 89 91
92 92 92 92 91
91
91
91
Overall
Motorway
Major ‘A’ road
Satisfied (%)
Motorways (feeling safe %)
Yorks & N East
North West
Midlands
M25
East
South East
South West
2014-15 2015-16 2016-17 2017-18 2018-19
94 92 92 89 93
88 89 87 80 89
92 92 87 88 92
91 94 91 89 88
93 97 93 89 92
91 95 92 91 91
92 94 90 93 91
2014-15 2015-16 2016-17 2017-18 2018-19
90 87 89 93 90
89 88 94 88 91
93 96 91 93 92
92 95 92 93 92
94 93 94 95 93
93 93 93 92 90
91 93 95 90 88
Major ‘A’ roads (feeling safe %)
Yorks & N East
North West
Midlands
M25
East
South East
South West
On motorways in Yorkshire and the North East region users felt most safe, while they felt least safe in the M25
91 per cent of road users felt very or fairly safe when making journeys on motorways and major ‘A’ roads in 2018-19. The proportion has remained fairly steady for the previous four years. Both motorways and major ‘A’ roads scored 91 per cent, with motorways closing the gap that was present in 2017-18.
Safety
Feeling safe
93
89
92
88
92
91
91
90
91
92
92
93
90
88
region. On major ‘A’ roads, users felt most safe in the East region and least safe in the South West.
28
National Road Users’ Satisfaction Survey 2018-19 Safety
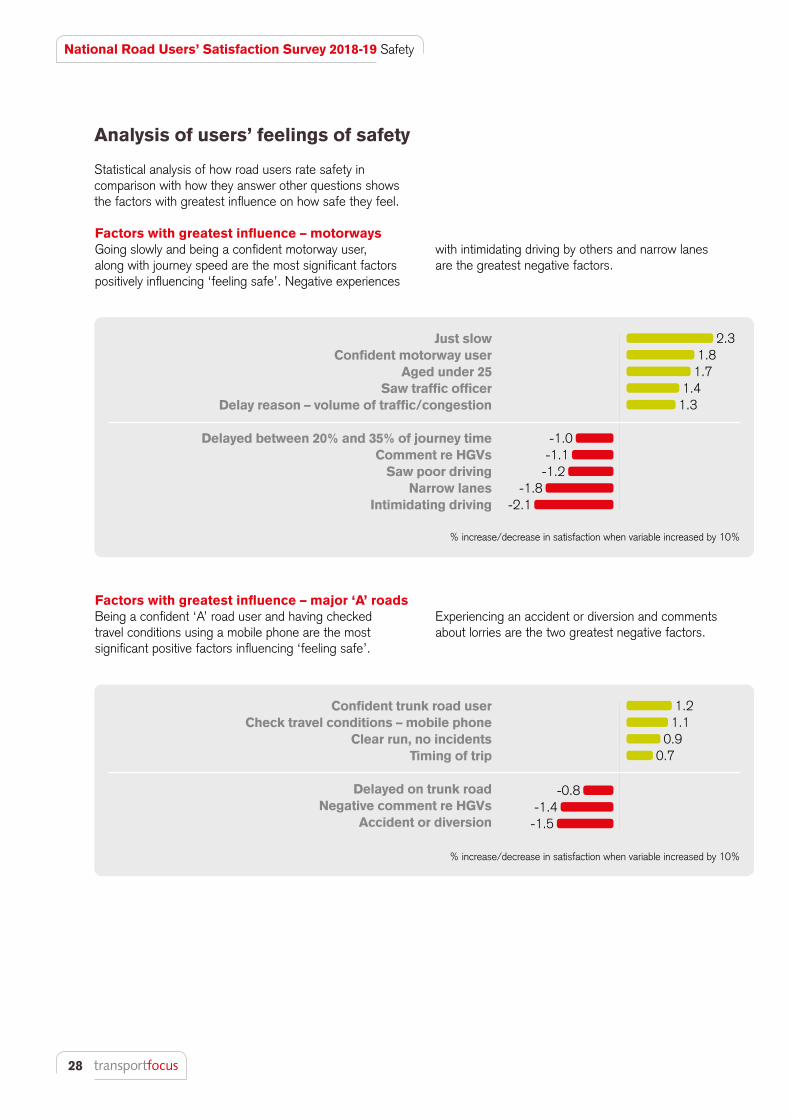
Statistical analysis of how road users rate safety in comparison with how they answer other questions shows the factors with greatest influence on how safe they feel.
Analysis of users’ feelings of safety
2.3 1.8
1.7 1.4
1.3
1.2 1.1
0.9 0.7
-1.0 -1.1
-1.2 -1.8
-2.1
-0.8 -1.4
-1.5
Just slowConfident motorway user
Aged under 25Saw traffic officer
Delay reason – volume of traffic/congestion
Delayed between 20% and 35% of journey timeComment re HGVs
Saw poor drivingNarrow lanes
Intimidating driving
Factors with greatest influence – motorwaysGoing slowly and being a confident motorway user, along with journey speed are the most significant factors positively influencing ‘feeling safe’. Negative experiences
Factors with greatest influence – major ‘A’ roadsBeing a confident ‘A’ road user and having checked travel conditions using a mobile phone are the most significant positive factors influencing ‘feeling safe’.
% increase/decrease in satisfaction when variable increased by 10%
% increase/decrease in satisfaction when variable increased by 10%
with intimidating driving by others and narrow lanes are the greatest negative factors.
Experiencing an accident or diversion and comments about lorries are the two greatest negative factors.
Confident trunk road userCheck travel conditions – mobile phone
Clear run, no incidentsTiming of trip
Delayed on trunk roadNegative comment re HGVs
Accident or diversion
29
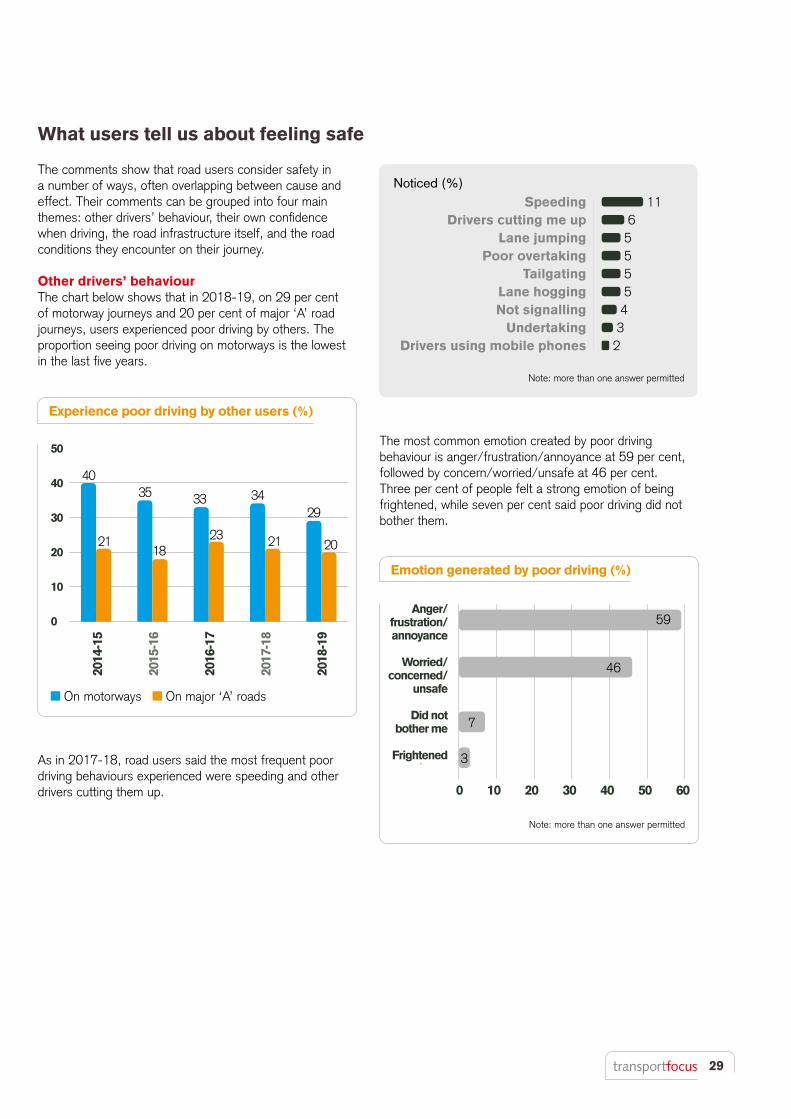
Other drivers’ behaviourThe chart below shows that in 2018-19, on 29 per cent of motorway journeys and 20 per cent of major ‘A’ road journeys, users experienced poor driving by others. The proportion seeing poor driving on motorways is the lowest in the last five years.
The comments show that road users consider safety in a number of ways, often overlapping between cause and effect. Their comments can be grouped into four main themes: other drivers’ behaviour, their own confidence when driving, the road infrastructure itself, and the road conditions they encounter on their journey.
As in 2017-18, road users said the most frequent poor driving behaviours experienced were speeding and other drivers cutting them up.
The most common emotion created by poor driving behaviour is anger/frustration/annoyance at 59 per cent, followed by concern/worried/unsafe at 46 per cent. Three per cent of people felt a strong emotion of being frightened, while seven per cent said poor driving did not bother them.
What users tell us about feeling safe
On motorways On major ‘A’ roads
50
40
30
20
10
0
40
21 2021
35
2934
18
33
23
Experience poor driving by other users (%)
Emotion generated by poor driving (%)
2014
-15
2015
-16
2016
-17
2017
-18
2018
-19
11 6
5 5 5 5
4 3
2
SpeedingDrivers cutting me up
Lane jumpingPoor overtaking
Tailgating Lane hoggingNot signalling
UndertakingDrivers using mobile phones
Noticed (%)
Note: more than one answer permitted
0 10 20 30 40 50 60
Anger/frustration/annoyance
Worried/concerned/
unsafe
Did not bother me
Frightened
59
46
3
7
Note: more than one answer permitted
30
National Road Users’ Satisfaction Survey 2018-19 Safety
The driver’s confidence and knowledge of the roadThe confidence of a driver (or how confident the passenger felt about the driver) gave a higher level of safety satisfaction. Other ways feelings of safety increased were how often they drive or how long they have been driving.
Users’ comments illustrate how accidents and dangerous driving by others affect their feelings of safety.
Users’ comments illustrate how other drivers’ behaviour affects their feelings of safety.
The following comments show that measures to manage speed and monitor behaviour contribute to feelings of safety:
First in general
“No one's paying attention, they are more worried about getting a speeding ticket than crashing into someone.” (Leisure, motorways)
“People swap lanes and there's nowhere to pull over if you break down and they travel too fast and swap lanes without indicating.” (Leisure, motorways)
“Speeders and drivers not indicating, driving too close, the standard of driving is generally poor.” (Leisure, motorways)
“Other people going too fast and swapping lanes, we rely on people's fast reactions too much, makes me feel vulnerable as they drive so fast and there's nowhere to stop if there are accidents.” (Leisure, ‘A’ road)
“People drive too fast and recklessly, even when it's raining.” (Business, ‘A’ road)
“Drivers tailgate and drive too fast.” (Leisure, ‘A’ road)
Then about more specific situations
“I never feel safe on the M25 through people driving poorly and erratic.” (Leisure, motorways)
“On the M25 yes and on the M4 no due to the roundabout at Junction 4 where there's so many lanes, it's confusing if you don't know it and people cut across lanes to get to where they need to go.” (Leisure, motorways)
“Very short slip roads on and off the A30.” (Leisure, ‘A’ road)
“I never feel safe on the M25 through people driving poorly and erratic.” (Leisure, motorways)
“There's the smart motorway now and hardly any traffic so no cars around and a smooth journey.” (Leisure, motorways)
“Smart motorways are good, safe.” (Business, motorways)
“It's a great motorway since the work was completed on this stretch.” (Personal business, motorways)
“More average speed cameras on the A roads so people don't drive as fast.” (Personal business, ‘A’ road)
“It is safer than the motorway as there are more cameras and a reduced speed limit.” (Leisure, ‘A’ road)
“I've been driving that road for 15 years and have seen very few accidents.” (Commuting, ‘A’ road)
“In a coach, makes me feel safe as it's bigger.” (Leisure, ‘A’ road)
“Very little traffic and I've got a safe car.” (Leisure, ‘A’ road)
“I'm used to driving, just take your time and keep to speed limits.” (Business, motorways)
“I'm a safe driver that keeps my distance but others are not safe.” (Leisure, motorways)
“I know how to drive properly on a motorway, don’t lane hog.” (Business, motorways)
“Due to accidents on there I tense up when I join it, think it's down to careless drivers because the road is good and straight.” (Leisure, motorways)
“Have had some bad experiences so in the back of my mind there is always concern as I have known of fatalities if there is an incident, need to be better informed.” (Personal business, motorways)
“Too many accidents on the A13.” (Leisure, ‘A’ road)
“Somebody doing around 90 mph cut right in front of me on the M48 near the diving centre.” (Leisure, motorways)
“Just this day as lanes were very narrow and changing over a long stretch with a speed restriction so you couldn't really get away from larger wagons that wouldn't let you pull over.” (Leisure, motorways)
“Somebody almost missed the turnoff and cut right in front of the ongoing traffic from the fast lane to the slip road.” (Leisure, motorways)
31
Infrastructure Good infrastructure and road conditions contributed positively to feeling safe. Roads being smooth, well-lit, free of debris, with vegetation being under control and having clear, accurate signage were mentioned by users.
Driving conditions Congestion contributed to feeling unsafe as vehicles travel closer together than they might otherwise and delays cause frustration, leading to poor driving.
“The road is being looked after and there are new cat's eyes so the road is good.” (Business, ‘A’ road)
“It's got cats eyes and fluorescent markings so fine.” (Commuting, ‘A’ road)
“They have put an extra lane in, it has 4 lanes and they have a filter lane joining the M1 which is so much safer.” (Leisure, motorways)
“People drive too fast and recklessly, even when it's raining.” (Business, ‘A’ road)
“The rain was really heavy at times, a lot of water on the roads.” (Leisure. ‘A’ road)
“It was pouring with rain and heavy traffic.” (Leisure, motorways)
“Weather, it was raining and there was a lot of surface water and it was windy.” (Leisure, motorways)
“Other people's terrible driving, driving far too close.” (Leisure, motorways)
“Short slip road off the M6 for Crewe and a downward bend causes accidents with people queuing and people going too fast into the back of them.” (Leisure, motorways)
“Speeders and drivers not indicating, driving too close, the standard of driving is generally poor.” (Leisure, motorways)
Sometimes road users feel safe, but the road conditions or infrastructure still impacts on their feelings of safety.
Poor weather conditions on specific journeys was a point noted by some and can affect the level of satisfaction.
Road layouts
“Clear, good road signs but the road surfaces could be better as the surfaces change.” (Commuting, motorways)
“Experienced, as a motorway driver it's a concern if I breakdown there's no hard shoulder.” (Leisure, motorways
Quality of the road surface
“Road surfaces, some parts are single lane and bendy and narrow and some are four lanes.” (Commuting, ‘A’ road)
“Very poor surfaces in places. Made driving dangerous with people avoiding potholes.” (Leisure, motorways)
Narrow lanes
“Where the width is narrow you do not have enough space and especially when there is a lorry you don't have room to get past.” (Business, motorways)
“Bad weather and a narrow lane with the concrete barrier and nowhere to go.” (Commuting, ‘A’ road)
Road markings and lighting
“More lighting would be good, weather good and clear.” (Leisure, motorways)
“The slip road junction 7 off the M54 when coming off the slip road it's very dark and needs some form of lighting, there's a camber on the road and it's long to the junction and could do with cat's eyes.” (Leisure, ‘A’ road)
32
National Road Users’ Satisfaction Survey 2018-19 Safety
Presence of lorries Lorries on the roads in conjunction with narrow lanes was often mentioned as a cause of feeling unsafe. Respondents mentioned the driver behaviour or the size of the vehicle as additional reasons as to why the presence of lorries caused them to feel unsafe.
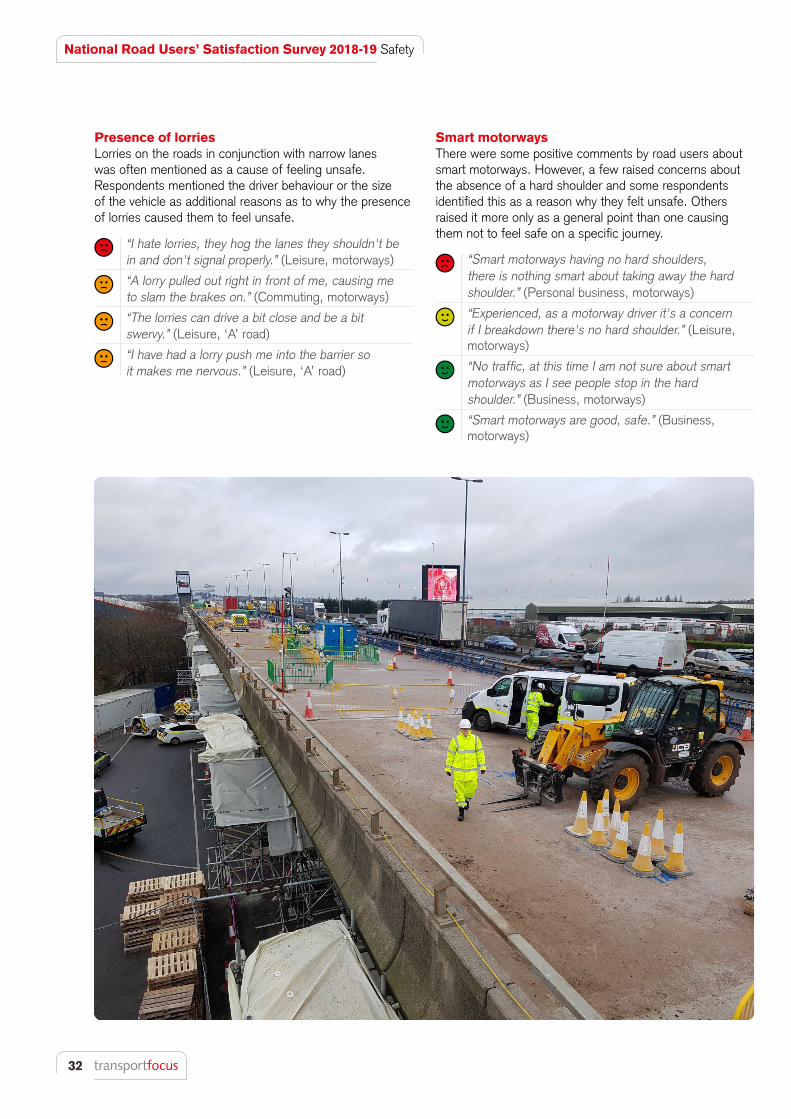
Smart motorwaysThere were some positive comments by road users about smart motorways. However, a few raised concerns about the absence of a hard shoulder and some respondents identified this as a reason why they felt unsafe. Others raised it more only as a general point than one causing them not to feel safe on a specific journey.
“I hate lorries, they hog the lanes they shouldn't be in and don't signal properly.” (Leisure, motorways)
“A lorry pulled out right in front of me, causing me to slam the brakes on.” (Commuting, motorways)
“The lorries can drive a bit close and be a bit swervy.” (Leisure, ‘A’ road)
“I have had a lorry push me into the barrier so it makes me nervous.” (Leisure, ‘A’ road)
“Smart motorways having no hard shoulders, there is nothing smart about taking away the hard shoulder.” (Personal business, motorways)
“Experienced, as a motorway driver it's a concern if I breakdown there's no hard shoulder.” (Leisure, motorways)
“No traffic, at this time I am not sure about smart motorways as I see people stop in the hard shoulder.” (Business, motorways)
“Smart motorways are good, safe.” (Business, motorways)
33
The National Road Users’ Satisfaction Survey (NRUSS) is the official measure of customer satisfaction among users of the Highways England road network. The survey in its current form has been running since April 2011. In April 2015 responsibility for running the motorways and major ‘A’ roads changed. A related change was that customer satisfaction is now measured independently by Transport Focus, starting in April 2016. Transport Focus decided, given the importance of trend data and that it was a formal Highways England target, to continue with NRUSS unchanged in the short-term. Transport Focus appointed AECOM to conduct the survey on its behalf. It has carried out the survey for the Highways Agency/Highways England since April 2011.
The main aspects of the methodology are detailed here and further information can be obtained by contacting Transport Focus.
Conducting the surveyEach year around 2000 users of the roads managed by Highways England are interviewed face-to-face in their homes. To take part, respondents must be aged 17 or over and have used a Highways England-managed road within the previous 12 months. The survey aims to achieve interviews evenly across each of Highways England’s seven regions: Yorkshire and North East, North West, Midlands, M25, East, South East, and South West.
Each month, six sample areas are chosen within each region making 42 sample areas per month. Sample areas are selected at random from all possible postcodes within that region. The selected postcodes provide the start location from which interviewers will approach homes to request an interview. Within each sample area an interviewer has to secure interviews that meet the following criteria:• gender: two men and two women• driver/passenger: minimum three drivers• age: minimum one person from each of the
17 to 34, 35 to 64, and 65+ age groups• employment: minimum two employed
These criteria were set based on usage of Highways England’s roads.
The questionnaire asks about their most recent journey on Highways England’s roads. Where that journey was a return journey, only the outward or return leg is asked about (chosen at random). The questions cover general trip experience and satisfaction with five key performance areas: journey time, safety, roadworks management,
information/signage, and general upkeep. The results are not weighted.
Measure Sample size 2018-19
Motorways Major ‘A’ roads
Overall satisfaction* 1305 1271
Satisfaction with journey times, upkeep, and safety at regional level**
250 206
Satisfaction with roadworks management (all regions’ results are combined – as only a proportion of users experience roadworks)
460 159
* These numbers added together exceed 2000 because some journeys involved use of a motorway and a major ‘A’ road.
** The approximate number of responses across each of the seven regions and across the four key performance areas. Two regions with notably fewer responses are the North West and M25 for major ‘A’ roads with around 60 and 140 respectively (both areas being predominantly motorways). Exact sample size numbers for each region/question can be supplied on request.
Sample sizesWith 42 sample areas each month and four completed interviews per sample area, there are around 2000 interviews achieved each year. Some users will have used only motorways, some only major ‘A’ roads, some both. The exact sample size for any result quoted is available from Transport Focus. However the table below gives approximate sample sizes for the results shown in this report. The number of interviews carried out in 2018-19 was not significantly different from previous years.
Overall satisfaction calculationThe overall satisfaction score is derived from the scores achieved for the five key performance areas. It is not generated from a direct question. The basis of the calculation is below:
Appendix: survey method
Introduction
Overall satisfaction score =
+(Nm)
+(Rm x Nm) (Rt x Nt)
(Nt)
34
National Road Users’ Satisfaction Survey 2018-19 Methodology
• Where Rm is the satisfaction score for that key performance area for motorways
• Where Rt is the satisfaction score for that key performance area for major ‘A’ roads
• Where Nm is the total number of responses for that key performance area for motorways
Factors of influence chartsNRUSS asks direct satisfaction questions for each of the five key performance areas for both motorways and major ‘A’ roads – 10 measures in all. For each of these, statistical analysis has been conducted to look at how all the other questions in the survey have been answered, to identify those with greatest influence on satisfaction in the key performance area concerned. The analysis includes answers from the questions asked directly and from ‘coding’ what users said were the reasons for their views.
The statistical process used was ‘logistic regression modelling’ which treats the dependent variable (the key performance area rating) as either zero = not satisfied
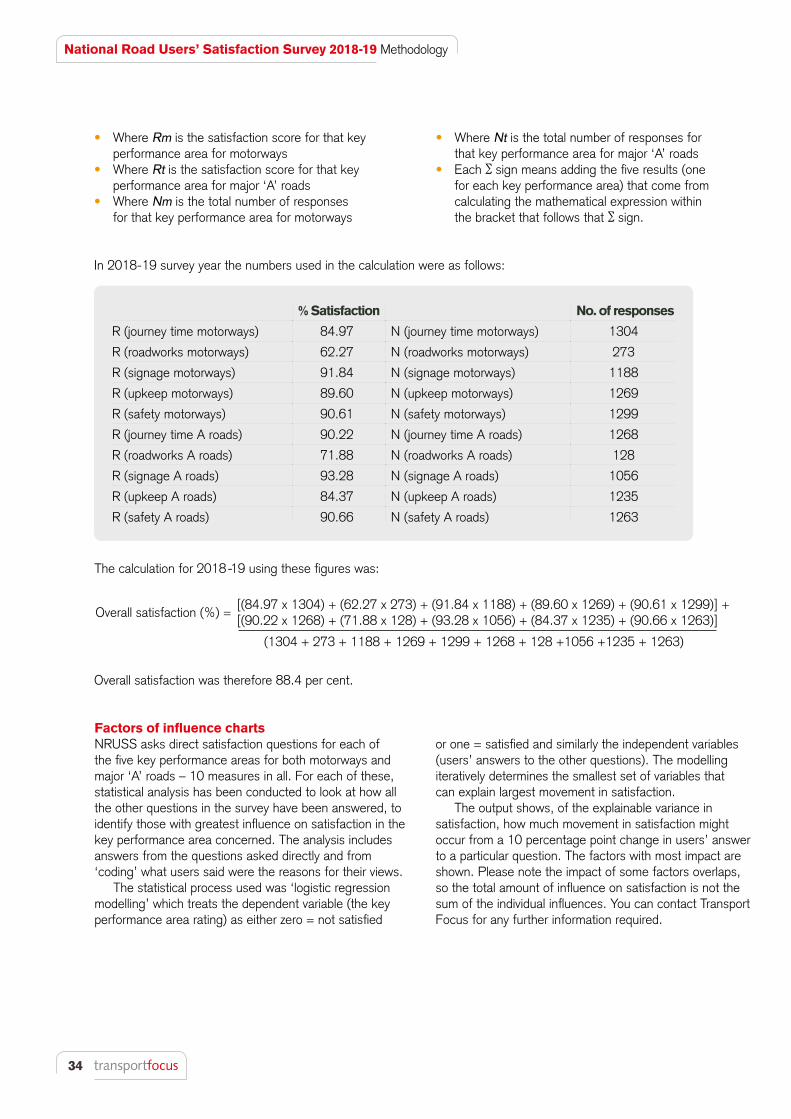
In 2018-19 survey year the numbers used in the calculation were as follows:
% Satisfaction No. of responses
R (journey time motorways) 84.97 N (journey time motorways) 1304
R (roadworks motorways) 62.27 N (roadworks motorways) 273
R (signage motorways) 91.84 N (signage motorways) 1188
R (upkeep motorways) 89.60 N (upkeep motorways) 1269
R (safety motorways) 90.61 N (safety motorways) 1299
R (journey time A roads) 90.22 N (journey time A roads) 1268
R (roadworks A roads) 71.88 N (roadworks A roads) 128
R (signage A roads) 93.28 N (signage A roads) 1056
R (upkeep A roads) 84.37 N (upkeep A roads) 1235
R (safety A roads) 90.66 N (safety A roads) 1263
The calculation for 2018-19 using these figures was:
Overall satisfaction was therefore 88.4 per cent.
• Where Nt is the total number of responses for that key performance area for major ‘A’ roads
• Each sign means adding the five results (one for each key performance area) that come from calculating the mathematical expression within the bracket that follows that sign.
or one = satisfied and similarly the independent variables (users’ answers to the other questions). The modelling iteratively determines the smallest set of variables that can explain largest movement in satisfaction.
The output shows, of the explainable variance in satisfaction, how much movement in satisfaction might occur from a 10 percentage point change in users’ answer to a particular question. The factors with most impact are shown. Please note the impact of some factors overlaps, so the total amount of influence on satisfaction is not the sum of the individual influences. You can contact Transport Focus for any further information required.
Overall satisfaction (%) =
(1304 + 273 + 1188 + 1269 + 1299 + 1268 + 128 +1056 +1235 + 1263)
[(84.97 x 1304) + (62.27 x 273) + (91.84 x 1188) + (89.60 x 1269) + (90.61 x 1299)] + [(90.22 x 1268) + (71.88 x 128) + (93.28 x 1056) + (84.37 x 1235) + (90.66 x 1263)]

35
Transport Focus is the operating name of the Passengers’ Council. This survey was published in October 2019. © 2019 Transport FocusDesign by www.heritamacdonald.com
Transport Focus is the independent consumer organisation representing the interests of:
• all users of England’s motorways and major ‘A’ roads (the Strategic Road Network)
• rail passengers in Great Britain• bus, coach and tram users across England
outside London.
We work to make a difference for all transport users
Contact Transport Focus
Any enquiries about this research
should be addressed to:
Murray Leader
Senior Insight Advisor
Transport Focus
0300 123 0843
www.transportfocus.org.uk
Fleetbank House
2-6 Salisbury Square
London
EC4Y 8JX
Transport Focus is the operating
name of the Passengers’ Council