national research flagships water for a healthy country ... · gbe global business environment ghd...
TRANSCRIPT
UNCHARTED WATERSInfluences on the Australian urban water sector
Water for a Healthy Country
N AT I O N A L R E S E A R C H
FLAGSHIPS
UNCHARTED WATERSInfluences on the Australian urban water sector
ISBN: 0 643 09248 X
The Water for a Healthy Country National Research Flagship is a research partnershipbetween CSIRO, state and Australian governments, private and public industry and otherresearch providers.
The Flagship was established in 2003 as part of the CSIRO National Research FlagshipInitiative.
The work contained in this report is a collaboration between Nosco Consulting and the Waterfor a Healthy Country Flagship.
© Commonwealth of Australia 2005 All rights reserved.
This work is copyright. Apart from any use as permitted under the Copyright Act 1968, nopart may be reproduced by any process without prior written permission from theCommonwealth.
Citation: Nosco Consulting 2005, Uncharted Waters: Influences on the Australian urbanwater sector. CSIRO: Water for a Healthy Country National Research Flagship, Canberra.
DISCLAIMER
This report has been produced by Nosco Consulting for CSIRO Water for a Healthy Country.
While all due care and attention has been taken to establish the accuracy of the materialpublished, CSIRO and the authors—Nosco Consulting—disclaim liability for any loss whichmay arise from any person acting in reliance upon the contents of this document.
For further information contact:
Ph: 02 6246 4565
Fax: 02 6246 4564
<www.csiro.au>
July 2005
WA
TE
R F
OR
A H
EA
LT
HY
CO
UN
TR
Y –
Un
ch
arte
d w
ate
rs
iii
Contents
ACKNOWLEDGMENTS .............................................................................................................. v
ABBREVIATIONS ....................................................................................................................... vi
EXECUTIVE SUMMARY ........................................................................................................... vii
Uncharted waters ........................................................................................................................................................................................................... viii
Key influencers ................................................................................................................................................................................................................. viii
1. INTRODUCTION...................................................................................................................... 1
1.1 Aim ............................................................................................................................................................................................................................................ 1
1.2 Approach to developing the paper ...................................................................................................................................................... 1
1.3 Structure ............................................................................................................................................................................................................................. 2
1.4 The seven key influencers ............................................................................................................................................................................2
2. GLOBALISATION AND LIBERALISATION ............................................................................ 4
2.1 A well-connected world .....................................................................................................................................................................................4
2.2 Global trends ................................................................................................................................................................................................................ 5
2.3 Urban water industry global liberalisation and competition ................................................................................... 6
But what if …? ........................................................................................................................................................................................................................ 7
3. PEOPLE AND INSTITUTIONS ................................................................................................ 9
3.1 Cultural values ............................................................................................................................................................................................................ 9
3.2 Governance ................................................................................................................................................................................................................ 10
3.3 Urban water sector institutional liberalisation .................................................................................................................... 11
But what if …? .................................................................................................................................................................................................................... 13
4. POPULATION ........................................................................................................................ 14
4.1 Population size and growth ..................................................................................................................................................................... 15
4.2 Skilled workforce .................................................................................................................................................................................................. 16
But what if…? ...................................................................................................................................................................................................................... 17
5. CLIMATE & ENVIROMENTAL CHANGE .............................................................................. 18
5.1 The environmental trends .......................................................................................................................................................................... 18
5.2 Water use and its environmental impact ................................................................................................................................. 18
iv
5.3 Variability in annual rainfall ...................................................................................................................................................................... 19
5.4 Global warming and sea-level rise ................................................................................................................................................. 19
5.5 Australia’s climate change ........................................................................................................................................................................ 20
But what if …? .................................................................................................................................................................................................................... 21
6. ENERGY AND GREENHOUSE GAS .................................................................................... 22
6.1 Australia’s greenhouse gas emissions ...................................................................................................................................... 22
6.2 Energy supply and price ............................................................................................................................................................................. 22
But what if …? .................................................................................................................................................................................................................... 25
7. SCIENCE AND TECHNOLOGY ............................................................................................ 26
7.1 New technology ..................................................................................................................................................................................................... 26
7.2 Water management – what is possible ..................................................................................................................................... 27
But what if …? .................................................................................................................................................................................................................... 29
8. WATER USE AND MANAGEMENT ...................................................................................... 30
8.1 Availability and reliability of supply ................................................................................................................................................. 30
8.2 National transition toward a more sustainable use of water ............................................................................. 21
8.3 Water services infrastructure ................................................................................................................................................................ 34
But what if …? .................................................................................................................................................................................................................... 34
9. CONCLUSION ....................................................................................................................... 36
Key influencers ................................................................................................................................................................................................................. 36
APPENDIX A SCENARIOS ....................................................................................................... 39
Shell Global Scenarios ............................................................................................................................................................................................ 39
Sydney Water Corporation ................................................................................................................................................................................. 40
Aspire Australia 2025 ................................................................................................................................................................................................ 41
Water and Sustainable Development, Global Scenarios 2000 – 2050 .......................................................... 41
Watercourse – Navigating Your Utility’s Future .......................................................................................................................... 43
REFERENCES .......................................................................................................................... 44
WA
TE
R F
OR
A H
EA
LT
HY
CO
UN
TR
Y –
Un
ch
arte
d w
ate
rs
v
We acknowledge CSIRO staff includingNick Abel, Stewart Burn, Steven Cork,Colin Creighton, Chris Davies, Tony Flimer,Barney Foran, Bruce Lee, Ted Lefroy,Shiroma Maheepala, Scott Maves, GraceMitchell, Craig Roy, Brian Ryan, GeoffSyme, John Wright and Mike Young fortheir input and advice.
Other advisors include:
❚ Kevin Goss, Murray Daring BasinCommission
❚ Ross Young, Water Services Associationof Australia (WSAA)
❚ Dr Tony Preistly, CRC Water Qualityand Treatment
❚ Dr Judi Hansen, Sydney WaterCorporation
❚ Dr Cynthia Mitchell, Institute ForSustainable Futures
We acknowledge Carol Howe and Roel Plantfor their direction and editing of this report.
Special thanks to Sydney Water Corporation,Curtin University and Intelligence ScanningNetwork for sharing their scenario planningexperiences and scanning information onurban water management.
Acknowledgments
vi
Abbreviations
AGO Australian Greenhouse Office
BCA Business Council of Australia
CoAg Council of Australian Governments
GBE Global Business Environment
GHD Gutteridge, Haskins & Davey
NGO non-government organisation
NIC National Intelligence Council
NLWRA National Land and Water Resources Audit
OECD Organization for Economic Co-Operation and Development
SARS severe acute respiratory syndrome
UK United Kingdom
UN United Nations
UNESCO United Nations Educational, Scientific and Cultural Organisation
US United States
WSAA Water Services Association of Australia
WA
TE
R F
OR
A H
EA
LT
HY
CO
UN
TR
Y –
Un
ch
arte
d w
ate
rs
vii
Developing sustainable water managementoptions requires thinking about the future,thinking about:
❚ how community needs and industryoperating conditions may change;
❚ the best strategies for catching theopportunities and managing the threats;and
❚ where to invest.
This is particularly important since untilrecently the water sector has been relativelyinsulated from many of the dramatic changesoccurring in other sectors within theAustralian community.
Stakeholders in the water sector are nowmaking decisions that have long-termimpacts in increasingly volatile conditions.
We view the future as one of opportunitiesthat bring uncertainty and challenges forurban water management.
We are in the midst of a worldwide,revolutionary change, with an uncertainoutcome. Part of the uncertainty has to donot just with events but with humanattitudes and reactions towards those events.People can react with hope and seize theopportunities … or they can react with fearand try and erect barriers to liberalisationto protect what they value.
GBE 2002
Most importantly, we recognise that theurban water sector is an integral part of thewider Australian community, and thereforeinterconnected with the global community.
POSSIBLE FUTURES
We face an infinite number of possiblefutures. This paper is a snapshot, asummation building on the work that othershave done. It discusses the key influencers—the ‘big ticket items’—that are likely to shapeurban water management over the next 20years. These influencers will impact on howsystems work and will cause importantevents and trends to occur.
Selection of the influencers and their specificfactors is based on:
❚ a review of scenarios undertaken by arange of organisations;
❚ a literature search, scanning 20-year plansundertaken by the states/territories andauthorities for the water sector; and
❚ input from researchers and peopledirectly involved in the water and alliedsectors.
Selection was made in the realisation of aneed to look outside the industry itself andpick up those big picture events that maychange the water sector’s present direction.
The purpose of this paper is to provide abasis for scenario planning, a collaborativeprocess, that involves a high level ofstakeholder engagement. It aims to stimulatedebate among urban water managers anddecision makers on the nature of the worldin 2024 and how it will effect planning.
Scenario development provides a mechanismto explore the interaction of the influencersand how they may roll out over time. Toillustrate how this can take shape a selectionof scenarios have been included in AppendixA: scenarios.
Executive summary
SCENARIO PLANNING
Scenarios are not a prediction about the future but tools for thinkingabout the future. Unlike forecasts which impose patterns extrapolatedfrom the present they explore wider possibilities. Scenarios are notprophecies. They incorporate a spectrum of ideas to create coherentand credible alternative stories about the future. Scenario planningis a tool designed to assist us to challenge assumptions, focus on keyuncertainties, understand the key influencers, and test strategies andplans. Scenarios are not about selecting the right ‘forecast’ but aboutaccepting uncertainties and making it part of our thinking.
viii
This paper also includes a series of ‘What if…’ pictures of possible futures that may bedriven by a particular influencer. You areencouraged to develop your own views ofhow the influencers and their interactionsmay create a different future. You are alsoencouraged to consider whether there areother influencers that will cause majordiscontinuities.
All decisions are taken against an uncertainfuture. These decisions can be difficult, as weare often trapped by the values andexperiences that influence our views on whatthe future may be like. Water authoritiesboth public and private, regulators, andgovernments need to choose those strategiesthat are of the most benefit even in differentfutures. This can be made easier by assessingthe options against possible scenarios.
UNCHARTED WATERS
By 2024 the urban water sector will havebeen shaped by significant events. How thoseevents shape the future will be determined bythe Australian community’s social values andits system of governance. These factors willalso be influenced by events.
It will be a bumpy ride to 2024, with manytwists and turns, and there are no road maps.Globalisation, liberalisation and informationtechnology, will make the journey one ofbreakneck speed.
❚ The global community will need to dealwith significant climate andenvironmental changes. These changeswill dominate initiatives in both urbanwater and energy sectors.
❚ Science and new technologies will offerus new choices and opportunitiesespecially in the areas of biotechnologyand information technology.
❚ We will face more pressure to change ourinstitutions and by 2024 the shape ofgovernment and business, and the waythey operate will be quite different.
❚ Australians will be older and there will bemore of us. We can speculate how thismay influence our values and willingnessto engage in the new world.
KEY INFLUENCERS
The seven key influencers for the urbanwater sector look at different possibledevelopments, and consequently new risksand opportunities that the water sectormight face. They have been identified as:
❚ globalisation and liberalisation;
❚ people and institutions;
❚ population;
❚ climate and environmental change;
❚ energy and greenhouse gas;
❚ science and technology; and
❚ water use and management.
These influencers emphasise the‘uncertainties’ rather that the predeterminedelements.
Influencer 1 – Globalisation andliberalisation
The primary shapers of Australia’s future—globalisation, liberalisation and the uptake ofnew technology—are unstoppable. We willbe more interdependent on the globalcommunity, and will experience a period ofrapid change and uncertainty.
Water sector: In 20 years the water sector’soperating environment will be founded onglobal events. Industry direction willincreasingly be determined from ‘outside’ by,for example, non-government organisations,commercial interests or the US. The waterindustry will need to be globally competitiveand adaptable.
WA
TE
R F
OR
A H
EA
LT
HY
CO
UN
TR
Y –
Un
ch
arte
d w
ate
rs
ix
Influencer 2 – People and institutions
The relative importance of all the changeinfluencers will be determined by thecommunity’s willingness to embrace changeand government structures, together with theway in which they interact.
Water sector: If the Australian Governmentpursues market liberalisation, as a result ofthe Council of Australian Governments(CoAG) reforms and internationalcompetition, can the sector make thenecessary changes to its systems and culture?The risks are:
❚ the entry of global competitors and the‘cherry picking’ of services;
❚ elimination of cross subsidies; and
❚ stranding of assets.
There may be opportunities to re-position orconverge to form multi-utilities, or theindustry may move towards multipleparticipants with a distributed infrastructurenetwork.
Influencer 3 – Population
Australia’s population will increase and age.At the same time, populations in theunderdeveloped countries will grow fasterand be younger. The combination ofpopulation growth and urbanisation willfoster instability in neighbouring countries.Australia is at risk of a ‘brain drain’ withyoung people moving oversees.
Water sector: There is likely to be a growthand change in demand for urban waterservices, particularly along the east coast. Theindustry is likely to suffer a shortfall of skillsduring a period of rapid change.
Influencer 4 – Climate and environmentalchange
Exact impacts of global warming areuncertain—Australia is likely to be hotterand dryer, with more extreme weatherconditions.
Water sector: There will be an increaseddemand for water, reduced yields andincreased variability.
Influencer 5 – Energy and greenhousegas emissions
Australia will have sufficient energy to meetdemands for population and economicgrowth. However, environmentalconsiderations will dominate the energysector’s initiatives. Advances are being madeto increase efficiency in energy production,and to develop sustainable alternative energysources. We could become a hydrogensociety.
Water sector: The water sector is likely toexperience some increases in prices forenergy, but prices may become volatile. Theindustry will be accountable for itsgreenhouse gas emissions.
Influencer 6 – Science and technology
The next 20 years will see a further spread ofinformation technology and the applicationof new bio-technologies. Nano-technology,sensor technologies and bio-markers offer anextraordinary range of applications andbenefits.
Water sector: The use of bio-technology toinfluence landscape-scale ecological process,improved efficiencies in water use,breakthroughs in membrane technology,solutions for local retention of stormwaterand sewage disposal, will create new ways ofdelivering water services.
x
Influencer 7 – Water use andmanagement
A shift to higher value use of water is likelyin response to the recognition of the need forsustainable use, increasing prices, changes ininstitutional structures and recognition ofthe value of water.
Water sector: Over the next 20 years theurban sector is likely to have wrestled withthe sustainability issues and come to gripswith managing demand, pricing and value.
The next 20 years will be a period ofincreased instability for the urban watersector. This will create new risks but alsoopportunities. Analysing how theseinfluences interact and roll out over thisperiod of time is a function of the scenarioplanning process.
A BETTER WORLD?
Since 1980 there have been increases in ‘world development’ indicators:
❚ life expectancy—increased from 61 to 68 years; in developingcountries it increased from 58 to 65 years
❚ adult literacy—increased from 63% to 75%
❚ primary school enrolment—increased from 81% to 90%
❚ secondary school enrolment—increased from 60% to 68%; forthe poorest counties it increased from 49% to 59%
❚ percentage of women of childbearing age in the poorest countrieswith access to contraception—increased from 4% to 35%
❚ cereal production per hectare increased by 20%
❚ infant mortality fell from 8% to 5.4%; in the poorest countries itfell from 9.7% to 6.8%.
Income inequity is rising, but the gap in human development is falling.
World Development Indicators, Shell
WA
TE
R F
OR
A H
EA
LT
HY
CO
UN
TR
Y –
Un
ch
arte
d w
ate
rs
1
1. Introduction
1.1 AIM
We all need to plan for the future. The urbanwater sector faces many uncertainties andpossible different futures—it may betransformed by issues that are bothconceivable and inconceivable at this presentpoint in time. Water authorities, businesses,regulators and governments need to selectstrategies that can create benefits even in verydifferent futures.
The aim of this discussion paper is tostimulate debate among urban watermanagers and decision makers on the natureof the world in 2024 and how it will effectplanning.
It identifies the influencers—the processesthat have a high influence on how systemswork, and that cause important events andtrends to occur. Almost all processes are bothinfluenced and influence other processes.They are the forces that will shape theenvironment. Those that will persist and canbe forecasted, and how change may occur isunknown.
1.2 APPROACH TO DEVELOPINGTHE PAPER
We face an infinite number of possiblefutures. This paper is a snapshot, asummation building on the work that othershave done. Selection of the influencers andtheir specific factors included in this paperemerged from:
❚ a review of scenarios undertaken by anumber of water and other organisations(national and international);
❚ a review of studies on trends;
❚ literature research;
❚ scanning of 20-year plans undertaken bythe states/territories and authorities forthe water sector; and
❚ input from researchers and peopledirectly involved in the water and alliedsectors.
Selection of the influencers was made in thecontext of a recognition of a need to lookoutside the water sector and pick up thosebig picture events that may change theindustry’s view of the direction of the sector.Trends and predetermined events that arewell understood by the water industry andhave been already been incorporated in theirlong-range plans were not included.
From the outset, the research sought toidentify:
❚ those issues about the future that couldturn the water sector upside down;
❚ what is making people feel enthusiasticand optimistic; and
❚ what is keeping them awake at night.
This paper discusses the key influencers or ‘big ticket items’ that are likely to shape urbanwater management over the next 20 years.
2
The selection was also made with the viewthat it is more productive to focus on asmaller range of key influencers.
Some of the predicted key influencers arealso based on trends that have an importantdegree of uncertainty. In contrast,judgements about the environment, climate,governance, and community attitudesrepresent a distillation of views of expertsfrom inside and outside CSIRO. These arematters for speculation as they arecontingent on the decisions that societies andgovernments will make.
Scenario planning is a collaborative processand one that involves a high level ofstakeholder engagement. The purpose of thispaper is to provide a basis for that process. Itis suggested that next steps towardsdeveloping scenarios should be:
1. agreement through consensus on theselection of the factors grouped withininfluencers;
2. development of exploratory firstgeneration scenarios to give insight intothe system, to identify predeterminedelements, and to understand theconnection between various forces andevents influencing the system;
3. detailed research (with a focus on gaininginsights) on some of the influencers andtheir uncertainties to gain a betterunderstanding of the forces that willeventually compel an outcome and theirinterplay; and
4. next generation scenarios or constructionof decision scenarios so that decisionmakers question their own views ofreality.
1.3 STRUCTURE
The structure of this paper is based on theseven-key influencers, with a section for eachinfluencer. Each section explores the ‘bigticket items’ the main factors that relate tothe influencers, and asks questions abouthow these factors may change the urbanwater sector or its strategies.
Hypothetical ‘What if …’ pictures ofpossible futures that may be driven by aparticular influencer are included at the endof each section. Readers are encouraged todevelop their own views of how theinfluencers and their interactions may createa different future. They are also encouragedto consider whether other influencers orfactors may cause major discontinuities.
Appendix A Scenarios provides summaries ofsome scenarios to illustrate how the variousinfluencers could play out in the future.
1.4 THE KEY INFLUENCERS
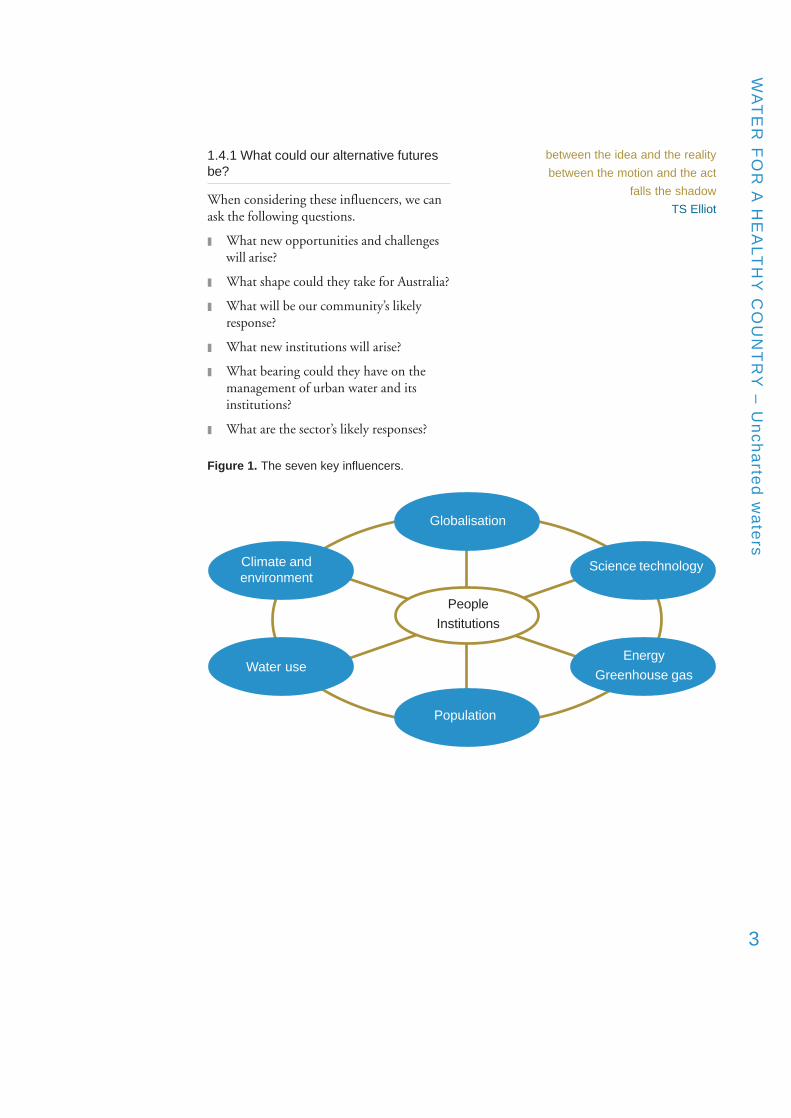
By 2024, water management in Australia islikely to be shaped by seven main influencers(see Figure 1):
❚ globalisation and liberalisation;
❚ people and institutions;
❚ population;
❚ climate and environmental change;
❚ science and technology;
❚ energy; and
❚ water use and management.
These influencers are interdependent and areplausible drivers. They are as much aboutopportunities that, if captured, willtransform the water sector, as about over-the-horizon problems.
WA
TE
R F
OR
A H
EA
LT
HY
CO
UN
TR
Y –
Un
ch
arte
d w
ate
rs
3
1.4.1 What could our alternative futuresbe?
When considering these influencers, we canask the following questions.
❚ What new opportunities and challengeswill arise?
❚ What shape could they take for Australia?
❚ What will be our community’s likelyresponse?
❚ What new institutions will arise?
❚ What bearing could they have on themanagement of urban water and itsinstitutions?
❚ What are the sector’s likely responses?
between the idea and the reality
between the motion and the act
falls the shadow
TS Elliot
Figure 1. The seven key influencers.
Globalisation
Climate andenvironment
Water use
Population
Energy
Greenhouse gas
Science technology
People
Institutions
4
The future’s primary influencer—globalisation, liberalisation (political, economic andsocial) and uptake of new technology—appears unstoppable. We are entering a period ofrapid change. The networking and integration of the global community and markets,together with information technology, will speed up the cycle of change and adjustmentpressures.
The key questions for urban water are:
❚ How will the Australian community be positioned in this new world?
❚ What opportunities and risks will it bring?
❚ How will globalisation and liberalisation influence community values?
❚ How will they influence business direction and operations?
United States (US), a major power: The USwill continue to be a major global force. USglobal economic, technical, military anddiplomatic influence will be unparallelledamong nations as well as in regional andnational organisations. This power will notonly ensure America’s pre-eminence, but alsocasts it as the key driver of the internationalsystem (GBE 2002; NIC 2000). It will be amajor proponent of globalisation, and itsactions will have an increasing global impactbecause of the tighter integration of globalmarkets.
2. Globalisation and liberalisation
ECONOMIC LIBERALISATION
The term ‘Washington Consensus’ describes the key reforms mostneo-liberal economists believe should be universally applied:
❚ fiscal discipline
❚ public monies for primary health care, primary education, andinfrastructure
❚ tax reform to lower marginal rates and broaden the tax base
❚ interest rate liberalisation
❚ a competitive exchange rate
❚ trade liberalisation
❚ liberalisation of direct foreign investment
❚ privatisation
❚ removal of barriers to market entry and exit
❚ secure property rights
GBE 2002
2.1 A WELL-CONNECTED WORLD
We are connecting more closely and in moreways to the global community as ourcommunication infrastructure develops andas our economic systems become more inter-dependent. This means that occurrences inany one area have the potential to effectmany other occurrences and areas.
2.1.1 Dominant players
In this connected world there are dominantplayers with shifts in the balance of powerand control.
New participants and a greater role for globalcorporations and non-government organisations(NGOs): An increasing number of newplayers are participating at a global level:
❚ countries entering the global tradingregime;
❚ new businesses;
❚ new partnerships among establishedbusinesses; and
❚ NGOs that are assuming a greater role inpublic debate and decision making.
WA
TE
R F
OR
A H
EA
LT
HY
CO
UN
TR
Y –
Un
ch
arte
d w
ate
rs
5
South-east Asia’s growth and stability:Emerging Asia will be the fastest growingregion, led by China and India, whoseeconomies already comprise roughly one-sixth of global GDP (NIC 2000). Howstable is our region? Potentially it providesunimaginable economic growthopportunities, and the stability and nature ofthe relationships will be of great importance.
Governments: Governments will have lesscontrol over flows of information,technology, migrants, arms and financialtransactions, whether licit or illicit acrosstheir borders. The quality of governancenationally and internationally willsubstantially determine how well states andsocieties cope with the global forces (NIC2000).
2.1.2 Pandemic disease
A well-connected world will further opentrade and increase movement of people.Global cooperation has shown to be effectivein controlling outbreaks of disease such assevere acute respiratory syndrome (SARS),although an increase in movement of peoplewas part of the reason for the threat andcould also introduce new pests and diseasesto humans, livestock and plants to Australia.In developing countries, the exposure ofpeople to ecosystems previously isolated fromhumans, together with human cohabitationwith stock and captive wild animals, increasethe risk of new diseases.
2.2 GLOBAL TRENDS
Possibly the most significant anticipatedtrends for the urban water sector are waterscarcity and economic growth.
MILLENNIUM DEVELOPMENT GOALS
Goal 7 Target 9: Integrate the principles of sustainable development into country policiesand programs and reverse the loss of environmental resources.
Goal 7 Target 10: By 2015 to halve the proportion of people without sustainable access tosafe drinking water and basic sanitation.
UN Millennium Project 2005
At least 1.1 billion people lack access to safewater, and 2.4 billion lack access to basicsanitation, a silent humanitarian crisis thateach day takes thousand of lives, robs thepoor of their health, thwarts progress towardgender equality, and hamstrings economicdevelopment, particularly in Africa and Asia.
UN Millennium Project 2004
Water scarcity: Globally, the withdrawal ofwater supplies is projected to increase by atleast 50 percent by 2025 (UN 2004). By2015, nearly half of the world’s population,will live in water-stressed countries (i.e. nomore than 1.7 ML of water per person peryear) mostly in Africa, the Middle East,South Asia, and Northern China (NIC2000). The United Nations advised:
... faced with inertia at the leadership levelthe global water crisis will reachunprecedented levels in years ahead withgrowing per capita scarcity of water inmany parts of the developing world …water resources will steadily decline becauseof growth, pollution and expected climatechange.
UNESCO 2003
Economic growth: It is predicted that overallthe global economy will return to the highgrowth levels of the 1960s and early 1970s.Political pressures for higher living standards,improved economic policies, rising foreigntrade and investment, diffusion ofinformation technologies, and anincreasingly dynamic private sector will drivethis change. Brakes on the economy, such asa substantial financial crisis or prolonged
6
disruption of energy supplies, may undo thisprojection. Regions, countries and groupsleft behind will face stagnation, politicalinstability and cultural alienation. The gulfbetween the haves and have-nots will widen.This will foster political, ethnic, ideologicaland religious extremism, along with theviolence that often accompanies it (NIC2000).
2.3 URBAN WATER INDUSTRYGLOBAL LIBERALISATION ANDCOMPETITION
The water sector is actively involved in theglobalisation and liberalisation processes.Over the past two decades, there has been adramatic growth in the privatisation of waterinfrastructure. By 2000 an estimated 93countries had privatised water or wastewaterservices, or were in the process of doing so.This included countries in North and LatinAmerica, the Caribbean, Europe, Africa, andthe Middle and Far East (Friend et al.2003b).
The focus of major international watercompanies is expansion and growth. This isdriven by the investment appeal of the waterindustry with its positive profit performance,and the need for infrastructure developmentin many third world countries (Friend et al.2003b).
The industry provides significant profits tothe three key players in the world marketnamely Vivendi Universal, Suez and RWE.Each is among the top 100 corporations.Their revenues are estimated to grow by tenpercent per year...
Friend et al. 2003b
There is a growth in alliances andinvolvement in public-private partnership.Competitiveness and acquisitions are alsofeatures. As an example, it appears that E.Onand RWL are aggressively competing forleader status in Germany. In the UnitedKingdom (UK), it is evident that watercompanies are responding to the regulatedwater industry with a growing interest innon-regulated ventures. Multi-utilities areemerging (Friend et al. 2003b).
Within this context there will be increasingexternal pressure on Australia to pursue theCoAG water reforms, creating opportunitiesfor new market entrants.
In 2003, profitability was a problem for 50percent of major Australian water companiesdespite increased revenues for most. Theongoing drought is unlikely to help asreduced water supply and restrictions impacton revenue (Friend et al. 2003b). This canmake them vulnerable in the longer term.
Increased liberalisation and competitionmeans that organisations not only need toimplement best practice, but also need tooperate in a strategic and commercialmanner to sustain profitability and marketshare. Those that cannot adapt quickly will‘go under’.
How many of you believe that you will be bought, sold, merged or affiliated with a public orprivate organisation within the next 15 years? You realize up until three months ago there werefour mega firms, each with a goal of owning or controlling 30 percent of the world’s water andwaste water infrastructure within one or two decades? Now there are only three. One bought upthe fourth.
Steve Gordon AWWA President, AWWA Mainstream, July 1999
WA
TE
R F
OR
A H
EA
LT
HY
CO
UN
TR
Y –
Un
ch
arte
d w
ate
rs
7
Australia’s international position
Australia becomes a world leading nation:What if Australia’s international statusincreases and it becomes the second mostpowerful nation (after the US). This isachieved through its agility in adapting toglobal events, speed in applying newtechnology and its ‘national competitiveness’(its dynamic institutions, state-of-the-artenvironmental management practices androbust physical infrastructure). In additionAustralia leverages its other strengths—excellence in education, science andtechnology, cultural diversity, and abundant‘clean’ natural resources. It sets the globalenvironmental and water managementagenda, and provides technologicalleadership.
Australia hands over its sovereignty: Imaginethat Australia becomes the fifty-first state ofthe United States or, because of itsgeographical position and high proportion ofAsian born residents (following an increase inimmigration), Australia becomes a memberof a powerful Asian federation. Thefederation controls trade, security,international policy, and environmentalsustainability.
Australia disconnects from the world: What ifAustralia withdraws from the globalcommunity as a ‘revolt’ against the externallyimposed rate and direction of change. As thegap between the ‘haves and have-nots’widens, with few benefiting from the globalconnections. Australians attempt to re-createthe ‘good old days’. We retreat within ourborders, restricting the movement of people,produce, finance and communications.Government is concerned about losingcontrol and centralises its decision making.Australia fails to adapt and keep up. Oureconomic wealth falls.
The world disconnects from Australia. Imaginethat relationships between nations breaksdown. War spreads beyond the Middle Eastand splits the community into two opposingsides, creating a ‘Korea-type relationship’ ona global scale. Trade and communicationsbetween the sides cease. Countries try tocheck US dominance. The US assumes a lessbenign control of power, pursuing theirinterests at the expense of all.
BUT WHAT IF …?
Imagine alternative futures where:
❚ Australia becomes a world-leading nation;
❚ Australia hands over its sovereignty;
❚ Australia disconnects from the rest of the world;
❚ the rest of the world disconnects from Australia;
❚ international scarcity of potable water results in the creation of an internationaltrading market;
❚ the Australian water sector becomes a world leader; or
❚ the water sector operates in a hostile environment.
8
The water sector
International scarcity of potable water: What ifwater scarcity results in the creation of aninternational trading market with watertraded as either a bulk commodity orembodied in high input products such as riceor milk. The value of the traded goods wouldreflect their embodied water content.Demand for irrigation would increase withan increase in the production of the highwater content produce.
Australian water sector becomes a world leader:Imagine that the Australian water industrydevelops a leading position in sustainable,integrated water management, energy useand infrastructure design. The sustainabledelivery of low cost, reliable water underpinsAustralia’s economic and social growth. Thewater industry too enters the internationalmarket making a significant contribution toAustralia’s wealth.
Water sector operates in a hostile environment:Imagine that with rising internationalconflict Australia becomes more vulnerableto terrorism requiring additional defenceexpenditure. Funding for capital investment,science and technology becomes scarce.There is a decline in water quality andconcerns about its security, and servicesbecome unreliable.
WA
TE
R F
OR
A H
EA
LT
HY
CO
UN
TR
Y –
Un
ch
arte
d w
ate
rs
9
3. People and institutions
Australia’s people and institutions will shape its future. They will determine the relativeimportance of the influencers through their capacity and willingness to embrace change,together with the way in which they interact.
Can Australia’s national culture and current system of government and public policydevelopment seize the opportunities and cope with the challenges ahead? If not, areAustralians capable of making fundamental changes that will work to both culture andstructure (Wayne Goss cited in BCA 2004)?
The key questions for urban water are:
❚ What will the community expect of water institutions and services?
❚ How far will governments pursue the reform agenda?
❚ How will stakeholders respond?
❚ What business enterprises will enter the marketplace?
3.1.1 How do we view water and theenvironment—as commodities or associal goods?
Water is not ‘respected’ or valued by theAustralian community generally. While waterand the environment are regarded asimportant, will policy be more pragmaticthan idealistic? Or, will the impendinginternational water scarcity or globalwarming change our views on itsmanagement and use?
Since a considerable amount of urban wateris used for recreational purposes, such asgardening and community parks, there is aview that water demand needs to beconsidered a social issue.
Water should be treated as a social andcultural good, and not primarily as aneconomic commodity. This presents adifferent view from decisions taken atseveral international forums in the 1990s,
The rate of change is so rapid it is just about the only certainty remaining; that there will bechange and there will be further change ... as Islam is demonstrating, human beings aren’talways happy with change and may revolt against it, even preferring a lower standard of livingfor the certainty of not changing any more. Change is exhausting.
Pru Goward Federal Sex Discrimination Commissioner
3.1 CULTURAL VALUES
How will people respond to future opportunitiesor challenges?
Most Australians have an optimistic outlookon our capacity to respond to challenges. Butare we looking through rose coloured glasses?
... people often do not act in the rational,self interested way they are ‘supposed to’ ineconomic theory ... People have a way ofupsetting the status quo, especially if theyact together under the force of deeply heldvalues galvanised by a new ideal or by newcircumstances – or when they feelthreatened.
GBE 2002
10
in which water was judged to be aneconomic commodity, reflecting a shifttowards market-based policies that reflectthe true cost of water, reduced subsidies andpossibly engage the private sector in watersupplies.
United Nations 2003
There is a view that water should flow to thehigher value use. However, tension existsbetween the demand for irrigation, forenvironmental flows and for urban supply.Increasingly urban and environmental usemay be considered to have the ‘higher value’.What would be the implications be forprimary producers? Alternatively, howwilling will the community be to embracefurther restrictions or changes in waterquality?
3.2 GOVERNANCE
The willingness and capacity of governmentsand its institutions to undertake a concertedeffort to sort out longer-term problems is akey influencer.
Do Australians accept that their future willbe profoundly influenced by factors such asour ageing population, globalisation,security issues and the strength of oureconomy? .Of course we have to addunpredictable events such as the worldexperiencing SARS and the September 11manifestation of asymmetric warfare.Australia cannot prevent such events. Thequestion is what will be the quality ofresponse from our system of governance andpolitics? The answer comes back to theleadership of the Australian nation—notonly political but also business, media andthe community?
Wayne Goss cited in BCA 2004
3.2.1 Institutional and structural changefatigue
Australia’s structural reform over the last 30years has covered almost every aspect ofeconomic activity. Key areas of reforminclude the labour market, tariff reductions,the exchange rate and financial sector,corporate governance, taxation, nationalcompetition policy, the public sector, andframeworks for monetary and fiscal policy(BCA 2004).
The reform dividend is evident in the highrates of productivity and economic growthachieved, especially relative to experiences ofmany other countries. This success wasneither guaranteed nor was it a result of luck.
A considerable amount of reform remains tobe undertaken, and new issues arecontinually arising.
However, there is an increasing level ofreform fatigue in the community, andevidence of some leaders stepping back fromfurther reform. While some Australianswelcome reform relief, ultimately Australia’sfuture will be diminished if it steps back.
Wayne Goss cited in BCA 2004
3.2.2 Quality of Australia’s institutions
Countries with competent governance willreshape traditional government structures tobetter engage a more complex andinterconnected world. States with ineffectiveand incompetent governance will not onlyfail to benefit from globalisation but in someinstances will spawn conflicts at home andabroad, ensuring an even wider gap betweenregional winners and losers than exist today(GBE 2002).
Effective governance will increasingly bedetermined by:
❚ the ability and agility to formpartnerships to exploit increasedinformation flow;
❚ new technologies;
❚ migration; and
❚ the influence of non-state actors (GBE2002).
WA
TE
R F
OR
A H
EA
LT
HY
CO
UN
TR
Y –
Un
ch
arte
d w
ate
rs
11
Responsibilities of semi-autonomousgovernment agencies will increasinglyintersect because of the transnational natureof priorities and requirements forinterdisciplinary policy responses.
3.2.3 Capacity of Australia’s institutions
Governance of democracies can only becomemore difficult.
Globalisation will increase transparency ofgovernment decision making …complicating the traditional deliberativeprocesses of democracies. Social decisions aremediated by institutions that were designedfor a slower, more methodical approach tosolving problems, and these problems wereassumed to come one by one.
The short-term nature of electoral cycles,inevitably bestows upon governments ashort-term outlook, now strongly reinforcedby the media’s rapid news cycle andcommunity expectations that problems canbe fixed immediately. Prevention forexample is not sexy in politics.
Goward 2003
Can the three tiers of government worktogether for the benefit of the nation? Willinefficiencies and duplication betweengovernments threaten Australia’s capacity forgrowth and social well being?
Many of Australia’s current environmentalproblem, have as acutely exacerbatingfeatures the overlapping responsibilities ofLocal, State and Federal Governments.Land clearing deteriorating condition of theMurray–Daring Basin are good examples ofproblems that cry out for the resolution ofoverlapping responsibilities for services andthe uncoordinated approaches to regulationand standards setting.
Michael Rae cited in BCA 2004
Environmental problems, especially waterallocation and greenhouse gas emissions areadressed on a piecemeal basis. Thegovernments each put money into water andenergy-related issues without a coordinatedeffort to sort out the longer-term problems.
3.2.4 Regulation and control
People want the efficiencies that marketliberalisation brings. They also wantappropriate government regulation. Many ofthe traditional approaches to regulating theeconomy and institutions will becomeincreasingly difficult to preform. The rate ofchange and its unpredictability in a globaleconomy requires a new way of ‘running theshop’, with new rules to manage theunwanted consequences of change.
3.3 URBAN WATER SECTORINSTITUTIONAL LIBERALISATION
In 1994, CoAG recognised the need forwater management reform and agreed toimplement a reform framework (ReformFramework). Still in its early days, the focushas been on getting the Reform Frameworkinto place and cost reductions. Most of thereal implications of these reforms are yet tobe played out. Far reaching changes arepredicted for the urban water sector forexample:
Pricing of services: Full cost pricing of allwater and wastewater services (including aprovision for environmental cost), as well asan unwinding of cross-subsidies (e.g.customers could pay different prices basedon their specific service delivery costs, timeof use and water quality) may be introduced.
Consumers will have come to terms with thefact that the days of cheap subsidised waterare coming to a close.
Prof Alan Fels, Chairman AustralianCompetition Commission
12
Marketisation of the sector: It is anticipatedthat:
❚ there will be new entrants under the ‘newaccess regime’ with competitors accessingexisting facilities;
❚ customers may have a choice of serviceproviders;
❚ full privatisation may occur;
❚ a further carving-up of businesses basedperhaps on geography, integrating thewater cycle elements, or infrastructurewill occur.
Increasingly water authorities may not wantto retain control of all aspects of watermanagement or may want to expand theirportfolios (e.g. they may re-positionthemselves as public health authorities).
Competition in other infrastructureindustries is driving convergence towards theprovision of multi-utility services.
In whichever direction the sector goes, it islikely that there be more providers, anincreased sophistication and a simplificationof the business.
Innovation and technical change:Liberalisation creates opportunities forinnovation and technical change—oldconstraints may be freed to create morediverse ways to deliver customer services.Changes in water delivery are expected and itis speculated that there will be greater localcontrol, management and service delivery toreduce risks and costs, and improvesustainability.
It is clear that whatever the water industrydoes, there will be rapid change with a movetoward a very different approach to servicedelivery. The Reform Framework will createnew dynamics for policy makers andregulators and will increase business risk and,in particular, the risks of assets beingstranded and the ‘cherry picking ofcustomers’.
While significant progress has been made,the Reform Framework is unlikely to meet itsimplementation target date of 2005. Ruralwater management reform is especiallylagging.
In Services Sydney Pty Ltd’s application to the National CompetitionCouncil for a recommendation to declare Sydney WaterCorporation’s transmission of sewage services and a service forconnection of new truck main service, it proposes to:
❚ establish a new state-of-the-art water reclamation plant; and
❚ construct water conduits to return tertiary treated water for otheruses.
The company will compete for customers principally on the basisthat its effluent treatment would be more environmentally friendlythan the ocean outfall system used by Sydney Water. Its pricingstructure is expected to be similar.
<www.ncc.gov.au>
WA
TE
R F
OR
A H
EA
LT
HY
CO
UN
TR
Y –
Un
ch
arte
d w
ate
rs
13
Australia’s response to change
No change: Imagine if Australia’s governmentshave not been able to embrace the changeand where we are unable to achieveagreement on problems or the way forward,different levels of government are blamingeach other (BCA 2004). There is a lack oftrust between the people and governmentand social unrest. Short-term attitudesflourish with no concerted effort bygovernment to pursue long-termopportunities or sort out the longer-termproblems.
Australia’s institutions change: What ifAustralia has a stronger and more centralisednational government; state/territorygovernments are abolished? Alternatively,Western Australia and Queensland cede fromthe Australian federation.
Water sector
A MacWater takes over the Australian urbanwater market: An international watercompany experiences flat profits in itsprimary market and decides to expand intoother enterprises. ‘MacWater’ diversifies intoland development. A major breakthrough inwater treatment technology allows MacWaterto offer a better and cheaper service, withfranchised management of development sites
including local water service provision. Itsreal competitive advantage is its leadership incustomer knowledge, managing theenvironmental impact of its operations andcost efficiency. It is very successful andeventually takes over the urban waterindustry. Governments subsequently have avery small role in the delivery of essentialservices and the industry becomes self-regulating.
International market dominated by oligopolies:Globally the entire water market is corneredby a few mega-corporations, which colludeand act as aggressive oligopolies excludingnew entrants, and manipulating supply andprices. Australia’s water utilities adopt a ‘headin the sand’ approach. A corporation entersthe Australian market ‘cherry picking’ theservices it provides. The expensive lessprofitable services are left in the publicdomain. Their costs climb or the authoritiesbecome unviable, as their fixed overheadcosts are covered by a smaller customer base.Governments are forced to heavily subsidisethe water industry to ensure equity and basicservice provision to all citizens. Thecorporation subsequently provides small localtreatment plants, further stranding the largercentralised infrastructure system.
BUT WHAT IF …?
Imagine alternative futures where:
❚ no change occurs;
❚ Australia’s institutions change;
❚ a MacWater takes over the Australian urban water market; or
❚ the international market is dominated by oligopolies.
14
Australia’s future will be shaped by changes to local and global populations. Populationchanges:
❚ trigger changes to social values and community needs;
❚ trigger demand for goods, services and resources; and
❚ have environmental impacts.
Our demographic profile relative to those of our neighbours influences our relationships,and has economic and social implications.
The Australian Bureau of Statistics advised that:
The growth of the world’s human populations and its increasing demand for limited globalresources is a key issue for citizens and governments throughout the world. This is coupledwith evidence that many of the life support systems that make-up our natural environmentis being degraded by human activity and continued population growth will add to thepressure experienced by these systems.
ABS 2001
The key questions for urban water are:
❚ How can we provide for urban growth and meet higher environmental and publichealth standards?
❚ How will businesses manage a skills shortage at a time when they need to draw upon asolid skills and knowledge base to meet the challenges?
4. POPULATION
WA
TE
R F
OR
A H
EA
LT
HY
CO
UN
TR
Y –
Un
ch
arte
d w
ate
rs
15
4.1 POPULATION SIZE ANDGROWTH
The world’s demographic balance ischanging: in the future there will be morepeople and in the developed countries thosepeople will be older.
4.1.1 Global population
Global population will increase from today’s6.4 billion to 7.8 billion in 2024 (U.S.Census Bureau 2004). Ninety-five percent ofthe increase will be in developingcountries—mainly in rapidly expandingurban areas—where political systems arebrittle. The combination of populationgrowth and urbanisation will fosterinstability (NIC 2000).
In developed countries, growth seems to havesettled at virtually zero. According to theUnited Nations 2003 projections, theaverage fertility rate in the more developedcountries is 1.6 (Australia’s is 1.7), while therate in the less developed countries is 2.9, theworld average is 2.7 (ABS 2003b).
4.1.2 Australia’s population
Population growth: Concerns have beenexpressed about the optimal population size.Estimates of Australia’s carrying capacity varyconsiderably, ranging from hundreds ofmillions to less than the current number ofpeople (ABS 2001). This issue remainsunresolved.
Australia’s June 2002 population of 19.7million is projected to grow to between 22.3to 24.6 million by June 2021. Fertility andmigration have the greatest impact on thisgrowth. Immigration is a more significantdriver as large changes in birth rates wouldbe needed to impact on total births (ABS2003b).
Ageing population: Over the next 20 yearsageing and retiring baby boomers presents achallenge. The additional pressure on the taxand welfare systems will be supported byfewer taxpayers and this will slow downeconomic growth. In 2002, 13 percent of thepopulation was aged 65 years and over; by2021, it is projected that they will represent19 to 20 percent (ABS 2003b). The elderlydependency ratio increased from 18 percentto 19 percent between 1954 and 1981, thento 21 percent by 1996. By 2031 it may reach31 percent. The net effect of a likely lifeexpectancy increase of over the next 10 yearswould be further increases in the proportionof over-sixty–fives.
Where we will live: There will be an overallmovement of the population to the coast andcities. Predictions are for a coastalcommunity that spreads along most ofeastern Australia. The drift will have asignificant impact on our capacity to managewater, infrastructure investment andenvironmental sustainability.
Further concentrations in capital cities willbe due to larger growth rates relative to therest of their state/territory. Melbourne islikely to increase by 19 percent to 4.2million in 2021 (estimated range is between4.1 and 4.3 million); Sydney by 18 percentto 4.9 million in 2021 (estimated range isbetween 4.7 and 5.1 million); Brisbane by35 percent to 2.3 million (estimated range isbetween 2.1 and 2.5 million). Brisbane andthe Gold Coast will merge into a newmegacity. They will remain Australia’s threemost populous cities (ABS 2003b).
How we will live: Households numbers areset to increase sharply, with a decline in thenumber of people per household. In 1947,the average Australian household size was 3.8persons. From 1981 to 1996 the number fellfrom 2.92 to 2.72. It is expected there willbe 2.3 persons per household in 2021. The
16
smaller households result from an ageingpopulation, family breakdown, smallerfamilies and lifestyle choices. It is forecastthat 500 000 new homes will be built inSydney over the next 20 to 30 years(Executive Intelligence). The percentage ofmulti-unit dwellings has increased.
Population make-up: Australian has one ofthe worlds’ most diverse populations: in2001, 23 percent were born overseas (ABS2003b), compared to, for example, 8 percentin both the US and New Zealand.Increasingly, Australians are dispersing andliving elsewhere in the world on a temporaryor permanent basis (1.7 percent of thepopulation in 2001).
Our population diversity and its connectionwith the global community increases ouradaptability and capacity to innovate.
4.2 SKILLED WORKFORCE
A critical assumption is that Australia will beable to draw on a pool of skills to support itstransition and growth. However, this may beunrealistic due to the combination of thebaby boomers retiring and a brain drain.
Baby boomers retire: Australia’s workforce hasa disproportionably high number of peopleclose to retirement, and fewer youngerworkers. In the next few decades a shortfallin the number of young people entering theworkforce could limit industry’s ability toconduct business and lead to higher wages.
European and Japanese populations are alsorapidly ageing, requiring more than 110million new workers by 2015 to maintainthe current working population to retireesdependency ratios (GBE 2002).
Brain drain: Increasingly, young Australiansare seeking opportunities overseas.
A key issue … is where we will come out interms of net brain gain or drain – that is,will Australia be able to attract more skilledindividuals on a relatively permanent basisthan we lose? Australia’s capacity tocontinue to benefit from ‘brain gain’ will bedetermined not only by domesticcircumstances—including the availabilityof competitive employment opportunitiesand policies to support skilled migrationand return of ex-patriots—but also by theequivalent circumstances globally. Australiais already facing competition for skilledlabour from other developed countries. Thiswill intensify as population ageingadvances. At the same time, permanent andlong-term departures by young, skilledAustralians have trended up (BCA 2004).
Melinda Cilento cited in BCA 2004
Water industry: A shortage of people enteringand remaining in the water treatmentindustry—in design, construction andmanagement—could lead to significantproblems in 10 to 20 years (GHD 2004).
WA
TE
R F
OR
A H
EA
LT
HY
CO
UN
TR
Y –
Un
ch
arte
d w
ate
rs
17More than 6 million new settlers have arrived in Australia since theend of World War II.
ABS 2004c
BUT WHAT IF…?
Imagine alternative futures where:
❚ we experience a rising tide of refugees; or
❚ our population decreases.
An overwhelming population increase
A rising tide of refugees: Imagine if legal andillegal refugees cause a significant increase inour population due to:
❚ population pressures from growth in theleast developed countries that are leastable to support it—unless a significantimprovement in these countries’economic prospects occurs, it is likelyoutward migration will grow;
❚ regional instability due to high populationgrowth, urbanisation and a wideningdisparity of wealth;
❚ natural disasters (e.g. 30 of the world’slargest cities lie near coasts: a metre rise inthe oceans … would put an estimated300 million people directly at risk[Linden cited in Hawken, Lovins &Hunter Lovins 2000]);
❚ relative economic position—our relativelystrong economic fortune creates strongpull factors;
❚ a shift in Australia’s social or economicvalues where immigration policies that arebased on views on appropriate numbers,an obligation to accept refugees and theneed to control inflow, could change asviews change; movement of people couldalso be deregulated in the same way thatwe are seeing economic and politicalliberalisation; or
❚ loss of border control, where Australia losesits ability to control the inflow of illegalmigrants.
East coast growths:The current populationincrease is occurring mainly on the east coastof Australia. What if water authorities areunable to meet the demand for waterservices: demand exceeds available supplyand our ability to dispose of the effluent andthe capacity of infrastructure.
Population decrease
Population decrease: Imagine if a realpopulation decrease occurs as it becomesevident that Australia has exceeded itshuman carrying capacity or, a pandemicdisease dramatically reduces our populationand immigration inflow. The water industry’scosts increase dramatically and revenueraising capacity falls as:
❚ in anticipation of a population increase,industry has over-invested in capitalinfrastructure, with significant under-utilisation and high operating costs;
❚ more resources are allocated forenvironmental sustainability and toundertake remedial work; or
❚ the population’s increased dependencyratios limits the industry’s capacity togenerate the required revenue.
18
5. Climate and enviromental change
We are at a new moment in human history. For the first time, we are widely aware thatour day-to-day decisions have the power to destroy our own habitat. Water is integrallylinked to the environment’s health. Water is vital to the survival of ecosystems, and inturn ecosystems help regulate the quality and quantity of water (Rosegrant, Cai & Cline2002).
For much of Australia, climate change predictions forecast that with rising temperatures,there will be an increased demand for water, reduced yields and increasing yieldvariability.
The key questions for urban water are:
❚ What provisions can be made to manage reduced yield in general, and increased yieldvariability, combined with population and economic growth?
❚ What will be done to mitigate the risks arising from climate change andenvironmental degradation?
❚ How significant are those risks?
We learn geology the day after the earthquake.
Ralph Waldo Emerson
5.2 WATER USE AND ITSENVIRONMENTAL IMPACT
Approximately 73 percent of water used inAustralia (~24 000 GL) is supplied by rivers,21 percent by groundwater aquifers, and theremaining 9 percent by harvest of overlandflows. Surface water predominates in allstates and territories except Western Australiaand the Northern Territory (NLWRA2001a).
The National Land and Water ResourcesAudit showed that, in 2002, twenty-sixpercent of the 325 surface watermanagement areas units were either close toor already overused when compared withsustainable flow regime requirements. Theseaccount for 55 percent of total water use inAustralia. Thirty-one percent of the 538ground water management units are alsofully or over-allocated (NLWRA 2001b).
5.1 THE ENVIRONMENTALTRENDS
Contemporary (global) environmentalproblems will persist and in many instancesgrow over the next 15 years. Withincreasingly intensive land use, significantdegradation of arable land will continue aswill the loss of tropical forests. Given thepromising global economic outlookgreenhouse gas emissions will increasesubstantially. The depletion of tropicalforests, other specie-rich habitats, such aswetlands and coral reefs, will exacerbate thehistorically large losses of biological speciesnow occurring.
NIC 2000
Australia’s arable land and fresh water are alsopredicted to continue to decline both inquantity and quality as is our biodiversity(Michael Rae cited in BCA 2004).
WA
TE
R F
OR
A H
EA
LT
HY
CO
UN
TR
Y –
Un
ch
arte
d w
ate
rs
19
Water quality data are limited with onlybetween 67 and 75 out of Australia’s 246river basins (about 28 percent) able to beassessed for any of the key variables—turbidity, nutrients or salinity. Sixty-fivebasins had major exceedances of guidelines(NLWRA 2000).
5.3 VARIABILITY IN ANNUALRAINFALL
In all parts of Australia there is greatvariability in annual rainfall:
❚ along the east coast it can vary by a factorof two or three to one betweenconsecutive years; and
❚ in arid areas annual rainfall inconsecutive years can vary by a factor of10 or higher.
Also, both long- and short-term cycles of wetand dry weather can be identified and thesecan be Australia wide or regional. Long-termweather cycles of 40–50 years have beenidentified (GHD 2004). These can have asignificant impact on the reliability ofexisting supplies.
Many of Australia’s rivers have highlyvariable flows. Droughts and floods arecommon, and hence rivers and groundwaterresources have been developed extensively forirrigated agriculture and domestic watersupplies.
The variable climate and water cycle flowssuggest that the use of the system to supportthe service needs of the community and theeconomy also needs to vary. The movetowards integrated water cycle managementwill require sensitivity to this volatility.Further, if we learn to live with climatevariability we will be better equipped to dealwith climate change.
5.4 GLOBAL WARMING AND SEA-LEVEL RISE
For many, global warming looms as one ofthe planet’s biggest threats. Over the past 20years researchers have gathered evidence thatburning fossil fuel is causing temperatures torise. The exact pace of global warming, aswell as mankind’s contribution, is uncertain(Cline 2004).
Rising temperatures can cause considerableharm depending on how big the future risesare and how quickly they happen, and theimpacts on regional environments.
Predictions are that the Earth’s averagetemperature is likely to rise by 1.4 to 5.8oCby the year 2100 relative to 1990, a warmingrate of 0.1 to 0.5oC per decade. With thiswill be a rise in sea level of 9 to 88 cm by2100, or 0.8 to 8.0 cm per decade (CSIRO2001b).
Given the promising global economicoutlook, greenhouse gas emissions willincrease substantially. But the pressures onthe environment as a result of economicgrowth will decrease as a result of less energy-intensive economic development,technological advances and the shift towardsless polluting fuels such as natural gas (NIC2000).
There are many uncertainties. Forecasts ongreenhouse gas emissions are subject to:
❚ population growth;
❚ technological change;
❚ social and political behaviour; and
❚ the validity of the climate modelling.
The climates too are influenced by thenormal climatic cycles and otherunpredictable factors such as solar radiationand chaotic variations in the climate system.
Many people’s intuition that weather is shifting and is becomingmore volatile is confirmed by meteorological measurements.Spring in the Northern Hemisphere is coming a week earlier: thealtitude at which the atmosphere chills to freezing is rising bynearly 15 feet a year; glaciers are retreating almost everywhere.
20
5.5 AUSTRALIA’S CLIMATECHANGE
Australia’s temperature, rainfall patterns andavailability of water will change relative to1990.
Rising temperatures: By 2030, Australia’sannual average temperatures will probably bebetween 0.4 and 2.0oC higher, with slightlyless warming in some coastal areas andTasmania, and greater warming in the north-west. The greatest amount of warming willoccur in spring; the least amount will be inwinter. In the north-west, the greatestpotential warming will be in summer. Theseincreases may lead to large changes inoccurrence of extremely hot or cold days(CSIRO 2001a).
Changes to average rainfall, rainfall patternand intensity of rainfall events: Average annualrainfall could increase or decrease. Changesvary from -10 percent to +10 percent by2030 and -35 percent to +35 percent by2070, relative to 1990. Decreases will bemost pronounced in winter and spring.There will be a bias towards decreases in thesouth-west, parts of the south-east andQueensland. Some inland and eastern coastalareas may become wetter in summer, andsome inland areas may become wetter inautumn (CSIRO 2001a).
Where average rainfall increases we couldhave more extremely wet years, and where itdecreases, more dry spells. An increase inextreme daily rainfall leading to morefrequent heavy rainfall events and flooding, islikely (CSIRO 2001b).
It will be drier, as higher temperaturesincrease evaporation, and this will tend to begreater where there is a correspondingdecrease in rainfall (CSIRO 2001b).
5.5.1 Implications of a climate change
Climate change will have social, economicand ecological impacts. All our naturalecosystems are vulnerable. Water resources,cities and towns, the energy sector andindustry are likely to be sensitive to climatechange, although the net effects are difficultto predict (CSIRO 2001a). The likelyimplications for urban water include watershortages, extreme weather events andenvironmental impacts.
Water shortage: Shortages are likely to occurparticularly in winter-rain–fed systemsalready under stress. This will lead to asharpening of competition between differentwater users, especially where large diversionsfrom river systems are made for industry andirrigation. The trends will be:
❚ increased water stress with increases instream flow in northern Australia anddecreases for southern Australia;
❚ warmer conditions, accompanied byrainfall decrease in key agriculturalregions particularly in winter and spring;and
❚ a decrease in water available forirrigation, domestic and industrial uses;environmental flows; and crop andpasture growth.
Extreme weather events: More frequentextreme events such as bushfires, floods,storms and drought are likely to occur.
Environmental impacts: A substantialreduction in biodiversity is likely to occur asmany natural systems will have difficultyadapting to climate changes. The range oftropical diseases, disease vectors and toxicalgal blooms are likely to be expanded(CSIRO 2001a).
If the world’s nations wanted to stabilise the atmosphere in itspresent disrupted state, they would need to cut CO2 emissionsimmediately by about three-fifths.
Hawken, Lovins & Hunter Lovins 2000
WA
TE
R F
OR
A H
EA
LT
HY
CO
UN
TR
Y –
Un
ch
arte
d w
ate
rs
21
5.5.2 Community response to climatechange
Planning and adaptation strategies can helpto minimise the adverse impacts andoptimise benefits. However, climate changeis not well understood and is poorly acceptedby decision makers and the public.
Global warming will challenge theinternational community as indications ofa warming climate … occur. The KyotoProtocol on Climate Change, whichmandates emission reductions targets fordeveloped countries, is unlikely to come inforce soon or without substantialmodification. Even in the absence of aformal treaty, however, some incrementalprogress will be made in reducing thegrowth in greenhouse gas emissions.
Cline 2004
Economist and columnist Robert JSamuelson in Newsweek expressed the viewthat:
It would be political suicide to do anythingserious about [climate] … So shrewdpoliticians are learning to dance around thedilemma’ … Without a breakthrough inalternative energy – nuclear or something –no one knows how to lower emissionsadequately without crushing the econom …
Samuelson cited in Hawken, Lovins &Hunter Lovins 2000
A contrary view is that:
Samuelson, like many business people,believes climate protection is costly becausethe best publicised (though not the mostbroadly accepted) economic computermodels say it is. …those models find carbonabatement costly because that’s what theyassume. The menu of climate-protectingopportunities is so large that over-time, theycan overtake and even surpass the pace ofeconomic growth… These steady long-termimprovements are profitable and alreadyunderway.
Hawken, Lovins & Hunter Lovins 2000
BUT WHAT IF …?
Imagine alternative futures where:
❚ large and sudden climatic changes occur;
❚ environmental decline triggers extinction; or
❚ existing production patterns intensify.
A climate catastrophe
Large and sudden climatic changes: Manyscientist suspect that relatively small changesin certain forces that drive the climate—notably CO
2 concentrations, especially if
they happen fast enough—may trigger largeand sudden changes in the world’s weather(e.g. the shifting of ocean currents). Suchchanges could lead to the onset of an ice agein just decades—this must be possible sinceices ages appear to have occurred thisabruptly in the past (Hawken, Lovins &Hunter Lovins 2000).
Well that’s that: Environmental decline couldtrigger the sixth extinction? Maybe in the far,
far distant future a new species will feature atelevision or other program ‘Walking withHumans’?
There is no change in land use
Existing production patterns intensify: Imagineif Australia’s climate becomes significantlydryer in the Murray–Darling Basin whichcurrently accounts for 45 percent ofAustralia’s agricultural produce. The type ofproduce remains unchanged. Internationallyprices increase in accordance with their watercontent due to global water shortages andincrease in cost of water. Responding to thehigher prices, producers seek to increaseproduction levels, irrigation increasessignificantly and the river is drained.
22
Water and energy are closely connected. Energy is used to clean, transport and heat water,and water is used to produce energy. The water sector’s use of energy and its emission ofgreenhouse gases to deliver water services are significant.
The key questions for urban water are:
❚ Will the urban water sector initiate effective energy efficiency measures?
❚ What should be done by the sector to reduce its greenhouse gas emissions?
6. Energy and greenhouse gas
I am a Green and I entreat my friends in themovement to drop their wrongheadedobjection to nuclear energy. Every year thatwe continue burning carbon makes it worsefor our descendants and for civilisation. TheGreen lobbies, which should have givenpriority to global warming, seem moreconcerned about threats to people thanthreats to Earth.
James Lovelock – renowned British scientistwho postulated that earth is a single living
organism
6.1 AUSTRALIA’S GREENHOUSEGAS EMISSIONS
Combustion of fossil fuels is the majorcontributor to Australia’s greenhouse gasemissions (about 73 percent of net emissions,excluding land clearing) (ABS 2003a).
Australia’s per capita carbon dioxideemissions, total primary energy supply andelectricity consumption, are higher thanaverage for all major world regions, with theexception of North America. Australia’s percapita carbon dioxide emissions are morethan four times the world average and nearly50 percent greater than the average forOECD countries (ABS 2003a).
6.2 ENERGY SUPPLY AND PRICE
Sustained economic growth, along withpopulation increases, will drive a nearly 50percent increase in global demand for energyover the 15 years (to 2015). Meeting thisdemand will not pose a major supplychallenge. Despite the increase, global energyresources will be sufficient to meet demand.Estimates suggest that 80 percent of theworld’s available oil and 95 percent of its gasremains underground (NIC 2000).
Globally, renewable energy will gainincreasing importance. Non-hydrorenewables—mainly wind and bio-mass—areexpected to account for a fast-growing shareof electricity production, even although theyare starting from a small base. It isanticipated that the per annum growth forwind power’s share should be by 10 percent,bio-mass by 4.2 percent, solar power by 16percent and geothermal power by 4.3percent. With these growth rates substantialfalls in capital costs are expected (IEA 2002).
Natural gas use will increase more rapidlythan any other energy source. However, fossilfuels will remain the dominate form ofenergy (GBE 2002).
There is some debate about whether with theincrease in demand significant real priceincreases will also occur:
... it is expected that energy prices are likelyto become more unstable in the next 15years period as price hikes are followed byprice collapse.
GBE 2002
WA
TE
R F
OR
A H
EA
LT
HY
CO
UN
TR
Y –
Un
ch
arte
d w
ate
rs
23
6.2.1 Australia’s future demand andavailability of energy resources
By 2015 Australia’s total energy productionis projected to increase by 55 percent over1998 levels. Black coal and uranium areexpected to be the dominant energyresources. Australia is facing a decline incrude oil production. Geoscience Australiapredicts that without any discoveries liquidfuel self sufficiency will decline from 85percent in 2001, to less than 40 percent in2010.
Australia’s known and prospective energyresources, other than oil (which can beimported or substituted through liquefactionof natural gas and coal), are sufficient tomeet projected demand.
In Australia, renewable energy (mainlyhydro, biomass, solar and wind energy)represented 4 percent of total energy used forelectricity generation, and 5 percent of enduse consumption in 2001/2002 (2004a).
The Australian Bureau of Statistics advisedthat although Australia has a favourableclimate for solar energy applications, its useis far below its potential. With the exceptionsof hydro-power, other forms of renewableenergy are still relatively insignificant. Theabundance of cheap fossil fuel may be onefactor influencing the rate of development ofalternative energy, it is probable that non-renewable energy sources will dominateAustralia’s future for some time (ABS2004b).
6.2.2 Reduction in energy use andmanagement in greenhouse gasemission
The continuing growth in energy use andgreenhouse gas emissions are likely to becapped by government and commercialinitiatives. The introduction of legislationaround the world and in Australia hasspurred sustainable developments and newbusiness opportunities while achieving theobjective of reducing environmental impacts.To illustrate:
❚ Significant global developments includethe emerging emission trading schemes toachieve effective reductions in greenhousegas emissions. A global greenhouse gasemissions market is starting to appeardespite non-sanctification by the USgovernment. However, in the UK thereare some doubts about its effectiveness.
❚ The Australian Renewable Energy(Electricity) Act 2000 (Cwlth) requiresthat wholesale purchasers of electricityproportionally contribute towards thegeneration of an additional 9500gigawatt hours (GWh) of renewableenergy annually by 2010 (the MandatoryRenewable Energy Target), equivalent tomore than twice the output of the SnowyMountains Scheme. A recent reviewrecommended that the targets beincreased beyond 2010, to 20 000 GWhin 2020.
❚ Accounting guidelines have beenprovided jointly by the Institute ofChartered Accountants in Australia andEnvironment Australia to assist thereporting of environmental costs. Theyare designed to help management identifyenvironmental performance.
❚ Corporations around the globe areviewing sustainability as a core businessstrategy that contributes to businesssuccess (Friend & Briggs 2003b).
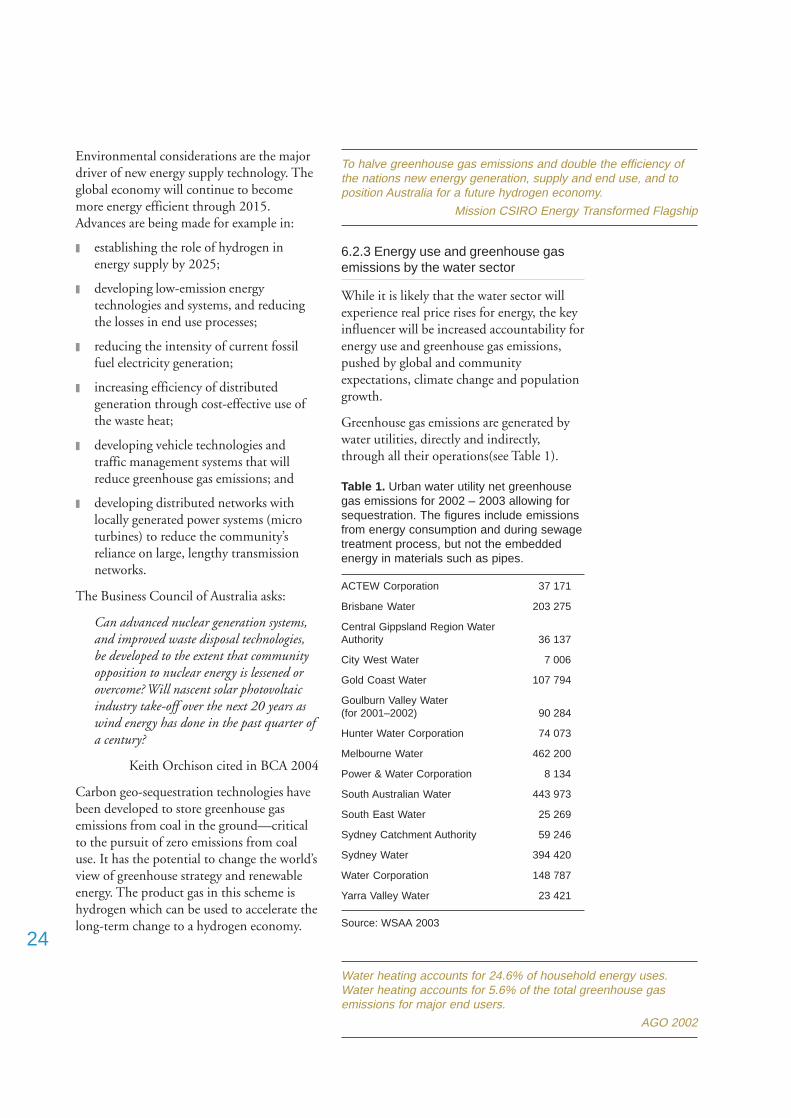
24
Water heating accounts for 24.6% of household energy uses.Water heating accounts for 5.6% of the total greenhouse gasemissions for major end users.
AGO 2002
Environmental considerations are the majordriver of new energy supply technology. Theglobal economy will continue to becomemore energy efficient through 2015.Advances are being made for example in:
❚ establishing the role of hydrogen inenergy supply by 2025;
❚ developing low-emission energytechnologies and systems, and reducingthe losses in end use processes;
❚ reducing the intensity of current fossilfuel electricity generation;
❚ increasing efficiency of distributedgeneration through cost-effective use ofthe waste heat;
❚ developing vehicle technologies andtraffic management systems that willreduce greenhouse gas emissions; and
❚ developing distributed networks withlocally generated power systems (microturbines) to reduce the community’sreliance on large, lengthy transmissionnetworks.
The Business Council of Australia asks:
Can advanced nuclear generation systems,and improved waste disposal technologies,be developed to the extent that communityopposition to nuclear energy is lessened orovercome? Will nascent solar photovoltaicindustry take-off over the next 20 years aswind energy has done in the past quarter ofa century?
Keith Orchison cited in BCA 2004
Carbon geo-sequestration technologies havebeen developed to store greenhouse gasemissions from coal in the ground—criticalto the pursuit of zero emissions from coaluse. It has the potential to change the world’sview of greenhouse strategy and renewableenergy. The product gas in this scheme ishydrogen which can be used to accelerate thelong-term change to a hydrogen economy.
6.2.3 Energy use and greenhouse gasemissions by the water sector
While it is likely that the water sector willexperience real price rises for energy, the keyinfluencer will be increased accountability forenergy use and greenhouse gas emissions,pushed by global and communityexpectations, climate change and populationgrowth.
Greenhouse gas emissions are generated bywater utilities, directly and indirectly,through all their operations(see Table 1).
Table 1. Urban water utility net greenhousegas emissions for 2002 – 2003 allowing forsequestration. The figures include emissionsfrom energy consumption and during sewagetreatment process, but not the embeddedenergy in materials such as pipes.
ACTEW Corporation 37 171
Brisbane Water 203 275
Central Gippsland Region WaterAuthority 36 137
City West Water 7 006
Gold Coast Water 107 794
Goulburn Valley Water(for 2001–2002) 90 284
Hunter Water Corporation 74 073
Melbourne Water 462 200
Power & Water Corporation 8 134
South Australian Water 443 973
South East Water 25 269
Sydney Catchment Authority 59 246
Sydney Water 394 420
Water Corporation 148 787
Yarra Valley Water 23 421
Source: WSAA 2003
To halve greenhouse gas emissions and double the efficiency ofthe nations new energy generation, supply and end use, and toposition Australia for a future hydrogen economy.
Mission CSIRO Energy Transformed Flagship
WA
TE
R F
OR
A H
EA
LT
HY
CO
UN
TR
Y –
Un
ch
arte
d w
ate
rs
25
Significant inroads are being made to reducegreenhouse gas in the sectors with thehighest level (energy sector, transport,households, manufacturing—iron, steel andbasic non-ferrous metal and products) bymanaging both the demand and efficiency ofuse.
Increasingly the water sector will need toenhance energy efficiency and reducegreenhouse gas emissions through research,creative technologies, changes in processes,and re-design of its infrastructure. It will alsobe expected to assist in the integration ofenergy and environmental policies.
BUT WHAT IF …?
Imagine alternative futures where:
❚ cheap alternative energy becomes readily available and used;
❚ energy supplies are disrupted;
❚ the urban water sector does not adequately address its energy use; or
❚ the Australian water sector is a global leader in the research and application of energyefficient processes.
Change in global energy demand andsupply
Alternative energy: Imagine the situation if avery cheap alternative energy source that isenvironmentally sustainable takes over oil.Alternatively, Australia becomes a hydrogensociety within the next 20 years.
Disruption in energy supplies: Imagine ifglobal energy supplies suffer a majordisruption. Turbulence in global energysupplies has a devastating effect. It is drivenby conflict among key energy-producingstates, sustained internal instability in two ormore energy producing states, or majorterrorist actions (GBE 2002).
Water industry energy use
The urban water sector does not adequatelyaddress its energy use: Imagine the situation ifthe water industry lost public supportthrough its tardiness in reducing itsgreenhouse gas emissions. The industry isfurther penalised as a result of theestablishment of a trading market wherecosts proved to be prohibitive. At the sametime with increased desalination andrecycling processes, there is a dramaticincrease in energy use. This situation wouldbe compounded by the cost and lead-time todevelop and implement energy-efficienttechnologies and processes.
Australian water sector is a global leader in theresearch and application of energy efficientprocesses: The Australian water industry coulddevelop an international competitiveadvantage through its application of energy-efficient processes and thereby enter theinternational market.
26
Positive outcomes from technological choices, be they in economic growth, social equityor environmental quality, rely more on the effectiveness of their integration rather thebrilliance or efficiency of a technology or idea (Barney Foran cited in BCA 2004).
The key questions for urban water are:
❚ What current technological innovation will impact on the services that water currentlyprovides?
❚ How will information technology, sensors, nano- and other technologies beincorporated into water management?
❚ What further advances can urban water make to increase water efficiency at each ofthe steps within the water cycle?
7.1.2 Nano-technology
Nano-technology, the design, fabrication,and characterisation of functional objectshaving dimensions at the nanometer (onebillionth of a metre) scale, will impact on ourlives in ways we can only begin to imagine.Nano-technology promises more for less:devices are smaller, cheaper, lighter andfaster, they have greater functionality andadded value, consume less raw materials andenergy. Examples of nano-technologyresearch include:
❚ molecular electronics to revolutioniseinformation technology;
❚ multifunctional windows (self-cleaning,solar control, switchable, photovoltaic) inone small package;
❚ paint additives that mean dark surfacesstay relatively cool and light surfaces canabsorb heat;
❚ embedded, distributed sensing systemsthat involve implanting tiny sensors(temperature, air quality, stress) inbuilding materials—using such systemswe obtain ‘smart spaces’ that employtechnology that can sense and act,communicate, reason, and interact withus to make our living and workingenvironment better; and
❚ biosensors for diagnostics that might oneday be found in the medicine cabinet.
7. Science and technology
7.1 NEW TECHNOLOGY
Over the next two decades the continueddiffusion of information technology,developments in nano-technology, sensors,and bio-markers together with newapplications for bio-technology, will be at theforefront of development. They will be themajor building blocks for international tradeand empower non-state actors.
The continuing revolutions and theintegration of information technology,biotechnology, materials science, andnanotechnology will generate a dramaticincrease in investment in technology, whichwill further stimulate innovation.
7.1.1 Information technology
The information technology revolutionrepresents the most significant globaltransformation since the industrialrevolution. The revolution, a driver of whatis often called the ‘fifth wave’ of technology,is only in its very beginnings. Few predictedits profound impact twenty years ago.Looking ahead another 20 years, the worldwill encounter more quantum leaps ininformation technology.
WA
TE
R F
OR
A H
EA
LT
HY
CO
UN
TR
Y –
Un
ch
arte
d w
ate
rs
27
7.1.3 Sensor technology
Sensor networks and associated processorsare being designed as self-organising systemsthat are aware of data and able to formresponses without human intervention(rather than using passive instruments fordata collection). These autonomous systemsare capable of performing advanced tasks inchanging environments. They comprisesensors intelligently linked to control andactuation, and may communicate andcooperate to achieve complex tasks. They canperform tasks that humans do not wish todo, or that they cannot do safely or well.
Sensor technology has many applications andpotential benefits are great.
7.1.4 Biomarkers
Biomarkers are being used for naturalresource management. They are organiccompounds that are characteristic ofpollutants; their presence indicates not onlythat the pollutant is in the water orsediments, but also its source. They are, ineffect, ‘fingerprints’ of the pollutant.
The ability to trace sources of hydrocarbonsand distinguish between sources is aninvaluable tool for improving managementof stormwater systems and controlling theamount and type of hydrocarbons enteringthe marine system. It provides a base forunderstanding the toxicology ofhydrocarbons in the systems.
7.1.5 Other innovations
Other innovations that are anticipated by2024 include:
❚ Biotechnology could drive medicalbreakthroughs enabling the world’swealthy to improve their health anddramatically increase their longevity. Atthe same time, genetically modified cropscould offer the potential to improvenutrition among the world’s one billionmalnourished people.
❚ Breakthroughs in materials technologycould generate widely available productsthat are multi-functional,environmentally safe, longer lasting andeasily adaptable to particular consumerrequirements (NIC 2000).
❚ Houses could supply their own powerneeds through use of fuel cells combinedwith photovoltaic generation of electricityending the need for large remote powerstations.
❚ Micro-turbines could be used inresidences.
7.2 WATER MANAGEMENT –WHAT IS POSSIBLE
Technical innovation, including mimicry ofnatural solutions, will continue to be a key tosustainable development and smarter use ofwater resources. The call for more efficientuse of water resources is also providing someimpetus to innovations in water use andrecycling technologies. In the urban contextmanaging scarcity and quality of watersupply, reducing stormwater pollutantimpacts, and the re-use of wastewater areamong key drivers for technical innovation.Technical applications directed towardsachieving efficiencies in operations, controlsystems and cost reductions are also apparent(Friend & Briggs 2003a). Examples ofdevelopments anticipated by 2024 in thewater sector follow.
Waterways and ecological processes
❚ A better understanding of interactionswith biological processes and increasingpower to influence landscape-scaleecological processes, together with bettermeasures of river health.
❚ Eco-technologies for environmentalmitigation and management that mimicnatural solutions.
❚ Environmental problems overcome(e.g. increasing salinity and the treatmentand disposal of wastes).
28
Effective waters use
❚ Further efficiencies in residential wateruse including waterless toilets,improvements to washing machines,dishwashers and garden irrigation.
❚ More efficient use of water for primaryproduction using precision farmingtechniques.
❚ Improved profiling of agriculturalproduction, and plant and animalvarieties to determine which are betteradapted to local environmentalconditions.
Efficient treatment
❚ Greater emphasis on engineering forefficiency of water and wastewatertreatment and transmission including:
● improved metering and leakdetection;
● improved maintainability of buriedinfrastructure (particularly the abilityto pinpoint when the infrastructureneeds replacing);
● solutions for local retention ofstormwater and sewerage disposal;and
● development of water treatmenttechnology enabling greater water re-use.
The new waterless urinal won’t block, is free from odour and won’trequire water ... The new urinal requires the use of one bucket ofwater a day for cleaning compared to the average of 1500 to 2000litres for flushable urinals ... It is more effective than flushing atstopping the build-up of uric scale—the part of the urine whichsticks to urinal flushpipes and creates unpleasant odours ... Mico-biological cubes are placed in the urinal, which convert urinalscale to a soluble substance.
<www.heraldsun.news.com.au>
New!Stafford®Cotton/Poly PerformanceW/FDress Shirt
Scotchgard™ Dual Action fabric protectorrepels stains while releasing dirt and othermore stubborn stains in the wash. Thetechnology reduces need for frequentwashing.
<www.jcpenney.net>
Process efficiencies
❚ Breakthrough in membrane technologyfor desalination plants resulting in muchlower levels of greenhouse gas emissionsand processing costs.
❚ Industry’s waste heat used fordesalination.
❚ Systematic implementation of measuring,monitoring and control technology.Sophisticated remote management of anysite, and greater precision, real-timebiological and chemical detection.
❚ Multi-utility ‘smart meter’ in allresidences, providing real-timeinformation on water use and quality (orelectricity and gas) to customers andutilities. A tool for measuringconsumption and managing use.
Risk management
❚ Tools to detect bio-terrorism activity andimprove security arrangements, includingalgae as an early warning system, andbiological and chemical sensors tomonitor and provide real-time detection.
BIO-REMEDIATION AND REDEVELOPMENT AT THESAME TIME
TNO and Tauw have successfully carried out the first scale in situHCH [pesticide] bioremediation at a Netherlands industrialcontaminated site. This was possible through a new approach thatallows existing bacteria in the soil, groundwater and wastewatertreatment to mineralise all HCH isomer into harmless end productslike CO2. This technology is 20-35 percent cheaper than the bestalternative containment technology including pump and treat
Friend & Briggs 2003a
WA
TE
R F
OR
A H
EA
LT
HY
CO
UN
TR
Y –
Un
ch
arte
d w
ate
rs
29
General technological breakthroughs
New crop varieties: Significant bio-technologybreakthroughs could result in new cropvarieties that:
❚ are salt tolerant and can be grown usingsalty water or in central Australia;
❚ require a low level of embodied water anduse water efficiently;
❚ are able to adapt to climate variabilityand produce good quality protein duringstress periods;
❚ are pest resistant and may be grown innorthern Australia; and
❚ act as bio-filters so that they removeimpurities from water and waterways,and can absorb and remove heavy metalsfrom contaminated soils.
Technological breakthroughs within thewater industry
A ‘new’ water source: Imagine the situation ifthe cost of desalination were reduced to $1per kilolitre, or that cloud-seedingtechniques are developed to enable the‘manufacture’ of water and that the cloudscould be moved between regions.
Efficient water extraction and re-use: With theintroduction of new recycling technologies,using cheap effective micro-desalinationplants, advanced biotechnologies andincreased processing efficiencies, 90 percent
of all water extracted could be re-used (e.g.in-house water treatment systems that are100 percent reliable, cheap to operate andrequire no maintenance). Water loss fromextraction to delivery could be eliminatedand the amount of available water coulddouble.
Image if we had a full understanding of thewater cycle based on robust science.Environmental impacts of water sourcedevelopment and extraction could beeliminated.
Efficient water use: We could eliminate theneed for many currently intensive waterusers, in industry and in primary productionto use extracted water through research,innovation, manufacturing and processchanges, new technology and capitalinvestment.
New consumer technologies: New technologiesthat are market-driven could emerge. Theycould include sonic massaging showers,fabrics that don’t require washing, grass thatstays green and does not grow. New materialscould mean that toilets and showers don’tneed to be cleaned thereby overcoming thecultural bias towards flushing toilets.
Fully automated service: With an integrationof sensors, bio-markers, robotics andinformation technology, the waterinfrastructure could be a fully automatedself-managing system. The systems collectand analyse data and take action.
BUT WHAT IF …?
Imagine alternative futures where:
❚ new crop varieties revolutionise water use;
❚ new water sources are developed;
❚ efficient water extraction and re-use is a reality;
❚ water use is efficient;
❚ innovative consumer technologies are developed; or
❚ services are fully automated.
30
8.1 AVAILABILITY ANDRELIABILITY OF SUPPLY
Contrary views on water shortages rangefrom ‘yes, there is a shortage for all the usesthat we want from water’ to ‘Australiaappears to have sufficient water availability’.
8.1.1 Security of the current water supply
The increasing demand for urban water iscausing concern. Many cities are nowexperiencing moderate water restrictions as aconsequence of the seven-year droughtshowing that we do not have enough waterfor existing water management practices toremain sustainable (GHD 2004).
A re-assessment of what is an acceptable levelof reliability for future urban water suppliesis likely to occur. Dam design and theestimation of safe yield are based onhistorical data. Safe yield describes thequantity of water that can be taken from awater storage. Increasingly yields are beingquoted with an associated probability offailure. Traditionally low probabilities offailure (such as 0.5 percent or 1.0 percent)have been accepted (GHD 2004). Economicgrowth and rising living standards are leadingto demands to increase reliability of wateravailability.
Against this, are the climate change forecastspredicting reduced yield and increased yield
variability increasing the probabilities offailure. The degree of risk will become moredifficult to predict.
8.1.2 Future water use
Water use expands with economic andpopulation growth. Australia’s water useincreased from 14 600 GL per year in 1983/84 to 24 000 GL per year in 1996/97, a 65percent growth (60 percent of this growthwas for agricultural use; the balance was formining, industrial and other uses; domesticuse was stable). The growth rate over the lastdecade was nearly 4 percent per annum, adoubling time of some 20 years (NLWRA2001a).
Taking account of proposals to implementbetter technologies and institutionalarrangements, by 2050 water requirementsfor urban water will increase from 5,000 to8,000 GL per year depending on thepopulation. By contrast total annualmanaged water use could increase from thecurrent level of 24,000 GL to more than40,000 GL by 2050, due to an anticipatedexpansion of irrigated agriculture innorthern Australia as constraints andavailably of quality water are experiencedin the south.
Foran, Poldy & CSIRO SustainableEcosystems 2002
8. Water use and management
Key industry drivers will be security of water supply, sharing of limited resources anddelivery of required water services to customers.
The key questions for the urban water sector are:
❚ Will the transition to sustainable water use be achieved in time?
❚ Should allocations shift from rural to urban use?
❚ Will distributed localised systems replace the current large-scale centralised waternetwork systems?
❚ How will the industry approach water use and management within a rapidly changingoperating environment?
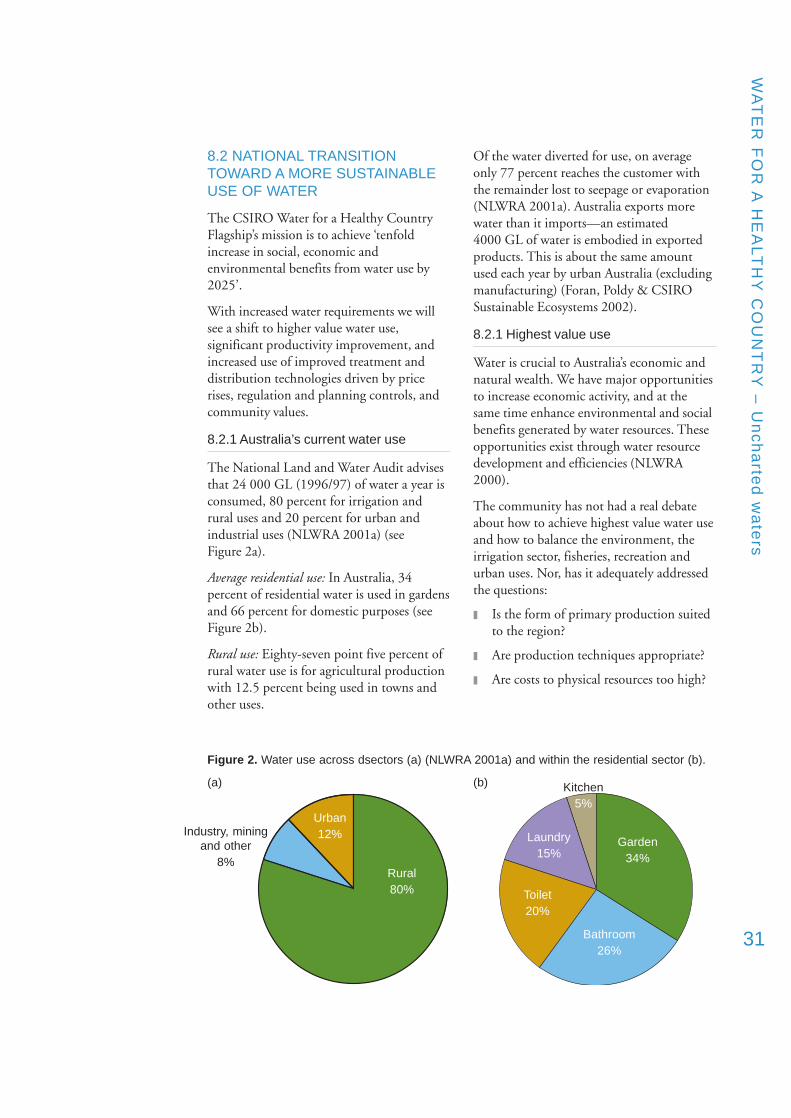
WA
TE
R F
OR
A H
EA
LT
HY
CO
UN
TR
Y –
Un
ch
arte
d w
ate
rs
31
8.2 NATIONAL TRANSITIONTOWARD A MORE SUSTAINABLEUSE OF WATER
The CSIRO Water for a Healthy CountryFlagship’s mission is to achieve ‘tenfoldincrease in social, economic andenvironmental benefits from water use by2025’.
With increased water requirements we willsee a shift to higher value water use,significant productivity improvement, andincreased use of improved treatment anddistribution technologies driven by pricerises, regulation and planning controls, andcommunity values.
8.2.1 Australia’s current water use
The National Land and Water Audit advisesthat 24 000 GL (1996/97) of water a year isconsumed, 80 percent for irrigation andrural uses and 20 percent for urban andindustrial uses (NLWRA 2001a) (seeFigure 2a).
Average residential use: In Australia, 34percent of residential water is used in gardensand 66 percent for domestic purposes (seeFigure 2b).
Rural use: Eighty-seven point five percent ofrural water use is for agricultural productionwith 12.5 percent being used in towns andother uses.
Of the water diverted for use, on averageonly 77 percent reaches the customer withthe remainder lost to seepage or evaporation(NLWRA 2001a). Australia exports morewater than it imports—an estimated4000 GL of water is embodied in exportedproducts. This is about the same amountused each year by urban Australia (excludingmanufacturing) (Foran, Poldy & CSIROSustainable Ecosystems 2002).
8.2.1 Highest value use
Water is crucial to Australia’s economic andnatural wealth. We have major opportunitiesto increase economic activity, and at thesame time enhance environmental and socialbenefits generated by water resources. Theseopportunities exist through water resourcedevelopment and efficiencies (NLWRA2000).
The community has not had a real debateabout how to achieve highest value water useand how to balance the environment, theirrigation sector, fisheries, recreation andurban uses. Nor, has it adequately addressedthe questions:
❚ Is the form of primary production suitedto the region?
❚ Are production techniques appropriate?
❚ Are costs to physical resources too high?
(b)
Garden34%
Bathroom26%
Toilet20%
Laundry15%
Kitchen5%
Figure 2. Water use across dsectors (a) (NLWRA 2001a) and within the residential sector (b).
(a)
Rural80%
Urban12%Industry, mining
and other8%
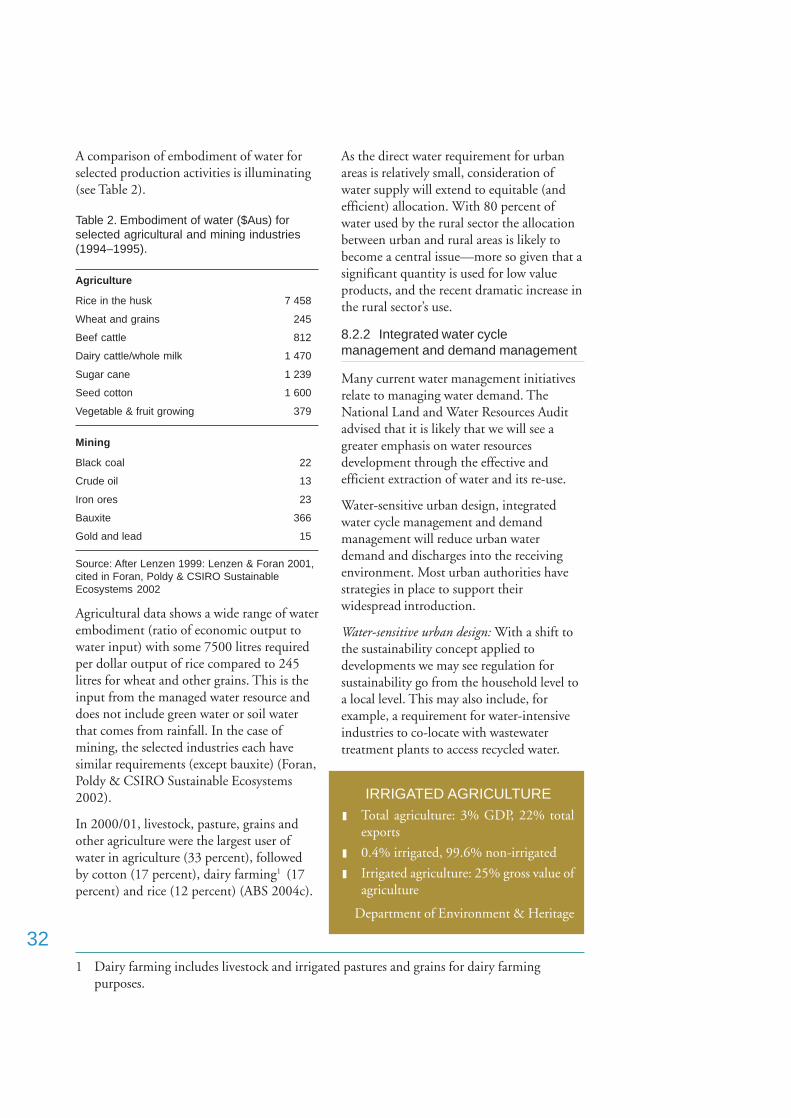
32
A comparison of embodiment of water forselected production activities is illuminating(see Table 2).
Table 2. Embodiment of water ($Aus) forselected agricultural and mining industries(1994–1995).
Agriculture
Rice in the husk 7 458
Wheat and grains 245
Beef cattle 812
Dairy cattle/whole milk 1 470
Sugar cane 1 239
Seed cotton 1 600
Vegetable & fruit growing 379
Mining
Black coal 22
Crude oil 13
Iron ores 23
Bauxite 366
Gold and lead 15
Source: After Lenzen 1999: Lenzen & Foran 2001,cited in Foran, Poldy & CSIRO SustainableEcosystems 2002
Agricultural data shows a wide range of waterembodiment (ratio of economic output towater input) with some 7500 litres requiredper dollar output of rice compared to 245litres for wheat and other grains. This is theinput from the managed water resource anddoes not include green water or soil waterthat comes from rainfall. In the case ofmining, the selected industries each havesimilar requirements (except bauxite) (Foran,Poldy & CSIRO Sustainable Ecosystems2002).
In 2000/01, livestock, pasture, grains andother agriculture were the largest user ofwater in agriculture (33 percent), followedby cotton (17 percent), dairy farming1 (17percent) and rice (12 percent) (ABS 2004c).
As the direct water requirement for urbanareas is relatively small, consideration ofwater supply will extend to equitable (andefficient) allocation. With 80 percent ofwater used by the rural sector the allocationbetween urban and rural areas is likely tobecome a central issue—more so given that asignificant quantity is used for low valueproducts, and the recent dramatic increase inthe rural sector’s use.
8.2.2 Integrated water cyclemanagement and demand management
Many current water management initiativesrelate to managing water demand. TheNational Land and Water Resources Auditadvised that it is likely that we will see agreater emphasis on water resourcesdevelopment through the effective andefficient extraction of water and its re-use.
Water-sensitive urban design, integratedwater cycle management and demandmanagement will reduce urban waterdemand and discharges into the receivingenvironment. Most urban authorities havestrategies in place to support theirwidespread introduction.
Water-sensitive urban design: With a shift tothe sustainability concept applied todevelopments we may see regulation forsustainability go from the household level toa local level. This may also include, forexample, a requirement for water-intensiveindustries to co-locate with wastewatertreatment plants to access recycled water.
IRRIGATED AGRICULTURE❚ Total agriculture: 3% GDP, 22% total
exports
❚ 0.4% irrigated, 99.6% non-irrigated
❚ Irrigated agriculture: 25% gross value ofagriculture
Department of Environment & Heritage
1 Dairy farming includes livestock and irrigated pastures and grains for dairy farmingpurposes.
WA
TE
R F
OR
A H
EA
LT
HY
CO
UN
TR
Y –
Un
ch
arte
d w
ate
rs
33
Integrated water cycle management: Watersupply, wastewater and stormwater areincreasingly being considered in anintegrated way. The volume of potable waterused, and sewage and the stormwatergenerated are all of the same order ofmagnitude in the major urban areas. There isa potential to significantly reduce demandfor water by recycling sewage and capturingstormwater. Water may be matched to itsintended use—for example, recycled waterfor toilet flushing and watering gardens;water in rain water tanks for laundry, hotwater and gardens.
Integrated water cycle management involvesan improved understanding of water systemsand their impact on the environment,planning, economy, health risks andcommunity.
Demand management: More stringentdemand management strategies may beintroduced at both residential and industrylevels. Several methods are being employedincluding:
❚ installation of low flow fixtures andappliances;
❚ products that use less water; and
❚ replacement of water with air cooling forindustrial processes.
It is likely that a multiplicity of waterproducts will be differentiated by, forexample, quality, service level standards, useand source.
8.2.3 Pricing of water services
With a push to sustainability, world waterprices are on the increase. By 2025agricultural water prices will be twice as highin developed countries and three times ashigh in developing countries. Water pricesfor connected households will double(Rosegrant, Cai & Cline 2002).
In Australia most water companies areshowing price increases in excess of the 2.5percent consumer price index for 2003. Incomparison to water prices in the rest of theworld, Australia continues to be rankedfourth lowest in 2002. Australia has beencriticised for being the driest inhabitedcontinent while having one of the highestconsumptions in the world (Friend et al.2003a). The Australian Water Associationdeems that the current water pricingstructure is too low to encourageconservation.
There is a significant price differentialbetween regional and urban areas. Can thisdifference be sustained?
BASIX
The New South Wales BASIX (Building Sustainability Index) a planning tool introducedinto the residential development approval process, targets a 40% reduction in both mainssupply water use and greenhouse gas emissions by 2006.
NSW Department of Infrastructure, Planning and Natural Resources
34
BUT WHAT IF …?
Imagine alternative futures where:
❚ we find cheap sustainable water sources;
❚ water can be treated at point of use;
❚ prices increase dramatically;
❚ leakages are reduced;
❚ new supplies are developed;
❚ we introduce large inter-basin transfers;
❚ the capacity of authorities to deliver water safely changes; or
❚ we see an increased demand for water.
8.3 WATER SERVICESINFRASTRUCTURE
Over the next 20 years it is anticipated thatinvestment in infrastructure will change.
Investment decision making: There are longlead times associated with putting into placenew water sources and storages, includinglarge (over 100 ML) desalination plants.Decisions for such developments will bemade in an environment of uncertainty withregard to climate and competition, adding tobusiness risk.
With the advent of climate change, we arelikely to see fundamental changes inplanning issues about dam safety andtransport systems that can handle theincreased variability and frequency ofextreme events.
The infrastructure: Currently, water andwastewater systems are separate. With thenew integrated water cycle managementsystems these will come closer together.
The scale of provision too will change. Willwe see:
❚ bigger centralised systems that arecheaper to operate;
❚ incremental introduction of smallersystems to accommodate the businessrisk;
❚ locally distributed systems with multipleservice providers, reaching the positionwhere the principal investment is intreatment plants rather thantransportation?
With a much greater acceptance ofdesalination plants, we will need anincreasing focus on energy management.
WA
TE
R F
OR
A H
EA
LT
HY
CO
UN
TR
Y –
Un
ch
arte
d w
ate
rs
35
Demand for water from existing sourcesfalls
Cheap sustainable water source: Imagine thatnew technology enables the extraction ofpotable water from any source (e.g. rawsewerage or sea water) cheaply and withoutsignificant greenhouse gas emissions and thereliable supply of water ceases to be an issue.
Water treatment at point of use: What ifauthorities deliver untreated water to allcustomers. Water is purified by small, cheap,energy-efficient filters at point-of-use withlow maintenance requirements.
Price increase: We could see a dramaticincrease in the price of water in urban andrural areas, reflecting its value to thecommunity and the cost of externalities.Rural and urban prices could becomecomparable. Investment to eliminate waterloss within the system could be increased anda thriving private sector water and biosolidrecycling industry could develop. Onehundred percent of wastewater andstormwater could be recycled.
Reduced leakages: Technology could bedeveloped to drastically reduce evaporativelosses from storage and eliminate mostleakage from pipes. Precision maintenancecould also reduce leaks.
Changes to water supplies
New supplies: Imagine if in ensuringreliability of supply for urban areas and tomeet the needs of additional instream flowsto maintain ecological systems (as a result ofclimate change), additional supplies andstorage including new dams are developed.
Large inter-basin transfers: What if urbanwater use is designated as the ‘highest valueuse’, with large transfers from rural to urbanuse. This, plus a fall in yields due to climatechange and a policy to increaseenvironmental flows, reduces wateravailability for agricultural use by 60 percent(to early 1980s’ consumption levels). Inresponse to climate change, an extensivenational infrastructure scheme could bedeveloped to transfer water from northern tosouthern Australia and shifts in whereagricultural production takes place couldoccur. Price increases and higher water yieldin northern Australia make this aneconomically feasible option.
Changes to water infrastructure: Waterauthorities could lose community trust, dueto a significant water quality incidentresulting in a number of deaths. A loss infaith in the industry could eventuallyundermine its service delivery capacity.Concerns about the protection of the watersupply from war, terrorism or mishaps thataffect human health could result in majorchanges to water infrastructure.
Increased demand for water: Communitywater demand could shift dramatically dueto, for example, large increases in economicand population growth, and direct andindirect use and consumption (including agrowth in the export of goods with asignificant amount of embodied water).
36
The aim of this discussion paper is tostimulate debate among urban watermanagers and decision makers on the natureof the world in 2024 and how it will effectcurrent planning.
Whatever the form of the journey to 2024,we believe that it is likely to be one ofopportunity and adventures. Theseopportunities bring uncertainty andchallenges for urban water management.
Most importantly, the urban water sector isan integral part of the wider Australiancommunity and international community.We are in the midst of worldwide,revolutionary change, with an uncertainoutcome. The uncertainty does not resultjust from events but is also associated withhuman attitudes and reactions towards thoseevents.
In developing sustainable water managementoptions, we need to think about the future:
❚ how community needs and industryoperating conditions may change; and
❚ the best strategies for catching theopportunities and managing the threats.
In doing so, we also need to decide where toinvest our resources:
❚ in physical infrastructure; and
❚ in the pursuit of knowledge andinnovation.
Water authorities, business, regulators andgovernments need to select strategies that cancreate benefits even in very different futures.
KEY INFLUENCERS
The key influencers look at different possibledevelopments, and consequently new risksand opportunities that the water sectormight face. Some of these challenges will bebroad sweeping changes, those typicallycovered by global forces, while others may bemore of a specific nature.
The seven key influencers of change forurban water were identified as:
❚ globalisation and liberalisation;
❚ people and institutions:
❚ population;
❚ climate and environmental change;
❚ energy and greenhouse gas;
❚ science and technology; and
❚ water use and management.
They emphasise the ‘uncertainties’ ratherthat the predetermined elements.
Although there are an unlimited number ofpossible futures, the seven key influencerswere selected as they were found to berecurrent research themes and are also mostlikely to cause the greatest discontinuities forthe urban water sector.
9. Conclusion
WA
TE
R F
OR
A H
EA
LT
HY
CO
UN
TR
Y –
Un
ch
arte
d w
ate
rs
37
Influencer 1 – Globalisation andliberalisation
The primary shapers of Australia’s future—globalisation, liberalisation and the uptake ofnew technology—are unstoppable. In thefuture, we will be more interdependent withand on the global community, and willexperience a period of rapid change anduncertainty.
The key questions for urban water are:
❚ How will the Australian community bepositioned in this new world?
❚ What opportunities and risks will itbring?
❚ How will globalisation and liberalisationinfluence community values?
❚ How will they influence businessdirection and operations?
Influencer 2 – People and institutions
The relative importance of the influencerswill be determined by both the community’swillingness to embrace change andgovernment structures, together with theway in which they interact.
The key questions for urban water are:
❚ What will the community expect of waterinstitutions and services?
❚ How far will governments pursue thereform agenda?
❚ How will stakeholders respond?
❚ What business enterprises will enter themarketplace?
Influencer 3 – Population
Australia’s population will increase and age.Globally, populations in underdevelopedcountries will grow faster and will beyounger.
The key questions for urban water are:
❚ How can we provide for urban growthand meet higher environmental andpublic health standards?
❚ How will businesses manage a skillsshortage at a time when they need todraw upon a solid skills and knowledgebase to meet the challenges?
Influencer 4 – Climate and environmentalchange
The exact impact of global warming isuncertain. Australia is likely to be hotter anddryer, with more extreme weatherconditions.
The key questions for urban water are:
❚ What provisions can be made to managereduced yield in general, and increasedyield variability, combined withpopulation and economic growth?
❚ What will be done to mitigate the risksarising from climate change andenvironmental degradation?
❚ How significant are those risks?
38
Influencer 5 – Energy and greenhousegas emissions
Environmental considerations will dominateinitiatives within the energy sector. Advancesare being made to increase efficiency inenergy production, and to developsustainable alternative energy sources.
The key questions for urban water are:
❚ Will the urban water sector initiateeffective energy efficiency measures?
❚ What should be done by the sector toreduce its greenhouse gas emissions?
Influencer 6 – Science and technology
The next 20 years will see the continueddiffusion of information technology and theapplication of new bio-technology. Nano-technology, sensor technologies and bio-markers offer an extraordinary range ofapplications and benefits.
The key questions for urban water are:
❚ What technological innovation ishappening that will impact on theservices that water currently provides?
❚ How will information technology,sensors, nano- and other technologies beincorporated into water management?
❚ What further advances can urban watermake to increase water efficiency at eachof the steps within the water cycle?
Influencer 7 – Water use andmanagement
A shift to higher value use of water inresponse to the recognition of the need forsustainable use, increasing prices, changes inintuitional structures and recognition of itsvalue is likely.
The key questions for the urban water sectorare:
❚ Will the transition to sustainable wateruse be achieved in time?
❚ Should allocations shift from rural tourban use?
❚ Will distributed localised systems replacethe current large-scale centralised waternetwork systems?
❚ How will the industry approach water useand management within a rapidlychanging operating environment?
In short can we do better?
WA
TE
R F
OR
A H
EA
LT
HY
CO
UN
TR
Y –
Un
ch
arte
d w
ate
rs
39
Appendix A: scenarios
The stories that could be told about the future are unlimited.
The scenarios of the 1980s were strongly coloured by the high oil prices and recession of theearly part of the decade, and the subsequent oil price collapse, speculation about thelongevity of the USSR, and concerns over climate change and sustainable development. Allissues were explored within the mental framework of the Cold War World. But by the endof the 1980s, it was clear we had entered a new era. The 1990s explored the new shape of amore integrated world that was subject to powerful forces.
GBE 2002
The following scenarios have been included to illustrate how others consider possibleshapes of the future.
SHELL GLOBAL SCENARIOS
The Shell 2002 global scenario (GBE 2002)looking out to 2020 explores the socialconsequences of globalisation, liberalisationand advancing technology.
Business Class explores a future resultingfrom when the connected freedom of theglobally interconnected elite and the onlyremaining super power—the US—lead theworld towards greater economic integrationand the dream of economic prosperity for all.We are looking at a world focused onefficiency and individual choice, where citiesand other rising sources of power diminishthe influence of national governments in akind of ‘new medievalism’, while businesspursues cutting-edge strategies to meet thevolatile conditions of the time.
Scenarios do not claim to be, and are not value free. They recognise that we are prisoners ofour own mindsets and language, and that understanding can be furthered with a new word orimage, especially a new story. We know that our successors will have a richer language todiscuss sustainability, and our task is to shine a light in that direction.
Ged Davis, Director, World Business Council for Sustainable Development
Prism questions the monochromatic worldof global integration and explores, instead,the persisting power of culture and history—the connections that matter—and the pursuitof multiple modernities as they emerge in anew regionalism. It is a world shaped by theinterplay of our differences, where countriesfind their own development path to suittheir particular circumstances. In thesediverse environments, the heart of business isto gain access and trust.
In both scenarios the real determinant ofsuccess is the quality of people engaged in anenterprise, how they relate to each other andto others, and how their talents aredeveloped and harnessed.
40
SYDNEY WATER SCENARIOS
The purpose of the development of theSydney Water Corporation scenarios was toidentify the external influences that shouldbe considered when undertaking a strategicplanning process. These scenarios,undertaken in 2002, explore possible waysthat the organisation may operate within abusiness environment created in the contextof global forces.
More than welcomed covers the rapidgrowth in Sydney over the past twenty yearsas Australia agreed to increase the refugeecomponent of its immigration program. Inthis scenario, Sydney’s population reached sixmillion—far exceeding earlier predictions. Asa result, Sydney Water worked closely withcustomers and the community to meet thisdemand, taking a lead role in planningdevelopment as the need to provide waterand sewerage to the increased populationbecame vital.
Alone again naturally details the changesthat Sydney Water would undergo inresponse to increasing global isolation,reduction of international trade and agrowing state/territory and national focus ondevelopment. A number of water problemsoccurred in the scenario and anyone whocould afford the alternatives to the publicwater supply did so. This resulted in theamalgamation of state-wide water functionsand Sydney Water became the urban waterdivision of the State Water Department.
Utopia – The Global Village postulatesperiods of intense conflict, which have givenway to a new form of internationalgovernance. Sydney Water has flourished as aresult of high levels of internationalcooperation and has now become the leaderin water management. It provides domesticcustomers with access to local and on-siteintegrated systems so that they can nowchoose service and quality levels. Minimumstandards are high and industrial andcommercial customers have products that arefit for purpose that meet sustainabilityprotocols. Developed countries generatefunds through water customers to raise thestandard of service in developing countries.
MacWater – A Retrospective suggests thatfollowing a rise in influence of multi-nationalcorporations and a subsequent decline ingovernment influence, the water industrybecomes self-regulating. A Frenchmultinational water company in thescenario, makes a major breakthrough inwater treatment resulting in a better, cheaperservice. They enter the Australian marketoffering cheaper alternatives than wasavailable through Sydney Water.
The international water companyexperiences flat profits in its primary marketand decides to expand into other enterprises.‘MacWater’ diversifies into landdevelopment. It wins the rights to build aseries of new eco-developments withfranchised management that includes localwater service provision. Its real competitiveadvantage is its leadership in customerknowledge, managing the environmentalimpact of its operations and cost efficiency. Itis very successful and puts in a bid to buySydney Water, which is eventually successful.
WA
TE
R F
OR
A H
EA
LT
HY
CO
UN
TR
Y –
Un
ch
arte
d w
ate
rs
41
ASPIRE AUSTRALIA 2025
The Business Council of Australia (BCA2004) concluded that there are three keychallenges for Australia’s future. The first isto deal with with its capacity; the second isits ability to respond to change; and thethird is its social cohesion.
Riding the Wave explores the consequence ofthe breakdown of trust between people andinstitutions. It is a story about reform fatigueand complacency. A loss of faith ininstitutions eventually undermines Australia’scapacity to grow. A lack of long-term focusedinvestment and reform results in economicdecline and social crises, ultimately leading toa re-examination of our political structures.In Riding the Wave, global prosperity is noguarantee for national prosperity. Efficientand effective government, and trust betweenpeople and institutions are critical tobuilding national capacity.
Stormy Seas focuses on Australia’sinternational relationships. It exploresAustralia’s policy options in a future wherethere is a substantial decline in Asia–Pacificstability and security. Regional instabilitychallenges Australia’s international andeconomic relations. Australians become morenationalistic, more cohesive—they are moretolerant towards difference within Australia,but at the same time cocooned in their viewof the rest of the world. While it is stressedthat this is only one possible story about howthese relationships might evolve, the StormySeas scenario presents a difficult future forAustralia.
Changing the Crew examines the socialdimensions of change in Australia—inparticular the potential value tensions withinand between generations as baby boomers,who have dominated Australia’s policies andvalues, are moving into retirement inunprecedented numbers. A new generationof pioneers create a sharper edge Australia,resulting in friction with other generations.Australians are more strongly connected withthe rest of the world than ever before,economically and culturally.
WATER AND SUSTAINABLEDEVELOPMENT, GLOBALSCENARIOS 2000 – 2050
The World Business Council for SustainableDevelopment (1997) developed threescenarios to explore possible challenges tosustainable development. Their divergencefrom each other arises when human actorsrespond in varying ways to the challenge ofsustainable development. They aredifferentiated from each other not so muchthrough the eco- or social system, butthrough people.
In FROG!, many nations experience a degreeof economic success and, for most, economicgrowth is the major concern, withsustainable development acknowledged to beimportant, but not pressing. Asenvironmental NGOs demand enforcementof standards set in global summits, thosenations who are striving to develop arguethat if the developed nations insist on raisingenvironmental standards, they should ‘FirstRaise Our Growth! People in developedcountries respond in uneven ways—sometimes by offering help in improving theenvironment, and sometimes in raising criesof ‘FROG!’ themselves.
In the early years, environmental health inmany areas improves significantly. This leadsto a perception that it is in much bettershape than it was in the late 1990s. But atthe global level, the picture is less clear. Withpopulation and economic growth,greenhouse gases are rising, unnoticed bymost. The signals are difficult to read andpeople disagree about what they mean—good reasons, it is felt, to continue toFROG! But, by 2050 there is evidence thatthe darkest predictions about global warmingare actually nearer to the truth than the moreoptimistic ones.
In FROG!, the habitual reliance ontechnology has not been sufficient to solvelonger-term environmental or social healthproblems. Globalisation and liberalisation of
42
markets along with the pressures of rapidurbanisation have raised the degree of socialinequity and unrest to a level that threatensbasic survival of both human systems andecosystems. People react like the frog thatwhen placed in boiling water, it leaps out;but when placed in cold water graduallyheats to boiling point. The complacent frogis boiled to death.
GEOpolity begins with a succession ofsignals in the first two decades—some real,some imagined—that an environmental andsocial crisis looms. The prevailing ‘economicmyth’ is increasingly viewed as dangerouslynarrow, particularly in Asia, where rapideconomic growth has meant that cornershave been cut and traditions lost. Becausemany institutions, especially governments,lose credibility as problem solvers, peopleexpect something from the new centres ofpower—the multinationals. But the businesssector seems unable or unwilling to respondadequately.
The perceived need for strong and certainresponses leads to a new global consensusthat welcomes technocratic solutions,sanctions, and more direct control of themarket to preserve environmental values andsocial cohesion. The impetus behind all thesemovements is the growing consensus that themarket has no inherent incentives to protectthe commons (publicly owned resources thatare freely available to all), social welfare, orany other non-economic values. In theabsence of business or governmentalleadership, people form new globalinstitutions, such as the Global EcosystemOrganisation (GEO) which has broadpowers to design and enforce globalstandards and measures to protect theenvironment and preserve society, even ifdoing so requires economic sacrifice.
In GEOpolity, governments are rejuvenatedas focal points of civil society. They seek to
work with markets rather than to displacethem. But they take the lead in shifting thestructure of the economy towards sustainabledevelopment in conjunction withinstitutions such as GEO.
Jazz is a world in which diverse players joinin ad hoc alliances to solve social andenvironmental problems in a pragmatic way.The key note of this scenario is dynamicreciprocity. This is a world of social andtechnological innovations, experimentation,rapid adaptation, voluntaryinterconnectedness, and a powerful and ever-changing global market.
Quick learning and subsequent innovationin Jazz is enabled by high transparency—thewidespread availability of information aboutingredients of products; sources of inputs;company, financial, environmental and socialdata; governmental decision-makingprocesses; and almost anything consumerswant to know.
Many players are involved, partly because theway information technology lowers barriersto entry allows new actors to step onto theeconomic stage. And that stage itself ischaracterised by a global free market, soundlegal systems and a respect for propertyrights.
To the extent that government is involved, itis most active at the local level, with ad hocglobal institutions arising to solve particularproblems. Agreements are reached throughmediation in a world in which transparencyis required.
Achievement of the new environmental andsocial standards occurs largely out of self-interest. The public is made aware oftransgressions and quickly acts againstcompanies or countries that violatestandards. Companies are interested in seeingthat disputes do not escalate and indirectlyharm them. They closely monitor
WA
TE
R F
OR
A H
EA
LT
HY
CO
UN
TR
Y –
Un
ch
arte
d w
ate
rs
43
relationships with customers and suppliersand quickly drop risky partners. In thishighly competitive and interconnectedworld, businesses see strategic economicadvantages in being perceived asenvironmentally and socially responsible, andmany become proactive leaders inresponding to the challenges.
Jazz is a world in which NGOs,governments, concerned consumers, andbusinesses act as partners—or fail. Together,with other players, they learn effective waysof incorporating environmental and socialvalues into market mechanisms.
WATERCOURSE – NAVIGATINGYOUR UTILITY’S FUTURE
Major trends being identified by the AWWAResearch Foundation (Means 2001) asaffecting the future water of water utilitiesare:
❚ increased infrastructure replacement costsforcing rates increases;
❚ water supply sources being managedholistically, along with land use andaquatic habitats;
❚ new environmental regulations thatcomplicate development of new suppliesand require more sophisticated treatmentof potable water;
❚ market pressures that drive water utilitiesto consolidate, outsource non-corefunctions and adopt other forms ofprivatisation;
❚ rising customer expectations compellingutilities to be more responsive to theirneeds;
❚ greater difficulty in recruiting andretaining employees as workers becomemore independent and entrepreneurial;and
❚ strategically applied technology thatpervade the work place.
Four plausible future water utility scenarioswere crafted by the AWWA ResearchFoundation:
❚ Business as usual looks at a water-shortutility with growing technologicalcapabilities;
❚ Rise of the Oligopoly depicts a worlddominated by several consolidatedmultinational utilities;
❚ Consumer Rules portrays as a situationin which consumers had full, virtuallyreal-time access to all utility information;and
❚ The Empire Strikes Back paints anidyllic future scenario in whichinfrastructure and water quality andquantity concerns have been successfullyaddressed.
44
Australian Bureau of Statistics (ABS) 2001,Measuring Wellbeing: Frameworks forAustralian Social Statistics, Cat. no.4160.0, ABS, Australia.
—— 2003a, Energy and Greenhouse GasEmission Accounts, Cat. no. 4604.0, ABS,Australia.
—— 2003b, Population Projections Australia2002-2101, Cat. no. 3222.0, ABSCanberra.
—— 2004, Water Use, Agriculture 2000–01,Cat. No 4610.0, ABS, Australia.
—— 2004a, Detailed Energy Statistics,Australia, Cat. no. 6248.0.55.002, ABS,Canberra.
—— 2004b, Themes web page –environment and energy. Available at<www.abs.gov.au>.
—— 2004c, Themes web page – AustralianSocial Trends. Available at<www.abs.gov.au>.
Australian Greenhouse Office (AGO) 2002,Australian National Greenhouse GasInventory 2002, AGO, Canberra.
Business Council of Australia (BCA) 2004,Aspire Australia 2025, BCA, Australia.Available at <www.bca.com.au>.
Cline W, 2004, ‘Degrees of Difference’, TheEconomist, April 29 2004.
Cocks D 2003, Deep Futures: Our Prospectsfor Survival, University of New SouthWales Press, Sydney.
CSIRO 2001a, Climate Change Impacts forAustralia, CSIRO, Australia.
—— 2001b, Climate Change Projections forAustralia, Climate Impact Group, CSIROAtmospheric Research, Melbourne,Australia.
Davis G 2002, Questioning Assumptions -Exploring Alternative Business Futures.Shell International Ltd., London, UK.Available at <www.shell.com/scenarios>.
Foran B, Poldy F & CSIRO SustainableEcosystems 2002, Future Dilemmas-Options to 2050 for Australia’s Population,Technology, Resources and Environment, areport to the Department of Immigrationand Multicultural and Indigenous Affairs,Working Paper Series 02/01, DIMIA,Canberra.
Friend D, Jones H & Briggs G (ExecutiveIntelligence Pty. Ltd.) 2003a, Pricing andDemand Management, Costs andInvestments, unpublished reportcommissioned by Sydney WaterCorporation.
—— 2003b, Market Review, unpublishedreport commissioned by Sydney WaterCorporation.
Friend D & Briggs G (Executive IntelligencePty. Ltd.) June 2003a, Annual Review-Technology, unpublished reportcommissioned by Sydney WaterCorporation.
—— 2003b, Annual Review – Environment,June 2003, unpublished reportcommissioned by Sydney WaterCorporation.
Global Business Environment (GBE) 2001,Exploring the Future. Energy Needs,Choices and Possibilities. Scenarios to2050, Shell International Ltd., London,UK. Available at <www.shell.com/scenarios>.
—— 2002, Exploring the Future. People andConnections. Global Scenarios to 2020.Public Summary, Shell International Ltd.,London, UK. Available at<www.shell.com/scenarios>.
Bibliography
WA
TE
R F
OR
A H
EA
LT
HY
CO
UN
TR
Y –
Un
ch
arte
d w
ate
rs
45
Goward P 2003, The future of work, scarcityand the nature of government, paperpresented to A 2020 Vision: Governmentfor the Future, Institute of PublicAdministration Australia, Australia.Available at <www.ipaa.org.au>.
Gutteridge, Haskins and Davey (GHD)2004, ‘Australian Water Industry RoadMapping Project, discussion paper, draft,Barton Group, Australia.
Hawken P, Lovins AB & Hunter Lovins L2000, Natural Capitalism the NextIndustrial Revolution, Earthscan, UK.
International Energy Agency (IEA) 2002,IEA World Energy Outlook 2002,Available at <www.iea.org>.
Lenzen M & Foran B 2001, An Input-Output Analysis of Australian Water Usage,Water Policy June 2001. Available at<www.waterpolicy.net>.
Means 111 EG 2001, Watercourse NavigatingYour Utility’s Future, AWWA ResearchFoundation, Denver, Colorado.
National Competition Council 2003,National Competition Policy. Water ReformAssessment Framework 2004. December2003. Available at <www.ncc.gov.au/publications>.
National Intelligence Council (nic) 2000,Global Trends 2015: A Dialogue About theFuture With Nongovernment Experts.Available at <www.cia.gov/reports/globaltrends2015/>.
National Land and Water Resources Audit(NLWRA) 2001a, Australian WaterResources Assessment 2000, NLWRA,Canberra.
—— 2001b, Australian National WaterAssessment 2000, Summary. NLWRA,Canberra. Available at<www.audit.ea.gov.au/ANRS/water/docs/national/Water_Summary.html>
—— 2000, Water Resources in Context,NLWRA, Canberra.
Rosegrant MW, Cai X & Cline S 2002,Global Water Outlook 2025, InternationalFood Policy Research Institute,Washington D.C. Available at<www.ifpri.org/pubs/fpr/fprwater2025.pdf>.
Shell International Ltd. 2004, GlobalScenarios 1992 -2002. Available at<www.shell.com/scenarios>.
UNESCO Press Release ‘Political InertiaExacerbates Water Crisis, Says WorldDevelopment Report, First UN System-Wide Evaluation of Global Resources,SAG/119, 6/3/2003
United Nations 2003, International Year ofFreshwater 2003 Backgrounder, UnitedNations, Department of PublicInformation. Available at <www.un.org/events/water/backgrounder.pdf>.
—— 2005, Millennium Project. Available at<www.unmillenniumproject.org>.
—— 2004, Millennium Project 2004,Interim Report of Taskforce 7 on Waterand Sanitation, United Nations. Availableat <www.unmillenniumproject.org>.
U.S. Census Bureau 2004, World Populationfrom 1950 to 2050, U.S. Bureau.Available at <www.census.gov/ipc/www.worldpop.html>.
Wack P 1985a, Scenarios: Shooting theRapids, Harvard Business ReviewNovember-December 1985.
Wack P 1985b, Scenarios: Uncharted WatersAhead, Harvard Business ReviewNovember-September-October 1985.
Water Services Association of Australia(WSAA) 2003, WSAAfacts 2003, WSAA,Australia.
World Business For SustainableDevelopment (WBSD) 1997, Water andSustainable Development – a BusinessPerspective, World Business For SustainableDevelopment Global Scenarios 2000 –2050, summary brochure, London.Available at <www.wbcsd.org>.

46

WA
TE
R F
OR
A H
EA
LT
HY
CO
UN
TR
Y –
Un
ch
arte
d w
ate
rs