national report - toxics link
TRANSCRIPT
NATIONAL REPORT
LEAD IN ENAMEL HOUSEHOLD PAINTS IN INDIA IN 2015A follow-up study on lead levels in paint analyzed in 2013
vii
TABLE OF CONTENTS
Acknowledgements iii
Preface ix
Executive Summary xi
Findings xii
Conclusions xii
Recommendations xiii
1. Background 1
1.1 Health and Economic Impact of Lead Exposure 11.2 Th e Use of Lead in Paint 31.3 Paint Market and Regulatory Framework in India 4 Lead Paint Regulatory Framework 5
2. Materials and Methods 6
3. Results 8
4. Discussion & Conclusions 12
5. Recommendations 13
Appendix
Appendix A 14
Appendix B 30
List of Figure and Tables
Figures
Figure 1 Market share of major paint manufacturers in India 5
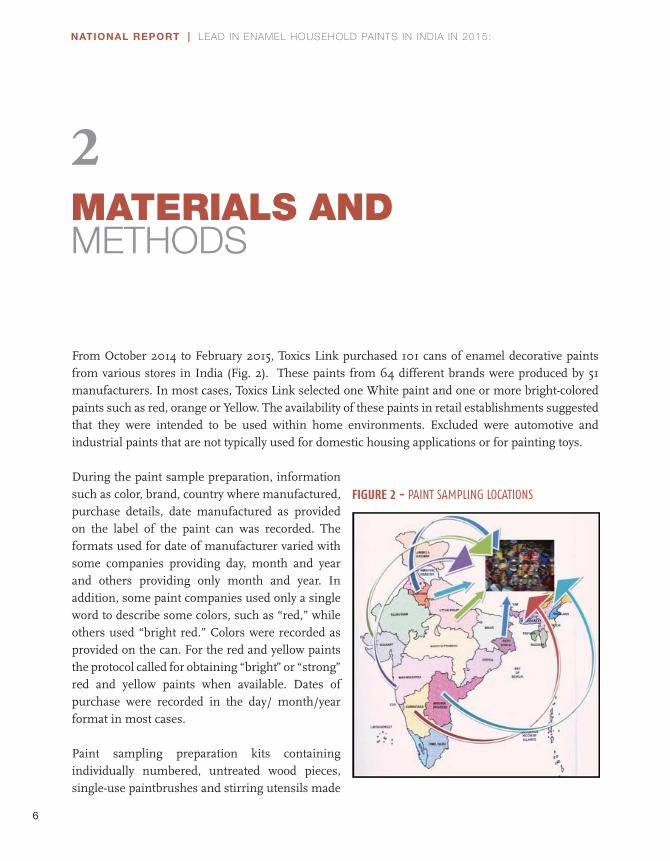
Figure 2 Paint sampling locations 6
Figure 3 Preparation of paint sample 7
Figure 4 Lead concentrations in all analyzed paints in 2015 grouped according to
concentration and color. 10
Figure 5 The 2015 lead concentrations in the 70 paints analyzed in both 2013 and 2015
grouped according to concentration and color. 10
Figure 6 The 2013 lead concentrations in the 70 paints analyzed in both 2013 and 2015
grouped according to concentration and color. 11
Figure 7 Lead concentrations in the 31 paints analyzed only in 2015 grouped according to
concentration and color. 11
Figure 8 Average lead concentration in yellow and white color in 2013 and 2015. 11
Tables
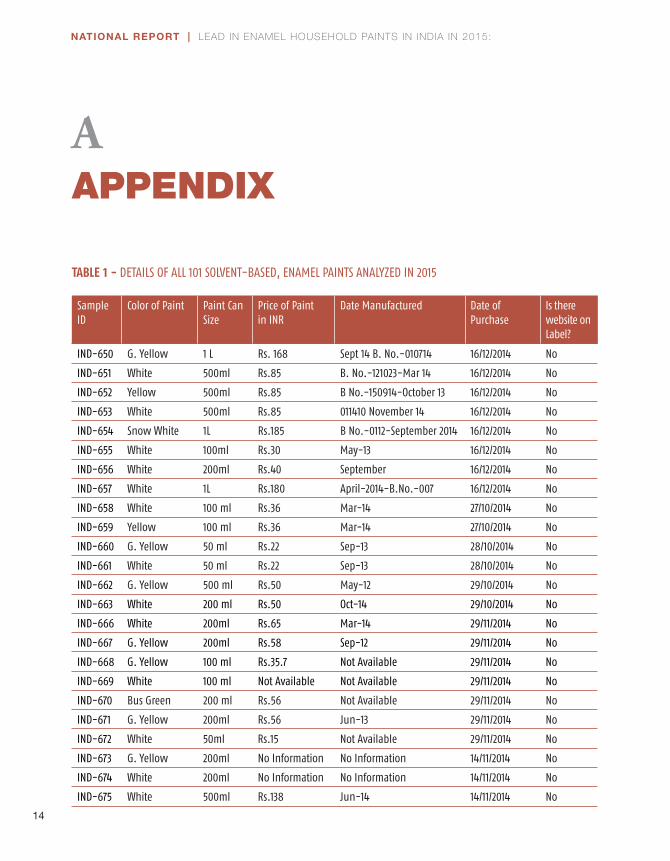
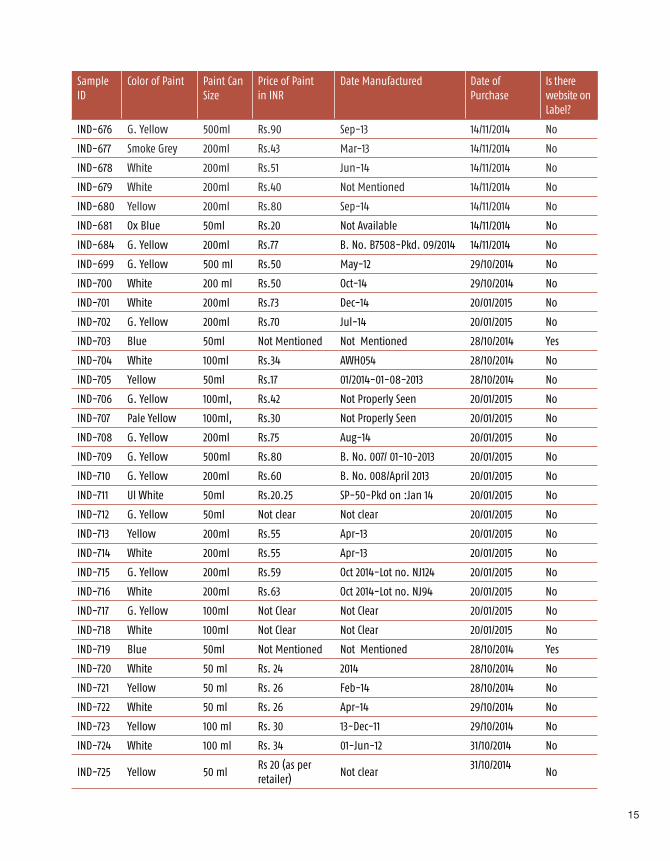
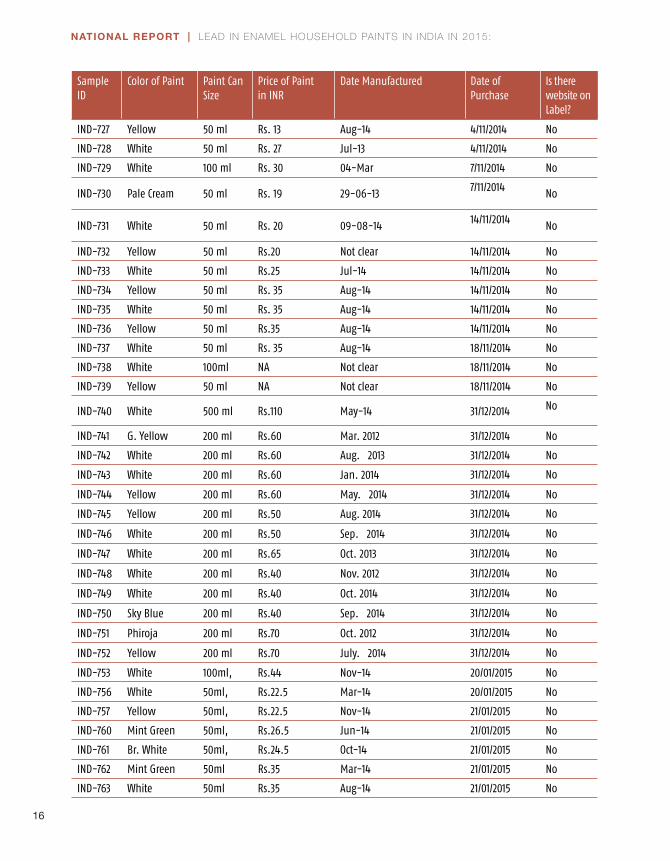
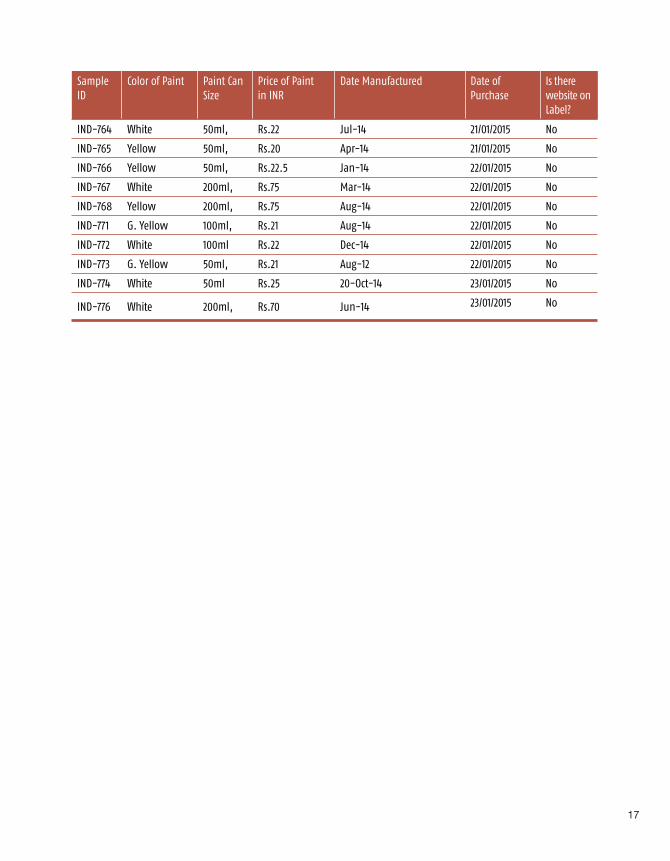
Table 1 Details of all 101 Solvent-based, Enamel Paints analyzed in 2015 14
Table 2 Results of Lab Analysis of all 101 Solvent-based Enamel Paints analyzed in 2015 18
Table 3 Distribution of Lead Concentration by Brand of all 101 Solvent-based Enamel Paints
analyzed in 2015. 21
Table 4 Comparison of Lead Concentration by Brand for solvent-based Enamel Paints
included in both the 2013 and 2015 study (70 paints) 23
Table 5 Lead Concentration (ppm) by Color for all 101 Solvent-based Enamel Paints 25
Table 6 Comparison of Lead Concentration (ppm) by Color for solvent-based Enamel Paints
included in both the 2013 and 2015 study (70 paints) 25
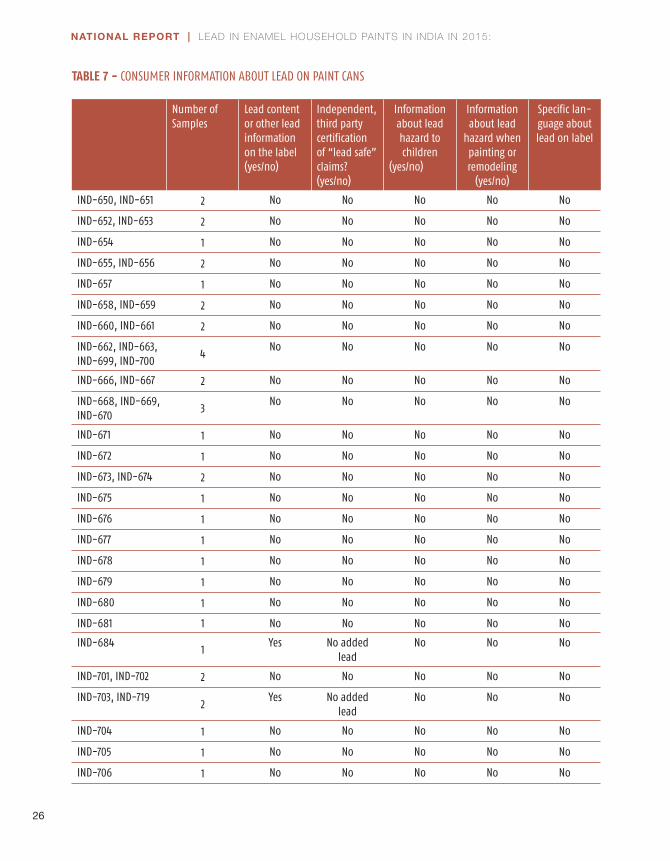
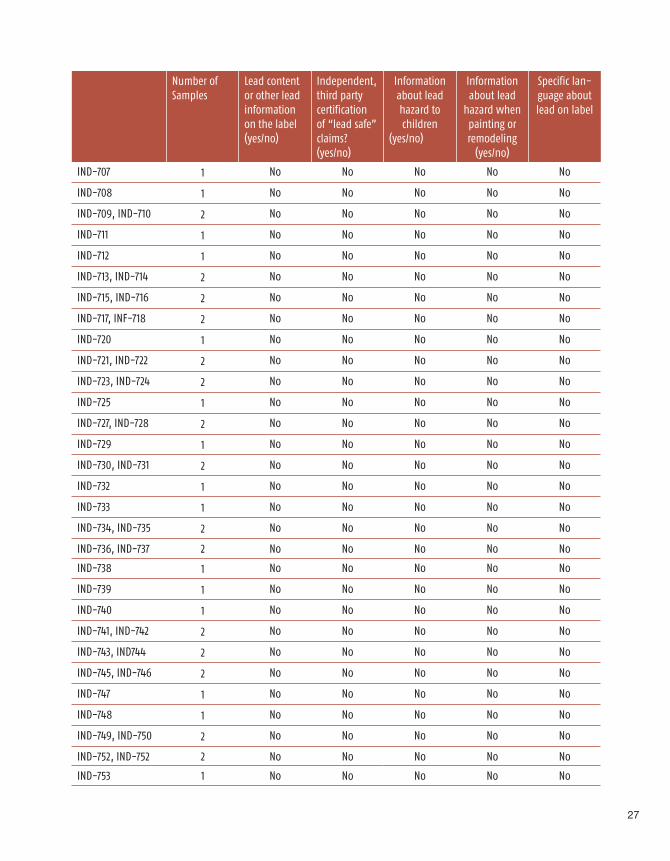
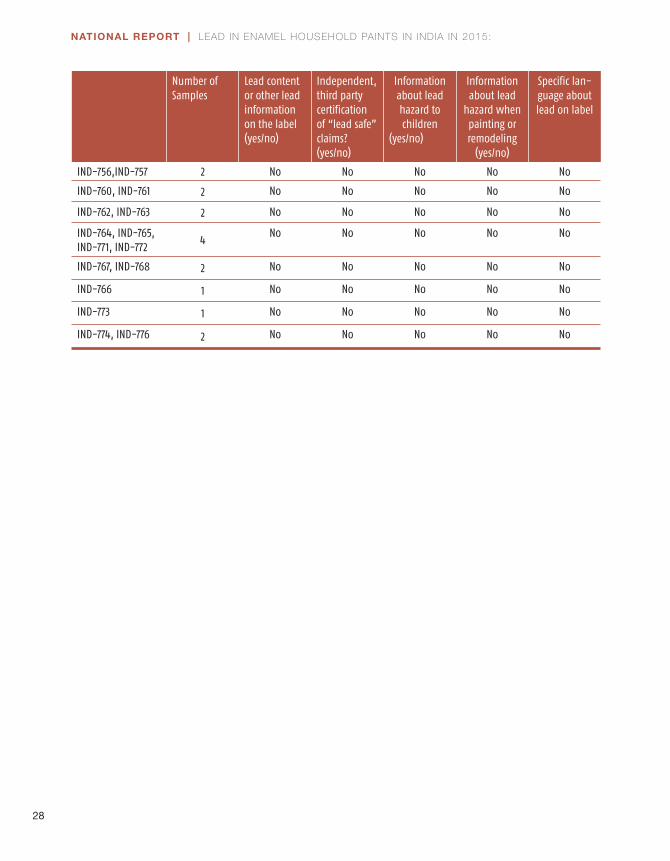
Table 7 Consumer Information about Lead on Paint Cans 26
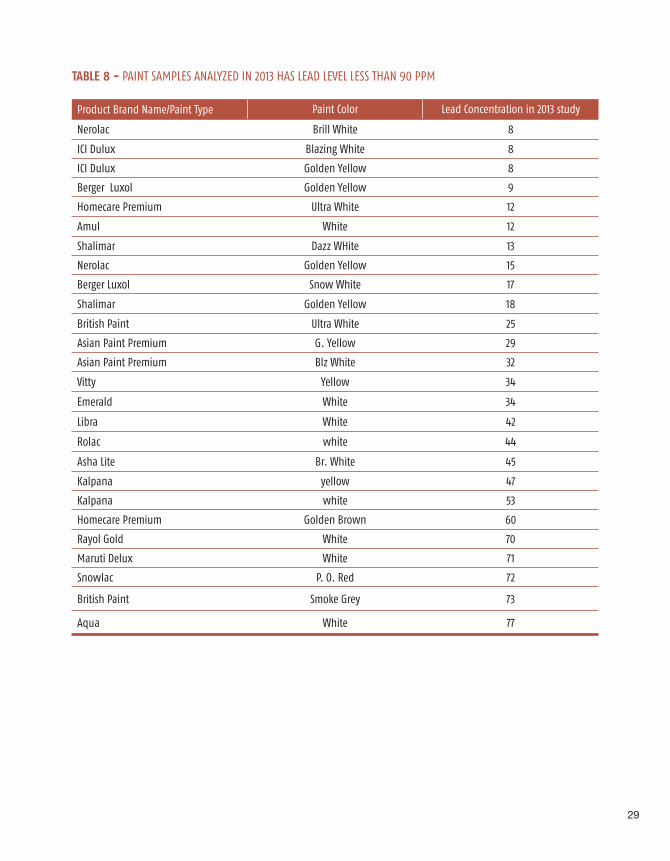
Table 8 Paint samples analyzed in 2013 has lead level less than 90 ppm 29
xi
EXECUTIVE SUMMARY
While lead exposure is also harmful to adults, lead exposure harms children at much lower levels, and the health effects are generally irreversible and can have a lifelong impact. The younger the child, the more harmful lead can be, and children with nutritional defi ciencies absorb ingested lead at an increased rate. The human fetus is the most vulnerable, and a pregnant woman can transfer lead that has accumulated in her body to her developing child. Lead is also transferred through breast milk when lead is present in a nursing mother.
Evidence of reduced intelligence caused by childhood exposure to lead has led the World Health Organization (WHO) to list “lead-caused mental retardation” as a recognized disease. WHO also lists it as one of the top ten diseases whose health burden among children is due to modifi able environmental factors.
Most highly industrial countries adopted laws or regulations to control the lead content of decorative paints—the paints used on the interiors and exteriors of homes, schools, and other child-occupied facilities—beginning in the 1970s and 1980s. In India lead paint regulation was enacted in 1950 and subsequently revised in 1965, 1975, 1993, 2004 and 2013 respectively and it is voluntary nature.
The paint study was undertaken as part of the Asian Lead Paint Elimination Project. The Asian Lead Paint Elimination Project carries out focused activities to eliminate lead paint from the market in seven project countries – Bangladesh, India, Indonesia, Nepal, Philippines, Sri Lanka, and Thailand.
xii
NATIONAL REPORT | LEAD IN ENAMEL HOUSEHOLD PAINTS IN INDIA IN 2015:
Findings
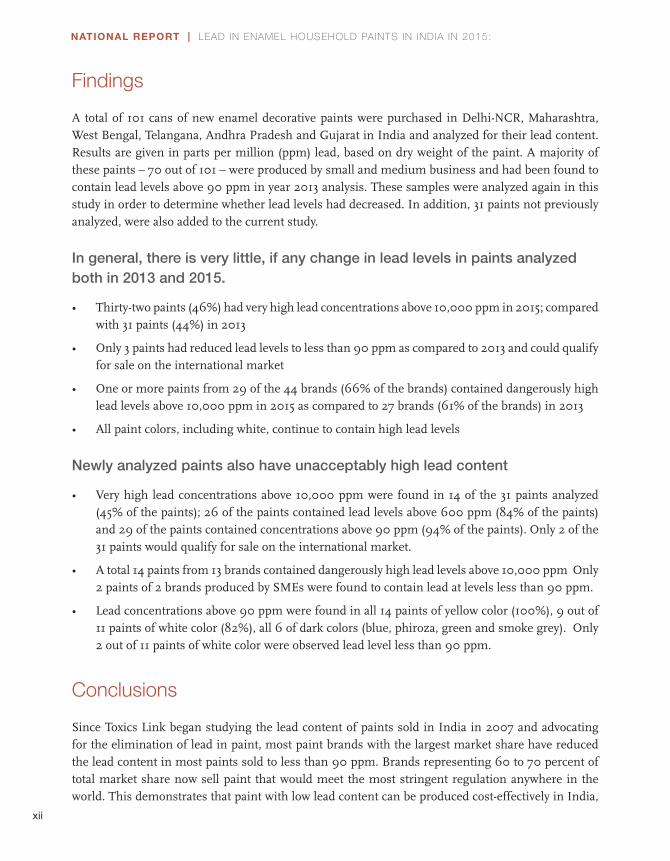
A total of 101 cans of new enamel decorative paints were purchased in Delhi-NCR, Maharashtra, West Bengal, Telangana, Andhra Pradesh and Gujarat in India and analyzed for their lead content. Results are given in parts per million (ppm) lead, based on dry weight of the paint. A majority of these paints – 70 out of 101 – were produced by small and medium business and had been found to contain lead levels above 90 ppm in year 2013 analysis. These samples were analyzed again in this study in order to determine whether lead levels had decreased. In addition, 31 paints not previously analyzed, were also added to the current study.
In general, there is very little, if any change in lead levels in paints analyzed both in 2013 and 2015.
• Thirty-two paints (46%) had very high lead concentrations above 10,000 ppm in 2015; compared with 31 paints (44%) in 2013
• Only 3 paints had reduced lead levels to less than 90 ppm as compared to 2013 and could qualify for sale on the international market
• One or more paints from 29 of the 44 brands (66% of the brands) contained dangerously high lead levels above 10,000 ppm in 2015 as compared to 27 brands (61% of the brands) in 2013
• All paint colors, including white, continue to contain high lead levels
Newly analyzed paints also have unacceptably high lead content
• Very high lead concentrations above 10,000 ppm were found in 14 of the 31 paints analyzed (45% of the paints); 26 of the paints contained lead levels above 600 ppm (84% of the paints) and 29 of the paints contained concentrations above 90 ppm (94% of the paints). Only 2 of the 31 paints would qualify for sale on the international market.
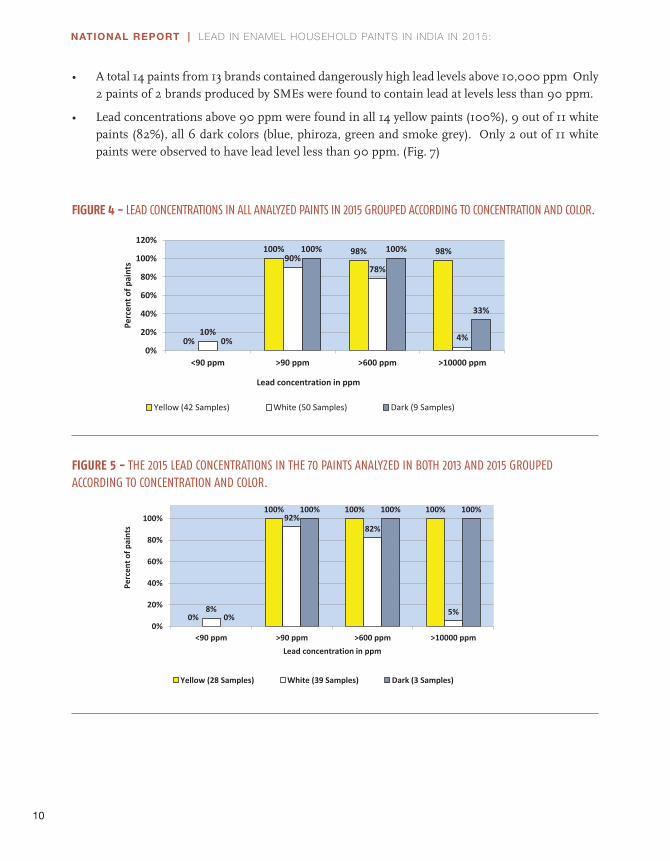
• A total 14 paints from 13 brands contained dangerously high lead levels above 10,000 ppm Only 2 paints of 2 brands produced by SMEs were found to contain lead at levels less than 90 ppm.
• Lead concentrations above 90 ppm were found in all 14 paints of yellow color (100%), 9 out of 11 paints of white color (82%), all 6 of dark colors (blue, phiroza, green and smoke grey). Only 2 out of 11 paints of white color were observed lead level less than 90 ppm.
Conclusions
Since Toxics Link began studying the lead content of paints sold in India in 2007 and advocating for the elimination of lead in paint, most paint brands with the largest market share have reduced the lead content in most paints sold to less than 90 ppm. Brands representing 60 to 70 percent of total market share now sell paint that would meet the most stringent regulation anywhere in the world. This demonstrates that paint with low lead content can be produced cost-effectively in India,
xiii
and that companies are willing and able to make the shift. On other hand, small and medium paint manufacturers continue to add lead in their paints.
Additionally, since Toxics Link began investigating lead in decorative paint and advocating for a mandatory lead paint standard, government agencies revised India’s voluntary standard downward from 1,000 ppm to 90 ppm. This action demonstrates that government offi cials have become aware of the danger lead paint poses to young children and the nation’s economy and are willing to prevent childhood lead exposure.
Advocacy by Toxics Link also has raised awareness of the hazard of lead paint among consumers. Nevertheless, it remains virtually impossible for consumers to identify which paints contain unacceptable levels of lead.
Recommendations
Government
• Government should establish a national mandatory regulatory framework to control the manufacture, import, export, sale, and use of lead paints and products coated with lead paint immediately
• Government should monitor lead in paint in order to achieve a strict compliance with mandatory standards once established
Paint Industry
• Produce paints without using lead
• Become a part of third party certifi cation
• Include uniform logo on the product
Public Awareness
• Purchase lead free paints from the market
• Be especially aware of paint contents when choosing the paint for children’s room

xiv
NATIONAL REPORT | LEAD IN ENAMEL HOUSEHOLD PAINTS IN INDIA IN 2015:
1
1.1 Health and Economic Impact of Lead Exposure
Children are exposed to lead from paint when deteriorating paint on walls, windows, doors, or other painted surfaces begins to chip or deteriorate and lead is released to dust and soil. When a surface previously painted with lead paint is sanded or scraped in preparation for repainting, very large amounts of lead-contaminated dusts also are produced and spread and can constitute a severe health hazard.1
Children playing indoors or outdoors get house dust or soil on their hands, and then ingest it through normal hand-to-mouth behavior. If the house dust or the soil is contaminated with lead, the children ingest lead. Hand-to-mouth behavior is especially prevalent in children aged six years and under, the age group most easily harmed by exposure to lead. A typical one- to six-year-old child ingests between 100 and 400 milligrams of house dust and soil each day.2
In some cases, children pick up paint chips and put them directly into their mouths. This can be especially harmful because the lead content of chips is typically much higher than what is found in dust and soils. When toys, household furniture, or other articles are painted with lead paint, children may chew on them and directly ingest the lead-contaminated, dried paint. Nonetheless, the most common way that children ingest lead is through lead-contaminated dust and soil that gets onto their hands.3
While lead exposure is also harmful to adults, lead exposure harms children at much lower levels, and the health effects are generally irreversible and can have a lifelong impact.4 The younger the child, the more harmful lead can be, and children with nutritional defi ciencies absorb ingested lead at an increased rate.5 The human fetus is the most vulnerable, and a pregnant woman can transfer lead that has accumulated in her body to her developing child.6 Lead is also transferred through breast milk when lead is present in a nursing mother.7
BACKGROUND
1
2
NATIONAL REPORT | LEAD IN ENAMEL HOUSEHOLD PAINTS IN INDIA IN 2015:
Once lead enters a child’s body through ingestion, inhalation, or across the placenta, it has the potential to damage a number of biological systems and pathways. The primary target is the central nervous system and the brain, but lead can also affect the blood system, the kidneys, and the skeleton.8
It is generally agreed that one key element in lead toxicity is its capacity to replace calcium in neurotransmitter systems, proteins, and bone structure, altering function and structure and thereby leading to severe health impacts. Lead is also known to affect and damage cell structure.9
According to the World Health Organization (WHO): ”Lead has no essential role in the human body, and lead poisoning accounts for about 0.6% of the global burden of disease.”10 Evidence of reduced intelligence caused by childhood exposure to lead has led WHO to list “lead-caused mental retardation” as a recognized disease. WHO also lists it as one of the top ten diseases whose health burden among children is due to modifi able environmental factors.11
In recent years, medical researchers have been documenting signifi cant health impacts in children from lower and lower levels of lead exposure.12,13 According to WHO: “There is no known safe level of exposure to lead.”14
When a young child is exposed to lead, the harm to her or his nervous system makes it more likely that the child will have diffi culties in school and engage in impulsive and violent behavior.15 Lead exposure in young children is also linked to increased rates of hyperactivity, inattentiveness, failure to graduate from high school, conduct disorder, juvenile delinquency, drug use, and incarceration.16 Lead exposure impacts on children continue throughout life and have a long-term impact on a child’s work performance, and—on average—are related to decreased economic success.
A recent study investigating the economic impact of childhood lead exposure on national economies in all low- and middle-income countries estimated a total cumulative cost burden of $977 billion international dollarsb per year.17 The study considered the neurodevelopmental effects on lead-exposed children, as measured by reduced IQ points, and it correlated lead exposure-related reductions in children’s IQ scores to reductions in lifetime economic productivity, as expressed in lifelong earning power. The study identifi ed many different sources of lead exposure in children, with lead paint as one major source. Broken down by region, the economic burden of childhood lead exposure as estimated by this study was:
• Africa: $134.7 billion of economic loss, or 4.03% of Gross Domestic Product (GDP)
• Latin America and the Caribbean: $142.3 billion of economic loss, or 2.04% of GDP
• Asia: $699.9 billion of economic loss, or 1.88% of GDP 1.877 trillion USD (2013)
b. An Interna onal dollar is a currency unit used by economists and interna onal organiza ons to compare the values of diff erent currencies. It adjusts the value of the U.S. dollar to refl ect currency exchange rates, purchasing power parity (PPP), and average commodity prices within each country. According to the World Bank, “An interna onal dollar has the same purchasing power over GDP as the U.S. dollar has in the United States.” The interna onal dollar values in this report were calculated from a World Bank table that lists GDP per capita by country based on purchas-ing power parity and expressed in interna onal dollars. The data from the table (at: h p://data.worldbank.org/indicator/NY.GDP.PCAP.PP.CD) was accessed by the report’s authors in February 2012.
3
1.2 The Use of Lead in Paint
Lead is a toxic metal that is found in some paints.
Paints contain lead when the paint manufacturer intentionally adds one or more leaded compounds to the paint for some purpose. A paint product may also contain some amount of lead when paint ingredients contaminated with lead are used, or when there is cross-contamination from other product lines in the same factory. Water-based paints are rarely contaminated with lead, but solvent-based enamel paints have been found to have high lead content in many countries.18, 19
The leaded compounds most commonly added to paints are pigments. Pigments are used to give the paint its color, make the paint opaque (so it covers well), and protect the paint and the underlying surface from degradation caused by exposure to sunlight. Lead-based pigments are sometimes used alone, and sometimes used in combination with other pigments.
Leaded compounds also may be added to enamel paints for use as driers (sometimes called drying agents or catalysts). Leaded compounds are also sometimes added to paints used on metal surfaces to inhibit rust or corrosion. The most common of these is lead tetroxide, sometimes called red lead or minium.
Non-leaded pigments, driers, and anti-corrosive agents have been widely available for decades, and are used by manufacturers producing the highest quality paints. When a paint manufacturer does not intentionally add lead compounds in the formulation of its paints, and takes care to avoid the use of paint ingredients that are contaminated with lead, the lead content of the paint will be very low –less than 90 parts per million (ppm) total lead by dry weight and frequently down to 10 ppm or less.
Most highly industrial countries adopted laws or regulations to control the lead content of decorative paints—the paints used on the interiors and exteriors of homes, schools, and other child-occupied facilities—beginning in the 1970s and 1980s. Many also imposed controls on the lead content of paints used on toys and for other applications likely to contribute to lead exposure in children. These regulatory actions were taken based on scientifi c and medical fi ndings that lead paint is a major source of lead exposure in children, and that lead exposure in children causes serious harm, especially to children aged six years and under.
The use of lead in production of decorative paint is prohibited in the European Union through regulations related to safety of consumer products and specifi c prohibitions for most leaded raw materials. In the U.S., Canada, Australia and other countries with regulations restricting the use of leaded ingredients in decorative paint, standards specifying a maximum lead limit are in place. The current standard for household paints in the U.S. and Canada is 90 ppm, and adherence to this ensures that a manufacturer can sell its paint anywhere in the world. Some other countries have established standards of 600 ppm.20, 21
4
NATIONAL REPORT | LEAD IN ENAMEL HOUSEHOLD PAINTS IN INDIA IN 2015:
1.3 Paint Market and Regulatory Framework in India
Paint Market in India
Over the past few years, the Indian paint market has grown substantially and caught the attention of many international paint manufacturers. The country continues to enjoy a healthy growth rate compared to other economies, due to the increasing level of disposable income, and demand from the infrastructure, industrial and automotive sectors, according to new research report, “Indian Paint Industry Forecast to 2015”.22
The Indian paint industry is likely to surge from its current level of about Rs. 40,600 crore annually to about Rs. 62,000 crore by 2016, a breathtaking double-digit compound annual growth rate (CAGR) of about 20%. A recent report on “Indian Paint Industry: 2014” reveals that India is the second-largest consumer of paint in Asia. Top players include Asian Paints, Kansai Nerolac Paints, Berger Paints, Akzo Nobel and Shalimar Paints.
The rural market has grown at a rate of around 20% a year (in fi nancial year 2014). The rural sector has a major share of the decorative paints segment. Thus, any benefi t to the rural sector due to improving in dispensable income is directly co-related to the growth of the paint industry.
The decorative segment made up nearly 73 percent (at Rs 29,638 crore) at of the paint market while the remaining Rs 10,962 crore was contributed by the industrial segment. “Demands for decorative paints arise from household paintings, architectural and other display products. The demand for paint increases during festive seasons. The major boost to the growth in Indian paint market has been provided by the decorative paint segment, which is anticipated to grow at a CAGR of more than 18% during the period 2014-15, said Mr. D S Rawat, Secretary General Associated Chambers of Commerce and Industry of India (ASSOCHAM).23
The decorative paint market is further segmented into emulsions, enamel, distemper and cement paints. Similarly, the industrial paint market is also segmented into automotive coating, high performance coating, powder coating and coil coating.
Some of the major reasons for the rise in the paint industry are awareness about environment and increases in disposable income are leading to demand for premium paints. The rising income levels and exposure to global trends have made consumers very aspiring, and they also have become health conscious and interested in using environmental friendly products. 24
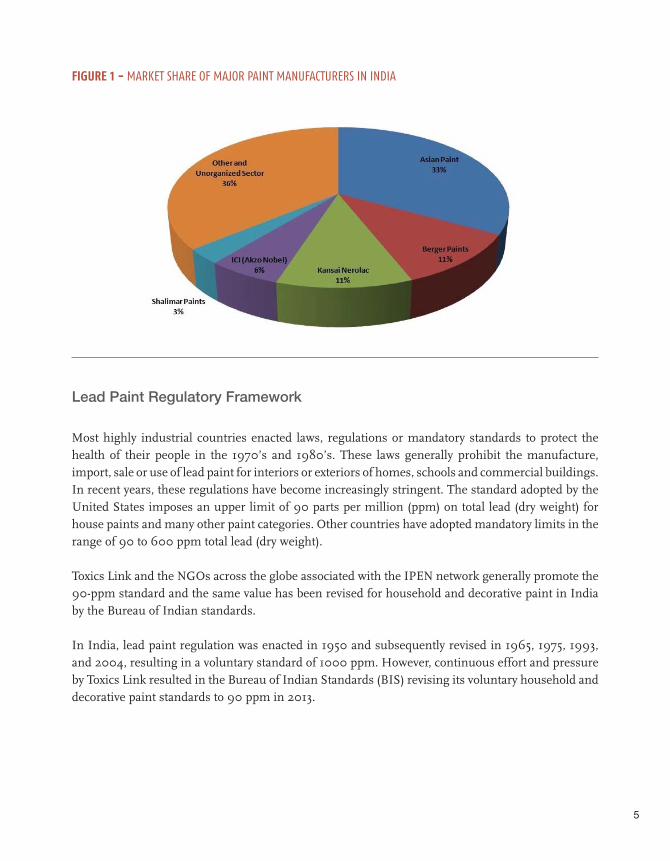
The unorganized sector accounts for approximately 35% of the paint market, with the organized sector accounting for the balance. In the unorganized segment, there are approximately 2,500 units having small and medium sized paint manufacturing plants. Top organized players include Asian Paints, Kansai Nerolac, Berger Paints, Shalimar Paints and ICI dulux (Akzo Nobel). (Fig. 1)
5
FIGURE 1 - MARKET SHARE OF MAJOR PAINT MANUFACTURERS IN INDIA
Lead Paint Regulatory Framework
Most highly industrial countries enacted laws, regulations or mandatory standards to protect the health of their people in the 1970’s and 1980’s. These laws generally prohibit the manufacture, import, sale or use of lead paint for interiors or exteriors of homes, schools and commercial buildings. In recent years, these regulations have become increasingly stringent. The standard adopted by the United States imposes an upper limit of 90 parts per million (ppm) on total lead (dry weight) for house paints and many other paint categories. Other countries have adopted mandatory limits in the range of 90 to 600 ppm total lead (dry weight).
Toxics Link and the NGOs across the globe associated with the IPEN network generally promote the 90-ppm standard and the same value has been revised for household and decorative paint in India by the Bureau of Indian standards.
In India, lead paint regulation was enacted in 1950 and subsequently revised in 1965, 1975, 1993, and 2004, resulting in a voluntary standard of 1000 ppm. However, continuous effort and pressure by Toxics Link resulted in the Bureau of Indian Standards (BIS) revising its voluntary household and decorative paint standards to 90 ppm in 2013.
6
NATIONAL REPORT | LEAD IN ENAMEL HOUSEHOLD PAINTS IN INDIA IN 2015:
From October 2014 to February 2015, Toxics Link purchased 101 cans of enamel decorative paints from various stores in India (Fig. 2). These paints from 64 different brands were produced by 51 manufacturers. In most cases, Toxics Link selected one White paint and one or more bright-colored paints such as red, orange or Yellow. The availability of these paints in retail establishments suggested that they were intended to be used within home environments. Excluded were automotive and industrial paints that are not typically used for domestic housing applications or for painting toys.
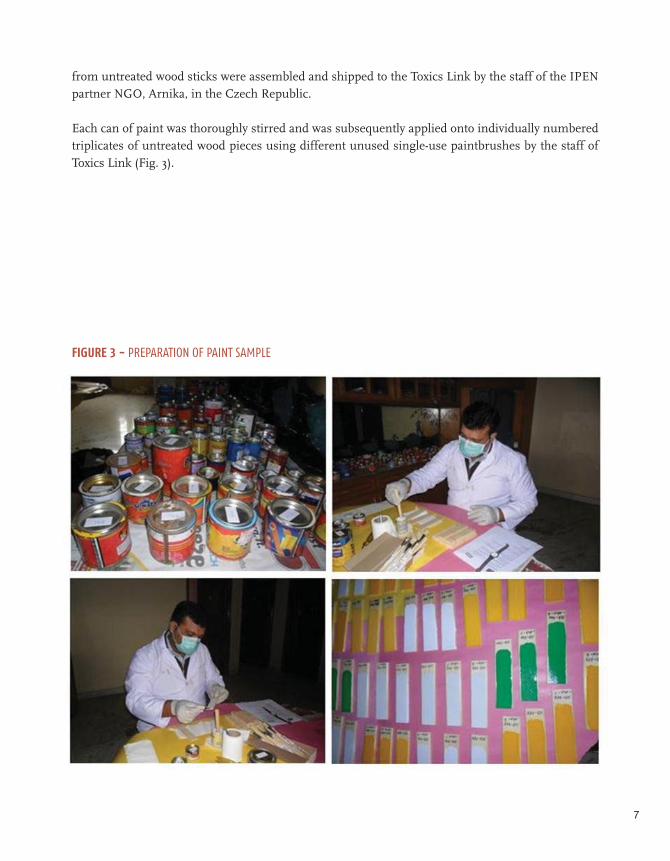
During the paint sample preparation, information such as color, brand, country where manufactured, purchase details, date manufactured as provided on the label of the paint can was recorded. The formats used for date of manufacturer varied with some companies providing day, month and year and others providing only month and year. In addition, some paint companies used only a single word to describe some colors, such as “red,” while others used “bright red.” Colors were recorded as provided on the can. For the red and yellow paints the protocol called for obtaining “bright” or “strong” red and yellow paints when available. Dates of purchase were recorded in the day/ month/year format in most cases.
Paint sampling preparation kits containing individually numbered, untreated wood pieces, single-use paintbrushes and stirring utensils made
MATERIALS AND METHODS
2
FIGURE 2 - PAINT SAMPLING LOCATIONS
7
from untreated wood sticks were assembled and shipped to the Toxics Link by the staff of the IPEN partner NGO, Arnika, in the Czech Republic.
Each can of paint was thoroughly stirred and was subsequently applied onto individually numbered triplicates of untreated wood pieces using different unused single-use paintbrushes by the staff of Toxics Link (Fig. 3).
FIGURE 3 - PREPARATION OF PAINT SAMPLE
8
NATIONAL REPORT | LEAD IN ENAMEL HOUSEHOLD PAINTS IN INDIA IN 2015:
A total of 101 cans of new enamel decorative paints were purchased in Delhi-NCR, Maharashtra, West Bengal, Telangana, Andhra Pradesh and Gujarat in India and analyzed for their lead content. A majority of these paint samples, 70 out of 101, were produced by small and medium businesses and had been found to have high lead content in a 2013 analysis.
Because all paints analyzed in the 2013 study produced by major paint brands (representing 65% of the market) contained lead levels below 90 ppm (see Table 8 in the appendix), the current study only analyzed those paints with lead levels above 90 ppm in order to determine whether small and medium sized paint business also had begun to reduce lead levels in their paints. In addition, 31 new samples, never previously analyzed, also were added to the current study. Results are given in parts per million (ppm) lead, based on dry weight of the paint. Please see Appendix A for full analysis results.
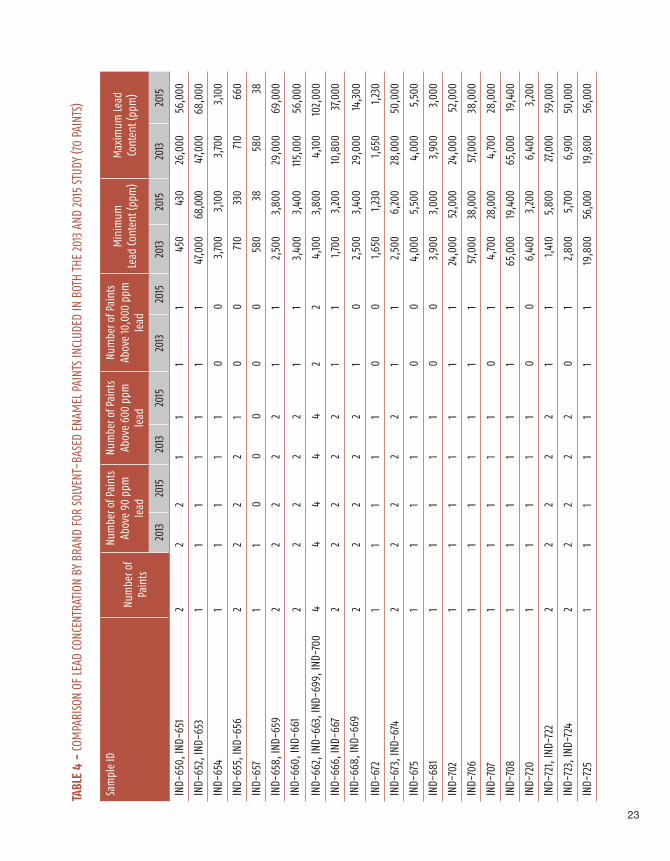
In general, there was very little, if any change in lead levels in analyzed paint samples between 2013 and 2015. A total of 70 paints from 44 brands that contained high lead levels in 2013 were re-analyzed for this study. Detailed results comparing results of the 70 paints analyzed in both 2013 and 2015 are presented in Table 4. Please see Appendix A for full analysis results.
Lead concentrations did not decrease in the paint samples with high lead levels in 2013
• The average concentration of the 70 paint samples in 2015 was 30,000 ppm compared to 20,300 ppm in 2013.
• Thirty-two paints had very high lead concentrations above 10,000 ppm in 2015; compared with 31 paints in 2013
• Only 3 paints had reduced lead levels in 2015 to less than 90 ppm and could qualify for sale on the international market
RESULTS
3
9
The number of paint brands producing high lead paint increased between 2013 and 2015
• One or more paint from 29 of the 44 brands (66% of the brands) contained dangerously high lead levels above 10,000 ppm in 2015 compared to 27 brands (61% of the brands) in 2013
• Only 3 paints from 3 brands were found to have reduced lead at levels less than 90 ppm between 2013 and 2015.
All paint colors, including white, continue to have high lead levels
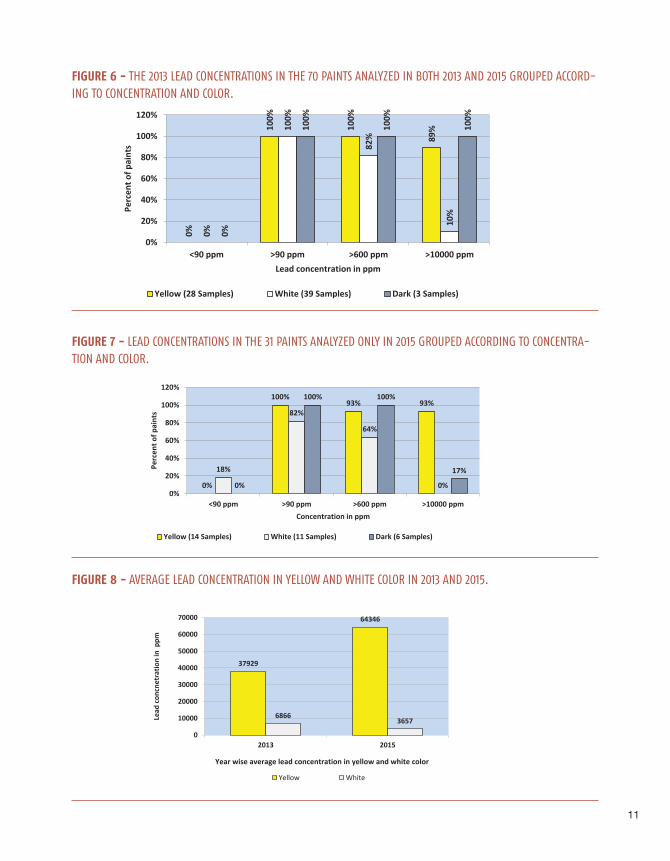
• Lead concentrations above 90 ppm were found in all 28 yellow paints (100%); the same result as in 2013 study.
• A total 36 out of 39 white paints (92%) contained lead levels above 90 ppm, compared to 39 (100%) of the paints in 2013.
• All 3 dark colored paints (mint green and ox blue) had lead levels above 90 ppm in both 2015 and 2013 study. (Fig. 5 and 6)
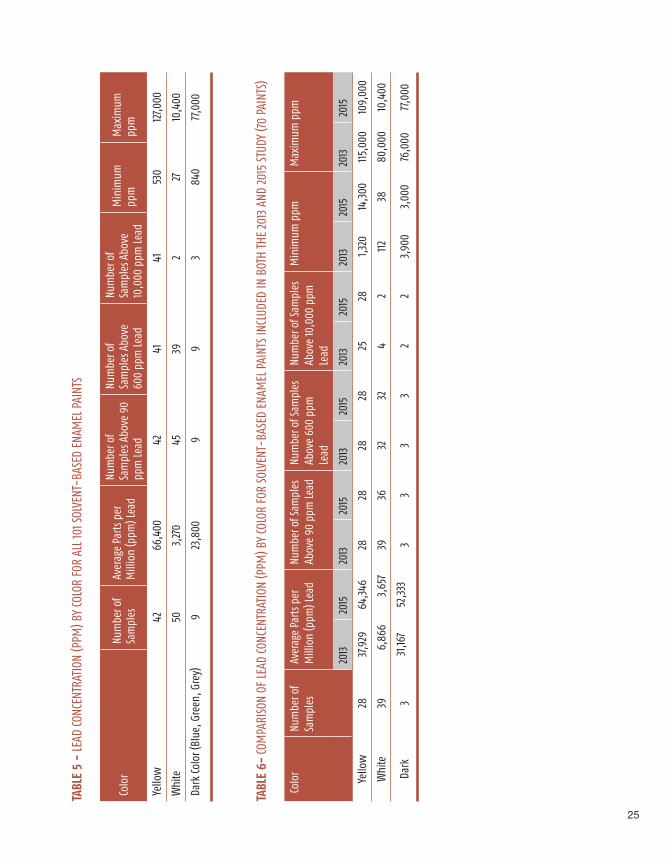
• The average lead concentration in yellow color paints has increased in 2015 which indicates the use of lead containing raw materials and in white color paints lead concentration has decreased in 2015 indicating use of lead free drier(Fig. 8)
Overall, small and medium size paint producers are producing paint with high lead content in 2015
• Out of the 101 paints representing 64 brands analyzed in 2015, 46 paints from 41 brands (64% of the brands) contain dangerously high lead level above 10,000 ppm. Only 5 paints from 5 brands produced by SMEs were found to contain lead levels less than 90 ppm.
• The majority of paints from all collected colors contain lead concentrations above 90 ppm (Fig. 4, Table 5). Lead concentrations above 90 ppm were found in all 42 yellow paints (100%), 45 out 50 white paints (90%), all 9 dark color paints (blue, green, smoke grey) (100%). (Table5)
• No manufacturers provided information and or statements about lead on their product labels.
Previously unanalyzed paint samples also have high lead content. Thirty-one paints not previously analyzed were included in the current study.
• Very high lead concentrations above 10,000 ppm were found in 14 of the 31 paints analyzed (45% of the paints); 26 of the paints contained lead levels above 600 ppm (84% of the paints) and 29 of the paints contained concentrations above 90 ppm (94% of the paints). Only 2 of the 31 paints would qualify for sale on the international market.
10
NATIONAL REPORT | LEAD IN ENAMEL HOUSEHOLD PAINTS IN INDIA IN 2015:
• A total 14 paints from 13 brands contained dangerously high lead levels above 10,000 ppm Only 2 paints of 2 brands produced by SMEs were found to contain lead at levels less than 90 ppm.
• Lead concentrations above 90 ppm were found in all 14 yellow paints (100%), 9 out of 11 white paints (82%), all 6 dark colors (blue, phiroza, green and smoke grey). Only 2 out of 11 white paints were observed to have lead level less than 90 ppm. (Fig. 7)
FIGURE 4 - LEAD CONCENTRATIONS IN ALL ANALYZED PAINTS IN 2015 GROUPED ACCORDING TO CONCENTRATION AND COLOR.
FIGURE 5 - THE 2015 LEAD CONCENTRATIONS IN THE 70 PAINTS ANALYZED IN BOTH 2013 AND 2015 GROUPED ACCORDING TO CONCENTRATION AND COLOR.
0%
100% 98% 98%
10%
90%78%
4%0%
100% 100%
33%
0%
20%
40%
60%
80%
100%
120%
<90 ppm >90 ppm >600 ppm >10000 ppm
Perc
ent o
f pai
nts
Lead concentration in ppm
Yellow (42 Samples) White (50 Samples) Dark (9 Samples)
0%
100% 100% 100%
8%
92%82%
5%0%
100% 100% 100%
0%
20%
40%
60%
80%
100%
<90 ppm >90 ppm >600 ppm >10000 ppm
Perc
ent o
f pai
nts
Lead concentration in ppm
Yellow (28 Samples) White (39 Samples) Dark (3 Samples)
11
FIGURE 6 - THE 2013 LEAD CONCENTRATIONS IN THE 70 PAINTS ANALYZED IN BOTH 2013 AND 2015 GROUPED ACCORD-ING TO CONCENTRATION AND COLOR.
FIGURE 7 - LEAD CONCENTRATIONS IN THE 31 PAINTS ANALYZED ONLY IN 2015 GROUPED ACCORDING TO CONCENTRA-TION AND COLOR.
FIGURE 8 - AVERAGE LEAD CONCENTRATION IN YELLOW AND WHITE COLOR IN 2013 AND 2015.
0%
100%
100%
89%
0%
100%
82%
10%
0%
100%
100%
100%
0%
20%
40%
60%
80%
100%
120%
<90 ppm >90 ppm >600 ppm >10000 ppm
Perc
ent o
f pai
nts
Lead concentration in ppm
Yellow (28 Samples) White (39 Samples) Dark (3 Samples)
0%
100%93% 93%
18%
82%
64%
0%0%
100% 100%
17%
0%
20%
40%
60%
80%
100%
120%
<90 ppm >90 ppm >600 ppm >10000 ppm
Perc
ent o
f pai
nts
Concentration in ppm
Yellow (14 Samples) White (11 Samples) Dark (6 Samples)
37929
64346
68663657
0
10000
20000
30000
40000
50000
60000
70000
2013 2015
Lead
con
cnet
ratio
n in
ppm
Year wise average lead concentration in yellow and white color
Yellow White
12
NATIONAL REPORT | LEAD IN ENAMEL HOUSEHOLD PAINTS IN INDIA IN 2015:
Since Toxics Link began studying the lead content of paints sold in India in 2007, most paint brands with the largest market share reduced lead in most paints sold to less than 90 ppm. Brands representing 60-70 percent of total market share now sell paint that would meet the most stringent regulation anywhere in the world. This demonstrates that paint with low lead content can be produced cost-effectively in India, and that companies are willing and able to make the shift.
Additionally, since Toxics Link began investigating lead in decorative paint and advocating for lead paint standards, government agencies revised India’s voluntary paint standard downward from 1000 ppm to 90 ppm. These actions demonstrate that government offi cials have become aware of the danger lead paint poses to young children and the nation’s economy and are willing to prevent childhood lead exposure.
Nevertheless, though advocacy by Toxics Link also has raised awareness of the hazard of lead paint among consumers, it remains virtually impossible for consumers to identify which paints contain unacceptable levels of lead, since most companies don’t provide information on their labels and those that do can’t be independently verifi ed.
Additionally, paint with high lead levels continue to be sold by small and medium-sized manufacturers representing less than 30% of the paint market. These producers often face special barriers in shifting to low lead products and may require additional technical information, better access to suppliers of non-leaded paint ingredients and other types of help in re-formulating their products. All lead-containing paints that were applied to surfaces in the past decades continue to represent a hazard when the surfaces where they were applied deteriorate or are scraped or sanded prior to the application of new paints.
DISCUSSION & CONCLUSIONS
4
13
Government
• Government should establish a national mandatory regulatory framework to control the manufacture, import, export, sale, and use of lead paints and products coated with lead paint immediately
• In the design of the mandatory regulatory framework, consideration should be given to the inclusion of provisions for compliance, monitoring, and enforcement
• Special attention should be given to the elimination of lead decorative paints and lead paints for other applications most likely to contribute to childhood lead exposure
• Monitor in order to achieve stricter compliance with mandatory standards
• Ministry of Environment Forest and Climate Change need to take and appropriate action immediately
• Governments should provide information to the public to reduce health hazards from previously applied paints that contained lead.
Paint Industry
• Produce paints without using lead
• Become a part of third party certifi cation
• Include uniform logo on the product
• Mandatory labeling requirements including information about the hazard associated with disturbing surfaces coated with lead paint when preparing for repainting
• Post information about lead in paint in shops where paint is being sold
Public Awareness
• Purchase lead free paints from the market
• Be especially aware of paint contents when choosing the paint for children’s room
• Be aware of health hazards from lead dust that may be created when previously painted surfaces
are prepared for repainting.
RECOMMENDATIONS
5
14
NATIONAL REPORT | LEAD IN ENAMEL HOUSEHOLD PAINTS IN INDIA IN 2015:
TABLE 1 - DETAILS OF ALL 101 SOLVENT-BASED, ENAMEL PAINTS ANALYZED IN 2015
SampleID
Color of Paint Paint Can Size
Price of Paint in INR
Date Manufactured Date of Purchase
Is there website on Label?
IND-650 G. Yellow 1 L Rs. 168 Sept 14 B. No.-010714 16/12/2014 No
IND-651 White 500ml Rs.85 B. No.-121023-Mar 14 16/12/2014 No
IND-652 Yellow 500ml Rs.85 B No.-150914-October 13 16/12/2014 No
IND-653 White 500ml Rs.85 011410 November 14 16/12/2014 No
IND-654 Snow White 1L Rs.185 B No.-0112-September 2014 16/12/2014 No
IND-655 White 100ml Rs.30 May-13 16/12/2014 No
IND-656 White 200ml Rs.40 September 16/12/2014 No
IND-657 White 1L Rs.180 April-2014-B.No.-007 16/12/2014 No
IND-658 White 100 ml Rs.36 Mar-14 27/10/2014 No
IND-659 Yellow 100 ml Rs.36 Mar-14 27/10/2014 No
IND-660 G. Yellow 50 ml Rs.22 Sep-13 28/10/2014 No
IND-661 White 50 ml Rs.22 Sep-13 28/10/2014 No
IND-662 G. Yellow 500 ml Rs.50 May-12 29/10/2014 No
IND-663 White 200 ml Rs.50 Oct-14 29/10/2014 No
IND-666 White 200ml Rs.65 Mar-14 29/11/2014 No
IND-667 G. Yellow 200ml Rs.58 Sep-12 29/11/2014 No
IND-668 G. Yellow 100 ml Rs.35.7 Not Available 29/11/2014 No
IND-669 White 100 ml Not Available Not Available 29/11/2014 No
IND-670 Bus Green 200 ml Rs.56 Not Available 29/11/2014 No
IND-671 G. Yellow 200ml Rs.56 Jun-13 29/11/2014 No
IND-672 White 50ml Rs.15 Not Available 29/11/2014 No
IND-673 G. Yellow 200ml No Information No Information 14/11/2014 No
IND-674 White 200ml No Information No Information 14/11/2014 No
IND-675 White 500ml Rs.138 Jun-14 14/11/2014 No
APPENDIXA
15
SampleID
Color of Paint Paint Can Size
Price of Paint in INR
Date Manufactured Date of Purchase
Is there website on Label?
IND-676 G. Yellow 500ml Rs.90 Sep-13 14/11/2014 No
IND-677 Smoke Grey 200ml Rs.43 Mar-13 14/11/2014 No
IND-678 White 200ml Rs.51 Jun-14 14/11/2014 No
IND-679 White 200ml Rs.40 Not Mentioned 14/11/2014 No
IND-680 Yellow 200ml Rs.80 Sep-14 14/11/2014 No
IND-681 Ox Blue 50ml Rs.20 Not Available 14/11/2014 No
IND-684 G. Yellow 200ml Rs.77 B. No. B7508-Pkd. 09/2014 14/11/2014 No
IND-699 G. Yellow 500 ml Rs.50 May-12 29/10/2014 No
IND-700 White 200 ml Rs.50 Oct-14 29/10/2014 No
IND-701 White 200ml Rs.73 Dec-14 20/01/2015 No
IND-702 G. Yellow 200ml Rs.70 Jul-14 20/01/2015 No
IND-703 Blue 50ml Not Mentioned Not Mentioned 28/10/2014 Yes
IND-704 White 100ml Rs.34 AWH054 28/10/2014 No
IND-705 Yellow 50ml Rs.17 01/2014-01-08-2013 28/10/2014 No
IND-706 G. Yellow 100ml, Rs.42 Not Properly Seen 20/01/2015 No
IND-707 Pale Yellow 100ml, Rs.30 Not Properly Seen 20/01/2015 No
IND-708 G. Yellow 200ml Rs.75 Aug-14 20/01/2015 No
IND-709 G. Yellow 500ml Rs.80 B. No. 007/ 01-10-2013 20/01/2015 No
IND-710 G. Yellow 200ml Rs.60 B. No. 008/April 2013 20/01/2015 No
IND-711 Ul White 50ml Rs.20.25 SP-50-Pkd on :Jan 14 20/01/2015 No
IND-712 G. Yellow 50ml Not clear Not clear 20/01/2015 No
IND-713 Yellow 200ml Rs.55 Apr-13 20/01/2015 No
IND-714 White 200ml Rs.55 Apr-13 20/01/2015 No
IND-715 G. Yellow 200ml Rs.59 Oct 2014-Lot no. NJ124 20/01/2015 No
IND-716 White 200ml Rs.63 Oct 2014-Lot no. NJ94 20/01/2015 No
IND-717 G. Yellow 100ml Not Clear Not Clear 20/01/2015 No
IND-718 White 100ml Not Clear Not Clear 20/01/2015 No
IND-719 Blue 50ml Not Mentioned Not Mentioned 28/10/2014 Yes
IND-720 White 50 ml Rs. 24 2014 28/10/2014 No
IND-721 Yellow 50 ml Rs. 26 Feb-14 28/10/2014 No
IND-722 White 50 ml Rs. 26 Apr-14 29/10/2014 No
IND-723 Yellow 100 ml Rs. 30 13-Dec-11 29/10/2014 No
IND-724 White 100 ml Rs. 34 01-Jun-12 31/10/2014 No
IND-725 Yellow 50 mlRs 20 (as per retailer)
Not clear31/10/2014
No
16
NATIONAL REPORT | LEAD IN ENAMEL HOUSEHOLD PAINTS IN INDIA IN 2015:
SampleID
Color of Paint Paint Can Size
Price of Paint in INR
Date Manufactured Date of Purchase
Is there website on Label?
IND-727 Yellow 50 ml Rs. 13 Aug-14 4/11/2014 No
IND-728 White 50 ml Rs. 27 Jul-13 4/11/2014 No
IND-729 White 100 ml Rs. 30 04-Mar 7/11/2014 No
IND-730 Pale Cream 50 ml Rs. 19 29-06-13 7/11/2014 No
IND-731 White 50 ml Rs. 20 09-08-14 14/11/2014 No
IND-732 Yellow 50 ml Rs.20 Not clear 14/11/2014 No
IND-733 White 50 ml Rs.25 Jul-14 14/11/2014 No
IND-734 Yellow 50 ml Rs. 35 Aug-14 14/11/2014 No
IND-735 White 50 ml Rs. 35 Aug-14 14/11/2014 No
IND-736 Yellow 50 ml Rs.35 Aug-14 14/11/2014 No
IND-737 White 50 ml Rs. 35 Aug-14 18/11/2014 No
IND-738 White 100ml NA Not clear 18/11/2014 No
IND-739 Yellow 50 ml NA Not clear 18/11/2014 No
IND-740 White 500 ml Rs.110 May-14 31/12/2014 No
IND-741 G. Yellow 200 ml Rs.60 Mar. 2012 31/12/2014 No
IND-742 White 200 ml Rs.60 Aug. 2013 31/12/2014 No
IND-743 White 200 ml Rs.60 Jan. 2014 31/12/2014 No
IND-744 Yellow 200 ml Rs.60 May. 2014 31/12/2014 No
IND-745 Yellow 200 ml Rs.50 Aug. 2014 31/12/2014 No
IND-746 White 200 ml Rs.50 Sep. 2014 31/12/2014 No
IND-747 White 200 ml Rs.65 Oct. 2013 31/12/2014 No
IND-748 White 200 ml Rs.40 Nov. 2012 31/12/2014 No
IND-749 White 200 ml Rs.40 Oct. 2014 31/12/2014 No
IND-750 Sky Blue 200 ml Rs.40 Sep. 2014 31/12/2014 No
IND-751 Phiroja 200 ml Rs.70 Oct. 2012 31/12/2014 No
IND-752 Yellow 200 ml Rs.70 July. 2014 31/12/2014 No
IND-753 White 100ml, Rs.44 Nov-14 20/01/2015 No
IND-756 White 50ml, Rs.22.5 Mar-14 20/01/2015 No
IND-757 Yellow 50ml, Rs.22.5 Nov-14 21/01/2015 No
IND-760 Mint Green 50ml, Rs.26.5 Jun-14 21/01/2015 No
IND-761 Br. White 50ml, Rs.24.5 Oct-14 21/01/2015 No
IND-762 Mint Green 50ml Rs.35 Mar-14 21/01/2015 No
IND-763 White 50ml Rs.35 Aug-14 21/01/2015 No
17
SampleID
Color of Paint Paint Can Size
Price of Paint in INR
Date Manufactured Date of Purchase
Is there website on Label?
IND-764 White 50ml, Rs.22 Jul-14 21/01/2015 No
IND-765 Yellow 50ml, Rs.20 Apr-14 21/01/2015 No
IND-766 Yellow 50ml, Rs.22.5 Jan-14 22/01/2015 No
IND-767 White 200ml, Rs.75 Mar-14 22/01/2015 No
IND-768 Yellow 200ml, Rs.75 Aug-14 22/01/2015 No
IND-771 G. Yellow 100ml, Rs.21 Aug-14 22/01/2015 No
IND-772 White 100ml Rs.22 Dec-14 22/01/2015 No
IND-773 G. Yellow 50ml, Rs.21 Aug-12 22/01/2015 No
IND-774 White 50ml Rs.25 20-Oct-14 23/01/2015 No
IND-776 White 200ml, Rs.70 Jun-14 23/01/2015 No
18
NATIONAL REPORT | LEAD IN ENAMEL HOUSEHOLD PAINTS IN INDIA IN 2015:
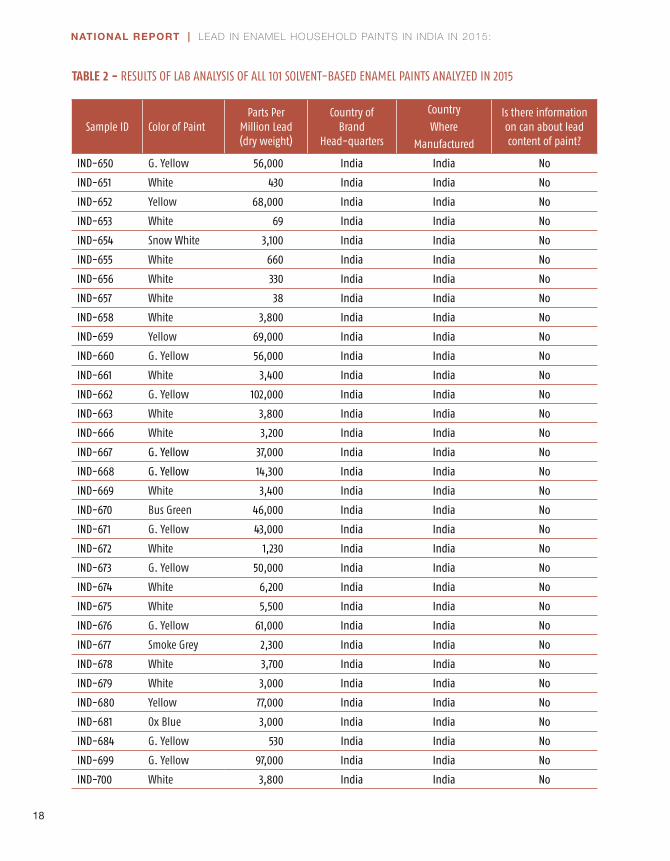
TABLE 2 - RESULTS OF LAB ANALYSIS OF ALL 101 SOLVENT-BASED ENAMEL PAINTS ANALYZED IN 2015
Sample ID Color of PaintParts Per
Million Lead(dry weight)
Country ofBrand
Head-quarters
Country
Where
Manufactured
Is there information on can about lead content of paint?
IND-650 G. Yellow 56,000 India India No
IND-651 White 430 India India No
IND-652 Yellow 68,000 India India No
IND-653 White 69 India India No
IND-654 Snow White 3,100 India India No
IND-655 White 660 India India No
IND-656 White 330 India India No
IND-657 White 38 India India No
IND-658 White 3,800 India India No
IND-659 Yellow 69,000 India India No
IND-660 G. Yellow 56,000 India India No
IND-661 White 3,400 India India No
IND-662 G. Yellow 102,000 India India No
IND-663 White 3,800 India India No
IND-666 White 3,200 India India No
IND-667 G. Yellow 37,000 India India No
IND-668 G. Yellow 14,300 India India No
IND-669 White 3,400 India India No
IND-670 Bus Green 46,000 India India No
IND-671 G. Yellow 43,000 India India No
IND-672 White 1,230 India India No
IND-673 G. Yellow 50,000 India India No
IND-674 White 6,200 India India No
IND-675 White 5,500 India India No
IND-676 G. Yellow 61,000 India India No
IND-677 Smoke Grey 2,300 India India No
IND-678 White 3,700 India India No
IND-679 White 3,000 India India No
IND-680 Yellow 77,000 India India No
IND-681 Ox Blue 3,000 India India No
IND-684 G. Yellow 530 India India No
IND-699 G. Yellow 97,000 India India No
IND-700 White 3,800 India India No
19
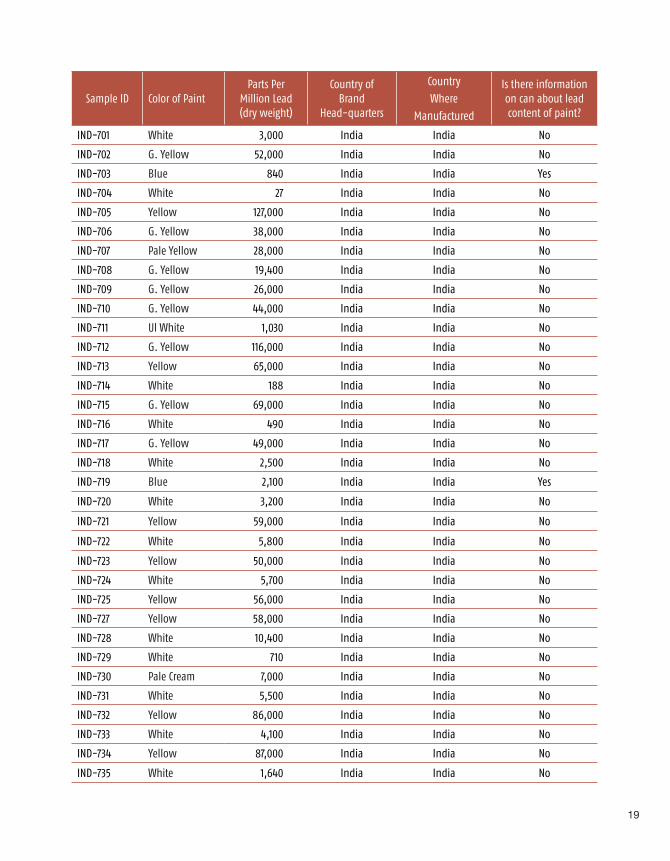
Sample ID Color of PaintParts Per
Million Lead(dry weight)
Country ofBrand
Head-quarters
Country
Where
Manufactured
Is there information on can about lead content of paint?
IND-701 White 3,000 India India No
IND-702 G. Yellow 52,000 India India No
IND-703 Blue 840 India India Yes
IND-704 White 27 India India No
IND-705 Yellow 127,000 India India No
IND-706 G. Yellow 38,000 India India No
IND-707 Pale Yellow 28,000 India India No
IND-708 G. Yellow 19,400 India India No
IND-709 G. Yellow 26,000 India India No
IND-710 G. Yellow 44,000 India India No
IND-711 Ul White 1,030 India India No
IND-712 G. Yellow 116,000 India India No
IND-713 Yellow 65,000 India India No
IND-714 White 188 India India No
IND-715 G. Yellow 69,000 India India No
IND-716 White 490 India India No
IND-717 G. Yellow 49,000 India India No
IND-718 White 2,500 India India No
IND-719 Blue 2,100 India India Yes
IND-720 White 3,200 India India No
IND-721 Yellow 59,000 India India No
IND-722 White 5,800 India India No
IND-723 Yellow 50,000 India India No
IND-724 White 5,700 India India No
IND-725 Yellow 56,000 India India No
IND-727 Yellow 58,000 India India No
IND-728 White 10,400 India India No
IND-729 White 710 India India No
IND-730 Pale Cream 7,000 India India No
IND-731 White 5,500 India India No
IND-732 Yellow 86,000 India India No
IND-733 White 4,100 India India No
IND-734 Yellow 87,000 India India No
IND-735 White 1,640 India India No
20
NATIONAL REPORT | LEAD IN ENAMEL HOUSEHOLD PAINTS IN INDIA IN 2015:
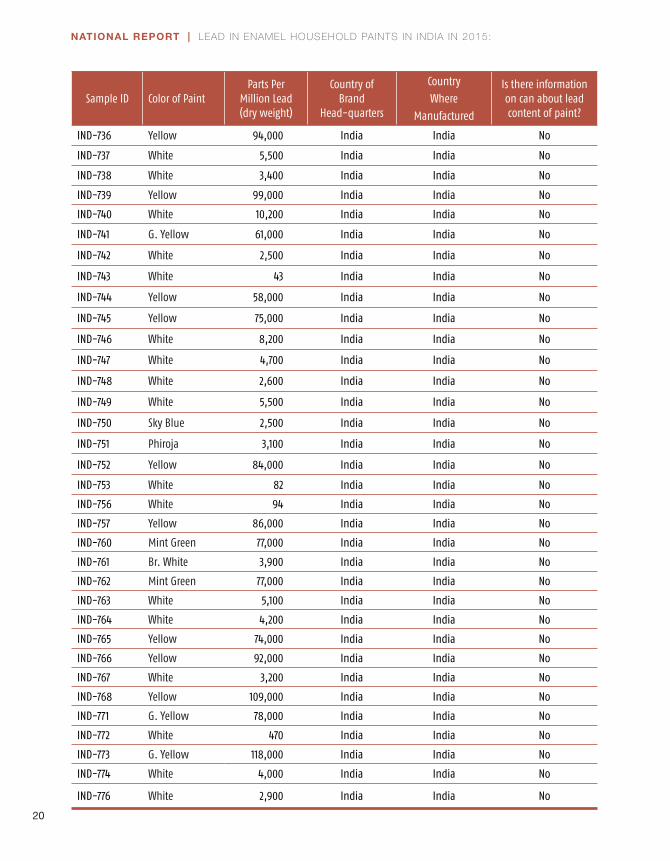
Sample ID Color of PaintParts Per
Million Lead(dry weight)
Country ofBrand
Head-quarters
Country
Where
Manufactured
Is there information on can about lead content of paint?
IND-736 Yellow 94,000 India India No
IND-737 White 5,500 India India No
IND-738 White 3,400 India India No
IND-739 Yellow 99,000 India India No
IND-740 White 10,200 India India No
IND-741 G. Yellow 61,000 India India No
IND-742 White 2,500 India India No
IND-743 White 43 India India No
IND-744 Yellow 58,000 India India No
IND-745 Yellow 75,000 India India No
IND-746 White 8,200 India India No
IND-747 White 4,700 India India No
IND-748 White 2,600 India India No
IND-749 White 5,500 India India No
IND-750 Sky Blue 2,500 India India No
IND-751 Phiroja 3,100 India India No
IND-752 Yellow 84,000 India India No
IND-753 White 82 India India No
IND-756 White 94 India India No
IND-757 Yellow 86,000 India India No
IND-760 Mint Green 77,000 India India No
IND-761 Br. White 3,900 India India No
IND-762 Mint Green 77,000 India India No
IND-763 White 5,100 India India No
IND-764 White 4,200 India India No
IND-765 Yellow 74,000 India India No
IND-766 Yellow 92,000 India India No
IND-767 White 3,200 India India No
IND-768 Yellow 109,000 India India No
IND-771 G. Yellow 78,000 India India No
IND-772 White 470 India India No
IND-773 G. Yellow 118,000 India India No
IND-774 White 4,000 India India No
IND-776 White 2,900 India India No
21
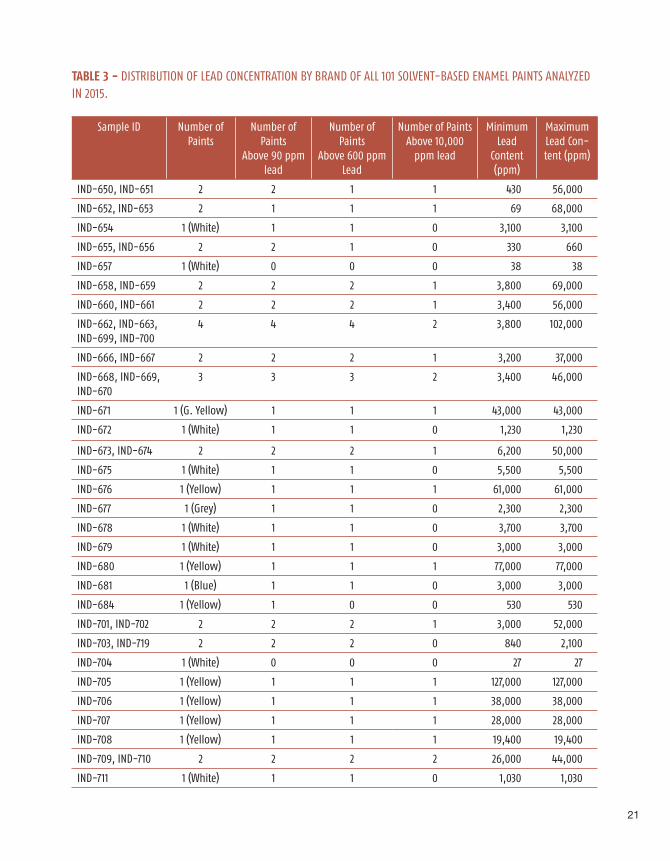
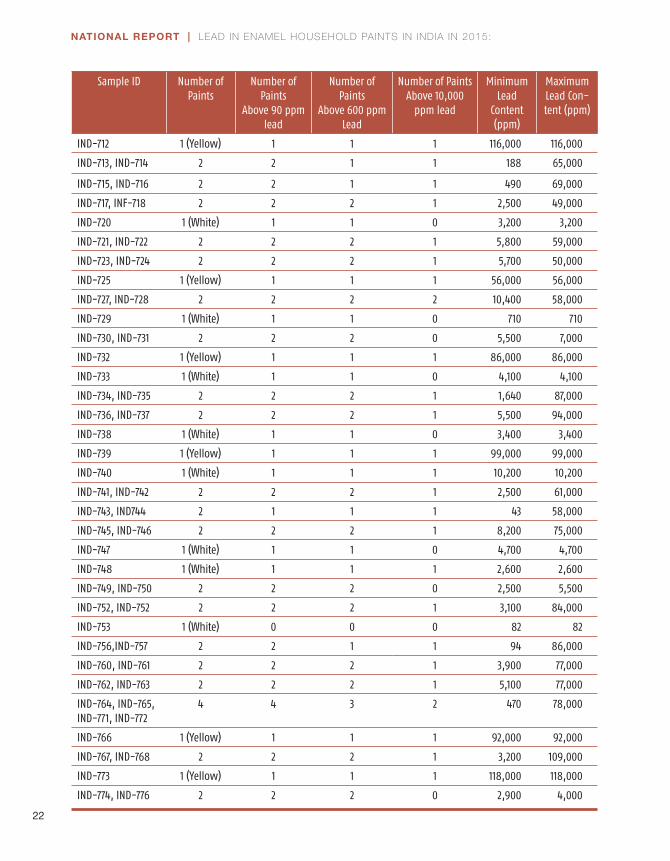
TABLE 3 - DISTRIBUTION OF LEAD CONCENTRATION BY BRAND OF ALL 101 SOLVENT-BASED ENAMEL PAINTS ANALYZED IN 2015.
Sample ID Number of Paints
Number of Paints
Above 90 ppmlead
Number of Paints
Above 600 ppmLead
Number of PaintsAbove 10,000
ppm lead
MinimumLead
Content (ppm)
Maximum Lead Con-tent (ppm)
IND-650, IND-651 2 2 1 1 430 56,000
IND-652, IND-653 2 1 1 1 69 68,000
IND-654 1 (White) 1 1 0 3,100 3,100
IND-655, IND-656 2 2 1 0 330 660
IND-657 1 (White) 0 0 0 38 38
IND-658, IND-659 2 2 2 1 3,800 69,000
IND-660, IND-661 2 2 2 1 3,400 56,000
IND-662, IND-663, IND-699, IND-700
4 4 4 2 3,800 102,000
IND-666, IND-667 2 2 2 1 3,200 37,000
IND-668, IND-669, IND-670
3 3 3 2 3,400 46,000
IND-671 1 (G. Yellow) 1 1 1 43,000 43,000
IND-672 1 (White) 1 1 0 1,230 1,230
IND-673, IND-674 2 2 2 1 6,200 50,000
IND-675 1 (White) 1 1 0 5,500 5,500
IND-676 1 (Yellow) 1 1 1 61,000 61,000
IND-677 1 (Grey) 1 1 0 2,300 2,300
IND-678 1 (White) 1 1 0 3,700 3,700
IND-679 1 (White) 1 1 0 3,000 3,000
IND-680 1 (Yellow) 1 1 1 77,000 77,000
IND-681 1 (Blue) 1 1 0 3,000 3,000
IND-684 1 (Yellow) 1 0 0 530 530
IND-701, IND-702 2 2 2 1 3,000 52,000
IND-703, IND-719 2 2 2 0 840 2,100
IND-704 1 (White) 0 0 0 27 27
IND-705 1 (Yellow) 1 1 1 127,000 127,000
IND-706 1 (Yellow) 1 1 1 38,000 38,000
IND-707 1 (Yellow) 1 1 1 28,000 28,000
IND-708 1 (Yellow) 1 1 1 19,400 19,400
IND-709, IND-710 2 2 2 2 26,000 44,000
IND-711 1 (White) 1 1 0 1,030 1,030
22
NATIONAL REPORT | LEAD IN ENAMEL HOUSEHOLD PAINTS IN INDIA IN 2015:
Sample ID Number of Paints
Number of Paints
Above 90 ppmlead
Number of Paints
Above 600 ppmLead
Number of PaintsAbove 10,000
ppm lead
MinimumLead
Content (ppm)
Maximum Lead Con-tent (ppm)
IND-712 1 (Yellow) 1 1 1 116,000 116,000
IND-713, IND-714 2 2 1 1 188 65,000
IND-715, IND-716 2 2 1 1 490 69,000
IND-717, INF-718 2 2 2 1 2,500 49,000
IND-720 1 (White) 1 1 0 3,200 3,200
IND-721, IND-722 2 2 2 1 5,800 59,000
IND-723, IND-724 2 2 2 1 5,700 50,000
IND-725 1 (Yellow) 1 1 1 56,000 56,000
IND-727, IND-728 2 2 2 2 10,400 58,000
IND-729 1 (White) 1 1 0 710 710
IND-730, IND-731 2 2 2 0 5,500 7,000
IND-732 1 (Yellow) 1 1 1 86,000 86,000
IND-733 1 (White) 1 1 0 4,100 4,100
IND-734, IND-735 2 2 2 1 1,640 87,000
IND-736, IND-737 2 2 2 1 5,500 94,000
IND-738 1 (White) 1 1 0 3,400 3,400
IND-739 1 (Yellow) 1 1 1 99,000 99,000
IND-740 1 (White) 1 1 1 10,200 10,200
IND-741, IND-742 2 2 2 1 2,500 61,000
IND-743, IND744 2 1 1 1 43 58,000
IND-745, IND-746 2 2 2 1 8,200 75,000
IND-747 1 (White) 1 1 0 4,700 4,700
IND-748 1 (White) 1 1 1 2,600 2,600
IND-749, IND-750 2 2 2 0 2,500 5,500
IND-752, IND-752 2 2 2 1 3,100 84,000
IND-753 1 (White) 0 0 0 82 82
IND-756,IND-757 2 2 1 1 94 86,000
IND-760, IND-761 2 2 2 1 3,900 77,000
IND-762, IND-763 2 2 2 1 5,100 77,000
IND-764, IND-765, IND-771, IND-772
4 4 3 2 470 78,000
IND-766 1 (Yellow) 1 1 1 92,000 92,000
IND-767, IND-768 2 2 2 1 3,200 109,000
IND-773 1 (Yellow) 1 1 1 118,000 118,000
IND-774, IND-776 2 2 2 0 2,900 4,000
23
TABLE
4 -
COM
PARI
SON
OF LE
AD C
ONCE
NTRA
TION
BY
BRAN
D FO
R SO
LVEN
T-BA
SED
ENAM
EL P
AINT
S IN
CLUD
ED IN
BOT
H TH
E 20
13 A
ND 2
015
STUD
Y (7
0 PA
INTS
)
Sam
ple
ID
Num
ber o
fPa
ints
Num
ber o
f Pai
nts
Abov
e 90
ppm
lead
Num
ber o
f Pai
nts
Abov
e 60
0 pp
mle
ad
Num
ber o
f Pai
nts
Abov
e 10
,000
ppm
le
ad
Min
imum
Lead
Con
tent
(ppm
)M
axim
um Le
ad
Cont
ent (
ppm
)
2013
2015
2013
2015
2013
2015
2013
2015
2013
2015
IND-
650,
IND-
651
22
21
11
145
043
026
,000
56,0
00
IND-
652,
IND-
653
11
11
11
147
,000
68,0
0047
,000
68,0
00
IND-
654
11
11
10
03,
700
3,10
03,
700
3,10
0
IND-
655,
IND-
656
22
22
10
071
033
071
066
0
IND-
657
11
00
00
058
038
580
38
IND-
658,
IND-
659
22
22
21
12,
500
3,80
029
,000
69,0
00
IND-
660,
IND-
661
22
22
21
13,
400
3,40
011
5,00
056
,000
IND-
662,
IND-
663,
IND-
699,
IND-
700
44
44
42
24,
100
3,80
04,
100
102,
000
IND-
666,
IND-
667
22
22
21
11,7
003,
200
10,8
0037
,000
IND-
668,
IND-
669
22
22
21
02,
500
3,40
029
,000
14,3
00
IND-
672
11
11
10
01,6
501,2
301,6
501,2
30
IND-
673,
IND-
674
22
22
21
12,
500
6,20
028
,000
50,0
00
IND-
675
11
11
10
04,
000
5,50
04,
000
5,50
0
IND-
681
11
11
10
03,
900
3,00
03,
900
3,00
0
IND-
702
11
11
11
124
,000
52,0
0024
,000
52,0
00
IND-
706
11
11
11
157
,000
38,0
0057
,000
38,0
00
IND-
707
11
11
10
14,
700
28,0
004,
700
28,0
00
IND-
708
11
11
11
165
,000
19,4
0065
,000
19,4
00
IND-
720
11
11
10
06,
400
3,20
06,
400
3,20
0
IND-
721,
IND-
722
22
22
21
11,4
105,
800
27,0
0059
,000
IND-
723,
IND-
724
22
22
20
12,
800
5,70
06,
900
50,0
00
IND-
725
11
11
11
119
,800
56,0
0019
,800
56,0
00
24
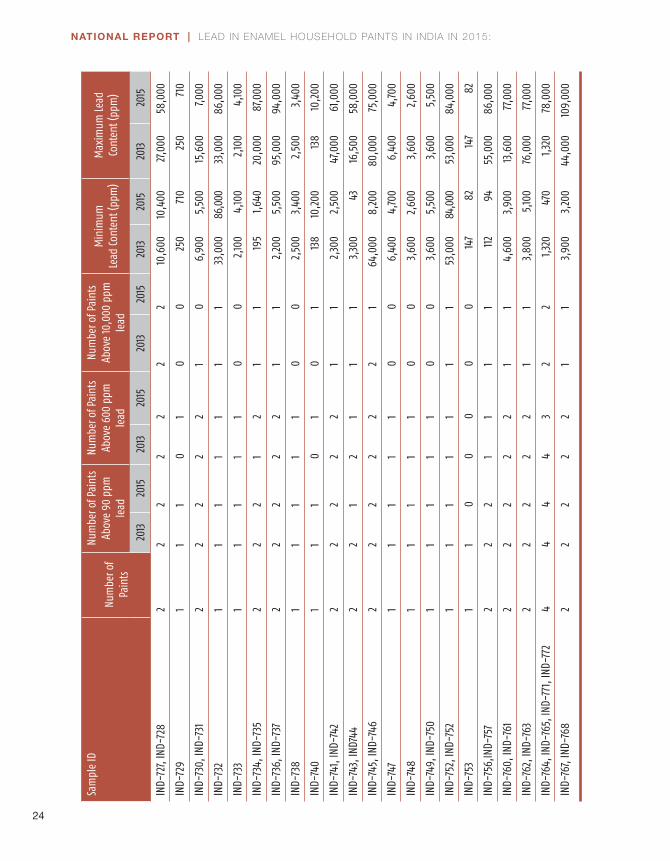
NATIONAL REPORT | LEAD IN ENAMEL HOUSEHOLD PAINTS IN INDIA IN 2015:
Sam
ple
ID
Num
ber o
fPa
ints
Num
ber o
f Pai
nts
Abov
e 90
ppm
lead
Num
ber o
f Pai
nts
Abov
e 60
0 pp
mle
ad
Num
ber o
f Pai
nts
Abov
e 10
,000
ppm
le
ad
Min
imum
Lead
Con
tent
(ppm
)M
axim
um Le
ad
Cont
ent (
ppm
)
2013
2015
2013
2015
2013
2015
2013
2015
2013
2015
IND-
727,
IND-
728
22
22
22
210
,600
10,4
0027
,000
58,0
00
IND-
729
11
10
10
025
071
025
071
0
IND-
730,
IND-
731
22
22
21
06,
900
5,50
015
,600
7,000
IND-
732
11
11
11
133
,000
86,0
0033
,000
86,0
00
IND-
733
11
11
10
02,
100
4,10
02,
100
4,10
0
IND-
734,
IND-
735
22
21
21
119
51,6
4020
,000
87,0
00
IND-
736,
IND-
737
22
22
21
12,
200
5,50
095
,000
94,0
00
IND-
738
11
11
10
02,
500
3,40
02,
500
3,40
0
IND-
740
11
10
10
113
810
,200
138
10,2
00
IND-
741,
IND-
742
22
22
21
12,
300
2,50
047
,000
61,0
00
IND-
743,
IND7
442
21
21
11
3,30
043
16,5
0058
,000
IND-
745,
IND-
746
22
22
22
164
,000
8,20
080
,000
75,0
00
IND-
747
11
11
10
06,
400
4,70
06,
400
4,70
0
IND-
748
11
11
10
03,
600
2,60
03,
600
2,60
0
IND-
749,
IND-
750
11
11
10
03,
600
5,50
03,
600
5,50
0
IND-
752,
IND-
752
11
11
11
153
,000
84,0
0053
,000
84,0
00
IND-
753
11
00
00
014
782
147
82
IND-
756,
IND-
757
22
21
11
1112
9455
,000
86,0
00
IND-
760,
IND-
761
22
22
21
14,
600
3,90
013
,600
77,0
00
IND-
762,
IND-
763
22
22
21
13,
800
5,10
076
,000
77,0
00
IND-
764,
IND-
765,
IND-
771,
IND-
772
44
44
32
21,3
2047
01,3
2078
,000
IND-
767,
IND-
768
22
22
21
13,
900
3,20
044
,000
109,
000
25
TABLE
5 -
LEAD
CON
CENT
RATI
ON (P
PM) B
Y CO
LOR
FOR
ALL 1
01 S
OLVE
NT-B
ASED
ENA
MEL
PAI
NTS
Colo
r Nu
mbe
r of
Sam
ples
Av
erag
e Pa
rts p
er
Mill
ion
(ppm
) Lea
d
Num
ber o
f Sa
mpl
es A
bove
90
ppm
Lead
Num
ber o
f Sa
mpl
es A
bove
60
0 pp
m Le
ad
Num
ber o
f Sa
mpl
es A
bove
10
,000
ppm
Lead
Min
imum
pp
m
Max
imum
pp
m
Yello
w42
66,4
0042
4141
530
127,0
00
Whi
te50
3,27
045
392
2710
,400
Dark
Col
or (B
lue,
Gre
en, G
rey)
923
,800
99
384
077
,000
TABLE
6-
COM
PARI
SON
OF LE
AD C
ONCE
NTRA
TION
(PPM
) BY
COLO
R FO
R SO
LVEN
T-BA
SED
ENAM
EL P
AINT
S IN
CLUD
ED IN
BOT
H TH
E 20
13 A
ND 2
015
STUD
Y (7
0 PA
INTS
)
Col
or
Num
ber o
f Sa
mpl
es
Aver
age
Part
s per
M
illio
n (p
pm) L
ead
Num
ber o
f Sam
ples
Ab
ove
90 p
pm Le
ad
Num
ber o
f Sam
ples
Ab
ove
600
ppm
Le
ad
Num
ber o
f Sam
ples
Ab
ove
10,0
00 p
pm
Lead
Min
imum
ppm
M
axim
um p
pm
2013
2015
2013
2015
2013
2015
2013
2015
2013
2015
2013
2015
Yello
w28
37,9
2964
,346
2828
2828
2528
1,320
14,3
0011
5,00
010
9,00
0
Whi
te39
6,86
63,
657
3936
3232
42
11238
80,0
0010
,400
Dark
331
,167
52,3
333
33
32
23,
900
3,00
076
,000
77,0
00
26
NATIONAL REPORT | LEAD IN ENAMEL HOUSEHOLD PAINTS IN INDIA IN 2015:
TABLE 7 - CONSUMER INFORMATION ABOUT LEAD ON PAINT CANS
Number of Samples
Lead content or other lead information on the label (yes/no)
Independent, third party certification of “lead safe” claims? (yes/no)
Information about lead hazard to children
(yes/no)
Information about lead
hazard when painting or remodeling
(yes/no)
Specific lan-guage about lead on label
IND-650, IND-651 2 No No No No No
IND-652, IND-653 2 No No No No No
IND-654 1 No No No No No
IND-655, IND-656 2 No No No No No
IND-657 1 No No No No No
IND-658, IND-659 2 No No No No No
IND-660, IND-661 2 No No No No No
IND-662, IND-663, IND-699, IND-700
4No No No No No
IND-666, IND-667 2 No No No No No
IND-668, IND-669, IND-670
3No No No No No
IND-671 1 No No No No No
IND-672 1 No No No No No
IND-673, IND-674 2 No No No No No
IND-675 1 No No No No No
IND-676 1 No No No No No
IND-677 1 No No No No No
IND-678 1 No No No No No
IND-679 1 No No No No No
IND-680 1 No No No No No
IND-681 1 No No No No No
IND-6841
Yes No added lead
No No No
IND-701, IND-702 2 No No No No No
IND-703, IND-7192
Yes No added lead
No No No
IND-704 1 No No No No No
IND-705 1 No No No No No
IND-706 1 No No No No No
27
Number of Samples
Lead content or other lead information on the label (yes/no)
Independent, third party certification of “lead safe” claims? (yes/no)
Information about lead hazard to children
(yes/no)
Information about lead
hazard when painting or remodeling
(yes/no)
Specific lan-guage about lead on label
IND-707 1 No No No No No
IND-708 1 No No No No No
IND-709, IND-710 2 No No No No No
IND-711 1 No No No No No
IND-712 1 No No No No No
IND-713, IND-714 2 No No No No No
IND-715, IND-716 2 No No No No No
IND-717, INF-718 2 No No No No No
IND-720 1 No No No No No
IND-721, IND-722 2 No No No No No
IND-723, IND-724 2 No No No No No
IND-725 1 No No No No No
IND-727, IND-728 2 No No No No No
IND-729 1 No No No No No
IND-730, IND-731 2 No No No No No
IND-732 1 No No No No No
IND-733 1 No No No No No
IND-734, IND-735 2 No No No No No
IND-736, IND-737 2 No No No No No
IND-738 1 No No No No No
IND-739 1 No No No No No
IND-740 1 No No No No No
IND-741, IND-742 2 No No No No No
IND-743, IND744 2 No No No No No
IND-745, IND-746 2 No No No No No
IND-747 1 No No No No No
IND-748 1 No No No No No
IND-749, IND-750 2 No No No No No
IND-752, IND-752 2 No No No No No
IND-753 1 No No No No No
28
NATIONAL REPORT | LEAD IN ENAMEL HOUSEHOLD PAINTS IN INDIA IN 2015:
Number of Samples
Lead content or other lead information on the label (yes/no)
Independent, third party certification of “lead safe” claims? (yes/no)
Information about lead hazard to children
(yes/no)
Information about lead
hazard when painting or remodeling
(yes/no)
Specific lan-guage about lead on label
IND-756,IND-757 2 No No No No No
IND-760, IND-761 2 No No No No No
IND-762, IND-763 2 No No No No No
IND-764, IND-765, IND-771, IND-772
4No No No No No
IND-767, IND-768 2 No No No No No
IND-766 1 No No No No No
IND-773 1 No No No No No
IND-774, IND-776 2 No No No No No
29
TABLE 8 - PAINT SAMPLES ANALYZED IN 2013 HAS LEAD LEVEL LESS THAN 90 PPM
Product Brand Name/Paint Type Paint Color Lead Concentration in 2013 study
Nerolac Brill White 8
ICI Dulux Blazing White 8
ICI Dulux Golden Yellow 8
Berger Luxol Golden Yellow 9
Homecare Premium Ultra White 12
Amul White 12
Shalimar Dazz WHite 13
Nerolac Golden Yellow 15
Berger Luxol Snow White 17
Shalimar Golden Yellow 18
British Paint Ultra White 25
Asian Paint Premium G. Yellow 29
Asian Paint Premium Blz White 32
Vitty Yellow 34
Emerald White 34
Libra White 42
Rolac white 44
Asha Lite Br. White 45
Kalpana yellow 47
Kalpana white 53
Homecare Premium Golden Brown 60
Rayol Gold White 70
Maruti Delux White 71
Snowlac P. O. Red 72
British Paint Smoke Grey 73
Aqua White 77
30
NATIONAL REPORT | LEAD IN ENAMEL HOUSEHOLD PAINTS IN INDIA IN 2015:
References1. Information about the indicated countries and studies can be found at www.toxicslink.org.
2. Clark, S., Grote, J., Wilson, J., Succop, P., Chen, M., Galke, W. and McLaine, P. (2004) Occurrence and determinants of increases in blood lead levels in children shortly after lead hazard control activities, Environmental Research. 96, 196-205.
3. World Health Organization, Childhood Lead Poisoning, page 18. http://www.who.int/ceh/publications/leadguidance.pdf (2010)
4. Lanphear, B. P., Matte, T. D., Rogers, J., Clickner, R. P., Dietz, B., Bornschein, R. L., Succop, P., Mahaffey, K. R., Dixon, S., Galke, W., Rabinowitz, M., Farfel, M., Rohde, C., Schwartz, J., Ashley, P. and Jacobs, D. E. (1998) The contribution of lead-contaminated house dust and residential soil to children’s blood lead levels, Environmental Research. 79, 51-68.
5. World Health Organization, Childhood Lead Poisoning, page 12http://www.who.int/ceh/publications/leadguidance.pdf (2010)
6. World Health Organization, Childhood Lead Poisoning, page 48http://www.who.int/ceh/publications/leadguidance.pdf (2010)
7. Bellinger D, Leviton A, Waternaux C, et al. 1987. Longitudinal analyses of prenatal and postnatal lead exposure and early cognitive development. N. Engl. J. Med. 316:1037–43
8. Bjorklund, K. L., Vahter, M., Palm, B., Grander, M., Lignell, S. and Berglund, M. (2012) Metals and trace element concentrations in breast milk of fi rst time healthy mothers: a biological monitoring study, Environmental Health. 11.
9. Needleman, H. (2004) Lead Poisoning, Annual Review of Medicine. 55, 209-222.
10. Verstraeten, S.V., et al, Aluminium and lead: molecular mechanisms of brain toxicity, (Archives of Toxicology 82:789–802. DOI 10.1007/s00204-008-0345-3, 2008)
11. World Health Organization, Childhood Lead Poisoning, 2010, page 11: http://www.who.int/ceh/publications/leadguidance.pdf
APPENDIXB
31
12. A. Prüss-Üstün and C. Corvalán, World Health Organization, Preventing Disease Through Healthy Environments: Towards an estimate of the environmental burden of disease, 2006, page 12: http://www.who.int/quantifying_ehimpacts/publications/preventingdisease.pdf
13. Herbert Needleman, Lead Poisoning,(Annual Review of Medicine 2004, http://www.rachel.org/fi les/document/Lead_Poisoning.pdf)
14. World Health Organization, Childhood Lead Poisoning, page 26 (citing the work of Lanphear et al., 2000): http://www.who.int/ceh/publications/leadguidance.pdf, 2010
15. World Health Organization, Frequently Asked Questions, International Lead Poisoning Awareness Campaign, Week of Action, 19-25 October, 2014, page 1: http://www.who.int/ipcs/lead_campaign/faq_lead_poisoning_prevention_campaign_en.pdf?ua=1
16. Mielke, H.W. and Zahran, S., The urban rise and fall of air lead (Pb) and the latent surge and retreat of societal violence ( Environment International. 43 (2012) 48-55)
17. World Health Organization, Childhood Lead Poisoning, page 28: http://www.who.int/ceh/publications/leadguidance.pdf, 2010
18. An International dollar is a currency unit used by economists and international organizations to compare the values of different currencies. It adjusts the value of the U.S. dollar to refl ect currency exchange rates, purchasing power parity (PPP), and average commodity prices within each country. According to the World Bank, “An international dollar has the same purchasing power over GDP as the U.S. dollar has in the United States.” The international dollar values in this report were calculated from a World Bank table that lists GDP per capita by country based on purchasing power parity and expressed in international dollars. The data from the table (at: http://data.worldbank.org/indicator/NY.GDP.PCAP.PP.CD) was accessed by the report’s authors in February 2012.
19. Teresa M. Attina and Leonardo Trasande, Economic Costs of Childhood Lead Exposure in Low- and Middle-Income Countries, (Environmental Health Perspectives; DOI:10.1289/ehp.1206424; http://ehp.niehs.nih.gov/1206424/ )
20. See e.g. Brosché, S., Denney, V., Weinberg, J., Calonzo, M. C., Withanage, H. and Clark, C. S. (2014) Asia Regional Paint Report Clark, C. S., Rampal, K. G., Thuppil, V., Chen, C. K., Clark, R. and Roda, S. (2006) The lead content of currently available new residential paint in several Asian countries, Environmental Research. 102, 9-12. Clark, C. S., Rampal, K. G., Thuppil, V., Roda, S. M., Succop, P., Menrath, W., Chen, C. K., Adebamowo, E. O., Agbede, O. A., Sridhar, M. K. C., Adebamowo, C. A., Zakaria, Y., El-Safty, A., Shinde, R. M. and Yu, J. F. (2009) Lead levels in new enamel household paints from Asia, Africa and South America, Environmental Research. 109, 930-936.
21. http://www.prnewswire.com/news-releases/indian-paint-industry-forecast-to-2015-170056666.html
22. http://assocham.org/newsdetail.php?id=4670
32
NATIONAL REPORT | LEAD IN ENAMEL HOUSEHOLD PAINTS IN INDIA IN 2015:
23. WHO Library Cataloguing-in-Publication Data (2011). Brief guide to analytical methods for measuring lead in paint.
24. http://www.who.int/ipcs/assessment/public_health/lead_paint.pdf
25. United States Consumer Product Safety Commission, Directorate for Laboratory Sciences, Division of Chemistry (2009). Test Method: CPSC-CH-E1003-09 Standard Operating Procedure for Determining Lead (Pb) in Paint and Other Similar Surface Coatingshttps://www.cpsc.gov/PageFiles/128129/CPSC-CH-E1003-09.pdf
Toxics Link is an Indian environmental research and advocacy organization set up in 1996, engaged in disseminating infor-mation to help strengthen campaign against toxics pollution, provide cleaner alternatives and bring together groups and peo-ple affected by this problem. Toxics Link’s Mission Statement is “Working together for environmental justice and freedom from toxics. We have taken upon ourselves to collect and share both
information about the sources and the dangers of poisons in our environment and bodies, and information about clean and sustainable alternatives for India and the rest of the world”
IPEN is an international NGO network of health and environ-mental organizations from all regions of the world in which Toxics Link participates. IPEN is a leading global organization working to establish and implement safe chemicals policies and
practices to protect human health and the environment. Its mission is a toxics-free future for all. IPEN helps build the capacity of its member organizations to imple-ment on-the-ground activities, learn from each other’s work, and work at the inter-national level to set priorities and achieve new policies.
Toxics LinkH-2, Jangpura ExtensionNew Delhi - 110014Phone: +91-(11)-24328006, 24320711, Fax: +91-(11)-24321747Email: [email protected]