national literacy acceleration program (nalap) …pdf.usaid.gov/pdf_docs/pnadw581.pdf · national...
TRANSCRIPT
National Literacy Acceleration Program (NALAP) Baseline Assessment
Prepared by: Kay Leherr
Education Development Center
Submitted to: Eric Johnson USAID/Ghana
8 June 2009
i
EXECUTIVE SUMMARY
Ghana is currently facing a national literacy and numeracy crisis. Based on the most current data available, only 26% of pupils who reach the sixth and final year of primary school are literate in English and only 11% are numerate1. Evidence from limited scale literacy interventions in Ghana demonstrates that literacy rates can be improved through the implementation of bilingual transitional literacy programs at the early levels of primary school. This has informed the development of a new National Literacy Acceleration Program (NALAP), which addresses the literacy crisis with a high quality program to be introduced nationwide in September 2009. In June 2006, a National Literacy Task Force (NLTF) was formed by Ghana’s Ministry of Education (MOE) to develop and implement NALAP with support from USAID. NALAP aims to ensure that all children in kindergarten to grade three have quality literacy materials, effective instruction, and public support to learn to read and write in their mother tongue and English. It directly supports the 2007 Education Reform of the Ministry of Education (MOE), which includes policies that stress the importance of local language instruction at the primary level. NALAP is a bilingual transitional “early exit” model, meaning that children learn to read in their mother tongue (L1) and also learn to speak English (L2), with a framework based on GES Language and Literacy Standards and Milestones. The instructional approach is supported by a comprehensive and high quality set of instructional materials, developed in all 11 Ghanaian languages of instruction and including both teacher and learner materials. The objective of NALAP Baseline Evaluation was to gather baseline data on early grade literacy levels and teacher methods of teaching reading and in the process to develop a comprehensive system for future assessments of NALAP, to be carried out by the GES. It was intended that the study would determine local language literacy rates across Ghana, as well as in geographic zones and between public and private schools, while utilizing a broader approach for teacher assessment in order to provide general performance measures and qualitative information. In addition to establishing statistically representative measures of pupil performance for comparisons against future assessments, this study also aimed to provide high quality, current data on pedagogical practices to inform the NALAP training design and implementation, which is currently scheduled for June and July 2009. Finally, an important goal of this study was to design ‘easy to use and replicate, yet robust and meaningful’ assessment instruments for both teacher and pupil performance so that the GES will be able to independently replicate the assessment approach in order to provide measures of NALAP impact in the future. The teacher assessment indicated that the majority of children in lower primary classrooms in Ghana are being taught by teachers who are not able to teach reading effectively, whether in public or private schools. Overall, only approximately one‐third of teachers demonstrated effectiveness, with no differences between teachers from public and private schools. There were differences in teacher performance geographically, with the lowest performing teachers teaching at schools in Northern Ghana. Nationally, teachers with qualifications performed significantly better than those without; however, the number of unqualified teachers was greater than the number of qualified teachers. Teachers did exhibit strong performance in several areas of effective instruction, but less than half teachers were able to demonstrate sufficient capacity in seven of the areas assessed, including Learner Interaction, Thinking Skills, Use of Teaching and Learning Materials, and Lesson Planning. Though the NALAP teacher guides are highly scripted, it will be necessary for teachers to be able to master these key building blocks to good instruction if they are going to implement the program successfully. Results of the pupil assessment indicated that only 18% of P1‐P3 pupils in Ghana are literate in the Ghanaian language to be used for NALAP implementation in their schools. Learners from private schools performed significantly better than learners from public schools and learners from the southern regions of Ghana performed better than those from Northern Ghana. The highest literacy rates were observed in private schools in the Middle Zone and the lowest literacy rates were observed in private schools in the Northern Zone, though rates of public schools in the Northern Zone were also very low. Overall, there was no significant difference in the performance of boys and girls, but boys did perform significantly better than girls in the
1 Ministry of Education, Ghana (2008). 2007 National Education Assessment Report. Accra, Ghana.
ii
Northern Zone. The highest literacy levels were observed in Fante schools, while the lowest literacy levels were observed in Dagbani schools. This study also demonstrated relationships between teacher and pupil performance. Overall, a greater percentage of pupils being taught by an effective teacher were literate compared to pupils being taught by a teacher not considered to be effective. This trend held true for both public and private schools, though the gap in performance between learners with and without an effective teacher in the private schools was much larger. It is also worth noting that despite this, private school pupils who did not have an effective teacher still performed better than all public school pupils, regardless of whether or not they had an effective teacher, indicating that there are additional factors contributing to elevated results in the private schools. The higher levels of performance in private schools is of particular interest, given the fact that it is generally assumed that the majority of private schools have an English only approach to instruction, which was somewhat confirmed by the results of the teacher assessment component. Nevertheless, these children performed at significantly higher levels than the children from the public schools, thus substantiating research that you only learn to read once and once you have, the literacy skills can be transferred to a language that you speak. With the private schools, the reverse of L1 to L2 transition promoted through NALAP might be used, or in fact there may not be a formal transition to L1 at all, but the pupils are nevertheless demonstrating skills in L1 literacy. It should be noted that critical issues relating to language of instruction were confirmed during the course of this study. The teaching of prescribed Ghanaian languages and the use of Ghanaian language as a medium of instruction proved to be a considerable hindering factor in the NALAP baseline assessment, both in terms of teacher and learner performance. In 13% of the schools sampled for the teacher assessment, teachers reported that either the Ghanaian language used in the school was different from that designated by the GES or that the school was not using a Ghanaian language at all, usually due to the fact that their learner population did not match one of the 11 official languages. As many as a third of teachers in lower primary classrooms were not proficient in reading or writing the Ghanaian language to be implemented with NALAP in their schools. Finally, the pupil assessment revealed alarmingly low levels of learner ability to understand the designated language of instruction in the school. In more than a quarter of primary schools, large percentages of pupils were either unable to understand basic instructions in the Ghanaian language being used in the school and/or had no basic familiarity with print. Exceedingly low results on the NALAP baseline assessment in the Northern Regions likely reveal not only the typical issues of quality education that are well known from that area, but also the somewhat unique complexities and challenges related to local language instruction. These findings present significant implications for the implementation of NALAP, which is going to require targeted strategies to deal with the unique challenges that language will present, most especially in the Northern Regions. Section Five of this report details a number of recommendations for both the implementation and future evaluation of NALAP for consideration by the MOE/GES and USAID. Most key among these recommendations are the following: Policy Reform. This study has confirmed findings of the teacher capacity survey that there are unacceptably high percentages of teachers in lower primary classrooms who are unable to read or write the language to be used for instruction in the school. With the GES moving toward an increasingly decentralized system, it is critical to emphasize teacher capacity in local language in the recruitment, training, posting, and transfer of teachers so that this problem is rectified. Teacher Professional Development. The teacher professional development component of NALAP needs to encompass both formal and informal training opportunities for teachers. It is understood that the initial teacher training activities for NALAP will be carried out beginning in September 2009 and this study has highlighted key areas that must be addressed through that activity. However, EDC also recommends that a structured ongoing teacher professional development strategy be designed and implemented to complement the initial training and respond to the considerable capacity gaps that have been identified. This is particularly important given the fact that teachers who are already struggling in their classrooms will be asked to implement the new approach, often in a language for which they do not have adequate literacy skills. A structured and well‐monitored teacher professional development program could also contribute to ongoing
iii
formative evaluation of NALAP, as is recommended below. The positive correlation between teacher qualification and teacher capacity to teach reading that has been observed provides further evidence for the GES to continue with efforts to get teachers qualified, preferably through distance learning models, so as to keep teachers in the classroom, but could also suggest that it may make sense to encourage NALAP teachers to form support groups that might allow for trained teachers to impart skills and ideas to untrained teachers. Social Marketing. The National Literacy Task Force took an important step for the success of NALAP by including a public advocacy or social marketing component to the overall program. Language issues have been discussed in detail above, but it is worth noting that the specific issues identified through this study should be factored into the NALAP social marketing campaign, both in terms of product development and implementation. Education managers, school administrators, and teachers will all face considerable challenges in the implementation of this new initiative and will benefit greatly from an environment that both understands and values the potential impact on children’s literacy and learning. NALAP Evaluation. It is well recognized that changes in the quality of education do not happen overnight and it will be necessary for the GES to commit to long term support, monitoring, and evaluation of NALAP if the expected gains in learner literacy rates are to be achieved. EDC recommends that, in the long term, USAID and the MOE/GES consider adopting a two tier approach to assessment of the NALAP initiative. The information gained through this baseline assessment could be used to inform the development, implementation, and analysis of results generated for both tiers. The first tier would consist of formative evaluation based on in‐depth and regular monitoring and assessment that would lend itself to understanding what is being taught and with what level of quality, how the pupils are responding, and ultimately what is working and what is not working. EDC recommends a case study approach, focusing on a limited number of schools but utilizing an intensive methodology for building a strong understanding of the progress and effectiveness of the NALAP implementation. This approach would likely include regular (perhaps bi‐weekly or monthly) assessments of teacher and learner performance, tracking a particular group of individuals over the course of an entire academic year. The case study would provide a rich data source for informing the ongoing NALAP implementation model, particularly as it relates to teacher training, since the study would provide detailed information not only of what teachers are able and not able to do in the classroom, but also an understanding of the obstacles to achieving better performance. This information would be available in ‘real‐time’, thus allowing for a professional development program model that is responsive to actual field implementation. The second tier of assessment, focused on overall impacts of the program, can follow the approach that has been utilized in this study to measure changes in teacher and learner performance over time. However, EDC is also recommending that the MOES/GES and USAID investigate and consider potentially more streamlined and simplistic approaches to pupil assessment to be used either intermittently or exclusively as NALAP implementation proceeds. One major limitation of the NALAP baseline assessment strategy is that it requires extensive training of data collectors, substantial field time to implement, and generates a very large data set that does not lend itself to easy processing. This approach may not be practical when considering a long‐term evaluation plan to be managed and implemented by the GES. Over the past several years, there has been a great deal of attention on the use of rapid reading assessments that have been shown to have strong predictive power of grade‐level equivalency and future reading ability. The strength of these approaches is that they are relatively simple to administer, yet provide a valid measure of overall literacy performance. EDC has provided explicit suggestions of how these types of assessments might be integrated into an overall assessment model.
iv
TABLE OF CONTENTS
Section One. Introduction ___________________________________________________________________ 1 Section Two. Study Design __________________________________________________________________ 5
2.1 Sample ____________________________________________________________________________ 5 2.2 Teacher Assessment Methodology ______________________________________________________ 6 2.3 Pupil Assessment methodology _________________________________________________________ 9 2.4 Data Quality and Assurance ___________________________________________________________ 13 2.5 Limitations of the Study ______________________________________________________________ 14
Section Three. Results _____________________________________________________________________ 19
3.1 Teacher Assessment _________________________________________________________________ 19 3.2 Pupil Assessment ___________________________________________________________________ 25
Section Four. Conclusions __________________________________________________________________ 31
4.1 Teacher Capacity to Teach Reading _____________________________________________________ 31 4.2 Pupil Ghanaian Language Literacy ______________________________________________________ 31 4.3 Language and Learning _______________________________________________________________ 33
Section Five. Recommendations _____________________________________________________________ 35
5.1 NALAP Implementation ______________________________________________________________ 35 5.2 NALAP Evaluation ___________________________________________________________________ 37
Appendix A. NALAP Baseline Detailed SCHOOL Sample ___________________________________________ 43 Appendix B. NALAP Classroom Observation Instrument __________________________________________ 53 Appendix C. NALAP COI Structured Note‐taking Form ____________________________________________ 75 Appendix D. NALAP Baseline Data Collectors ___________________________________________________ 77 Appendix E. NALAP Baseline Data Collection Schedule ___________________________________________ 79 Appendix F. NALAP Baseline Detailed Teacher Sample ___________________________________________ 85 Appendix G. NALAP Baseline Detailed Pupil Sample _____________________________________________ 87
Education Development Center 1
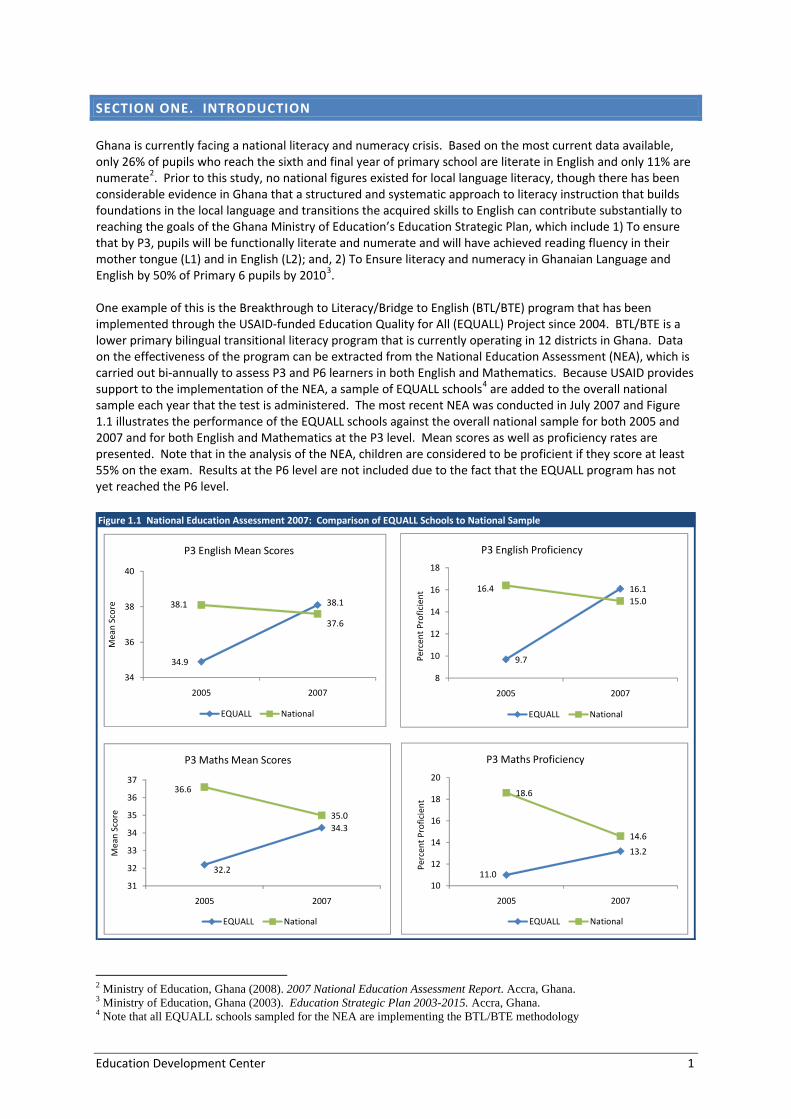
SECTION ONE. INTRODUCTION Ghana is currently facing a national literacy and numeracy crisis. Based on the most current data available, only 26% of pupils who reach the sixth and final year of primary school are literate in English and only 11% are numerate2. Prior to this study, no national figures existed for local language literacy, though there has been considerable evidence in Ghana that a structured and systematic approach to literacy instruction that builds foundations in the local language and transitions the acquired skills to English can contribute substantially to reaching the goals of the Ghana Ministry of Education’s Education Strategic Plan, which include 1) To ensure that by P3, pupils will be functionally literate and numerate and will have achieved reading fluency in their mother tongue (L1) and in English (L2); and, 2) To Ensure literacy and numeracy in Ghanaian Language and English by 50% of Primary 6 pupils by 20103. One example of this is the Breakthrough to Literacy/Bridge to English (BTL/BTE) program that has been implemented through the USAID‐funded Education Quality for All (EQUALL) Project since 2004. BTL/BTE is a lower primary bilingual transitional literacy program that is currently operating in 12 districts in Ghana. Data on the effectiveness of the program can be extracted from the National Education Assessment (NEA), which is carried out bi‐annually to assess P3 and P6 learners in both English and Mathematics. Because USAID provides support to the implementation of the NEA, a sample of EQUALL schools4 are added to the overall national sample each year that the test is administered. The most recent NEA was conducted in July 2007 and Figure 1.1 illustrates the performance of the EQUALL schools against the overall national sample for both 2005 and 2007 and for both English and Mathematics at the P3 level. Mean scores as well as proficiency rates are presented. Note that in the analysis of the NEA, children are considered to be proficient if they score at least 55% on the exam. Results at the P6 level are not included due to the fact that the EQUALL program has not yet reached the P6 level. Figure 1.1 National Education Assessment 2007: Comparison of EQUALL Schools to National Sample
34.9
38.138.1
37.6
34
36
38
40
2005 2007
Mean Score
P3 English Mean Scores
EQUALL National
32.2
34.3
36.6
35.0
31
32
33
34
35
36
37
2005 2007
Mean Score
P3 Maths Mean Scores
EQUALL National
9.7
16.116.415.0
8
10
12
14
16
18
2005 2007
Percen
t Proficient
P3 English Proficiency
EQUALL National
11.0
13.2
18.6
14.6
10
12
14
16
18
20
2005 2007
Percen
t Proficient
P3 Maths Proficiency
EQUALL National
2 Ministry of Education, Ghana (2008). 2007 National Education Assessment Report. Accra, Ghana. 3 Ministry of Education, Ghana (2003). Education Strategic Plan 2003-2015. Accra, Ghana. 4 Note that all EQUALL schools sampled for the NEA are implementing the BTL/BTE methodology
NALAP Baseline Assessment Section 1. Introduction
Education Development Center 2
The graphs in Figure 1.1 illustrate that while national performance in English and Mathematics at the P3 level decreased between 2005 and 2007, performance of P3 learners in the EQUALL schools improved5. In both English and Mathematics, P3 learners from the EQUALL schools were performing well below the national average during the 2005 NEA assessment. By 2007, P3 learners had completely closed the performance gap in English and had substantially narrowed the gap in Mathematics. Overall, the fact that English literacy rates are rising in the EQUALL schools confirms international research of the effectiveness of local language literacy programs. In addition, these results also support the argument that improving literacy skills has associated impact in other subject areas, given that the EQUALL schools have also demonstrated improvements in Mathematics against an overall decline in performance across the country.6 Despite being a multilingual country, Ghana has never had a nationwide approach for bilingual education, but rather a history of non‐systematic instruction in English and local language and a changing and ambiguous language policy. In June 2006, a National Literacy Task Force (NLTF) was formed by the Ghana Education Service (GES) to develop and implement a new National Literacy Acceleration Program (NALAP), with support from USAID. NALAP aims to ensure that all children in kindergarten to grade three have quality literacy materials, effective instruction, and public support to learn to read and write in their mother tongue and English. It directly supports the 2007 Education Reform of the Ministry of Education (MOE), which includes policies that stress the importance of local language instruction at the primary level. There are over fifty local languages in Ghana, but currently eleven languages are officially sponsored by the MOE to be used as languages of instruction7. NALAP has been under development in these eleven languages since August 2007 and is scheduled to be introduced to Ghanaian primary schools nationwide in September 2009, or the beginning of the 2009‐2010 academic year. The NALAP approach is based on research findings that children learn to read and write better and more quickly in their mother‐tongue and can then transfer these skills to a second language. It is a bilingual transitional “early exit” model, meaning that children learn to read in their mother tongue (L1) and also learn to speak English (L2). The NALAP framework is based on Language and Literacy Standards and Milestones, developed by the GES prior to the initiation of the NALAP design phase, with the majority of instructional time initially spent on L1 (90% in kindergarten and 80% in grade one) and time for English gradually increasing to 50% by grade three. This permits children to consolidate their literacy skills in L1 while developing oral English skills. By the time children have a good understanding of oral English, they can transfer their literacy skills to the second language, thus obtaining literacy skills in both languages by the time they enter grade four (when all instruction is in English). NALAP is supported by a comprehensive and high quality set of instructional materials, developed in all 11 languages of instruction and including both teacher and learner materials. The NALAP materials set includes highly structured teacher guides, which are primarily written in English but with key sections translated to the local language to assure that the teacher can conduct the lesson in L1. To date, three types of research have been carried out in support of the introduction of NALAP. In February 2008, a nationwide survey of teacher capacity to teach in Ghanaian languages revealed low levels of head teacher and teacher capacity to teach in L1, despite generally good alignment between the L1 designated for the school and the predominant language of the school‐community. Contributing to the problem, particularly for lower primary instruction, were a failure to assign teachers to schools and classes based on L1 proficiencies; a weak understanding of the medium of instruction policy among circuit supervisors, head teachers, and teachers; and a severe shortage of Ghanaian language textbooks or other teaching and learning materials in the schools. Despite these challenges, educators at all levels of the system reported that they were in favor of the use of Ghanaian language as the medium of instruction and the introduction of an L1 to L2
5 It is possible that the decline in quality at the P3 level may be somewhat attributable to sizeable increases in access as a result of the introduction of a capitation grant scheme, as there were measures of increased quality at the P6 level. If this is the case, the gains observed in the EQUALL schools were achieved even in the face of the challenges presented by increased enrolments at the lower primary level, whereas nationally, schools were not able to even maintain performance levels. 6 Education Development Center (2008). Education Quality for All FY 2008 Annual Report. Education Quality for All Project, Accra, Ghana. 7 The MOE/GES has a process for determining which Ghanaian languages are officially sponsored. With at least 46 languages in Ghana, some of which do not have an orthography, criteria have been established for introducing a new language into the schools. This criteria includes the existence and availability of literature, the availability of teachers, and the establishment of the language within the Bureau of Ghanaian Languages. Once the criteria have been satisfied, the MOE can take a decision to add to the currently approved 11 languages.
NALAP Baseline Assessment Section 1. Introduction
Education Development Center 3
transitional literacy program.8 Overall, this study presented a considerable challenge to NALAP, as teacher capacity levels were lower than expected, and revealed a need for policy and practice reforms to support L1 instruction, capacity building for teachers for L1 literacy, and more effective dissemination of the medium of instruction policy throughout the system to improve compliance. In June 2008, a nationwide social marketing survey was conducted to build an understanding of views and practices of education stakeholders toward literacy and local language instruction, primarily to inform the development of key messages and products for the NALAP public advocacy campaign. The survey included parents, teachers, head teachers, chiefs, District Directors of Education, and members of the District Education Oversight Committee. The great majority of respondents in each group understood the rationale behind initiating literacy using mother tongue and supported the program. Exceptions were some parents who still felt that schools should only teach English, and some teachers who did not have confidence that the program could be implemented well, particularly in multi‐lingual settings. Most importantly, each group had a particular perspective and particular concerns, which need to be addressed in the NALAP national launch and campaign.9 Research into teacher capacity to teach reading and pupil literacy rates, the subject of this report, represents the third NALAP research activity to date. The objective of this study was to gather baseline data on early grade literacy levels and teacher methods of teaching reading and in the process to develop a comprehensive assessment system for future assessments of NALAP, to be carried out by the GES. It was intended that the study would determine local language literacy rates across Ghana, as well as in geographic zones and between public and private schools, while utilizing a broader approach for teacher assessment in order to provide general performance measures and qualitative information. In addition to establishing statistically representative measures of pupil performance for comparisons against future assessments, this study also aimed to provide high quality, current data on pedagogical practices to inform the NALAP training design and implementation, which is currently scheduled for June and July 2009. Finally, an important goal of this study was to design ‘easy to use and replicate, yet robust and meaningful’ assessment instruments for both teacher and pupil performance so that the GES will be able to independently replicate the assessment approach in order to provide measures of NALAP impact in the future.
8 National Centre for Research Into Basic Education (2008). Report on Teacher Capacity for Local Language Instruction. Education Quality for All Project, Accra, Ghana. 9 Education Quality for All. NALAP Social Marketing Formative Research Report. Accra, Ghana (2008).

Education Development Center 5
SECTION TWO. STUDY DESIGN The NALAP baseline assessment study design was largely modeled on the work that has been carried out in measuring teacher and pupil performance on the Education Quality for All (EQUALL) project, but with substantial modifications to align the approaches with the design and needs of NALAP. This section provides further details on the sample, teacher and pupil assessment methodologies, data analysis and reporting, data quality and assurance, and assumptions and limitations of the approach.
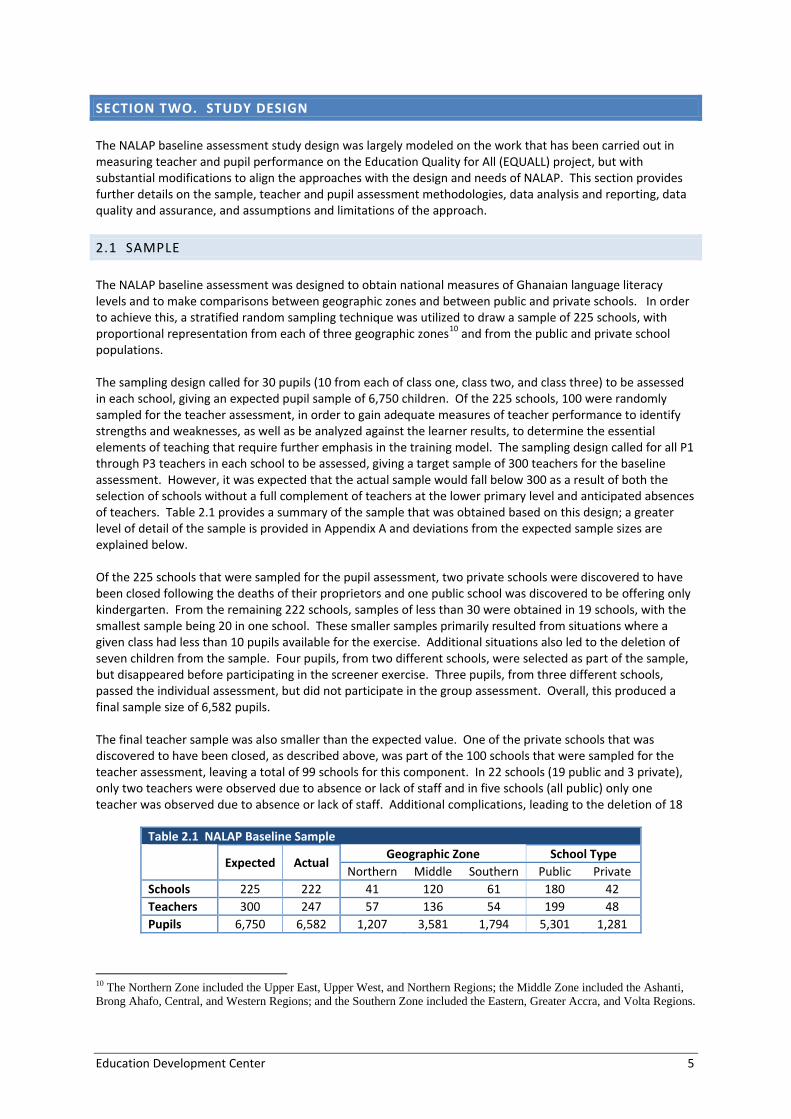
2.1 SAMPLE The NALAP baseline assessment was designed to obtain national measures of Ghanaian language literacy levels and to make comparisons between geographic zones and between public and private schools. In order to achieve this, a stratified random sampling technique was utilized to draw a sample of 225 schools, with proportional representation from each of three geographic zones10 and from the public and private school populations. The sampling design called for 30 pupils (10 from each of class one, class two, and class three) to be assessed in each school, giving an expected pupil sample of 6,750 children. Of the 225 schools, 100 were randomly sampled for the teacher assessment, in order to gain adequate measures of teacher performance to identify strengths and weaknesses, as well as be analyzed against the learner results, to determine the essential elements of teaching that require further emphasis in the training model. The sampling design called for all P1 through P3 teachers in each school to be assessed, giving a target sample of 300 teachers for the baseline assessment. However, it was expected that the actual sample would fall below 300 as a result of both the selection of schools without a full complement of teachers at the lower primary level and anticipated absences of teachers. Table 2.1 provides a summary of the sample that was obtained based on this design; a greater level of detail of the sample is provided in Appendix A and deviations from the expected sample sizes are explained below. Of the 225 schools that were sampled for the pupil assessment, two private schools were discovered to have been closed following the deaths of their proprietors and one public school was discovered to be offering only kindergarten. From the remaining 222 schools, samples of less than 30 were obtained in 19 schools, with the smallest sample being 20 in one school. These smaller samples primarily resulted from situations where a given class had less than 10 pupils available for the exercise. Additional situations also led to the deletion of seven children from the sample. Four pupils, from two different schools, were selected as part of the sample, but disappeared before participating in the screener exercise. Three pupils, from three different schools, passed the individual assessment, but did not participate in the group assessment. Overall, this produced a final sample size of 6,582 pupils. The final teacher sample was also smaller than the expected value. One of the private schools that was discovered to have been closed, as described above, was part of the 100 schools that were sampled for the teacher assessment, leaving a total of 99 schools for this component. In 22 schools (19 public and 3 private), only two teachers were observed due to absence or lack of staff and in five schools (all public) only one teacher was observed due to absence or lack of staff. Additional complications, leading to the deletion of 18
10 The Northern Zone included the Upper East, Upper West, and Northern Regions; the Middle Zone included the Ashanti, Brong Ahafo, Central, and Western Regions; and the Southern Zone included the Eastern, Greater Accra, and Volta Regions.
Table 2.1 NALAP Baseline Sample
Expected Actual Geographic Zone School Type
Northern Middle Southern Public Private Schools 225 222 41 120 61 180 42 Teachers 300 247 57 136 54 199 48 Pupils 6,750 6,582 1,207 3,581 1,794 5,301 1,281
NALAP Baseline Assessment Section 2. Study Design
Education Development Center 6
teachers from the sample, are listed below. This resulted in an overall sample of 247 teachers from 94 schools, against the expected sample of 300 teachers from 100 schools.
All 10 sampled schools that were designated as Kasem schools by the GES stated that they do not use Kasem as the official language of the school. Teachers in these schools were teaching in either English, Kusal, or Gurune. The teacher assessment team that went to these schools had members who were literate in English and Gurune, but neither member understood Kusal. Prior to the lesson delivery, teachers stated that they would teach in English, but they often reverted to Kusal, making it impossible for the data collectors to follow the lesson and make accurate ratings. This led to the deletion of nine teachers from four schools.
In one school that was designated as Dagbani by the GES, the teacher used Ewe in lesson delivery.
The teacher assessment team in this school did not understand Ewe, making it impossible for the data collectors to follow the lesson and make accurate ratings. This led to the deletion of one teacher from one school.
One data collection team failed to utilize the element of the classroom observation instrument
dealing with teacher ability to teach in English during the assessment process. In any situation where the teacher taught either primarily in English or in both English and Ghanaian language, they were not rated in English by this team, leading to a situation where the teacher had less of an opportunity to reach performance criteria. This led to the deletion of eight teachers from four schools.
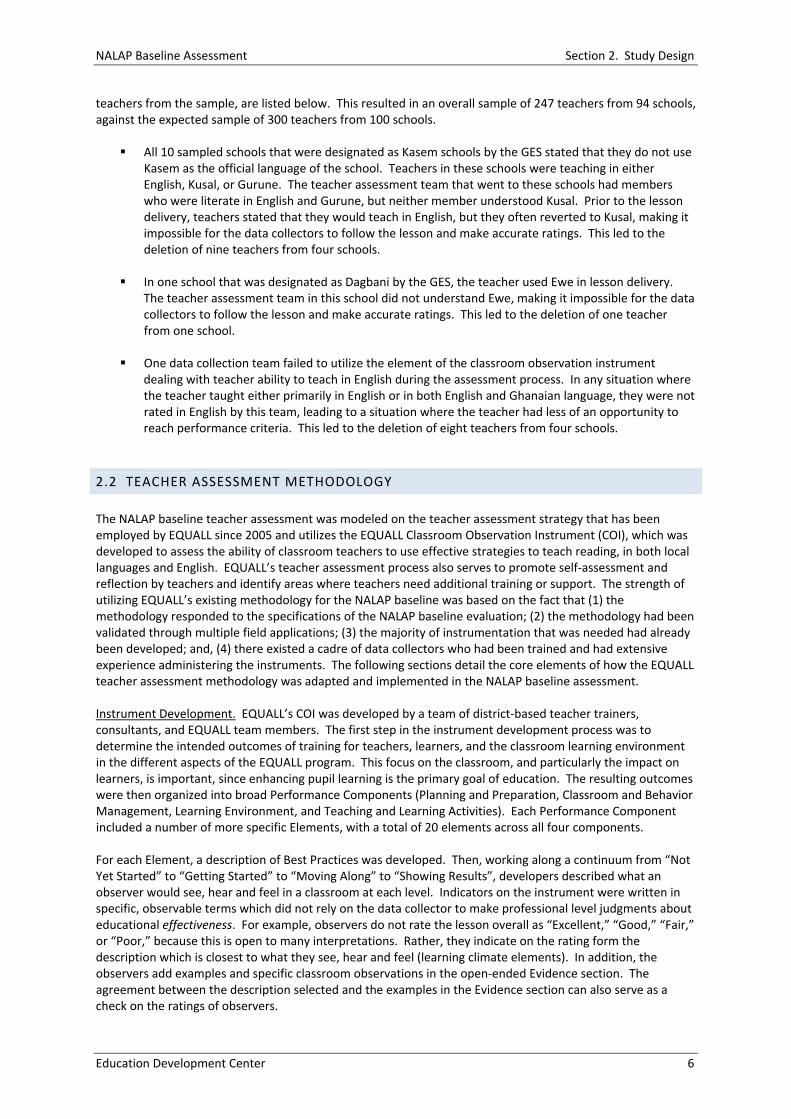
2.2 TEACHER ASSESSMENT METHODOLOGY The NALAP baseline teacher assessment was modeled on the teacher assessment strategy that has been employed by EQUALL since 2005 and utilizes the EQUALL Classroom Observation Instrument (COI), which was developed to assess the ability of classroom teachers to use effective strategies to teach reading, in both local languages and English. EQUALL’s teacher assessment process also serves to promote self‐assessment and reflection by teachers and identify areas where teachers need additional training or support. The strength of utilizing EQUALL’s existing methodology for the NALAP baseline was based on the fact that (1) the methodology responded to the specifications of the NALAP baseline evaluation; (2) the methodology had been validated through multiple field applications; (3) the majority of instrumentation that was needed had already been developed; and, (4) there existed a cadre of data collectors who had been trained and had extensive experience administering the instruments. The following sections detail the core elements of how the EQUALL teacher assessment methodology was adapted and implemented in the NALAP baseline assessment. Instrument Development. EQUALL’s COI was developed by a team of district‐based teacher trainers, consultants, and EQUALL team members. The first step in the instrument development process was to determine the intended outcomes of training for teachers, learners, and the classroom learning environment in the different aspects of the EQUALL program. This focus on the classroom, and particularly the impact on learners, is important, since enhancing pupil learning is the primary goal of education. The resulting outcomes were then organized into broad Performance Components (Planning and Preparation, Classroom and Behavior Management, Learning Environment, and Teaching and Learning Activities). Each Performance Component included a number of more specific Elements, with a total of 20 elements across all four components. For each Element, a description of Best Practices was developed. Then, working along a continuum from “Not Yet Started” to “Getting Started” to “Moving Along” to “Showing Results”, developers described what an observer would see, hear and feel in a classroom at each level. Indicators on the instrument were written in specific, observable terms which did not rely on the data collector to make professional level judgments about educational effectiveness. For example, observers do not rate the lesson overall as “Excellent,” “Good,” “Fair,” or “Poor,” because this is open to many interpretations. Rather, they indicate on the rating form the description which is closest to what they see, hear and feel (learning climate elements). In addition, the observers add examples and specific classroom observations in the open‐ended Evidence section. The agreement between the description selected and the examples in the Evidence section can also serve as a check on the ratings of observers.
NALAP Baseline Assessment Section 2. Study Design
Education Development Center 7
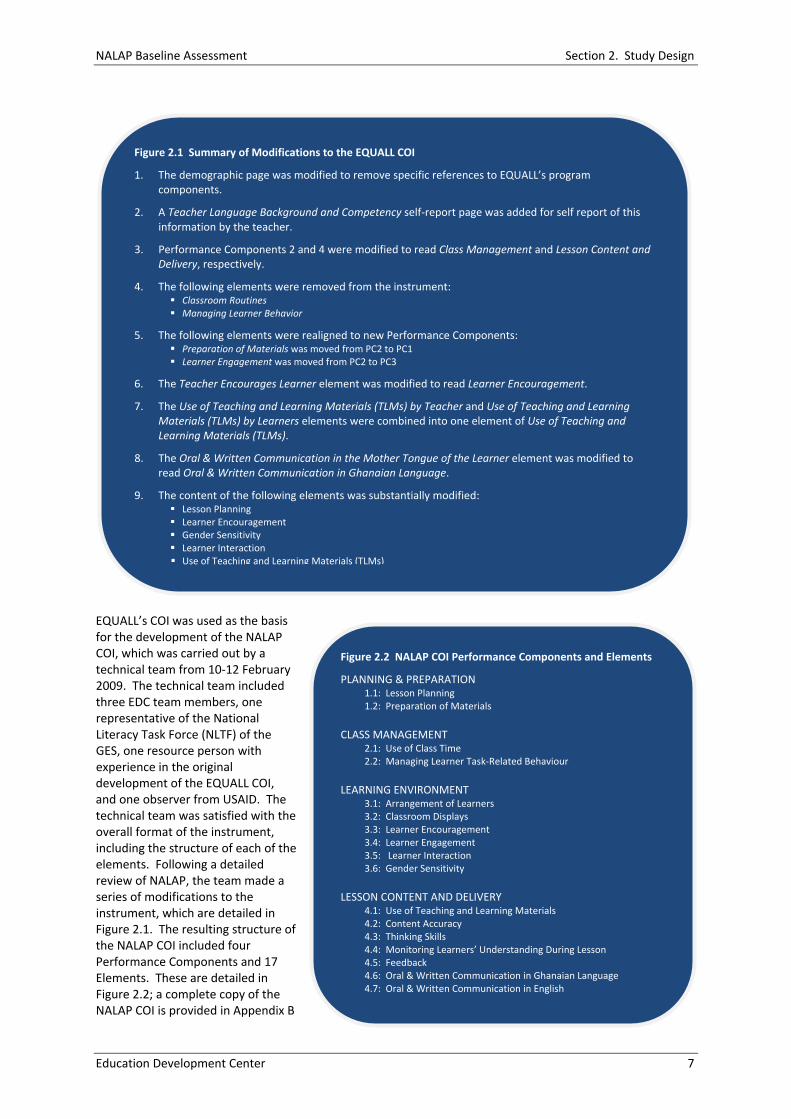
EQUALL’s COI was used as the basis for the development of the NALAP COI, which was carried out by a technical team from 10‐12 February 2009. The technical team included three EDC team members, one representative of the National Literacy Task Force (NLTF) of the GES, one resource person with experience in the original development of the EQUALL COI, and one observer from USAID. The technical team was satisfied with the overall format of the instrument, including the structure of each of the elements. Following a detailed review of NALAP, the team made a series of modifications to the instrument, which are detailed in Figure 2.1. The resulting structure of the NALAP COI included four Performance Components and 17 Elements. These are detailed in Figure 2.2; a complete copy of the NALAP COI is provided in Appendix B
Figure 2.1 Summary of Modifications to the EQUALL COI
1. The demographic page was modified to remove specific references to EQUALL’s program components.
2. A Teacher Language Background and Competency self‐report page was added for self report of this information by the teacher.
3. Performance Components 2 and 4 were modified to read Class Management and Lesson Content and Delivery, respectively.
4. The following elements were removed from the instrument: Classroom Routines Managing Learner Behavior
5. The following elements were realigned to new Performance Components: Preparation of Materials was moved from PC2 to PC1 Learner Engagement was moved from PC2 to PC3
6. The Teacher Encourages Learner element was modified to read Learner Encouragement.
7. The Use of Teaching and Learning Materials (TLMs) by Teacher and Use of Teaching and Learning Materials (TLMs) by Learners elements were combined into one element of Use of Teaching and Learning Materials (TLMs).
8. The Oral & Written Communication in the Mother Tongue of the Learner element was modified to read Oral & Written Communication in Ghanaian Language.
9. The content of the following elements was substantially modified: Lesson Planning Learner Encouragement Gender Sensitivity Learner Interaction Use of Teaching and Learning Materials (TLMs)
Figure 2.2 NALAP COI Performance Components and Elements
PLANNING & PREPARATION 1.1: Lesson Planning 1.2: Preparation of Materials
CLASS MANAGEMENT
2.1: Use of Class Time 2.2: Managing Learner Task‐Related Behaviour
LEARNING ENVIRONMENT
3.1: Arrangement of Learners 3.2: Classroom Displays 3.3: Learner Encouragement 3.4: Learner Engagement 3.5: Learner Interaction 3.6: Gender Sensitivity
LESSON CONTENT AND DELIVERY
4.1: Use of Teaching and Learning Materials 4.2: Content Accuracy 4.3: Thinking Skills 4.4: Monitoring Learners’ Understanding During Lesson 4.5: Feedback 4.6: Oral & Written Communication in Ghanaian Language 4.7: Oral & Written Communication in English
NALAP Baseline Assessment Section 2. Study Design
Education Development Center 8
and the NALAP COI Structured Note‐taking Form is provided in Appendix C. Limited field testing of five elements that were substantially modified (see modification #9 in Figure 2.1) was carried out from 20‐24 February 2009 by resource people independent of the instrument development team. This exercise indicated that the newly revised items were easy to understand and administer and had acceptable levels of inter‐rater reliability. Selection and Training of Data Collectors. Data collectors were identified through district education offices (DEOs) across Ghana. To the extent possible, data collectors were selected from a pool of District Monitoring Assistants (DMAs) and DEO staff that have partnered with the EQUALL project and have experience with the EQUALL teacher assessment. Where language requirements necessitated the identification of data collectors from outside of this pool, EDC requested that DEOs nominate officers who had been trained under the USAID‐funded Quality Improvement in Primary Schools (QUIPS) M&E capacity building program. In total, 22 data collectors were selected to form 11 teams to carry out the teacher assessment. A full list of the data collectors is provided in Appendix D. From 4‐6 March 2009, EDC carried out a three‐day training workshop to prepare data collectors to utilize the NALAP COI in the field. The workshop included practice observation in classrooms with trained evaluators to determine that data collectors’ ratings were on target before they are allowed to assess teachers. It was very important that observers understood the instrument and practiced making targeted rating decisions, so that for each Element, they focused on only that Element and did not let decisions “bleed” together. As part of the training, data collectors received field notes for data collection. Data Collection. The teacher assessment was carried out by a two‐member team in one day in each school. All lower primary teachers present in the schools were observed during an English or Ghanaian language lesson. Observations were carried out by two data collectors per classroom. Before each observation, data collectors confirmed a time to observe the class so that they were present from the beginning to the end of each lesson. All class observations were “announced”, as the assessment was intended to determine what teachers are capable of doing. Thus the results will show not what teachers typically do, but the best that they are able to do. This distinction is very important since there is likely to be a big gap between the two, especially given the evidence that teacher attendance and time on task in Ghana is problematic11. The entire teacher assessment exercise was completed from 9‐27 March 2009. A full data collection schedule is provided in Appendix E. It should be noted that during the NALAP COI development workshop, there was much discussion surrounding the question of which subject (English or Ghanaian language) and which language of instruction (again, English or Ghanaian language) should be used for the observation. One challenge of the NALAP baseline assessment exercise was the fact that the lower primary school timetable will change once NALAP has been introduced. Currently, children in P1‐P3 have separate classes for Ghanaian Language and for English; these are also two different subjects in the curriculum, with Ghanaian Language focused on language and culture and English focused on language and reading. With the introduction of NALAP, these two subjects will be collapsed into one Language and Literacy period on the timetable and a portion of each lesson will be devoted to both Ghanaian language and English. This situation created a question of which class should be observed during the NALAP baseline: Ghanaian language or English? The language of instruction to be observed also complicated the process at the school level. Ideally, it would have been best to observe the teachers teaching reading using Ghanaian language, because this is the approach that is used in NALAP, as well as because the NALAP baseline learner assessment focused only on Ghanaian language literacy. However, the current Ghanaian language syllabus does not explicitly address reading and not all teachers in lower primary are able to teach in the Ghanaian language used in the school. In future NALAP assessments, it is assumed that teacher observation will be carried out in the Language and Literacy period and teachers will be observed teaching in both Ghanaian language and English, as is prescribed in the NALAP curriculum. For the reasons stated above, this was difficult to replicate during the baseline assessment. The technical team therefore determined that in order to maximize the teacher assessment sample, the observation parameters would be as broad as possible and would require that teachers be observed teaching reading, either during the Ghanaian language or English time period and using either
11 See Abadzi, H. (2007) Absenteeism and Beyond: Loss and Cost of Instructional Time in Schools (DRAFT). Independent Evaluation Group, World Bank.
NALAP Baseline Assessment Section 2. Study Design
Education Development Center 9
Ghanaian language or English as the medium of instruction. These factors were recorded on the background information sheet as part of the assessment. In addition, as is noted in modification #2 in Figure 2.1, an additional information page was added to the instrument to collect specific language competency data on the teachers. This was done using a brief interview with the teacher, so reflects only teacher self‐report (experiences) and self‐assessment (competencies), but should contributes to understanding the results of the assessment, especially as it relates to the pupil assessment results, as well as serves as a limited follow‐up to the teacher capacity survey conducted in relation to the NALAP development process12. Upon arriving at the classroom, observers thanked the teacher for participating in the study and told the teacher that the assessment was to gather information about the impact of a variety of teacher training programs; it was not a job evaluation. They told the teacher that names of teachers will not be used in the report and tried to put the teacher at ease. During each lesson, observers sat where they could see all pupils and then observed for a full lesson. They watched, listened, and took notes; they did not interact with the teacher or the learners during the lesson. Observation notes were recorded on a Structured Note‐taking Form (see Appendix C). The COI itself was not used during the lesson. At the end of the lesson, observers thanked the teacher and left the classroom. Before observing a second teacher, each data collector used the COI to individually rate the teacher on each Element, choosing the description which best fit the teacher. For each Element in the COI, the observer considered the descriptions of the teaching/learning behaviors in the developmental descriptions ranging from “Not Yet Started” through “Getting Started” and “Moving Along” to “Showing Results” and selected the one that best fit what was observed. If the teacher did not meet the criteria for a rating, she/he received the lower rating. Ratings are meant to represent a “preponderance of evidence,” not a single incident during a 45‐60 minute lesson. Observers were instructed to not “halo” (“Everything was wonderful!”) or “pitchfork” (“Everything was awful!”) but consider each Element separately in making rating decisions. Observers wrote comments and examples in the Evidence section of the instrument, to justify their rating decisions. The scoring process took about 30‐45 minutes. The observers were then able to observe another class, take notes, and afterwards, individually rate the teacher using the COI. Later the same day, the observers met to discuss the observation(s) and their ratings and rationales. They came to a consensus about a rating for each teacher on each of the Elements and a rationale, which is written in the Evidence section. Data collectors had to be able to justify the ratings given to teachers with examples from the observation. During the field work, EDC supervisory team members held periodic debriefing sessions with the data collection teams and collected the instruments that had been administered. During these debriefing sessions, data collectors further discussed ratings and rationales, ensuring that matches had been achieved. Data Entry and Cleaning. Once the instruments had been collected, they were coded for data entry. A manual double data entry process into Excel files was utilized to ensure the accuracy of the electronic data capture. Resulting files were then imported into SPSS file and verified utilizing both random manual checks and electronic algorithms to identify out‐of‐range or anomalous data. Errors were rectified until the data set was determined to be sufficiently clean.
2.3 PUPIL ASSESSMENT METHODOLOGY The NALAP baseline pupil assessment was modeled on the pupil assessment methodology that EDC has employed through EQUALL since 2005, though it focused exclusively on Ghanaian language assessment, rather than both Ghanaian language and English. EQUALL’s methodology was designed to measure lower‐primary learner literacy rates through the administration of EQUALL Reading Assessment (ERA) instruments, which had been developed in English and 11 Ghanaian languages. This methodology allows EQUALL to categorize learners into beginning, developing, and transitioning literacy achievement levels in English and in the Ghanaian language being utilized in their schools. Like with the teacher assessment, the strength of utilizing this methodology for the NALAP baseline was based on the fact that (1) the methodology met the 12 It should be noted that this aspect of the data collection proved to be problematic, especially in schools where the ‘prescribed’ Ghanaian language was not being utilized. This is discussed in more detail in the Limitations Sub-section below.
NALAP Baseline Assessment Section 2. Study Design
Education Development Center 10
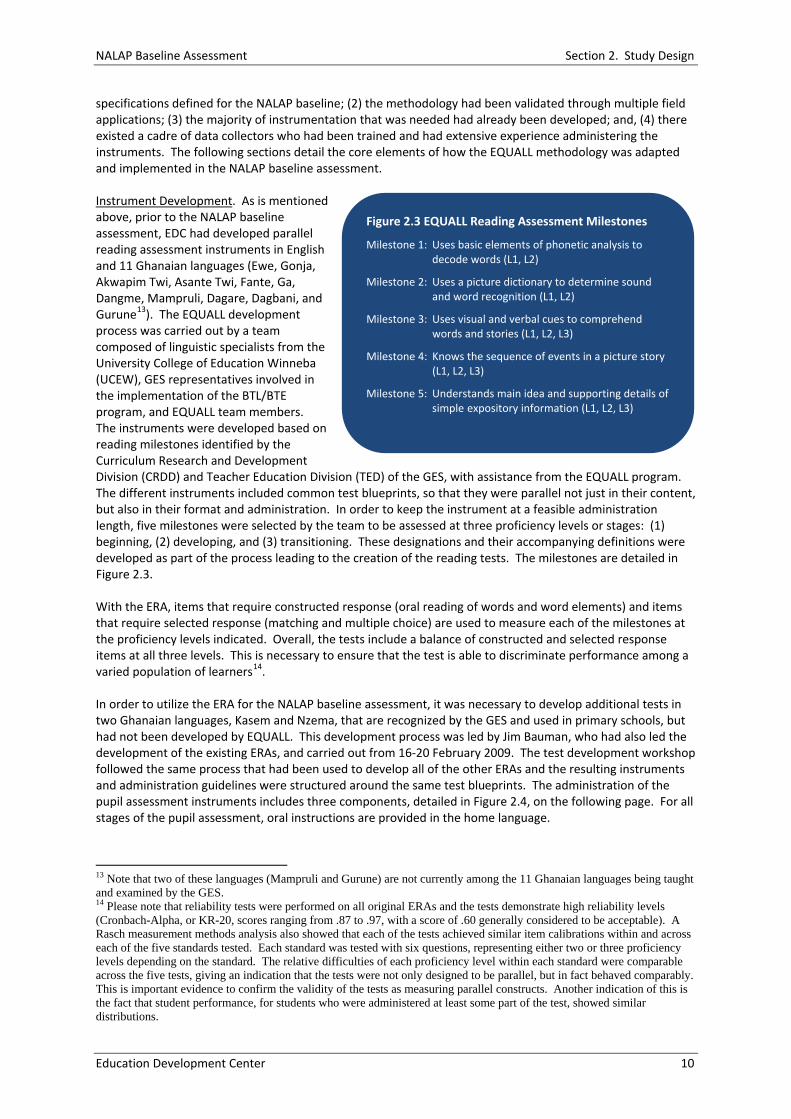
specifications defined for the NALAP baseline; (2) the methodology had been validated through multiple field applications; (3) the majority of instrumentation that was needed had already been developed; and, (4) there existed a cadre of data collectors who had been trained and had extensive experience administering the instruments. The following sections detail the core elements of how the EQUALL methodology was adapted and implemented in the NALAP baseline assessment. Instrument Development. As is mentioned above, prior to the NALAP baseline assessment, EDC had developed parallel reading assessment instruments in English and 11 Ghanaian languages (Ewe, Gonja, Akwapim Twi, Asante Twi, Fante, Ga, Dangme, Mampruli, Dagare, Dagbani, and Gurune13). The EQUALL development process was carried out by a team composed of linguistic specialists from the University College of Education Winneba (UCEW), GES representatives involved in the implementation of the BTL/BTE program, and EQUALL team members. The instruments were developed based on reading milestones identified by the Curriculum Research and Development Division (CRDD) and Teacher Education Division (TED) of the GES, with assistance from the EQUALL program. The different instruments included common test blueprints, so that they were parallel not just in their content, but also in their format and administration. In order to keep the instrument at a feasible administration length, five milestones were selected by the team to be assessed at three proficiency levels or stages: (1) beginning, (2) developing, and (3) transitioning. These designations and their accompanying definitions were developed as part of the process leading to the creation of the reading tests. The milestones are detailed in Figure 2.3. With the ERA, items that require constructed response (oral reading of words and word elements) and items that require selected response (matching and multiple choice) are used to measure each of the milestones at the proficiency levels indicated. Overall, the tests include a balance of constructed and selected response items at all three levels. This is necessary to ensure that the test is able to discriminate performance among a varied population of learners14. In order to utilize the ERA for the NALAP baseline assessment, it was necessary to develop additional tests in two Ghanaian languages, Kasem and Nzema, that are recognized by the GES and used in primary schools, but had not been developed by EQUALL. This development process was led by Jim Bauman, who had also led the development of the existing ERAs, and carried out from 16‐20 February 2009. The test development workshop followed the same process that had been used to develop all of the other ERAs and the resulting instruments and administration guidelines were structured around the same test blueprints. The administration of the pupil assessment instruments includes three components, detailed in Figure 2.4, on the following page. For all stages of the pupil assessment, oral instructions are provided in the home language.
13 Note that two of these languages (Mampruli and Gurune) are not currently among the 11 Ghanaian languages being taught and examined by the GES. 14 Please note that reliability tests were performed on all original ERAs and the tests demonstrate high reliability levels (Cronbach-Alpha, or KR-20, scores ranging from .87 to .97, with a score of .60 generally considered to be acceptable). A Rasch measurement methods analysis also showed that each of the tests achieved similar item calibrations within and across each of the five standards tested. Each standard was tested with six questions, representing either two or three proficiency levels depending on the standard. The relative difficulties of each proficiency level within each standard were comparable across the five tests, giving an indication that the tests were not only designed to be parallel, but in fact behaved comparably. This is important evidence to confirm the validity of the tests as measuring parallel constructs. Another indication of this is the fact that student performance, for students who were administered at least some part of the test, showed similar distributions.
Figure 2.3 EQUALL Reading Assessment Milestones
Milestone 1: Uses basic elements of phonetic analysis to decode words (L1, L2)
Milestone 2: Uses a picture dictionary to determine sound and word recognition (L1, L2)
Milestone 3: Uses visual and verbal cues to comprehend words and stories (L1, L2, L3)
Milestone 4: Knows the sequence of events in a picture story (L1, L2, L3)
Milestone 5: Understands main idea and supporting details of simple expository information (L1, L2, L3)
NALAP Baseline Assessment Section 2. Study Design
Education Development Center 11
It was envisioned that the actual NALAP baseline administration would serve as the basis for the field validation and item analysis for the two new instruments, but this proved to be problematic for both Kasem and Nzema. With the Kasem test, the overall NALAP sample appeared to contain adequate numbers to allow for test analysis to be carried out. A total of 13 schools that were understood to be Kasem schools were selected for the study and 383 pupils were sampled. However, of these 383 pupils, only three passed the screening exercise and two of those pupils passed the individual assessment. Therefore, only two pupils took the entire 30 item test, making item analysis impossible. One of these students obtained a score of 12 out of 60 and the other obtained a score of 34 out of 60, but given the fact that the reliability of the test could not be established, these numbers do not hold much meaning. The problems with the Kasem testing were further complicated by issues regarding the Ghanaian language used in the school and the NALAP implementation plans for those schools. Of the 13 schools, only two were identified as Kasem schools by the DEOs as part of a NALAP exercise. Two of the remaining schools were private schools, which reported to EDC that they do not teach Ghanaian language and the other nine schools reported that they were using Kusaal, Gurune, or Buli, all languages that are not covered by NALAP. Based on consultations with people involved with NALAP, EDC understood that these 11 schools would receive Kasem materials during the NALAP implementation, presumably with an expectation that the materials would be used. Since this was a baseline study, the team felt that the most appropriate approach in these schools would be to administer the Kasem instruments, though this ultimately led to overwhelming failure among the pupils on the screening exercise. In subsequent consultations with USAID and the NLTF, it has been clarified that these schools will neither necessarily receive Kasem NALAP materials, nor be expected to use Kasem as a medium of instruction to teach reading. Indeed, reports from the data collection teams and field supervisors indicated that in the schools that were identified as Kasem, the children did not speak or understand Kasem and in most cases, no Ghanaian language instruction was taking place. In some schools, the other, non‐official, Ghanaian languages mentioned above were being used. This is evidence of the challenge of implementing a local language literacy program that does not necessarily provide for the first language, or even community dominant language, for some populations of children. Even in the schools that were designated as Kasem schools by their DEOs, a designation which was subsequently confirmed with the head teachers, only one pupil from the two schools passed the screening exercise (the other two pupils to pass the screening exercise were both from the private schools). Due to these difficulties, for the purposes of this assessment, all 13 Kasem schools and 383 pupils have been removed from the pupil assessment analysis. The Nzema testing faced different, but equally problematic, challenges in terms of utilizing the data to analyze the test and determine cut scores. For the overall assessment, a total of four Nzema schools were sampled, which was expected to produce a sample of 120 pupils, below what was needed to carry out the test analysis
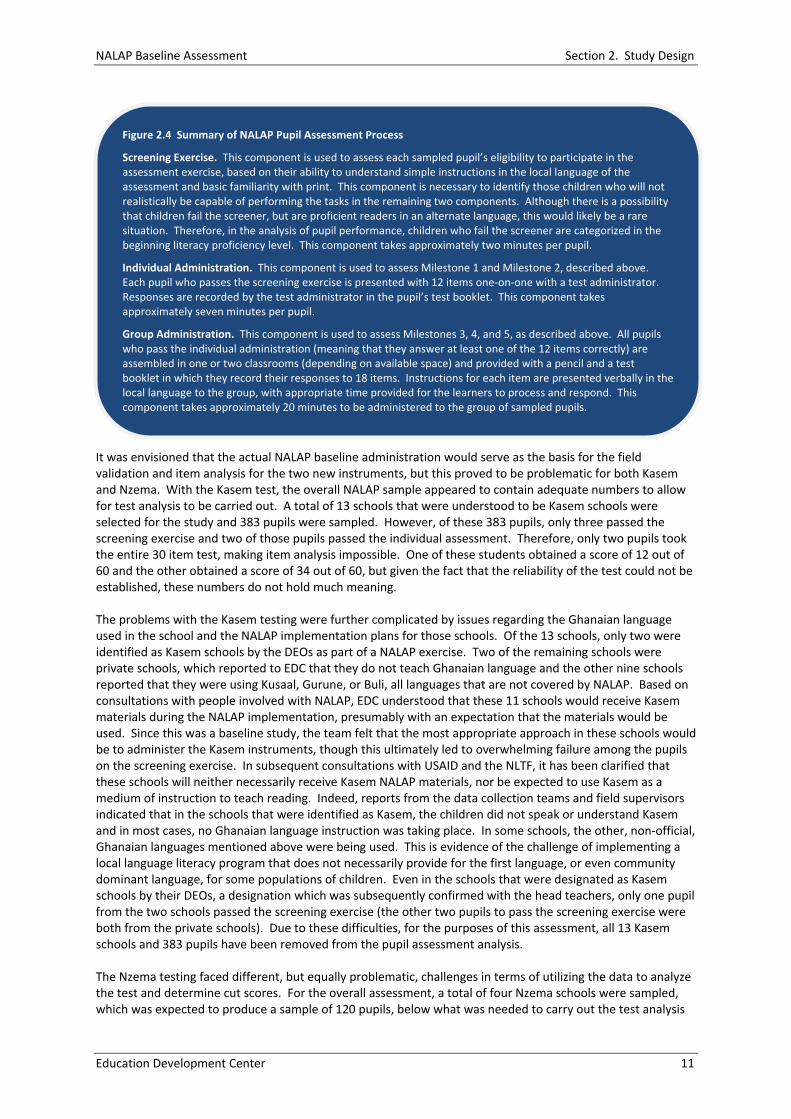
Figure 2.4 Summary of NALAP Pupil Assessment Process
Screening Exercise. This component is used to assess each sampled pupil’s eligibility to participate in the assessment exercise, based on their ability to understand simple instructions in the local language of the assessment and basic familiarity with print. This component is necessary to identify those children who will not realistically be capable of performing the tasks in the remaining two components. Although there is a possibility that children fail the screener, but are proficient readers in an alternate language, this would likely be a rare situation. Therefore, in the analysis of pupil performance, children who fail the screener are categorized in the beginning literacy proficiency level. This component takes approximately two minutes per pupil.
Individual Administration. This component is used to assess Milestone 1 and Milestone 2, described above. Each pupil who passes the screening exercise is presented with 12 items one‐on‐one with a test administrator. Responses are recorded by the test administrator in the pupil’s test booklet. This component takes approximately seven minutes per pupil.
Group Administration. This component is used to assess Milestones 3, 4, and 5, as described above. All pupils who pass the individual administration (meaning that they answer at least one of the 12 items correctly) are assembled in one or two classrooms (depending on available space) and provided with a pencil and a test booklet in which they record their responses to 18 items. Instructions for each item are presented verbally in the local language to the group, with appropriate time provided for the learners to process and respond. This component takes approximately 20 minutes to be administered to the group of sampled pupils.
NALAP Baseline Assessment Section 2. Study Design
Education Development Center 12
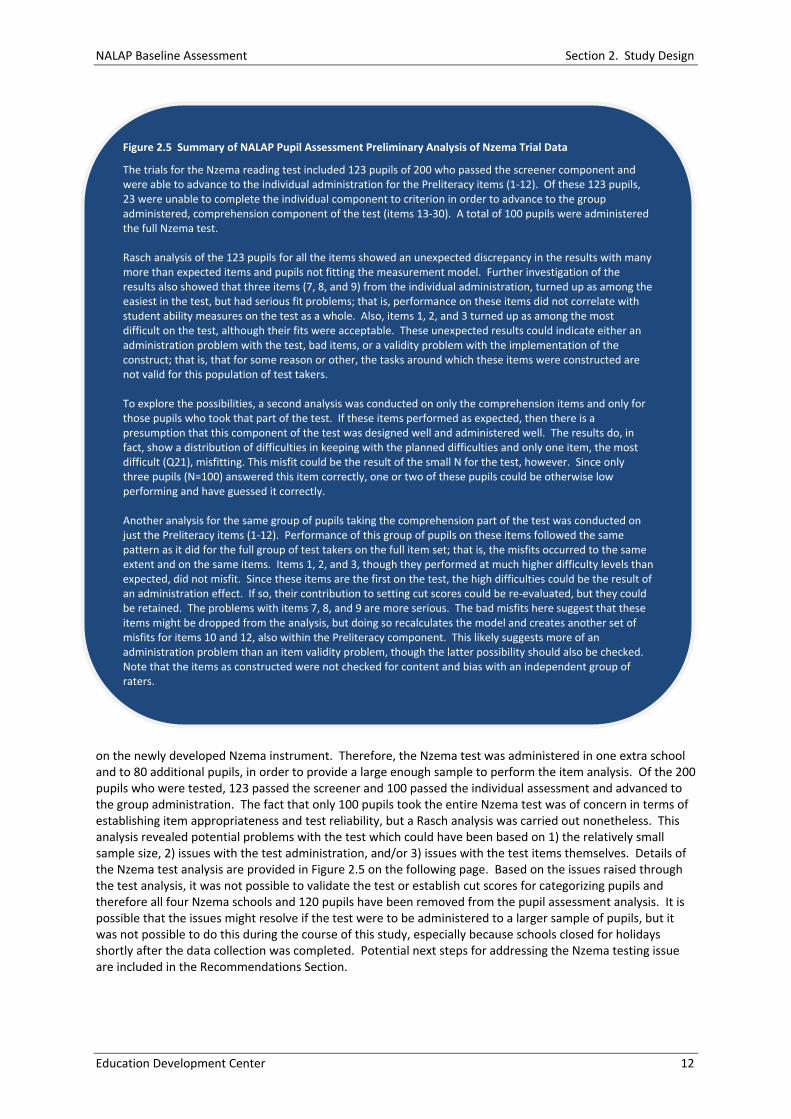
on the newly developed Nzema instrument. Therefore, the Nzema test was administered in one extra school and to 80 additional pupils, in order to provide a large enough sample to perform the item analysis. Of the 200 pupils who were tested, 123 passed the screener and 100 passed the individual assessment and advanced to the group administration. The fact that only 100 pupils took the entire Nzema test was of concern in terms of establishing item appropriateness and test reliability, but a Rasch analysis was carried out nonetheless. This analysis revealed potential problems with the test which could have been based on 1) the relatively small sample size, 2) issues with the test administration, and/or 3) issues with the test items themselves. Details of the Nzema test analysis are provided in Figure 2.5 on the following page. Based on the issues raised through the test analysis, it was not possible to validate the test or establish cut scores for categorizing pupils and therefore all four Nzema schools and 120 pupils have been removed from the pupil assessment analysis. It is possible that the issues might resolve if the test were to be administered to a larger sample of pupils, but it was not possible to do this during the course of this study, especially because schools closed for holidays shortly after the data collection was completed. Potential next steps for addressing the Nzema testing issue are included in the Recommendations Section.
Figure 2.5 Summary of NALAP Pupil Assessment Preliminary Analysis of Nzema Trial Data
The trials for the Nzema reading test included 123 pupils of 200 who passed the screener component and were able to advance to the individual administration for the Preliteracy items (1‐12). Of these 123 pupils, 23 were unable to complete the individual component to criterion in order to advance to the group administered, comprehension component of the test (items 13‐30). A total of 100 pupils were administered the full Nzema test. Rasch analysis of the 123 pupils for all the items showed an unexpected discrepancy in the results with many more than expected items and pupils not fitting the measurement model. Further investigation of the results also showed that three items (7, 8, and 9) from the individual administration, turned up as among the easiest in the test, but had serious fit problems; that is, performance on these items did not correlate with student ability measures on the test as a whole. Also, items 1, 2, and 3 turned up as among the most difficult on the test, although their fits were acceptable. These unexpected results could indicate either an administration problem with the test, bad items, or a validity problem with the implementation of the construct; that is, that for some reason or other, the tasks around which these items were constructed are not valid for this population of test takers. To explore the possibilities, a second analysis was conducted on only the comprehension items and only for those pupils who took that part of the test. If these items performed as expected, then there is a presumption that this component of the test was designed well and administered well. The results do, in fact, show a distribution of difficulties in keeping with the planned difficulties and only one item, the most difficult (Q21), misfitting. This misfit could be the result of the small N for the test, however. Since only three pupils (N=100) answered this item correctly, one or two of these pupils could be otherwise low performing and have guessed it correctly. Another analysis for the same group of pupils taking the comprehension part of the test was conducted on just the Preliteracy items (1‐12). Performance of this group of pupils on these items followed the same pattern as it did for the full group of test takers on the full item set; that is, the misfits occurred to the same extent and on the same items. Items 1, 2, and 3, though they performed at much higher difficulty levels than expected, did not misfit. Since these items are the first on the test, the high difficulties could be the result of an administration effect. If so, their contribution to setting cut scores could be re‐evaluated, but they could be retained. The problems with items 7, 8, and 9 are more serious. The bad misfits here suggest that these items might be dropped from the analysis, but doing so recalculates the model and creates another set of misfits for items 10 and 12, also within the Preliteracy component. This likely suggests more of an administration problem than an item validity problem, though the latter possibility should also be checked. Note that the items as constructed were not checked for content and bias with an independent group of raters.
NALAP Baseline Assessment Section 2. Study Design
Education Development Center 13
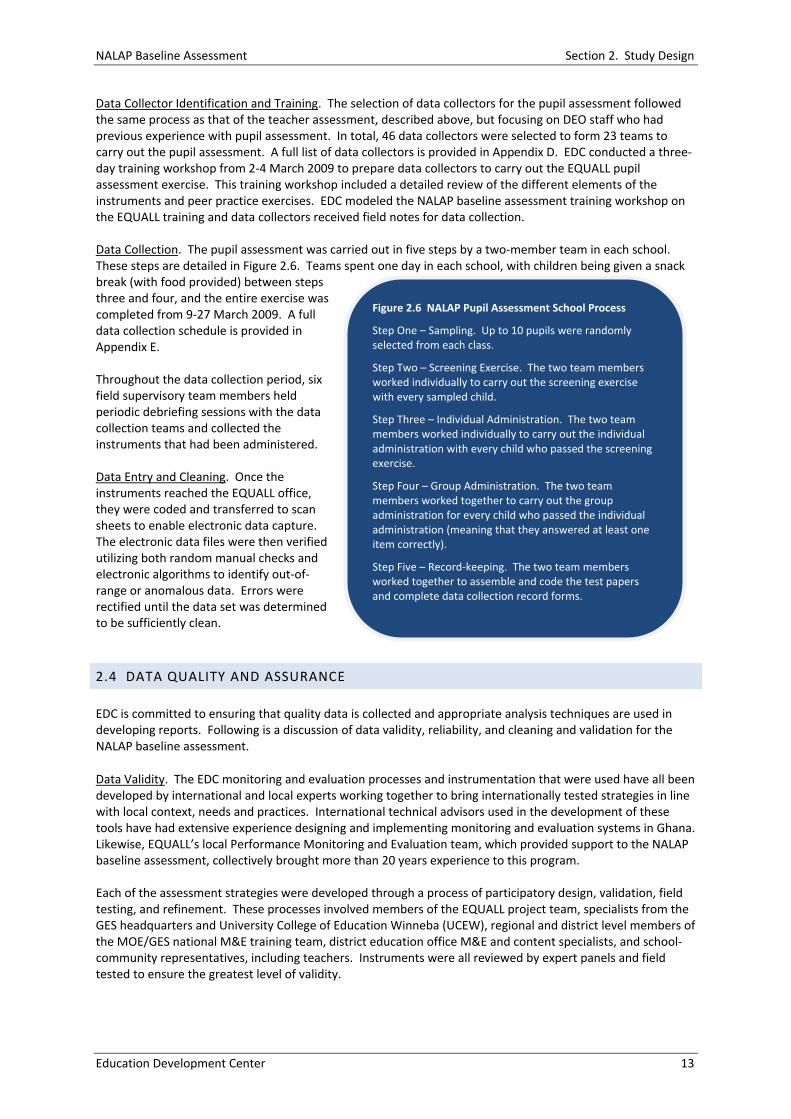
Data Collector Identification and Training. The selection of data collectors for the pupil assessment followed the same process as that of the teacher assessment, described above, but focusing on DEO staff who had previous experience with pupil assessment. In total, 46 data collectors were selected to form 23 teams to carry out the pupil assessment. A full list of data collectors is provided in Appendix D. EDC conducted a three‐day training workshop from 2‐4 March 2009 to prepare data collectors to carry out the EQUALL pupil assessment exercise. This training workshop included a detailed review of the different elements of the instruments and peer practice exercises. EDC modeled the NALAP baseline assessment training workshop on the EQUALL training and data collectors received field notes for data collection. Data Collection. The pupil assessment was carried out in five steps by a two‐member team in each school. These steps are detailed in Figure 2.6. Teams spent one day in each school, with children being given a snack break (with food provided) between steps three and four, and the entire exercise was completed from 9‐27 March 2009. A full data collection schedule is provided in Appendix E. Throughout the data collection period, six field supervisory team members held periodic debriefing sessions with the data collection teams and collected the instruments that had been administered. Data Entry and Cleaning. Once the instruments reached the EQUALL office, they were coded and transferred to scan sheets to enable electronic data capture. The electronic data files were then verified utilizing both random manual checks and electronic algorithms to identify out‐of‐range or anomalous data. Errors were rectified until the data set was determined to be sufficiently clean.
2.4 DATA QUALITY AND ASSURANCE EDC is committed to ensuring that quality data is collected and appropriate analysis techniques are used in developing reports. Following is a discussion of data validity, reliability, and cleaning and validation for the NALAP baseline assessment. Data Validity. The EDC monitoring and evaluation processes and instrumentation that were used have all been developed by international and local experts working together to bring internationally tested strategies in line with local context, needs and practices. International technical advisors used in the development of these tools have had extensive experience designing and implementing monitoring and evaluation systems in Ghana. Likewise, EQUALL’s local Performance Monitoring and Evaluation team, which provided support to the NALAP baseline assessment, collectively brought more than 20 years experience to this program. Each of the assessment strategies were developed through a process of participatory design, validation, field testing, and refinement. These processes involved members of the EQUALL project team, specialists from the GES headquarters and University College of Education Winneba (UCEW), regional and district level members of the MOE/GES national M&E training team, district education office M&E and content specialists, and school‐community representatives, including teachers. Instruments were all reviewed by expert panels and field tested to ensure the greatest level of validity.
Figure 2.6 NALAP Pupil Assessment School Process
Step One – Sampling. Up to 10 pupils were randomly selected from each class.
Step Two – Screening Exercise. The two team members worked individually to carry out the screening exercise with every sampled child.
Step Three – Individual Administration. The two team members worked individually to carry out the individual administration with every child who passed the screening exercise.
Step Four – Group Administration. The two team members worked together to carry out the group administration for every child who passed the individual administration (meaning that they answered at least one item correctly).
Step Five – Record‐keeping. The two team members worked together to assemble and code the test papers and complete data collection record forms.
NALAP Baseline Assessment Section 2. Study Design
Education Development Center 14
Data Reliability. For the NALAP baseline assessment, EDC fielded teams of external data gatherers, including District Monitoring Assistants (DMAs) of the MOE/GES and district‐level MOE/GES officials from districts where EDC is currently implementing the EQUALL project. Over the past four years, EDC has assembled data collection teams from among these groups and involved as many of the ‘regulars’ as possible for this exercise, although new people had to be added in order to meet the number and language requirements for the data collection teams. As much as possible, the data collection teams were led by DMAs, who have received extensive training ranging from ten‐day comprehensive to one‐day refreshers related to data collection at least once, and sometimes twice, per year for more than the past eight years. In addition, they received 20 days of training and carried out extensive M&E training activities as part of the QUIPS/CSA M&E Capacity Building Program. The other DEO representatives were selected from those who have had extensive training on ‘indicator‐based’ qualitative data collection at the school‐community and district level through the M&E component of QUIPS/CSA. All members of the data collection teams, whether old or new, were provided with training on the instrumentation, including field practice, and were supervised during the data collection process. Data gatherers for school level data collection were selected and assigned to teams based on their proficiencies in the relevant local languages. Two raters were used for the teacher performance assessment, since this exercise required data collectors to make determinations based on the scales. As described above, the raters worked independently, and assigned ratings, and then came together to determine consensus scores. Raters were also required to record descriptive supporting information for all ratings and participate in debriefing sessions with EDC team members. Inter‐rater reliability was examined during the training exercises, where multiple data collectors, working simultaneously but independently, rated teacher performance for comparison and analysis. After the initial administration of each of the existing ERA instruments, the data was analyzed to obtain a reliability measure of the instrument. All nine of the instruments that were used in the NALAP baseline had been analyzed using the Rasch Model, producing Cronbach Alpha (KR‐20) measures of reliability ranging from .91 (Dagaare, Fante, and Ga) to .95 (Dagbani and Gonja). Each item on each instrument was also evaluated to determine its fit within the overall model. Out of 270 items across all nine tests, only one (Ga Item Nine) was found to be non‐performing and has subsequently been excluded from analyses, although it is still administered as part of the test. As is described above, there were issues with the analyses of the two newly developed tests in Nzema and Kasem and at this time, it has not been possible to compute measures of reliability for either test. For this reason, results of the pupil assessment for pupils tested in either Kasem or Nzema have not been included in the reported results. Data Cleaning and Validation. EDC employed several techniques for ensuring that data was collected, coded, electronically captured, and stored in efficient, accurate, and secure ways. For the teacher and pupil assessments, which each generated large volumes of data, a series of data quality procedures were carried out, including the development of detailed tracking sheets for the movement and manipulation of test papers and electronic files, double coding and entry procedures to minimize errors, random manual checks of electronic data files, and computer routines to identify anomalies.
2.5 LIMITATIONS OF THE STUDY The original scope of work for the NALAP baseline assessment was ambitious, but also constrained by several factors, including time, resources, and a need to design and implement a study that could be easily replicated. This led to numerous compromises in terms of the study design, which when combined with other factors related to assessment options and implementation challenges, produced limitations of the overall study related to sampling, data collector selection and training, teacher assessment, pupil assessment, language and learning, and replication. Sampling. In EDC’s experience with teacher and pupil assessment in Ghana, teacher and pupil absenteeism has been found to be a constraining factor in measuring performance. Teachers are often unavailable and not easily compelled to be available, thus limiting the sample. With the study design, EDC was able to assess only those teachers and pupils that were present on the day of assessment and this had some impact on the sample size and potentially the sampled population. There is a risk that poorer performing teachers or pupils
NALAP Baseline Assessment Section 2. Study Design
Education Development Center 15
may ‘stay away’, thus influencing the results. However, pupil and teacher absenteeism are common even in the absence of assessment, so it is difficult to accurately predict the effects. EDC does believe, however, that effects related to absenteeism are likely consistent from year to year, so the comparison of results throughout the long‐term NALAP evaluation should be valid. Also at issue with the sampling is the fact that four Nzema and 13 Kasem schools were excluded from the pupil assessment, for reasons stated above. Though likely not a substantial issue for Nzema, since it forms part of the Middle Zone, which is the largest, the impact of this is more serious in terms of the Kasem schools, which were all drawn from the Northern Zone, which is the smallest. The sampling frame for the NALAP baseline assessment was designed to be nationally representative and additionally representative of each zone. With the exclusion of the Kasem schools, the Northern Zone is now likely underrepresented in the national results, which likely inflated the national pupil results. Likewise, the Northern Zone sample may also be overestimating literacy rates, particularly since the Kasem areas are among those that face the most difficult challenges when it comes to local language instruction. Data Collector Selection and Training. The final NALAP baseline assessment design called for data collectors to be exclusively selected from District Education Offices (DEOs) across the country, rather than utilizing a combination of university students and DEO staff, as EDC has done on the EQUALL project. This decision was made to both contain costs and establish a stronger GES base of trained administrators of both the teacher and pupil assessment instruments. Another cost saving measure that was employed was to reduce the training period for the data collectors from five days to three days. In combination, there is some concern that these modifications may have had implications for the study. Confusion among one of the data collection teams led to the deletion of eight teachers from the sample, as is described in Section 2.1. Pupil test administration issues have also been identified as possible factors in the Nzema test administration leading to the need to exclude the Nzema schools from the pupil assessment analysis. Reports from field supervisors further indicated generally lower levels of data collector performance than has been experienced with the EQUALL data collection processes. Teacher Assessment. While ideally EDC, and probably the National Literacy Task Force (NLTF), would have liked to have obtained measures of teacher ‘practice’, meaning what they are doing in their classrooms on a day‐to‐day basis, it is really only practical to obtain measures of teacher ‘ability’, meaning how they are able to perform during a scheduled observation. In order to maintain a positive environment around assessment, it is advisable to inform schools and teachers prior to data collection activities. This gives the teacher the opportunity to prepare, perhaps more than usual, for the lesson that will be observed. Teachers also are inclined to put forth their best effort when being observed, which may be better than the average day. These factors can inflate the results, but this is very common in measuring teacher performance, and teacher assessment experts feel that knowing what a teacher is able to do is critical to assessing performance. Pupil Assessment. NALAP is a bilingual transitional literacy program, but the NALAP baseline assessment focused on only Ghanaian language literacy. This is partly due to the fact that the GES, through the Basic Education Comprehensive Assessment System (BECAS), has national tests in place to measure English competencies at the P2, P3, P4, and P6 levels. However, the NALAP baseline assessment was not coordinated with these tests, either in terms of timing or sampling, so there is no ability to observe relationships between Ghanaian language and English language literacy proficiencies from this dataset. In addition, based on observations that Ghanaian languages are not being used as either a medium of instruction or to teach reading in many schools, it is possible that the NALAP baseline pupil assessment could have failed to recognize literacy skills among pupils that may have developed in English rather than the local language. The pupil assessment strategy was also limited to assessing only the students’ reading proficiency, not their writing proficiency. There were several reasons motivating the decision not to test writing, some bearing on the time available to develop and score a reliable instrument and others bearing on the issue of the developmental relationship between reading and writing. It is widely acknowledged by language learning specialists that reading, as a receptive skill, precedes writing as a productive skill, in parallel to the relationship between receptive listening skills and productive speaking skills. In other words, it is the expectation that the attainment of reading skills precedes and facilitates the attainment of writing skills. There is likewise the practical issue that the assessment of writing takes longer to administer than does the assessment of receptive skills. The reading assessment alone is likely at the time limit for testing pupils without introducing validity
NALAP Baseline Assessment Section 2. Study Design
Education Development Center 16
threats due to fatigue and attention span. The usual procedure, especially for very young children, is to break up a long assessment into separate testing episodes, which was not feasible given the expected timeframe of the activity. Last, even though writing assessment items may take relatively little time to develop, they require much more time and many more resources in order to score reliably. Language and Learning. The teaching of prescribed Ghanaian languages and the use of Ghanaian language as a medium of instruction proved to be a considerable hindering factor in the NALAP baseline assessment, both in terms of teacher and learner performance. In addition to constraining this study, these findings also present significant implications for the implementation of NALAP. As part of the teacher assessment, EDC attempted to collect data on language of instruction being used in the schools against teacher background and competency in that language. This was done by adding an additional page to the COI demographics section. Though there seem to have been issues with the accurate administration of this portion of the instrument, interesting information still emerged. In 12 of the 89 schools sampled for the teacher assessment (excluding the mis‐designated Kasem schools), the teachers reported that either the Ghanaian language used in the school was different from that designated by the GES or that the school was not using a Ghanaian language at all, usually due to the fact that their learner population did not match one of the 11 official languages. Two of the 12 schools were private schools and 10 were public schools. Of the 10 public schools, three were designated as Akwapim Twi, three were designated as Asante Twi, one as Dagaare, two as Dagbani, and one as Ewe. These issues led to the deletion of 10 teachers from the study, as was detailed in Section 2.1. Even in schools which were using the prescribed Ghanaian language, teacher competencies in that language, based on self‐reports, were low. Of the 247 teachers assessed, 211 reported that the school was using the Ghanaian language designated by the GES. Out of the 211, 80% rated themselves as ‘good’ in terms of understanding the language, 77% rated themselves as ‘good’ at speaking the language, 68% rated themselves as ‘good’ at reading the language, and 65% rated themselves as ‘good’ at writing the language. This represents considerably better results than were obtained in the teacher capacity survey, most likely due to the fact that this was a self assessment while the teacher capacity survey included an external assessment, but still indicates that as many as a third of teachers in lower primary classrooms were not proficient in reading or writing the Ghanaian language to be implemented with NALAP. Inconsistencies in practice regarding language of instruction for English and Ghanaian language subjects also created issues for standardizing classroom observation administration and for rating elements 4.6 Oral and Written Communication in Ghanaian language and 4.7 Oral and Written Communication in English. As is described above, the most flexible approach to determining the subject and language of instruction to be observed was used in order to maximize the sample, but this required reducing the number of elements on the instrument by combining elements 4.6 and 4.7. It should also be noted that there was considerable variation between what language teachers said that they intended to use prior to the lesson and the language actually used during the lesson. Once NALAP, with its highly scripted teacher guides that explicitly guide the language of instruction, is introduced, it is assumed that these issues will be resolved, but that raises additional questions as to how to analyze the data sets and compare results between baseline and impact in future years. Finally, the pupil assessment revealed alarmingly low levels of learner ability to understand the designated language of instruction in the school. In four Dagbani schools, every sampled learner failed the screening exercise. In 54 of the 205 schools (26%) that were included in the pupil assessment analysis (excluding Kasem and Nzema), more than half of the sampled pupils failed the screening exercise. These results suggest that in more than a quarter of primary schools, large percentages of pupils are either unable to understand basic instructions in the Ghanaian language being used in the school and/or have no basic familiarity with print. This is particularly problematic for NALAP implementation given that the program will be implemented in P1‐P3 simultaneously, despite the fact that it cannot be assumed that children in P2 or P3 have obtained any basic local language literacy skills. Replication. The last, but perhaps most critical, issue with the NALAP baseline study design relates to the practicality and future utilization of the approach. The original scope of work called for ‘easy to use and replicate, yet robust and meaningful’ assessment instruments for both teacher and pupil performance, while at the same time detailing a series of technical expectations of what the instruments and associated processes
NALAP Baseline Assessment Section 2. Study Design
Education Development Center 17
would provide. EDC believes that there is somewhat of a disconnect between these two requirements, as assessment systems that provide high quality, robust, qualitative and quantitative data that can be used to measure a wide range of skills and provide detailed input to ongoing program design are generally complex and require substantial resources, both technical and financial, to implement. EDC implemented an approach for the baseline assessment that met the technical requirements detailed in the SOW and subsequent feedback from USAID and believes that the implementation of this approach has produced valuable information to both USAID and NALAP at the baseline stage. However, EDC would recommend that USAID and the GES consider adopting a more streamlined and simplistic approach to pupil assessment for later stages of the evaluation. There are currently several literacy assessment strategies, including the Wide Range Achievement Test (WRAT) and components of the Early Grade Reading Assessment (EGRA) that are relatively simple to administer but have been proven to be strong predictors of future reading ability, including comprehension. The application of such approaches is discussed in more detail in the Recommendations section below.

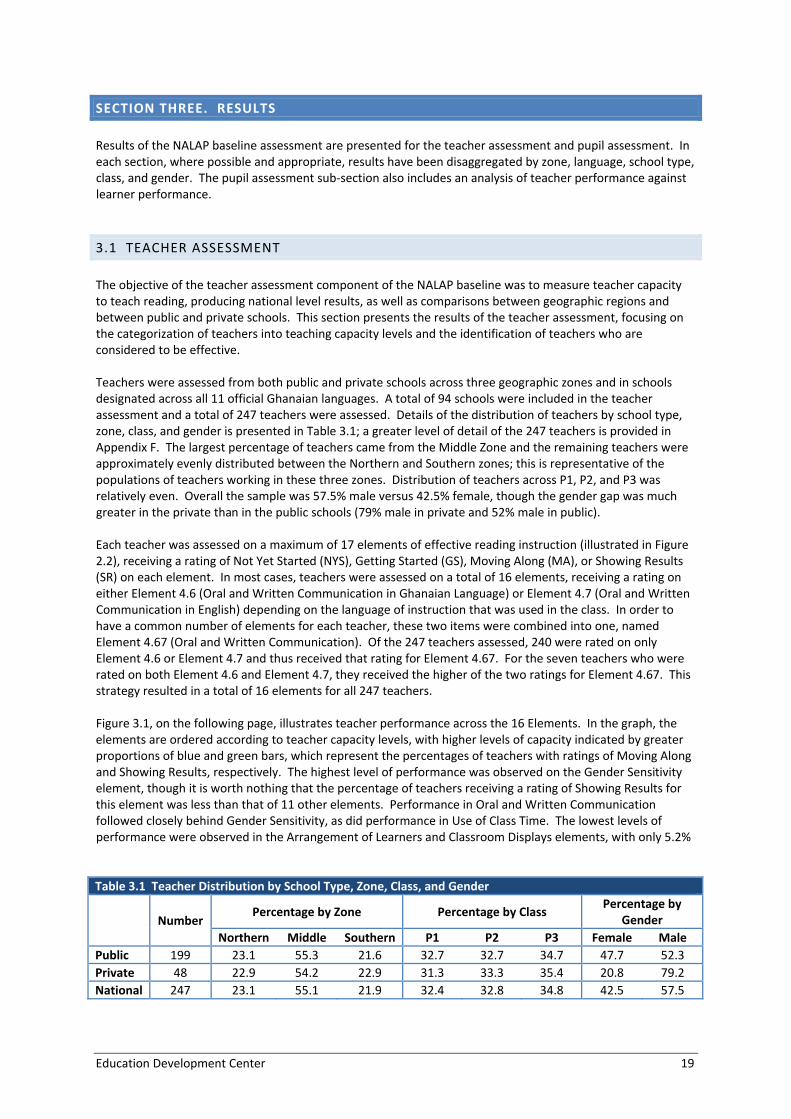
Education Development Center 19
SECTION THREE. RESULTS
Results of the NALAP baseline assessment are presented for the teacher assessment and pupil assessment. In each section, where possible and appropriate, results have been disaggregated by zone, language, school type, class, and gender. The pupil assessment sub‐section also includes an analysis of teacher performance against learner performance.
3.1 TEACHER ASSESSMENT The objective of the teacher assessment component of the NALAP baseline was to measure teacher capacity to teach reading, producing national level results, as well as comparisons between geographic regions and between public and private schools. This section presents the results of the teacher assessment, focusing on the categorization of teachers into teaching capacity levels and the identification of teachers who are considered to be effective. Teachers were assessed from both public and private schools across three geographic zones and in schools designated across all 11 official Ghanaian languages. A total of 94 schools were included in the teacher assessment and a total of 247 teachers were assessed. Details of the distribution of teachers by school type, zone, class, and gender is presented in Table 3.1; a greater level of detail of the 247 teachers is provided in Appendix F. The largest percentage of teachers came from the Middle Zone and the remaining teachers were approximately evenly distributed between the Northern and Southern zones; this is representative of the populations of teachers working in these three zones. Distribution of teachers across P1, P2, and P3 was relatively even. Overall the sample was 57.5% male versus 42.5% female, though the gender gap was much greater in the private than in the public schools (79% male in private and 52% male in public). Each teacher was assessed on a maximum of 17 elements of effective reading instruction (illustrated in Figure 2.2), receiving a rating of Not Yet Started (NYS), Getting Started (GS), Moving Along (MA), or Showing Results (SR) on each element. In most cases, teachers were assessed on a total of 16 elements, receiving a rating on either Element 4.6 (Oral and Written Communication in Ghanaian Language) or Element 4.7 (Oral and Written Communication in English) depending on the language of instruction that was used in the class. In order to have a common number of elements for each teacher, these two items were combined into one, named Element 4.67 (Oral and Written Communication). Of the 247 teachers assessed, 240 were rated on only Element 4.6 or Element 4.7 and thus received that rating for Element 4.67. For the seven teachers who were rated on both Element 4.6 and Element 4.7, they received the higher of the two ratings for Element 4.67. This strategy resulted in a total of 16 elements for all 247 teachers. Figure 3.1, on the following page, illustrates teacher performance across the 16 Elements. In the graph, the elements are ordered according to teacher capacity levels, with higher levels of capacity indicated by greater proportions of blue and green bars, which represent the percentages of teachers with ratings of Moving Along and Showing Results, respectively. The highest level of performance was observed on the Gender Sensitivity element, though it is worth nothing that the percentage of teachers receiving a rating of Showing Results for this element was less than that of 11 other elements. Performance in Oral and Written Communication followed closely behind Gender Sensitivity, as did performance in Use of Class Time. The lowest levels of performance were observed in the Arrangement of Learners and Classroom Displays elements, with only 5.2%
Table 3.1 Teacher Distribution by School Type, Zone, Class, and Gender
Number Percentage by Zone Percentage by Class
Percentage by Gender
Northern Middle Southern P1 P2 P3 Female MalePublic 199 23.1 55.3 21.6 32.7 32.7 34.7 47.7 52.3Private 48 22.9 54.2 22.9 31.3 33.3 35.4 20.8 79.2National 247 23.1 55.1 21.9 32.4 32.8 34.8 42.5 57.5
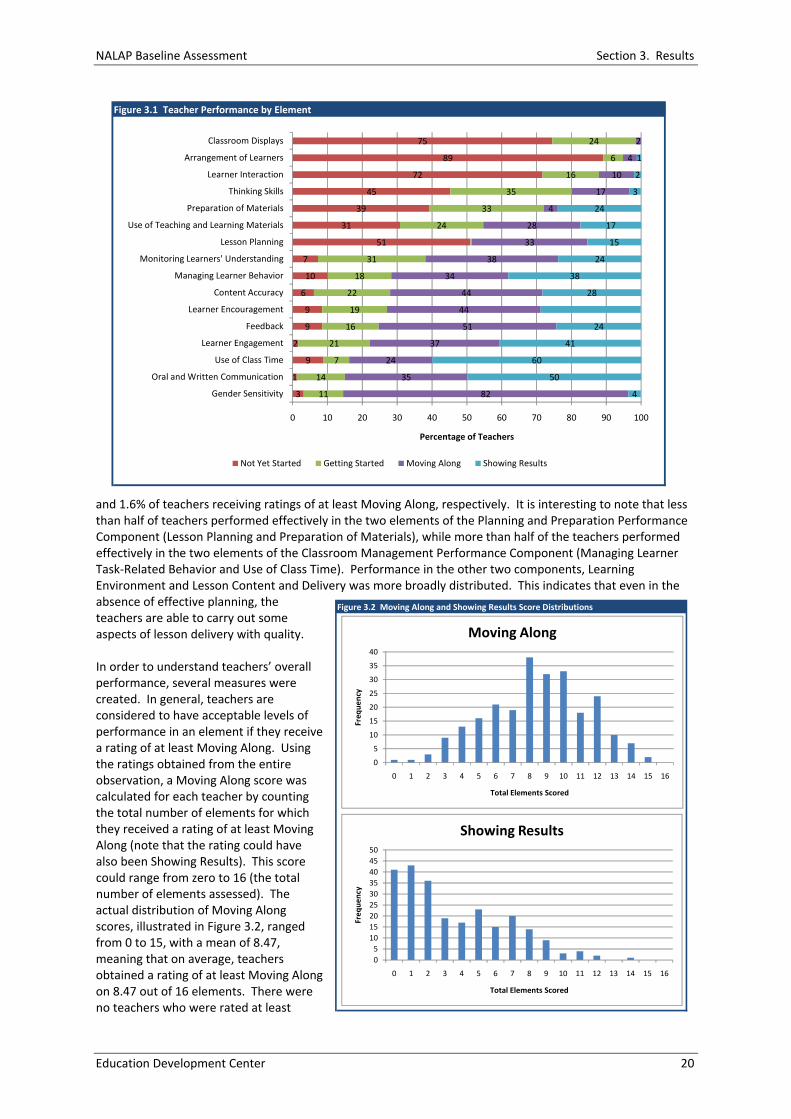
NALAP Baseline Assessment Section 3. Results
Education Development Center 20
and 1.6% of teachers receiving ratings of at least Moving Along, respectively. It is interesting to note that less than half of teachers performed effectively in the two elements of the Planning and Preparation Performance Component (Lesson Planning and Preparation of Materials), while more than half of the teachers performed effectively in the two elements of the Classroom Management Performance Component (Managing Learner Task‐Related Behavior and Use of Class Time). Performance in the other two components, Learning Environment and Lesson Content and Delivery was more broadly distributed. This indicates that even in the absence of effective planning, the teachers are able to carry out some aspects of lesson delivery with quality. In order to understand teachers’ overall performance, several measures were created. In general, teachers are considered to have acceptable levels of performance in an element if they receive a rating of at least Moving Along. Using the ratings obtained from the entire observation, a Moving Along score was calculated for each teacher by counting the total number of elements for which they received a rating of at least Moving Along (note that the rating could have also been Showing Results). This score could range from zero to 16 (the total number of elements assessed). The actual distribution of Moving Along scores, illustrated in Figure 3.2, ranged from 0 to 15, with a mean of 8.47, meaning that on average, teachers obtained a rating of at least Moving Along on 8.47 out of 16 elements. There were no teachers who were rated at least
Figure 3.2 Moving Along and Showing Results Score Distributions
0
5
10
15
20
25
30
35
40
0 1 2 3 4 5 6 7 8 9 10 11 12 13 14 15 16
Freq
uency
Total Elements Scored
Moving Along
05
101520253035404550
0 1 2 3 4 5 6 7 8 9 10 11 12 13 14 15 16
Freq
uency
Total Elements Scored
Showing Results
Figure 3.1 Teacher Performance by Element
82
35
24
37
51
44
44
34
38
33
28
4
17
10
4
2
4
50
60
41
24
28
38
24
15
17
24
3
2
1
3
1
9
2
9
9
6
10
7
51
31
39
45
72
89
75
11
14
7
21
16
19
22
18
31
24
33
35
16
6
24
0 10 20 30 40 50 60 70 80 90 100
Gender Sensitivity
Oral and Written Communication
Use of Class Time
Learner Engagement
Feedback
Learner Encouragement
Content Accuracy
Managing Learner Behavior
Monitoring Learners' Understanding
Lesson Planning
Use of Teaching and Learning Materials
Preparation of Materials
Thinking Skills
Learner Interaction
Arrangement of Learners
Classroom Displays
Percentage of Teachers
Not Yet Started Getting Started Moving Along Showing Results
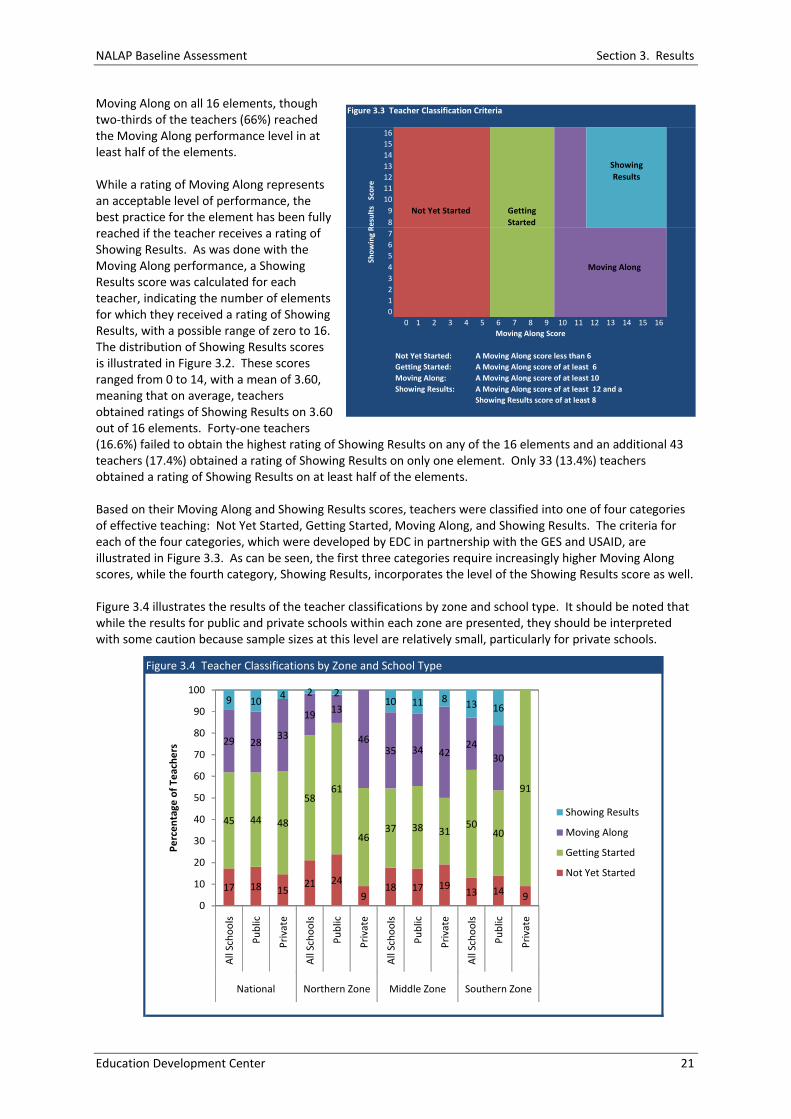
NALAP Baseline Assessment Section 3. Results
Education Development Center 21
Moving Along on all 16 elements, though two‐thirds of the teachers (66%) reached the Moving Along performance level in at least half of the elements. While a rating of Moving Along represents an acceptable level of performance, the best practice for the element has been fully reached if the teacher receives a rating of Showing Results. As was done with the Moving Along performance, a Showing Results score was calculated for each teacher, indicating the number of elements for which they received a rating of Showing Results, with a possible range of zero to 16. The distribution of Showing Results scores is illustrated in Figure 3.2. These scores ranged from 0 to 14, with a mean of 3.60, meaning that on average, teachers obtained ratings of Showing Results on 3.60 out of 16 elements. Forty‐one teachers (16.6%) failed to obtain the highest rating of Showing Results on any of the 16 elements and an additional 43 teachers (17.4%) obtained a rating of Showing Results on only one element. Only 33 (13.4%) teachers obtained a rating of Showing Results on at least half of the elements. Based on their Moving Along and Showing Results scores, teachers were classified into one of four categories of effective teaching: Not Yet Started, Getting Started, Moving Along, and Showing Results. The criteria for each of the four categories, which were developed by EDC in partnership with the GES and USAID, are illustrated in Figure 3.3. As can be seen, the first three categories require increasingly higher Moving Along scores, while the fourth category, Showing Results, incorporates the level of the Showing Results score as well. Figure 3.4 illustrates the results of the teacher classifications by zone and school type. It should be noted that while the results for public and private schools within each zone are presented, they should be interpreted with some caution because sample sizes at this level are relatively small, particularly for private schools.
Figure 3.3 Teacher Classification Criteria
161514131211109 Not Yet Started Getting8 Started7654 Moving Along3210
0 1 2 3 4 5 6 7 8 9 10 11 12 13 14 15 16
Not Yet Started: A Moving Along score less than 6Getting Started: A Moving Along score of at least 6Moving Along: A Moving Along score of at least 10Showing Results: A Moving Along score of at least 12 and a
Showing Results score of at least 8
Show
ing Re
sults Score
Showing Results
Moving Along Score
Figure 3.4 Teacher Classifications by Zone and School Type
17 18 1521 24
918 17 19
13 14 9
45 44 48
5861
4637 38 31
5040
91
9 104 2 2
10 11 8 13 16
29 2833
19 13
4635 34 42
2430
0
10
20
30
40
50
60
70
80
90
100
All Scho
ols
Public
Private
All Scho
ols
Public
Private
All Scho
ols
Public
Private
All Scho
ols
Public
Private
National Northern Zone Middle Zone Southern Zone
Percen
tage
of T
eachers
Showing Results
Moving Along
Getting Started
Not Yet Started
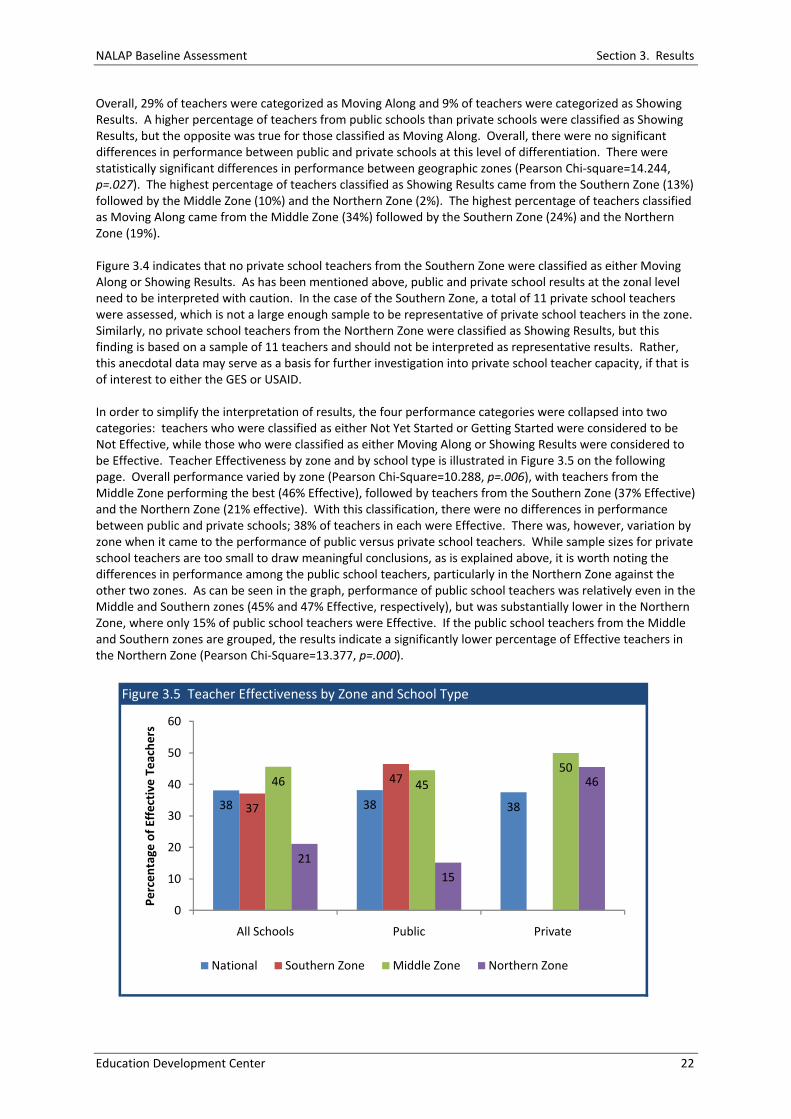
NALAP Baseline Assessment Section 3. Results
Education Development Center 22
Overall, 29% of teachers were categorized as Moving Along and 9% of teachers were categorized as Showing Results. A higher percentage of teachers from public schools than private schools were classified as Showing Results, but the opposite was true for those classified as Moving Along. Overall, there were no significant differences in performance between public and private schools at this level of differentiation. There were statistically significant differences in performance between geographic zones (Pearson Chi‐square=14.244, p=.027). The highest percentage of teachers classified as Showing Results came from the Southern Zone (13%) followed by the Middle Zone (10%) and the Northern Zone (2%). The highest percentage of teachers classified as Moving Along came from the Middle Zone (34%) followed by the Southern Zone (24%) and the Northern Zone (19%). Figure 3.4 indicates that no private school teachers from the Southern Zone were classified as either Moving Along or Showing Results. As has been mentioned above, public and private school results at the zonal level need to be interpreted with caution. In the case of the Southern Zone, a total of 11 private school teachers were assessed, which is not a large enough sample to be representative of private school teachers in the zone. Similarly, no private school teachers from the Northern Zone were classified as Showing Results, but this finding is based on a sample of 11 teachers and should not be interpreted as representative results. Rather, this anecdotal data may serve as a basis for further investigation into private school teacher capacity, if that is of interest to either the GES or USAID. In order to simplify the interpretation of results, the four performance categories were collapsed into two categories: teachers who were classified as either Not Yet Started or Getting Started were considered to be Not Effective, while those who were classified as either Moving Along or Showing Results were considered to be Effective. Teacher Effectiveness by zone and by school type is illustrated in Figure 3.5 on the following page. Overall performance varied by zone (Pearson Chi‐Square=10.288, p=.006), with teachers from the Middle Zone performing the best (46% Effective), followed by teachers from the Southern Zone (37% Effective) and the Northern Zone (21% effective). With this classification, there were no differences in performance between public and private schools; 38% of teachers in each were Effective. There was, however, variation by zone when it came to the performance of public versus private school teachers. While sample sizes for private school teachers are too small to draw meaningful conclusions, as is explained above, it is worth noting the differences in performance among the public school teachers, particularly in the Northern Zone against the other two zones. As can be seen in the graph, performance of public school teachers was relatively even in the Middle and Southern zones (45% and 47% Effective, respectively), but was substantially lower in the Northern Zone, where only 15% of public school teachers were Effective. If the public school teachers from the Middle and Southern zones are grouped, the results indicate a significantly lower percentage of Effective teachers in the Northern Zone (Pearson Chi‐Square=13.377, p=.000).
Figure 3.5 Teacher Effectiveness by Zone and School Type
38 38 3837
4746 4550
2115
46
0
10
20
30
40
50
60
All Schools Public Private
Percen
tage
of E
ffective
Teachers
National Southern Zone Middle Zone Northern Zone

NALAP Baseline Assessment Section 3. Results
Education Development Center 23
In each school, available teachers from all three lower primary classes were assessed. Figure 3.6 illustrates teacher effectiveness by zone and class. Though a lower percentage of P3 teachers were classified as effective (35% for P3 versus 40% for both P1 and P2), there were no statistically significant differences in performance by class. Again, though nationally there was little variation in results by class, the percentage of effective teachers by class in each zone demonstrated more variability, though the sample sizes at this level are too small to establish significant differences in performance. Results by gender are illustrated in Figure 3.7. Overall, female teachers performed better than male teachers (Pearson Chi‐square=4.543, p=.033), with 46% of female teachers classified as effective against 32% of male teachers, though this trend only held in a meaningful way in the Southern Zone, where 55% of female teachers were Effective compared to 16% of male teachers. Performance of female and male teachers was essentially the same in the Northern Zone (22% versus 21%) and only slightly different in the Middle Zone (48% versus 44%). As illustrated in Table 3.1, male teachers outnumbered female teachers, making up 57%% of the sample. During the data collection, teachers were asked to report their educational qualification level across nine categories. Using this information, 241 of the 247 teachers were classified as either Qualified (Certificate A 4‐Year, Certificate A Post Secondary, Diploma in Basic Education) or Not Qualified (MSLC/BECE, Tech/Vocational, O Level/SSCE, A Level) teachers15. Figure 3.8 illustrates teacher performance by qualification. Qualified teachers performed significantly better than Not qualified teachers (54% vs. 25%; Pearson Chi‐Square=21.115, p=.000) and this trend held in the Middle and Southern zones, with the larger disparity in performance in the Southern Zone, where 57% of Qualified teachers were considered to be effective against 13% of Not Qualified teachers. In the Northern Zone, a higher percentage of Not Qualified teachers were
15 Of the six remaining teachers, one reported HND, three reported Degree, and two reported Other. These teachers were left out of these calculations because it was not possible to determine whether or not they were qualified teachers.
Figure 3.6 Teacher Effectiveness by Zone and Class
40 4035
21
11
30
4751
3944
39
30
0
10
20
30
40
50
60
P1 P2 P3 P1 P2 P3 P1 P2 P3 P1 P2 P3
National Northern Zone Middle Zone Southern Zone
Percen
tage
of E
ffective
Teachers
Figure 3.7 Teacher Effectiveness by Zone and Gender
46
32
22 21
4844
55
16
0
10
20
30
40
50
60
Female Male Female Male Female Male Female Male
National Northern Zone Middle Zone Southern Zone
Percen
tage
of E
ffective
Teachers
Figure 3.8 Teacher Effectiveness by Zone and Qualification
25
54
23
8
31
62
13
57
0
10
20
30
40
50
60
70
Not Qualified
Qualified Not Qualified
Qualified Not Qualified
Qualified Not Qualified
Qualified
National Northern Zone Middle Zone Southern Zone
Percen
tage
of E
ffective
Teachers
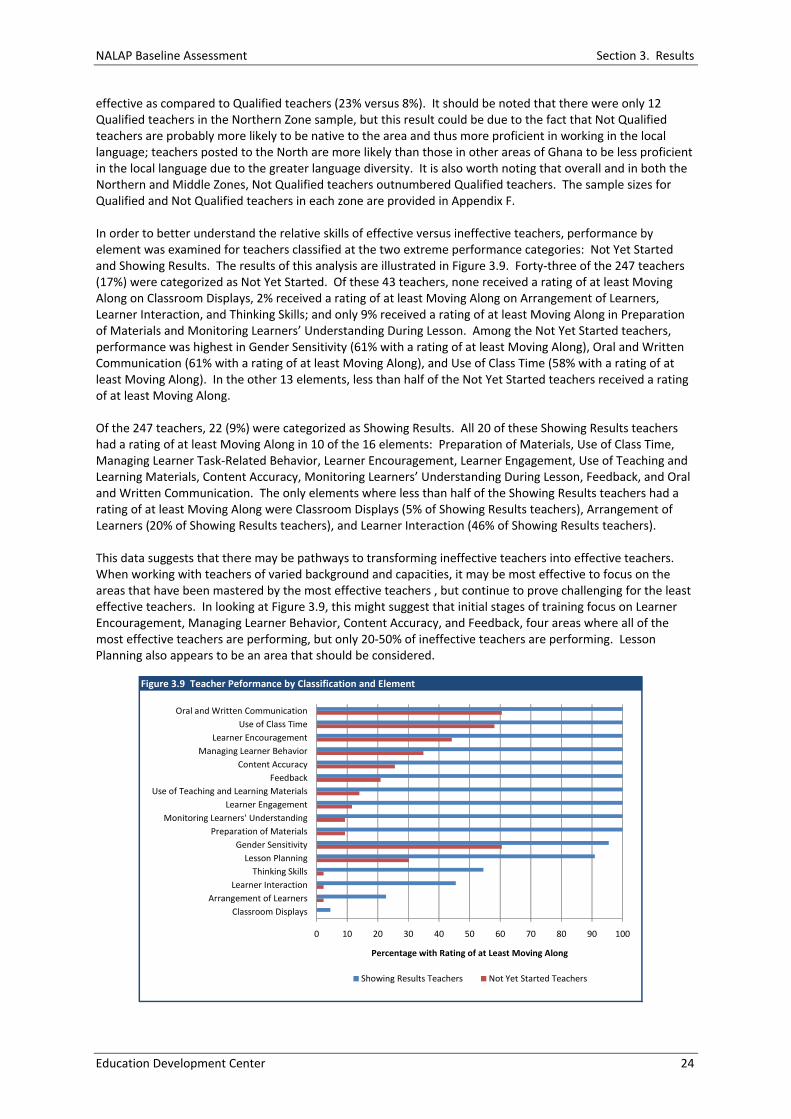
NALAP Baseline Assessment Section 3. Results
Education Development Center 24
effective as compared to Qualified teachers (23% versus 8%). It should be noted that there were only 12 Qualified teachers in the Northern Zone sample, but this result could be due to the fact that Not Qualified teachers are probably more likely to be native to the area and thus more proficient in working in the local language; teachers posted to the North are more likely than those in other areas of Ghana to be less proficient in the local language due to the greater language diversity. It is also worth noting that overall and in both the Northern and Middle Zones, Not Qualified teachers outnumbered Qualified teachers. The sample sizes for Qualified and Not Qualified teachers in each zone are provided in Appendix F.
In order to better understand the relative skills of effective versus ineffective teachers, performance by element was examined for teachers classified at the two extreme performance categories: Not Yet Started and Showing Results. The results of this analysis are illustrated in Figure 3.9. Forty‐three of the 247 teachers (17%) were categorized as Not Yet Started. Of these 43 teachers, none received a rating of at least Moving Along on Classroom Displays, 2% received a rating of at least Moving Along on Arrangement of Learners, Learner Interaction, and Thinking Skills; and only 9% received a rating of at least Moving Along in Preparation of Materials and Monitoring Learners’ Understanding During Lesson. Among the Not Yet Started teachers, performance was highest in Gender Sensitivity (61% with a rating of at least Moving Along), Oral and Written Communication (61% with a rating of at least Moving Along), and Use of Class Time (58% with a rating of at least Moving Along). In the other 13 elements, less than half of the Not Yet Started teachers received a rating of at least Moving Along. Of the 247 teachers, 22 (9%) were categorized as Showing Results. All 20 of these Showing Results teachers had a rating of at least Moving Along in 10 of the 16 elements: Preparation of Materials, Use of Class Time, Managing Learner Task‐Related Behavior, Learner Encouragement, Learner Engagement, Use of Teaching and Learning Materials, Content Accuracy, Monitoring Learners’ Understanding During Lesson, Feedback, and Oral and Written Communication. The only elements where less than half of the Showing Results teachers had a rating of at least Moving Along were Classroom Displays (5% of Showing Results teachers), Arrangement of Learners (20% of Showing Results teachers), and Learner Interaction (46% of Showing Results teachers). This data suggests that there may be pathways to transforming ineffective teachers into effective teachers. When working with teachers of varied background and capacities, it may be most effective to focus on the areas that have been mastered by the most effective teachers , but continue to prove challenging for the least effective teachers. In looking at Figure 3.9, this might suggest that initial stages of training focus on Learner Encouragement, Managing Learner Behavior, Content Accuracy, and Feedback, four areas where all of the most effective teachers are performing, but only 20‐50% of ineffective teachers are performing. Lesson Planning also appears to be an area that should be considered.
Figure 3.9 Teacher Peformance by Classification and Element
0 10 20 30 40 50 60 70 80 90 100
Classroom DisplaysArrangement of Learners
Learner InteractionThinking Skills
Lesson PlanningGender Sensitivity
Preparation of MaterialsMonitoring Learners' Understanding
Learner EngagementUse of Teaching and Learning Materials
FeedbackContent Accuracy
Managing Learner BehaviorLearner Encouragement
Use of Class TimeOral and Written Communication
Percentage with Rating of at Least Moving Along
Showing Results Teachers Not Yet Started Teachers
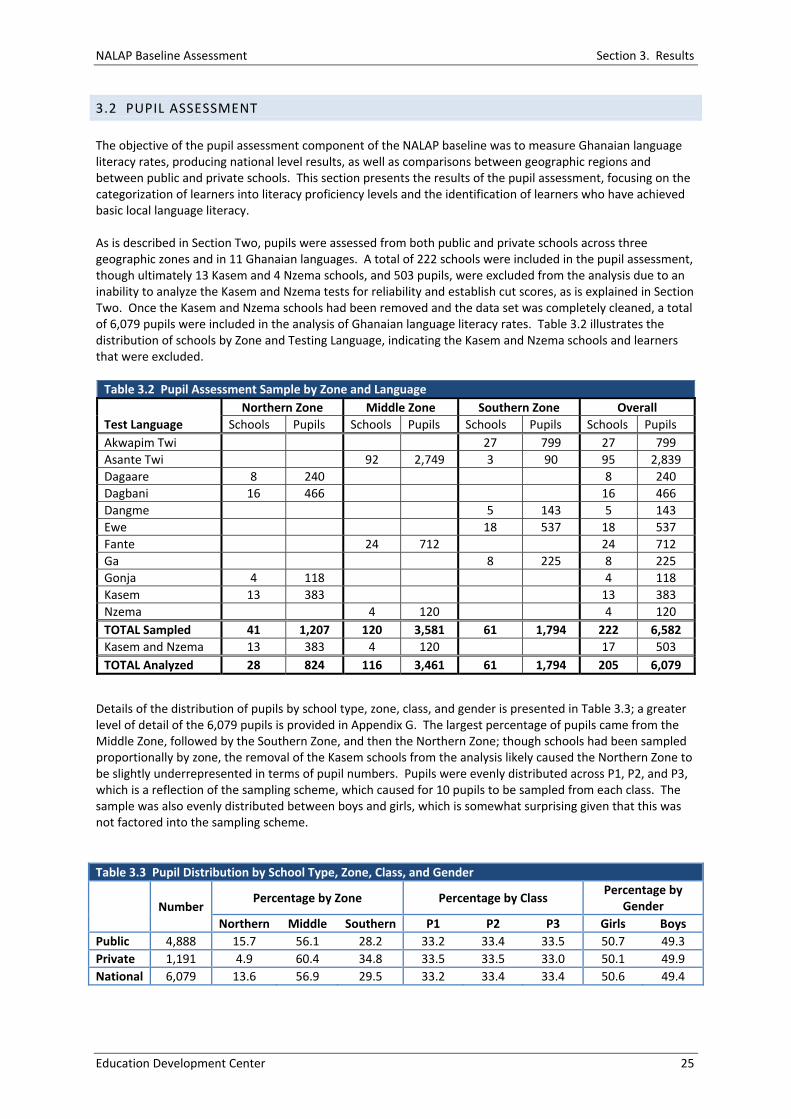
NALAP Baseline Assessment Section 3. Results
Education Development Center 25
3.2 PUPIL ASSESSMENT The objective of the pupil assessment component of the NALAP baseline was to measure Ghanaian language literacy rates, producing national level results, as well as comparisons between geographic regions and between public and private schools. This section presents the results of the pupil assessment, focusing on the categorization of learners into literacy proficiency levels and the identification of learners who have achieved basic local language literacy. As is described in Section Two, pupils were assessed from both public and private schools across three geographic zones and in 11 Ghanaian languages. A total of 222 schools were included in the pupil assessment, though ultimately 13 Kasem and 4 Nzema schools, and 503 pupils, were excluded from the analysis due to an inability to analyze the Kasem and Nzema tests for reliability and establish cut scores, as is explained in Section Two. Once the Kasem and Nzema schools had been removed and the data set was completely cleaned, a total of 6,079 pupils were included in the analysis of Ghanaian language literacy rates. Table 3.2 illustrates the distribution of schools by Zone and Testing Language, indicating the Kasem and Nzema schools and learners that were excluded.
Details of the distribution of pupils by school type, zone, class, and gender is presented in Table 3.3; a greater level of detail of the 6,079 pupils is provided in Appendix G. The largest percentage of pupils came from the Middle Zone, followed by the Southern Zone, and then the Northern Zone; though schools had been sampled proportionally by zone, the removal of the Kasem schools from the analysis likely caused the Northern Zone to be slightly underrepresented in terms of pupil numbers. Pupils were evenly distributed across P1, P2, and P3, which is a reflection of the sampling scheme, which caused for 10 pupils to be sampled from each class. The sample was also evenly distributed between boys and girls, which is somewhat surprising given that this was not factored into the sampling scheme. Table 3.3 Pupil Distribution by School Type, Zone, Class, and Gender
Number
Percentage by Zone Percentage by Class Percentage by
Gender Northern Middle Southern P1 P2 P3 Girls Boys
Public 4,888 15.7 56.1 28.2 33.2 33.4 33.5 50.7 49.3Private 1,191 4.9 60.4 34.8 33.5 33.5 33.0 50.1 49.9National 6,079 13.6 56.9 29.5 33.2 33.4 33.4 50.6 49.4
Table 3.2 Pupil Assessment Sample by Zone and Language
Test Language Northern Zone Middle Zone Southern Zone Overall
Schools Pupils Schools Pupils Schools Pupils Schools PupilsAkwapim Twi 27 799 27 799Asante Twi 92 2,749 3 90 95 2,839Dagaare 8 240 8 240Dagbani 16 466 16 466Dangme 5 143 5 143Ewe 18 537 18 537Fante 24 712 24 712Ga 8 225 8 225Gonja 4 118 4 118Kasem 13 383 13 383Nzema 4 120 4 120TOTAL Sampled 41 1,207 120 3,581 61 1,794 222 6,582Kasem and Nzema 13 383 4 120 17 503TOTAL Analyzed 28 824 116 3,461 61 1,794 205 6,079
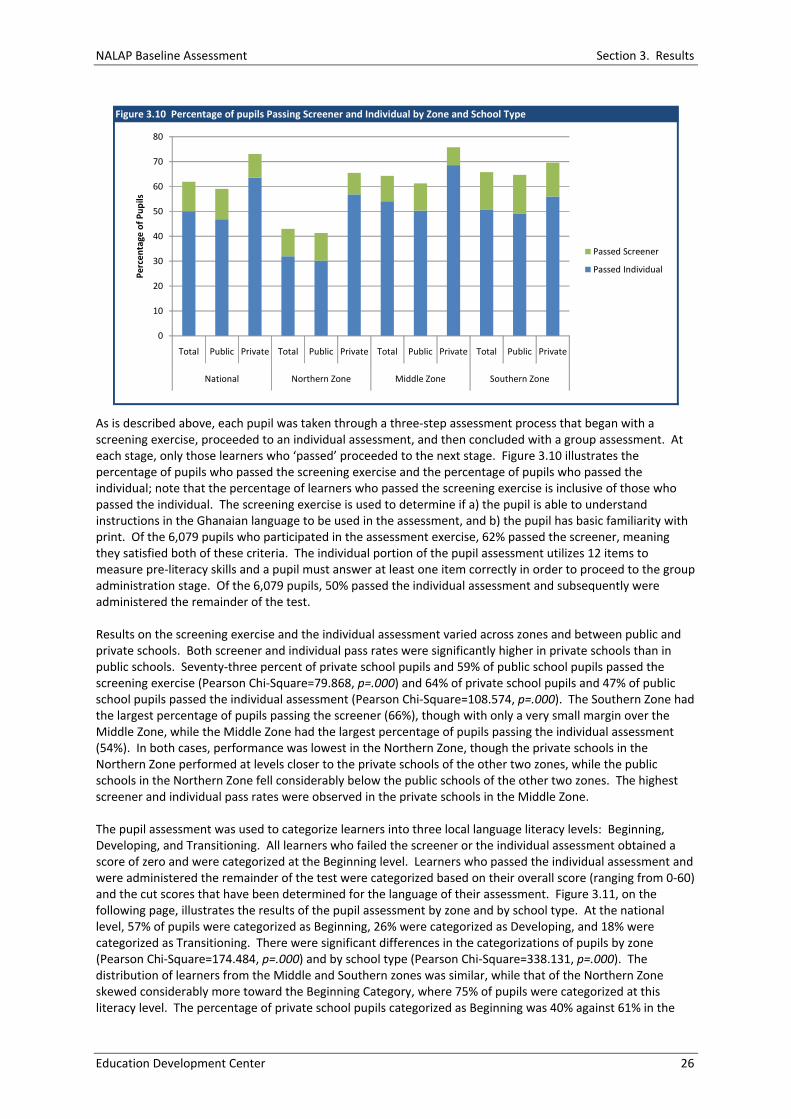
NALAP Baseline Assessment Section 3. Results
Education Development Center 26
As is described above, each pupil was taken through a three‐step assessment process that began with a screening exercise, proceeded to an individual assessment, and then concluded with a group assessment. At each stage, only those learners who ‘passed’ proceeded to the next stage. Figure 3.10 illustrates the percentage of pupils who passed the screening exercise and the percentage of pupils who passed the individual; note that the percentage of learners who passed the screening exercise is inclusive of those who passed the individual. The screening exercise is used to determine if a) the pupil is able to understand instructions in the Ghanaian language to be used in the assessment, and b) the pupil has basic familiarity with print. Of the 6,079 pupils who participated in the assessment exercise, 62% passed the screener, meaning they satisfied both of these criteria. The individual portion of the pupil assessment utilizes 12 items to measure pre‐literacy skills and a pupil must answer at least one item correctly in order to proceed to the group administration stage. Of the 6,079 pupils, 50% passed the individual assessment and subsequently were administered the remainder of the test. Results on the screening exercise and the individual assessment varied across zones and between public and private schools. Both screener and individual pass rates were significantly higher in private schools than in public schools. Seventy‐three percent of private school pupils and 59% of public school pupils passed the screening exercise (Pearson Chi‐Square=79.868, p=.000) and 64% of private school pupils and 47% of public school pupils passed the individual assessment (Pearson Chi‐Square=108.574, p=.000). The Southern Zone had the largest percentage of pupils passing the screener (66%), though with only a very small margin over the Middle Zone, while the Middle Zone had the largest percentage of pupils passing the individual assessment (54%). In both cases, performance was lowest in the Northern Zone, though the private schools in the Northern Zone performed at levels closer to the private schools of the other two zones, while the public schools in the Northern Zone fell considerably below the public schools of the other two zones. The highest screener and individual pass rates were observed in the private schools in the Middle Zone. The pupil assessment was used to categorize learners into three local language literacy levels: Beginning, Developing, and Transitioning. All learners who failed the screener or the individual assessment obtained a score of zero and were categorized at the Beginning level. Learners who passed the individual assessment and were administered the remainder of the test were categorized based on their overall score (ranging from 0‐60) and the cut scores that have been determined for the language of their assessment. Figure 3.11, on the following page, illustrates the results of the pupil assessment by zone and by school type. At the national level, 57% of pupils were categorized as Beginning, 26% were categorized as Developing, and 18% were categorized as Transitioning. There were significant differences in the categorizations of pupils by zone (Pearson Chi‐Square=174.484, p=.000) and by school type (Pearson Chi‐Square=338.131, p=.000). The distribution of learners from the Middle and Southern zones was similar, while that of the Northern Zone skewed considerably more toward the Beginning Category, where 75% of pupils were categorized at this literacy level. The percentage of private school pupils categorized as Beginning was 40% against 61% in the
Figure 3.10 Percentage of pupils Passing Screener and Individual by Zone and School Type
0
10
20
30
40
50
60
70
80
Total Public Private Total Public Private Total Public Private Total Public Private
National Northern Zone Middle Zone Southern Zone
Percen
tage
of P
upils
Passed Screener
Passed Individual
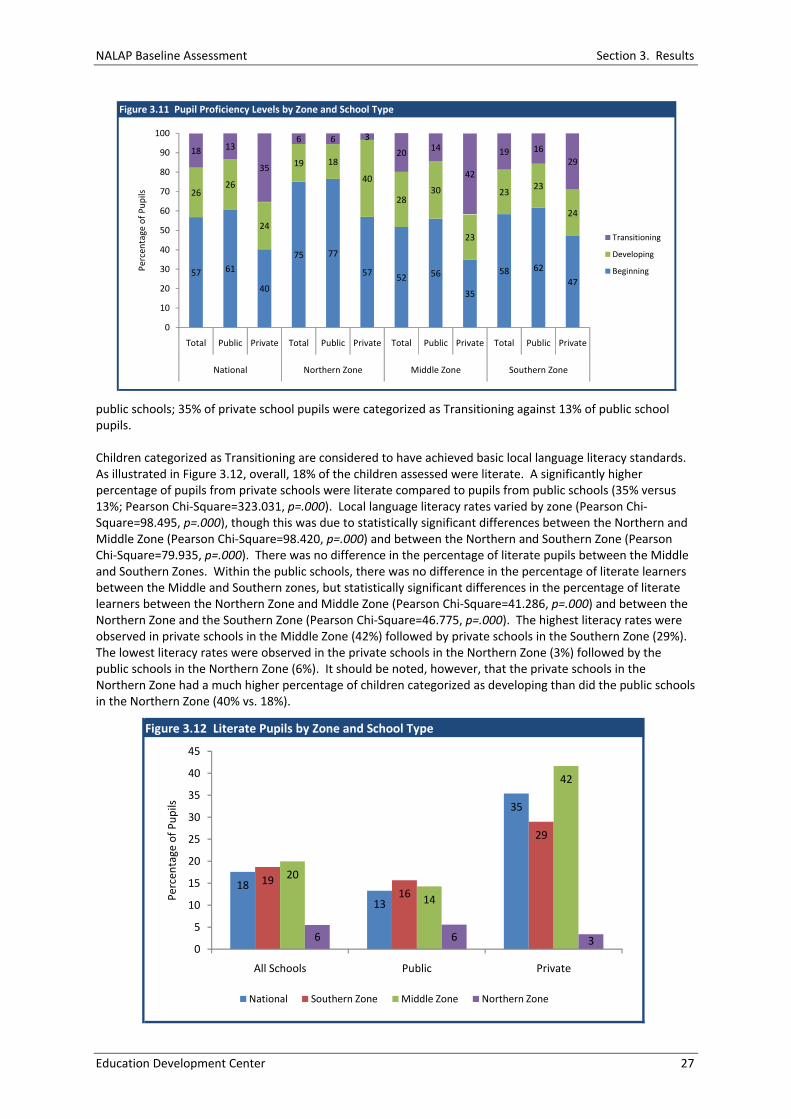
NALAP Baseline Assessment Section 3. Results
Education Development Center 27
public schools; 35% of private school pupils were categorized as Transitioning against 13% of public school pupils. Children categorized as Transitioning are considered to have achieved basic local language literacy standards. As illustrated in Figure 3.12, overall, 18% of the children assessed were literate. A significantly higher percentage of pupils from private schools were literate compared to pupils from public schools (35% versus 13%; Pearson Chi‐Square=323.031, p=.000). Local language literacy rates varied by zone (Pearson Chi‐Square=98.495, p=.000), though this was due to statistically significant differences between the Northern and Middle Zone (Pearson Chi‐Square=98.420, p=.000) and between the Northern and Southern Zone (Pearson Chi‐Square=79.935, p=.000). There was no difference in the percentage of literate pupils between the Middle and Southern Zones. Within the public schools, there was no difference in the percentage of literate learners between the Middle and Southern zones, but statistically significant differences in the percentage of literate learners between the Northern Zone and Middle Zone (Pearson Chi‐Square=41.286, p=.000) and between the Northern Zone and the Southern Zone (Pearson Chi‐Square=46.775, p=.000). The highest literacy rates were observed in private schools in the Middle Zone (42%) followed by private schools in the Southern Zone (29%). The lowest literacy rates were observed in the private schools in the Northern Zone (3%) followed by the public schools in the Northern Zone (6%). It should be noted, however, that the private schools in the Northern Zone had a much higher percentage of children categorized as developing than did the public schools in the Northern Zone (40% vs. 18%).
Figure 3.11 Pupil Proficiency Levels by Zone and School Type
57 61
40
75 77
57 52 56
35
58 62
47
2626
24
19 18
40
2830
23
2323
24
18 13
35
6 6 3
20 14
42
19 1629
0
10
20
30
40
50
60
70
80
90
100
Total Public Private Total Public Private Total Public Private Total Public Private
National Northern Zone Middle Zone Southern Zone
Percen
tage of P
upils
Transitioning
Developing
Beginning
Figure 3.12 Literate Pupils by Zone and School Type
18
13
35
1916
29
20
14
42
6 6 30
5
10
15
20
25
30
35
40
45
All Schools Public Private
Percen
tage of P
upils
National Southern Zone Middle Zone Northern Zone
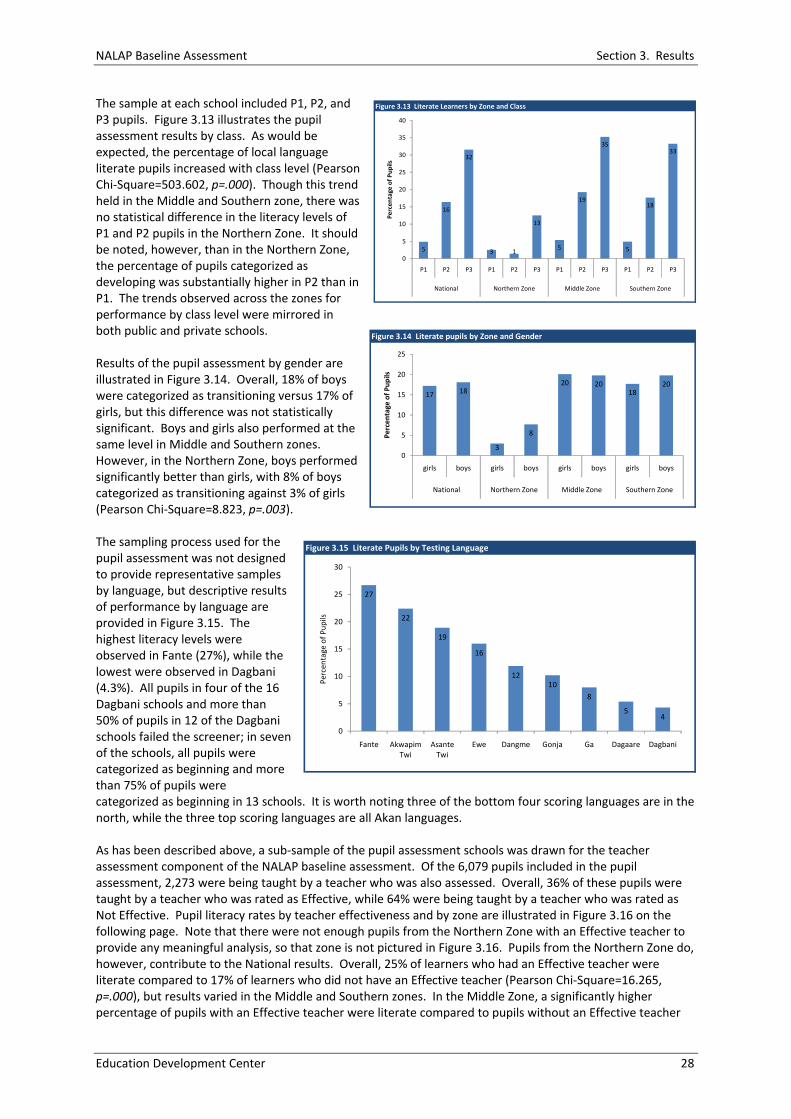
NALAP Baseline Assessment Section 3. Results
Education Development Center 28
The sample at each school included P1, P2, and P3 pupils. Figure 3.13 illustrates the pupil assessment results by class. As would be expected, the percentage of local language literate pupils increased with class level (Pearson Chi‐Square=503.602, p=.000). Though this trend held in the Middle and Southern zone, there was no statistical difference in the literacy levels of P1 and P2 pupils in the Northern Zone. It should be noted, however, than in the Northern Zone, the percentage of pupils categorized as developing was substantially higher in P2 than in P1. The trends observed across the zones for performance by class level were mirrored in both public and private schools. Results of the pupil assessment by gender are illustrated in Figure 3.14. Overall, 18% of boys were categorized as transitioning versus 17% of girls, but this difference was not statistically significant. Boys and girls also performed at the same level in Middle and Southern zones. However, in the Northern Zone, boys performed significantly better than girls, with 8% of boys categorized as transitioning against 3% of girls (Pearson Chi‐Square=8.823, p=.003). The sampling process used for the pupil assessment was not designed to provide representative samples by language, but descriptive results of performance by language are provided in Figure 3.15. The highest literacy levels were observed in Fante (27%), while the lowest were observed in Dagbani (4.3%). All pupils in four of the 16 Dagbani schools and more than 50% of pupils in 12 of the Dagbani schools failed the screener; in seven of the schools, all pupils were categorized as beginning and more than 75% of pupils were categorized as beginning in 13 schools. It is worth noting three of the bottom four scoring languages are in the north, while the three top scoring languages are all Akan languages. As has been described above, a sub‐sample of the pupil assessment schools was drawn for the teacher assessment component of the NALAP baseline assessment. Of the 6,079 pupils included in the pupil assessment, 2,273 were being taught by a teacher who was also assessed. Overall, 36% of these pupils were taught by a teacher who was rated as Effective, while 64% were being taught by a teacher who was rated as Not Effective. Pupil literacy rates by teacher effectiveness and by zone are illustrated in Figure 3.16 on the following page. Note that there were not enough pupils from the Northern Zone with an Effective teacher to provide any meaningful analysis, so that zone is not pictured in Figure 3.16. Pupils from the Northern Zone do, however, contribute to the National results. Overall, 25% of learners who had an Effective teacher were literate compared to 17% of learners who did not have an Effective teacher (Pearson Chi‐Square=16.265, p=.000), but results varied in the Middle and Southern zones. In the Middle Zone, a significantly higher percentage of pupils with an Effective teacher were literate compared to pupils without an Effective teacher
Figure 3.13 Literate Learners by Zone and Class
5
16
32
3 1
13
5
19
35
5
18
33
0
5
10
15
20
25
30
35
40
P1 P2 P3 P1 P2 P3 P1 P2 P3 P1 P2 P3
National Northern Zone Middle Zone Southern Zone
Percen
tage of P
upils
Figure 3.14 Literate pupils by Zone and Gender
17 18
3
8
20 2018
20
0
5
10
15
20
25
girls boys girls boys girls boys girls boys
National Northern Zone Middle Zone Southern Zone
Percen
tage
of P
upils
Figure 3.15 Literate Pupils by Testing Language
27
22
19
16
1210
8
54
0
5
10
15
20
25
30
Fante Akwapim Twi
Asante Twi
Ewe Dangme Gonja Ga Dagaare Dagbani
Percen
tage of P
upils
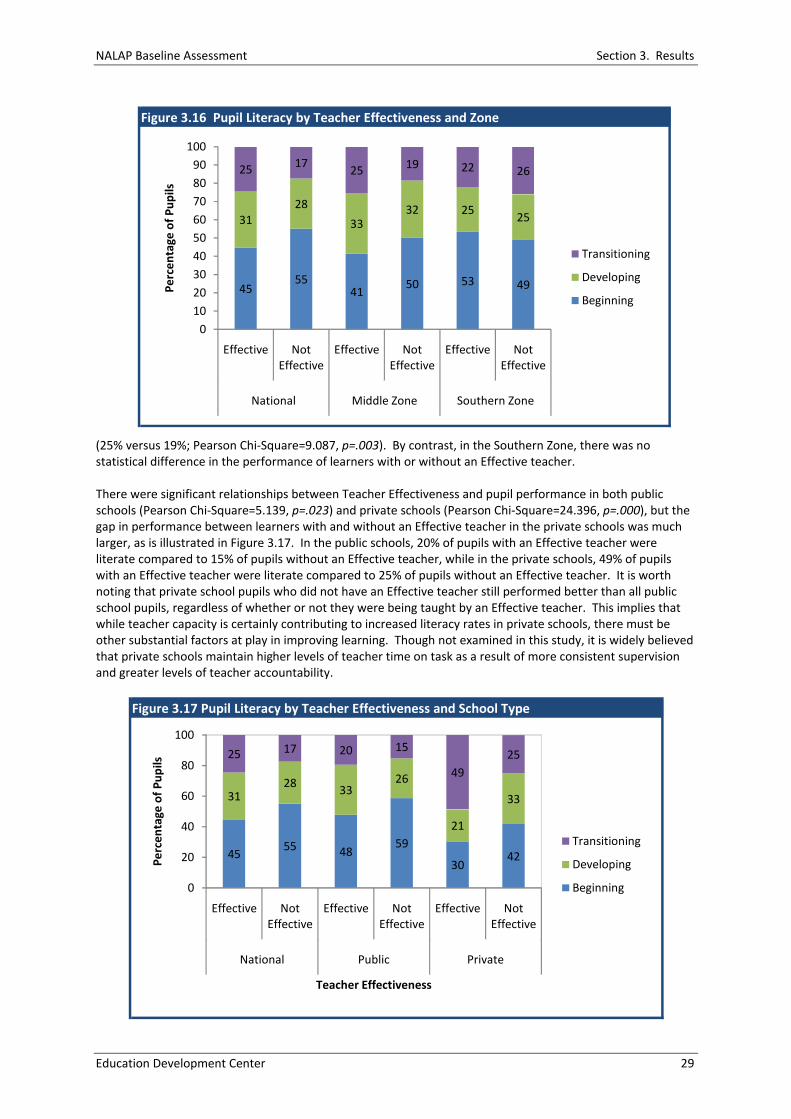
NALAP Baseline Assessment Section 3. Results
Education Development Center 29
(25% versus 19%; Pearson Chi‐Square=9.087, p=.003). By contrast, in the Southern Zone, there was no statistical difference in the performance of learners with or without an Effective teacher. There were significant relationships between Teacher Effectiveness and pupil performance in both public schools (Pearson Chi‐Square=5.139, p=.023) and private schools (Pearson Chi‐Square=24.396, p=.000), but the gap in performance between learners with and without an Effective teacher in the private schools was much larger, as is illustrated in Figure 3.17. In the public schools, 20% of pupils with an Effective teacher were literate compared to 15% of pupils without an Effective teacher, while in the private schools, 49% of pupils with an Effective teacher were literate compared to 25% of pupils without an Effective teacher. It is worth noting that private school pupils who did not have an Effective teacher still performed better than all public school pupils, regardless of whether or not they were being taught by an Effective teacher. This implies that while teacher capacity is certainly contributing to increased literacy rates in private schools, there must be other substantial factors at play in improving learning. Though not examined in this study, it is widely believed that private schools maintain higher levels of teacher time on task as a result of more consistent supervision and greater levels of teacher accountability.
Figure 3.16 Pupil Literacy by Teacher Effectiveness and Zone
4555
4150 53 49
25 1725 19 22 26
3128
3332 25 25
0102030405060708090100
Effective Not Effective
Effective Not Effective
Effective Not Effective
National Middle Zone Southern Zone
Percen
tage
of P
upils
Transitioning
Developing
Beginning
Figure 3.17 Pupil Literacy by Teacher Effectiveness and School Type
4555 48
59
3042
3128 33
26
21
33
25 17 20 15
4925
0
20
40
60
80
100
Effective Not Effective
Effective Not Effective
Effective Not Effective
National Public Private
Percen
tage
of P
upils
Teacher Effectiveness
Transitioning
Developing
Beginning
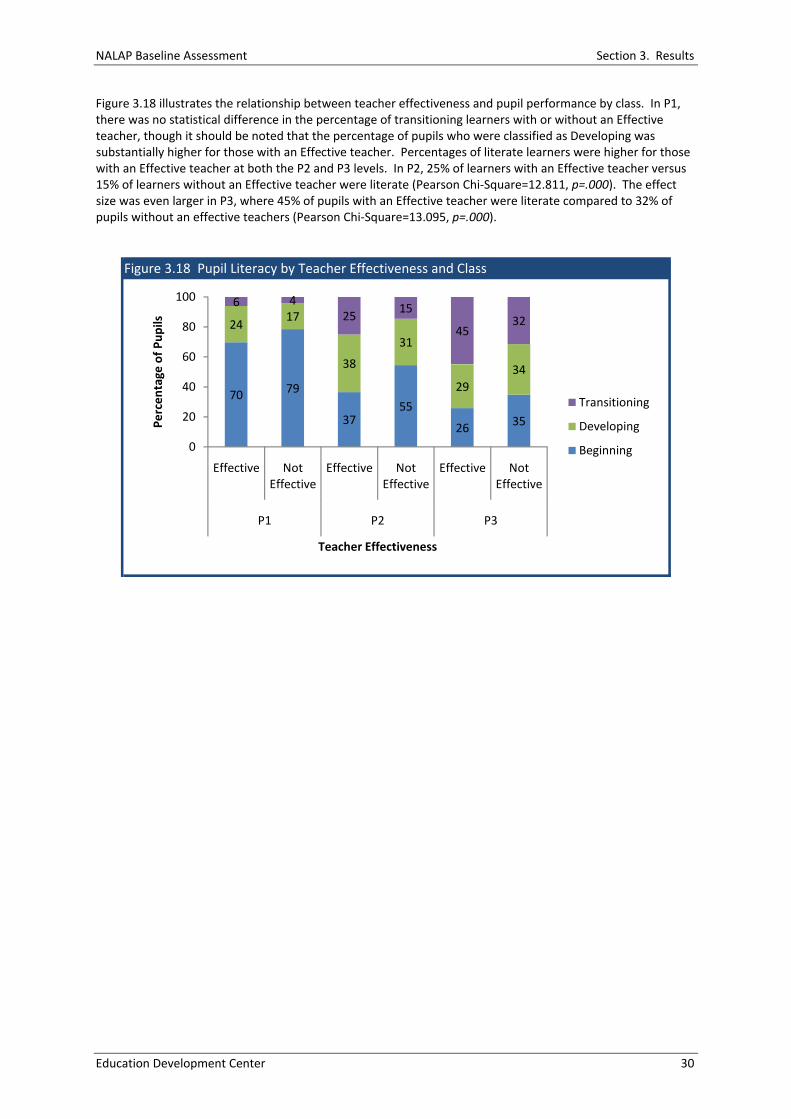
NALAP Baseline Assessment Section 3. Results
Education Development Center 30
Figure 3.18 illustrates the relationship between teacher effectiveness and pupil performance by class. In P1, there was no statistical difference in the percentage of transitioning learners with or without an Effective teacher, though it should be noted that the percentage of pupils who were classified as Developing was substantially higher for those with an Effective teacher. Percentages of literate learners were higher for those with an Effective teacher at both the P2 and P3 levels. In P2, 25% of learners with an Effective teacher versus 15% of learners without an Effective teacher were literate (Pearson Chi‐Square=12.811, p=.000). The effect size was even larger in P3, where 45% of pupils with an Effective teacher were literate compared to 32% of pupils without an effective teachers (Pearson Chi‐Square=13.095, p=.000).
Figure 3.18 Pupil Literacy by Teacher Effectiveness and Class
70 79
3755
26 35
2417
38
31
2934
6 425
15
4532
0
20
40
60
80
100
Effective Not Effective
Effective Not Effective
Effective Not Effective
P1 P2 P3
Percen
tage of P
upils
Teacher Effectiveness
Transitioning
Developing
Beginning
Education Development Center 31
SECTION FOUR. CONCLUSIONS The main conclusions of the NALAP baseline assessment have been summarized by teacher capacity, pupil performance, and overall language and learning findings.
4.1 TEACHER CAPACITY TO TEACH READING The teacher assessment component of the NALAP baseline assessment was designed to understand the capacity of teachers to teach reading in lower primary classrooms (P1‐P3). Teachers were assessed on 16 elements of effective teaching of reading, receiving ratings ranging from ‘Not Yet Started’ to ‘Getting Started’ to ‘Moving Along’ to ‘Showing Results’. In general, teachers are considered to have reached acceptable levels of performance if they obtain a rating of ‘Moving Along’, but the best practice has only been full achieved if they obtain a rating of ‘Showing Results’. In addition to ratings on each element, the overall performance of the teacher was also rated as one of the four categories. When teachers achieved an overall rating of at least ‘Moving Along’, they were considered to be Effective teachers. Teachers who had an overall rating of ‘Not Yet Started’ or ‘Getting Started’ were considered to be Not Effective teachers. On average, teachers were able to satisfy the ‘Moving Along’ criteria on approximately half of the 16 elements and were able to satisfy the ‘Showing Results’ criteria on approximately one‐quarter of the elements. Performance levels were highest in the areas of Gender Sensitivity, Oral and Written Communication, and Use of Class Time and performance levels were lowest in the areas of Classroom Displays and Arrangement of Learners. These two low performing areas are both largely dependent on the physical structure of the school and classroom and the availability of materials. In schools with overcrowded classrooms, it can be difficult to arrange learners in ways that maximize learning, such as grouping them. When classes are operated in dilapidated buildings which may or may not have walls, or under trees, the display of teaching and learning materials becomes a challenge. Overall, approximately one‐third of teachers were Effective, with no differences between teachers from public and private schools. Teachers from the Middle Zone performed better than teachers from the Southern Zone and both performed better than the teachers from the Northern Zone. Teacher performance levels were consistent across all three grade levels. Overall, female teachers performed better than male teachers, though this national figure was most strongly influenced by results in the Southern Zone, where 55% of female teachers were considered to be Effective against only 16% of male teachers. Nationally, Qualified teachers performed significantly better than Not Qualified teachers, though overall and in both the Northern and Middle zones, the number of Not Qualified teachers was greater than the number of Qualified teachers. The greatest difference in performance between Qualified and Not Qualified teachers again was in the Southern Zone. These results indicate that the majority of children in lower primary classrooms in Ghana are being taught by teachers who are not able to teach reading effectively, whether in public or private schools. While there is strong performance in several areas of effective instruction, less than half of teachers were able to demonstrate sufficient capacity in seven areas, including Learner Interaction, Thinking Skills, Use of Teaching and Learning Materials, and Lesson Planning. Though the NALAP teacher guides are highly scripted, it will be necessary for teachers to be able to master these key building blocks to good instruction if they are going to implement the program successfully.
4.2 PUPIL GHANAIAN LANGUAGE LITERACY The pupil assessment component of the NALAP baseline assessment was designed to measure local language literacy proficiency levels in lower primary classrooms across Ghana. Pupils were taken through a three‐step assessment process that began with a screening exercise, proceeded to an individual assessment, and then concluded with a group assessment. At each stage, only those learners who ‘passed’ proceeded to the next stage. Based on their performance, pupils were categorized into three local language literacy levels:
NALAP Baseline Assessment Section 4. Conclusions
Education Development Center 32
Beginning, Developing, and Transitioning. Children categorized as transitioning are considered to have achieved basic local language literacy standards. The first stage of the pupil assessment, the screening exercise, was originally developed to establish that it was appropriate to test the pupils with the overall test. However, with the NALAP baseline, the screening exercise excluded nearly four out of every 10 learners from the remainder of the assessment. This means that these learners either were unable to understand instructions in the local language or had no basic familiarity with print. It is worth noting that screener failure rates were significantly higher in public schools than in private schools. Overall, more than half of the pupils (57%) were categorized at the Beginning proficiency level and only 18% were considered to be Literate. Learners from private schools performed significantly better than learners from public schools. There was no difference in performance between pupils from the Middle and Southern zones, but performance of pupils from the Northern Zone was lower than the other two zones. The highest literacy rates were observed in private schools in the Middle Zone and the lowest literacy rates were observed in private schools in the Northern Zone, though rates of public schools in the Northern Zone were also very low. As would be expected, the percentage of local language literate pupils increased with class level in both public and private schools. Nationally, 5% of P1 pupils, 16% of P2 pupils, and 32% of P3 pupils were literate. There were no differences in performance between P1 and P2 learners in the Northern Zone, but the overall class trend was mirrored in the other two zones. Pupils from the Northern Zone appeared to be lagging behind those from the Middle and Southern zones by more than one year; for example, 13% of P3 pupils from the Northern Zone were literate compared to 19% of P2 pupils from the Middle Zone and 18% of P2 pupils from the Southern Zone16. There was no significant difference in the performance of boys and girls overall, but boys did perform significantly better than girls in the Northern Zone. The highest literacy levels were observed in Fante schools, while the lowest literacy levels were observed in Dagbani schools, though the sample was not drawn to be representative by language. Results of the teacher assessment were analyzed alongside the pupil results to observe relationships between teacher and pupil performance. Overall, a greater percentage of pupils being taught by an Effective teacher were literate compared to pupils being taught by a Not Effective teacher. This trend held true in the Middle Zone, but there was no statistical difference in the percentage of literate pupils with or without an Effective teacher in the Southern Zone. The trend also held true for both public and private schools, though the gap in performance between learners with and without an Effective teacher in the private schools was much larger. Despite this, private school pupils who did not have an Effective teacher still performed better than all public school pupils, regardless of whether or not they had an Effective teacher. In P1, the teacher capacity seemed to have a greater influence on the percentages of pupils classified as Developing or Transitioning, while at P2 and P2 the effect was on the Transitioning categorization, as with the overall sample. This is likely due to the fact that P1 pupils are primarily at the early stages of literacy. The higher levels of performance in private schools is of particular interest, given the fact that it is generally assumed that the majority of private schools have an English only approach to instruction, which was somewhat confirmed by the results of the teacher assessment component. Nevertheless, these children performed at significantly higher levels than the children from the public schools, thus substantiating research that you only learn to read once and once you have, the literacy skills can be transferred to a language that you speak. With the private schools, the reverse of L1 to L2 transition promoted through NALAP might be used, or in fact there may not be a formal transition to L1 at all, but the pupils are nevertheless demonstrating skills in L1 literacy. Though performance levels of pupils in the Northern Zone are typically lower, the exceedingly low results on the NALAP baseline assessment likely reveal not only the typical issues of quality education that are well known from that area, but also the somewhat unique complexities and challenges related to local language instruction. Even after excluding the problematic Kasem schools from the sample, the low local language
16 This finding is especially alarming given the fact that the results from the Northern Zone likely overestimate the true literacy rates for the zone given the exclusion of the Kasem pupils, who are likely to lack local language literacy skills.
NALAP Baseline Assessment Section 4. Conclusions
Education Development Center 33
literacy rates in the Northern Zone are probably related to the higher level of diversity in languages than is prevalent in the other zones. NALAP is going to need targeted strategies to deal with the unique challenges that language will present in these areas.
4.3 LANGUAGE AND LEARNING As part of the teacher assessment component of the NALAP baseline, information was collected from the 99 schools and 247 teachers on the local language being used in the schools and the teacher’s competency in that language, both based on a self report. In 14% of public schools, teachers reported that the local language of instruction being used in the school differed from that which had been designated by the GES (through the NALAP school language collection exercise). Even in schools which were using the prescribed Ghanaian language, teacher self‐reported competencies in those languages were low, indicating that as many as a third of teachers in lower primary classrooms were not proficient in reading or writing the Ghanaian language to be implemented with NALAP. The pupil assessment process revealed alarmingly low levels of learner ability to understand the designated language of instruction in the schools. In more than a quarter of schools, less than half of the pupils were able to pass a simple screening exercise, which is designed to establish that the child can understand instructions in the local language and has basic familiarity with print. Given that this assessment was carried out toward the end of the second term of the school year and included pupils from P1 to P3, this suggests that large percentages of pupils do not speak the local languages being utilized in their school. It is probably fair to assume that English is being widely used in these schools, though this assessment did not make any attempt to assess this in the schools. This is particularly problematic for NALAP implementation given that the program will be implemented in P1‐P3 simultaneously.

Education Development Center 35
SECTION FIVE. RECOMMENDATIONS
There is much that has been learned from the NALAP baseline assessment that should inform both immediate and long‐term strategies for NALAP implementation and evaluation. EDC has summarized the key recommendations and hopes that these will provide a basis for ongoing dialogue as different aspects of NALAP advance.
5.1 NALAP IMPLEMENTATION This study has revealed an overwhelming need for reform in the teaching of reading in Ghana and a system that is well primed for the introduction of a new program such as NALAP. This section details ways in which the NALAP baseline assessment findings can help to strengthen NALAP implementation in the areas of Policy Reform, Teacher Professional Development, Materials Distribution, and Social Marketing. Policy Reform. The NALAP baseline assessment has numerous findings with potential policy implications, but three stand out as particularly related to the success of NALAP. First, this study has confirmed findings of the teacher capacity survey that there are unacceptably high percentages of teachers in lower primary classrooms who are unable to read or write the language to be used for instruction in the school. With the GES moving toward an increasingly decentralized system, it is critical to emphasize teacher capacity in local language in the recruitment, training, posting, and transfer of teachers so that this problem is rectified. Second, the study has revealed that the numbers of children that lack functionality in the language to be used in their schools may be greater than originally assumed. This is in addition to the schools for which it is understood that none of the 11 official languages of the GES are used. As a national program, NALAP is going to need clear guidelines for application at the school level so that it is clear that all children have been considered and that a strategy has been put in place that addresses the attainment of literacy for all lower primary pupils. These guidelines may make provision for the use of multiple languages in a school, the adaptation of some NALAP approaches in non‐official Ghanaian languages at the schools level, or the limited promotion of English language instruction in schools that cannot currently be adequately served by NALAP. It will be necessary for the MOE to determine at what level these types of decisions can be taken and what type of approvals will be necessary. Finally, this study has revealed greater capacity among female teachers to teach reading, which should be considered in ongoing assessments and policy dialogue. The GES should be careful not to ‘over‐react’ to this finding, perhaps by mandating that female teachers be assigned to lower primary classrooms whenever possible, because this study did not provide an overall picture of teacher performance at that level. It very well may be that although female teachers are more skilled with teaching reading, male teachers may be more skilled with teaching mathematics. Having said this, there may be implications for teacher recruitment, especially in cases where schools may be able to move toward a system of having a literacy resource teacher to support all levels of instruction. At the very least, as the GES moves forward with NALAP implementation and future assessments, it is worth paying attention to how teacher gender may be influencing results and how the findings may be used practically to improve results across the country. Teacher Professional Development. The teacher professional development component of NALAP needs to encompass both formal and informal training opportunities for teachers. It is understood that the initial teacher training activities for NALAP will be carried out beginning in September 2009, but EDC recommends that a structured ongoing teacher professional development strategy also be designed and implemented. Following are some recommendations for both aspects of support. NALAP Training. This study has provided valuable information on teacher performance across 16 elements of effective strategies for teaching reading and this information should be used to strengthen the NALAP training. Though the overall training approach has already been designed, details about what teachers are able and not able to do well could help to identify areas that should be emphasized or de‐emphasized during the training. Though it would be tempting to focus heavily, or perhaps even exclusively, on the areas which showed the
NALAP Baseline Assessment Section 5. Recommendations
Education Development Center 36
lowest levels of competency, it may make more sense to examine the differences between Effective and Not Effective teachers in order to figure out where the barriers to become an Effective teacher are strongest. For example, Learner Encouragement, Managing Learner Behavior, Content Accuracy, and Feedback have been identified as four areas where improvement in performance may have the greatest impact on increasing the percentages of Effective teachers, but the NLTF is encouraged to review Section 3.1 of this report, as well as the data files that accompany the report, carefully to consider the most critical areas to focus on during the NALAP training. The extent to which this type of information can be incorporated into the NALAP training is valuable, but given the relatively short time period for the NALAP training, it may even have greater implications for ongoing teacher support activities. It will be important to continually link the assessment of pupil literacy with an assessment of teacher capacity to build a broader sense of the elements that are most critical to learning, rather than assuming that all elements are important; by tracking both types of performance over time, the NLTF can better understand how movement in teacher capacity impacts pupil results. This implies a school and teacher level focus on continually assessing pupil learning as a part of instruction, which needs to be built into a teacher professional development program and continually reinforced through supervision and support mechanisms. The NALAP approach is designed to lead to basic local language literacy by the end of P1, which is strengthened in P2 and P3 while English language literacy is also gradually introduced. The generally low local language literacy levels across all three grade levels revealed through this exercise, coupled with findings suggesting that large percentages of pupils have difficulties with the languages being used in the schools, have serious implications for the introduction of NALAP at the P2 and P3 level, which need to be addressed during the training of both Master Trainers and teachers. Having not established foundational local language literacy skills, teachers are not going to be able to strictly adhere to the NALAP teacher guides for instruction. EDC is concerned that the NALAP training is too short to meaningfully incorporate strategies for building teacher capacity to utilize appropriate remedial approaches with pupils, but at the very least, this issue needs to be acknowledged and addressed during the workshops and teachers need to have a clear sense of expectations of how to approach NALAP implementation in P2 and P3 during the first couple of years. The training of the Master Trainers in this issue is also stressed due to the importance of their role in providing ongoing professional support to the teachers as they work through what is likely to be a challenging first couple of years. Finally, the teacher assessment component of the NALAP assessment revealed unacceptably low levels of teacher proficiency in the Ghanaian languages to be used in the schools. A recommendation to review and improve teacher posting policies to take language proficiencies into account has been made above, but the GES will also need to recognize that this will not happen overnight and needs to develop strategies to address the problem, even in the short term. The NALAP teacher guide has been designed in such a way as to assist teachers with low proficiency levels in the local language and it is believed that by implementing NALAP, teachers, who are already literate in English, will build their language and literacy skills in the Ghanaian language, but this is not enough. The GES needs to consider strategies for improving local language proficiencies of teachers to better equip them to support pupils as they progress through NALAP. Ongoing Teacher Professional Support. It goes without saying that if NALAP is going to be successful, teachers are going to require regular quality professional support to increase their understanding of the approach and build their skill base to effectively implement the teaching methodologies and perform as effective teachers. The NALAP COI, coupled with the results of the teacher assessment, can go a long way to supporting this aspect of NALAP implementation. The COI was originally designed to serve as a tool not only of teacher assessment, but also of teacher reflection and can be used in part or in whole in a variety of teacher professional development activities. Now that national level results of teacher capacity are available, these can be used to chart a path for individual teacher development in a meaningful way that has demonstrated linkages to pupil learning. EDC would recommend that the GES promote the use of the COI in the ongoing implementation of NALAP at the school level. The teacher assessment results indicate a positive correlation between teacher qualification and teacher capacity to teach reading. This provides further evidence for the GES to continue with efforts to get teachers qualified, preferably through distance learning models so as to keep teachers in the classroom, but could also
NALAP Baseline Assessment Section 5. Recommendations
Education Development Center 37
suggest that it may make sense to encourage NALAP teachers to form support groups that might allow for trained teachers to impart skills and ideas to untrained teachers. Materials Distribution. The results of the teacher assessment revealed a misalignment between the language of instruction designated by the GES for schools and the language of instruction being used in the schools. In addition, the issues that were encountered with the sampled schools that were believed to be Kasem revealed that there are potentially large numbers of schools that are not, and do not intend to, use any of the official 11 NALAP languages. This creates issues for materials distribution that need to be addressed by USAID and the GES, in addition to the question of whether it will be mandatory, or even possible, for every primary school to implement NALAP, which is addressed above. Social Marketing. Language issues have been discussed in detail above, but it is worth noting that the specific issues identified through this study should be factored into the NALAP social marketing campaign, both in terms of product development and implementation.
5.2 NALAP EVALUATION It is well recognized that changes in the quality of education do not happen overnight and it will be necessary for the GES to commit to long term support, monitoring, and evaluation of NALAP if the expected gains in learner literacy rates are to be achieved. This section discusses an overall recommended approach for the assessment of the NALAP initiative, as well as more specific recommendations for the replication of the approach used for the baseline assessment. Approach. EDC recommends that, in the long term, USAID and the GES consider adopting a two tier approach to assessment of the NALAP initiative. The first tier would consist of formative evaluation based on in‐depth and regular monitoring and assessment, while the second tier would be focused on overall impacts of the program. The information gained through this baseline assessment could be used to inform the development, implementation, and analysis of results generated for both tiers. Formative Assessment. While considerable time was taken in developing the overall NALAP design, the development process for the materials has been incredibly accelerated, not allowing for the types of field testing or quality measures that would normally be associated with the development and introduction of such a large scale and wide ranging program. For this reason, EDC believes that there would be real value in instituting a rigorous monitoring and evaluation component to the implementation of NALAP, including a substantial formative evaluation component that would lend itself to understanding what is being taught and with what level of quality, how the pupils are responding, and ultimately what is working and what is not working. To achieve this objective, EDC recommends a case study approach, focusing on a limited number of schools but utilizing an intensive methodology for building a strong understanding of the progress and effectiveness of the NALAP implementation. This approach would likely include regular (perhaps bi‐weekly or monthly) assessments of teacher and learner performance, tracking a particular group of individuals over the course of an entire academic year. For teachers, a performance tracking system that would involve self‐reporting and external observation of teaching practices in grades KG‐P3 could be developed. The performance and tracking system would potentially include three components: a daily record of progress through the NALAP teacher guide, a bi‐weekly observation by an external observer, and a reflection on teaching practices to be completed at the end of each term. The record of progress through the NALAP teacher guide would monitor the completion of lessons in each individual classroom, satisfying several purposes: to provide accountability for each teacher’s work, to provide feedback for further refinements of the scope and sequence of the NALAP, and to provide information to contextualize the performance of students on the standards and milestones assessments. Teachers would be responsible for keeping daily track of their progress through the curriculum; the record may include information such as lesson topics covered and activities completed. The bi‐weekly observation would focus on whether teachers are implementing those practices on which they received training from NALAP,
NALAP Baseline Assessment Section 5. Recommendations
Education Development Center 38
particularly those practices that are based on research on learning to read and write in the local language and in a second language (in this case English). Teachers would be scored on criteria that are central to NALAP, such as whether they are teaching to the objectives set out in the teachers guide and using the instructional methods described there. Observers would be trained to reliably score teachers using a rubric with a numerical scale. Teachers would also complete a reflection on teaching practices once each term. The topics covered in the reflection would mirror those topics in the bi‐weekly observation. The questionnaire would ask teachers to reflect on how well they have been able to implement pedagogical practices on which they have received training, how effective they perceive their teaching to be, and what additional training and support they would like to receive in order to deliver lessons effectively. For learners, in addition to an annual reading assessment, which will likely be a main feature of the impact evaluation, pupils would be tested bi‐weekly to track their progress toward a more comprehensive set of literacy standards and milestones than would be addressed through the NRAs. Benchmark testing would be designed to track how well pupils are meeting the objectives that are laid out in the NALAP teacher guide, as opposed to their acquisition of general literacy skills, which is tested once per year. The purpose of such benchmark testing is to monitor pupil growth across time, to measure the impact of instruction, and to make determinations about the effectiveness of particular units (and collectively, about the entire curriculum). The proposed case study approach would provide a rich data source for informing the ongoing NALAP implementation model, particularly as it relates to teacher training, since the study would provide detailed information not only of what teachers are able and not able to do in the classroom, but also an understanding of the obstacles to achieving better performance. This information would be available in ‘real‐time’, thus allowing for a professional development program model that is responsive to actual field implementation. Over the long term, the case study approach could be utilized as a systematic way to assemble information on both general and detailed material improvements for a re‐design plan to be implemented whenever the appropriate timeframe for the reproduction of materials has passed. Finally, it should be noted that if a case study is implemented, it would lessen the pressure for the national evaluation to produce detailed information on teacher and learner performance, thus clearing the path to utilize a simpler, easier, and potentially more transferable approach to measuring learner performance, as suggested in Section Two and discussed below. Impact Assessment. From the onset of the design of the NALAP baseline assessment, it was understood that this study would form the basis for ongoing assessment of NALAP by the GES. EDC implemented an approach for the baseline assessment that met the technical requirements detailed in the SOW and subsequent feedback from USAID and believes that the implementation of this approach has produced valuable information to both USAID and NALAP at the baseline stage. The assessment strategy that has been used for the baseline assessment can serve as the long‐term model for impact assessment of the NALAP program, however, EDC would recommend that USAID and the GES consider adopting a more streamlined and simplistic approach to pupil assessment for later stages of the evaluation. The purpose of the baseline assessment was to provide benchmarks from which to ultimately measure program impact and has established a base from which a gradual transition to an alternative model could be possible. Indeed, rigorous and detailed data and information on both teacher and pupil performance has been generated that will prove valuable not only to NALAP, but to education planners and policy‐makers in general. It is a robust approach that produces a rich data set, unique in the fact that it provides reliable and valid data on local language literacy achievement. One major limitation of the NALAP baseline assessment strategy is that it requires extensive training of data collectors, substantial field time to implement, and generates a very large data set that does not lend itself to easy processing. This approach may not be practical when considering a long‐term evaluation plan to be managed and implemented by the GES. Over the past several years, there has been a great deal of attention on the use of rapid reading assessments that have been shown to have strong predictive power of grade‐level equivalency and future reading ability. The strength of these approaches is that they are relatively simple to administer, yet provide a valid measure of overall literacy performance. EDC understands that USAID is currently considering some work to be carried out on Early Grade Reading Assessment (EGRA) in Ghana and this may be a logical intersection to take a second look at the NALAP assessment approach and determine whether it would be desired and feasible to develop an alternate model. EGRA may be able to assist the GES to further develop the oral assessment component of the NRA so that it could be used either independently or
NALAP Baseline Assessment Section 5. Recommendations
Education Development Center 39
in conjunction with the larger assessment. If the GES were interested in introducing such an alternate model, the following approach could work well in conjunction with the proposed baseline assessment strategy. The alternative assessment approach would be developed prior to the first impact assessment. During the first impact assessment, the baseline model utilizing the NRA would be replicated in the entire sample of schools and both models would be applied in a sub‐sample of schools. This would allow for the results of the new model to be normed against the results of the NRA instruments, thus providing a basis for ultimately replacing the old model with the new. This would also provide the option, on an annual or bi‐annual basis, of administering either of the two assessment models because the relationship between the two would be understood. Therefore, if there are plans to design new professional development techniques or update the NALAP materials, the GES may choose to employ the full baseline assessment model, including teacher assessment. If the current need is to have a more basic assessment of ongoing impacts of the program, the simpler model may be employed. This type of flexibility would also permit the GES the capability to have regular assessments when available resource levels may be inconsistent. Note that the remainder of this section addresses recommendations for the replication of the assessment strategy used in this study, as they will form a part of future impact evaluations regardless of the direction that the GES takes. Instrumentation. In order to ensure that results are comparable from year to year, the instrumentation should remain primarily the same. However, there are items for the both the COI and the NRA that should or need to be addressed prior to the first impact assessment. NALAP COI. Overall, the NALAP COI seems to have performed well for the purposes of this assessment, but there are a couple of modifications to the background and demographic information that emerged both from the NALAP COI development team and the data collection exercise. During the COI development workshop, the technical team discussed a couple of items that would be beneficial to add to the COI and teacher assessment process in future impact evaluations, both relating to the teacher’s experience with the NALAP implementation. First, the team felt that it would be helpful to record the type(s) and date(s) of any NALAP‐specific training that the teacher had received, including both initial and refresher trainings. The results of this data collection could provide information on whether new teachers coming into lower primary classrooms continue to be trained in NALAP and could also allow for a comparison of the amount of NALAP training to teacher capacity and learner results. Second, the team recommended that once NALAP is introduced, it would be helpful to utilize the teacher assessment process to track teacher transfers in and out of both schools and lower primary classrooms. The movement of teachers within and between schools is often cited as a threat to sustained improvements with literacy initiatives; getting information on this could be easily integrated into the background information sheet of the NALAP COI. As has been detailed above, one major modification to the EQUALL COI for the NALAP COI was the addition of a Teacher Language Background and Competency self‐report section of the instrument. This was done in order to strengthen the understanding of the language situation at the school, both as it pertained to the local language being used in the school against the language designated by the GES and teacher competency in that language. This section of the instrument did provide valuable information from the baseline assessment, but there were also several issues with data collectors fully understanding the intent of each of the questions and accurately recording the information. EDC would recommend that, prior to any future impact assessments, this section of the instrument be reviewed and revised, in order to increase both clarity and comprehensiveness. It would also be beneficial to focus attention on this section during the data collector training. NALAP Reading Assessments (NRAs). At this point, literacy tests for Kasem and Nzema have been developed, but neither test has been validated and cut scores have not been established. In the case of Kasem, the inability to carry out these exercises at this time resulted from a lack of opportunity to administer the test to an appropriate sample of pupils. In order to determine the reliability of the test and establish cut scores, it is necessary to administer the test to a set of age appropriate pupils who represent the spectrum of literacy attainment. With the Kasem administration, almost all of the sampled pupils failed the screening portion of the pupil assessment and did not even complete the actual test. In the case of Nzema, it is unclear at this time
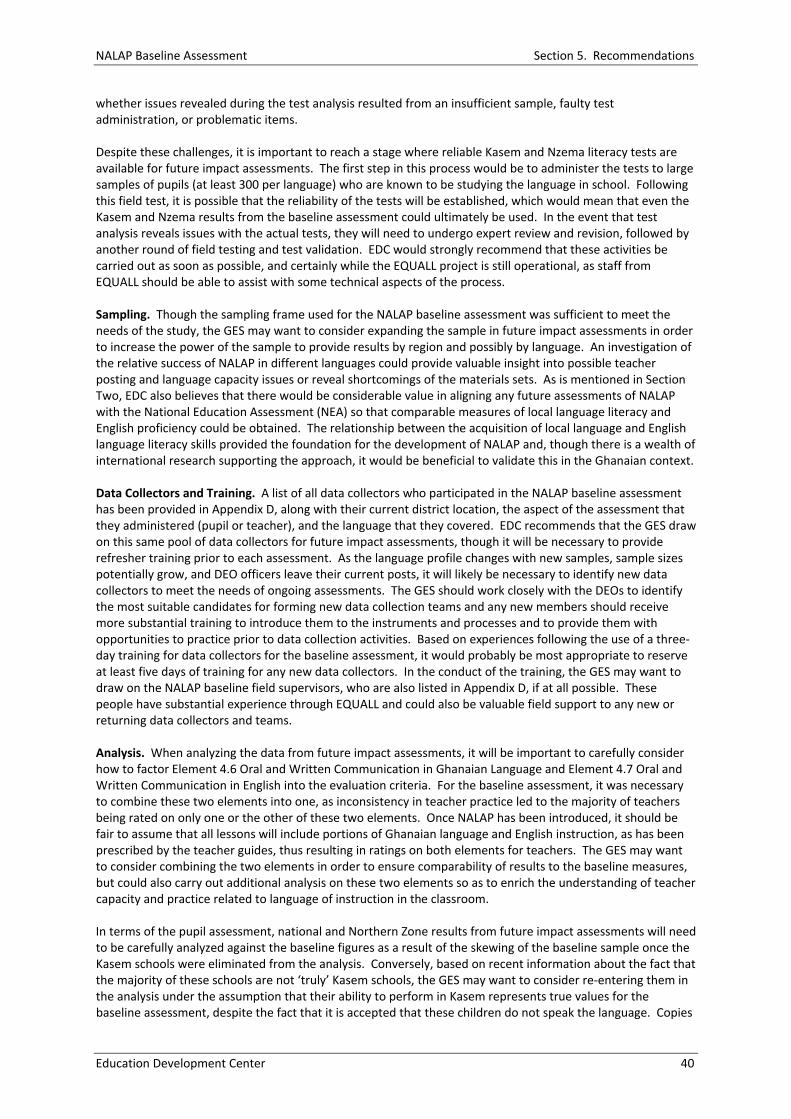
NALAP Baseline Assessment Section 5. Recommendations
Education Development Center 40
whether issues revealed during the test analysis resulted from an insufficient sample, faulty test administration, or problematic items. Despite these challenges, it is important to reach a stage where reliable Kasem and Nzema literacy tests are available for future impact assessments. The first step in this process would be to administer the tests to large samples of pupils (at least 300 per language) who are known to be studying the language in school. Following this field test, it is possible that the reliability of the tests will be established, which would mean that even the Kasem and Nzema results from the baseline assessment could ultimately be used. In the event that test analysis reveals issues with the actual tests, they will need to undergo expert review and revision, followed by another round of field testing and test validation. EDC would strongly recommend that these activities be carried out as soon as possible, and certainly while the EQUALL project is still operational, as staff from EQUALL should be able to assist with some technical aspects of the process. Sampling. Though the sampling frame used for the NALAP baseline assessment was sufficient to meet the needs of the study, the GES may want to consider expanding the sample in future impact assessments in order to increase the power of the sample to provide results by region and possibly by language. An investigation of the relative success of NALAP in different languages could provide valuable insight into possible teacher posting and language capacity issues or reveal shortcomings of the materials sets. As is mentioned in Section Two, EDC also believes that there would be considerable value in aligning any future assessments of NALAP with the National Education Assessment (NEA) so that comparable measures of local language literacy and English proficiency could be obtained. The relationship between the acquisition of local language and English language literacy skills provided the foundation for the development of NALAP and, though there is a wealth of international research supporting the approach, it would be beneficial to validate this in the Ghanaian context. Data Collectors and Training. A list of all data collectors who participated in the NALAP baseline assessment has been provided in Appendix D, along with their current district location, the aspect of the assessment that they administered (pupil or teacher), and the language that they covered. EDC recommends that the GES draw on this same pool of data collectors for future impact assessments, though it will be necessary to provide refresher training prior to each assessment. As the language profile changes with new samples, sample sizes potentially grow, and DEO officers leave their current posts, it will likely be necessary to identify new data collectors to meet the needs of ongoing assessments. The GES should work closely with the DEOs to identify the most suitable candidates for forming new data collection teams and any new members should receive more substantial training to introduce them to the instruments and processes and to provide them with opportunities to practice prior to data collection activities. Based on experiences following the use of a three‐day training for data collectors for the baseline assessment, it would probably be most appropriate to reserve at least five days of training for any new data collectors. In the conduct of the training, the GES may want to draw on the NALAP baseline field supervisors, who are also listed in Appendix D, if at all possible. These people have substantial experience through EQUALL and could also be valuable field support to any new or returning data collectors and teams. Analysis. When analyzing the data from future impact assessments, it will be important to carefully consider how to factor Element 4.6 Oral and Written Communication in Ghanaian Language and Element 4.7 Oral and Written Communication in English into the evaluation criteria. For the baseline assessment, it was necessary to combine these two elements into one, as inconsistency in teacher practice led to the majority of teachers being rated on only one or the other of these two elements. Once NALAP has been introduced, it should be fair to assume that all lessons will include portions of Ghanaian language and English instruction, as has been prescribed by the teacher guides, thus resulting in ratings on both elements for teachers. The GES may want to consider combining the two elements in order to ensure comparability of results to the baseline measures, but could also carry out additional analysis on these two elements so as to enrich the understanding of teacher capacity and practice related to language of instruction in the classroom. In terms of the pupil assessment, national and Northern Zone results from future impact assessments will need to be carefully analyzed against the baseline figures as a result of the skewing of the baseline sample once the Kasem schools were eliminated from the analysis. Conversely, based on recent information about the fact that the majority of these schools are not ‘truly’ Kasem schools, the GES may want to consider re‐entering them in the analysis under the assumption that their ability to perform in Kasem represents true values for the baseline assessment, despite the fact that it is accepted that these children do not speak the language. Copies
NALAP Baseline Assessment Section 5. Recommendations
Education Development Center 41
of all datasets will be provided to both USAID and the GES so that future analyses can include revisions to baseline results if appropriate and necessary. GES Capacity. As has been detailed above, the NALAP baseline assessment approach was designed with a view toward enabling replication by the GES, with little or no outside technical support. Toward this aim, EDC involved members of the GES in the implementation of the study to the extent that they were available, including most importantly in the data analysis and review of results. EDC, along with this report, has also transferred all relevant electronic files (including instrumentation, analysis programs, and data files) to USAID and the GES to support future implementation. It should be noted that SPSS has been used for the data analysis component of the study. Representatives of the Assessment Services Unit of the GES have indicated that they have basic familiarity with SPSS, but would require more advanced training if it is expected that they will modify analysis programs in the future. Even if modifications are not necessary, EDC would recommend that the ASU staff members be provided with advanced SPSS training, as these skills will enhance both the analysis and interpretation of results in the future.

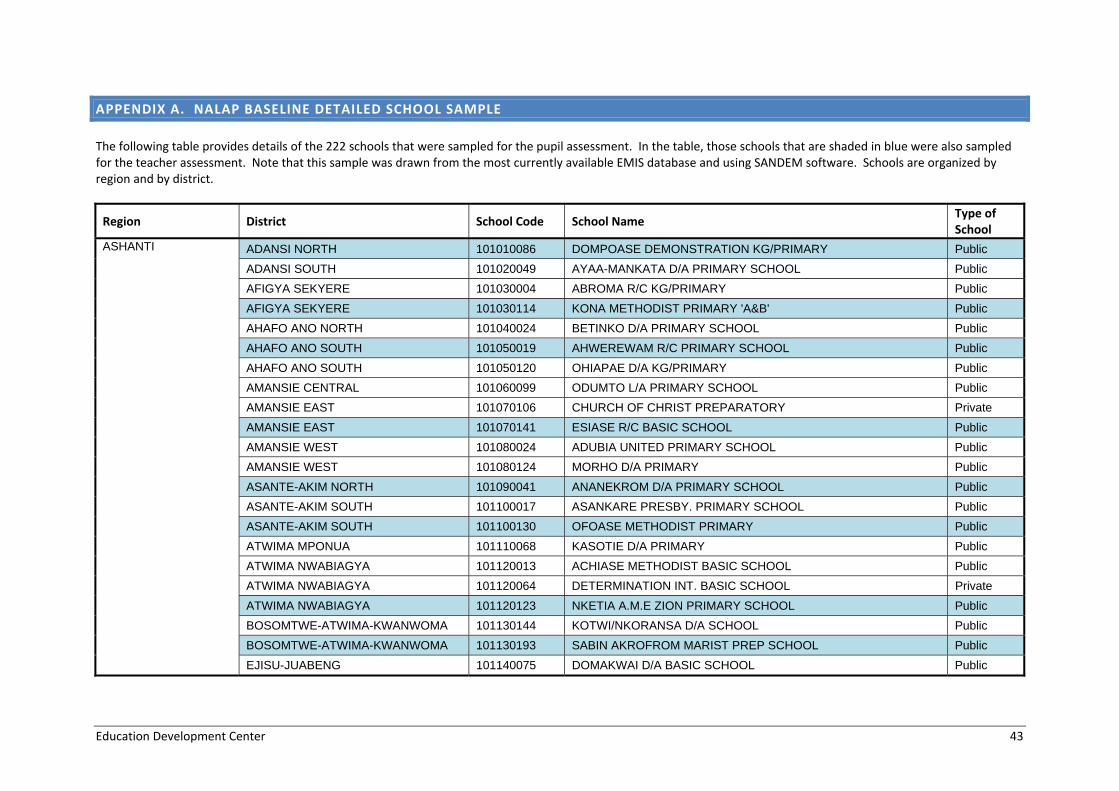
Education Development Center 43
APPENDIX A. NALAP BASELINE DETAILED SCHOOL SAMPLE The following table provides details of the 222 schools that were sampled for the pupil assessment. In the table, those schools that are shaded in blue were also sampled for the teacher assessment. Note that this sample was drawn from the most currently available EMIS database and using SANDEM software. Schools are organized by region and by district.
Region District School Code School Name Type of School
ASHANTI ADANSI NORTH 101010086 DOMPOASE DEMONSTRATION KG/PRIMARY Public ADANSI SOUTH 101020049 AYAA-MANKATA D/A PRIMARY SCHOOL Public AFIGYA SEKYERE 101030004 ABROMA R/C KG/PRIMARY Public AFIGYA SEKYERE 101030114 KONA METHODIST PRIMARY 'A&B' Public AHAFO ANO NORTH 101040024 BETINKO D/A PRIMARY SCHOOL Public AHAFO ANO SOUTH 101050019 AHWEREWAM R/C PRIMARY SCHOOL Public AHAFO ANO SOUTH 101050120 OHIAPAE D/A KG/PRIMARY Public AMANSIE CENTRAL 101060099 ODUMTO L/A PRIMARY SCHOOL Public AMANSIE EAST 101070106 CHURCH OF CHRIST PREPARATORY Private AMANSIE EAST 101070141 ESIASE R/C BASIC SCHOOL Public AMANSIE WEST 101080024 ADUBIA UNITED PRIMARY SCHOOL Public AMANSIE WEST 101080124 MORHO D/A PRIMARY Public ASANTE-AKIM NORTH 101090041 ANANEKROM D/A PRIMARY SCHOOL Public ASANTE-AKIM SOUTH 101100017 ASANKARE PRESBY. PRIMARY SCHOOL Public ASANTE-AKIM SOUTH 101100130 OFOASE METHODIST PRIMARY Public ATWIMA MPONUA 101110068 KASOTIE D/A PRIMARY Public ATWIMA NWABIAGYA 101120013 ACHIASE METHODIST BASIC SCHOOL Public ATWIMA NWABIAGYA 101120064 DETERMINATION INT. BASIC SCHOOL Private ATWIMA NWABIAGYA 101120123 NKETIA A.M.E ZION PRIMARY SCHOOL Public BOSOMTWE-ATWIMA-KWANWOMA 101130144 KOTWI/NKORANSA D/A SCHOOL Public BOSOMTWE-ATWIMA-KWANWOMA 101130193 SABIN AKROFROM MARIST PREP SCHOOL Public EJISU-JUABENG 101140075 DOMAKWAI D/A BASIC SCHOOL Public
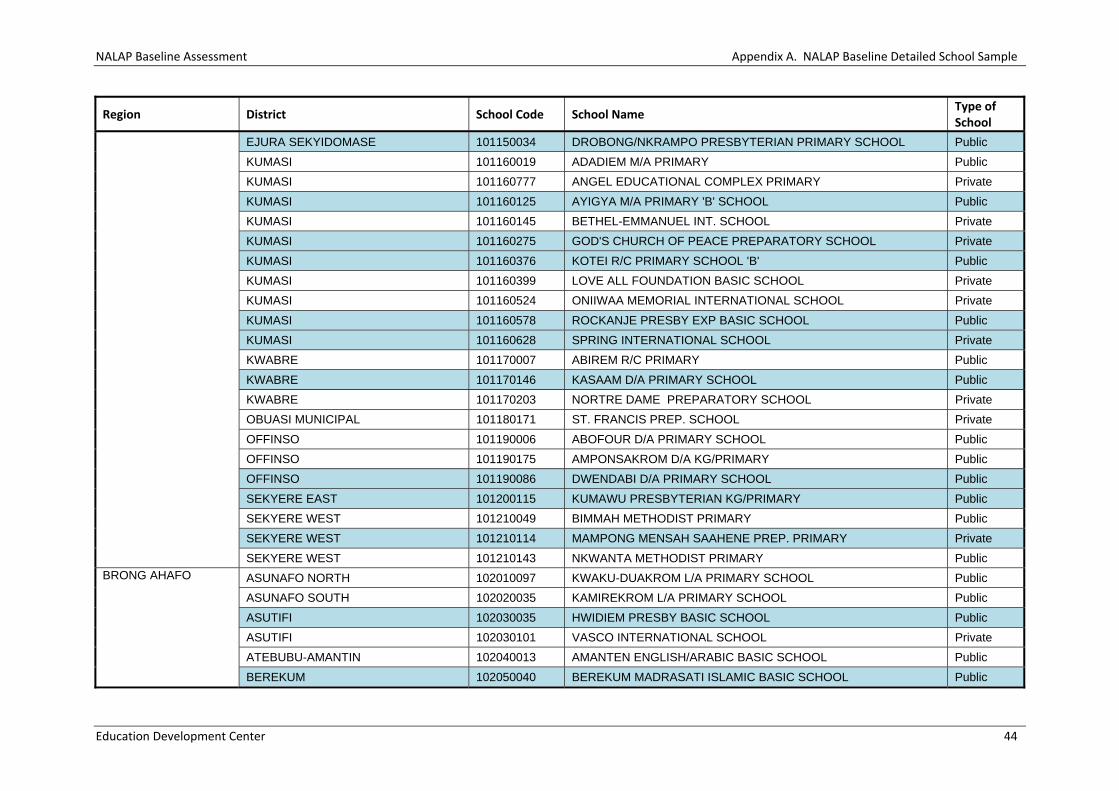
NALAP Baseline Assessment Appendix A. NALAP Baseline Detailed School Sample
Education Development Center 44
Region District School Code School Name Type of School
EJURA SEKYIDOMASE 101150034 DROBONG/NKRAMPO PRESBYTERIAN PRIMARY SCHOOL Public KUMASI 101160019 ADADIEM M/A PRIMARY Public KUMASI 101160777 ANGEL EDUCATIONAL COMPLEX PRIMARY Private KUMASI 101160125 AYIGYA M/A PRIMARY 'B' SCHOOL Public KUMASI 101160145 BETHEL-EMMANUEL INT. SCHOOL Private KUMASI 101160275 GOD'S CHURCH OF PEACE PREPARATORY SCHOOL Private KUMASI 101160376 KOTEI R/C PRIMARY SCHOOL 'B' Public KUMASI 101160399 LOVE ALL FOUNDATION BASIC SCHOOL Private KUMASI 101160524 ONIIWAA MEMORIAL INTERNATIONAL SCHOOL Private KUMASI 101160578 ROCKANJE PRESBY EXP BASIC SCHOOL Public KUMASI 101160628 SPRING INTERNATIONAL SCHOOL Private KWABRE 101170007 ABIREM R/C PRIMARY Public KWABRE 101170146 KASAAM D/A PRIMARY SCHOOL Public KWABRE 101170203 NORTRE DAME PREPARATORY SCHOOL Private OBUASI MUNICIPAL 101180171 ST. FRANCIS PREP. SCHOOL Private OFFINSO 101190006 ABOFOUR D/A PRIMARY SCHOOL Public OFFINSO 101190175 AMPONSAKROM D/A KG/PRIMARY Public OFFINSO 101190086 DWENDABI D/A PRIMARY SCHOOL Public SEKYERE EAST 101200115 KUMAWU PRESBYTERIAN KG/PRIMARY Public SEKYERE WEST 101210049 BIMMAH METHODIST PRIMARY Public SEKYERE WEST 101210114 MAMPONG MENSAH SAAHENE PREP. PRIMARY Private SEKYERE WEST 101210143 NKWANTA METHODIST PRIMARY Public
BRONG AHAFO
ASUNAFO NORTH 102010097 KWAKU-DUAKROM L/A PRIMARY SCHOOL Public ASUNAFO SOUTH 102020035 KAMIREKROM L/A PRIMARY SCHOOL Public ASUTIFI 102030035 HWIDIEM PRESBY BASIC SCHOOL Public ASUTIFI 102030101 VASCO INTERNATIONAL SCHOOL Private ATEBUBU-AMANTIN 102040013 AMANTEN ENGLISH/ARABIC BASIC SCHOOL Public BEREKUM 102050040 BEREKUM MADRASATI ISLAMIC BASIC SCHOOL Public
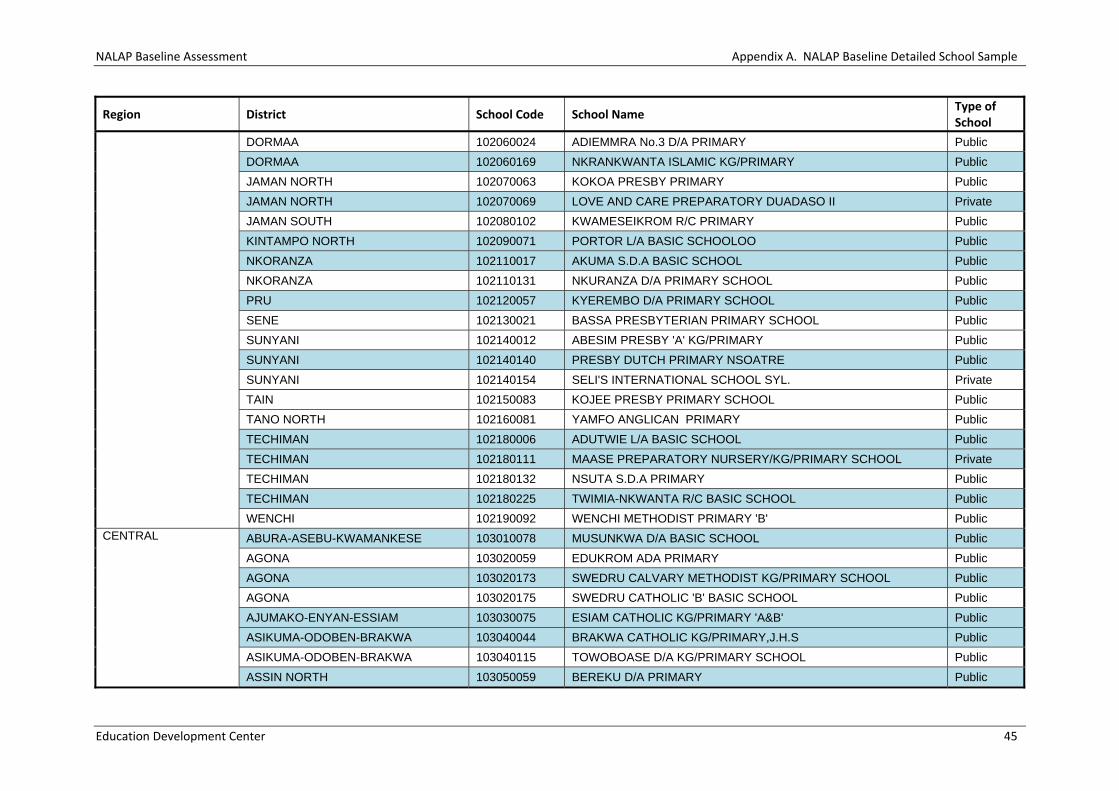
NALAP Baseline Assessment Appendix A. NALAP Baseline Detailed School Sample
Education Development Center 45
Region District School Code School Name Type of School
DORMAA 102060024 ADIEMMRA No.3 D/A PRIMARY Public DORMAA 102060169 NKRANKWANTA ISLAMIC KG/PRIMARY Public JAMAN NORTH 102070063 KOKOA PRESBY PRIMARY Public JAMAN NORTH 102070069 LOVE AND CARE PREPARATORY DUADASO II Private JAMAN SOUTH 102080102 KWAMESEIKROM R/C PRIMARY Public KINTAMPO NORTH 102090071 PORTOR L/A BASIC SCHOOLOO Public NKORANZA 102110017 AKUMA S.D.A BASIC SCHOOL Public NKORANZA 102110131 NKURANZA D/A PRIMARY SCHOOL Public PRU 102120057 KYEREMBO D/A PRIMARY SCHOOL Public SENE 102130021 BASSA PRESBYTERIAN PRIMARY SCHOOL Public SUNYANI 102140012 ABESIM PRESBY 'A' KG/PRIMARY Public SUNYANI 102140140 PRESBY DUTCH PRIMARY NSOATRE Public SUNYANI 102140154 SELI'S INTERNATIONAL SCHOOL SYL. Private TAIN 102150083 KOJEE PRESBY PRIMARY SCHOOL Public TANO NORTH 102160081 YAMFO ANGLICAN PRIMARY Public TECHIMAN 102180006 ADUTWIE L/A BASIC SCHOOL Public TECHIMAN 102180111 MAASE PREPARATORY NURSERY/KG/PRIMARY SCHOOL Private TECHIMAN 102180132 NSUTA S.D.A PRIMARY Public TECHIMAN 102180225 TWIMIA-NKWANTA R/C BASIC SCHOOL Public WENCHI 102190092 WENCHI METHODIST PRIMARY 'B' Public
CENTRAL
ABURA-ASEBU-KWAMANKESE 103010078 MUSUNKWA D/A BASIC SCHOOL Public AGONA 103020059 EDUKROM ADA PRIMARY Public AGONA 103020173 SWEDRU CALVARY METHODIST KG/PRIMARY SCHOOL Public AGONA 103020175 SWEDRU CATHOLIC 'B' BASIC SCHOOL Public AJUMAKO-ENYAN-ESSIAM 103030075 ESIAM CATHOLIC KG/PRIMARY 'A&B' Public ASIKUMA-ODOBEN-BRAKWA 103040044 BRAKWA CATHOLIC KG/PRIMARY,J.H.S Public ASIKUMA-ODOBEN-BRAKWA 103040115 TOWOBOASE D/A KG/PRIMARY SCHOOL Public ASSIN NORTH 103050059 BEREKU D/A PRIMARY Public
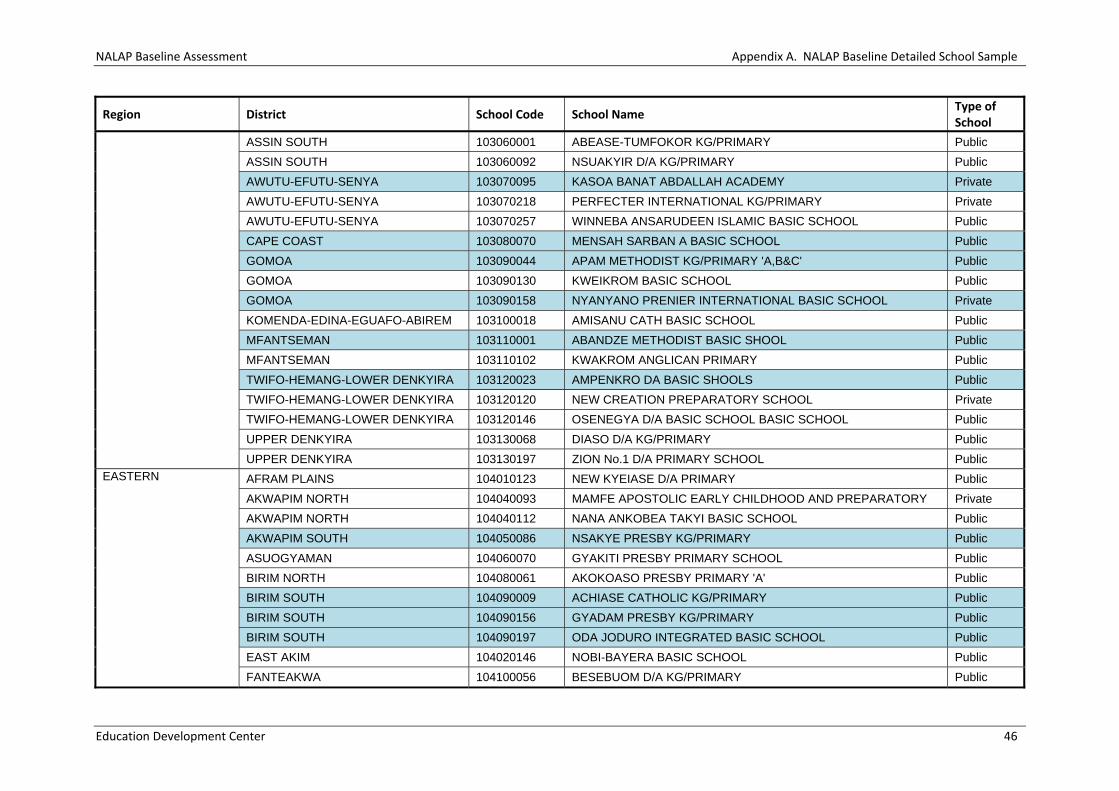
NALAP Baseline Assessment Appendix A. NALAP Baseline Detailed School Sample
Education Development Center 46
Region District School Code School Name Type of School
ASSIN SOUTH 103060001 ABEASE-TUMFOKOR KG/PRIMARY Public ASSIN SOUTH 103060092 NSUAKYIR D/A KG/PRIMARY Public AWUTU-EFUTU-SENYA 103070095 KASOA BANAT ABDALLAH ACADEMY Private AWUTU-EFUTU-SENYA 103070218 PERFECTER INTERNATIONAL KG/PRIMARY Private AWUTU-EFUTU-SENYA 103070257 WINNEBA ANSARUDEEN ISLAMIC BASIC SCHOOL Public CAPE COAST 103080070 MENSAH SARBAN A BASIC SCHOOL Public GOMOA 103090044 APAM METHODIST KG/PRIMARY 'A,B&C' Public GOMOA 103090130 KWEIKROM BASIC SCHOOL Public GOMOA 103090158 NYANYANO PRENIER INTERNATIONAL BASIC SCHOOL Private KOMENDA-EDINA-EGUAFO-ABIREM 103100018 AMISANU CATH BASIC SCHOOL Public MFANTSEMAN 103110001 ABANDZE METHODIST BASIC SHOOL Public MFANTSEMAN 103110102 KWAKROM ANGLICAN PRIMARY Public TWIFO-HEMANG-LOWER DENKYIRA 103120023 AMPENKRO DA BASIC SHOOLS Public TWIFO-HEMANG-LOWER DENKYIRA 103120120 NEW CREATION PREPARATORY SCHOOL Private TWIFO-HEMANG-LOWER DENKYIRA 103120146 OSENEGYA D/A BASIC SCHOOL BASIC SCHOOL Public UPPER DENKYIRA 103130068 DIASO D/A KG/PRIMARY Public UPPER DENKYIRA 103130197 ZION No.1 D/A PRIMARY SCHOOL Public
EASTERN
AFRAM PLAINS 104010123 NEW KYEIASE D/A PRIMARY Public AKWAPIM NORTH 104040093 MAMFE APOSTOLIC EARLY CHILDHOOD AND PREPARATORY Private AKWAPIM NORTH 104040112 NANA ANKOBEA TAKYI BASIC SCHOOL Public AKWAPIM SOUTH 104050086 NSAKYE PRESBY KG/PRIMARY Public ASUOGYAMAN 104060070 GYAKITI PRESBY PRIMARY SCHOOL Public BIRIM NORTH 104080061 AKOKOASO PRESBY PRIMARY 'A' Public BIRIM SOUTH 104090009 ACHIASE CATHOLIC KG/PRIMARY Public BIRIM SOUTH 104090156 GYADAM PRESBY KG/PRIMARY Public BIRIM SOUTH 104090197 ODA JODURO INTEGRATED BASIC SCHOOL Public EAST AKIM 104020146 NOBI-BAYERA BASIC SCHOOL Public FANTEAKWA 104100056 BESEBUOM D/A KG/PRIMARY Public
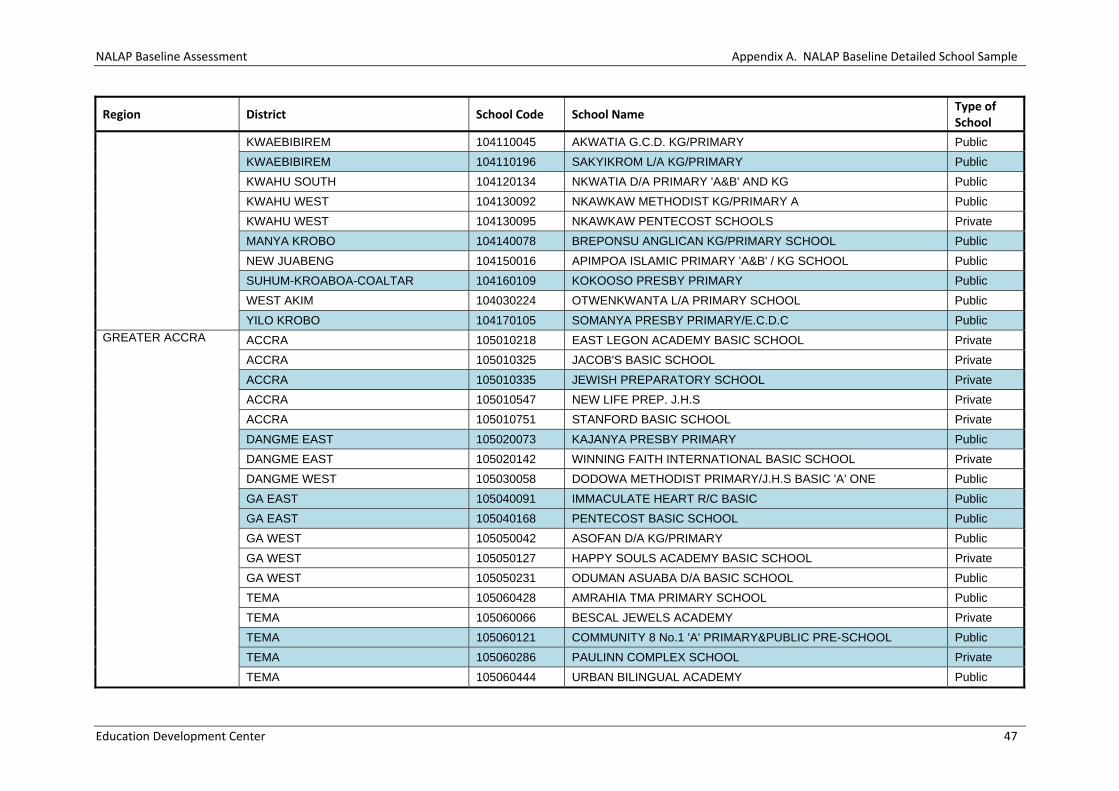
NALAP Baseline Assessment Appendix A. NALAP Baseline Detailed School Sample
Education Development Center 47
Region District School Code School Name Type of School
KWAEBIBIREM 104110045 AKWATIA G.C.D. KG/PRIMARY Public KWAEBIBIREM 104110196 SAKYIKROM L/A KG/PRIMARY Public KWAHU SOUTH 104120134 NKWATIA D/A PRIMARY 'A&B' AND KG Public KWAHU WEST 104130092 NKAWKAW METHODIST KG/PRIMARY A Public KWAHU WEST 104130095 NKAWKAW PENTECOST SCHOOLS Private MANYA KROBO 104140078 BREPONSU ANGLICAN KG/PRIMARY SCHOOL Public NEW JUABENG 104150016 APIMPOA ISLAMIC PRIMARY 'A&B' / KG SCHOOL Public SUHUM-KROABOA-COALTAR 104160109 KOKOOSO PRESBY PRIMARY Public WEST AKIM 104030224 OTWENKWANTA L/A PRIMARY SCHOOL Public YILO KROBO 104170105 SOMANYA PRESBY PRIMARY/E.C.D.C Public
GREATER ACCRA ACCRA 105010218 EAST LEGON ACADEMY BASIC SCHOOL Private ACCRA 105010325 JACOB'S BASIC SCHOOL Private ACCRA 105010335 JEWISH PREPARATORY SCHOOL Private ACCRA 105010547 NEW LIFE PREP. J.H.S Private ACCRA 105010751 STANFORD BASIC SCHOOL Private DANGME EAST 105020073 KAJANYA PRESBY PRIMARY Public DANGME EAST 105020142 WINNING FAITH INTERNATIONAL BASIC SCHOOL Private DANGME WEST 105030058 DODOWA METHODIST PRIMARY/J.H.S BASIC 'A' ONE Public GA EAST 105040091 IMMACULATE HEART R/C BASIC Public GA EAST 105040168 PENTECOST BASIC SCHOOL Public GA WEST 105050042 ASOFAN D/A KG/PRIMARY Public GA WEST 105050127 HAPPY SOULS ACADEMY BASIC SCHOOL Private GA WEST 105050231 ODUMAN ASUABA D/A BASIC SCHOOL Public TEMA 105060428 AMRAHIA TMA PRIMARY SCHOOL Public TEMA 105060066 BESCAL JEWELS ACADEMY Private TEMA 105060121 COMMUNITY 8 No.1 'A' PRIMARY&PUBLIC PRE-SCHOOL Public TEMA 105060286 PAULINN COMPLEX SCHOOL Private TEMA 105060444 URBAN BILINGUAL ACADEMY Public
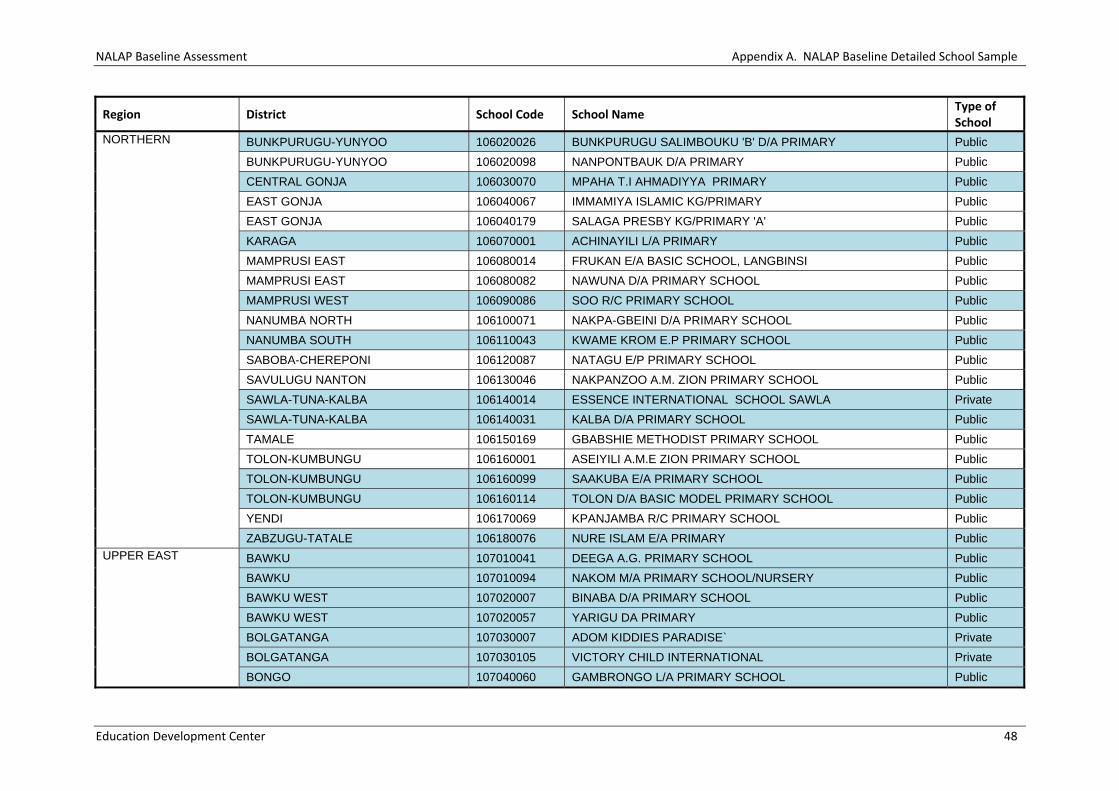
NALAP Baseline Assessment Appendix A. NALAP Baseline Detailed School Sample
Education Development Center 48
Region District School Code School Name Type of School
NORTHERN
BUNKPURUGU-YUNYOO 106020026 BUNKPURUGU SALIMBOUKU 'B' D/A PRIMARY Public BUNKPURUGU-YUNYOO 106020098 NANPONTBAUK D/A PRIMARY Public CENTRAL GONJA 106030070 MPAHA T.I AHMADIYYA PRIMARY Public EAST GONJA 106040067 IMMAMIYA ISLAMIC KG/PRIMARY Public EAST GONJA 106040179 SALAGA PRESBY KG/PRIMARY 'A' Public KARAGA 106070001 ACHINAYILI L/A PRIMARY Public MAMPRUSI EAST 106080014 FRUKAN E/A BASIC SCHOOL, LANGBINSI Public MAMPRUSI EAST 106080082 NAWUNA D/A PRIMARY SCHOOL Public MAMPRUSI WEST 106090086 SOO R/C PRIMARY SCHOOL Public NANUMBA NORTH 106100071 NAKPA-GBEINI D/A PRIMARY SCHOOL Public NANUMBA SOUTH 106110043 KWAME KROM E.P PRIMARY SCHOOL Public SABOBA-CHEREPONI 106120087 NATAGU E/P PRIMARY SCHOOL Public SAVULUGU NANTON 106130046 NAKPANZOO A.M. ZION PRIMARY SCHOOL Public SAWLA-TUNA-KALBA 106140014 ESSENCE INTERNATIONAL SCHOOL SAWLA Private SAWLA-TUNA-KALBA 106140031 KALBA D/A PRIMARY SCHOOL Public TAMALE 106150169 GBABSHIE METHODIST PRIMARY SCHOOL Public TOLON-KUMBUNGU 106160001 ASEIYILI A.M.E ZION PRIMARY SCHOOL Public TOLON-KUMBUNGU 106160099 SAAKUBA E/A PRIMARY SCHOOL Public TOLON-KUMBUNGU 106160114 TOLON D/A BASIC MODEL PRIMARY SCHOOL Public YENDI 106170069 KPANJAMBA R/C PRIMARY SCHOOL Public ZABZUGU-TATALE 106180076 NURE ISLAM E/A PRIMARY Public
UPPER EAST
BAWKU 107010041 DEEGA A.G. PRIMARY SCHOOL Public BAWKU 107010094 NAKOM M/A PRIMARY SCHOOL/NURSERY Public BAWKU WEST 107020007 BINABA D/A PRIMARY SCHOOL Public BAWKU WEST 107020057 YARIGU DA PRIMARY Public BOLGATANGA 107030007 ADOM KIDDIES PARADISE` Private BOLGATANGA 107030105 VICTORY CHILD INTERNATIONAL Private BONGO 107040060 GAMBRONGO L/A PRIMARY SCHOOL Public
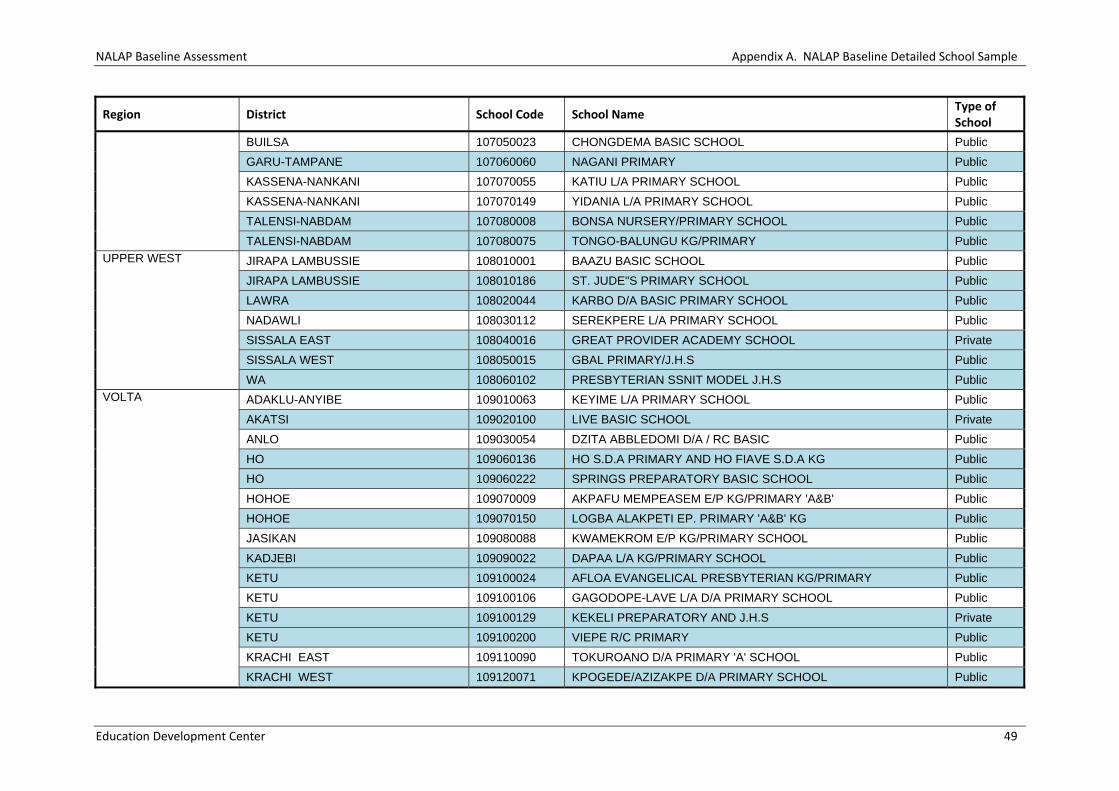
NALAP Baseline Assessment Appendix A. NALAP Baseline Detailed School Sample
Education Development Center 49
Region District School Code School Name Type of School
BUILSA 107050023 CHONGDEMA BASIC SCHOOL Public GARU-TAMPANE 107060060 NAGANI PRIMARY Public KASSENA-NANKANI 107070055 KATIU L/A PRIMARY SCHOOL Public KASSENA-NANKANI 107070149 YIDANIA L/A PRIMARY SCHOOL Public TALENSI-NABDAM 107080008 BONSA NURSERY/PRIMARY SCHOOL Public TALENSI-NABDAM 107080075 TONGO-BALUNGU KG/PRIMARY Public
UPPER WEST JIRAPA LAMBUSSIE 108010001 BAAZU BASIC SCHOOL Public JIRAPA LAMBUSSIE 108010186 ST. JUDE"S PRIMARY SCHOOL Public LAWRA 108020044 KARBO D/A BASIC PRIMARY SCHOOL Public NADAWLI 108030112 SEREKPERE L/A PRIMARY SCHOOL Public SISSALA EAST 108040016 GREAT PROVIDER ACADEMY SCHOOL Private SISSALA WEST 108050015 GBAL PRIMARY/J.H.S Public WA 108060102 PRESBYTERIAN SSNIT MODEL J.H.S Public
VOLTA
ADAKLU-ANYIBE 109010063 KEYIME L/A PRIMARY SCHOOL Public AKATSI 109020100 LIVE BASIC SCHOOL Private ANLO 109030054 DZITA ABBLEDOMI D/A / RC BASIC Public HO 109060136 HO S.D.A PRIMARY AND HO FIAVE S.D.A KG Public HO 109060222 SPRINGS PREPARATORY BASIC SCHOOL Public HOHOE 109070009 AKPAFU MEMPEASEM E/P KG/PRIMARY 'A&B' Public HOHOE 109070150 LOGBA ALAKPETI EP. PRIMARY 'A&B' KG Public JASIKAN 109080088 KWAMEKROM E/P KG/PRIMARY SCHOOL Public KADJEBI 109090022 DAPAA L/A KG/PRIMARY SCHOOL Public KETU 109100024 AFLOA EVANGELICAL PRESBYTERIAN KG/PRIMARY Public KETU 109100106 GAGODOPE-LAVE L/A D/A PRIMARY SCHOOL Public KETU 109100129 KEKELI PREPARATORY AND J.H.S Private KETU 109100200 VIEPE R/C PRIMARY Public KRACHI EAST 109110090 TOKUROANO D/A PRIMARY 'A' SCHOOL Public KRACHI WEST 109120071 KPOGEDE/AZIZAKPE D/A PRIMARY SCHOOL Public
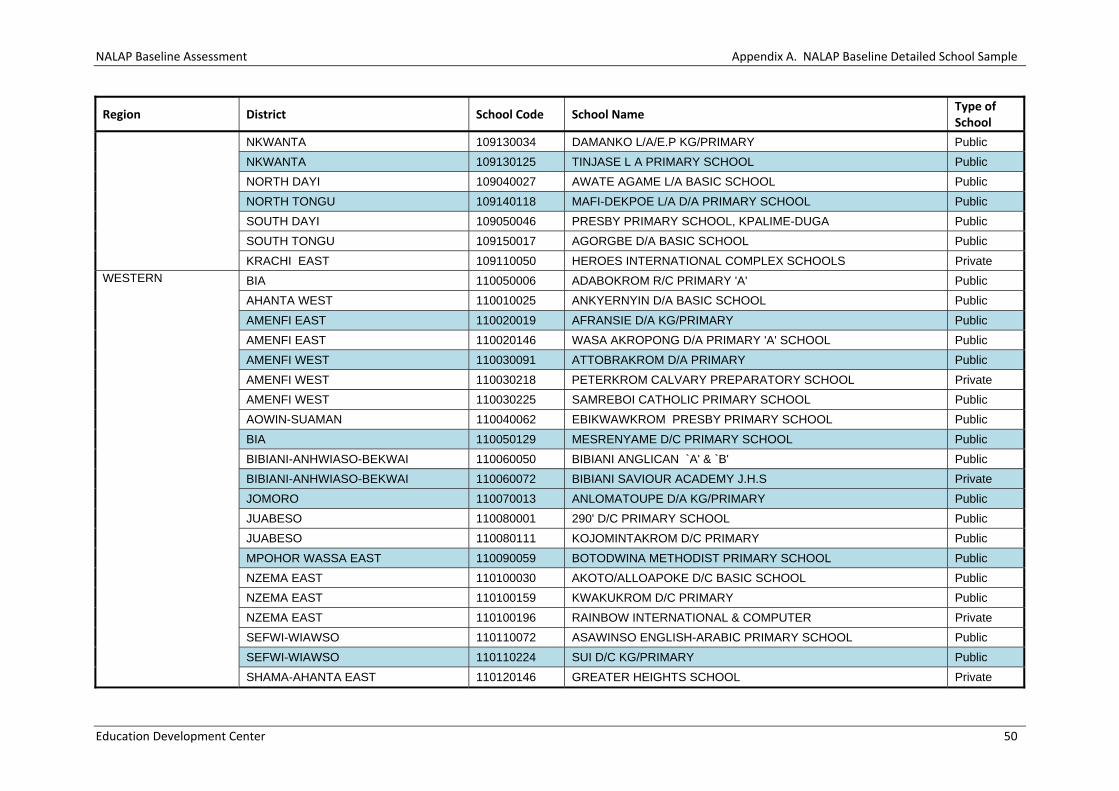
NALAP Baseline Assessment Appendix A. NALAP Baseline Detailed School Sample
Education Development Center 50
Region District School Code School Name Type of School
NKWANTA 109130034 DAMANKO L/A/E.P KG/PRIMARY Public NKWANTA 109130125 TINJASE L A PRIMARY SCHOOL Public NORTH DAYI 109040027 AWATE AGAME L/A BASIC SCHOOL Public NORTH TONGU 109140118 MAFI-DEKPOE L/A D/A PRIMARY SCHOOL Public SOUTH DAYI 109050046 PRESBY PRIMARY SCHOOL, KPALIME-DUGA Public SOUTH TONGU 109150017 AGORGBE D/A BASIC SCHOOL Public KRACHI EAST 109110050 HEROES INTERNATIONAL COMPLEX SCHOOLS Private
WESTERN
BIA 110050006 ADABOKROM R/C PRIMARY 'A' Public AHANTA WEST 110010025 ANKYERNYIN D/A BASIC SCHOOL Public AMENFI EAST 110020019 AFRANSIE D/A KG/PRIMARY Public AMENFI EAST 110020146 WASA AKROPONG D/A PRIMARY 'A' SCHOOL Public AMENFI WEST 110030091 ATTOBRAKROM D/A PRIMARY Public AMENFI WEST 110030218 PETERKROM CALVARY PREPARATORY SCHOOL Private AMENFI WEST 110030225 SAMREBOI CATHOLIC PRIMARY SCHOOL Public AOWIN-SUAMAN 110040062 EBIKWAWKROM PRESBY PRIMARY SCHOOL Public BIA 110050129 MESRENYAME D/C PRIMARY SCHOOL Public BIBIANI-ANHWIASO-BEKWAI 110060050 BIBIANI ANGLICAN `A' & `B' Public BIBIANI-ANHWIASO-BEKWAI 110060072 BIBIANI SAVIOUR ACADEMY J.H.S Private JOMORO 110070013 ANLOMATOUPE D/A KG/PRIMARY Public JUABESO 110080001 290' D/C PRIMARY SCHOOL Public JUABESO 110080111 KOJOMINTAKROM D/C PRIMARY Public MPOHOR WASSA EAST 110090059 BOTODWINA METHODIST PRIMARY SCHOOL Public NZEMA EAST 110100030 AKOTO/ALLOAPOKE D/C BASIC SCHOOL Public NZEMA EAST 110100159 KWAKUKROM D/C PRIMARY Public NZEMA EAST 110100196 RAINBOW INTERNATIONAL & COMPUTER Private SEFWI-WIAWSO 110110072 ASAWINSO ENGLISH-ARABIC PRIMARY SCHOOL Public SEFWI-WIAWSO 110110224 SUI D/C KG/PRIMARY Public SHAMA-AHANTA EAST 110120146 GREATER HEIGHTS SCHOOL Private
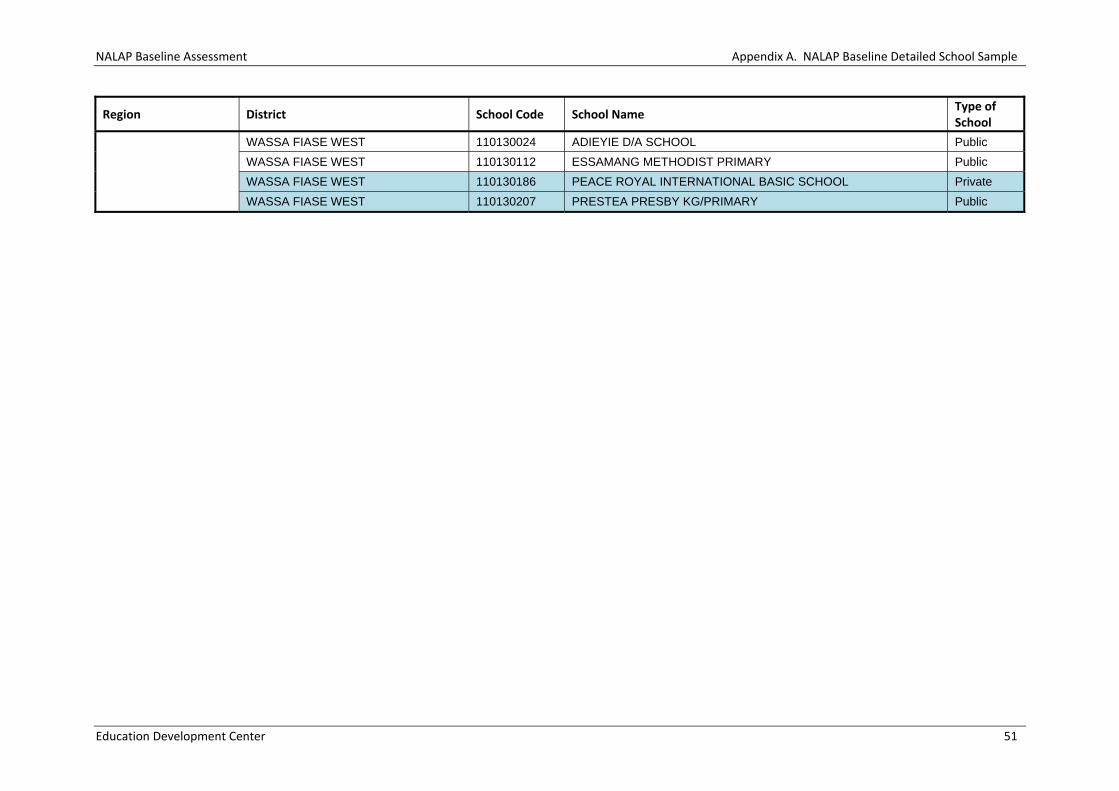
NALAP Baseline Assessment Appendix A. NALAP Baseline Detailed School Sample
Education Development Center 51
Region District School Code School Name Type of School
WASSA FIASE WEST 110130024 ADIEYIE D/A SCHOOL Public WASSA FIASE WEST 110130112 ESSAMANG METHODIST PRIMARY Public WASSA FIASE WEST 110130186 PEACE ROYAL INTERNATIONAL BASIC SCHOOL Private WASSA FIASE WEST 110130207 PRESTEA PRESBY KG/PRIMARY Public

Education Development Center 53
APPENDIX B. NALAP CLASSROOM OBSERVATION INSTRUMENT
NATIONAL LITERACY ACCELERATION PROGRAM
Classroom Observation Instrument
Baseline Assessment, February 2009
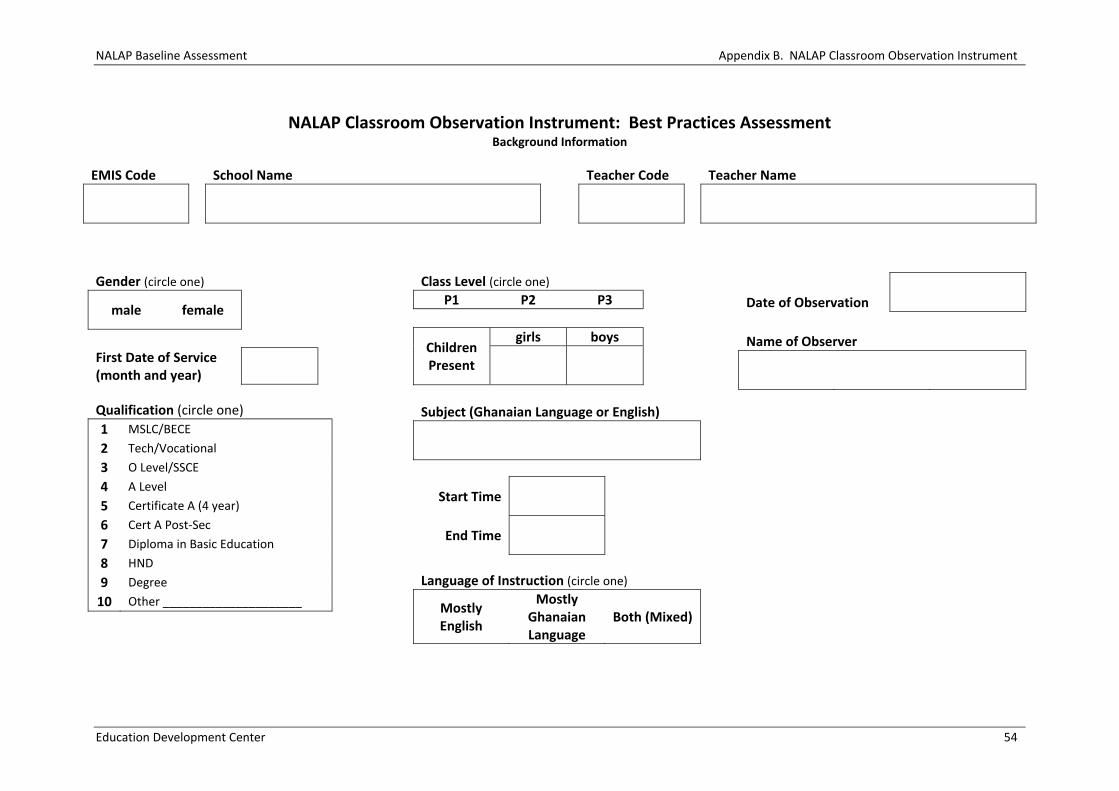
NALAP Baseline Assessment Appendix B. NALAP Classroom Observation Instrument
Education Development Center 54
NALAP Classroom Observation Instrument: Best Practices Assessment Background Information
EMIS Code School Name Teacher Code Teacher Name
Gender (circle one)
male female
First Date of Service (month and year)
Qualification (circle one) 1 MSLC/BECE
2 Tech/Vocational
3 O Level/SSCE
4 A Level
5 Certificate A (4 year)
6 Cert A Post‐Sec
7 Diploma in Basic Education
8 HND
9 Degree
10 Other _____________________
Class Level (circle one)
P1 P2 P3
Children Present
girls boys
Subject (Ghanaian Language or English)
Start Time
End Time
Language of Instruction (circle one)
Mostly English
Mostly Ghanaian Language
Both (Mixed)
Date of Observation
Name of Observer
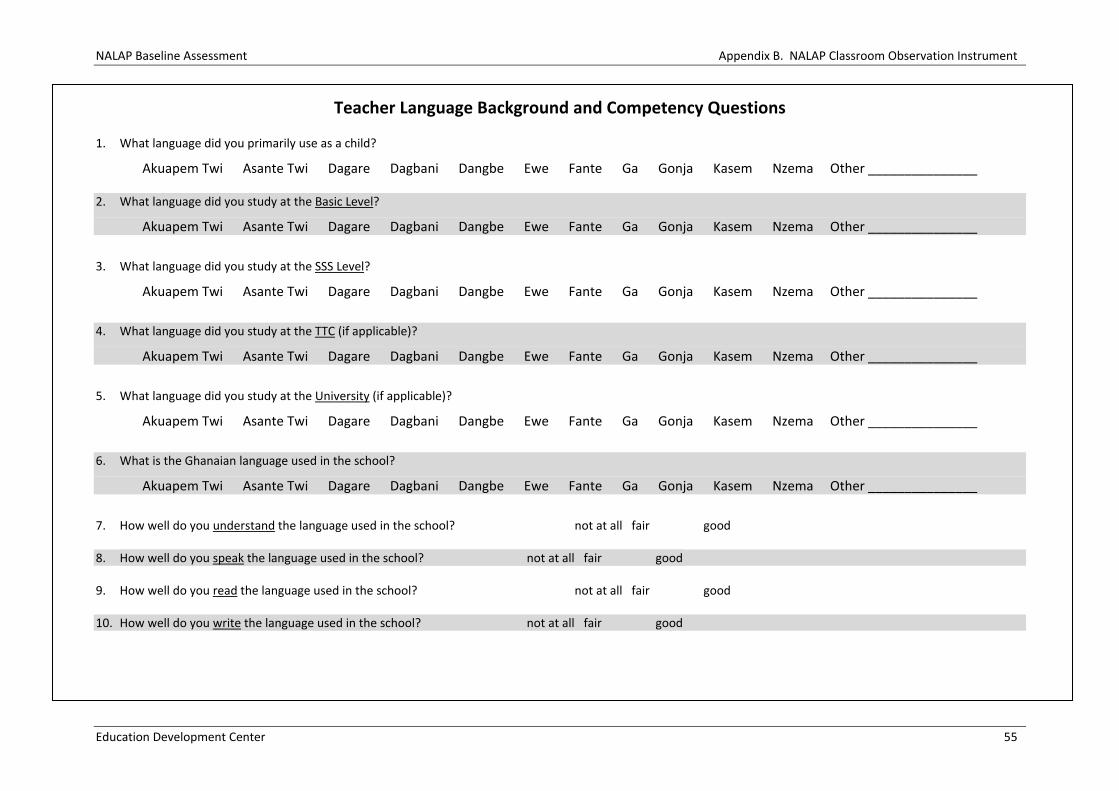
NALAP Baseline Assessment Appendix B. NALAP Classroom Observation Instrument
Education Development Center 55
Teacher Language Background and Competency Questions 1. What language did you primarily use as a child?
Akuapem Twi Asante Twi Dagare Dagbani Dangbe Ewe Fante Ga Gonja Kasem Nzema Other _______________ 2. What language did you study at the Basic Level?
Akuapem Twi Asante Twi Dagare Dagbani Dangbe Ewe Fante Ga Gonja Kasem Nzema Other _______________
3. What language did you study at the SSS Level?
Akuapem Twi Asante Twi Dagare Dagbani Dangbe Ewe Fante Ga Gonja Kasem Nzema Other _______________
4. What language did you study at the TTC (if applicable)?
Akuapem Twi Asante Twi Dagare Dagbani Dangbe Ewe Fante Ga Gonja Kasem Nzema Other _______________
5. What language did you study at the University (if applicable)?
Akuapem Twi Asante Twi Dagare Dagbani Dangbe Ewe Fante Ga Gonja Kasem Nzema Other _______________
6. What is the Ghanaian language used in the school?
Akuapem Twi Asante Twi Dagare Dagbani Dangbe Ewe Fante Ga Gonja Kasem Nzema Other _______________
7. How well do you understand the language used in the school? not at all fair good 8. How well do you speak the language used in the school? not at all fair good 9. How well do you read the language used in the school? not at all fair good 10. How well do you write the language used in the school? not at all fair good
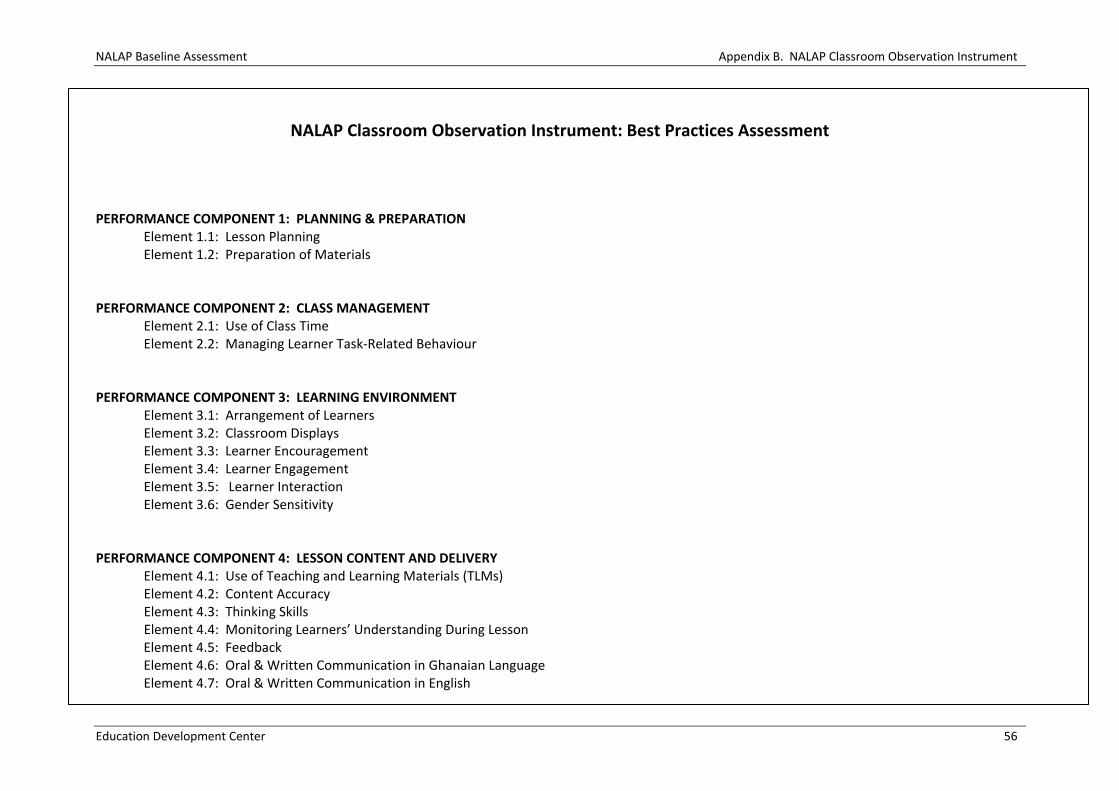
NALAP Baseline Assessment Appendix B. NALAP Classroom Observation Instrument
Education Development Center 56
NALAP Classroom Observation Instrument: Best Practices Assessment
PERFORMANCE COMPONENT 1: PLANNING & PREPARATION Element 1.1: Lesson Planning
Element 1.2: Preparation of Materials PERFORMANCE COMPONENT 2: CLASS MANAGEMENT Element 2.1: Use of Class Time Element 2.2: Managing Learner Task‐Related Behaviour PERFORMANCE COMPONENT 3: LEARNING ENVIRONMENT Element 3.1: Arrangement of Learners Element 3.2: Classroom Displays Element 3.3: Learner Encouragement
Element 3.4: Learner Engagement Element 3.5: Learner Interaction
Element 3.6: Gender Sensitivity PERFORMANCE COMPONENT 4: LESSON CONTENT AND DELIVERY Element 4.1: Use of Teaching and Learning Materials (TLMs) Element 4.2: Content Accuracy Element 4.3: Thinking Skills Element 4.4: Monitoring Learners’ Understanding During Lesson Element 4.5: Feedback Element 4.6: Oral & Written Communication in Ghanaian Language Element 4.7: Oral & Written Communication in English
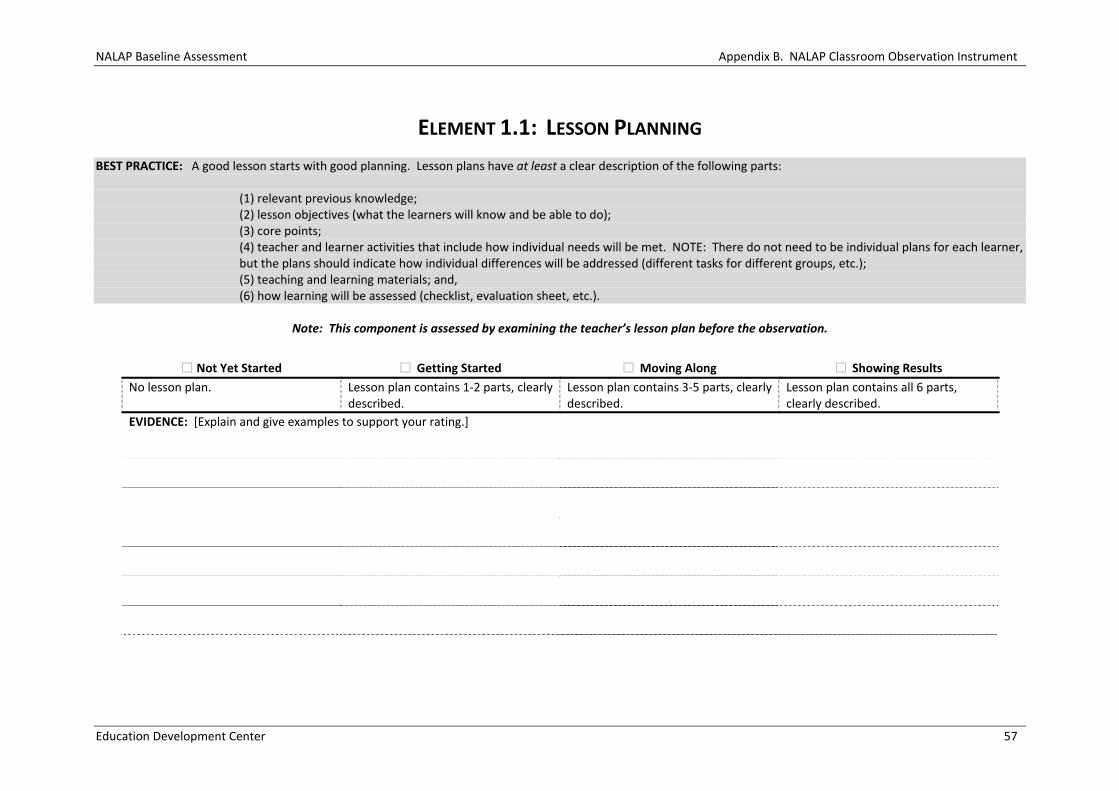
NALAP Baseline Assessment Appendix B. NALAP Classroom Observation Instrument
Education Development Center 57
ELEMENT 1.1: LESSON PLANNING BEST PRACTICE: A good lesson starts with good planning. Lesson plans have at least a clear description of the following parts: (1) relevant previous knowledge; (2) lesson objectives (what the learners will know and be able to do); (3) core points; (4) teacher and learner activities that include how individual needs will be met. NOTE: There do not need to be individual plans for each learner,
but the plans should indicate how individual differences will be addressed (different tasks for different groups, etc.); (5) teaching and learning materials; and, (6) how learning will be assessed (checklist, evaluation sheet, etc.).
Note: This component is assessed by examining the teacher’s lesson plan before the observation.
Not Yet Started Getting Started Moving Along Showing Results
No lesson plan. Lesson plan contains 1‐2 parts, clearly described.
Lesson plan contains 3‐5 parts, clearly described.
Lesson plan contains all 6 parts, clearly described.
EVIDENCE: [Explain and give examples to support your rating.]
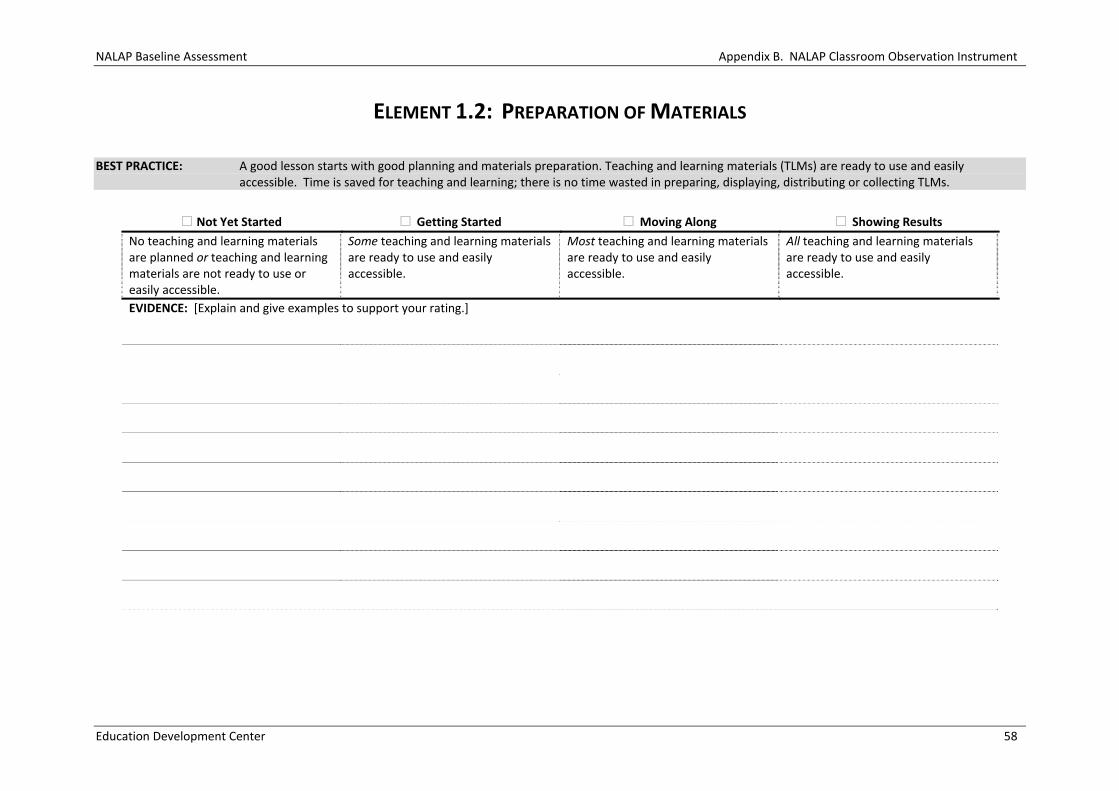
NALAP Baseline Assessment Appendix B. NALAP Classroom Observation Instrument
Education Development Center 58
ELEMENT 1.2: PREPARATION OF MATERIALS BEST PRACTICE: A good lesson starts with good planning and materials preparation. Teaching and learning materials (TLMs) are ready to use and easily
accessible. Time is saved for teaching and learning; there is no time wasted in preparing, displaying, distributing or collecting TLMs.
Not Yet Started Getting Started Moving Along Showing Results
No teaching and learning materials are planned or teaching and learning materials are not ready to use or easily accessible.
Some teaching and learning materials are ready to use and easily accessible.
Most teaching and learning materials are ready to use and easily accessible.
All teaching and learning materials are ready to use and easily accessible.
EVIDENCE: [Explain and give examples to support your rating.]
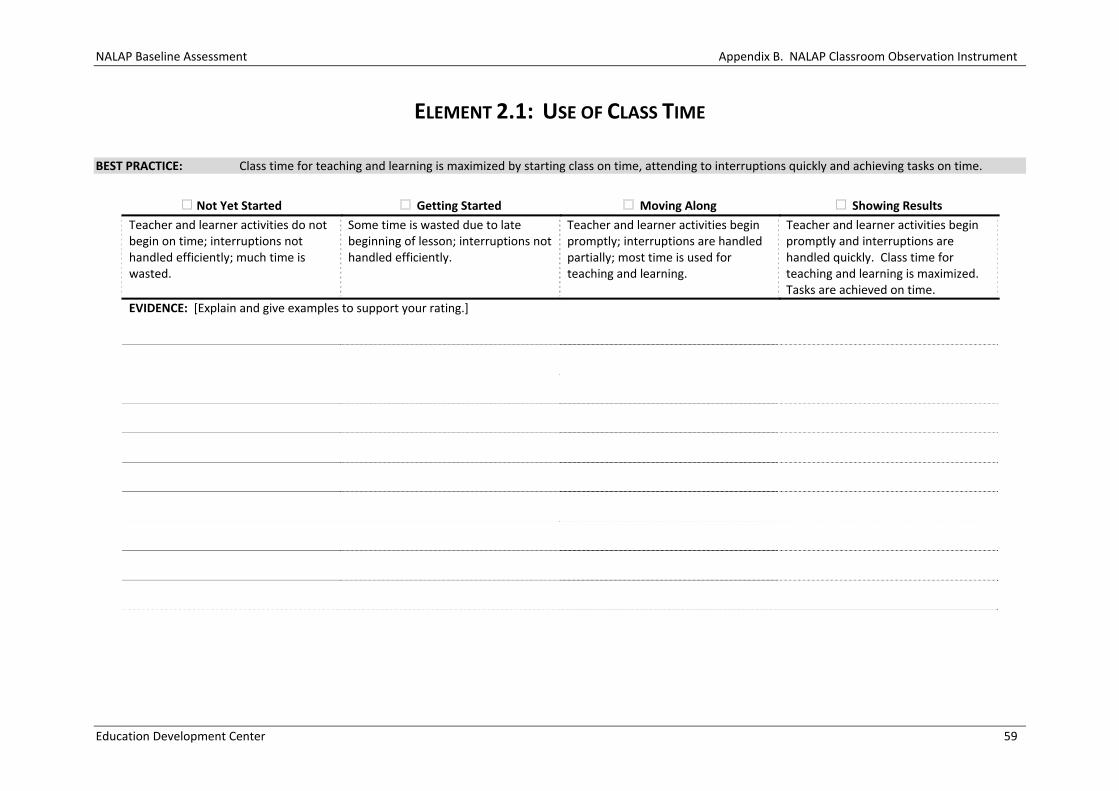
NALAP Baseline Assessment Appendix B. NALAP Classroom Observation Instrument
Education Development Center 59
ELEMENT 2.1: USE OF CLASS TIME BEST PRACTICE: Class time for teaching and learning is maximized by starting class on time, attending to interruptions quickly and achieving tasks on time.
Not Yet Started Getting Started Moving Along Showing Results
Teacher and learner activities do not begin on time; interruptions not handled efficiently; much time is wasted.
Some time is wasted due to late beginning of lesson; interruptions not handled efficiently.
Teacher and learner activities begin promptly; interruptions are handled partially; most time is used for teaching and learning.
Teacher and learner activities begin promptly and interruptions are handled quickly. Class time for teaching and learning is maximized. Tasks are achieved on time.
EVIDENCE: [Explain and give examples to support your rating.]
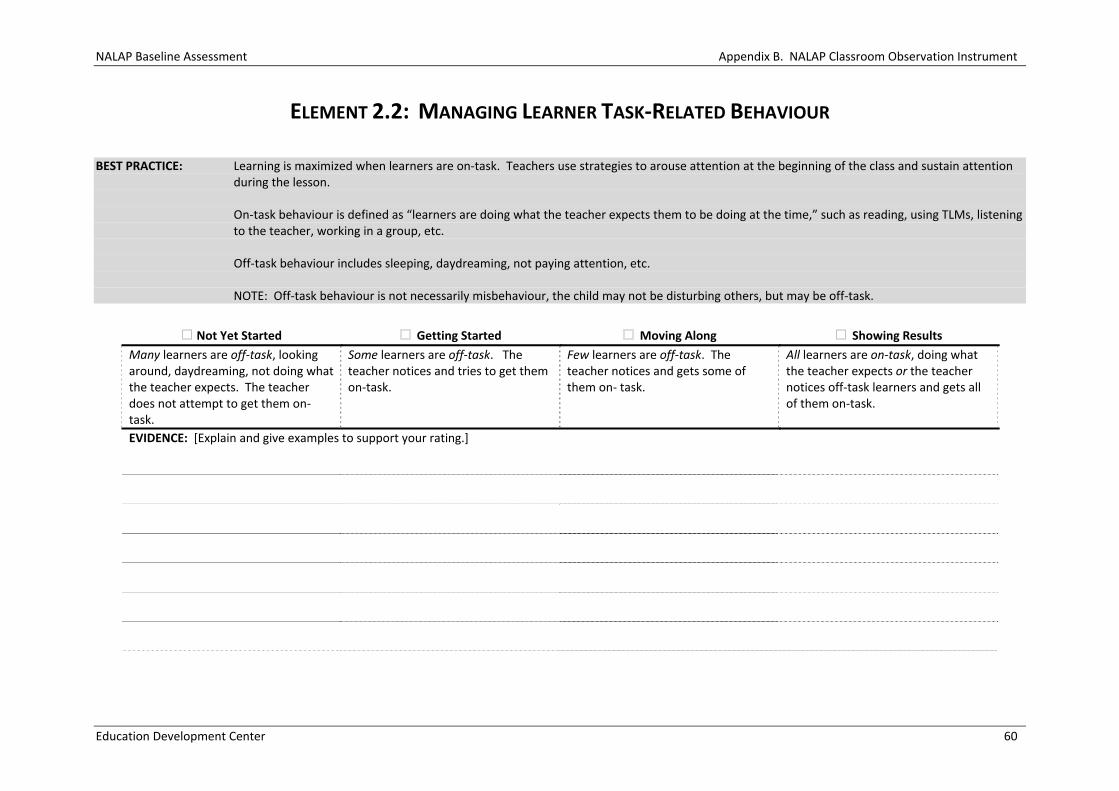
NALAP Baseline Assessment Appendix B. NALAP Classroom Observation Instrument
Education Development Center 60
ELEMENT 2.2: MANAGING LEARNER TASK‐RELATED BEHAVIOUR BEST PRACTICE: Learning is maximized when learners are on‐task. Teachers use strategies to arouse attention at the beginning of the class and sustain attention
during the lesson. On‐task behaviour is defined as “learners are doing what the teacher expects them to be doing at the time,” such as reading, using TLMs, listening
to the teacher, working in a group, etc. Off‐task behaviour includes sleeping, daydreaming, not paying attention, etc. NOTE: Off‐task behaviour is not necessarily misbehaviour, the child may not be disturbing others, but may be off‐task.
Not Yet Started Getting Started Moving Along Showing Results
Many learners are off‐task, looking around, daydreaming, not doing what the teacher expects. The teacher does not attempt to get them on‐task.
Some learners are off‐task. The teacher notices and tries to get them on‐task.
Few learners are off‐task. The teacher notices and gets some of them on‐ task.
All learners are on‐task, doing what the teacher expects or the teacher notices off‐task learners and gets all of them on‐task.
EVIDENCE: [Explain and give examples to support your rating.]
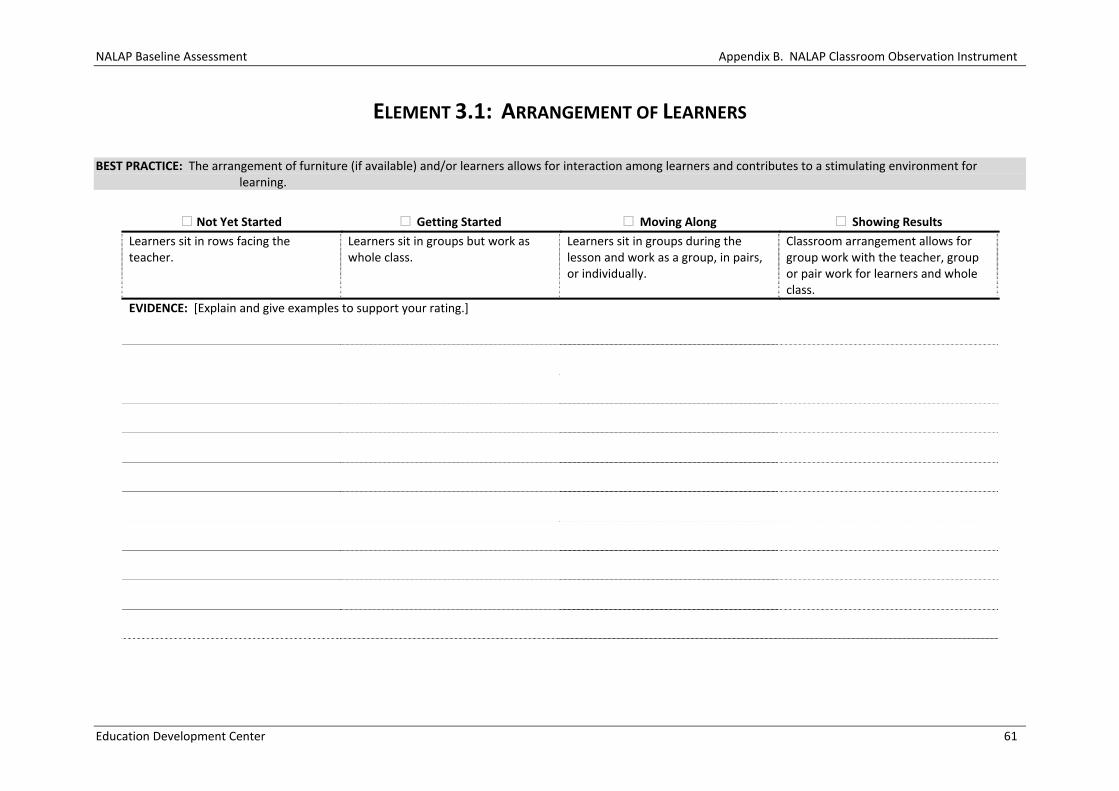
NALAP Baseline Assessment Appendix B. NALAP Classroom Observation Instrument
Education Development Center 61
ELEMENT 3.1: ARRANGEMENT OF LEARNERS BEST PRACTICE: The arrangement of furniture (if available) and/or learners allows for interaction among learners and contributes to a stimulating environment for
learning.
Not Yet Started Getting Started Moving Along Showing Results
Learners sit in rows facing the teacher.
Learners sit in groups but work as whole class.
Learners sit in groups during the lesson and work as a group, in pairs, or individually.
Classroom arrangement allows for group work with the teacher, group or pair work for learners and whole class.
EVIDENCE: [Explain and give examples to support your rating.]
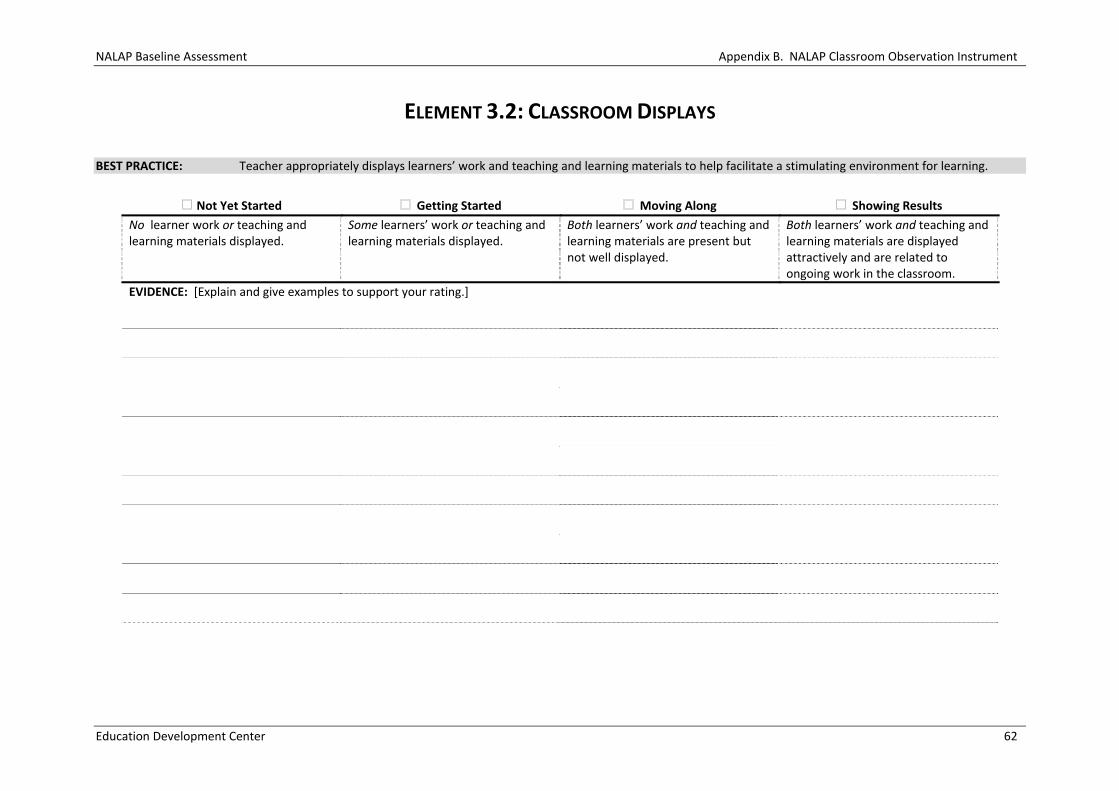
NALAP Baseline Assessment Appendix B. NALAP Classroom Observation Instrument
Education Development Center 62
ELEMENT 3.2: CLASSROOM DISPLAYS BEST PRACTICE: Teacher appropriately displays learners’ work and teaching and learning materials to help facilitate a stimulating environment for learning.
Not Yet Started Getting Started Moving Along Showing Results
No learner work or teaching and learning materials displayed.
Some learners’ work or teaching and learning materials displayed.
Both learners’ work and teaching and learning materials are present but not well displayed.
Both learners’ work and teaching and learning materials are displayed attractively and are related to ongoing work in the classroom.
EVIDENCE: [Explain and give examples to support your rating.]
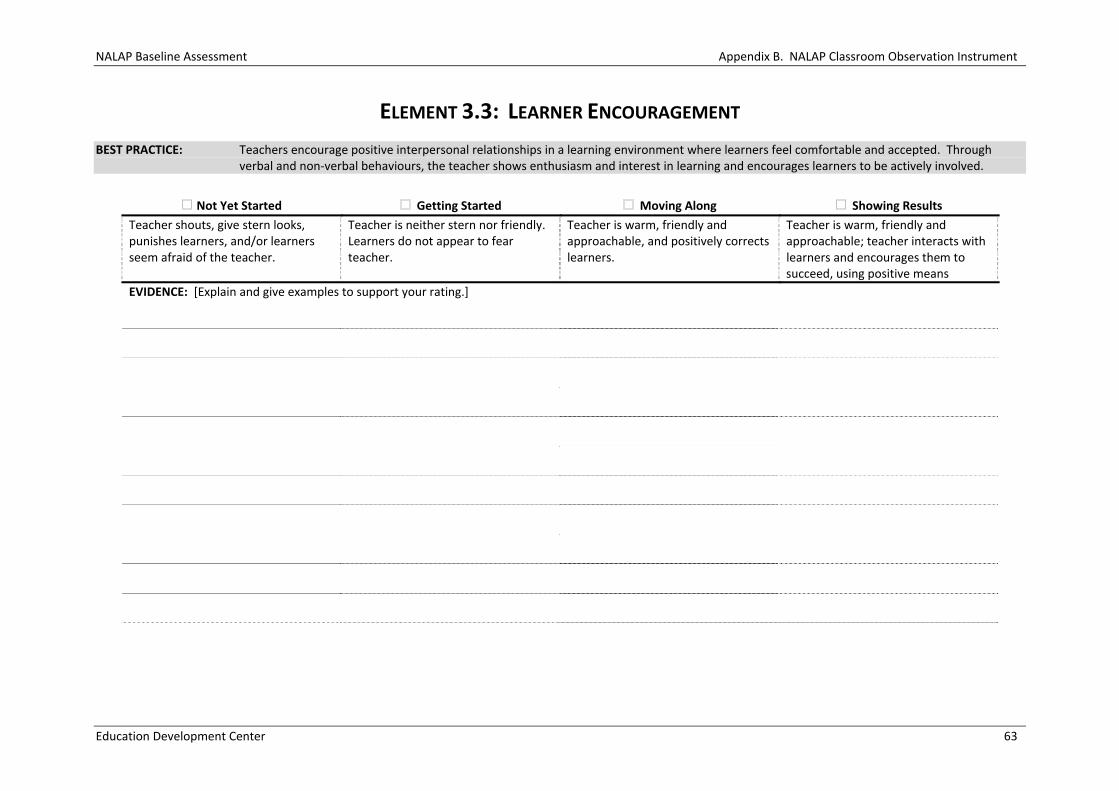
NALAP Baseline Assessment Appendix B. NALAP Classroom Observation Instrument
Education Development Center 63
ELEMENT 3.3: LEARNER ENCOURAGEMENT BEST PRACTICE: Teachers encourage positive interpersonal relationships in a learning environment where learners feel comfortable and accepted. Through
verbal and non‐verbal behaviours, the teacher shows enthusiasm and interest in learning and encourages learners to be actively involved.
Not Yet Started Getting Started Moving Along Showing Results
Teacher shouts, give stern looks, punishes learners, and/or learners seem afraid of the teacher.
Teacher is neither stern nor friendly. Learners do not appear to fear teacher.
Teacher is warm, friendly and approachable, and positively corrects learners.
Teacher is warm, friendly and approachable; teacher interacts with learners and encourages them to succeed, using positive means
EVIDENCE: [Explain and give examples to support your rating.]
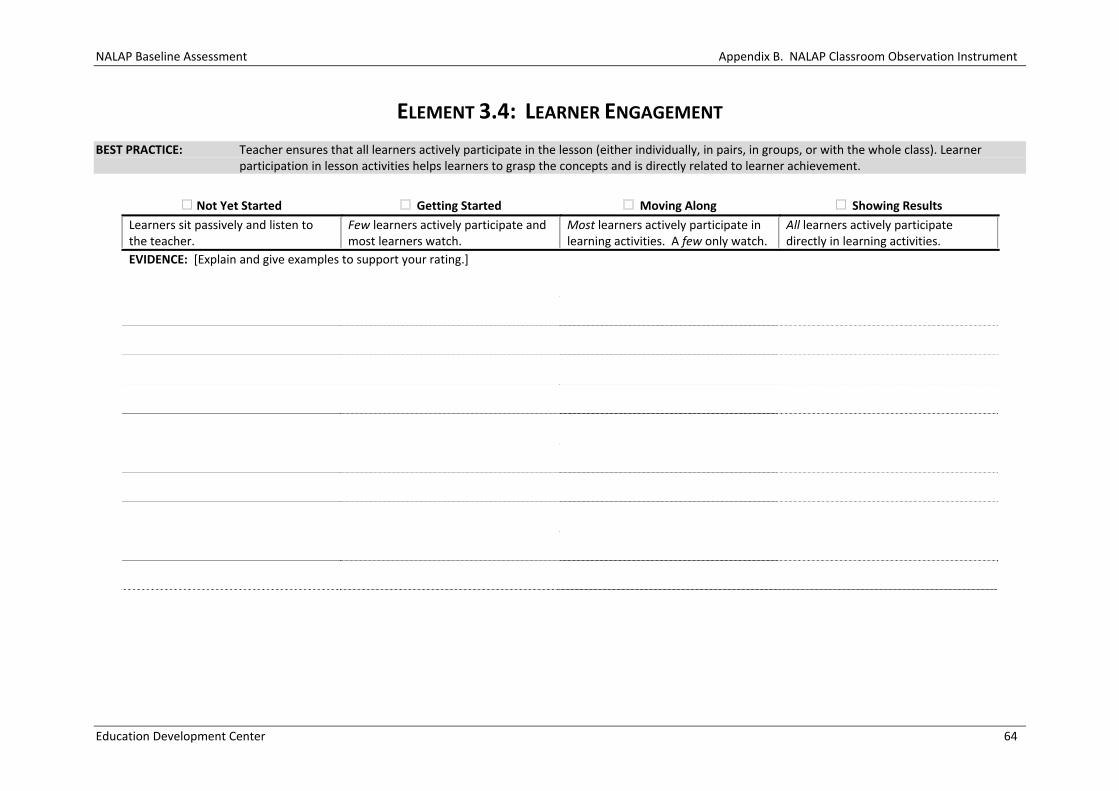
NALAP Baseline Assessment Appendix B. NALAP Classroom Observation Instrument
Education Development Center 64
ELEMENT 3.4: LEARNER ENGAGEMENT BEST PRACTICE: Teacher ensures that all learners actively participate in the lesson (either individually, in pairs, in groups, or with the whole class). Learner
participation in lesson activities helps learners to grasp the concepts and is directly related to learner achievement.
Not Yet Started Getting Started Moving Along Showing Results
Learners sit passively and listen to the teacher.
Few learners actively participate and most learners watch.
Most learners actively participate in learning activities. A few only watch.
All learners actively participate directly in learning activities.
EVIDENCE: [Explain and give examples to support your rating.]
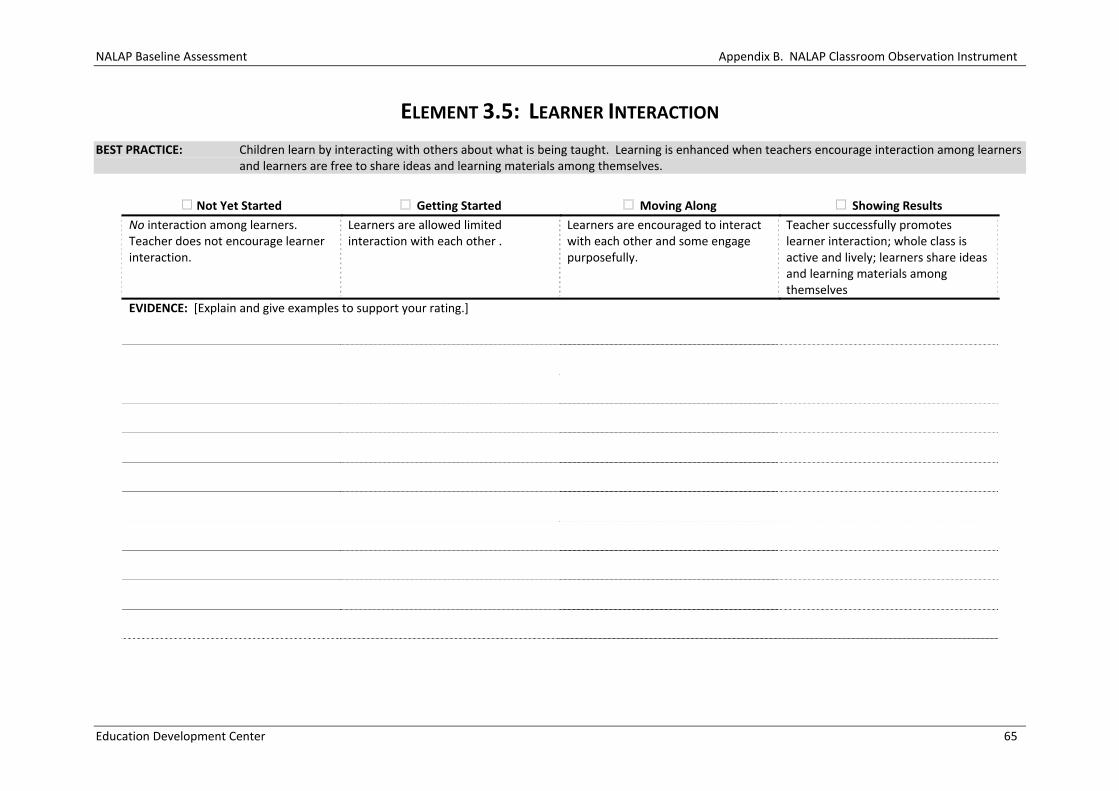
NALAP Baseline Assessment Appendix B. NALAP Classroom Observation Instrument
Education Development Center 65
ELEMENT 3.5: LEARNER INTERACTION BEST PRACTICE: Children learn by interacting with others about what is being taught. Learning is enhanced when teachers encourage interaction among learners
and learners are free to share ideas and learning materials among themselves.
Not Yet Started Getting Started Moving Along Showing Results
No interaction among learners. Teacher does not encourage learner interaction.
Learners are allowed limited interaction with each other .
Learners are encouraged to interact with each other and some engage purposefully.
Teacher successfully promotes learner interaction; whole class is active and lively; learners share ideas and learning materials among themselves
EVIDENCE: [Explain and give examples to support your rating.]
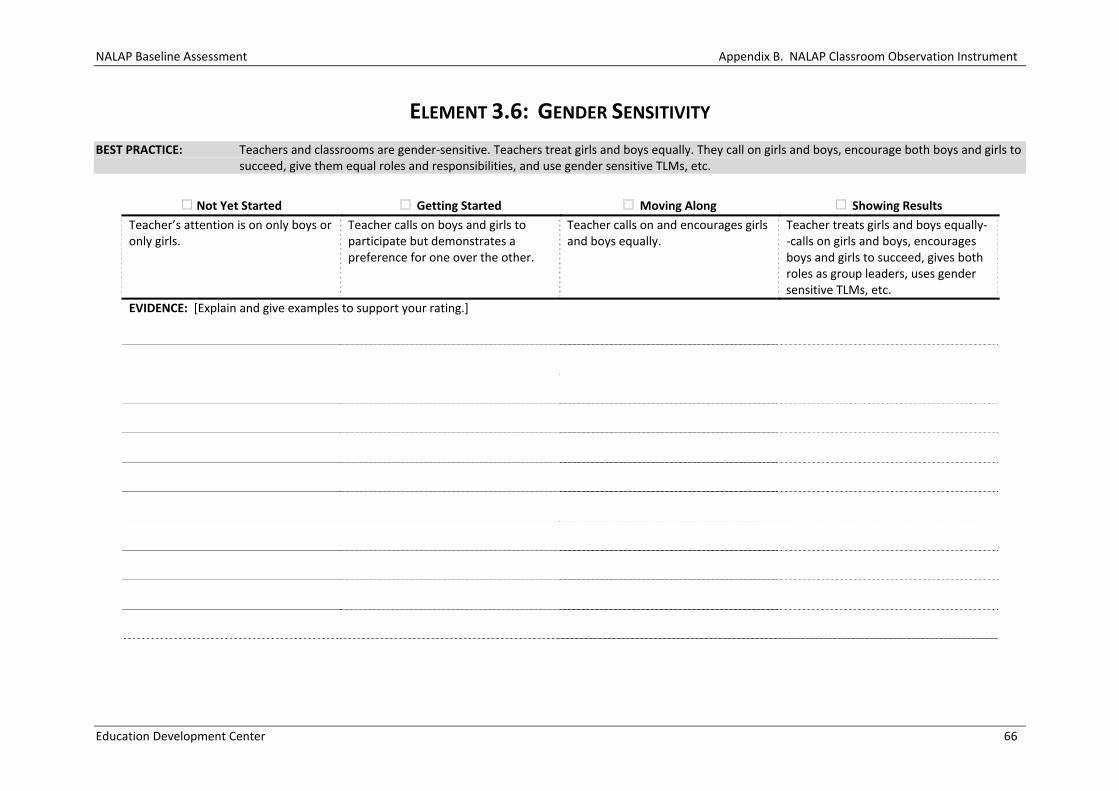
NALAP Baseline Assessment Appendix B. NALAP Classroom Observation Instrument
Education Development Center 66
ELEMENT 3.6: GENDER SENSITIVITY BEST PRACTICE: Teachers and classrooms are gender‐sensitive. Teachers treat girls and boys equally. They call on girls and boys, encourage both boys and girls to
succeed, give them equal roles and responsibilities, and use gender sensitive TLMs, etc.
Not Yet Started Getting Started Moving Along Showing Results
Teacher’s attention is on only boys or only girls.
Teacher calls on boys and girls to participate but demonstrates a preference for one over the other.
Teacher calls on and encourages girls and boys equally.
Teacher treats girls and boys equally‐‐calls on girls and boys, encourages boys and girls to succeed, gives both roles as group leaders, uses gender sensitive TLMs, etc.
EVIDENCE: [Explain and give examples to support your rating.]
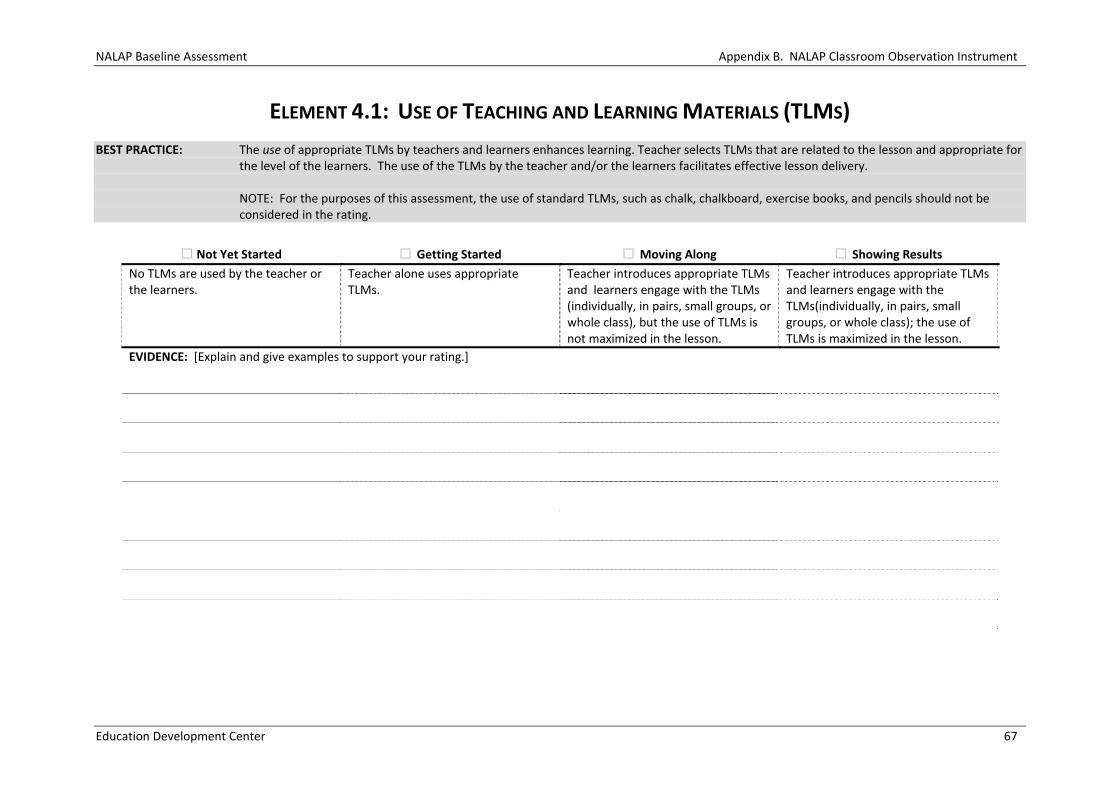
NALAP Baseline Assessment Appendix B. NALAP Classroom Observation Instrument
Education Development Center 67
ELEMENT 4.1: USE OF TEACHING AND LEARNING MATERIALS (TLMS)
BEST PRACTICE: The use of appropriate TLMs by teachers and learners enhances learning. Teacher selects TLMs that are related to the lesson and appropriate for the level of the learners. The use of the TLMs by the teacher and/or the learners facilitates effective lesson delivery.
NOTE: For the purposes of this assessment, the use of standard TLMs, such as chalk, chalkboard, exercise books, and pencils should not be
considered in the rating.
Not Yet Started Getting Started Moving Along Showing Results
No TLMs are used by the teacher or the learners.
Teacher alone uses appropriate TLMs.
Teacher introduces appropriate TLMs and learners engage with the TLMs (individually, in pairs, small groups, or whole class), but the use of TLMs is not maximized in the lesson.
Teacher introduces appropriate TLMs and learners engage with the TLMs(individually, in pairs, small groups, or whole class); the use of TLMs is maximized in the lesson.
EVIDENCE: [Explain and give examples to support your rating.]

NALAP Baseline Assessment Appendix B. NALAP Classroom Observation Instrument
Education Development Center 68
ELEMENT 4.2: CONTENT ACCURACY BEST PRACTICE: When teachers know the content well, they can give multiple examples and explain concepts in different ways. The teacher is thoroughly
knowledgeable of the content of the lesson, and explanations of lesson content are accurate and clear to the learners.
Not Yet Started Getting Started Moving Along Showing Results
The teacher gives much inaccurate information or the explanations are not clear to learners.
The teacher makes few content errors. Some explanations are not clear to learners.
The teacher makes no error in content. Explanations are clear to learners.
The teacher shows that he or she knows the content being taught. Explanations are clear and the teacher uses several examples and/or explains concepts in different ways to reach all learners.
EVIDENCE: [Explain and give examples to support your rating.]
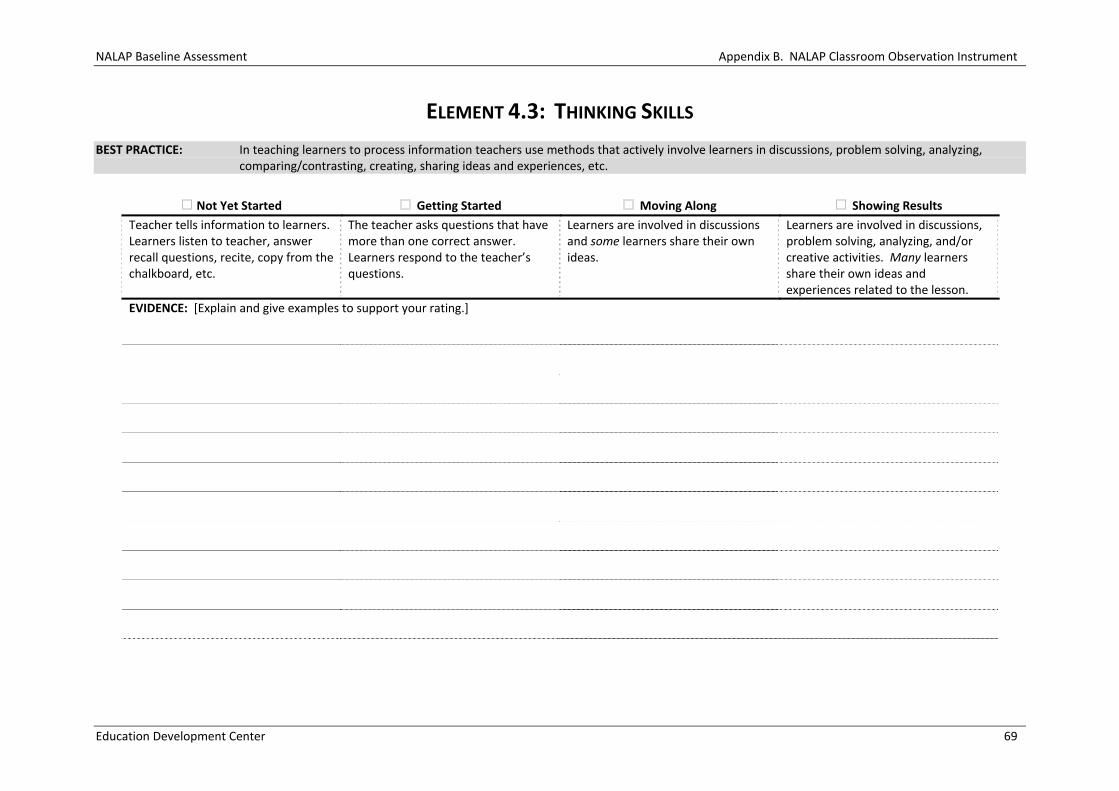
NALAP Baseline Assessment Appendix B. NALAP Classroom Observation Instrument
Education Development Center 69
ELEMENT 4.3: THINKING SKILLS
BEST PRACTICE: In teaching learners to process information teachers use methods that actively involve learners in discussions, problem solving, analyzing, comparing/contrasting, creating, sharing ideas and experiences, etc.
Not Yet Started Getting Started Moving Along Showing Results
Teacher tells information to learners. Learners listen to teacher, answer recall questions, recite, copy from the chalkboard, etc.
The teacher asks questions that have more than one correct answer. Learners respond to the teacher’s questions.
Learners are involved in discussions and some learners share their own ideas.
Learners are involved in discussions, problem solving, analyzing, and/or creative activities. Many learners share their own ideas and experiences related to the lesson.
EVIDENCE: [Explain and give examples to support your rating.]
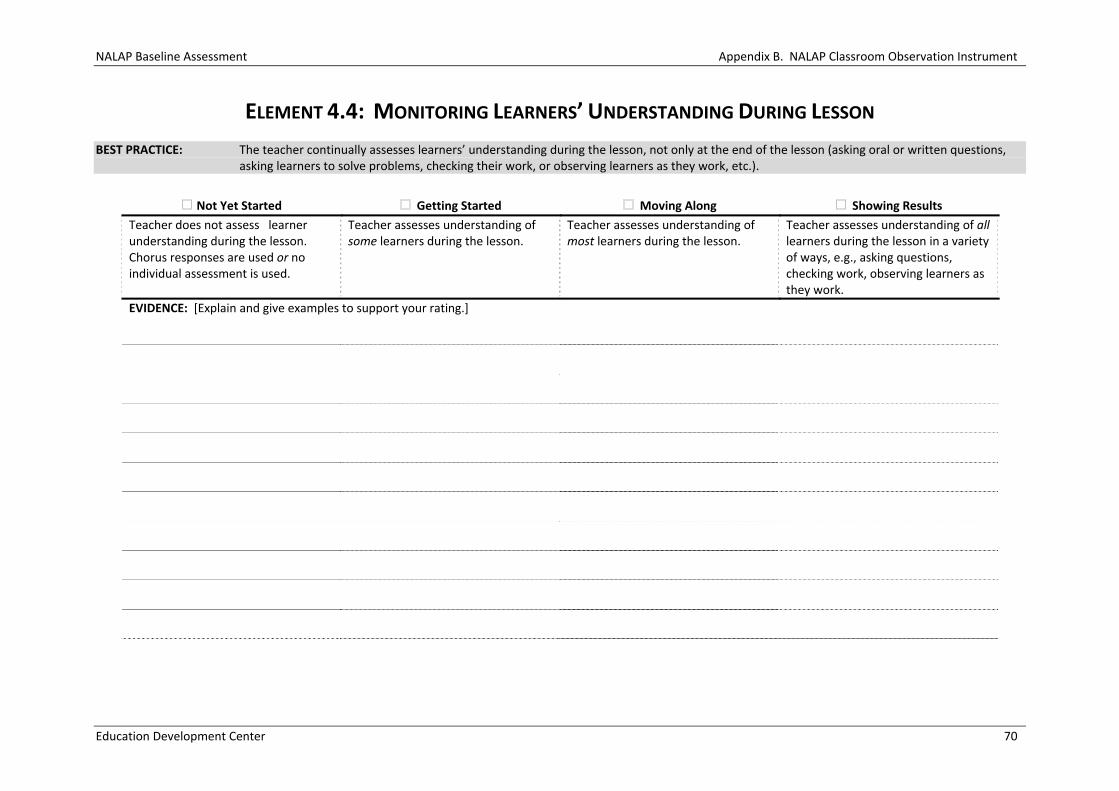
NALAP Baseline Assessment Appendix B. NALAP Classroom Observation Instrument
Education Development Center 70
ELEMENT 4.4: MONITORING LEARNERS’ UNDERSTANDING DURING LESSON BEST PRACTICE: The teacher continually assesses learners’ understanding during the lesson, not only at the end of the lesson (asking oral or written questions,
asking learners to solve problems, checking their work, or observing learners as they work, etc.).
Not Yet Started Getting Started Moving Along Showing Results
Teacher does not assess learner understanding during the lesson. Chorus responses are used or no individual assessment is used.
Teacher assesses understanding of some learners during the lesson.
Teacher assesses understanding of most learners during the lesson.
Teacher assesses understanding of all learners during the lesson in a variety of ways, e.g., asking questions, checking work, observing learners as they work.
EVIDENCE: [Explain and give examples to support your rating.]
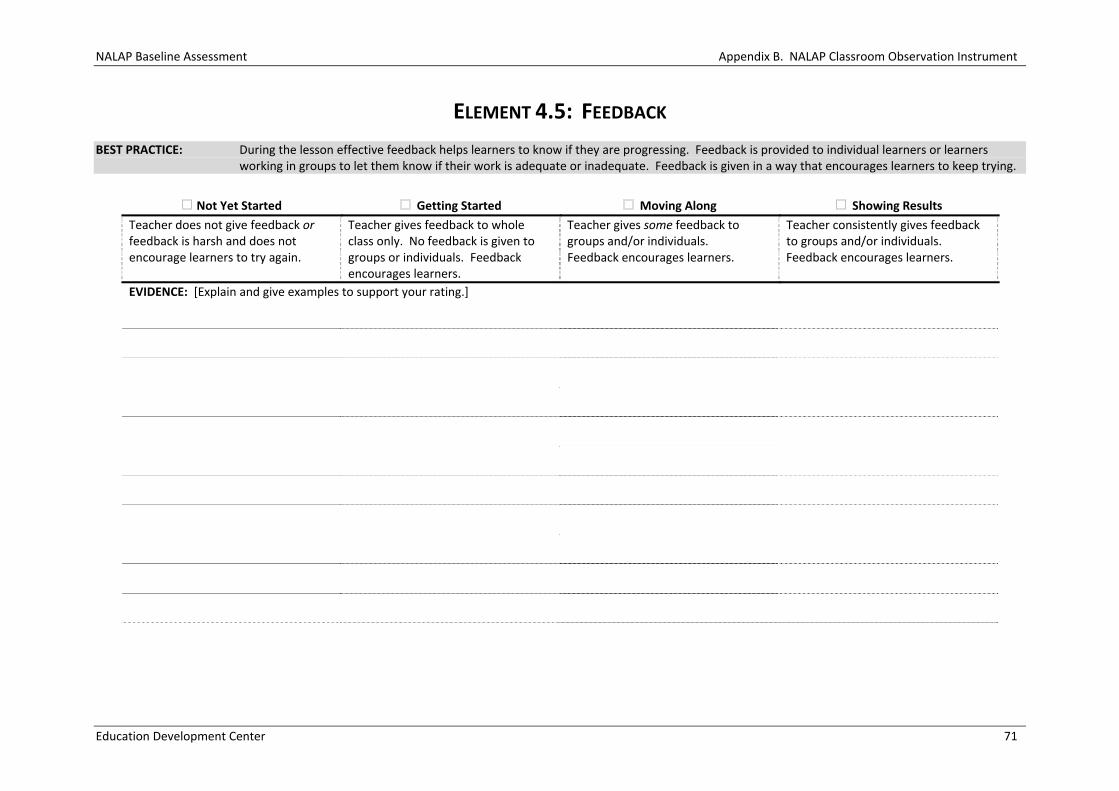
NALAP Baseline Assessment Appendix B. NALAP Classroom Observation Instrument
Education Development Center 71
ELEMENT 4.5: FEEDBACK BEST PRACTICE: During the lesson effective feedback helps learners to know if they are progressing. Feedback is provided to individual learners or learners
working in groups to let them know if their work is adequate or inadequate. Feedback is given in a way that encourages learners to keep trying.
Not Yet Started Getting Started Moving Along Showing Results
Teacher does not give feedback or feedback is harsh and does not encourage learners to try again.
Teacher gives feedback to whole class only. No feedback is given to groups or individuals. Feedback encourages learners.
Teacher gives some feedback to groups and/or individuals. Feedback encourages learners.
Teacher consistently gives feedback to groups and/or individuals. Feedback encourages learners.
EVIDENCE: [Explain and give examples to support your rating.]
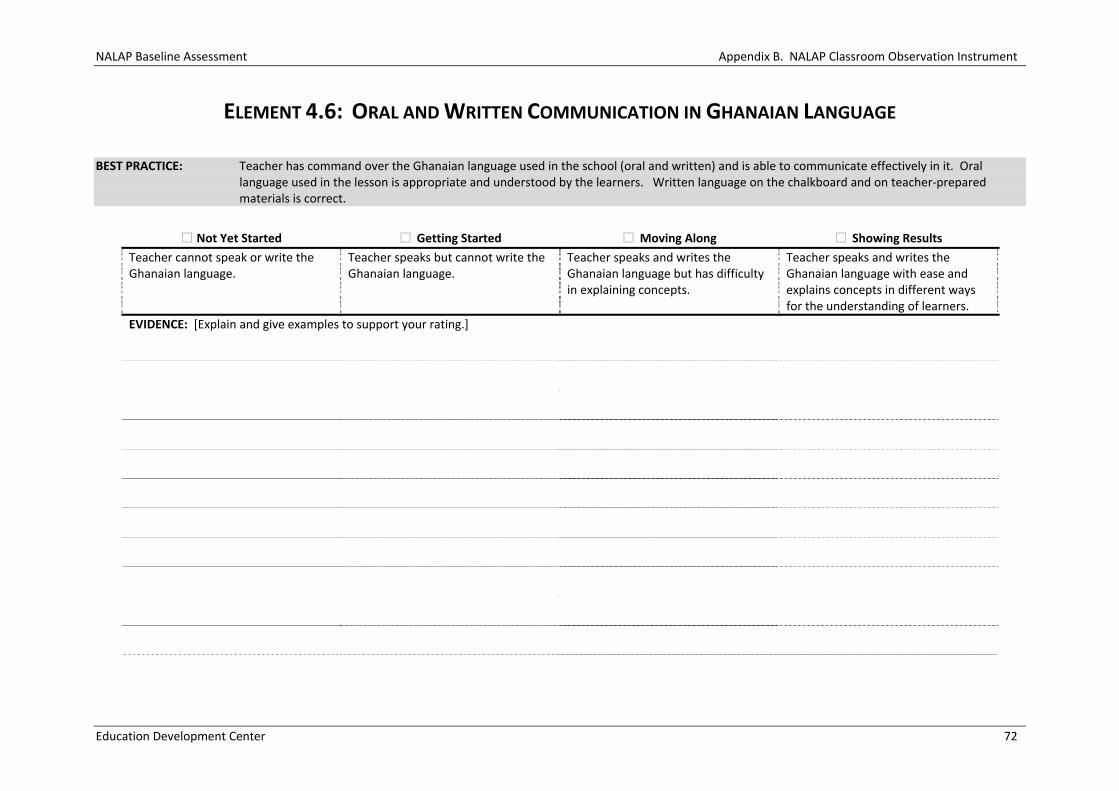
NALAP Baseline Assessment Appendix B. NALAP Classroom Observation Instrument
Education Development Center 72
ELEMENT 4.6: ORAL AND WRITTEN COMMUNICATION IN GHANAIAN LANGUAGE BEST PRACTICE: Teacher has command over the Ghanaian language used in the school (oral and written) and is able to communicate effectively in it. Oral
language used in the lesson is appropriate and understood by the learners. Written language on the chalkboard and on teacher‐prepared materials is correct.
Not Yet Started Getting Started Moving Along Showing Results
Teacher cannot speak or write the Ghanaian language.
Teacher speaks but cannot write the Ghanaian language.
Teacher speaks and writes the Ghanaian language but has difficulty in explaining concepts.
Teacher speaks and writes the Ghanaian language with ease and explains concepts in different ways for the understanding of learners.
EVIDENCE: [Explain and give examples to support your rating.]
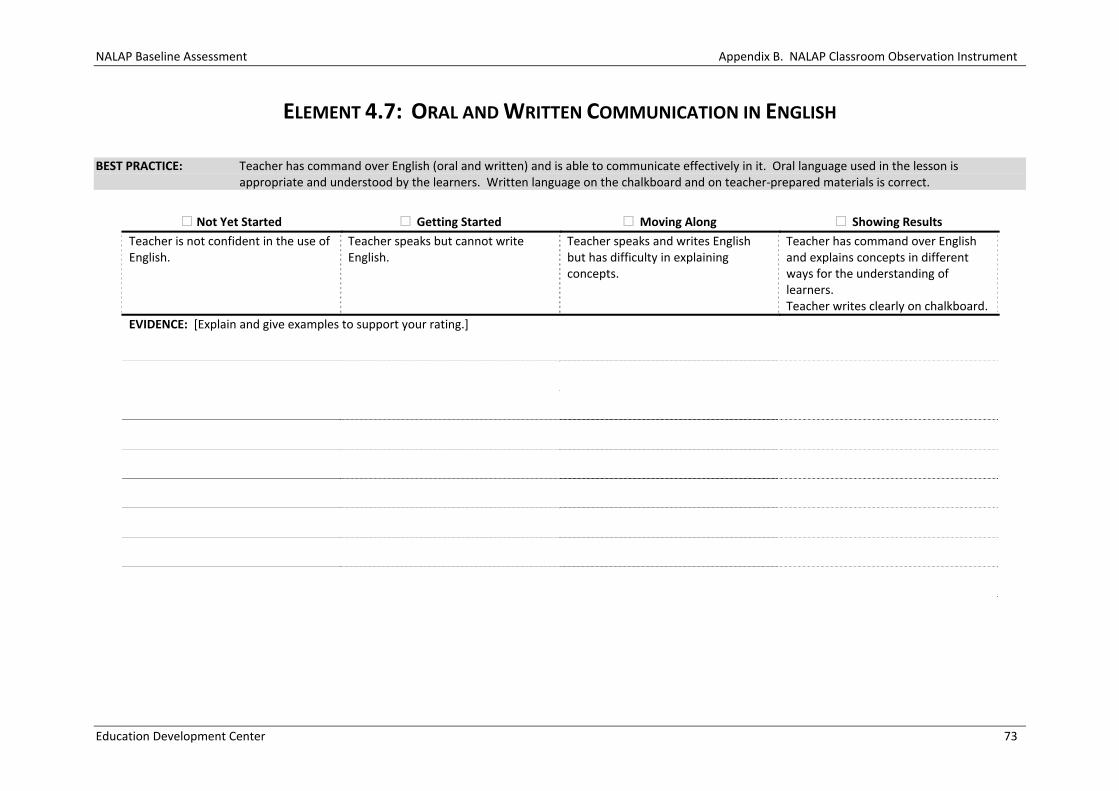
NALAP Baseline Assessment Appendix B. NALAP Classroom Observation Instrument
Education Development Center 73
ELEMENT 4.7: ORAL AND WRITTEN COMMUNICATION IN ENGLISH BEST PRACTICE: Teacher has command over English (oral and written) and is able to communicate effectively in it. Oral language used in the lesson is
appropriate and understood by the learners. Written language on the chalkboard and on teacher‐prepared materials is correct.
Not Yet Started Getting Started Moving Along Showing Results
Teacher is not confident in the use of English.
Teacher speaks but cannot write English.
Teacher speaks and writes English but has difficulty in explaining concepts.
Teacher has command over English and explains concepts in different ways for the understanding of learners. Teacher writes clearly on chalkboard.
EVIDENCE: [Explain and give examples to support your rating.]

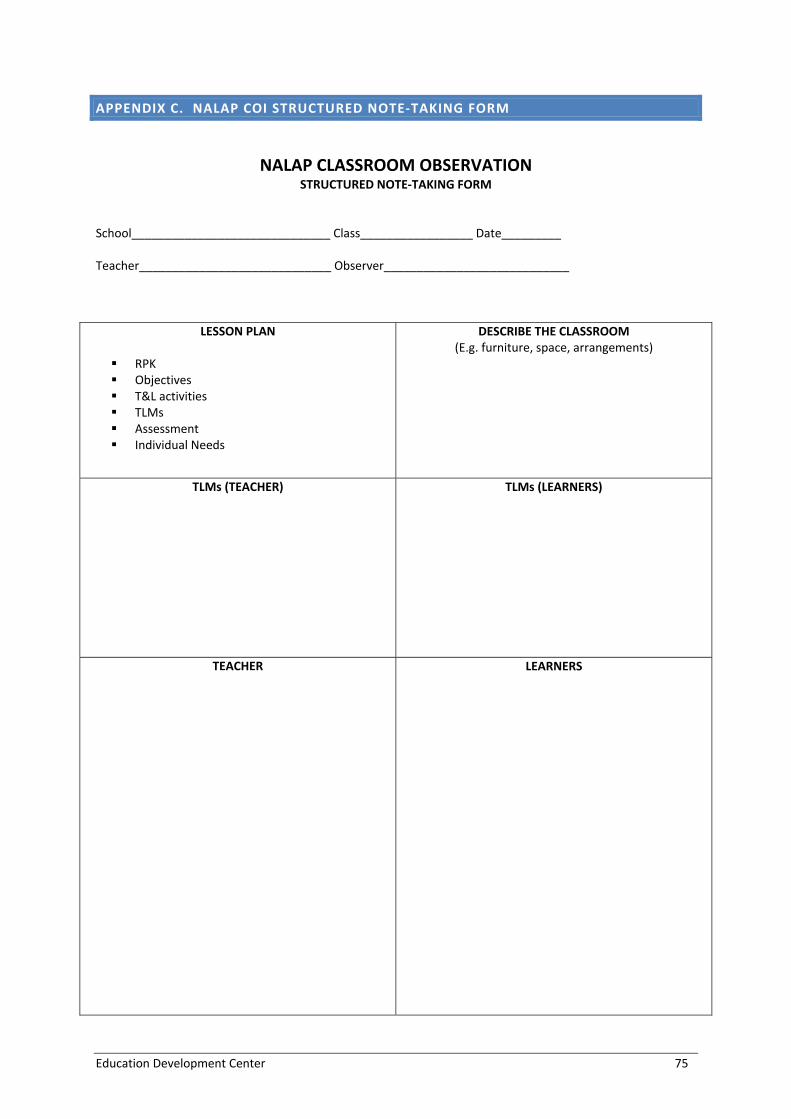
Education Development Center 75
APPENDIX C. NALAP COI STRUCTURED NOTE‐TAKING FORM
NALAP CLASSROOM OBSERVATION STRUCTURED NOTE‐TAKING FORM
School______________________________ Class_________________ Date_________ Teacher_____________________________ Observer____________________________
LESSON PLAN
RPK Objectives T&L activities TLMs Assessment Individual Needs
DESCRIBE THE CLASSROOM (E.g. furniture, space, arrangements)
TLMs (TEACHER)
TLMs (LEARNERS)
TEACHER
LEARNERS

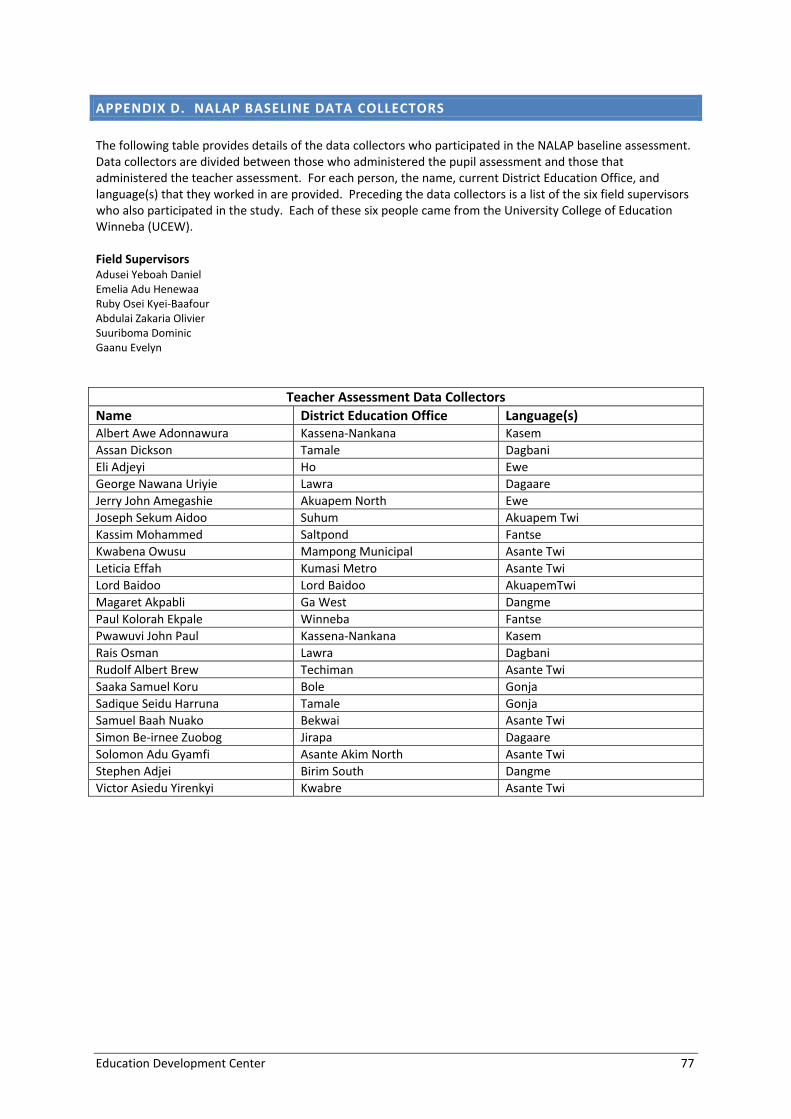
Education Development Center 77
APPENDIX D. NALAP BASELINE DATA COLLECTORS The following table provides details of the data collectors who participated in the NALAP baseline assessment. Data collectors are divided between those who administered the pupil assessment and those that administered the teacher assessment. For each person, the name, current District Education Office, and language(s) that they worked in are provided. Preceding the data collectors is a list of the six field supervisors who also participated in the study. Each of these six people came from the University College of Education Winneba (UCEW). Field Supervisors Adusei Yeboah Daniel Emelia Adu Henewaa Ruby Osei Kyei‐Baafour Abdulai Zakaria Olivier Suuriboma Dominic Gaanu Evelyn
Teacher Assessment Data Collectors Name District Education Office Language(s) Albert Awe Adonnawura Kassena‐Nankana KasemAssan Dickson Tamale DagbaniEli Adjeyi Ho EweGeorge Nawana Uriyie Lawra DagaareJerry John Amegashie Akuapem North EweJoseph Sekum Aidoo Suhum Akuapem Twi Kassim Mohammed Saltpond FantseKwabena Owusu Mampong Municipal Asante Twi Leticia Effah Kumasi Metro Asante Twi Lord Baidoo Lord Baidoo AkuapemTwi Magaret Akpabli Ga West DangmePaul Kolorah Ekpale Winneba FantsePwawuvi John Paul Kassena‐Nankana KasemRais Osman Lawra DagbaniRudolf Albert Brew Techiman Asante Twi Saaka Samuel Koru Bole GonjaSadique Seidu Harruna Tamale GonjaSamuel Baah Nuako Bekwai Asante Twi Simon Be‐irnee Zuobog Jirapa DagaareSolomon Adu Gyamfi Asante Akim North Asante Twi Stephen Adjei Birim South DangmeVictor Asiedu Yirenkyi Kwabre Asante Twi
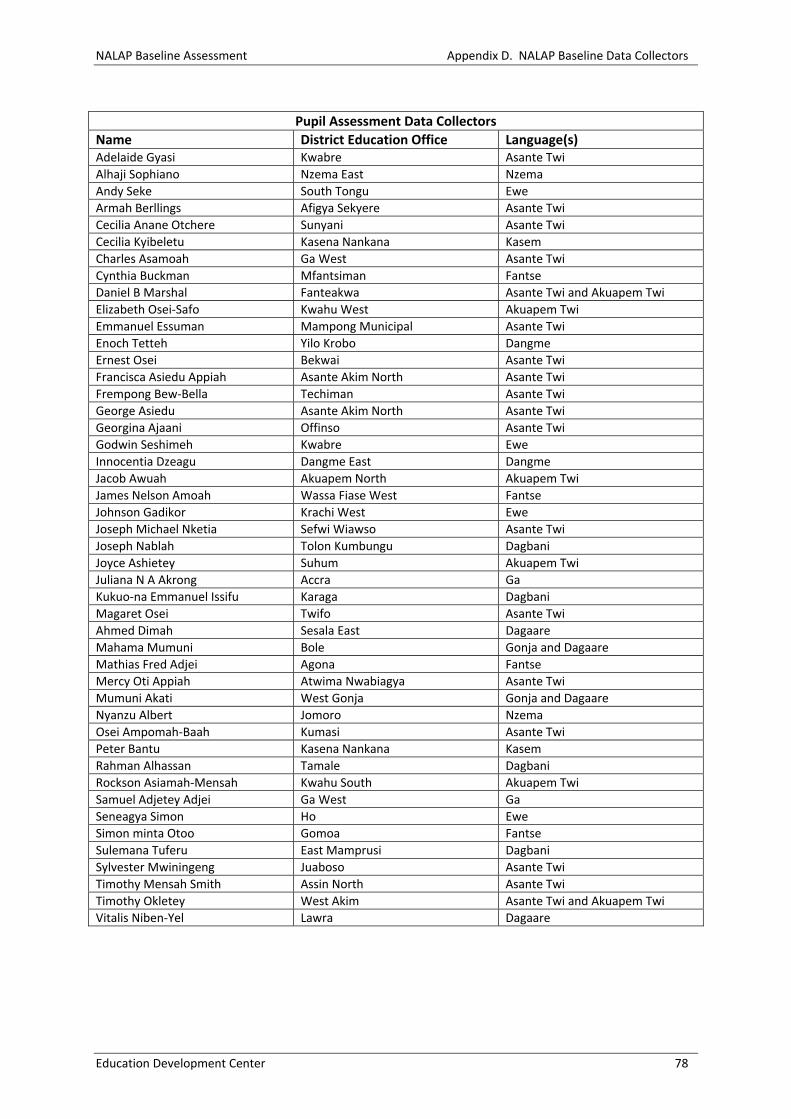
NALAP Baseline Assessment Appendix D. NALAP Baseline Data Collectors
Education Development Center 78
Pupil Assessment Data Collectors
Name District Education Office Language(s) Adelaide Gyasi Kwabre Asante Twi Alhaji Sophiano Nzema East NzemaAndy Seke South Tongu EweArmah Berllings Afigya Sekyere Asante Twi Cecilia Anane Otchere Sunyani Asante Twi Cecilia Kyibeletu Kasena Nankana KasemCharles Asamoah Ga West Asante Twi Cynthia Buckman Mfantsiman FantseDaniel B Marshal Fanteakwa Asante Twi and Akuapem TwiElizabeth Osei‐Safo Kwahu West Akuapem Twi Emmanuel Essuman Mampong Municipal Asante Twi Enoch Tetteh Yilo Krobo DangmeErnest Osei Bekwai Asante Twi Francisca Asiedu Appiah Asante Akim North Asante Twi Frempong Bew‐Bella Techiman Asante Twi George Asiedu Asante Akim North Asante Twi Georgina Ajaani Offinso Asante Twi Godwin Seshimeh Kwabre EweInnocentia Dzeagu Dangme East DangmeJacob Awuah Akuapem North Akuapem Twi James Nelson Amoah Wassa Fiase West FantseJohnson Gadikor Krachi West EweJoseph Michael Nketia Sefwi Wiawso Asante Twi Joseph Nablah Tolon Kumbungu DagbaniJoyce Ashietey Suhum Akuapem Twi Juliana N A Akrong Accra GaKukuo‐na Emmanuel Issifu Karaga DagbaniMagaret Osei Twifo Asante Twi Ahmed Dimah Sesala East DagaareMahama Mumuni Bole Gonja and Dagaare Mathias Fred Adjei Agona FantseMercy Oti Appiah Atwima Nwabiagya Asante Twi Mumuni Akati West Gonja Gonja and Dagaare Nyanzu Albert Jomoro NzemaOsei Ampomah‐Baah Kumasi Asante Twi Peter Bantu Kasena Nankana KasemRahman Alhassan Tamale DagbaniRockson Asiamah‐Mensah Kwahu South Akuapem Twi Samuel Adjetey Adjei Ga West GaSeneagya Simon Ho EweSimon minta Otoo Gomoa FantseSulemana Tuferu East Mamprusi DagbaniSylvester Mwiningeng Juaboso Asante Twi Timothy Mensah Smith Assin North Asante Twi Timothy Okletey West Akim Asante Twi and Akuapem TwiVitalis Niben‐Yel Lawra Dagaare
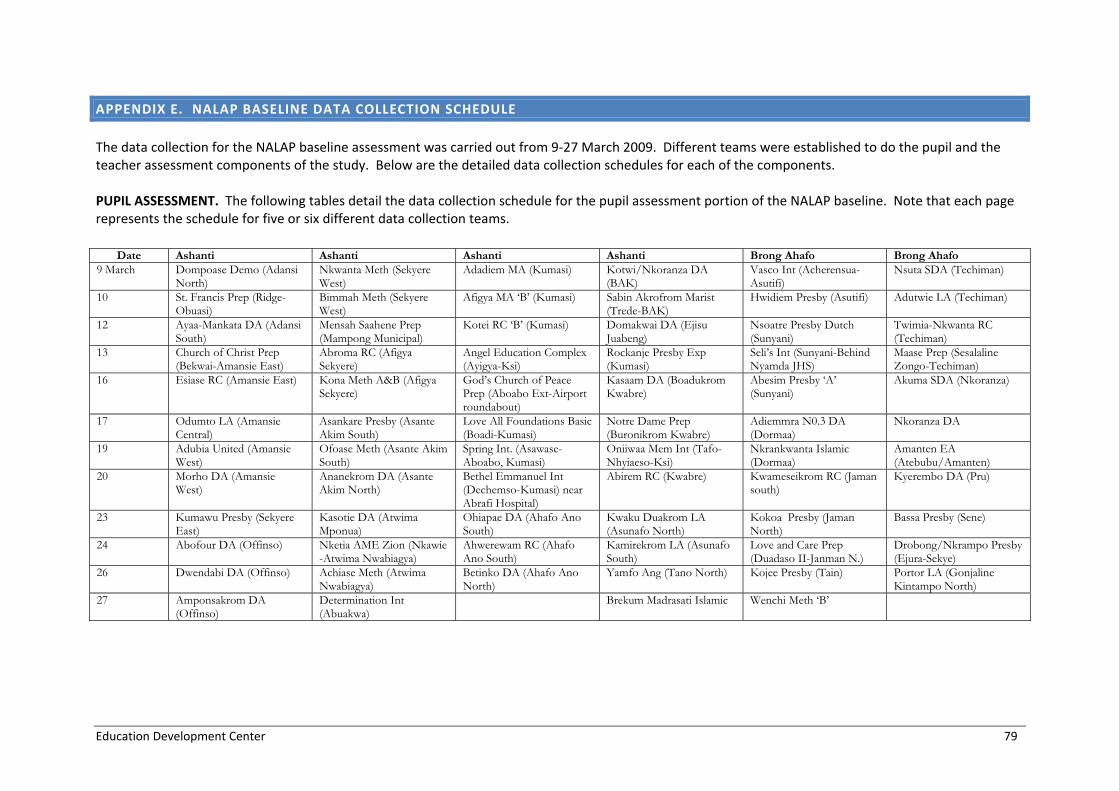
Education Development Center 79
APPENDIX E. NALAP BASELINE DATA COLLECTION SCHEDULE The data collection for the NALAP baseline assessment was carried out from 9‐27 March 2009. Different teams were established to do the pupil and the teacher assessment components of the study. Below are the detailed data collection schedules for each of the components. PUPIL ASSESSMENT. The following tables detail the data collection schedule for the pupil assessment portion of the NALAP baseline. Note that each page represents the schedule for five or six different data collection teams.
Date Ashanti Ashanti Ashanti Ashanti Brong Ahafo Brong Ahafo
9 March Dompoase Demo (Adansi North)
Nkwanta Meth (Sekyere West)
Adadiem MA (Kumasi) Kotwi/Nkoranza DA (BAK)
Vasco Int (Acherensua-Asutifi)
Nsuta SDA (Techiman)
10 St. Francis Prep (Ridge-Obuasi)
Bimmah Meth (Sekyere West)
Afigya MA ‘B’ (Kumasi) Sabin Akrofrom Marist (Trede-BAK)
Hwidiem Presby (Asutifi) Adutwie LA (Techiman)
12 Ayaa-Mankata DA (Adansi South)
Mensah Saahene Prep (Mampong Municipal)
Kotei RC ‘B’ (Kumasi) Domakwai DA (Ejisu Juabeng)
Nsoatre Presby Dutch (Sunyani)
Twimia-Nkwanta RC (Techiman)
13 Church of Christ Prep (Bekwai-Amansie East)
Abroma RC (Afigya Sekyere)
Angel Education Complex (Ayigya-Ksi)
Rockanje Presby Exp (Kumasi)
Seli’s Int (Sunyani-Behind Nyamda JHS)
Maase Prep (Sesalaline Zongo-Techiman)
16 Esiase RC (Amansie East) Kona Meth A&B (Afigya Sekyere)
God’s Church of Peace Prep (Aboabo Ext-Airport roundabout)
Kasaam DA (Boadukrom Kwabre)
Abesim Presby ‘A’ (Sunyani)
Akuma SDA (Nkoranza)
17 Odumto LA (Amansie Central)
Asankare Presby (Asante Akim South)
Love All Foundations Basic (Boadi-Kumasi)
Notre Dame Prep (Buronikrom Kwabre)
Adiemmra N0.3 DA (Dormaa)
Nkoranza DA
19 Adubia United (Amansie West)
Ofoase Meth (Asante Akim South)
Spring Int. (Asawase- Aboabo, Kumasi)
Oniiwaa Mem Int (Tafo-Nhyiaeso-Ksi)
Nkrankwanta Islamic (Dormaa)
Amanten EA (Atebubu/Amanten)
20 Morho DA (Amansie West)
Ananekrom DA (Asante Akim North)
Bethel Emmanuel Int (Dechemso-Kumasi) near Abrafi Hospital)
Abirem RC (Kwabre) Kwameseikrom RC (Jaman south)
Kyerembo DA (Pru)
23 Kumawu Presby (Sekyere East)
Kasotie DA (Atwima Mponua)
Ohiapae DA (Ahafo Ano South)
Kwaku Duakrom LA (Asunafo North)
Kokoa Presby (Jaman North)
Bassa Presby (Sene)
24 Abofour DA (Offinso) Nketia AME Zion (Nkawie -Atwima Nwabiagya)
Ahwerewam RC (Ahafo Ano South)
Kamirekrom LA (Asunafo South)
Love and Care Prep (Duadaso II-Janman N.)
Drobong/Nkrampo Presby (Ejura-Sekye)
26 Dwendabi DA (Offinso) Achiase Meth (Atwima Nwabiagya)
Betinko DA (Ahafo Ano North)
Yamfo Ang (Tano North)
Kojee Presby (Tain) Portor LA (Gonjaline Kintampo North)
27 Amponsakrom DA (Offinso)
Determination Int (Abuakwa)
Brekum Madrasati Islamic Wenchi Meth ‘B’
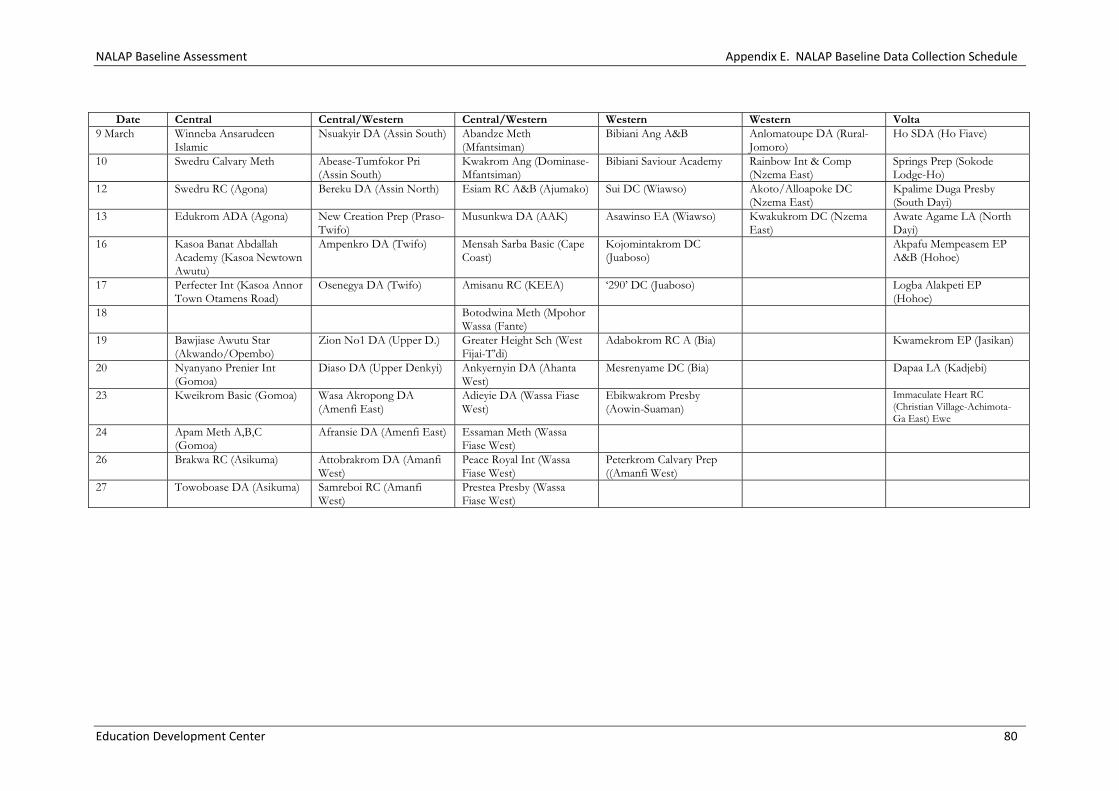
NALAP Baseline Assessment Appendix E. NALAP Baseline Data Collection Schedule
Education Development Center 80
Date Central Central/Western Central/Western Western Western Volta
9 March Winneba Ansarudeen Islamic
Nsuakyir DA (Assin South) Abandze Meth (Mfantsiman)
Bibiani Ang A&B Anlomatoupe DA (Rural-Jomoro)
Ho SDA (Ho Fiave)
10 Swedru Calvary Meth Abease-Tumfokor Pri (Assin South)
Kwakrom Ang (Dominase-Mfantsiman)
Bibiani Saviour Academy Rainbow Int & Comp (Nzema East)
Springs Prep (Sokode Lodge-Ho)
12 Swedru RC (Agona) Bereku DA (Assin North) Esiam RC A&B (Ajumako) Sui DC (Wiawso) Akoto/Alloapoke DC (Nzema East)
Kpalime Duga Presby (South Dayi)
13 Edukrom ADA (Agona) New Creation Prep (Praso-Twifo)
Musunkwa DA (AAK) Asawinso EA (Wiawso) Kwakukrom DC (Nzema East)
Awate Agame LA (North Dayi)
16 Kasoa Banat Abdallah Academy (Kasoa Newtown Awutu)
Ampenkro DA (Twifo) Mensah Sarba Basic (Cape Coast)
Kojomintakrom DC (Juaboso)
Akpafu Mempeasem EP A&B (Hohoe)
17 Perfecter Int (Kasoa Annor Town Otamens Road)
Osenegya DA (Twifo) Amisanu RC (KEEA) ‘290’ DC (Juaboso) Logba Alakpeti EP (Hohoe)
18 Botodwina Meth (Mpohor Wassa (Fante)
19 Bawjiase Awutu Star (Akwando/Opembo)
Zion No1 DA (Upper D.) Greater Height Sch (West Fijai-T’di)
Adabokrom RC A (Bia) Kwamekrom EP (Jasikan)
20 Nyanyano Prenier Int (Gomoa)
Diaso DA (Upper Denkyi) Ankyernyin DA (Ahanta West)
Mesrenyame DC (Bia) Dapaa LA (Kadjebi)
23 Kweikrom Basic (Gomoa) Wasa Akropong DA (Amenfi East)
Adieyie DA (Wassa Fiase West)
Ebikwakrom Presby (Aowin-Suaman)
Immaculate Heart RC (Christian Village-Achimota-Ga East) Ewe
24 Apam Meth A,B,C (Gomoa)
Afransie DA (Amenfi East) Essaman Meth (Wassa Fiase West)
26 Brakwa RC (Asikuma) Attobrakrom DA (Amanfi West)
Peace Royal Int (Wassa Fiase West)
Peterkrom Calvary Prep ((Amanfi West)
27 Towoboase DA (Asikuma) Samreboi RC (Amanfi West)
Prestea Presby (Wassa Fiase West)
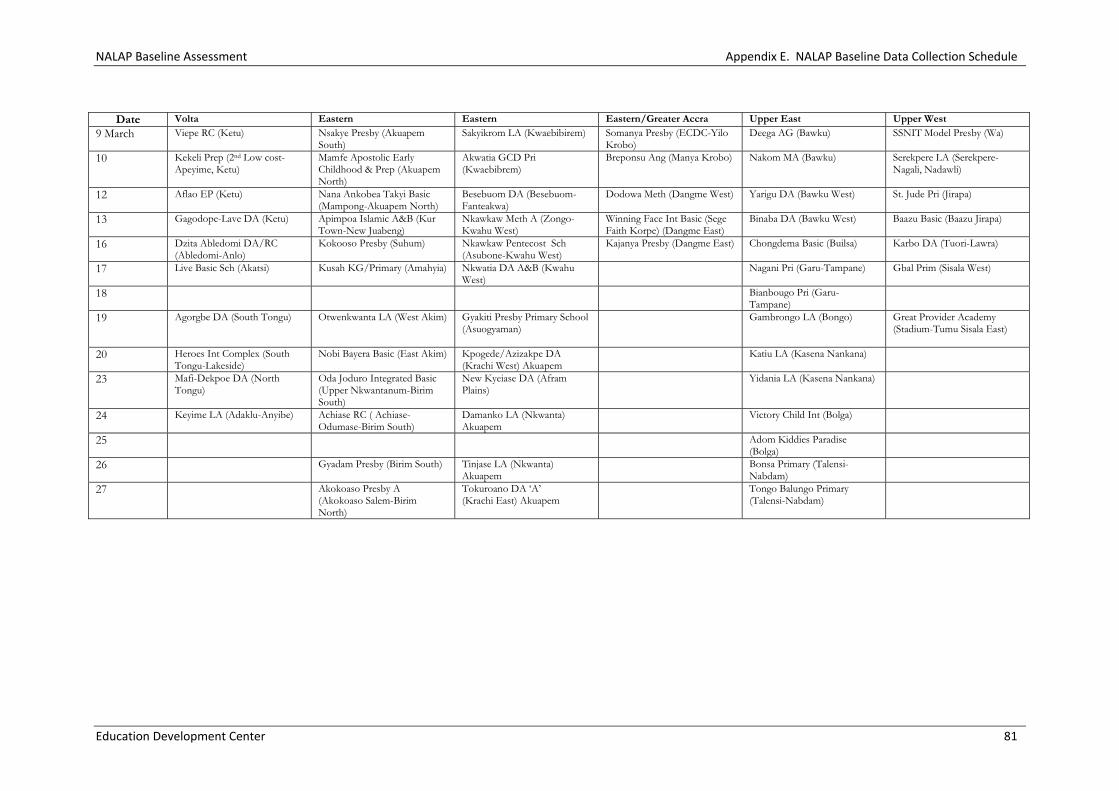
NALAP Baseline Assessment Appendix E. NALAP Baseline Data Collection Schedule
Education Development Center 81
Date Volta Eastern Eastern Eastern/Greater Accra Upper East Upper West
9 March Viepe RC (Ketu) Nsakye Presby (Akuapem South)
Sakyikrom LA (Kwaebibirem) Somanya Presby (ECDC-Yilo Krobo)
Deega AG (Bawku) SSNIT Model Presby (Wa)
10 Kekeli Prep (2nd Low cost-Apeyime, Ketu)
Mamfe Apostolic Early Childhood & Prep (Akuapem North)
Akwatia GCD Pri (Kwaebibrem)
Breponsu Ang (Manya Krobo) Nakom MA (Bawku) Serekpere LA (Serekpere-Nagali, Nadawli)
12 Aflao EP (Ketu) Nana Ankobea Takyi Basic (Mampong-Akuapem North)
Besebuom DA (Besebuom-Fanteakwa)
Dodowa Meth (Dangme West) Yarigu DA (Bawku West) St. Jude Pri (Jirapa)
13 Gagodope-Lave DA (Ketu) Apimpoa Islamic A&B (Kur Town-New Juabeng)
Nkawkaw Meth A (Zongo-Kwahu West)
Winning Face Int Basic (Sege Faith Korpe) (Dangme East)
Binaba DA (Bawku West) Baazu Basic (Baazu Jirapa)
16 Dzita Abledomi DA/RC (Abledomi-Anlo)
Kokooso Presby (Suhum) Nkawkaw Pentecost Sch (Asubone-Kwahu West)
Kajanya Presby (Dangme East) Chongdema Basic (Builsa) Karbo DA (Tuori-Lawra)
17 Live Basic Sch (Akatsi) Kusah KG/Primary (Amahyia) Nkwatia DA A&B (Kwahu West)
Nagani Pri (Garu-Tampane) Gbal Prim (Sisala West)
18 Bianbougo Pri (Garu-Tampane)
19 Agorgbe DA (South Tongu) Otwenkwanta LA (West Akim) Gyakiti Presby Primary School (Asuogyaman)
Gambrongo LA (Bongo) Great Provider Academy (Stadium-Tumu Sisala East)
20 Heroes Int Complex (South Tongu-Lakeside)
Nobi Bayera Basic (East Akim) Kpogede/Azizakpe DA (Krachi West) Akuapem
Katiu LA (Kasena Nankana)
23 Mafi-Dekpoe DA (North Tongu)
Oda Joduro Integrated Basic (Upper Nkwantanum-Birim South)
New Kyeiase DA (Afram Plains)
Yidania LA (Kasena Nankana)
24 Keyime LA (Adaklu-Anyibe) Achiase RC ( Achiase-Odumase-Birim South)
Damanko LA (Nkwanta) Akuapem
Victory Child Int (Bolga)
25 Adom Kiddies Paradise (Bolga)
26 Gyadam Presby (Birim South) Tinjase LA (Nkwanta) Akuapem
Bonsa Primary (Talensi-Nabdam)
27 Akokoaso Presby A (Akokoaso Salem-Birim North)
Tokuroano DA ‘A’ (Krachi East) Akuapem
Tongo Balungo Primary (Talensi-Nabdam)
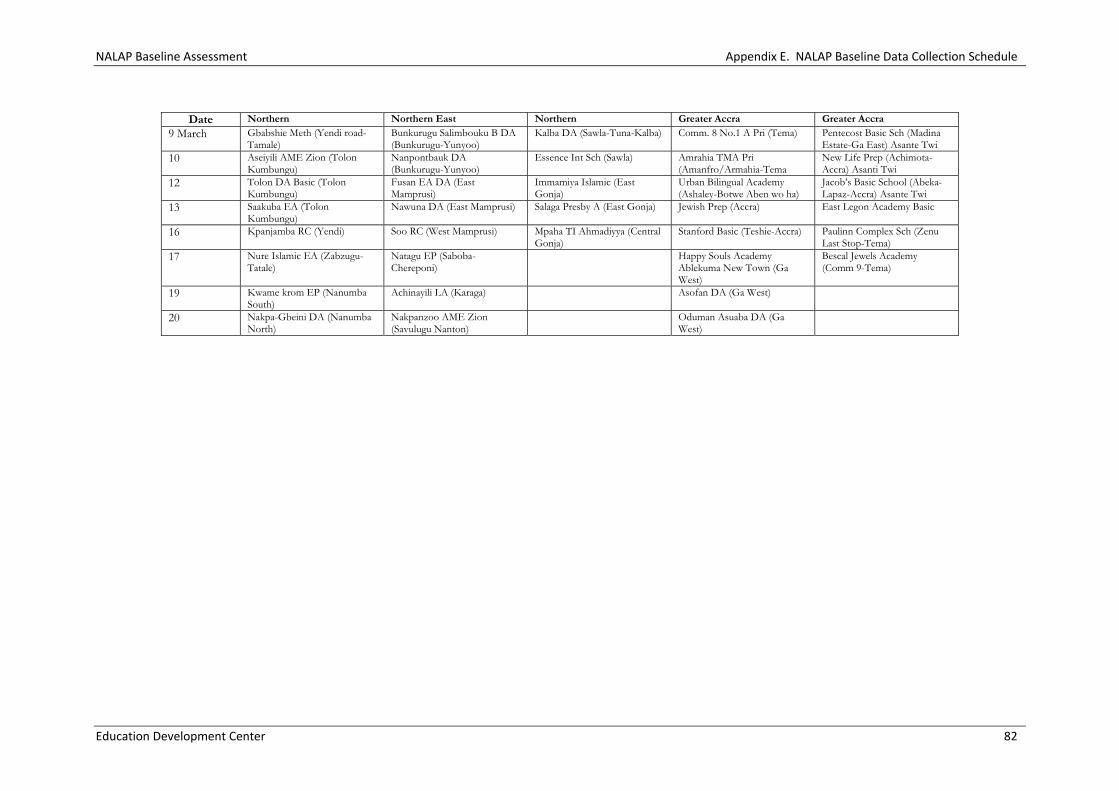
NALAP Baseline Assessment Appendix E. NALAP Baseline Data Collection Schedule
Education Development Center 82
Date Northern Northern East Northern Greater Accra Greater Accra
9 March Gbabshie Meth (Yendi road-Tamale)
Bunkurugu Salimbouku B DA (Bunkurugu-Yunyoo)
Kalba DA (Sawla-Tuna-Kalba) Comm. 8 No.1 A Pri (Tema) Pentecost Basic Sch (Madina Estate-Ga East) Asante Twi
10 Aseiyili AME Zion (Tolon Kumbungu)
Nanpontbauk DA (Bunkurugu-Yunyoo)
Essence Int Sch (Sawla) Amrahia TMA Pri (Amanfro/Armahia-Tema
New Life Prep (Achimota-Accra) Asanti Twi
12 Tolon DA Basic (Tolon Kumbungu)
Fusan EA DA (East Mamprusi)
Immamiya Islamic (East Gonja)
Urban Bilingual Academy (Ashaley-Botwe Aben wo ha)
Jacob’s Basic School (Abeka-Lapaz-Accra) Asante Twi
13 Saakuba EA (Tolon Kumbungu)
Nawuna DA (East Mamprusi) Salaga Presby A (East Gonja) Jewish Prep (Accra) East Legon Academy Basic
16 Kpanjamba RC (Yendi) Soo RC (West Mamprusi) Mpaha TI Ahmadiyya (Central Gonja)
Stanford Basic (Teshie-Accra) Paulinn Complex Sch (Zenu Last Stop-Tema)
17 Nure Islamic EA (Zabzugu-Tatale)
Natagu EP (Saboba-Chereponi)
Happy Souls Academy Ablekuma New Town (Ga West)
Bescal Jewels Academy (Comm 9-Tema)
19 Kwame krom EP (Nanumba South)
Achinayili LA (Karaga) Asofan DA (Ga West)
20 Nakpa-Gbeini DA (Nanumba North)
Nakpanzoo AME Zion (Savulugu Nanton)
Oduman Asuaba DA (Ga West)
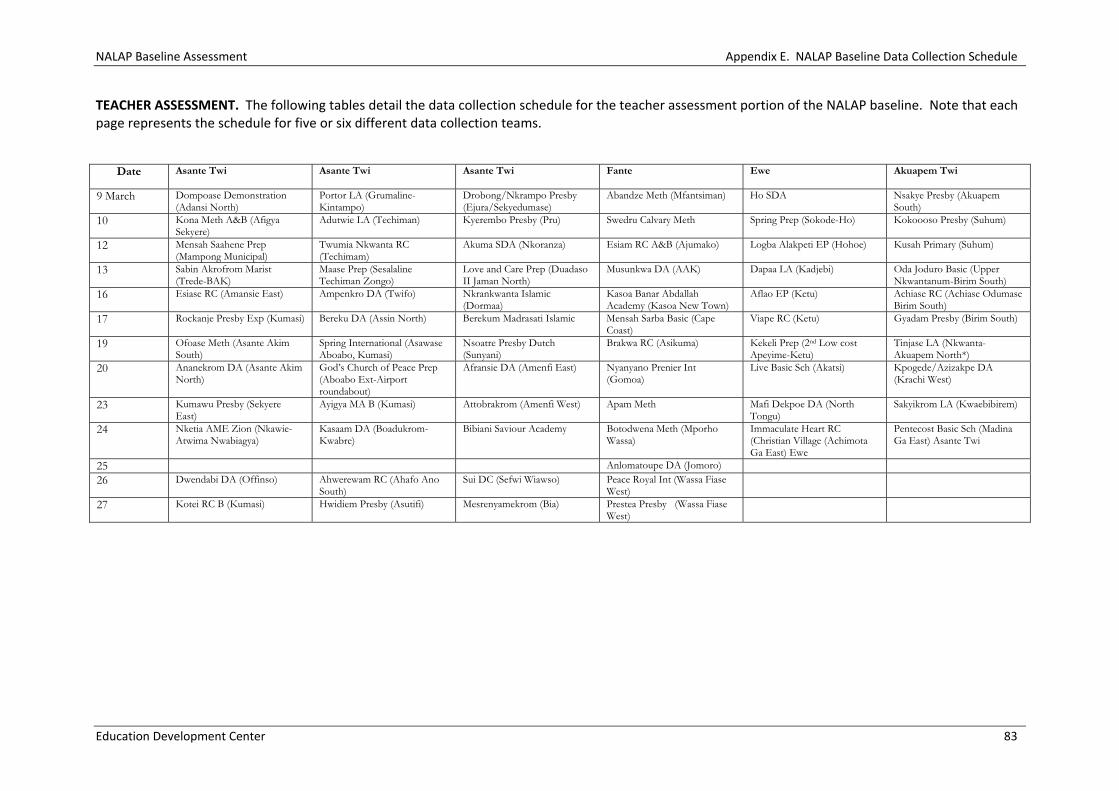
NALAP Baseline Assessment Appendix E. NALAP Baseline Data Collection Schedule
Education Development Center 83
TEACHER ASSESSMENT. The following tables detail the data collection schedule for the teacher assessment portion of the NALAP baseline. Note that each page represents the schedule for five or six different data collection teams.
Date Asante Twi Asante Twi Asante Twi Fante
Ewe Akuapem Twi
9 March Dompoase Demonstration (Adansi North)
Portor LA (Grumaline-Kintampo)
Drobong/Nkrampo Presby (Ejura/Sekyedumase)
Abandze Meth (Mfantsiman) Ho SDA Nsakye Presby (Akuapem South)
10 Kona Meth A&B (Afigya Sekyere)
Adutwie LA (Techiman) Kyerembo Presby (Pru) Swedru Calvary Meth Spring Prep (Sokode-Ho) Kokoooso Presby (Suhum)
12 Mensah Saahene Prep (Mampong Municipal)
Twumia Nkwanta RC (Techimam)
Akuma SDA (Nkoranza)
Esiam RC A&B (Ajumako) Logba Alakpeti EP (Hohoe) Kusah Primary (Suhum)
13 Sabin Akrofrom Marist (Trede-BAK)
Maase Prep (Sesalaline Techiman Zongo)
Love and Care Prep (Duadaso II Jaman North)
Musunkwa DA (AAK) Dapaa LA (Kadjebi) Oda Joduro Basic (Upper Nkwantanum-Birim South)
16 Esiase RC (Amansie East) Ampenkro DA (Twifo) Nkrankwanta Islamic (Dormaa)
Kasoa Banar Abdallah Academy (Kasoa New Town)
Aflao EP (Ketu) Achiase RC (Achiase Odumase Birim South)
17 Rockanje Presby Exp (Kumasi) Bereku DA (Assin North) Berekum Madrasati Islamic Mensah Sarba Basic (Cape Coast)
Viape RC (Ketu) Gyadam Presby (Birim South)
19 Ofoase Meth (Asante Akim South)
Spring International (Asawase Aboabo, Kumasi)
Nsoatre Presby Dutch (Sunyani)
Brakwa RC (Asikuma) Kekeli Prep (2nd Low cost Apeyime-Ketu)
Tinjase LA (Nkwanta-Akuapem North*)
20 Ananekrom DA (Asante Akim North)
God’s Church of Peace Prep (Aboabo Ext-Airport roundabout)
Afransie DA (Amenfi East) Nyanyano Prenier Int (Gomoa)
Live Basic Sch (Akatsi) Kpogede/Azizakpe DA (Krachi West)
23 Kumawu Presby (Sekyere East)
Ayigya MA B (Kumasi) Attobrakrom (Amenfi West) Apam Meth Mafi Dekpoe DA (North Tongu)
Sakyikrom LA (Kwaebibirem)
24 Nketia AME Zion (Nkawie-Atwima Nwabiagya)
Kasaam DA (Boadukrom-Kwabre)
Bibiani Saviour Academy Botodwena Meth (Mporho Wassa)
Immaculate Heart RC (Christian Village (Achimota Ga East) Ewe
Pentecost Basic Sch (Madina Ga East) Asante Twi
25 Anlomatoupe DA (Jomoro) 26 Dwendabi DA (Offinso) Ahwerewam RC (Ahafo Ano
South) Sui DC (Sefwi Wiawso) Peace Royal Int (Wassa Fiase
West)
27 Kotei RC B (Kumasi) Hwidiem Presby (Asutifi) Mesrenyamekrom (Bia) Prestea Presby (Wassa Fiase West)
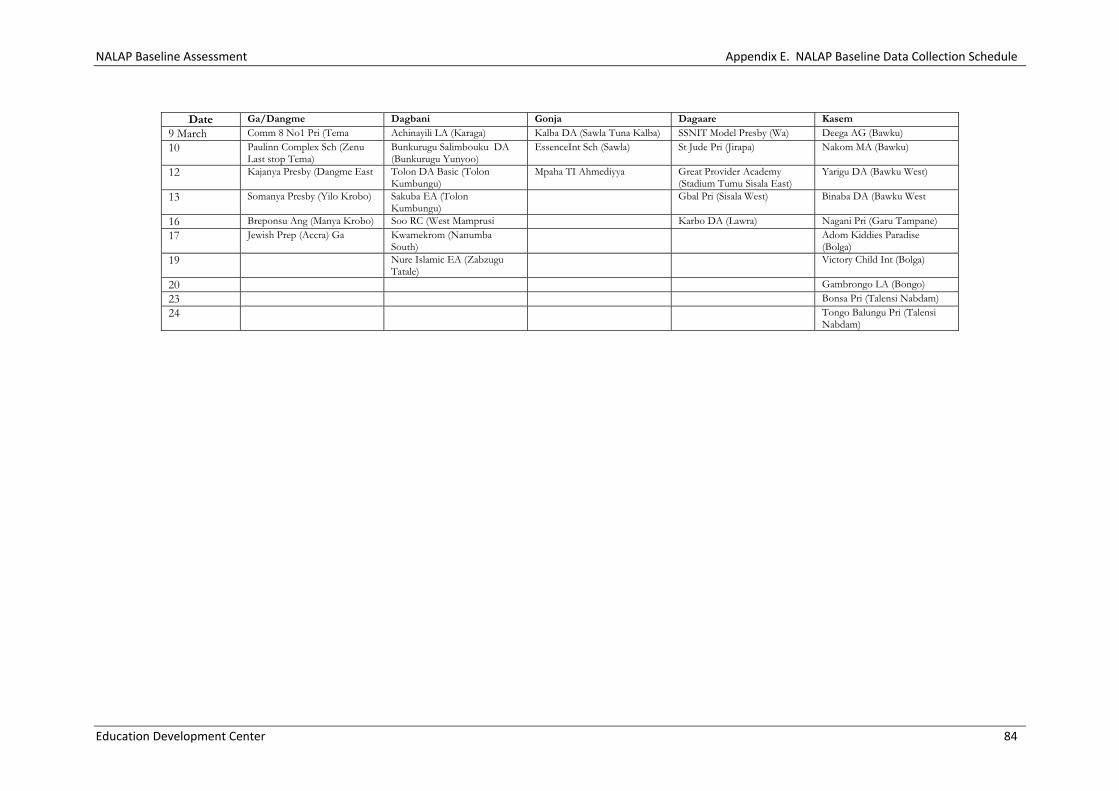
NALAP Baseline Assessment Appendix E. NALAP Baseline Data Collection Schedule
Education Development Center 84
Date Ga/Dangme Dagbani Gonja Dagaare Kasem
9 March Comm 8 No1 Pri (Tema Achinayili LA (Karaga) Kalba DA (Sawla Tuna Kalba) SSNIT Model Presby (Wa) Deega AG (Bawku) 10 Paulinn Complex Sch (Zenu
Last stop Tema) Bunkurugu Salimbouku DA (Bunkurugu Yunyoo)
EssenceInt Sch (Sawla) St Jude Pri (Jirapa) Nakom MA (Bawku)
12 Kajanya Presby (Dangme East Tolon DA Basic (Tolon Kumbungu)
Mpaha TI Ahmediyya Great Provider Academy (Stadium Tumu Sisala East)
Yarigu DA (Bawku West)
13 Somanya Presby (Yilo Krobo) Sakuba EA (Tolon Kumbungu)
Gbal Pri (Sisala West) Binaba DA (Bawku West
16 Breponsu Ang (Manya Krobo) Soo RC (West Mamprusi Karbo DA (Lawra) Nagani Pri (Garu Tampane) 17 Jewish Prep (Accra) Ga Kwamekrom (Nanumba
South) Adom Kiddies Paradise
(Bolga) 19 Nure Islamic EA (Zabzugu
Tatale) Victory Child Int (Bolga)
20 Gambrongo LA (Bongo) 23 Bonsa Pri (Talensi Nabdam) 24 Tongo Balungu Pri (Talensi
Nabdam)
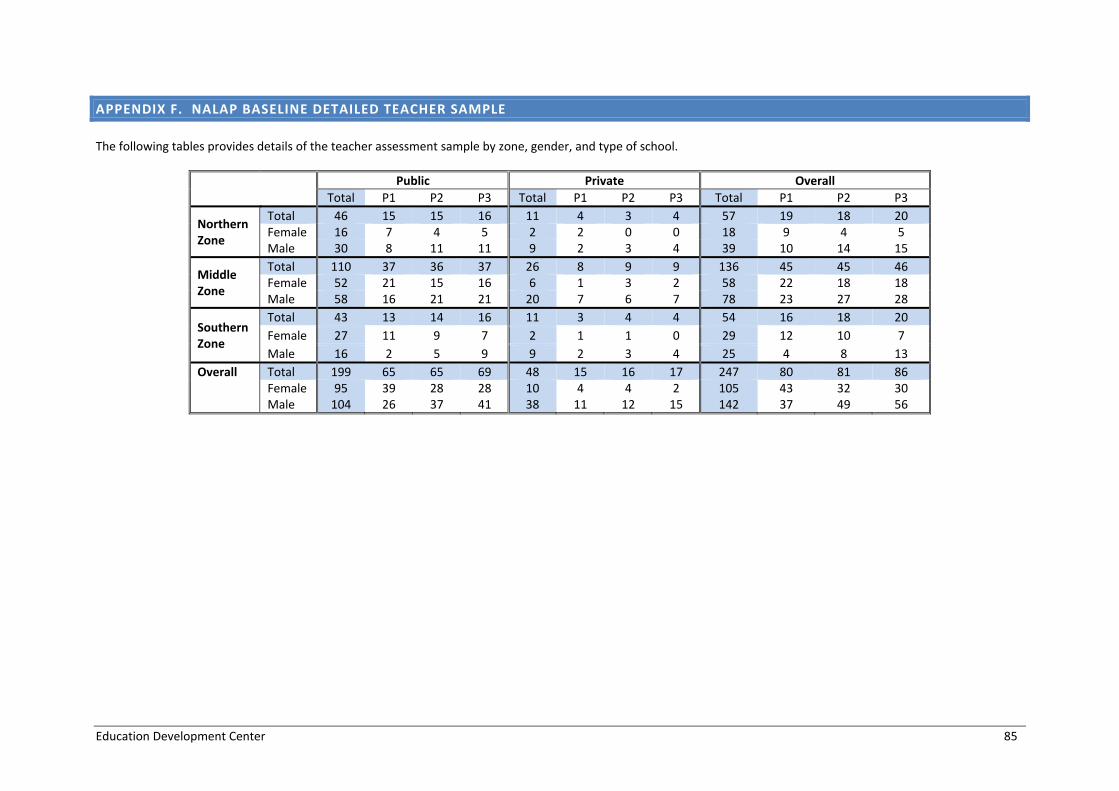
Education Development Center 85
APPENDIX F. NALAP BASELINE DETAILED TEACHER SAMPLE The following tables provides details of the teacher assessment sample by zone, gender, and type of school.
Public Private Overall Total P1 P2 P3 Total P1 P2 P3 Total P1 P2 P3
Northern Zone
Total 46 15 15 16 11 4 3 4 57 19 18 20Female 16 7 4 5 2 2 0 0 18 9 4 5Male 30 8 11 11 9 2 3 4 39 10 14 15
Middle Zone
Total 110 37 36 37 26 8 9 9 136 45 45 46Female 52 21 15 16 6 1 3 2 58 22 18 18Male 58 16 21 21 20 7 6 7 78 23 27 28
Southern Zone
Total 43 13 14 16 11 3 4 4 54 16 18 20Female 27 11 9 7 2 1 1 0 29 12 10 7Male 16 2 5 9 9 2 3 4 25 4 8 13
Overall Total 199 65 65 69 48 15 16 17 247 80 81 86Female 95 39 28 28 10 4 4 2 105 43 32 30Male 104 26 37 41 38 11 12 15 142 37 49 56

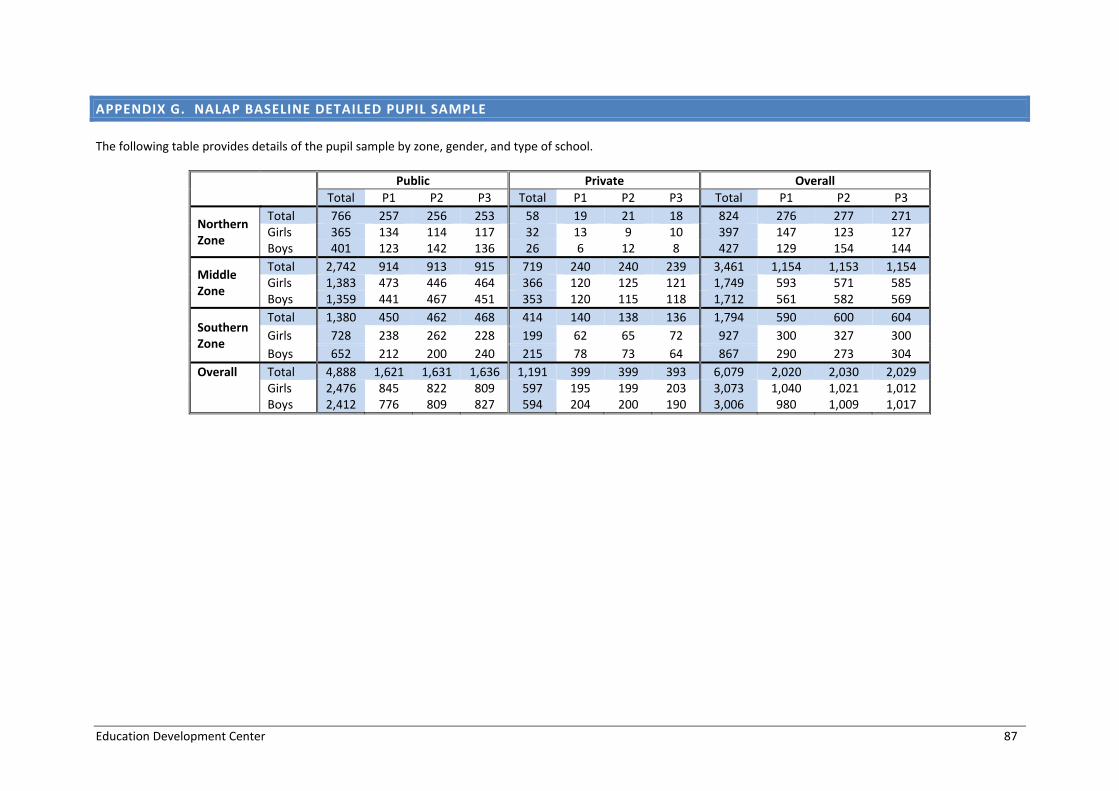
Education Development Center 87
APPENDIX G. NALAP BASELINE DETAILED PUPIL SAMPLE The following table provides details of the pupil sample by zone, gender, and type of school.
Public Private Overall Total P1 P2 P3 Total P1 P2 P3 Total P1 P2 P3
Northern Zone
Total 766 257 256 253 58 19 21 18 824 276 277 271Girls 365 134 114 117 32 13 9 10 397 147 123 127Boys 401 123 142 136 26 6 12 8 427 129 154 144
Middle Zone
Total 2,742 914 913 915 719 240 240 239 3,461 1,154 1,153 1,154Girls 1,383 473 446 464 366 120 125 121 1,749 593 571 585Boys 1,359 441 467 451 353 120 115 118 1,712 561 582 569
Southern Zone
Total 1,380 450 462 468 414 140 138 136 1,794 590 600 604Girls 728 238 262 228 199 62 65 72 927 300 327 300Boys 652 212 200 240 215 78 73 64 867 290 273 304
Overall Total 4,888 1,621 1,631 1,636 1,191 399 399 393 6,079 2,020 2,030 2,029Girls 2,476 845 822 809 597 195 199 203 3,073 1,040 1,021 1,012Boys 2,412 776 809 827 594 204 200 190 3,006 980 1,009 1,017