national earthquake information center systems overview ... · national earthquake information...
TRANSCRIPT
National Earthquake Information Center Systems Overview and Integration
By Michelle Guy, John Patton, Jeremy Fee, Mike Hearne, Eric Martinez, D. Ketchum, Charles Worden, Vince Quitoriano, Edward Hunter, Gregory Smoczyk, and Stan Schwarz
Open-File Report 2015–1120
U.S. Department of the Interior U.S. Geological Survey
ii
U.S. Department of the Interior SALLY JEWELL, Secretary
U.S. Geological Survey Suzette M. Kimball, Acting Director
U.S. Geological Survey, Reston, Virginia: 2015
For more information on the USGS—the Federal source for science about the Earth, its natural and living resources, natural hazards, and the environment—visit http://www.usgs.gov/ or call 1–888–ASK–USGS (1–888–275–8747).
For an overview of USGS information products, including maps, imagery, and publications, visit http://www.usgs.gov/pubprod/.
Any use of trade, firm, or product names is for descriptive purposes only and does not imply endorsement by the U.S. Government.
Although this information product, for the most part, is in the public domain, it also may contain copyrighted materials as noted in the text. Permission to reproduce copyrighted items must be secured from the copyright owner.
Suggested citation: Guy, Michelle, Patton, John, Fee, J.M., Hearne, Mike, Martinez, E.M., Ketchum, D., Worden, C.B., Quitoriano, Vince, Hunter, E.J., Smoczyk, G.M., and Schwarz, Stan, 2015, National Earthquake Information Center systems overview and integration: U.S. Geological Survey Open-File Report 2015–1120, 25 p., http://dx.doi.org/10.3133/ofr20151120.
ISSN 2331-1258 (online)

Contents Overview ........................................................................................................................................................ 1 Motivation ...................................................................................................................................................... 2 Systems Integration—How It All Fits Together .............................................................................................. 2
Data Acquisition ......................................................................................................................................... 3 Edge ....................................................................................................................................................... 4 Product Distribution Layer ...................................................................................................................... 5
Data Processing Component ..................................................................................................................... 7 Hydra Subsystem ................................................................................................................................... 9 “Did You Feel It?” Subsystem ............................................................................................................... 10 ShakeMap Subsystem ......................................................................................................................... 12 PAGER Subsystem .............................................................................................................................. 14 Tweet Earthquake Dispatch ................................................................................................................. 15
Data Presentation .................................................................................................................................... 16 Web ...................................................................................................................................................... 16 Web Service and Data Feeds............................................................................................................... 17 Comprehensive Catalog ....................................................................................................................... 18 Event Notification Service..................................................................................................................... 18 NEIC Executive Summary Tool ............................................................................................................ 19
Shared Data Services Across NEIC ............................................................................................................ 20 Future Work ................................................................................................................................................. 24 Conclusion ................................................................................................................................................... 24 References Cited ......................................................................................................................................... 24
Figures 1. National Earthquake Information Center Functional Components .................................................... 3 2. Edge Data Acquisition Subsystem .................................................................................................... 4 3. Product Distribution Layer Hub Architecture ..................................................................................... 6 4. Data Processing Overview ............................................................................................................... 7 5. Data Processing Flow Over Time ..................................................................................................... 8 6. Data Processing – Hydra Subsystem ............................................................................................. 10 7. Data Processing – DYFI? Subsystem............................................................................................. 11 8. Data Processing – ShakeMap Subsystem ...................................................................................... 13 9. Data Processing – PAGER Subsystem .......................................................................................... 14 10. Data Processing – Tweet Earthquake Detections / Presentation – Tweet Earthquake Dispatch .... 16 11. Data Presentation – Web Stack, Comprehensive Catalog, Data Feeds ......................................... 17 12. Data Presentation – Earthquake Notification Service ..................................................................... 19 13. Data Presentation – NEIC Executive Summary Tool ...................................................................... 20 14. Shared Data Services ..................................................................................................................... 23

National Earthquake Information Center Systems Overview and Integration
By Michelle Guy, John Patton, Jeremy Fee, Mike Hearne, Eric Martinez, D. Ketchum, Charles Worden, Vince Quitoriano, Edward Hunter, Gregory Smoczyk, and Stan Schwarz
Overview The primary mission of the U.S. Geological Survey (USGS) National Earthquake
Information Center (NEIC) is comprehensive global earthquake monitoring (M4.5 or larger) and complete seismic monitoring of the United States for all significant earthquakes (M3.0 or larger or felt). In recent years, the NEIC has assumed a more prominent role in local and regional seismic monitoring, backup capabilities, and special studies. The NEIC uses numerous scientific algorithms to produce information products for local, national, and international disaster responders; infrastructure corporations (for example, utility providers and insurers); U.S. embassies worldwide; news agencies; national and international earth science research communities; and millions of public users.
To support this mission, the NEIC operates a constant service to derive numerous information products as rapidly and accurately as possible. Derived information products and data sets provide a wealth of related earthquake information and include products such as location, magnitude, maps of shaking intensity, moment tensors, phase arrivals, and loss and damage reports. These information products are automatically derived in near real-time and refined over time. Earthquake information products vary from well formatted text files, to binary files, to directories full of many files. A team of analysts, who provide constant coverage, 24 hours a day, seven days a week, 365 days a year, review the acquired data and automatically derived products (1) in near real-time for rapid release and (2) in the weeks following events to produce historical catalogs of global earthquakes in support of scientific research. Data and products are reviewed both in near real-time for rapid release and in the weeks following events to produce historical catalogs of global earthquakes in support of scientific research. At the present time, the NEIC publishes data for approximately 25,000 earthquakes annually.
The NEIC software system that supports this service and mission comprises many subsystems. The internals of each subsystem are often complex, but the integration between all of the subsystems is well defined, standardized, and straightforward. This Open-File Report describes the systems’ integration infrastructure and how all the subsystems fit together. It provides summary views of the system as a whole, along with detailed views of the inputs, outputs, and dependencies for each subsystem. It also outlines the many shared data services that support these subsystems and applications as well as external customers. The NEIC systems-integration effort is ongoing. Additional integration steps, needed to reach our goals, are discussed.
It is important to note that this document provides a brief introduction to the work of dozens of software developers and IT specialists, spanning in many cases more than a decade.

2
References to significant amounts of supporting documentation, code, and information are supplied within.
Motivation Well-executed systems integration is critical in making communications between
applications or subsystems as robust, transparent, and easy as possible. However, systems integration is difficult and is often the most likely point of failure in operational systems. Systems integration is about adding value to the whole system by supporting capabilities that are possible because of interactions and collaboration across subsystems.
Efficient and flexible systems integration helps our science center implement and operate more maintainable and scalable systems. Clearly defined integration supports independent development between numerous developers, as well as collaboration between internal and external teams. Operation of the system is improved, as the failure of one piece of the system does not cause a failure of the system as a whole. Additionally, by using standardized formats and distribution mechanisms, our science center reduces the coupling between the subsystems, the number of points of failure, and the number of technologies supported. All of this leads to reduced complexity and improved efficiencies.
Consistency is also an important part of integrated systems. To achieve consistency, several common or shared data services are centralized and shared across the subsystems and collaborators. Examples of shared data services include waveforms via Continuous Waveform Buffers (CWB), geographic data via GeoServers, geographic information systems (GIS), station metadata via Metadata Server (MDS), aggregated and indexed catalog of all products via Comprehensive Catalog (ComCat), and real-time, well-formatted data feeds for all products. The ease of maintenance is also improved by making these common services shared, rather than having multiple and different implementations to maintain.
Systems Integration—How It All Fits Together There are three main functional components of NEIC’s system: data acquisition,
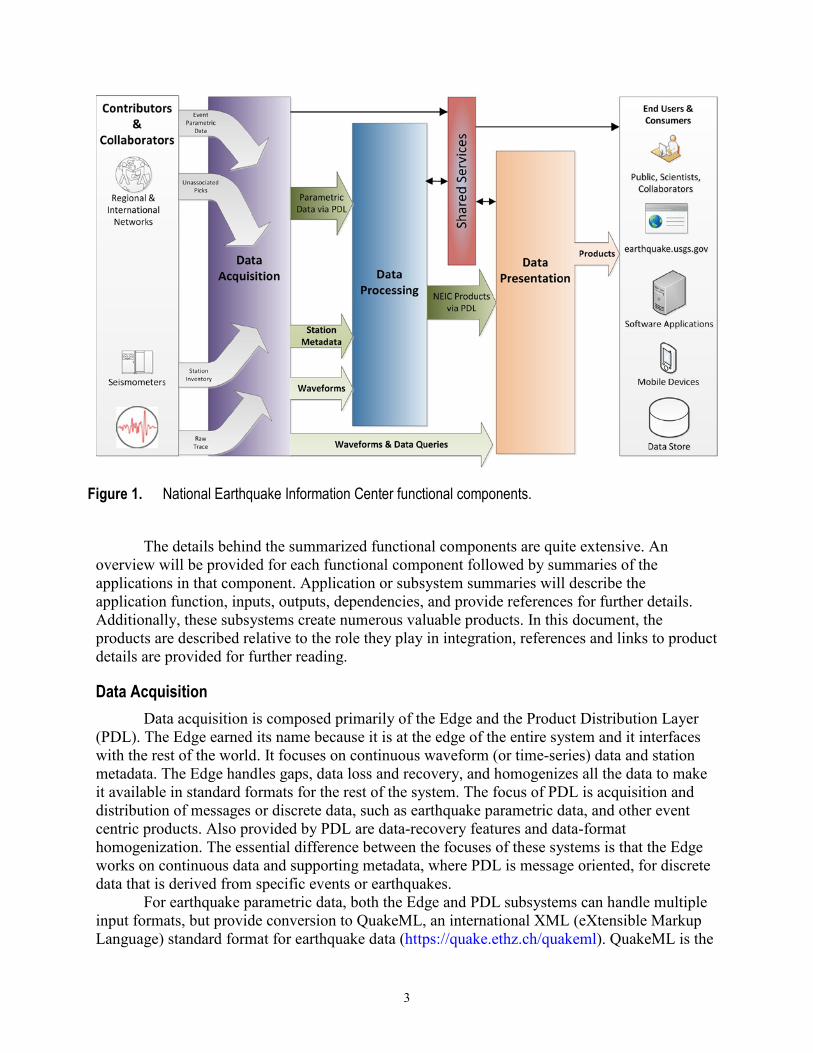
processing, and presentation (fig. 1). Each functional component is composed of multiple specialized applications or subsystems, all of which communicate with, or depend on, one or many other subsystems. These dependencies are confined to shared services and shared data or products. Each component contributes to and(or) uses shared services to achieve consistency across the entire system. Figure 1 depicts a summary of NEIC inputs, outputs, and data flows that span the functional components. In this diagram and throughout the document, data acquisition subsystems are purple, data processing subsystems are blue, data presentation subsystems are orange, shared services are red, and data integration paths are green.
The numerous subsystems across the functional components work to produce products or detailed, supporting information about earthquakes. Each product uniquely tells a piece of the story for any given earthquake. The richness of the data set is significantly increased when all of the products are brought together to tell the full story. This subtle, simple, yet powerful goal is accomplished by our systems integration approach, which is described in this document.
3
Figure 1. National Earthquake Information Center functional components.
The details behind the summarized functional components are quite extensive. An
overview will be provided for each functional component followed by summaries of the applications in that component. Application or subsystem summaries will describe the application function, inputs, outputs, dependencies, and provide references for further details. Additionally, these subsystems create numerous valuable products. In this document, the products are described relative to the role they play in integration, references and links to product details are provided for further reading.
Data Acquisition Data acquisition is composed primarily of the Edge and the Product Distribution Layer
(PDL). The Edge earned its name because it is at the edge of the entire system and it interfaces with the rest of the world. It focuses on continuous waveform (or time-series) data and station metadata. The Edge handles gaps, data loss and recovery, and homogenizes all the data to make it available in standard formats for the rest of the system. The focus of PDL is acquisition and distribution of messages or discrete data, such as earthquake parametric data, and other event centric products. Also provided by PDL are data-recovery features and data-format homogenization. The essential difference between the focuses of these systems is that the Edge works on continuous data and supporting metadata, where PDL is message oriented, for discrete data that is derived from specific events or earthquakes.
For earthquake parametric data, both the Edge and PDL subsystems can handle multiple input formats, but provide conversion to QuakeML, an international XML (eXtensible Markup Language) standard format for earthquake data (https://quake.ethz.ch/quakeml). QuakeML is the

4
standard format for earthquake parametric data for the entire system and the majority of NEIC’s collaborators (Advance National Seismic System, 2013). Using an international, extensible, and standard format significantly increases the ease of integration and shared code for data parsing across the subsystems and with collaborators.
Edge The Edge subsystem handles vast amounts of data from many organizations in many
formats and homogenizes it for simplified and efficient consumption, both within the NEIC and externally (fig. 2).
Figure 2. Edge data acquisition subsystem. (ANSS, Advanced National Seismic System; RSNs, Regional Seismic Networks; GSN, Global Seismic Network; MDS, Metadata Server; CWB, Continuous Waveform Buffer; RWS, Random Access Memory (RAM) Waveserver; TCP, Transmission Control Protocol; IRIS, Incorporated Research Institutions for Seismology; NEIC, National Earthquake Information Center; PDL, Product Distribution Layer; PGA XML,, Peak Ground Acceleration in extensible markup language.)
This subsystem handles four basic kinds of input information: raw trace (continuous
time-series data), station metadata (for example, coordinates and responses), unassociated pick data, and late-arriving contributed event parametric data. Parametric data refers to earthquake parameters including location, magnitude, phases, and moment tensors. For the raw time-series inputs, which come from dozens of regional and international networks, the Edge provides storage and access via multiple waveform interfaces including: Continuous Waveform Buffer (CWB), Winston Waveserver, and Earthworm Waveserver. Station metadata is stored in the
5
Metadata Server (MDS) and available via a data service with a defined query interface. Detailed supporting documentation is available online (ftp://hazards.cr.usgs.gov/CWBQuery). The contributed parametric data comes in via email in different formats that the Edge converts to QuakeML. The Edge then distributes the data via the NEIC Private PDL hub, as this data is generally intended for NEIC consumption only. The Edge subsystem is written predominately in Java and is compatible with MySQL and Postgres.
The Edge subsystem generates peak ground acceleration products for triggered strong-motion data that is transmitted when sensor movement exceeds a pre-defined threshold. Currently, Edge takes triggered strong-motion data and applies a simple peak ground acceleration (PGA) algorithm to produce XML-formatted data that is sent to ShakeMap via SendFile. To reduce the number of technologies supported and to simplify the overall maintenance of the NEIC system, this PGA data could be made into a product and distributed via PDL. This needs further evaluation and thus is depicted as a red arrow in the Edge Subsystem diagram (fig. 2).
Product Distribution Layer The PDL is a message-based distribution platform. It provides a standard distribution
mechanism for both sending and receiving messages. For the NEIC, these messages are well-formatted data packages of derived seismic event information, also known as “products.” Example products include origins, phases, moment tensors, shaking intensity maps, and loss and damage reports. Definitions for all products can be found online (http://ehppdl1.cr.usgs.gov/userguide/products/index.html). Products are well-formatted text-file(s) (for example, XML), binary file(s), a set of directories with many files, or any combination of these. Regardless of the format, products have a set of properties, organized as key value pairs, which describe the product and make it identifiable and searchable, independent of the underlying product format.
As products are distributed via PDL, they are associated and prioritized by the Indexer. The Indexer applies a set of business rules to associate and prioritize products, where NEIC applies network authoritative logic to assign preference, or what we call “preferredness”, to products. Preferredness is an ordered priority for data such that one product from one source is ultimately the most preferred. The network-based business rules operate on data such as source and event location. Both of these features, aggregation and preferredness, are essential to integrate and accommodate multiple products contributed from different organizations and algorithms.
Products are simultaneously distributed internally between all subsystems and externally with collaborators. As a result, collaboration is necessary on all product definitions and in the presentation of those products. This collaboration requires NEIC developers to coordinate across multiple groups, internal and external to the USGS, and with several regional, national, and international organizations. Consequently, significant documentation and testing are necessary to achieve effective integration. Detailed supporting documentation on PDL and products can be found online (http://ehppdl1.cr.usgs.gov).
A strength of PDL is that it supports loose coupling between data/product producers (senders) and consumers (receivers). All product producers and consumers only need to communicate with the PDL hubs, via PDL Product Client software. The hubs take care of the broader event association, via the Indexer, and wider data distribution via PDL. Because producers and consumers initiate connections to the hubs, most users do not need to reconfigure
6
firewalls if their data needs or collaborators change. Producers use a private key to sign products when they are sent to the PDL Hubs; the key verifies this signature using a public key before distributing products, to ensure only that authorized producers are able to send products. Receiving clients may optionally verify these signatures as well. Receiving clients can be configured to trigger processing when new products arrive, either using command line arguments or a Java application programming interface (API), eliminating polling latency. The PDL Product Client software supports configuration options to filter the products a receiver downloads. Conveniently, and quite significantly from a maintenance perspective, the PDL hubs, the sender PDL Product Client, and the receiver PDL Product Client software are the same code baselines, with different configurations. The PDL software is publically available for download and documented online (http://ehppdl1.cr.usgs.gov). Additional supporting libraries for parsing formatted products and programmatically searching for and downloading products are available also available online (https://github.com/USGS/devcorner).
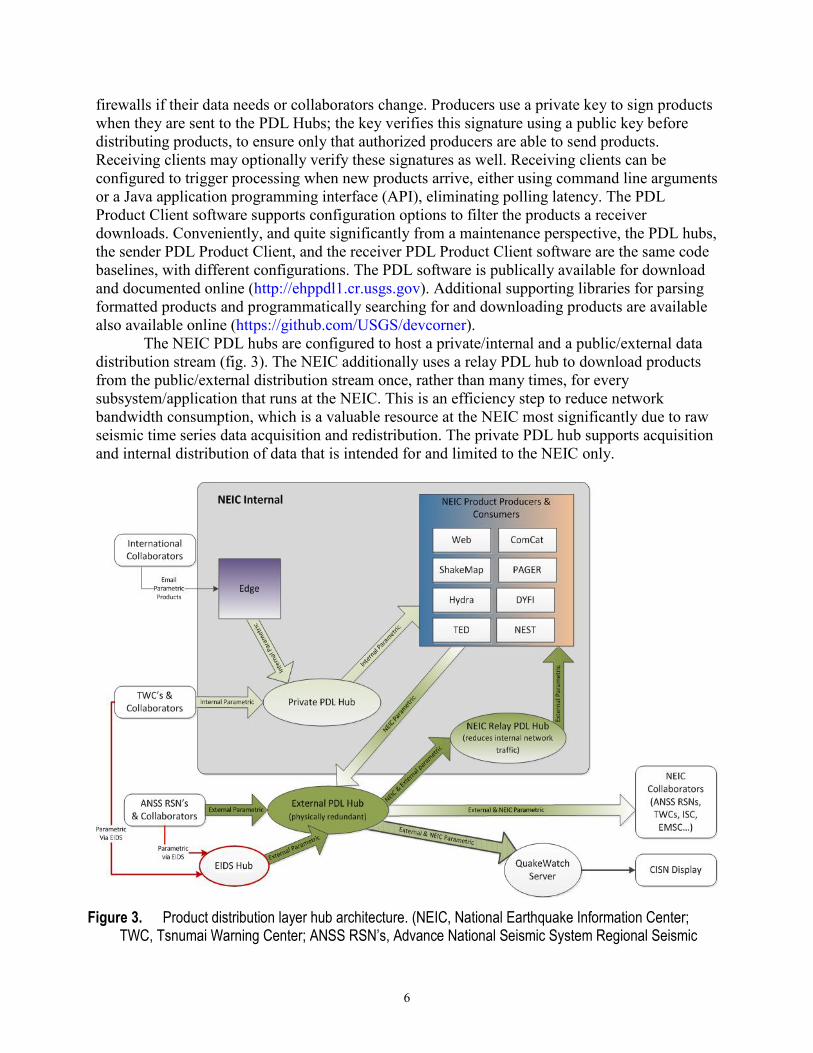
The NEIC PDL hubs are configured to host a private/internal and a public/external data distribution stream (fig. 3). The NEIC additionally uses a relay PDL hub to download products from the public/external distribution stream once, rather than many times, for every subsystem/application that runs at the NEIC. This is an efficiency step to reduce network bandwidth consumption, which is a valuable resource at the NEIC most significantly due to raw seismic time series data acquisition and redistribution. The private PDL hub supports acquisition and internal distribution of data that is intended for and limited to the NEIC only.
Figure 3. Product distribution layer hub architecture. (NEIC, National Earthquake Information Center; TWC, Tsnumai Warning Center; ANSS RSN’s, Advance National Seismic System Regional Seismic
7
Networks; EIDS, Earthquake Information Distribution System; PDL, Product Distribution Layer; ComCat, Comprehensive Catalog; PAGER, Prompt Assessment of Global Earthquakes for Response; TED, Tweet Earthquake Dispatch; DYFI, “Did You Feel It?”; NEST, NEIC Executive Summary Tool; EMSC, European-Mediterranean Seismological Centre; CISN, California Integrated Seismic Network.)
In the “Product Distribution Layer Hub Architecture” diagram (fig. 3), the legacy
Earthquake Information Data Exchange (EIDS) hubs are almost completely phased out, as they supported only limited text-based products; thus, the corresponding integration arrows are drawn in red. For backwards compatibility with EIDS there is support in PDL, via the EIDSInputWedge, as documented online (http://ehppdl1.cr.usgs.gov/userguide/eidsinputwedge.html).
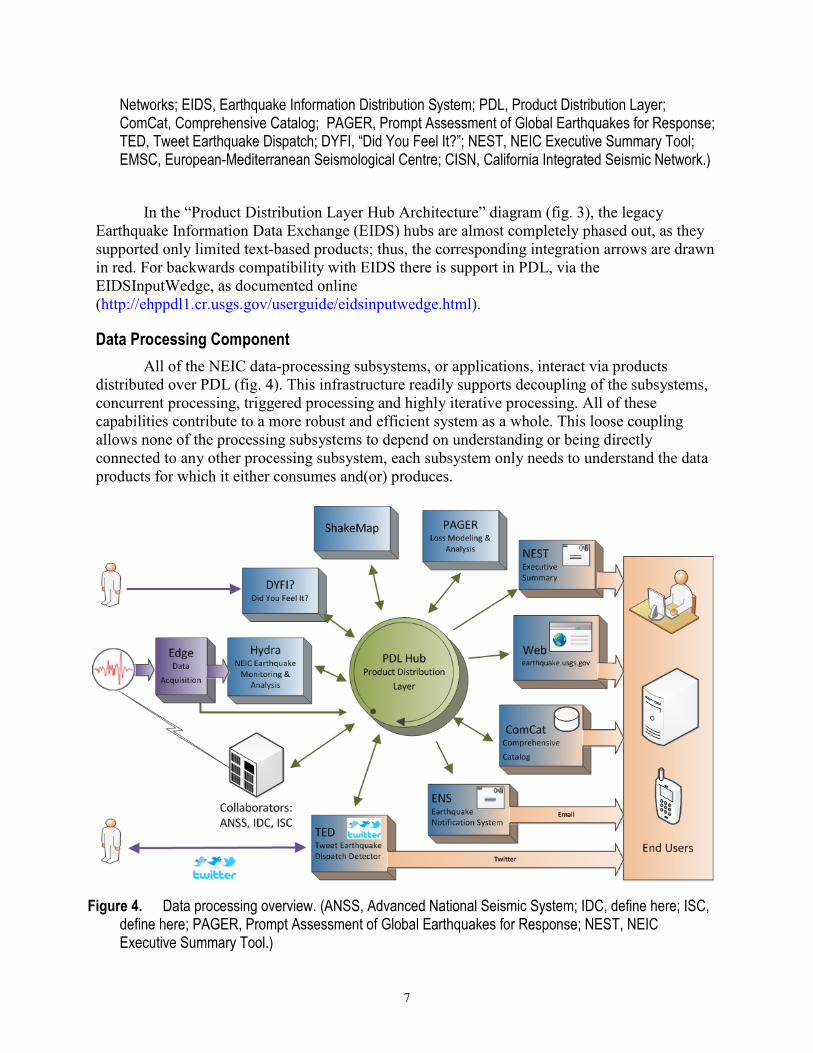
Data Processing Component All of the NEIC data-processing subsystems, or applications, interact via products
distributed over PDL (fig. 4). This infrastructure readily supports decoupling of the subsystems, concurrent processing, triggered processing and highly iterative processing. All of these capabilities contribute to a more robust and efficient system as a whole. This loose coupling allows none of the processing subsystems to depend on understanding or being directly connected to any other processing subsystem, each subsystem only needs to understand the data products for which it either consumes and(or) produces.
Figure 4. Data processing overview. (ANSS, Advanced National Seismic System; IDC, define here; ISC, define here; PAGER, Prompt Assessment of Global Earthquakes for Response; NEST, NEIC Executive Summary Tool.)

8
Data processing flow over time (fig. 5) demonstrates an example product flow for an event over time, showing how PDL supports triggered, highly iterative, concurrent, and loosely coupled processing. The key stages in an event’s lifecycle include:
1. Event detection and corresponding production of preliminary location and magnitude, 2. Concurrent presentation of preliminary event information and production of initial
ShakeMap product, 3. The existence of a ShakeMap product triggers PAGER (Prompt Assessment
of Global Earthquakes for Response) to process. Concurrently, more data is coming into Hydra and refined scientific solutions are computed (additional magnitudes, moment tensors, etc.),
4. Steps two and three are repeated for weeks as additional data continues to become available,
5. Event is reviewed, verified, and archived in the Comprehensive Catalog (ComCat) to support long term research and scientific efforts, It is relevant to note that at every step through the data flow, the products are distributed
for concurrent processing and presentation to ensure product consumers (other subsystems, end users, etc.) are receiving the information as rapidly as it is being produced.
Figure 5. Data processing flow over time. (NEIC, National Earthquake Information Center; ANSS RSN, Advanced National Seismic System Regional Seismic Network; NEST, NEIC Executive Summary Tool; PAGER, Prompt Assessment of Global Earthquakes for Response; MT, Moment Tensor.)
9
Hydra Subsystem The Hydra subsystem provides continual real time global seismic monitoring and
analysis tools, as well as late arriving data aggregation and NEIC catalog (also known as Preliminary Determination of Epicenter [PDE]) production tools. As a seismic monitoring and analysis system, its unique design supports global and regional seismology, and it aggregates solutions across many different contributors, both nationally and internationally.
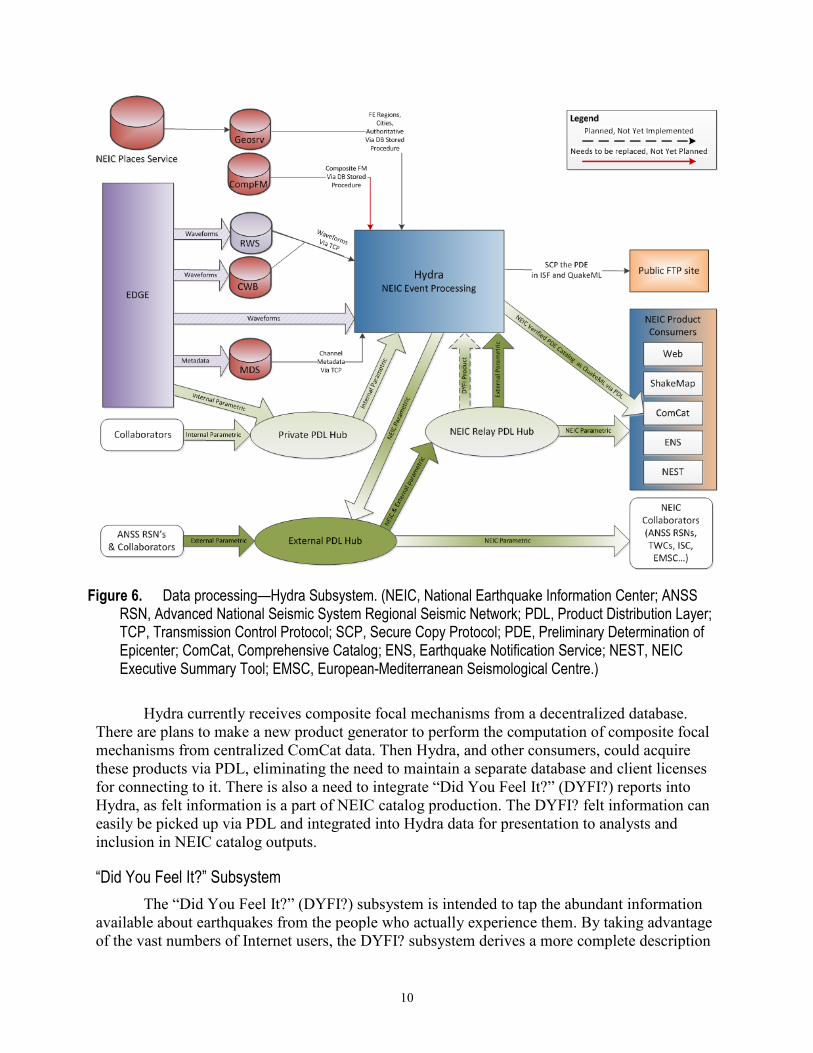
The inputs into Hydra include raw waveform time series data, station metadata, region and city information, and parametric solutions (fig. 6). As with other NEIC subsystems, Hydra gets waveform time series data from Edge nodes/CWBs, station metadata from centralized NEIC station metadata servers (MDS), geographic information from NEIC geographic data services (GeoServer), and parametric solutions via PDL. Parametric solutions include origins, magnitudes, moment tensors, and phase data from both public/external and private/internal data sources. Internal data inputs include global phase arrival time picks and event detections produced by the continuous earthquake detection software, which processes waveforms in real-time. Hydra uses a single-frequency band teleseismic picking algorithm for automatic arrival time picking; this will soon be supplemented by a multiple frequency band regional / local picking algorithm. These picking algorithms can be tuned as needed to improve the detection capabilities in relevant regions. All picks are delivered in real-time to both (1) Hydra and (2) the automated nucleation and association process for automated and rapid global and regional detections. This nucleation and association back-projection algorithm processes the picked phase arrival times to automatically detect seismic events including location, depth, and corresponding associated and named phase set. Multiple instances of the automated detection process can be run, each with a configuration specific to the region of interest.
Hydra runs numerous scientific algorithms in near real-time and for catalog production. Algorithms include location, event validation, over a dozen magnitude calculations, three types of moment tensor computations, and output generation. Hydra’s outputs are parametric solutions distributed as origin, phase, and moment tensor products via PDL (fig. 6). In September 2013, Hydra replaced the seismic monitoring, analysis, and catalog production system on the legacy VAX/VMS systems, which had been in operations for over twenty years. Hydra provides modern and sustainable technologies, a modular and expandable architecture, powerful graphical user interfaces, and seamless NEIC-wide systems integration, which support the NEIC in taking on additional tasks (for example, after-hours monitoring for Volcano Hazards Program) and an expanding mission.
10
Figure 6. Data processing—Hydra Subsystem. (NEIC, National Earthquake Information Center; ANSS RSN, Advanced National Seismic System Regional Seismic Network; PDL, Product Distribution Layer; TCP, Transmission Control Protocol; SCP, Secure Copy Protocol; PDE, Preliminary Determination of Epicenter; ComCat, Comprehensive Catalog; ENS, Earthquake Notification Service; NEST, NEIC Executive Summary Tool; EMSC, European-Mediterranean Seismological Centre.)
Hydra currently receives composite focal mechanisms from a decentralized database.
There are plans to make a new product generator to perform the computation of composite focal mechanisms from centralized ComCat data. Then Hydra, and other consumers, could acquire these products via PDL, eliminating the need to maintain a separate database and client licenses for connecting to it. There is also a need to integrate “Did You Feel It?” (DYFI?) reports into Hydra, as felt information is a part of NEIC catalog production. The DYFI? felt information can easily be picked up via PDL and integrated into Hydra data for presentation to analysts and inclusion in NEIC catalog outputs.
“Did You Feel It?” Subsystem The “Did You Feel It?” (DYFI?) subsystem is intended to tap the abundant information
available about earthquakes from the people who actually experience them. By taking advantage of the vast numbers of Internet users, the DYFI? subsystem derives a more complete description

11
of what people experienced, the effects of the earthquake, and the extent of damage, than could be derived through traditional ways of gathering felt information, which were often manual and time and labor intensive (Atkinson and Wald, 2007).
The DYFI? subsystem inputs include origin products, via PDL, and firsthand accounts entered via webpages, DYFI? questionnaires, and place names (fig. 7). The questionnaires, or felt reports, are used to estimate a shaking intensity, and are grouped into communities, defined by ZIP code regions, cities, or geocoded areas. An intensity value is then assigned to each community for which a questionnaire was filled out; each intensity value reflects the effects of earthquake shaking on the people and structures in the community. The subsystem is triggered by an event origin, to create a respective map of the intensities for each ZIP code, which summarizes the questionnaire responses provided by Internet users. A DYFI? map is made and updated every 5 minutes following a significant earthquake and then updated less frequently as additional data are received. More specific system and product information is available online (http://earthquake.usgs.gov/research/dyfi/).
Figure 7. Data processing—Did You Feel It? (DYFI) Subsystem. (FE, Flinn Enghdahl; NEIC, National Earthquake Information System; ANSS RSN, Advanced National Seismic System Regional Seismic Network; PDL, Product Distribution Layer; SMTP, Simple Mail Transfer Protocol; DYFI, Did You Feel It?; ComCat, Comprehensive Catalog; NEST, NEIC Executive Summary Tool.)
12
DYFI?-generated products are distributed via PDL. The subsystem does need further integration to get Flinn-Engdahl regions, as documented online (http://earthquake.usgs.gov/learn/topics/flinn_engdahl.php), via the GeoServer web service. Additional recommendations on points of integration include considering relying on PDL for distribution of PGA XML data, replacing the DYFI? data link to ShakeMap with PDL, and integrating with Earthquake Notification Service (ENS) for email distribution.
ShakeMap Subsystem A ShakeMap is a representation of ground shaking produced by an earthquake. The
information a ShakeMap presents is different from data describing the earthquake magnitude and epicenter that are released after an earthquake because ShakeMap focuses on the geographic distribution of the ground shaking produced by an earthquake, rather than the parameters describing the earthquake source (Worden and others, 2010). So, while an earthquake has one magnitude and one epicenter, ShakeMaps represent the range of ground shaking levels at sites throughout the region depending on distance from the earthquake, the rock and soil conditions at sites, and variations in the propagation of seismic waves from the earthquake due to complexities in the earthquake source and the structure of the Earth’s crust.
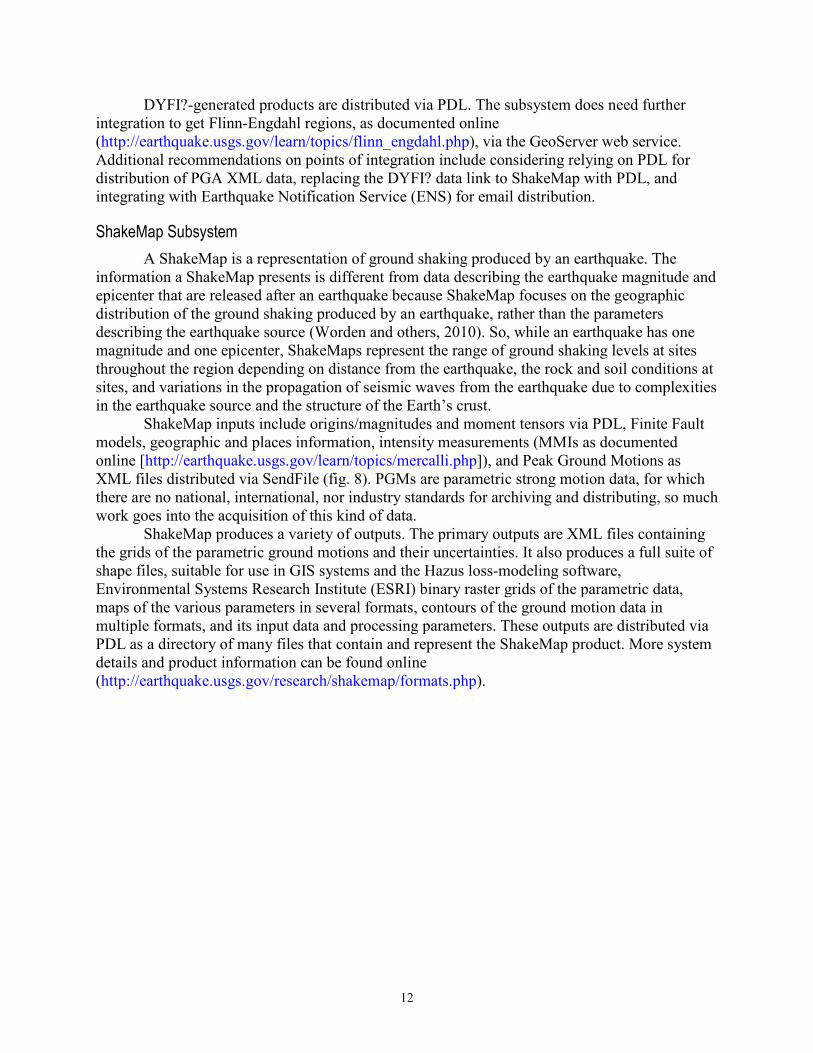
ShakeMap inputs include origins/magnitudes and moment tensors via PDL, Finite Fault models, geographic and places information, intensity measurements (MMIs as documented online [http://earthquake.usgs.gov/learn/topics/mercalli.php]), and Peak Ground Motions as XML files distributed via SendFile (fig. 8). PGMs are parametric strong motion data, for which there are no national, international, nor industry standards for archiving and distributing, so much work goes into the acquisition of this kind of data.
ShakeMap produces a variety of outputs. The primary outputs are XML files containing the grids of the parametric ground motions and their uncertainties. It also produces a full suite of shape files, suitable for use in GIS systems and the Hazus loss-modeling software, Environmental Systems Research Institute (ESRI) binary raster grids of the parametric data, maps of the various parameters in several formats, contours of the ground motion data in multiple formats, and its input data and processing parameters. These outputs are distributed via PDL as a directory of many files that contain and represent the ShakeMap product. More system details and product information can be found online (http://earthquake.usgs.gov/research/shakemap/formats.php).
13
Figure 8. Data processing—ShakeMap subsystem. (MT, Moment Tensor; FE, Flinn Engdahl; FM, Focal Mechanism; PDL, Product Distribution Layer; PGA, Peak Ground Acceleration; XML, extensible markup language; HTTP, hypertext transfer protocol; MMI, Modified Mercalli Intensity; DYFI,You’re your Feel It?; ANSS RSN, Advanced National Seismic System Regional Seismic Network; NEIC, National Earthquake Information Center; PAGER, Prompt Assessment of Global Earthquakes for Response; ComCat, Comprehensive Catalog; ENS, Earthquake Notification Service; NEST, NEIC Executive Summary Tool.)
Areas for consideration relative to system integration include:
• Distribute and receive Finite Fault products via PDL. • Move composite focal mechanism (FM) data into a centralized web service built
from moment tensor data on ComCat. • Acquire Flinn-Enghdahl regions and place information via the GeoServer web
service. • Using PDL for distribution of PGA XML data rather than SendFile.
14
PAGER Subsystem PAGER is an automated system that produces content concerning the impact of
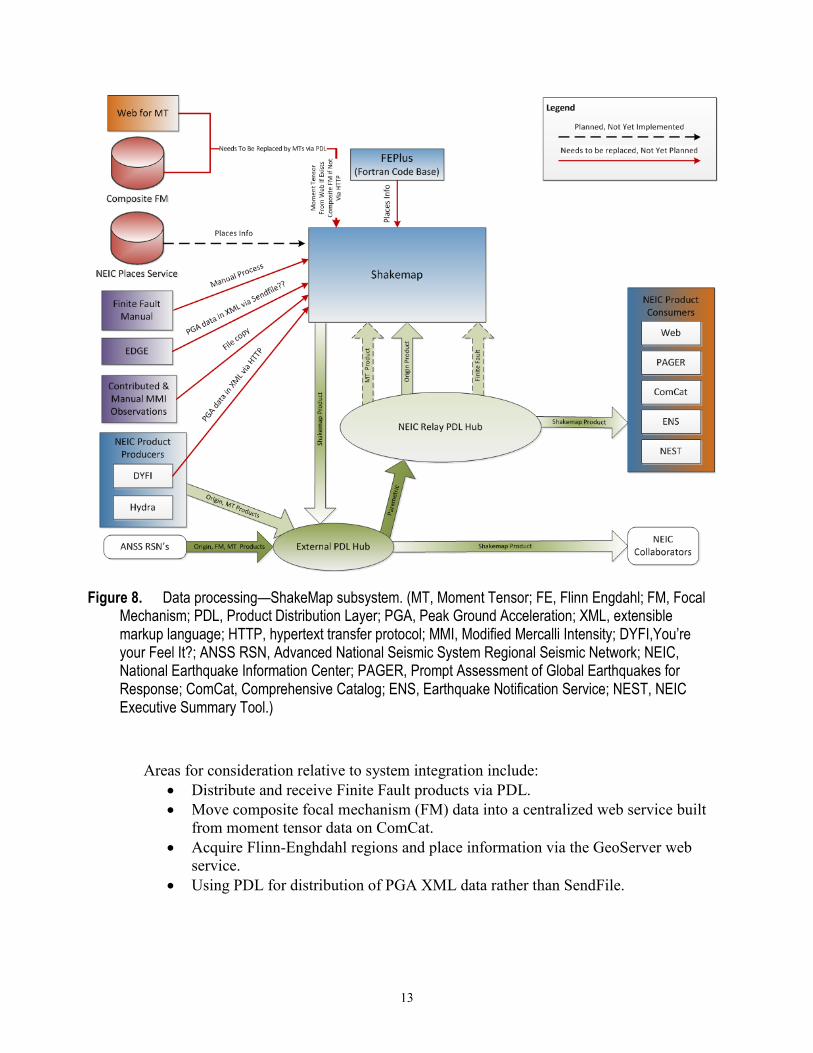
significant earthquakes around the world (Wald and others, 2010). The system informs emergency responders, government agencies, aid agencies, and the media of the scope of the potential disaster. PAGER rapidly assesses earthquake impacts by comparing the population exposed to each level of shaking intensity with models of economic and fatality losses based on past earthquakes in each country or region of the world. Earthquake alerts—which were formerly sent based only on event magnitude and location, or population exposure to shaking—now are also be generated based on the estimated range of fatalities and economic losses.
System inputs include ShakeMap products, and city and population information (fig. 9). The system also maintains a historical catalog of shaking exposure for use in assessments. Such catalogs have been maintained in isolated systems for use by PAGER only. Currently developers are working to format and integrate these catalogs into the Comprehensive Catalog in order to further the effort of supporting fewer applications and data repositories as well as to support more data sharing. More system and product specific information can be found online (http://earthquake.usgs.gov/research/pager/).
Figure 9. Data processing—PAGER Subsystem. (NEIC, National Earthquake Information Center; FE, Flinn Engdahl; ANSS RSN, Advanced National Seismic System Regional Seismic Netowrk; PDL, Product Distribution Layer; ENS, Earthquake Notification Service; ComCat, Comprehensive Catalog; NEST, NEIC Executive Summary Tool; PAGER, Prompt Assessment of Global Earthquakes for Response; FEMA,Federal Emergency Management Agency; USGS, U.S. Geological Survey;
15
USAID/OFDA, U.S. Agency for International Development/Office of Foreign Disaster Assistance; UN, United Nations)
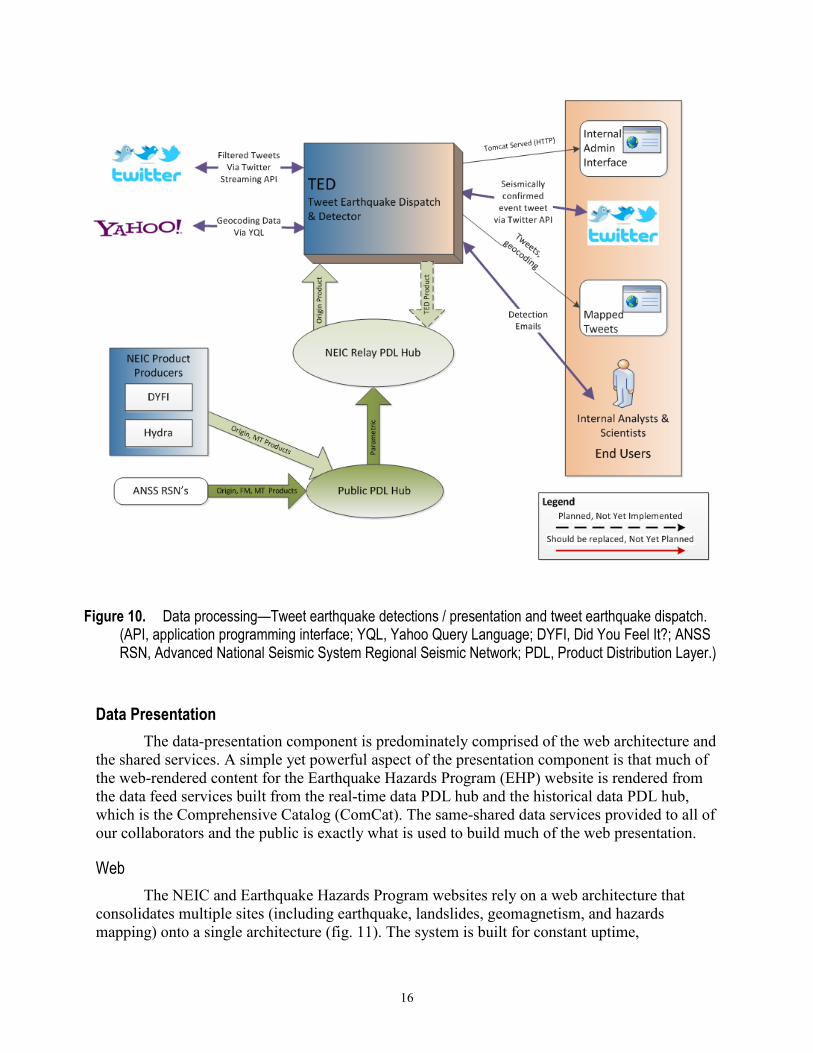
Tweet Earthquake Dispatch The NEIC runs a real-time system that detects earthquakes worldwide using data solely
mined from Twitter messages. This system improves the earthquake response of NEIC and its collaborators by providing rapid alerts prior to seismic-based detections in regions sparsely covered with seismic instruments (Earle and others, 2010; Guy and others, 2010). This system capitalizes on the expeditious, free and ubiquitous nature of social-media data to produce rapid and dynamic earthquake effect products based on information shared via social-media networks, from people at the source of the hazard, as the effects unfold. Amassed detection, damage, and effects data are made available to collaborators who participate in hazards response efforts. The input data streams and distributed products are persisted to support analysis and long term scientific research efforts.
System inputs include tweets from Twitter, geocoding places information, and earthquake origin/magnitude products via PDL (fig. 10). The outputs include data storage of qualifying earthquake tweets for analysis, internal emails of initial detections and derived follow on earthquake effect/characterization indicators, and public tweets of seismically confirmed events via twitter accounts @USGSted, and @USGSBigQuakes. Future integration efforts include creating an output product for distribution via PDL. More details on the system can be found online (http://earthquake.usgs.gov/earthquakes/ted/).
16
Figure 10. Data processing—Tweet earthquake detections / presentation and tweet earthquake dispatch. (API, application programming interface; YQL, Yahoo Query Language; DYFI, Did You Feel It?; ANSS RSN, Advanced National Seismic System Regional Seismic Network; PDL, Product Distribution Layer.)
Data Presentation The data-presentation component is predominately comprised of the web architecture and
the shared services. A simple yet powerful aspect of the presentation component is that much of the web-rendered content for the Earthquake Hazards Program (EHP) website is rendered from the data feed services built from the real-time data PDL hub and the historical data PDL hub, which is the Comprehensive Catalog (ComCat). The same-shared data services provided to all of our collaborators and the public is exactly what is used to build much of the web presentation.
Web The NEIC and Earthquake Hazards Program websites rely on a web architecture that
consolidates multiple sites (including earthquake, landslides, geomagnetism, and hazards mapping) onto a single architecture (fig. 11). The system is built for constant uptime,

17
maintainability, and significantly high loads, which average over thirty million monthly worldwide visitors.
The earthquake event pages provide a comprehensive set of information about seismic events. The pages are automatically generated based on real-time information as it is received from various monitoring networks, via PDL. The pages are assembled from the dynamic event data, that is publically available via the real-time data feeds, and are accessible via multiple browsers and devices (for example, mobile friendly). The interactive websites and more information is available online (http://earthquake.usgs.gov). The code is also available online (https://github.com/usgs/earthquake-eventpages).
Figure 11. Data presentation–Web stack, comprehensive catalog, data feeds. (NEIC, National Earthquake Information Center; DYFI, Did You Feel It?; TED, Tweet Earthquake Dispatch; ANSS RSN, Advanced National Seismic System Regional Seismic Network; PDL, Product Distribution Layer; USGS, U.S. Geological Survey; PAGER, Prompt Assessment of Global Earthquakes for Response; IPAWS, Integrated Public Alert and Warning System.)
Web Service and Data Feeds The web service and feeds provide public data access to the catalog of earthquake
products acquired by PDL and managed by the Indexer (fig. 11). Feeds are predefined web service queries, built using a data-first approach, and are cached for scalability. The data-first
18
approach incorporates activities required to assess, improve, and maintain data quality. The web service and data feeds serve the real-time and historic ANSS earthquake information using consistent formats. A format for programmatic access includes links to all information in originally contributed formats, so information can be extracted from the catalog for processing. The scientific researchers and general public can subscribe to the feeds or use the web service, which is why this system is also described in the Shared Services section of this document. More information about the services, feeds, and formats can be found online (http://earthquake.usgs.gov/earthquakes/feed/v1.0/).
Comprehensive Catalog Earthquake parametric data exists in various formats (sometimes with no reference to
other available products and sources of information) and in many locations. Prior to the existence of the Advanced National Seismic Systems’ (ANSS’s) Comprehensive Catalog (ComCat) users had to visit multiple sources to view or download earthquake data, parametric parameters, and other related products (for example, hypocenter, phases, moment tensors, ShakeMaps). Software developments at the USGS have created systems (for example, Product Distribution Layer) that are leveraged to facilitate the development of a Comprehensive Catalog (ComCat) across the ANSS and the NEIC’s global network of contributors. ComCat consists of (fig. 11):
• A comprehensive catalog of all ANSS events, both historical and near real time • Integrated digital catalogs such as Global Centroid Moment Tensor (GCMT)
Catalog, Duputel W-Phase Catalog, among others on a continually expanding list • A web interface to access and search the catalog • Downloadable files of search results in a variety of formats • All products associated with events (for example, earthquake source parameters,
tectonic summaries, isoseismal maps, ShakeMaps, etc.) indexed and easily accessible.
Because the system offers an integrated single location for earthquake centric products, and because it has multiple interfaces for accessing the data, it is also thought of as a shared service and discussed more in that section of this document. More information on ComCat is available online (http://earthquake.usgs.gov/earthquakes/map/doc_aboutdata.php) and it is also referenced in the U.S. Geological Survey Science Data Catalog (http://data.usgs.gov/datacatalog/#fq=titlestr%3A%22Advanced%20National%20Seismic%20System%20(ANSS)%20Comprehensive%20Catalog%22&q=*%3A*). Additionally, software tools for programmatic access are publically available online (https://github.com/usgs/devcorner).
Earthquake Notification Service The USGS Earthquake Hazards Program (EHP) Earthquake Notification Service (ENS)
is a customizable earthquake alert system provided for free. New accounts receive, by default, all earthquakes with magnitude 6.0 or greater; users can subsequently customize these settings to better-fit individual needs. Users receive earthquake notifications for any earthquakes located by the ANSS/NEIC (Advanced National Seismic System/National Earthquake Information Center) in the United States and around the world (fig. 12). Information for earthquakes in the United States is generally available within 5 minutes; information for earthquakes elsewhere in the World is generally available within 30 minutes. Within the United States, earthquakes are located down to about M2.0, and about M4.0 for the rest of the world. Earthquake information

19
products, received PDL, trigger the notifications (fig. 13). More information about, including how to subscribe, to ENS is online (https://sslearthquake.usgs.gov/ens/help).
Figure 12. Data presentation—Earthquake Notification Service (ENS). (NEIC, National Earthquake Information Center; DYFI, Did You Feel It?; PAGER, Prompt Assessment of Global Earthquakes for Response; SMS, short message service; ANSS RSN, Advanced National Seismic System; PDL, Product Distribution Layer.)
NEIC Executive Summary Tool After a significant earthquake, the NEIC earthquake coordinator distributes a summary of
the event and NEIC actions to a limited (mostly USGS) audience. This is done less than one hour after the event, and is often updated as more information becomes available. The NEIC Executive Summary Tool (NEST) is not used on a regular basis, rather only following significant earthquakes; therefore the interface is intuitive and easy to operate when there are long time lapses between uses. The tool is also used in situations that can frequently be high stress/pressure and perhaps in the middle of the night, so again, ease of operation is paramount. Much of the information that is included in the summary outputs is received via PDL across many NEIC systems (earthquake solutions, shaking intensities, effect assessments, etc.) (fig. 13). NEST provides a quick and easy way to assemble and view the relevant information and provide a framework to evaluate what additional information is available and should be included.

20
Figure 13. Data presentation—National Earthquake Information Center (NEIC) Executive Summary Tool. (NEST,NEIC Executive Summary Tool; ANSS RSN, Advanced National Seismic System Regional Seismic Network; PDL, Product Distribution Layer.; SMS, short message service.)
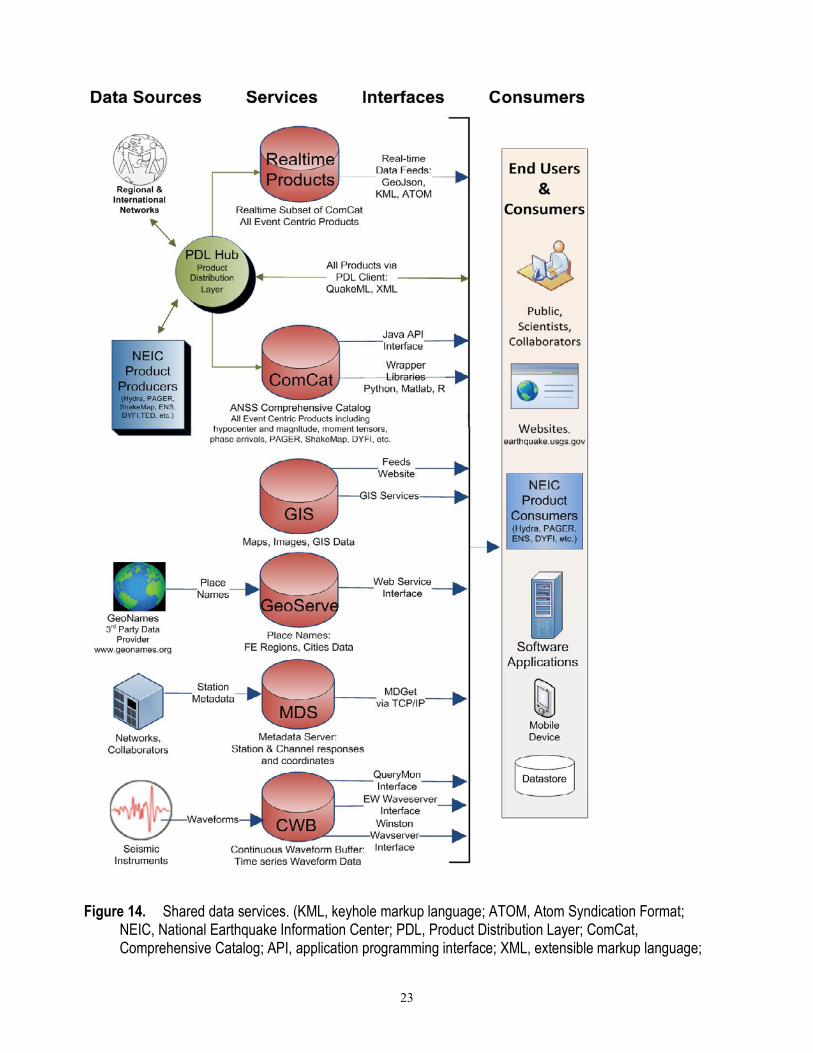
Shared Data Services Across NEIC There are several data sets and services that are needed across many subsystems and
applications, such as place and geographical names, seismic time series data, and station metadata (fig. 14). By making shared services, the team can support common needs across many internal and external applications and subsystems. Shared services provide the whole system with consistency and simplicity, instead of multiple subsystems implementing the same feature in different ways, often with different technologies and resulting in different outcomes.
The shared services have well defined interfaces, sometimes available via multiple mechanisms and(or) formats, and are built to follow open standards for ease of integration and support. These services include:
• Station Metadata, such as instrument latitude, longitude, poles and zeros. o MDS
Inputs are detailted station information in dataless SEED format (http://ds.iris.edu/ds/nodes/dmc/data/formats/#dataless-seed).
Outputs are available via a programmatic query interface and database stored procedures.
21
o SMDS Inputs are station information acquired via database queries to MDS. Outputs available via web interface online
(https://geohazards.usgs.gov/secure/beta-smds/list.php). Future intensions to integrate with stationXML
(http://www.fdsn.org/xml/station). o International Agency Deployment and Station Registry (IADSR)
Inputs include dataless volumes processed when we put them in the MDS which contain coordinates for stations and location codes and text files from the International Seismological Centre (ISC) containing the station coordinates for the International Registry (IR).
Outputs derived via mdget programmatic interface for Agency Deployment Station Location (ADSL) formatted outputs (https://github.com/usgs/mdgetpython).
• Place names, such as cities, countries, oceans, regions, etc. o The GeoServer returns city and region information for a given latitude and
longitude. o The places database is populated with data sets from GeoNames
(http://www.geonames.org). o Location products encapsulate the information returned from the GeoServer for a
given latitude and longitude into a product that is distributed by PDL. • Authoritativeness
o The PDL Indexer applies business rules to determine which product from which sender is authoritative, or preferred, over the other same products from other contributors. Supporting documentation can be found online (http://ehppdl1.cr.usgs.gov/userguide/system_overview.html#indexer).
o The GeoServer returns authoritative network given a latitude and longitude as defined by ANSS regional seismic networks and NEIC international collaborators’ authoritative regions/polygons.
• Product distribution for event-associated parametric data (for example, origins, moment tensors) and derived products (for example, ShakeMap, PAGER)
o The Product Client is a java application that can be configured to send and(or) receive products via PDL. Application distribution, system requirements and installation instructions are available online (https://ehppdl1.cr.usgs.gov).
o The web services implement Federation of Digital Seismograph Networks (FDSN) formatted data services of all event data. Supporting documentation is online (http://www.fdsn.org/webservices/).
o The data feeds provide GeoJSON formatted data for all data on the PDL data stream; supporting documentation is online (http://earthquake.usgs.gov/earthquakes/feed/v1.0/index.php).
o The Comprehensive Catalog (ComCat), provides either an aggregated data view across all contributors for events, or views of catalogs for a particular contributor. Supporting documentation is online (http://earthquake.usgs.gov/earthquakes/map/doc_aboutdata.php).
22
o Backwards compatibility with EIDS is supported via EIDSInputWedge in PDL. Supporting documentation is online (http://ehppdl1.cr.usgs.gov/userguide/eidsinputwedge.html).
• Waveform Data Distribution o Data acquired by the Edge and made available in Waveform Buffers:
The Continuous Waveform Buffer (CWB) contains 18 months of data and accessible via numerous interfaces including Earthworm waveserver interface, Winston waveserver interface, and CWB Query interface.
The Research Waveform Buffer has two-hour snippets of data around significant events from 1990 to current. The data is available via the same interfaces as the CWB.
• GIS Support o NEIC maintains ArcGIS web services for numerous data sets. These web services
include support for dynamic data queries as well as cached map images for online use.
o Supported geospatial data currently includes historic earthquakes, faults, plate boundaries, hazard maps, and slab models. This list will be expanded in the future.
The value of the shared data services is highlighted by their use outside of the NEIC. The CWBs, for acquisition of time-series data, are used by several ANSS organizations, the USGS Volcano Hazards Program, the USGS Geomagnetism program, and other NEIC collaborators. Both PDL and ComCat have been adopted as ANSS standards for product distribution and archival. Additionally, the place names service is used by multiple ANSS organizations.
23
Figure 14. Shared data services. (KML, keyhole markup language; ATOM, Atom Syndication Format; NEIC, National Earthquake Information Center; PDL, Product Distribution Layer; ComCat, Comprehensive Catalog; API, application programming interface; XML, extensible markup language;
24
ANSS, Advanced National Seismic System; DYFI, Did You Feel It?; PAGER, Prompt Assessment of Global Earthquakes for Response; ENS, Earthquake Notification Service; TED, Tweet Earthquake Dispatch; GIS, Geographic Information System; FE, Flinn Engdahl; TCP/IP, Transmission Control Protocol/Internet Protocol; MDS, Metadata Server; MDGet, Metadata Get; EW, Earthworm; CWB, Continuous Waveform Buffer.)
Future Work The team is continuing to work on new subsystems and products. One such product, that
will better support earthquake impact and effects data (for example, number of deaths, buildings damaged, utilities damaged) integration across multiple subsystems, is the Impact product. This is an example of a new product that will be generated by multiple subsystems and scientists. Impact data aggregated with other event details will them make a rich data set for continued updates and improvements for loss and damage models as well.
Another project is setting up an environment, using existing PDL and event web pages code base, for earthquake scenarios to support emergency preparedness. We are excited about our improvements and efforts to continue supporting the public and science community.
Conclusion The NEIC integration effort focuses on following open and consistent data format and
distribution standards and consistent shared data services. With this focus, the team has constructed a system of loosely coupled, highly specialized and sophisticated subsystems that work efficiently together. The success of the integration effort has contributed to the team’s ability to develop, operate, and maintain an enriched suite of applications and products in overall support of the NEIC and its mission.
The successful integration of all of NEIC’s subsystems and products across all three functional areas of acquisition, processing, and presentation results in a richer data set for all of our customers. This richer data set provides a means to tell very detailed stories at an event level, for a region, and(or) for a time span. The team has been successful in building an integrated system to support the immediate and long-terms needs of our customers.
References Cited Advance National Seismic System (ANSS), 2013, ANSS QuakeML Standards and Code:
Quakeml, accessed June 01, 2015 at https://github.com/usgs/Quakeml. Atkinson, G.M., and Wald, D.J., 2007, “Did You Feel It?” intensity data—A surprisingly good
measure of earthquake ground motion: Seismological Research Letters, v. 78, p. 362–368. Earle, Paul, Guy, Michelle, Buckmaster, Richard, Ostrum, Chris, Horvath, Scott, and Vaughan,
Amy, 2010, OMG earthquake! Can Twitter improve earthquake response?: Seismological Research Letters, v. 81, p. 246–251.
Guy, Michelle, Earle, Paul, Ostrum, Chris, Gruchalla, Kenny, and Horvath, Scott, 2010, Integration and dissemination of citizen reported and seismically derived earthquake information via social network technologies: Advances in Intelligent Data Analysis IX Lecture Notes in Computer Science, v. 6065, p. 42–53.

25
Worden, C.B., Wald, D.J., Lin, K., Cua, G., and Garcia, D., 2010, A revised ground-motion and intensity interpolation scheme for ShakeMap: Bulletin of the Seismological Society of America, v. 100, p. 3083–3096.
Wald, D.J., Jaiswal, K.S., Marano, K.D., Bausch, D.B., and Hearne, M.G., 2010, PAGER—Rapid assessment of an earthquake’s impact: U.S. Geological Survey Fact Sheet 2010–3036, 4 p.