national disability insurance scheme outcomes framework ... · national disability insurance scheme...
TRANSCRIPT
National Disability Insurance Scheme Outcomes framework pilot study: summary report
Version 1, September 2015

2
3
Acknowledgements
The NDIA would like to thank all those who have contributed to the development of the NDIS Outcomes Framework so far. In particular, thanks are due to all of the participants, family members and carers who generously contributed their time in order to take part in the pilot study interviews.
4
Contents Acknowledgements .................................................................................................................... 3
Contents .................................................................................................................................... 4
1 The need for a National Disability Insurance Scheme participant and family/carer outcomes framework .................................................................................................................................. 5
1.1 Background.................................................................................................................. 5
1.2 Legislation and other policy documents ....................................................................... 5
1.2.1 Legislation ............................................................................................................ 5
1.2.2 Other policy documents ........................................................................................ 6
1.3 Guiding principles, monitoring and benchmarking ........................................................ 6
1.4 Participants’ unique goals ............................................................................................ 7
1.5 Review of existing frameworks and consultation .......................................................... 7
1.5.1 Review of existing frameworks .............................................................................. 7
1.5.2 Consultation .......................................................................................................... 8
2 Piloting the outcomes framework ........................................................................................ 9
2.1 Introduction .................................................................................................................. 9
2.1.1 Interpretation of results ......................................................................................... 9
2.1.2 Questionnaire versions ......................................................................................... 9
2.1.3 Interviews conducted .......................................................................................... 11
2.2 Results ....................................................................................................................... 12
2.2.1 Participants from birth to school age ................................................................... 12
2.2.2 Participants from school age to 15 ...................................................................... 15
2.2.3 Participants aged 15 to 24 .................................................................................. 19
2.2.4 Participants aged 25 to 55 .................................................................................. 28
2.2.5 Participants aged over 55 ................................................................................... 35
2.2.6 Family members of participants aged 0 to 15 ...................................................... 43
2.2.7 Family members of participants aged 15 to 24 .................................................... 49
2.2.8 Family members of participants aged 25 and over .............................................. 55
2.2.9 Overall findings and next steps ........................................................................... 59
5
1 The need for a National Disability Insurance Scheme participant and family/carer outcomes framework
1.1 Background
Fundamentally, the National Disability Insurance Scheme (NDIS) was set up to allow people with disability to live “an ordinary life”: to fully realise their potential, to participate in and contribute to society, and to have a say in their own future – just as other members of Australian society do.
These aims are embedded in the legislation which established the Scheme, the National Disability Insurance Scheme Act 20131, and taken up by the National Disability Insurance Agency (NDIA) Strategic Plan 2013-20162. The Strategic Plan points out that achievement of Scheme goals “will require regular reviews of the NDIA’s own performance and a culture of continuous learning”. Given the Scheme’s focus on the individual, these reviews must measure the extent to which the individual goals, needs and choices of each participant are being met, as well as the impact of the Scheme on the wellbeing of families and carers. In other words, we need a way of measuring individual outcomes for participants, their families and carers.
1.2 Legislation and other policy documents
1.2.1 Legislation
The NDIS is governed by the National Disability Insurance Scheme Act 2013 and hence must uphold the objects and principles set out in Part 2 of the Act. Sections 3 and 4 of the Act are particularly relevant to individual outcomes. Section 3 (1) lists the objects of the Act, including, for example, Sections 3 (1) (c), (e), (g) and (h):
(c) support the independence and social and economic participation of people with disability . . .
(e) enable people with disability to exercise choice and control in the pursuit of their goals and the planning and delivery of their supports . . .
(g) . . . maximise independent lifestyles and full inclusion in the community . . .
(h) . . . facilitate greater community inclusion of people with disability
1 http://www.comlaw.gov.au/Details/C2013A00020/Download 2 http://www.ndis.gov.au/document/671
6
Section 3 also states that achievement of the objects will require governments to work together to develop and implement the Scheme, and adoption of an insurance-based approach.
Section 3 refers to Australia’s obligations under some other instruments, including:
• The UN Convention on the Rights of Persons with Disabilities3 (CRPD); • The National Disability Strategy 2010-204 as endorsed by COAG on 13 February 2011;
and • The Carer Recognition Act 20105.
These instruments also contain provisions relevant to individual outcomes, and there is a reporting requirement under the CRPD.
1.2.2 Other policy documents
Other policy documents relevant to outcome measurement include:
• The Productivity Commission Report6 • The NDIA Strategic Plan2 • Intergovernmental Agreement (IGA)7 Annex on the Integrated NDIS Performance
Reporting Framework • The National Disability Strategy 2010-20208 • National Standards for Disability Services9.
1.3 Guiding principles, monitoring and benchmarking
At a basic level, the Scheme has a responsibility to enable participants to meet their goals, or an accepted goal. Monitoring outcome measures over time will enable assessment of how well the Agency is assisting participants to achieve their goals. Concurrent tracking of risk factors, including socio-demographic factors, as well as the individual, community and mainstream supports that are being received, will enable modelling of how progress is impacted by risk factors and alternative support options. The ultimate aim of this modelling is to uncover the factors and supports that predict progress towards the achievement of outcomes.
3 http://www.un.org/disabilities/convention/conventionfull.shtml 4 http://www.dss.gov.au/our-responsibilities/disability-and-carers/program-services/government-international/national-disability-strategy 5 http://www.comlaw.gov.au/Details/C2010A00123 6 http://www.pc.gov.au/projects/inquiry/disability-support/report 7 https://www.coag.gov.au/node/485 8 https://www.dss.gov.au/our-responsibilities/disability-and-carers/program-services/government-international/national-disability-strategy 9 https://www.dss.gov.au/our-responsibilities/disability-and-carers/standards-and-quality-assurance/national-standards-for-disability-services
7
Collecting information on individual outcome measures also allows us to measure how the Scheme is tracking against external benchmarks. For example, we might measure the experience of people with a disability against the experience of other Australians, or against the achievements of other OECD countries.
Development of the outcomes framework needs to be informed by a set of guiding principles. The indicators must be:
• Meaningful: widely accepted as important measures of progress • Informative: able to indicate what is working to improve outcomes and what is not • Feasible to collect and report: avoid over-surveying participants and undue burden on
staff.
1.4 Participants’ unique goals
Participants will have their own unique goals and aspirations, which will be incorporated into their plan. Measuring how participants are progressing in relation to these personal goals is an important part of plan review, and the outcomes framework is not intended to replace the monitoring of individual goals. Rather, the purpose of the outcomes framework is to measure progress towards a common set of accepted goals for each participant, so that the results can be aggregated up to provide a picture of how and where the Scheme is making a difference overall.
1.5 Review of existing frameworks and consultation
1.5.1 Review of existing frameworks
The key frameworks considered were:
• Council on Quality and Leadership : Personal Outcome Measures® (CQL POM) (US) • National Core Indicators (NCI) (US) • Fulfilling Potential (UK) • Life Opportunities Survey (LOS) (UK) • Adult Social Care Outcomes Framework (ASCOF) (UK) • Frameworks emerging from Personally Controlled Budget approaches (UK) • National Disability Survey (Republic of Ireland) • The Intellectual Disability Supplement to the Irish Longitudinal Study of Ageing (IDS-
TILDA) (Republic of Ireland) • The University of Toronto Quality of Life Profile (QLP) (Canada) • Ministry of Social Development “Investing in Services for Outcomes” (New Zealand) • Transport Accident Commission (TAC) (Australia) • National Disability Services (NDS) framework (Australia).
8
1.5.2 Consultation
In developing the NDIS Outcomes Framework the NDIA has consulted with a wide range of experts and stakeholders. Consultation has included:
• The NDIA Independent Advisory Council, who provided valuable ongoing input, including advice on how to frame the questionnaires around a lifespan approach.
• A workshop involving representatives of key stakeholder groups held in March 2015, chaired by IAC Chair Rhonda Galbally and Scheme Actuary Sarah Johnson. Feedback arising from this workshop contributed to improvement of the outcomes framework questionnaires.
• Feedback provided by the participants and family members/carers who took part in the pilot study, which has also contributed to improvement of the outcomes framework questionnaires.
• Disability researchers, including experts from the University of Sydney, the University of New South Wales, La Trobe University, Monash University, and Griffith University.
• Experts involved with the development of other national and international frameworks, including the US National Core Indicators and The Council on Quality and Leadership.
• Experts working with special cohorts, including Indigenous groups and Culturally and Linguistically Diverse groups.
• Intellectual disability experts, who assisted with drafting the Easy English and Pictorial versions of the questionnaires, and with other issues related to engaging participants with intellectual disability.
• Mental health experts.
9
2 Piloting the outcomes framework
2.1 Introduction
This section of the report describes the pilot study that was undertaken to trial the outcomes framework. Interviews with a sample of participants, and family members/carers, took place in the Barwon, Hunter and Tasmanian trial sites in the first quarter of 2015.
2.1.1 Interpretation of results
The primary purpose of the pilot study was to assess the validity of questions rather than to provide a detailed analysis of responses to questions. Although some analysis has been presented, we would caution against over-interpreting the results since they are based on relatively small sample sizes and only present a snapshot of participant experience at a single point in time. Nevertheless, these preliminary results do give an indication of the types of analyses that will be possible once full data collection commences and a longitudinal database is built up.
Results also need to be considered in the light of the NDIS’s role: the Outcomes Framework poses questions about areas of a participant’s life for which other systems, such as Health or Education, are primarily responsible, not the NDIS. Whilst the inclusion of such questions was deliberate, and is important for building up a complete picture of progress, it is also important to remember that the NDIS is not able to directly influence outcomes in all areas.
It should also be recognised that the journey towards full implementation of the NDIS is not complete, and any interpretation of the pilot study results needs to acknowledge the stage we are at in this journey. Many of the participants surveyed only joined the Scheme recently, and first plans were often focussed on addressing unmet need, such as daily living activities. As the Scheme matures, more focus will be placed on capacity building. The new NDIA support catalogue reflects this evolution, and will help ensure that NDIS planning is better aligned to participant outcomes, focusing on core supports, and investments by the Agency in capacity building and purchase of assistive technology to increase participants’ independence and reduce long term costs.
2.1.2 Questionnaire versions
Eleven different questionnaire versions were trialled during the pilot study, including eight participant versions and three family versions. The eleven versions are summarised in Table 2.1.
Table 2.1 Questionnaire versions
Participant age Participant standard Participant Easy English/Pictorial
Family/carer
0 to school Participant 0-school Family 0-15 School to age 15 Participant school-15 Family 0-15 15 to 24 Participant 15-24 Participant 15-24 EE Family 15-24
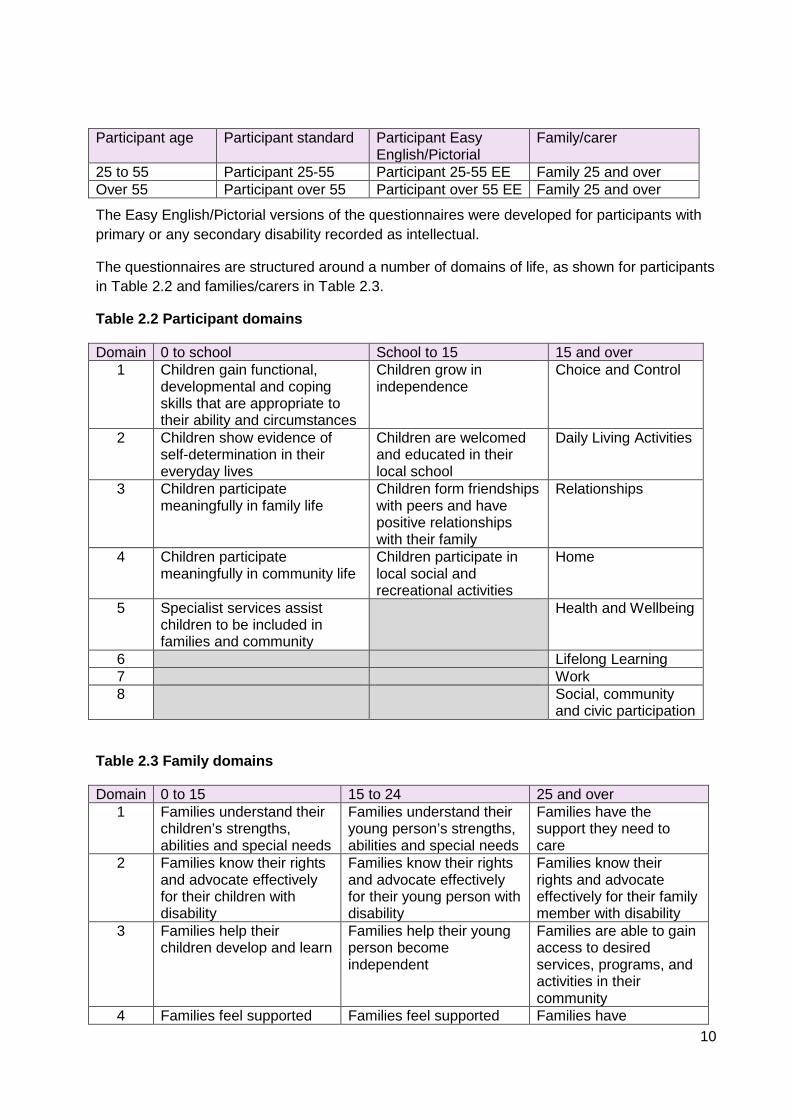
10
Participant age Participant standard Participant Easy English/Pictorial
Family/carer
25 to 55 Participant 25-55 Participant 25-55 EE Family 25 and over Over 55 Participant over 55 Participant over 55 EE Family 25 and over
The Easy English/Pictorial versions of the questionnaires were developed for participants with primary or any secondary disability recorded as intellectual.
The questionnaires are structured around a number of domains of life, as shown for participants in Table 2.2 and families/carers in Table 2.3.
Table 2.2 Participant domains
Domain 0 to school School to 15 15 and over 1 Children gain functional,
developmental and coping skills that are appropriate to their ability and circumstances
Children grow in independence
Choice and Control
2 Children show evidence of self-determination in their everyday lives
Children are welcomed and educated in their local school
Daily Living Activities
3 Children participate meaningfully in family life
Children form friendships with peers and have positive relationships with their family
Relationships
4 Children participate meaningfully in community life
Children participate in local social and recreational activities
Home
5 Specialist services assist children to be included in families and community
Health and Wellbeing
6 Lifelong Learning 7 Work 8 Social, community
and civic participation
Table 2.3 Family domains
Domain 0 to 15 15 to 24 25 and over 1 Families understand their
children’s strengths, abilities and special needs
Families understand their young person’s strengths, abilities and special needs
Families have the support they need to care
2 Families know their rights and advocate effectively for their children with disability
Families know their rights and advocate effectively for their young person with disability
Families know their rights and advocate effectively for their family member with disability
3 Families help their children develop and learn
Families help their young person become independent
Families are able to gain access to desired services, programs, and activities in their community
4 Families feel supported Families feel supported Families have
11
Domain 0 to 15 15 to 24 25 and over succession plans
5 Families are able to gain access to desired services, programs, and activities in their community
Families are able to gain access to desired services, programs, and activities in their community
Families enjoy health and wellbeing
6 Families enjoy health and wellbeing
Families enjoy health and wellbeing
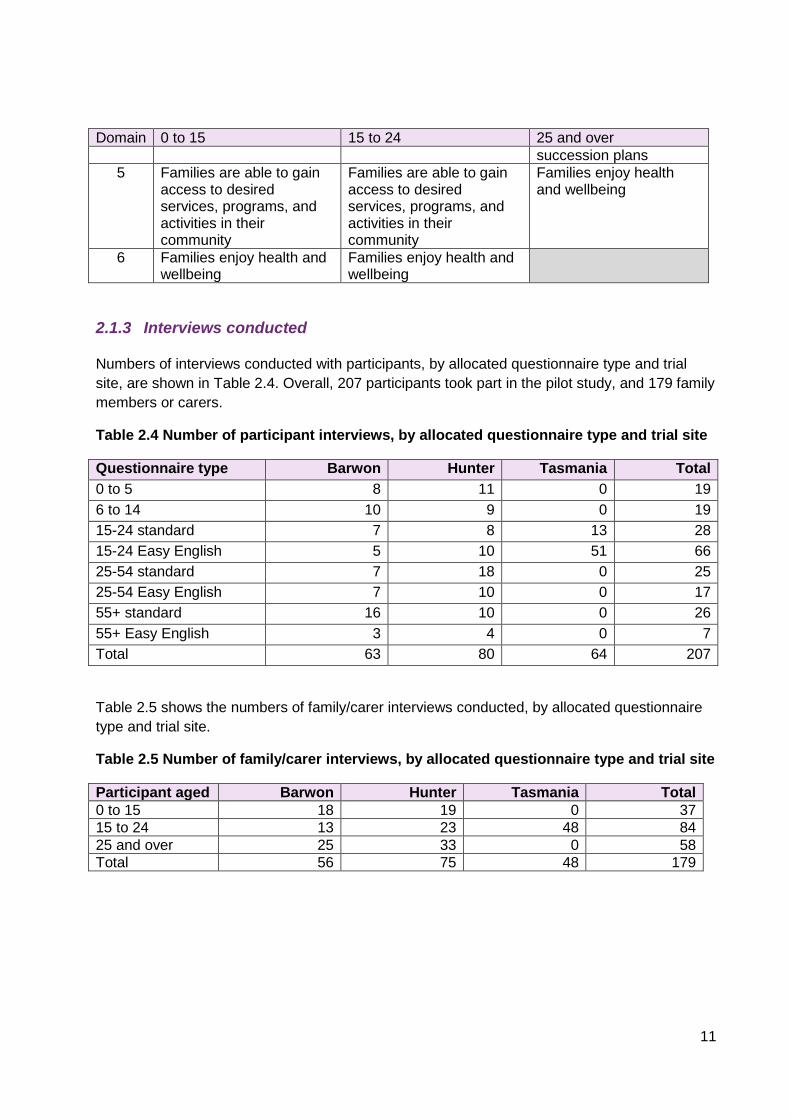
2.1.3 Interviews conducted
Numbers of interviews conducted with participants, by allocated questionnaire type and trial site, are shown in Table 2.4. Overall, 207 participants took part in the pilot study, and 179 family members or carers.
Table 2.4 Number of participant interviews, by allocated questionnaire type and trial site
Questionnaire type Barwon Hunter Tasmania Total 0 to 5 8 11 0 19 6 to 14 10 9 0 19 15-24 standard 7 8 13 28 15-24 Easy English 5 10 51 66 25-54 standard 7 18 0 25 25-54 Easy English 7 10 0 17 55+ standard 16 10 0 26 55+ Easy English 3 4 0 7 Total 63 80 64 207
Table 2.5 shows the numbers of family/carer interviews conducted, by allocated questionnaire type and trial site.
Table 2.5 Number of family/carer interviews, by allocated questionnaire type and trial site
Participant aged Barwon Hunter Tasmania Total 0 to 15 18 19 0 37 15 to 24 13 23 48 84 25 and over 25 33 0 58 Total 56 75 48 179
12
2.2 Results
2.2.1 Participants from birth to school age
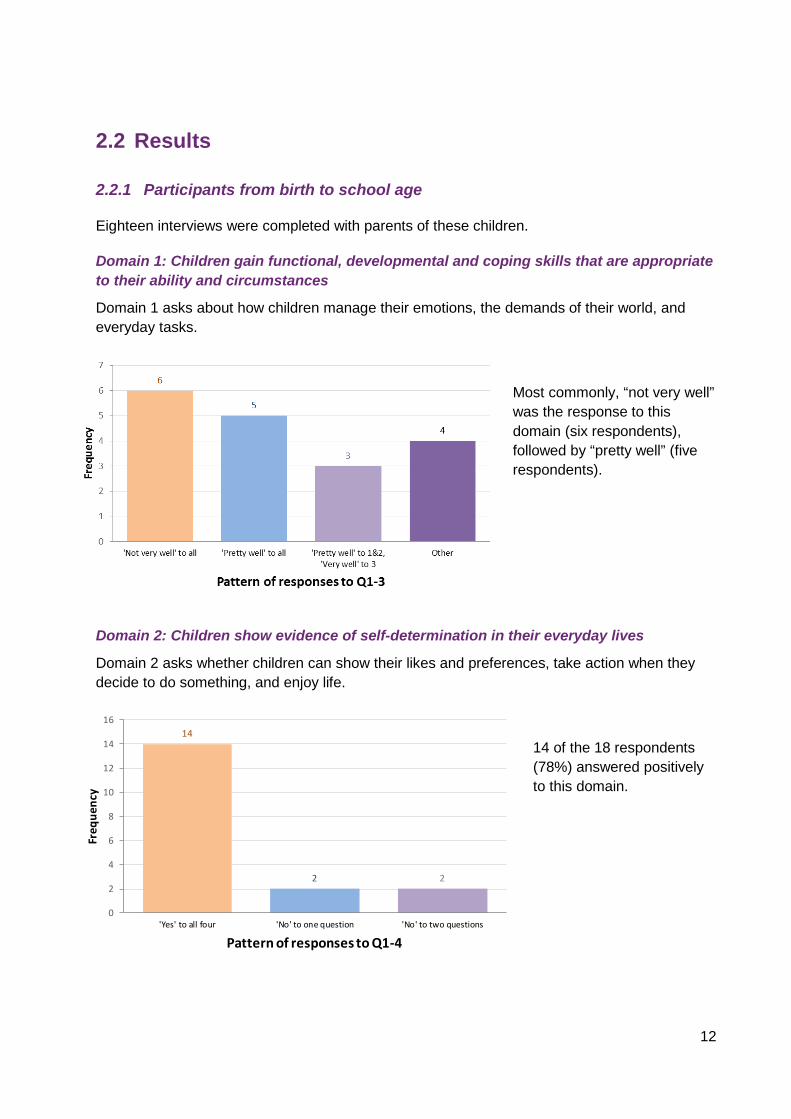
Eighteen interviews were completed with parents of these children.
Domain 1: Children gain functional, developmental and coping skills that are appropriate to their ability and circumstances
Domain 1 asks about how children manage their emotions, the demands of their world, and everyday tasks.
Most commonly, “not very well” was the response to this domain (six respondents), followed by “pretty well” (five respondents).
Domain 2: Children show evidence of self-determination in their everyday lives
Domain 2 asks whether children can show their likes and preferences, take action when they decide to do something, and enjoy life.
14 of the 18 respondents (78%) answered positively to this domain.
14
2 2
0
2
4
6
8
10
12
14
16
'Yes' to all four 'No' to one question 'No' to two questions
Freq
uenc
y
Pattern of responses to Q1-4

13
Domain 3: Children participate meaningfully in family life
Domain 3 asks eight questions about relationships within and outside of the family, inclusion and integration within the family, time constraints, and effect on siblings.
Six respondents answered positively across all aspects of this domain, and five responded positively to all except one.
Domain 4: Children participate meaningfully in community life
An overall score for Domain 4 measures how much difficulty parents had in finding child care, how they rated their experience of child care, and their child’s involvement with friends and activities. The scale is 0 to 100, with 0 being most positive and 100 being least positive.
Of the 13 parents who answered all questions contributing to the score, eight had scores in the range 4.3 to 30.4, and the other five had scores in the range 52.2 to 82.6.
6
5
2
5
0
1
2
3
4
5
6
7
Positive to all eight Negative to one Q Negative to two Qs Negative to three ormore Qs
Freq
uenc
y
Pattern of responses to Q1-8
0
20
40
60
80
100
1 2 3 4 5 6 7 8 9 10 11 12 13
Scor
e
Rank
Domain 4 scores
most positive
least positive
14
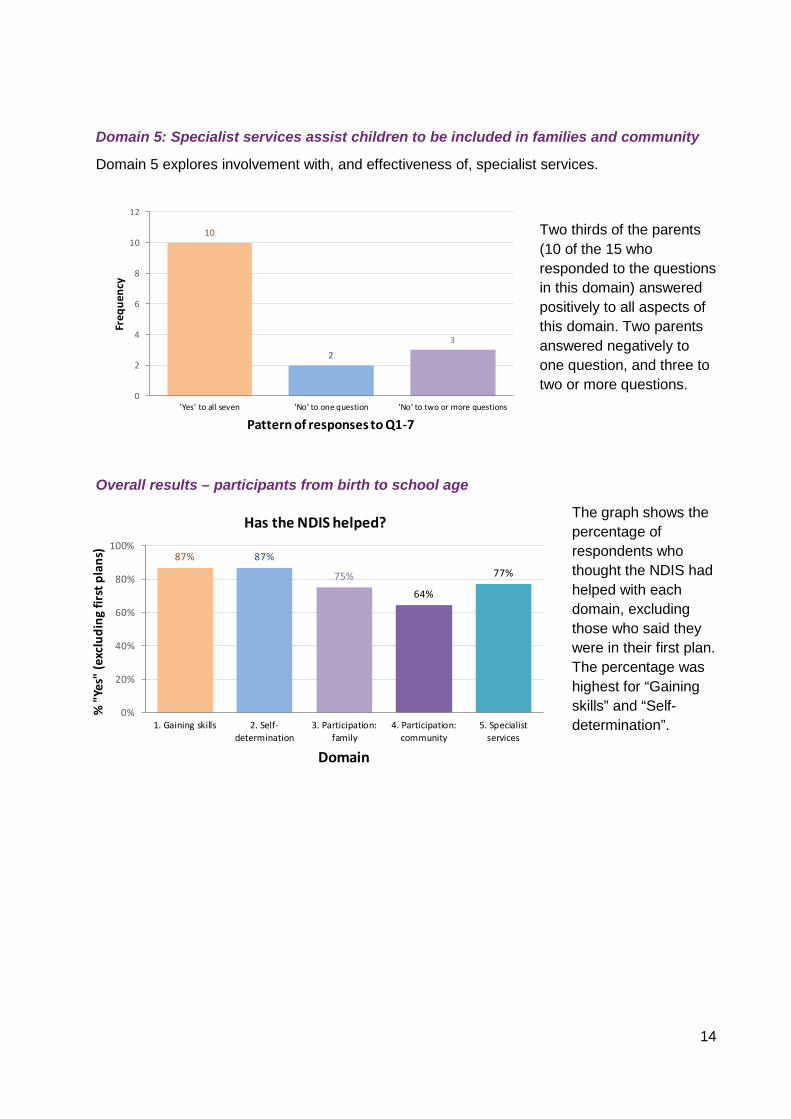
Domain 5: Specialist services assist children to be included in families and community
Domain 5 explores involvement with, and effectiveness of, specialist services.
Two thirds of the parents (10 of the 15 who responded to the questions in this domain) answered positively to all aspects of this domain. Two parents answered negatively to one question, and three to two or more questions.
Overall results – participants from birth to school age
The graph shows the percentage of respondents who thought the NDIS had helped with each domain, excluding those who said they were in their first plan. The percentage was highest for “Gaining skills” and “Self-determination”.
10
23
0
2
4
6
8
10
12
'Yes' to all seven 'No' to one question 'No' to two or more questions
Freq
uenc
y
Pattern of responses to Q1-7
87% 87%
75%
64%
77%
0%
20%
40%
60%
80%
100%
1. Gaining skills 2. Self-determination
3. Participation:family
4. Participation:community
5. Specialistservices
% "Y
es"
(exc
ludi
ng fi
rst p
lans
)
Domain
Has the NDIS helped?
15
2.2.2 Participants from school age to 15
Twenty-two interviews were completed with parents of these children.
Domain 1: Children grow in independence
Domain 1 asks about age-appropriate development of skills, growth towards independence, spending time apart from family, and having a say.
On a scale from 0 to 100, with 0 being most positive and 100 being least positive, half had scores below 40.
Domain 2: Children are welcomed and educated in their local school
This domain asks about choosing a school, and the child’s educational goals and experiences at school.
Overall, 69% of parents were satisfied that their child’s school listens to them in relation to their child’s education (although none of them were very satisfied).
Parents who thought their child was happy at school were more likely to express satisfaction, the percentages being 100% for those who thought their child was almost always happy at school, 67% for those who thought their child was usually happy, and 25% for those who thought their child was sometimes happy.
69%
100%
67%
25%
0%
10%
20%
30%
40%
50%
60%
70%
80%
90%
100%
Overall Almost always Usually Sometimes
How often child is happy at school
% satisfied that their child's school listens to them
16
Domain 3: Children form friendships with peers and have positive relationships with their family
Domain 3 asks about relationships within and outside of the family, inclusion and integration within the family, time constraints, effect on siblings, child care and friends.
Eleven of the 17 families who have other children (65%) were very worried or a little worried about the effect on them of having a sibling with disability.
Parents used between 0 and 5 different forms of childcare when they had to go out, most commonly extended family (used by 55% of families). Four families used NDIS individualised support.
18%
55%
32%
18%9%
18%9%
0%
20%
40%
60%
80%
100%
Siblings Extended family Friends He/she is able tostay alone
Privately recruitedbabysitter
NDIS individualisedsupport
Respite centre
When you need to go out, which of the following options do you use to look after your child?
12 of the 22 families used extended family, and 7 used friends.
24%
41%35%
0%
20%
40%
60%
80%
100%
I am very worried I am a little worried I am not worried
I am worried about the effect of having a sibling with disability on my other children now and in the future
11 of the 17 families with other children (65%) were worried to some extent.
17
Six of the 21 families who used childcare were not happy with the arrangement.
Three of the 21 parents who responded said their child did not have friends they enjoyed spending time with. Friends were most commonly at school (15 of the 18 children with friends, or 83%), but 10 (56%) had friends outside school and one (6%) online.
Domain 4: Children participate in local social and recreational activities
Overall, 59% of parents (13 out of 22) said it was easy to find vacation care that welcomed their child.
86%
14%
0%
20%
40%
60%
80%
100%
Yes No
My child has friends that he/she enjoys spending time with
18 of the 21 parents who responded (86%) said their child had friends they enjoyed spending time with.
83%
56%
6%
0%
20%
40%
60%
80%
100%
At school Outside school On line
The friends are
15 children had friends at school and 10 had friends outside school.
59%
9%18% 14%
0%
20%
40%
60%
80%
100%
Easy Not that easy Difficult Impossible
Finding vacation care that welcomes my child is
13 of the 22 parents said it was easy to find welcoming vacation care, but 7 said it was difficult or impossible.
71%
29%
0%
20%
40%
60%
80%
100%
Yes No
Are you happy with that arrangement?
15 of the 21 parents who responded were happy with the arrangement.
18
Seventeen of the 22 parents (77%) said they would like more opportunity for their child to be involved in activities with other children. Further, 76% of families said their child’s disability was a barrier.
Many of the families cited multiple barriers to involvement. For example, five said that their child’s disability, other children not being welcoming, and other families not being welcoming were all barriers. Two of these five families said that transport and cost were also barriers.
Overall results – participants from school age to 15
The graph shows the percentage of respondents who thought the NDIS had helped with each domain, excluding those who said they were in their first plan. The percentage was highest for Domain 1: Independence (83% thought the NDIS had helped).
76%
35%29%
24%18%
35%41%
0%
20%
40%
60%
80%
100%
My child’s disability
Children notwelcoming
Families notwelcoming
Too busy Transport Cost Other
The barriers to my child being more involved with other children are:
13 of the parents said their child's disability was a barrier, 6 said that other children were not welcoming, and 6 said cost was a barrier.
83%
50%
74%67%
0%
20%
40%
60%
80%
100%
1. Independence 2. School 3. Friends and family 4. Social participation
% "Y
es"
(exc
ludi
ng fi
rst p
lans
)
Domain
Has the NDIS helped?
19
2.2.3 Participants aged 15 to 24
Ninety-two interviews were completed with participants from this age group: 68 using the standard version and 24 using the Easy English version.
Domain 1: Choice and control
Specific to this young adult age group, Domain 1 explores whether participants are starting to have more independence and make more decisions in their lives. In common with the other adult questionnaires, it also asks about exercising choice, about decision making, and whether the participant would like to have more choice and control in their life.
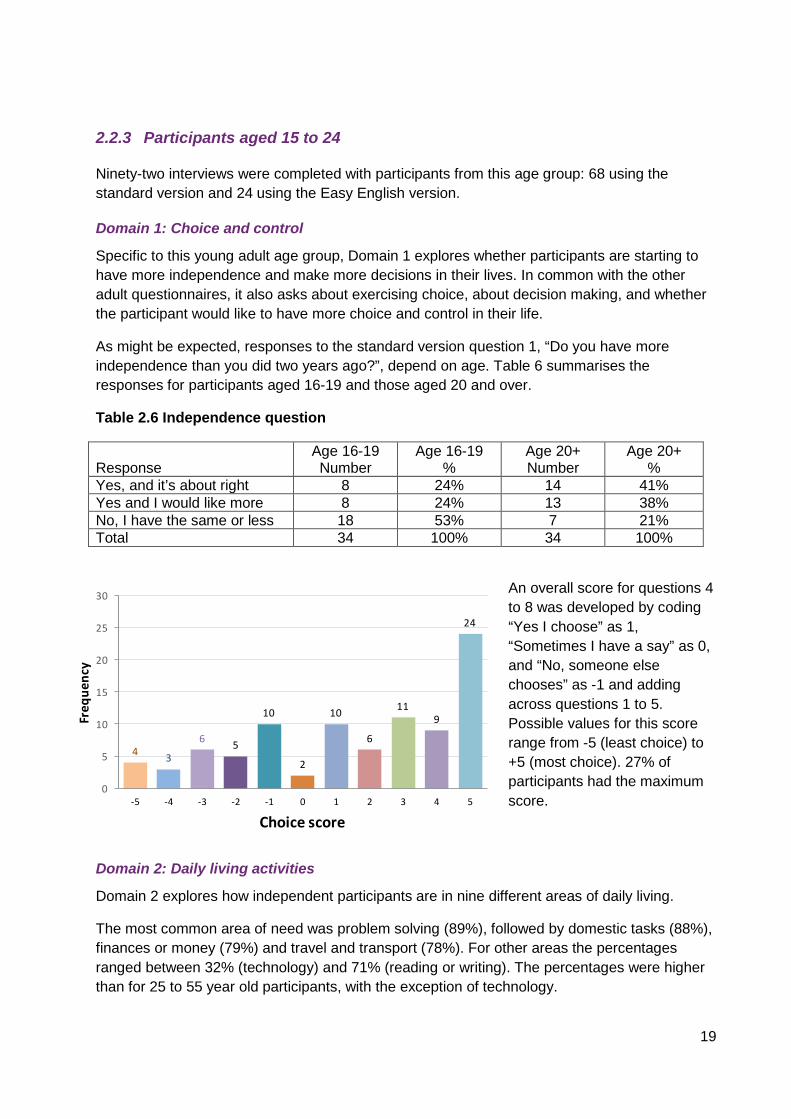
As might be expected, responses to the standard version question 1, “Do you have more independence than you did two years ago?”, depend on age. Table 6 summarises the responses for participants aged 16-19 and those aged 20 and over.
Table 2.6 Independence question
Response
Age 16-19 Number
Age 16-19 %
Age 20+ Number
Age 20+ %
Yes, and it’s about right 8 24% 14 41% Yes and I would like more 8 24% 13 38% No, I have the same or less 18 53% 7 21% Total 34 100% 34 100%
An overall score for questions 4 to 8 was developed by coding “Yes I choose” as 1, “Sometimes I have a say” as 0, and “No, someone else chooses” as -1 and adding across questions 1 to 5. Possible values for this score range from -5 (least choice) to +5 (most choice). 27% of participants had the maximum score.
Domain 2: Daily living activities
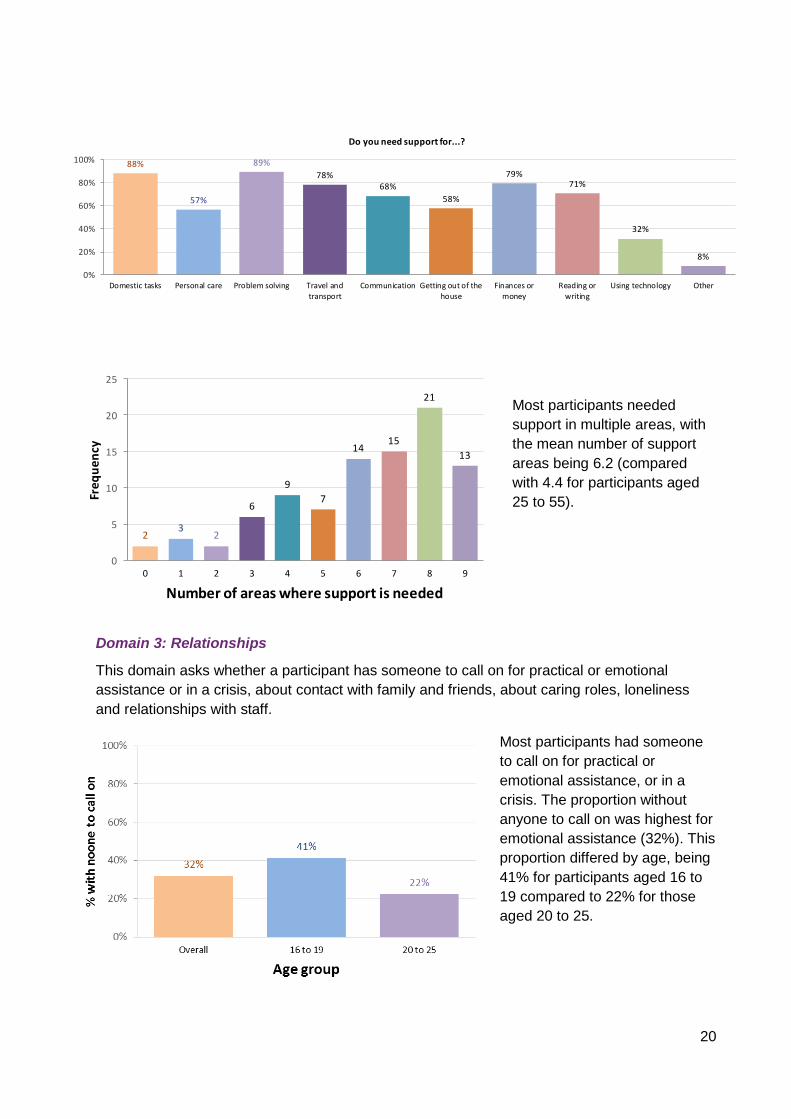
Domain 2 explores how independent participants are in nine different areas of daily living.
The most common area of need was problem solving (89%), followed by domestic tasks (88%), finances or money (79%) and travel and transport (78%). For other areas the percentages ranged between 32% (technology) and 71% (reading or writing). The percentages were higher than for 25 to 55 year old participants, with the exception of technology.
4 3
6 5
10
2
10
6
119
24
0
5
10
15
20
25
30
-5 -4 -3 -2 -1 0 1 2 3 4 5
Freq
uenc
y
Choice score
20
Most participants needed support in multiple areas, with the mean number of support areas being 6.2 (compared with 4.4 for participants aged 25 to 55).
Domain 3: Relationships
This domain asks whether a participant has someone to call on for practical or emotional assistance or in a crisis, about contact with family and friends, about caring roles, loneliness and relationships with staff.
Most participants had someone to call on for practical or emotional assistance, or in a crisis. The proportion without anyone to call on was highest for emotional assistance (32%). This proportion differed by age, being 41% for participants aged 16 to 19 compared to 22% for those aged 20 to 25.
88%
57%
89%78%
68%58%
79%71%
32%
8%
0%
20%
40%
60%
80%
100%
Domestic tasks Personal care Problem solving Travel andtransport
Communication Getting out of thehouse
Finances ormoney
Reading orwriting
Using technology Other
Do you need support for...?
23
2
6
97
1415
21
13
0
5
10
15
20
25
0 1 2 3 4 5 6 7 8 9
Freq
uenc
y
Number of areas where support is needed
21
0%
20%
40%
60%
80%
100%
1-3 4-6 7-8 9-10
% w
ith n
oone
to ca
ll on
Decile of IRSD
n=25 n=24 n=11n=31
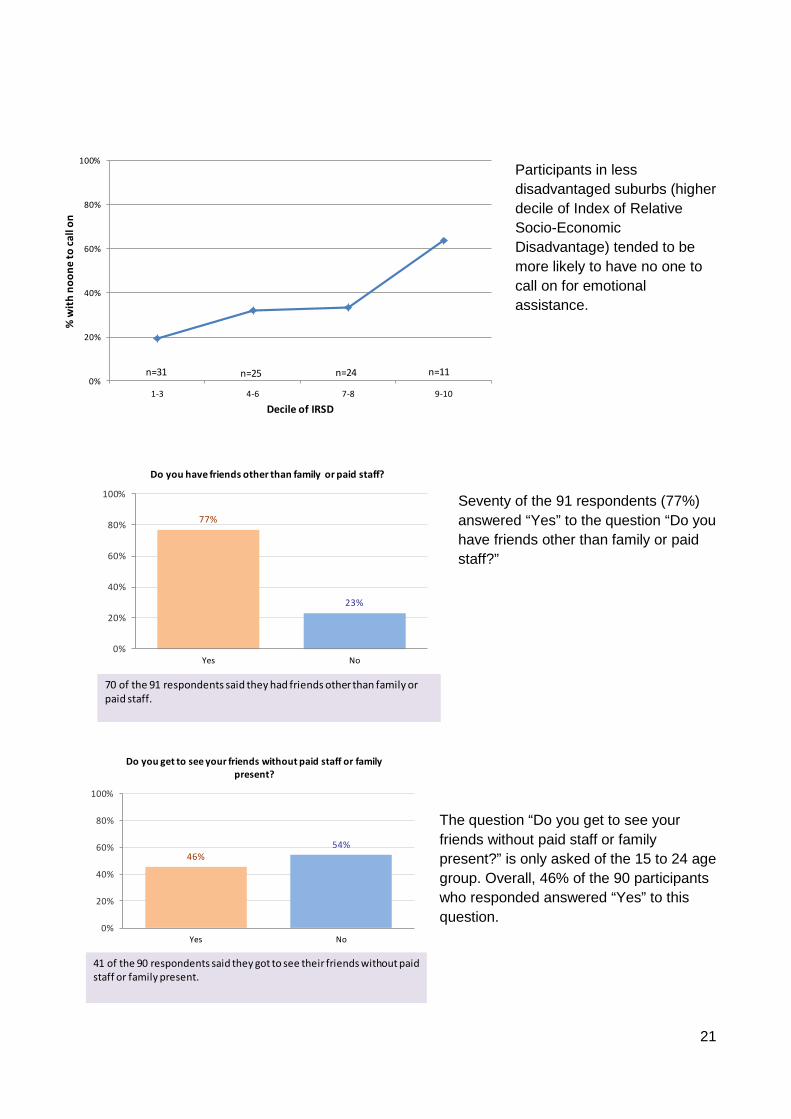
Participants in less disadvantaged suburbs (higher decile of Index of Relative Socio-Economic Disadvantage) tended to be more likely to have no one to call on for emotional assistance.
Seventy of the 91 respondents (77%) answered “Yes” to the question “Do you have friends other than family or paid staff?”
The question “Do you get to see your friends without paid staff or family present?” is only asked of the 15 to 24 age group. Overall, 46% of the 90 participants who responded answered “Yes” to this question.
46%54%
0%
20%
40%
60%
80%
100%
Yes No
Do you get to see your friends without paid staff or family present?
41 of the 90 respondents said they got to see their friends without paid staff or family present.
77%
23%
0%
20%
40%
60%
80%
100%
Yes No
Do you have friends other than family or paid staff?
70 of the 91 respondents said they had friends other than family or paid staff.

22
Domain 4: Home
This domain asks about participants’ satisfaction with their home, now and in five years’ time, and whether they feel safe. Specific to the young adult cohort, it also asks about the participant’s involvement in planning for a home of their own.
91% of participants (84) were happy with their home, similar to 93% for the 25 to 55 age group.
However, the proportion who thought it would be suitable in 5 years’ time was much lower, being 60% for this young adult group compared to 86% for the 25 to 55 group. This reflects the young adult age group’s desire to move out of home, with 22% saying their home wouldn’t be suitable in 5 years’ time because they wanted to choose their own home.
Domain 5: Health and wellbeing
Domain 5 asks a series of health and lifestyle-related questions, as well as questions about accessing health services.
91%
9%
0%
20%
40%
60%
80%
100%
Yes No
Are you satisfied with the home you live in?
84 of the participants said they were satisfied with their home.
60%
22%10% 7%
0%
20%
40%
60%
80%
100%
Yes No, I want tochoose my home
No, because offactors related tomy support needs
No, other
Will where you live be good for you in 5 years’ time?
40 of the 67 respondents thought their home would be good for them in 5 years' time. Of the other 27, 15 said they wanted to choose their home and 10 cited factors related to their support needs. (This question was not asked in the Easy English version).
23
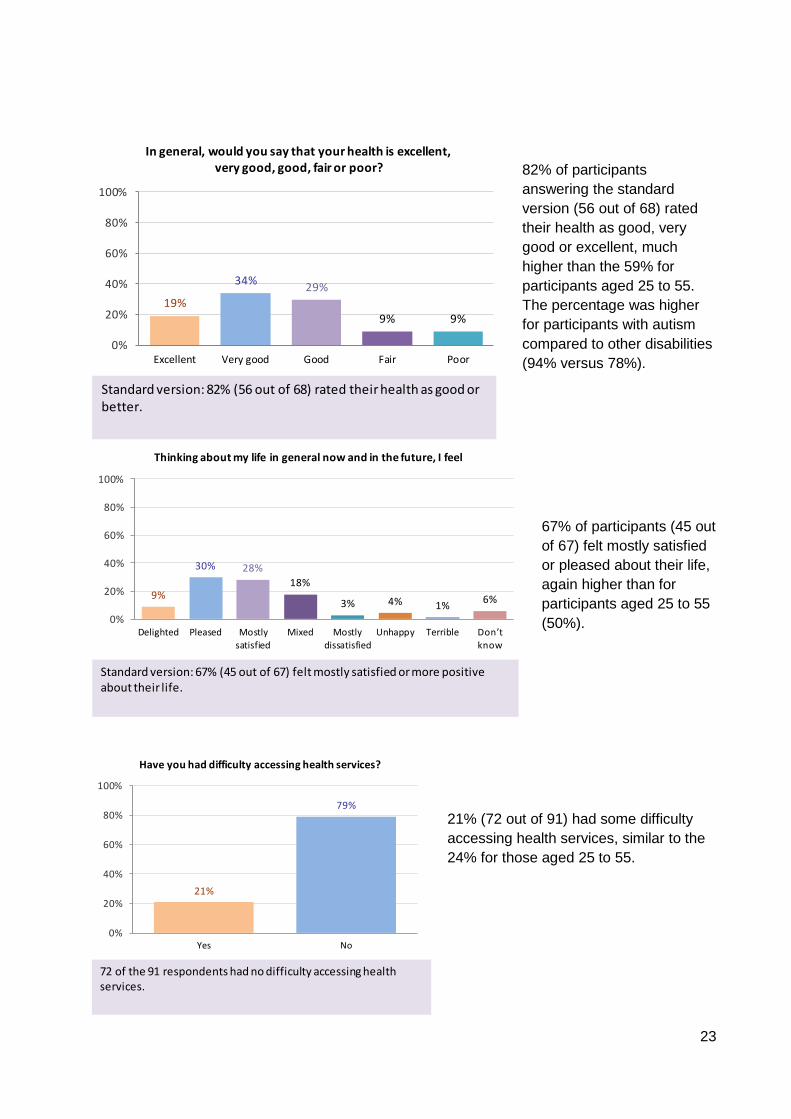
82% of participants answering the standard version (56 out of 68) rated their health as good, very good or excellent, much higher than the 59% for participants aged 25 to 55. The percentage was higher for participants with autism compared to other disabilities (94% versus 78%).
67% of participants (45 out of 67) felt mostly satisfied or pleased about their life, again higher than for participants aged 25 to 55 (50%).
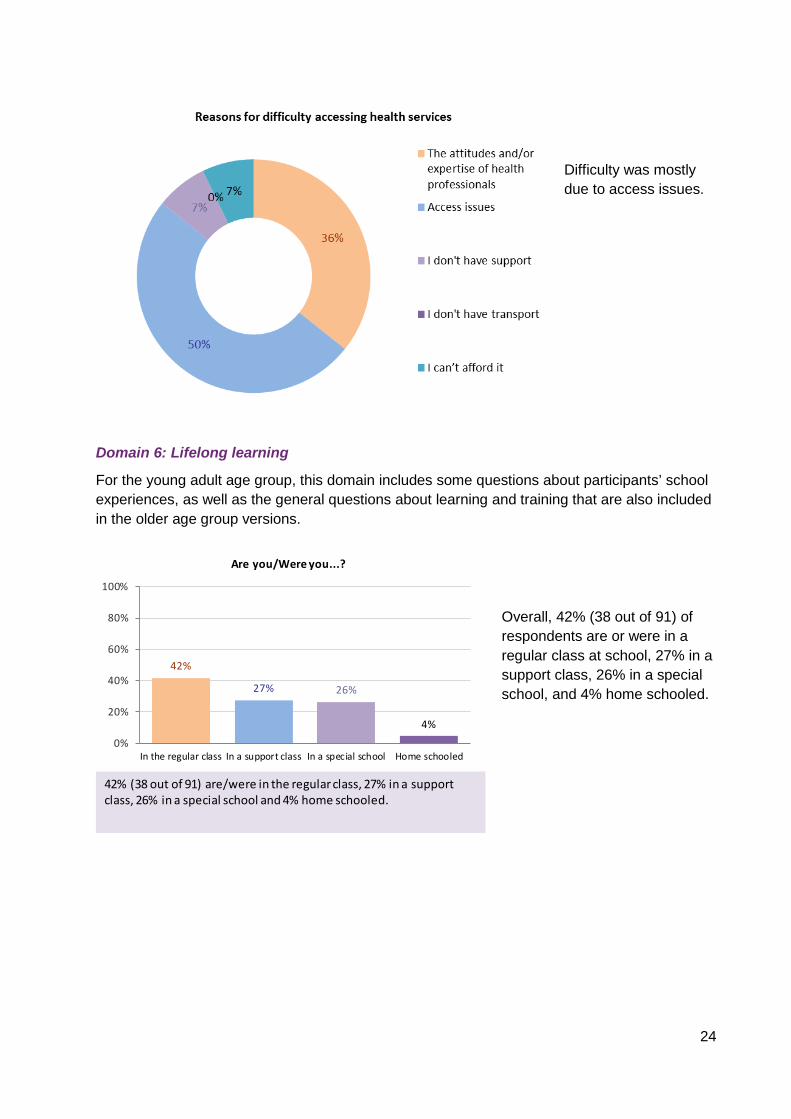
21% (72 out of 91) had some difficulty accessing health services, similar to the 24% for those aged 25 to 55.
19%
34% 29%
9% 9%
0%
20%
40%
60%
80%
100%
Excellent Very good Good Fair Poor
In general, would you say that your health is excellent, very good, good, fair or poor?
Standard version: 82% (56 out of 68) rated their health as good or better.
9%
30% 28%18%
3% 4% 1% 6%
0%
20%
40%
60%
80%
100%
Delighted Pleased Mostlysatisfied
Mixed Mostlydissatisfied
Unhappy Terrible Don’t know
Thinking about my life in general now and in the future, I feel
Standard version: 67% (45 out of 67) felt mostly satisfied or more positive about their life.
21%
79%
0%
20%
40%
60%
80%
100%
Yes No
Have you had difficulty accessing health services?
72 of the 91 respondents had no difficulty accessing health services.
24
Difficulty was mostly due to access issues.
Domain 6: Lifelong learning
For the young adult age group, this domain includes some questions about participants’ school experiences, as well as the general questions about learning and training that are also included in the older age group versions.
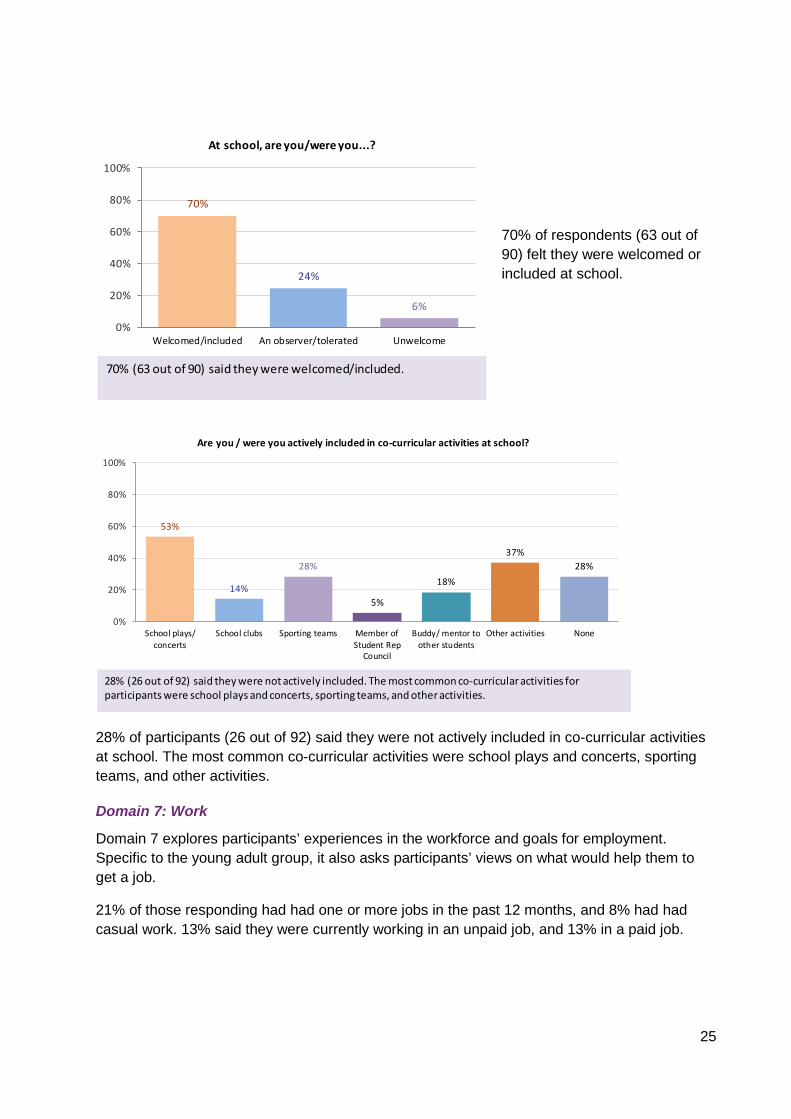
Overall, 42% (38 out of 91) of respondents are or were in a regular class at school, 27% in a support class, 26% in a special school, and 4% home schooled.
42%
27% 26%
4%
0%
20%
40%
60%
80%
100%
In the regular class In a support class In a special school Home schooled
Are you/Were you...?
42% (38 out of 91) are/were in the regular class, 27% in a support class, 26% in a special school and 4% home schooled.
25
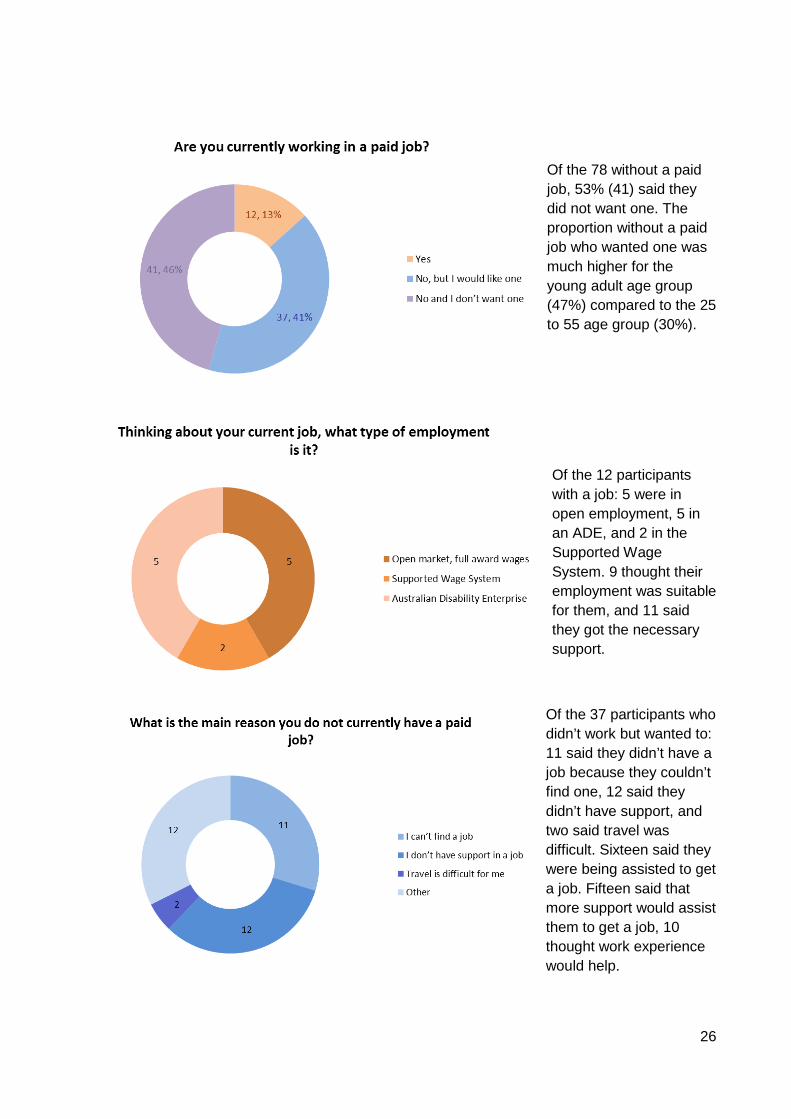
70% of respondents (63 out of 90) felt they were welcomed or included at school.
28% of participants (26 out of 92) said they were not actively included in co-curricular activities at school. The most common co-curricular activities were school plays and concerts, sporting teams, and other activities.
Domain 7: Work
Domain 7 explores participants’ experiences in the workforce and goals for employment. Specific to the young adult group, it also asks participants’ views on what would help them to get a job.
21% of those responding had had one or more jobs in the past 12 months, and 8% had had casual work. 13% said they were currently working in an unpaid job, and 13% in a paid job.
53%
14%
28%
5%
18%
37%28%
0%
20%
40%
60%
80%
100%
School plays/concerts
School clubs Sporting teams Member ofStudent Rep
Council
Buddy/ mentor toother students
Other activities None
Are you / were you actively included in co-curricular activities at school?
28% (26 out of 92) said they were not actively included. The most common co-curricular activities for participants were school plays and concerts, sporting teams, and other activities.
70%
24%
6%
0%
20%
40%
60%
80%
100%
Welcomed/included An observer/tolerated Unwelcome
At school, are you/were you...?
70% (63 out of 90) said they were welcomed/included.
26
Of the 78 without a paid job, 53% (41) said they did not want one. The proportion without a paid job who wanted one was much higher for the young adult age group (47%) compared to the 25 to 55 age group (30%).
Of the 12 participants with a job: 5 were in open employment, 5 in an ADE, and 2 in the Supported Wage System. 9 thought their employment was suitable for them, and 11 said they got the necessary support.
Of the 37 participants who didn’t work but wanted to: 11 said they didn’t have a job because they couldn’t find one, 12 said they didn’t have support, and two said travel was difficult. Sixteen said they were being assisted to get a job. Fifteen said that more support would assist them to get a job, 10 thought work experience would help.
27
Domain 8: Social, community and civic participation
Domain 8 asks about hobbies, volunteering, involvement in community groups, feelings of safety, voting, leisure activities, and whether the participant feels they are able to have a say.
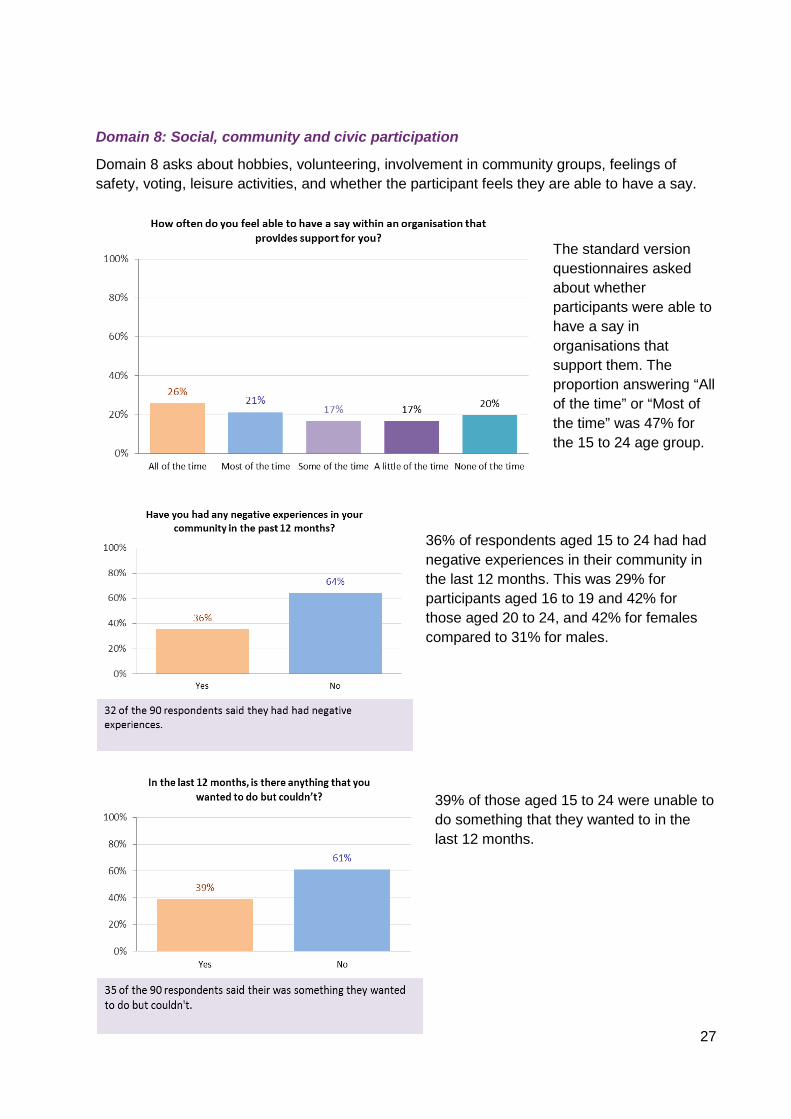
The standard version questionnaires asked about whether participants were able to have a say in organisations that support them. The proportion answering “All of the time” or “Most of the time” was 47% for the 15 to 24 age group.
36% of respondents aged 15 to 24 had had negative experiences in their community in the last 12 months. This was 29% for participants aged 16 to 19 and 42% for those aged 20 to 24, and 42% for females compared to 31% for males.
39% of those aged 15 to 24 were unable to do something that they wanted to in the last 12 months.
28
Overall results – participants aged 15 to 24
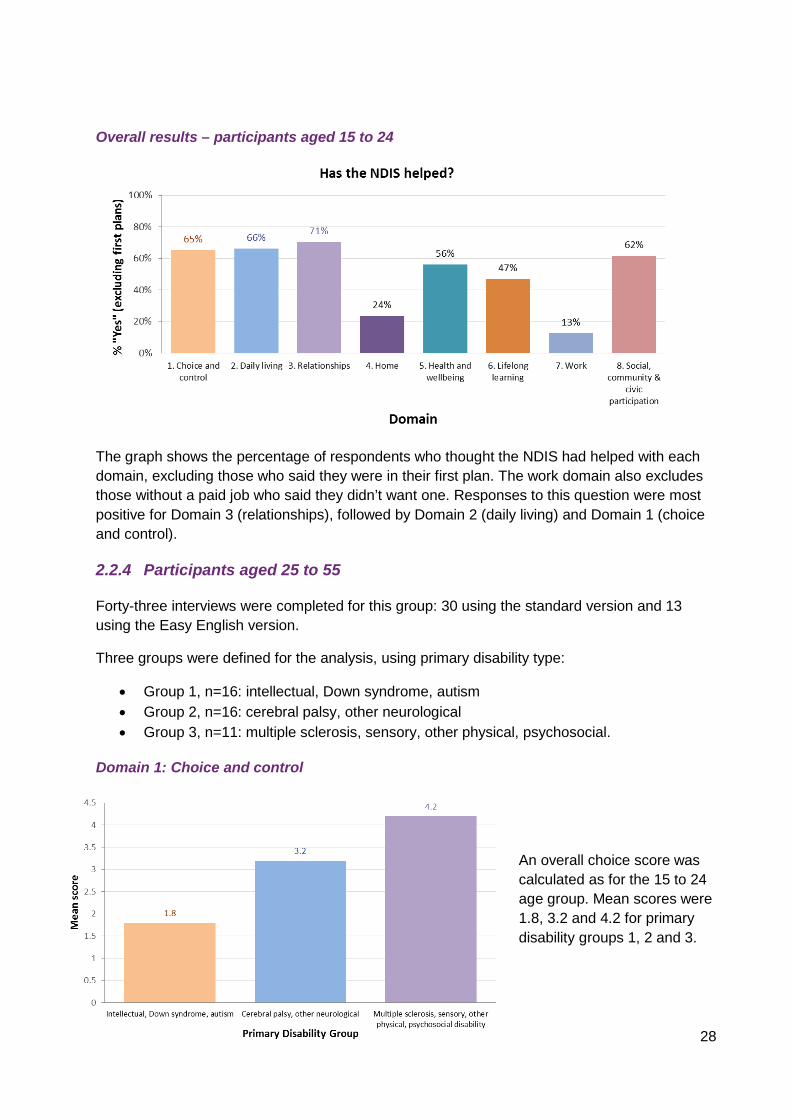
The graph shows the percentage of respondents who thought the NDIS had helped with each domain, excluding those who said they were in their first plan. The work domain also excludes those without a paid job who said they didn’t want one. Responses to this question were most positive for Domain 3 (relationships), followed by Domain 2 (daily living) and Domain 1 (choice and control).
2.2.4 Participants aged 25 to 55
Forty-three interviews were completed for this group: 30 using the standard version and 13 using the Easy English version.
Three groups were defined for the analysis, using primary disability type:
• Group 1, n=16: intellectual, Down syndrome, autism • Group 2, n=16: cerebral palsy, other neurological • Group 3, n=11: multiple sclerosis, sensory, other physical, psychosocial.
Domain 1: Choice and control
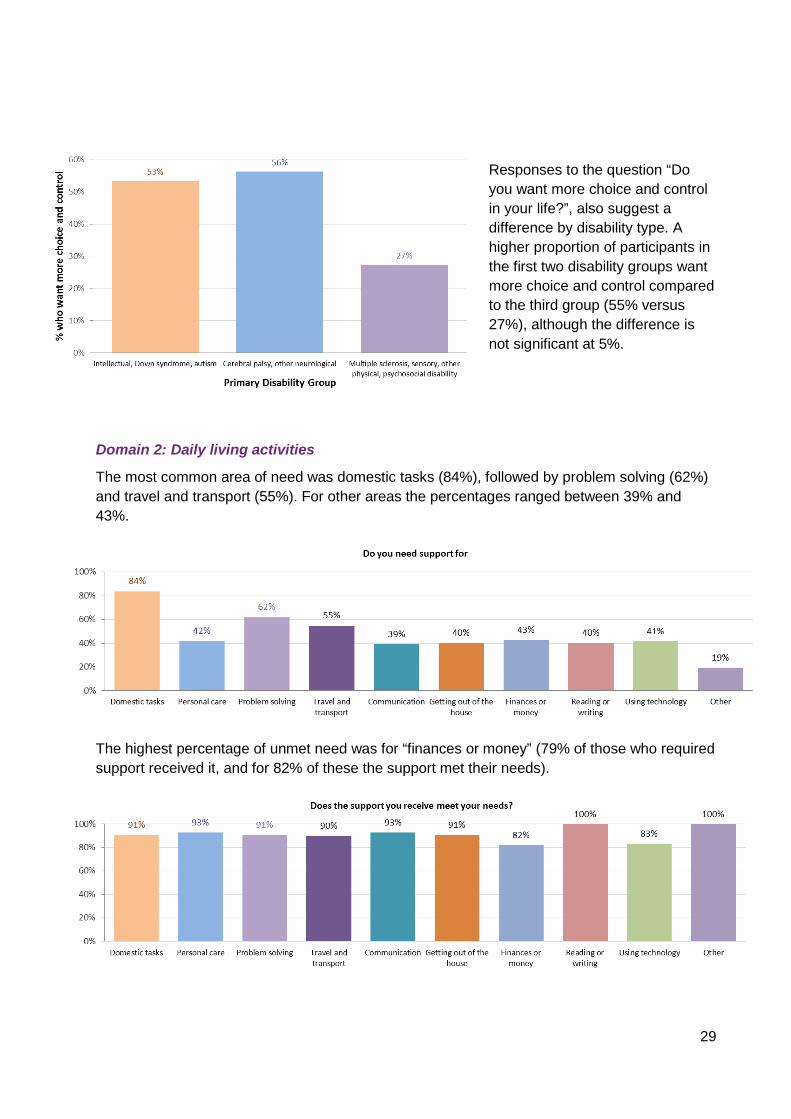
An overall choice score was calculated as for the 15 to 24 age group. Mean scores were 1.8, 3.2 and 4.2 for primary disability groups 1, 2 and 3.
29
Responses to the question “Do you want more choice and control in your life?”, also suggest a difference by disability type. A higher proportion of participants in the first two disability groups want more choice and control compared to the third group (55% versus 27%), although the difference is not significant at 5%.
Domain 2: Daily living activities
The most common area of need was domestic tasks (84%), followed by problem solving (62%) and travel and transport (55%). For other areas the percentages ranged between 39% and 43%.
The highest percentage of unmet need was for “finances or money” (79% of those who required support received it, and for 82% of these the support met their needs).
30
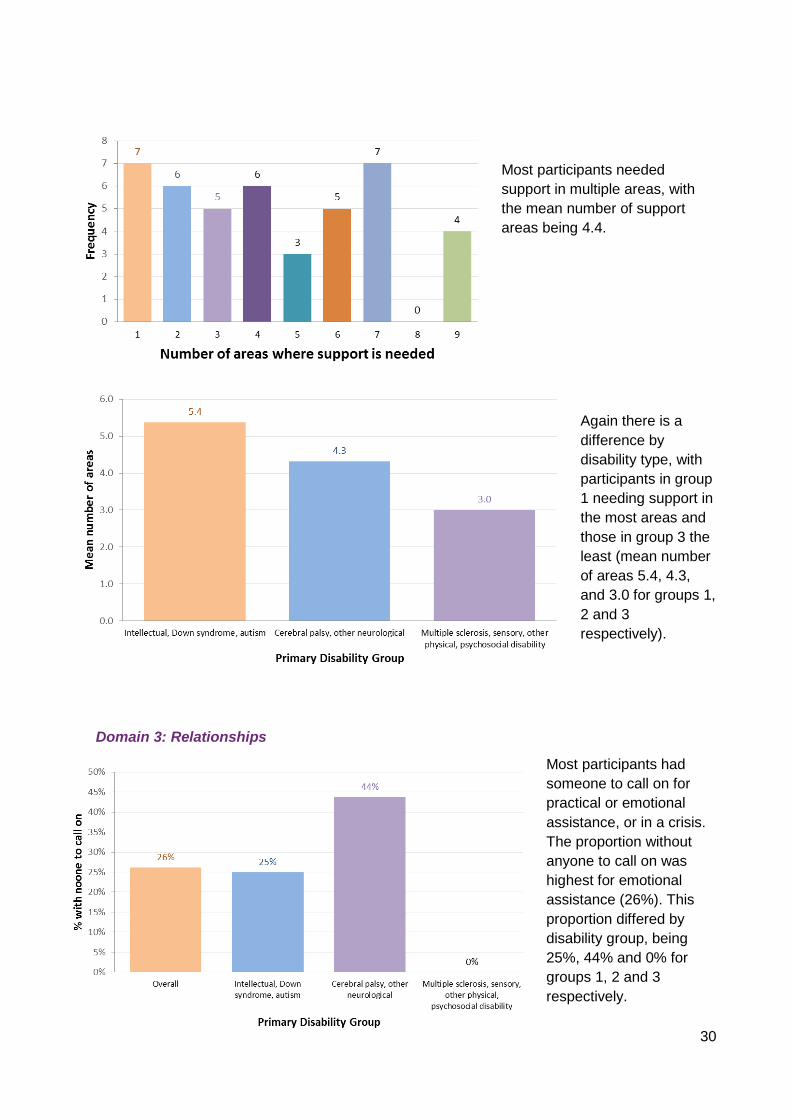
Most participants needed support in multiple areas, with the mean number of support areas being 4.4.
Again there is a difference by disability type, with participants in group 1 needing support in the most areas and those in group 3 the least (mean number of areas 5.4, 4.3, and 3.0 for groups 1, 2 and 3 respectively).
Domain 3: Relationships
Most participants had someone to call on for practical or emotional assistance, or in a crisis. The proportion without anyone to call on was highest for emotional assistance (26%). This proportion differed by disability group, being 25%, 44% and 0% for groups 1, 2 and 3 respectively.
31
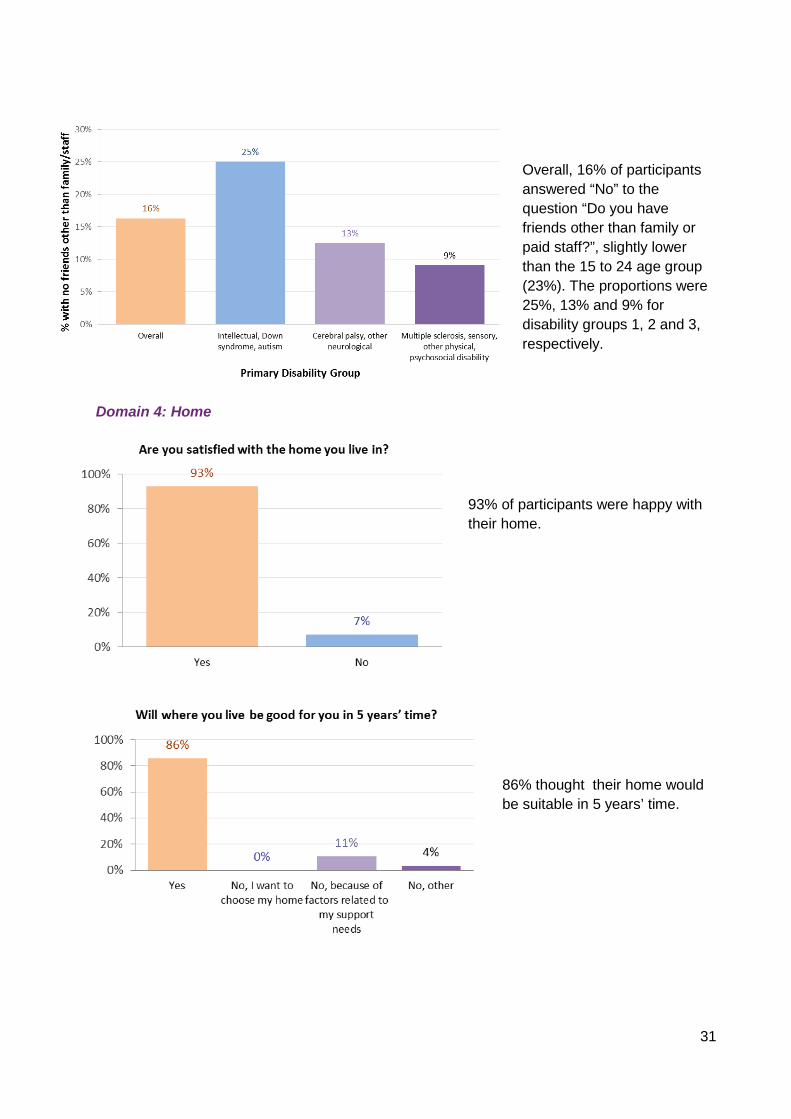
Overall, 16% of participants answered “No” to the question “Do you have friends other than family or paid staff?”, slightly lower than the 15 to 24 age group (23%). The proportions were 25%, 13% and 9% for disability groups 1, 2 and 3, respectively.
Domain 4: Home
93% of participants were happy with their home.
86% thought their home would be suitable in 5 years’ time.
32
Domain 5: Health and wellbeing
59% of participants answering the standard version rated their health as good, very good or excellent. By disability group, this percentage was 83%, 50% and 55% for groups 1, 2 and 3 respectively.
50% of participants felt mostly satisfied or pleased about their life. This was 67%, 42% and 50% for disability groups 1, 2 and 3 respectively.
25% had some difficulty accessing health services. This was 17%, 33% and 20% for disability groups 1, 2 and 3 respectively. Difficulty was mostly due to access issues.
33
Domain 6: Lifelong learning
12% of respondents (34 out of 42) said they did not get the opportunity to learn new things but would like to. Four of these five participants were from disability group 3.
Domain 7: Work
35% of respondents had a paid job (27%, 33% and 50% in disability groups 1, 2 and 3 respectively).
Fourteen of the 40 respondents said they had a paid job. Of the 26 participants without a paid job, 70% didn’t want one and 30% (6 participants, 2 in each of the three disability groups) wanted one.
34
Domain 8: Social, community and civic participation
54% of respondents were unable to do something they wanted to do in the last 12 months (31%, 73% and 60% in disability groups 1, 2 and 3 respectively).
32% of respondents had had negative experiences in their community in the last year (31%, 40% and 20% in disability groups 1, 2 and 3 respectively).
35
Overall results – participants aged 25 to 55
The graph shows the percentage of respondents who thought the NDIS had helped with each domain, excluding those who said they were in their first plan. The work domain also excludes those without a paid job who said they didn’t want one. Responses to this question were most positive for Domain 1 (choice and control), where 76% thought the NDIS had helped, followed by Domain 2 (daily living) and Domain 5 (health and wellbeing).
2.2.5 Participants aged over 55
Thirty-two interviews were completed for this group: 27 using the standard version and five using the Easy English version.
Five groups were defined for the analysis, using primary disability type:
• Group 1, n=7: intellectual, Down syndrome • Group 2, n=12: cerebral palsy, other neurological • Group 3, n=5: multiple sclerosis • Group 4, n=4: psychosocial disability • Group 5, n=4: sensory, other physical.
36
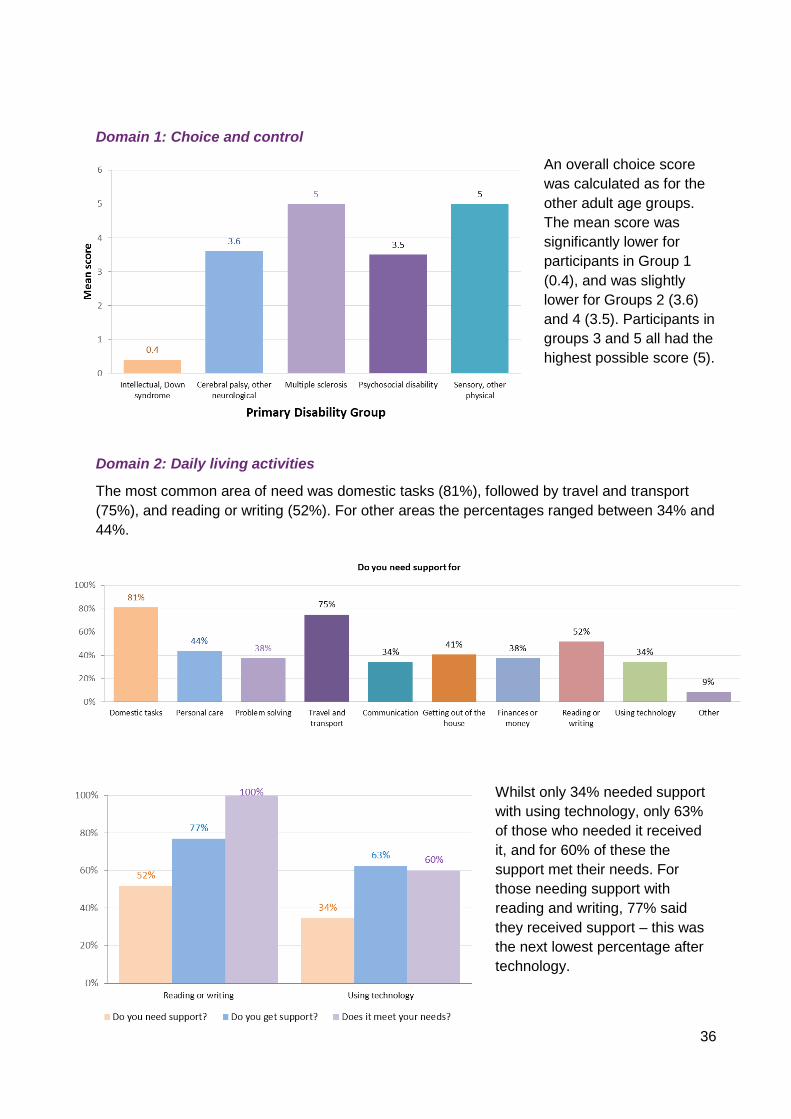
Domain 1: Choice and control
An overall choice score was calculated as for the other adult age groups. The mean score was significantly lower for participants in Group 1 (0.4), and was slightly lower for Groups 2 (3.6) and 4 (3.5). Participants in groups 3 and 5 all had the highest possible score (5).
Domain 2: Daily living activities
The most common area of need was domestic tasks (81%), followed by travel and transport (75%), and reading or writing (52%). For other areas the percentages ranged between 34% and 44%.
Whilst only 34% needed support with using technology, only 63% of those who needed it received it, and for 60% of these the support met their needs. For those needing support with reading and writing, 77% said they received support – this was the next lowest percentage after technology.
37
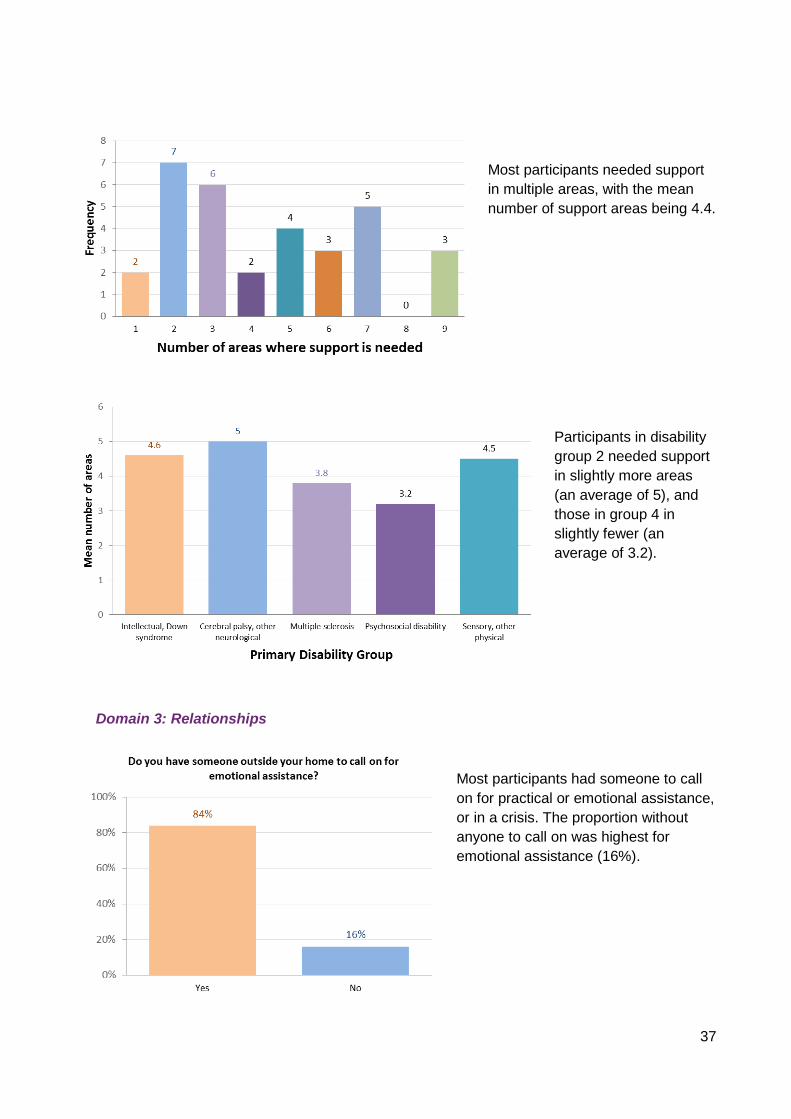
Most participants needed support in multiple areas, with the mean number of support areas being 4.4.
Participants in disability group 2 needed support in slightly more areas (an average of 5), and those in group 4 in slightly fewer (an average of 3.2).
Domain 3: Relationships
Most participants had someone to call on for practical or emotional assistance, or in a crisis. The proportion without anyone to call on was highest for emotional assistance (16%).
38
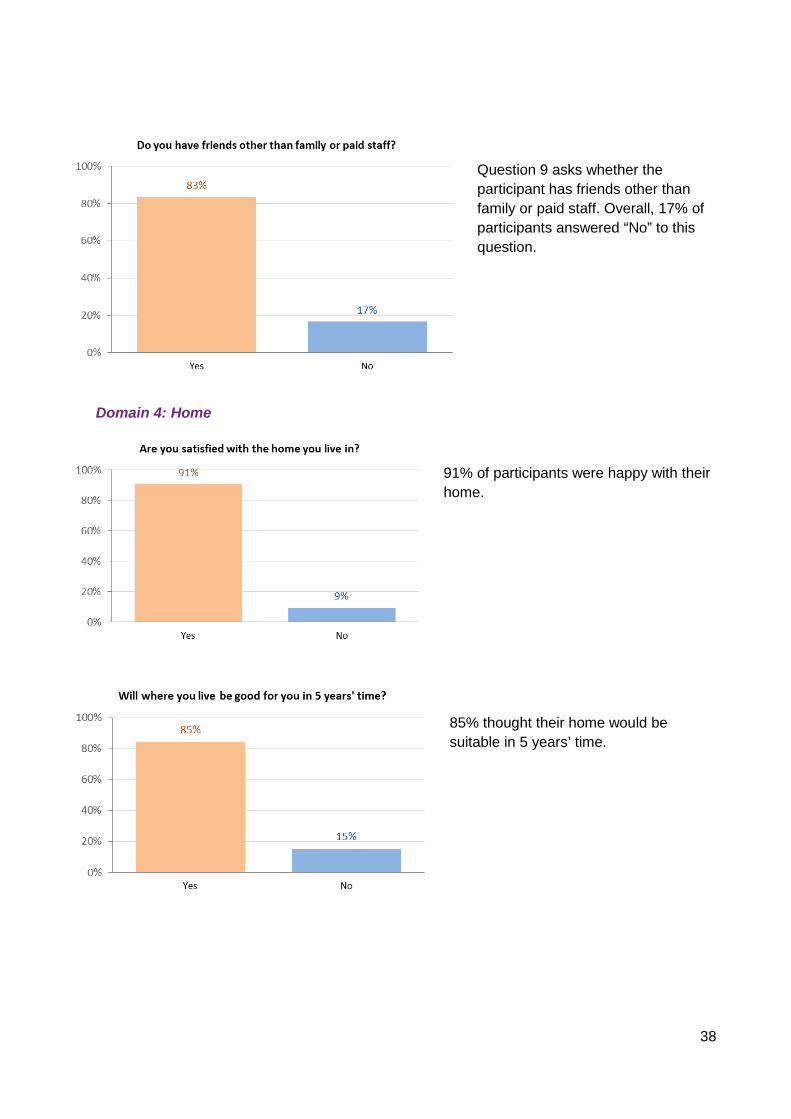
Question 9 asks whether the participant has friends other than family or paid staff. Overall, 17% of participants answered “No” to this question.
Domain 4: Home
91% of participants were happy with their home.
85% thought their home would be suitable in 5 years’ time.
39
Domain 5: Health and wellbeing
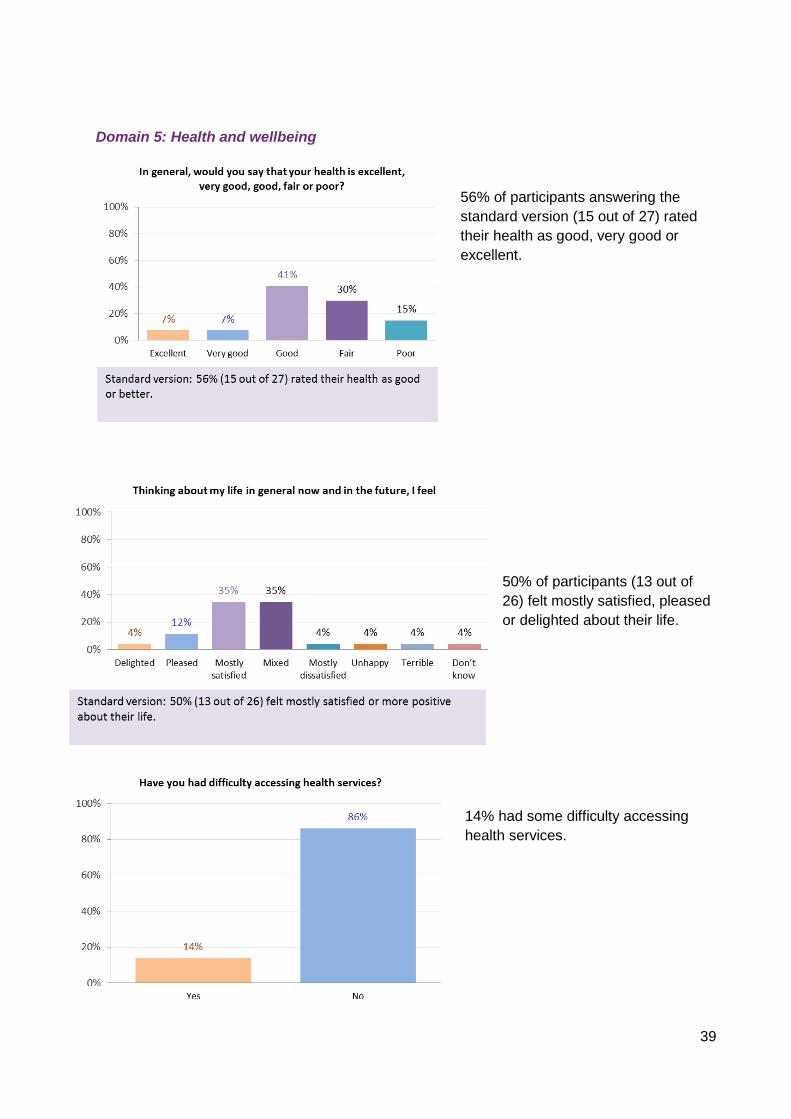
56% of participants answering the standard version (15 out of 27) rated their health as good, very good or excellent.
50% of participants (13 out of 26) felt mostly satisfied, pleased or delighted about their life.
14% had some difficulty accessing health services.

40
Domain 6: Lifelong learning
Only two participants (6%) said they did not get the opportunity to learn new things but would like to.
Four participants said they had been prevented from doing a course or training in the last 12 months. Two said this was because of travel, one lack of support, and one cost.
3% 0%7% 3% 0% 0%
87%
0%
20%
40%
60%
80%
100%
Lack of support Courserequirements
Travel Cost No suitablecourse
Other No
Yes, due to:
In the last 12 months, is there any course or training that you wanted to do but couldn’t?

41
Domain 7: Work
Overall, 9 respondents (30%) had a paid job, three in open employment. The percentage was slightly lower than the 35% for 25 to 55 year olds. Of the participants without a job, 86% didn’t want one and 14% (3 participants) wanted one.
Only 9% (one of 11) participants in disability group 2 had a paid job, compared to 50% in groups 4 and 5, 43% in group 1, and 25% in group 3.
9, 30%
3, 10%18, 60%
Are you currently working in a paid job
Yes No, but I would like one No and I don’t want one
3
3
2
1
What type of employment is it?
Open market, full award wages Supported Wage System
Australian Disability Enterprise Other
42
Domain 8: Social, community and civic participation
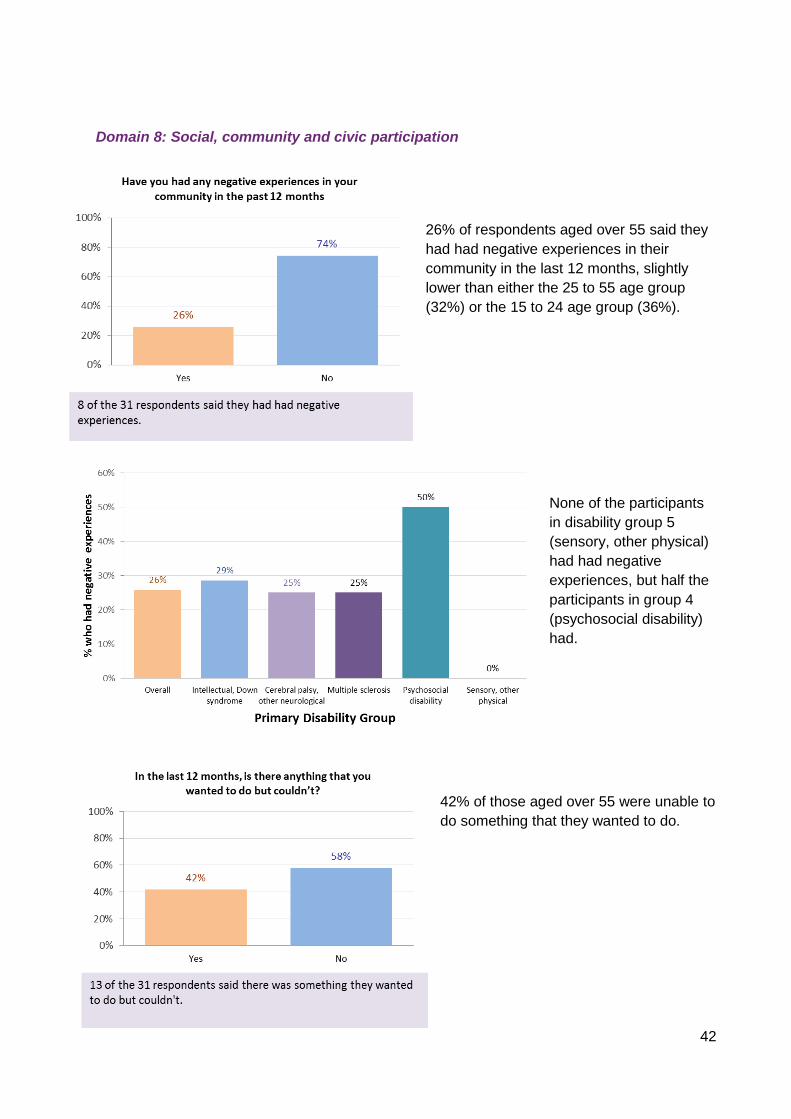
26% of respondents aged over 55 said they had had negative experiences in their community in the last 12 months, slightly lower than either the 25 to 55 age group (32%) or the 15 to 24 age group (36%).
None of the participants in disability group 5 (sensory, other physical) had had negative experiences, but half the participants in group 4 (psychosocial disability) had.
42% of those aged over 55 were unable to do something that they wanted to do.
43
Overall results – participants over 55
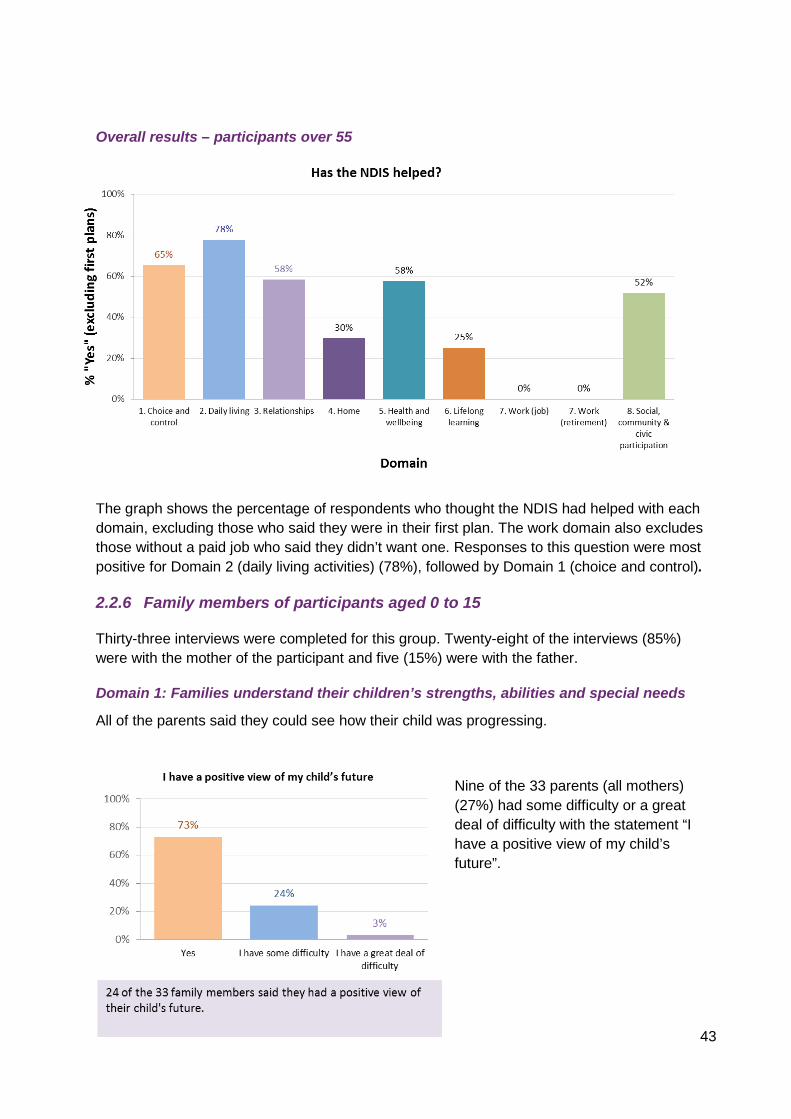
The graph shows the percentage of respondents who thought the NDIS had helped with each domain, excluding those who said they were in their first plan. The work domain also excludes those without a paid job who said they didn’t want one. Responses to this question were most positive for Domain 2 (daily living activities) (78%), followed by Domain 1 (choice and control).
2.2.6 Family members of participants aged 0 to 15
Thirty-three interviews were completed for this group. Twenty-eight of the interviews (85%) were with the mother of the participant and five (15%) were with the father.
Domain 1: Families understand their children’s strengths, abilities and special needs
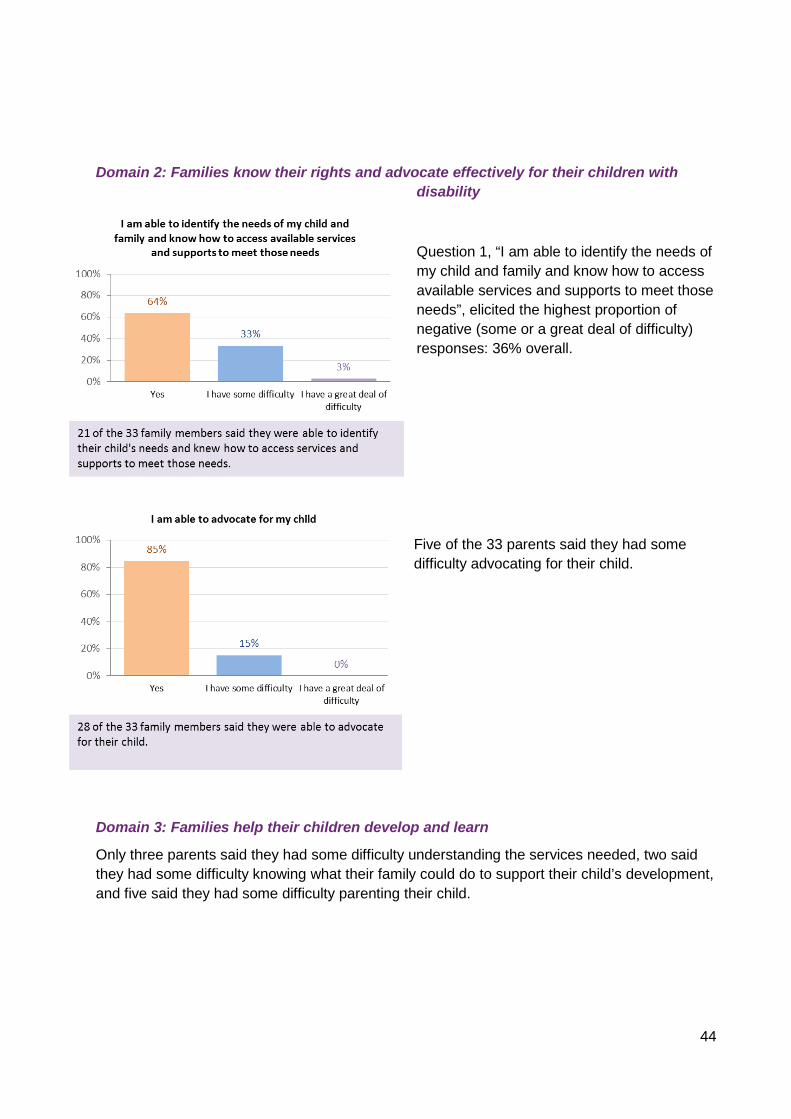
All of the parents said they could see how their child was progressing.
Nine of the 33 parents (all mothers) (27%) had some difficulty or a great deal of difficulty with the statement “I have a positive view of my child’s future”.
44
Domain 2: Families know their rights and advocate effectively for their children with disability
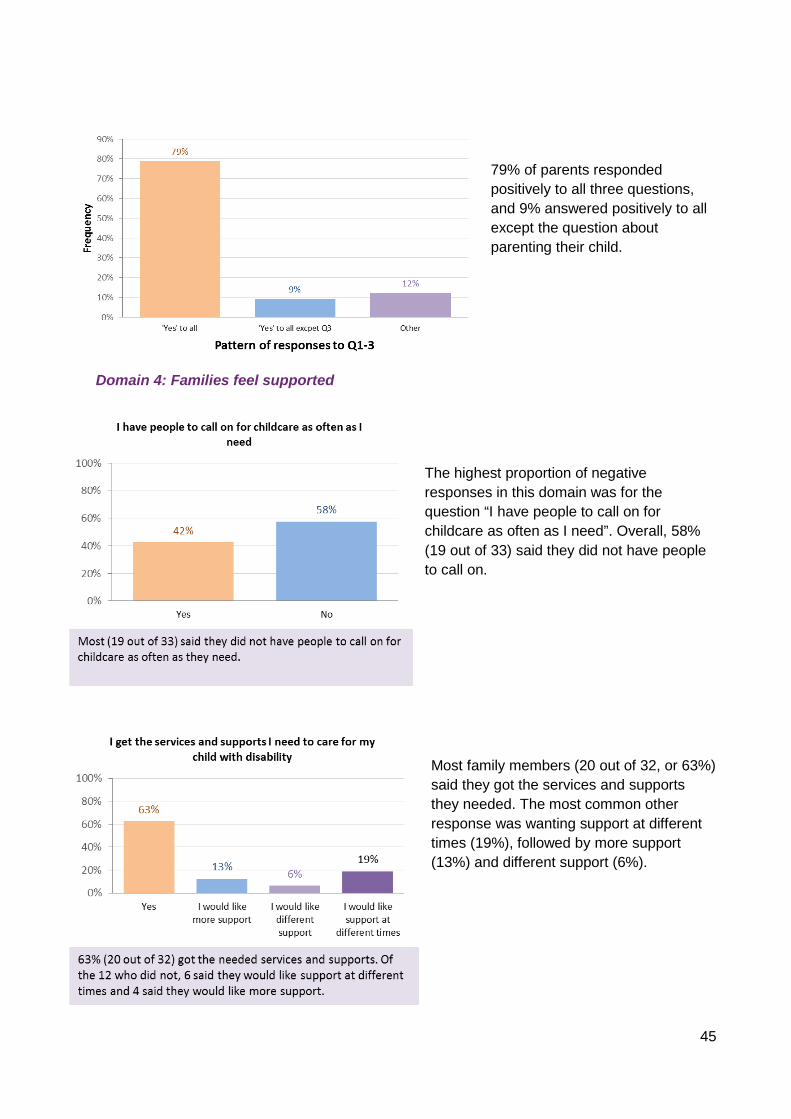
Question 1, “I am able to identify the needs of my child and family and know how to access available services and supports to meet those needs”, elicited the highest proportion of negative (some or a great deal of difficulty) responses: 36% overall.
Five of the 33 parents said they had some difficulty advocating for their child.
Domain 3: Families help their children develop and learn
Only three parents said they had some difficulty understanding the services needed, two said they had some difficulty knowing what their family could do to support their child’s development, and five said they had some difficulty parenting their child.
45
79% of parents responded positively to all three questions, and 9% answered positively to all except the question about parenting their child.
Domain 4: Families feel supported
The highest proportion of negative responses in this domain was for the question “I have people to call on for childcare as often as I need”. Overall, 58% (19 out of 33) said they did not have people to call on.
Most family members (20 out of 32, or 63%) said they got the services and supports they needed. The most common other response was wanting support at different times (19%), followed by more support (13%) and different support (6%).
46
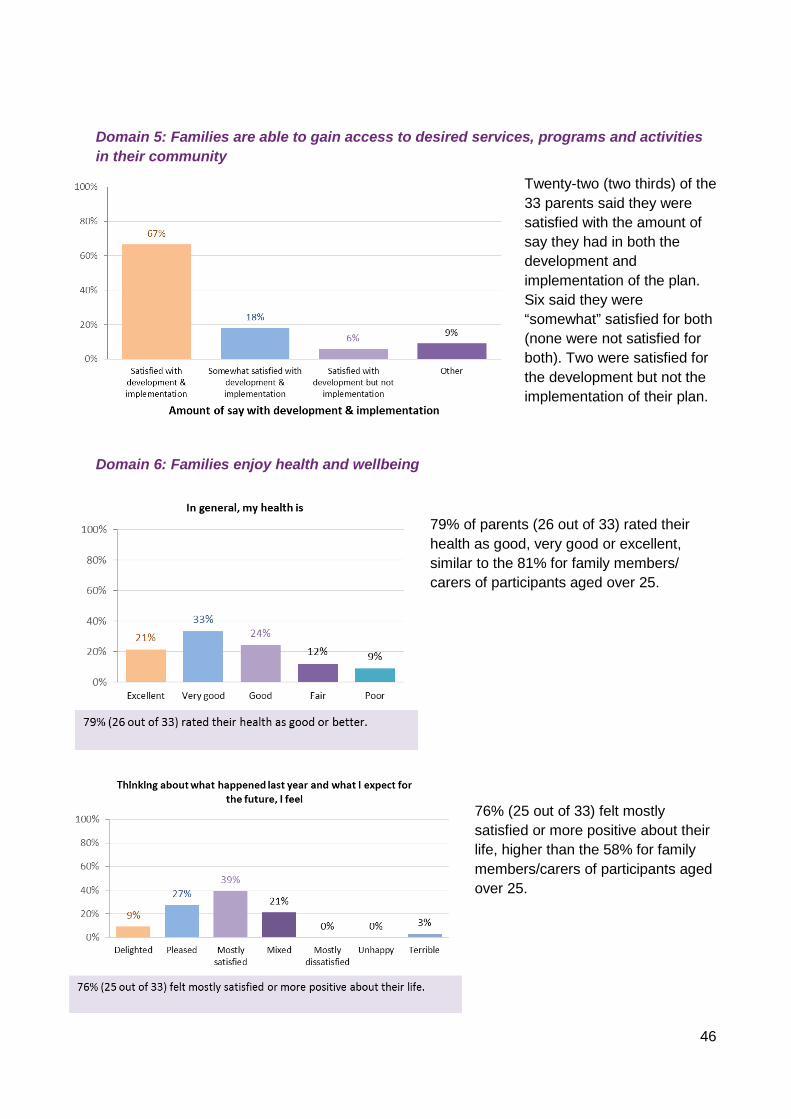
Domain 5: Families are able to gain access to desired services, programs and activities in their community
Twenty-two (two thirds) of the 33 parents said they were satisfied with the amount of say they had in both the development and implementation of the plan. Six said they were “somewhat” satisfied for both (none were not satisfied for both). Two were satisfied for the development but not the implementation of their plan.
Domain 6: Families enjoy health and wellbeing
79% of parents (26 out of 33) rated their health as good, very good or excellent, similar to the 81% for family members/ carers of participants aged over 25.
76% (25 out of 33) felt mostly satisfied or more positive about their life, higher than the 58% for family members/carers of participants aged over 25.
47
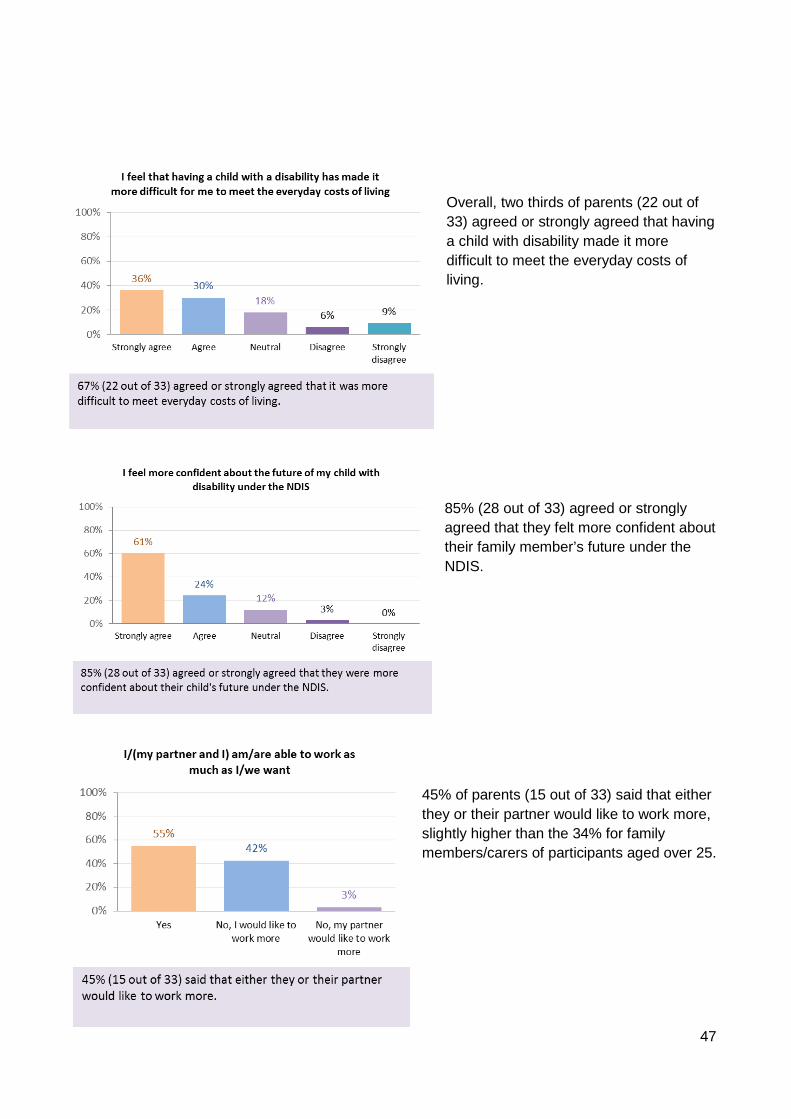
Overall, two thirds of parents (22 out of 33) agreed or strongly agreed that having a child with disability made it more difficult to meet the everyday costs of living.
85% (28 out of 33) agreed or strongly agreed that they felt more confident about their family member’s future under the NDIS.
45% of parents (15 out of 33) said that either they or their partner would like to work more, slightly higher than the 34% for family members/carers of participants aged over 25.
48
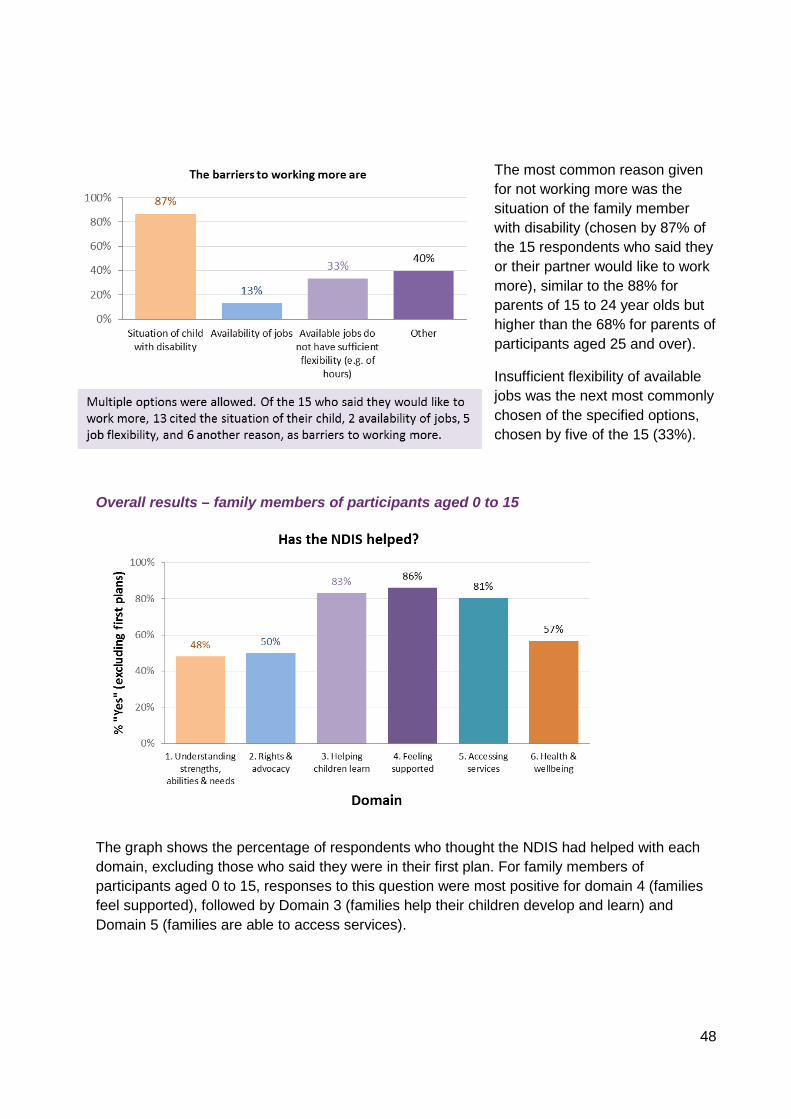
The most common reason given for not working more was the situation of the family member with disability (chosen by 87% of the 15 respondents who said they or their partner would like to work more), similar to the 88% for parents of 15 to 24 year olds but higher than the 68% for parents of participants aged 25 and over).
Insufficient flexibility of available jobs was the next most commonly chosen of the specified options, chosen by five of the 15 (33%).
Overall results – family members of participants aged 0 to 15
The graph shows the percentage of respondents who thought the NDIS had helped with each domain, excluding those who said they were in their first plan. For family members of participants aged 0 to 15, responses to this question were most positive for domain 4 (families feel supported), followed by Domain 3 (families help their children develop and learn) and Domain 5 (families are able to access services).
49
2.2.7 Family members of participants aged 15 to 24
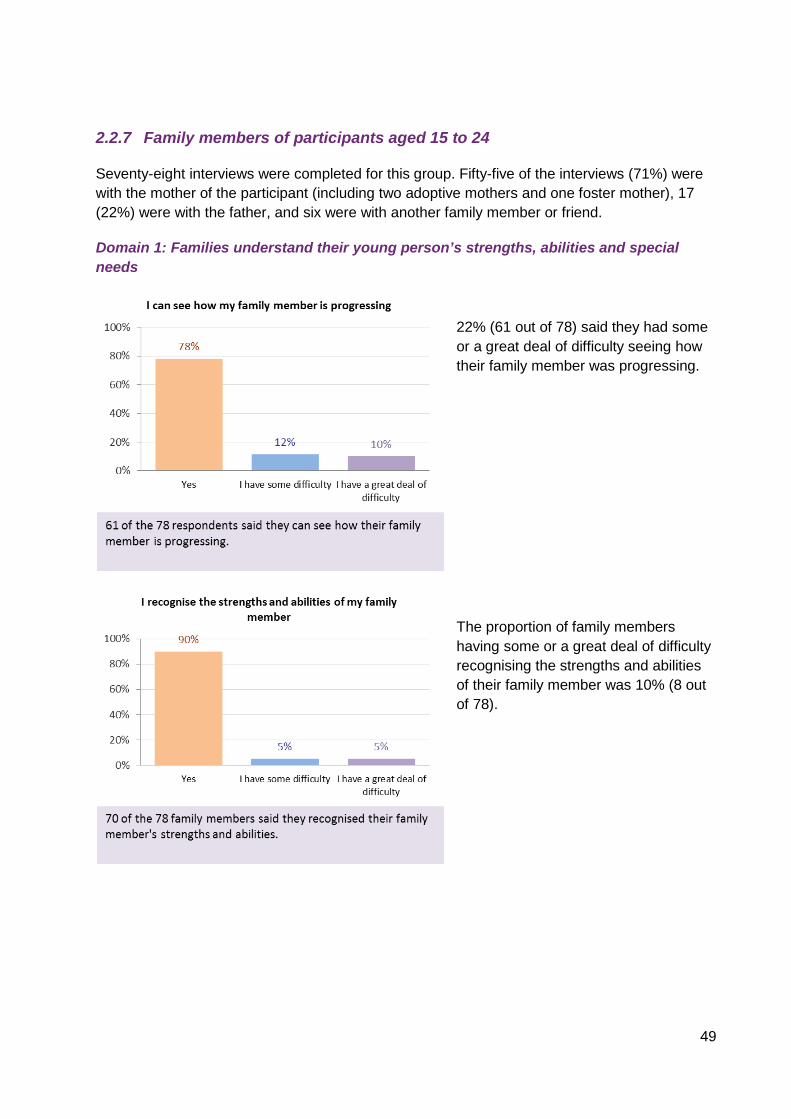
Seventy-eight interviews were completed for this group. Fifty-five of the interviews (71%) were with the mother of the participant (including two adoptive mothers and one foster mother), 17 (22%) were with the father, and six were with another family member or friend.
Domain 1: Families understand their young person’s strengths, abilities and special needs
22% (61 out of 78) said they had some or a great deal of difficulty seeing how their family member was progressing.
The proportion of family members having some or a great deal of difficulty recognising the strengths and abilities of their family member was 10% (8 out of 78).

50
Domain 2: Families know their rights and advocate effectively for their young person with disability
Question 1, “I am able to identify the needs of my family member with disability and my family and I know how to access available services and supports to meet those needs”, elicited the highest proportion of negative (some or a great deal of difficulty) responses: 42% overall.
There was a tendency for the proportion of negative responses to decrease with increasing decile of IRSD, suggesting that families in less disadvantaged areas (higher IRSD) were more likely to be able to identify needs and know how to access services.
14 of the 78 family members (18%) responded negatively to the statement “I understand my rights and the rights of my family member with disability”.
51
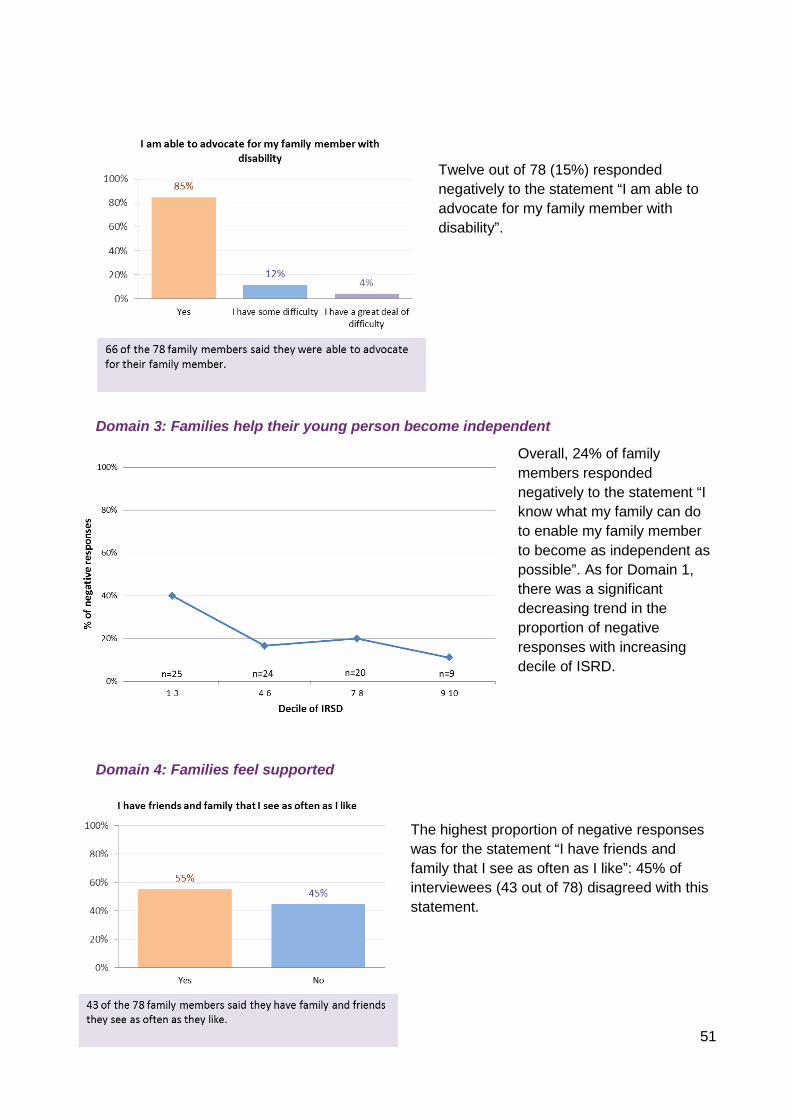
Twelve out of 78 (15%) responded negatively to the statement “I am able to advocate for my family member with disability”.
Domain 3: Families help their young person become independent
Overall, 24% of family members responded negatively to the statement “I know what my family can do to enable my family member to become as independent as possible”. As for Domain 1, there was a significant decreasing trend in the proportion of negative responses with increasing decile of ISRD.
Domain 4: Families feel supported
The highest proportion of negative responses was for the statement “I have friends and family that I see as often as I like”: 45% of interviewees (43 out of 78) disagreed with this statement.
52
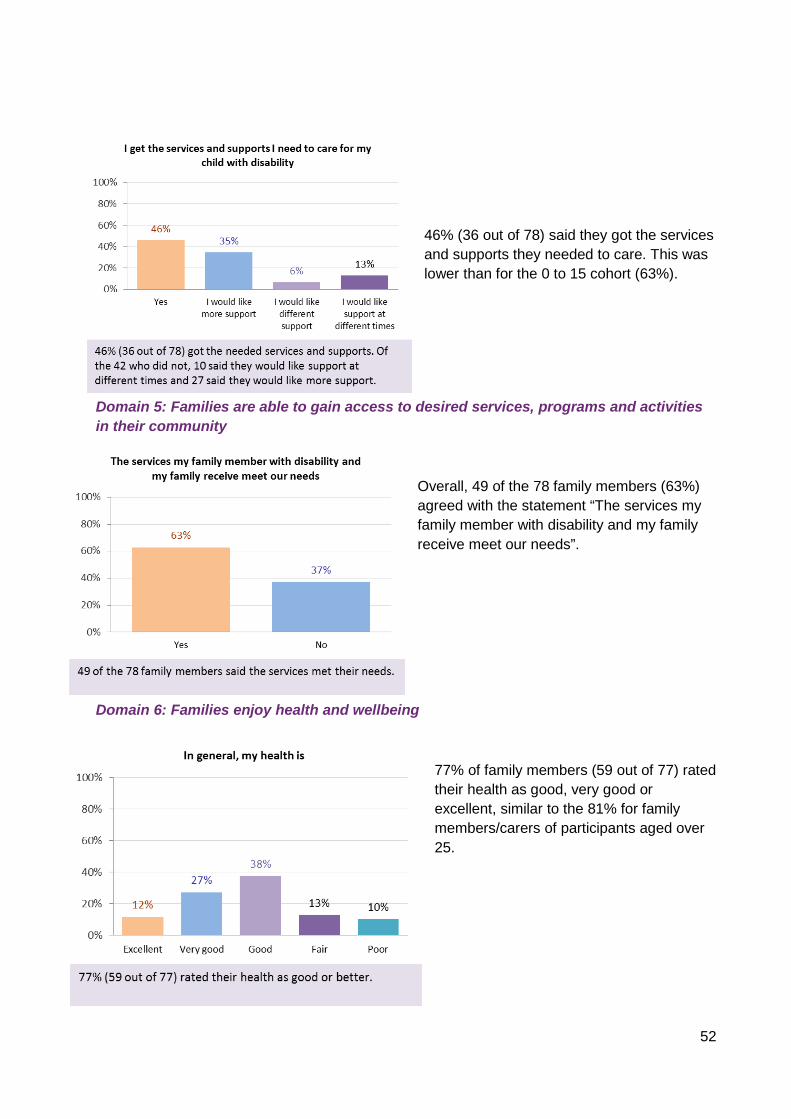
46% (36 out of 78) said they got the services and supports they needed to care. This was lower than for the 0 to 15 cohort (63%).
Domain 5: Families are able to gain access to desired services, programs and activities in their community
Overall, 49 of the 78 family members (63%) agreed with the statement “The services my family member with disability and my family receive meet our needs”.
Domain 6: Families enjoy health and wellbeing
77% of family members (59 out of 77) rated their health as good, very good or excellent, similar to the 81% for family members/carers of participants aged over 25.
53
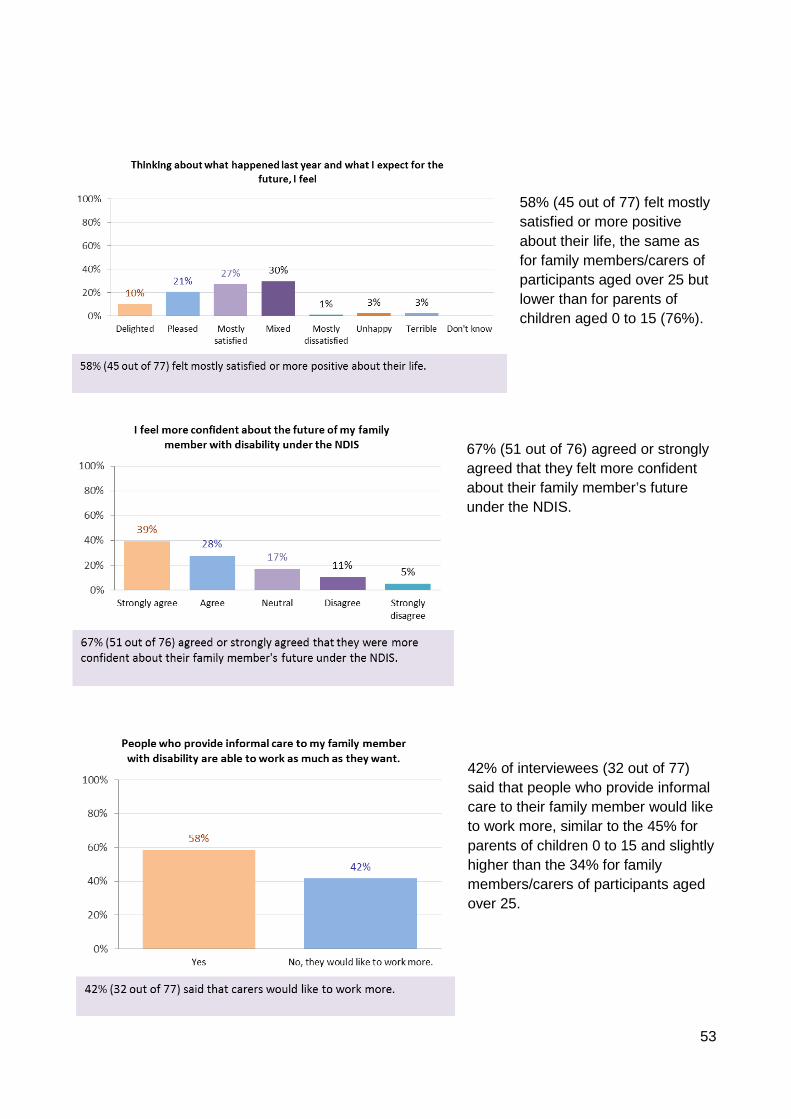
58% (45 out of 77) felt mostly satisfied or more positive about their life, the same as for family members/carers of participants aged over 25 but lower than for parents of children aged 0 to 15 (76%).
67% (51 out of 76) agreed or strongly agreed that they felt more confident about their family member’s future under the NDIS.
42% of interviewees (32 out of 77) said that people who provide informal care to their family member would like to work more, similar to the 45% for parents of children 0 to 15 and slightly higher than the 34% for family members/carers of participants aged over 25.
54
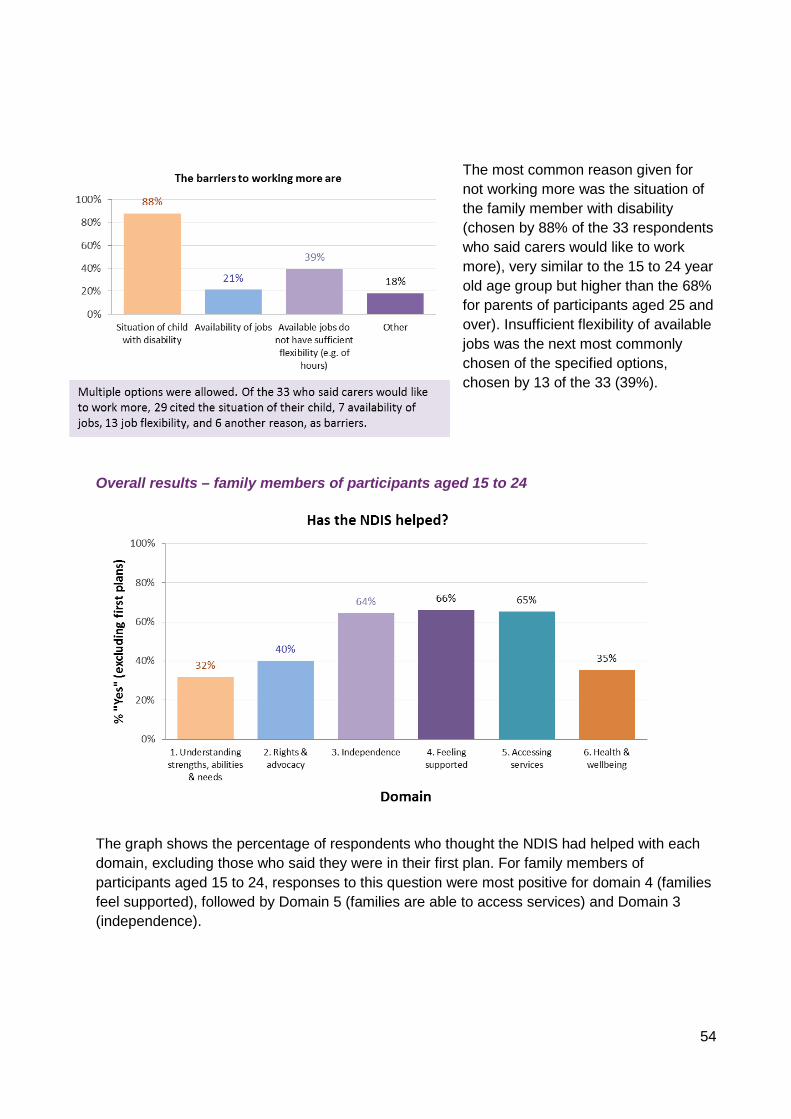
The most common reason given for not working more was the situation of the family member with disability (chosen by 88% of the 33 respondents who said carers would like to work more), very similar to the 15 to 24 year old age group but higher than the 68% for parents of participants aged 25 and over). Insufficient flexibility of available jobs was the next most commonly chosen of the specified options, chosen by 13 of the 33 (39%).
Overall results – family members of participants aged 15 to 24
The graph shows the percentage of respondents who thought the NDIS had helped with each domain, excluding those who said they were in their first plan. For family members of participants aged 15 to 24, responses to this question were most positive for domain 4 (families feel supported), followed by Domain 5 (families are able to access services) and Domain 3 (independence).
55
2.2.8 Family members of participants aged 25 and over
Sixty-eight interviews were completed for this group. Thirty of the interviews (44%) were with the mother or stepmother of the participant, 26 (38%) were with the spouse, partner or fiancé, and the remaining 12 (18%) with another relative or carer.
Domain 1: Families have the support they need to care
32 of 65 respondents (49%) answered positively to the first four questions of this domain (about networks of support), but seven answered negatively to all four questions.
Domain 2: Families know their rights and advocate effectively for their family member with disability
35 of 65 respondents (54%) answered positively to all of the first 3 questions (about knowing how to access services, understanding rights, and being able to advocate).
Questions:1 I have friends and family that I see as often as I like2 I have people to call on for practical assistance3 I have people to call on to support my family member with disability 4 I have people to call on for emotional support
49%
11% 11% 8%
22%
0%
20%
40%
60%
80%
100%
'Yes' to all 'Yes' to all exceptQ1
'No' to all 'No' to all except Q4 Other
Pattern of responses to Q1-4
Questions:1 I am able to identify the needs of my family member with disability and my family and I know how to access available services and supports to meet those needs2 I understand my rights and the rights of my family member with disability3 I am able to advocate for my family member with disability
54%
17%
29%
0%
20%
40%
60%
80%
100%
'Yes' to all 'Yes' to all excpet Q1 Other
Pattern of responses to Q1-3
56
Domain 3: Families are able to gain access to desired services, programs and activities in their community
27 of 63 respondents (43%) answered positively to all of the first 5 questions (about working with and selecting services, and how effective they are).
Domain 4: Families have succession plans
22 of the 66 family members/carers who responded had made succession plans or had begun to make them.
Most commonly this involved the extended family, siblings, or professionals.
57
Domain 5: Families enjoy health and wellbeing
81% of family members (54 out of 67) rated their health as good, very good or excellent. This compares with 59% for participants aged 25 to 55.
58% (38 out of 66) felt mostly satisfied or more positive about their life, compared with 50% for participants aged 25 to 55.
71% (46 out of 65) agreed or strongly agreed that they felt more confident about their family member’s future under the NDIS.
58
34% of family members (22 out of 64) said they would like to work more.
The most common reason given for not working more was the situation of the family member with disability (chosen by 15 of the 22 respondents, or 68%), followed by availability of jobs with sufficient flexibility (23%).
Overall results – family members of participants aged 25 and over
The graph shows the percentage of respondents who thought the NDIS had helped with each domain, excluding those who said they were in their first plan. For family members of participants aged over 25, responses to this question were most positive for Domain 1 (support to care), followed by Domain 3 (families are able to access services).
59
2.2.9 Overall findings and next steps
As discussed in Section 2.1, the analysis presented in this report is based on relatively small sample sizes, particularly for some questionnaire versions, and should therefore be viewed as exploratory in nature. Nevertheless, some preliminary trends have emerged from the analysis and are summarised in this section.
The results indicate that the NDIS is making a difference to the lives of participants and their families and carers. The percentages responding positively to the question “Has the NDIS helped?” by domain suggest that the NDIS has helped more in some areas than others:
• For the three adult participant cohorts, domains 1 (choice and control) and 2 (daily living activities) rank in the top three for all age groups. Domain 3 (relationships) is the top-ranked domain for young adults (and the fourth ranked domain for the other adult age groups). Domain 5 (health) ranks third for the two older adult age groups.
• For the three adult participant cohorts, the three lowest ranked domains are common to all age groups. These are domains 4 (home), 6 (lifelong learning) and 7 (work). Domain 7 is the bottom-ranked domain for all three age groups.
• For participants from birth to school age, domain 1 (children gain functional, developmental and coping skills) and domain 2 (children show evidence of self-determination) rank equal first. The lowest ranked domain is 4 (children participate meaningfully in community life).
• For participants from school age to 15, the highest ranked domain was 1 (children grow in independence) and the lowest was 2 (school).
• For all family versions, the domains “families feel supported” and “families are able to gain access to services, programs and activities” were amongst the top three. For families of children aged 0 to 15, domain 3 (families help their children develop and learn) is ranked second, and for families of participants aged 15 to 24, domain 3 (families help their young person become independent) ranks third.
• For families of participants aged 0 to 15 and 15 to 24, domain 1 (families understand their child/young person’s strengths, abilities and special needs) ranks lowest.
• For families of participants aged 25 and over, domain 4 (families have succession plans) ranks lowest.
The NDIA is committed to a culture of continuous learning and improvement. The NDIA Board and management will use the outcomes framework to support this culture by identifying areas where improvement may be required, allowing the Agency to respond with targeted strategies. For example, work is already underway on a strategy focusing on transition to work from school, and looking at early childhood models of support (including accessing mainstream services).
Results from the pilot study have also contributed to the development of an implementation strategy for the outcomes framework. Two versions of the questionnaires have been developed: a short form (SF) and a long form (LF). The SF will contain questions relevant to planning and a small number of key indicators. It will be collected for all participants. The LF will contain a broader range of questions relevant to Scheme monitoring and will be collected for a sample of participants. Both forms will be collected longitudinally over time.

60
Finally, it is envisaged that this report will form the basis for discussion of pilot study results with key stakeholder groups, and further development of the framework.