national center for intermodal transportation for … center for intermodal transportation for...
TRANSCRIPT
National Center for Intermodal Transportation
for Economic Competitiveness
Workforce Development, Recruitment and Retention, and Promotion of Women and Other
Underrepresented Groups in the Intermodal Trucking Industry
Patrick Sherry, PhD, ABPP
Research Professor
National Center for Intermodal Transportation
Denver Transportation Institute
University of Denver
Ruth Chao, PhD
Briana Hedman, PhD
Jessica Mantia, MA
National Center for Intermodal Transportation
Research Associate
National Center for Intermodal Transportation for Economic Competitiveness
at the
University of Denver
October 2016
Recruitment in Transportation
October 2016 2
Disclaimer
The contents of this report reflect the views of the authors, who are responsible for the facts and
the accuracy of the information presented herein. This document is disseminated under the
sponsorship of the Department of Transportation University Transportation Centers Program, in
the interest of information exchange. The U.S. Government assumes no liability for the contents
or use thereof.
Recruitment in Transportation
October 2016 3
Abstract
The present investigation extended previous research on the factors that affect the pursuit of
careers in transportation, with particular attention to the recruitment of female candidates. In this
work, a sample of 162 high school students and college graduates who had some work
experience were gathered from a large West Coast community. A questionnaire was developed
based on theories of work values, organizational commitment, social support, and vocational
interests. Results from descriptive statistics, comparisons of means, and hierarchical stepwise
regression analyses provided data on the relative contribution of occupational values, social
support, and self-efficacy as they affect career choice for jobs in transportation.
Differences in perceived social support were found for the general sample. Those who
were more interested in accepting a position in transportation were also more likely to
have access to “mentorship and professional networks” in transportation. In addition,
those respondents indicated that they had “role models,” “family,” “friends,” or
“relatives” who were positive about the industry. Lastly, they indicated that their “family
was supportive” and that a “mentor contributed to my success” in transportation. Female
accepters had a “friend” or “family member” who made the difference by
“recommending” or suggesting transportation as a career or profession.
Differences in self-efficacy measures revealed that persons who had a high degree of
self-confidence that their “skills” would be of value and that they would be “successful”
in the transportation industry were more likely to accept a position. In addition, a belief
that the “mission and values” were worth supporting was also a differentiator among
accepters. Individuals who believed that they would find “friends” and people with
“similar” interests or “supportive” people were also more likely to accept. Lastly, those
who also noted that they would be able to engage in the “lifestyle” and “income” they
sought were also more likely to lean towards accepting.
Differences in occupational values were nonsignificant in differentiating persons in the
general sample. Women who were less interested in flexible “work hours,” “significant
financial rewards,” or good “labor management relations” but who did prefer a
“competitive salary,” were more likely to accept a position in transportation.
A model emerged with six predictor variables that accounted for 66% of the variance in
acceptance of transportation jobs.
Practical implications of these findings revealed a profile and a set of screening items capable of
differentiating persons willing to accept a position in transportation. The findings also indicate a
candidate’s likely probability of acceptance by as much as 7 to 1, when answers to proposed
interview questions are in the scorable direction. Similarly the probability of acceptance of
position offers was nearly 2 to 1 when answers are in the scorable direction. The value of this
research is that it enables transportation organizations to focus scarce and shrinking public
funding for recruitment and retention on the admittedly small segment of the population that is
willing to consider positions in transportation and to identify and focus on individuals more
likely to pursue and accept those positions.
Recruitment in Transportation
October 2016 4
Table of Contents
Abstract ..................................................................................................................................................................... 3
Review of Literature ............................................................................................................................. 6
Theoretical Background............................................................................................................................ 7
Trait Factor Theory .................................................................................................................................. 8
Method ............................................................................................................................................................... 12
Procedure ............................................................................................................................................... 12
Measures ................................................................................................................................................. 12
Analysis .................................................................................................................................................... 13
Results ............................................................................................................................................................... 13
Participants ............................................................................................................................................ 13
Occupational Values ................................................................................................................................ 14
Vocational Interests ................................................................................................................................. 18
Social Support ............................................................................................................................................ 19
Self - Efficacy .............................................................................................................................................. 22
Predictive Models ..................................................................................................................................... 23
Pursue a position in transportation ............................................................................................. 23
Accepting a position in Transportation ...................................................................................... 24
Summary ...................................................................................................................................................... 25
Odds of Accepting/Rejecting ................................................................................................................ 29
Discussion ........................................................................................................................................................ 31
Battery of Successful Screening Items .............................................................................................. 33
Recommendations ................................................................................................................................... 34
References ........................................................................................................................................................ 35
Appendix A. ...................................................................................................................................................... 39
Recruitment in Transportation
October 2016 5
List of Tables Table 1. Comparison of occupational values for accepters of a position in transportation. . 15
Table 2. Gender differences on occupational values. ........................................................................... 16
Table 3. Comparison of occupational values for women accepters. .............................................. 17
Table 4. Vocational interest preferences for accepters of transportation positions. .............. 18
Table 5. Gender differences in vocational interest preferences. ..................................................... 18
Table 6. Differences in vocational interests among women accepting positions. .................... 19
Table 7. Differences in perceived support among those willing to work in transportation. 20
Table 8. Differences in perceived support among women who would accept a positon. ....... 21
Table 9. Differences in perceived support among men who would accept a positon. ............ 22
Table 10. Differences in aceptance on self-efficacy. ............................................................................. 23
Table 11. Regression analysis of predictor variables onto interest in pursuing a position. 24
Table 12. Regression analysis of variables onto interest in pursuing jobs transportation. .. 25
Table 13. Regression analysis of predictor variables onto interest in accepting a position. 25
Table 14. Cross tabulation of "good fit" versus "accepting" a position in transportation. .... 29
Table 15. Significant differentiators between accepters and non-accepters. ............................ 30
Table 16. Battery of Successful Screening Items ................................................................................... 33
List of Figures Figure 1. Model of vocational choice in transportation. ..................................................................... 10
Figure 2. Percent likely to pursue a position in transportation. ...................................................... 14
Figure 3. Percent likely to accept a position in transportation – even with another offer. ... 14
Figure 4. Profile of persons interested in accepting a position in transportation. .................. 26
Figure 5. Profile of differences for accepting vs not accepting transportation jobs. .............. 27
Figure 6. Differences between women Accepting vs Non-Accepting positions. ....................... 27
Figure 7. Differences between male accepters and non-accepters. ............................................... 28
Recruitment in Transportation
October 2016 6
Recruitment and Retention of Women and Other Underrepresented Groups in the
Intermodal Trucking Industry
Review of Literature
Workforce planners have become increasingly concerned about the ability of the
transportation industry to field an effective and diverse workforce over the next decade. Program
growth, new technologies, budget constraints, scarcity of midlevel managers, and staffing
shortages due to an aging workforce and lack of new recruitment fuel these challenges. It has
been estimated that 40% to 50% of the existing transportation workforce is nearing retirement
(Martin, 2015). Recruitment into the transportation industry and employee retention is crucial to
maintaining the industry’s success. To successfully recruit and retain employees, there is a need
to cultivate an interest in young people. One needs to understand the factors that influence
people’s decisions to take jobs in transportation or to move into or out of the industry. Because it
can cost upwards of $100,000 to recruit, train and place a qualified candidate1, it is imperative
that recruiters and managers have a clear picture of who is likely to succeed and stay working in
the industry.
A review of the current literature found one research study that explored the gender
inequality of women in the transportation industry. Specifically, Hanson and Murakami (2010)
noted that gender inequality may be best explained in terms of lack of equal opportunity for men
and women within the industry and women may not be attracted to the industry due to a gap in
education or lack of role models. They also recognized the limited talent pool of women for the
transportation industry, which may be due to the lack of recruitment of women, as well as
advertising that characterizes transportation jobs as nontraditional roles for women. Educating
women about the roles available to them in the transportation industry and modifying
advertisements to highlight such roles could assist recruitment. The Women’s Labor Bureau
defines a job nontraditional for women if less than 25% of that labor force is made up of women
(Women’s Labor Bureau, 2009), a criterion that the transportation industry clearly meets. With
regard to the underrepresentation of women in the transportation industry, Hanson and
Murakami (2010) stated, “Not only does this gender imbalance limit women's opportunities for
interesting and well-remunerated work, it deprives the transportation field of a vital source of
talent.”
Hanson and Murakami sought to understand the reasons behind women not being
attracted to the industry. Their interviews with leaders in the field were geared towards
uncovering recommendations for increasing gender equality. Several themes emerged in leaders’
recommendations. Prominent suggestions included connecting with children and young people
through schools and existing programs to advertise the roles of women in science and
1 Lindsey, A. Personal communication.
Recruitment in Transportation
October 2016 7
engineering, as well as building relationships through networking within the industry to connect
women and create awareness about women looking for positions.
Transportation leaders also recommended that women already in transportation increase
participation in industry organizations and take leadership positions in those organizations to
show the proficiency and capability of women within the industry. A qualitative study
examining factors that contributed to women’s success in the transportation industry confirms
that access to mentors and social networks helps contribute to overall career success (Hanson &
Murakami, 2010). Participants reported that the limited number of women in the industry
reduced the overall sense of social support and restricted access to available talent. Hanson &
Murakami (2010) also recognized that the transportation industry needs to ensure flexibility in
the workplace for female employees to accommodate family schedules and create part-time
positions.
Although the study was insightful, it had some limitations. The researchers failed to
interview both managerial- and non-managerial-level women within the industry. They also did
not interview women within different roles and occupations of the industry to better understand
the vast array of issues. The small sample of eight high-powered female executives most likely
skewed results and overlooked additional essential explanations (Hanson & Murakami, 2010).
Mulholland (2014) reported that women who are self-sufficient, rational, scientifically
minded and who enjoyed pursuing complicated goals were more likely to pursue or accept a
job in the transportation industry. One criticism of these studies has been that they do not fully
account for different levels in the managerial hierarchy. In other words, factors that affect
women entering the transportation workforce at an entry level are different from those that
affect women entering at the professional level. The leadership competencies needed for
working as a senior-level manager and as first-line supervisors are also quite different.
According to the Harvard Business Review, women experience subtle gender biases in
the workplace because qualities that are associated with leadership tend to be traditionally
associated with men, which can make it challenging for women to develop an identity as a
leader (Ibarra et al., 2013). Creating an identity as a leader typically occurs by modeling the
behaviors of a role model until those behaviors develop into a personalized leadership style
(Ibarra et al., 2013). The lack of female representation in the transportation industry,
particularly at the leadership level, may also be a barrier that affects workforce recruitment and
retention for females in transportation.
This investigation attempts to gather additional data from various organizations to
identify barriers to workforce recruitment and retention, develop and employ a metric for
estimating change in performance, and provide a model for these estimations in intermodal
transportation organizations for others to use. The needed skills and competencies to be
successful in the industry will also be examined.
Theoretical Background
Recruitment in Transportation
October 2016 8
A number of theories have been proposed to explain and predict career decision-making
and vocational choice. These theories offer a particular point of view, various assumptions, and
hypotheses as to what influences vocational choice.
Trait Factor Theory
Trait factor theory is based on the notion that characteristics of the individual can be
matched with those of the job to create congruence. Persons who have a greater congruence with
the job will be more likely to accept and remain on the job. Holland’s (1973) theory predicts that
those higher in congruence between their personal characteristics and the characteristics of the
job are also more likely to have higher degrees of job satisfaction and job tenure as well as
improved job performance and career satisfaction. Various measures and methods have been
offered to attempt to measure vocational interests and subsequent congruence. Called the
RIASEC Model, a vocational interest typology defined by Holland (1973) is predicated upon the
assumption that individuals can be loosely grouped into six personality types and that these types
are correlated with likes and dislikes which guide career selection. The RIASEC model looks at
preference for work activities centering on:
1. Practical hands-on problems and solutions;
2. Ideas, thinking, and problem solving;
3. Artistic and creative use of forms, design, and patterns;
4. Helping, teaching, providing service, or working with people;
5. Leading people, directing projects, making decisions; and
6. Predictability, definite procedures, routine, data, details, and organization.
Interestingly, a recent meta-analysis revealed that vocational interests have demonstrated
modest validity indices with such traditional personnel outcome variables as turnover and job
performance. In an analysis of 74 studies, significant relationships emerged between vocational
interests and job performance, training performance, intention to turnover and actual turnover.
The authors concluded that “Finally, validity estimates were largest when studies used multiple
interests for prediction, either by using a single job- or vocation-focused scale (which tends to
tap multiple interests) or by using a regression-weighted composite of several RIASEC or basic
interest scales.” (Van Iddekinge, et. al, 2011). These findings provide compelling evidence for
the role of vocational interests as a key predictor of acceptance of a position in transportation.
Occupational values were included as part of Super’s work values theory. This theory
was proposed as part of Super’s larger developmental theory of career choice and development.
The values component of his theory has also been used by trait factor theorists. Super developed
Super’s Work Values Inventory (Super, 1970), which included 12-values scales. Recent research
has shown that the instrument is reliable and valid. It was also deemed reliable and valid in a
sample of African Americans, as has been demonstrated within a predominantly Caucasian
college student sample. Values of coefficient α were similar to those found in white and
Recruitment in Transportation
October 2016 9
normative samples, with a median α of .82 herein and medians of .82 and .84 in the normative
and white college student samples.
Another values measure, the Minnesota Importance Questionnaire (Weiss, et. al. 1964),
measures occupational values and includes an extensive system for determining occupational
preference based on the assessment of occupational values. The Minnesota Importance
Questionnaire (MIQ) is a measure of an individual's vocational needs and values, which are
important aspects of the work personality. It is designed to measure six vocational values (and
the 20 vocational needs from which the values derive): Achievement, Ability Utilization,
Achievement, Altruism, Co-workers, Social Service, Moral Values, Comfort, Activity,
Independence, Variety, Compensation, Security, Working Conditions, Safety, Company Policies
and Practices, Supervision – Human Relations, Supervision –Technical, Status, Advancement,
Recognition, Authority, Social Status, Autonomy, Creativity, and Responsibility. The MIQ
enables the comparison of the vocational values of the individual to occupational reinforcers for
185 occupations representative of the major fields and levels of the world of work. By assessing
the degree of congruence between the occupational reinforcers with an individual's needs or
values, the instrument helps predict job satisfaction. The assessment of need-reinforcer
correspondence in work complements the usual practice of measuring vocational abilities and
comparing them with the ability requirements of occupations needed to predict job performance
and potential longevity. An important advantage of the MIQ is that it is available for use in both
research and clinical work free of charge as long as Vocational Psychology Research Lab,
University of Minnesota, is acknowledged as the source of the material. (Lofquist, & Dawis,
1969; Dawis, Lofquist, & Weiss, 1968).
Social cognitive theory suggests that rather than having a relational focus, women’s
career development is influenced by career self-efficacy beliefs and behaviors that reflect these
beliefs (Farmer, Wardop, Anderson, & Riesinger, 1995). Expansionist theories suggest that
workplace distress is related to underutilization of skills, perception of limited opportunities, and
heavy job demands in both men and women (Barnett & Hyde, 2001; Sullivan & Mainiero, 2006).
Expansionist theory also explains differences in entry and retention of women in male-dominated
fields as a byproduct of differences in evaluation of opportunities for success in the field. It is
unclear if these perceptions are accurate given the climate of the transportation industry, or if
they are a result of lack of information or understanding about the opportunities available.
Demographic factors have been shown to influence women’s entry and persistence in
male-dominated career fields. Other factors include the presence of a role model (Quimby &
Desantis, 2006), career self-efficacy (Farmer et al., 1995), perception of barriers (Rivera et al,
2004), demographic factors (Rosen & Korabik, 1990), work-life balance (Whitmarsh, et al.,
2007), and workplace factors (Crozier, et al. 1998).
Previous research shows that individuals tend to change to careers more congruent with
their personality types (Donohue, 2005). The literature reveals that job satisfaction, ability to
maintain a suitable lifestyle, geographic location, and family commitments are indicators of
career persistence (Alexander, Lichtenstein, Joo Oh, & Ullman, 1998; Smart, & Peterson, 1994;
Recruitment in Transportation
October 2016 10
Donohue, 2005). Variable and long work hours make it difficult for employees in the
transportation industry to attain an adequate work-life balance. Smith & Canger (2004) found
that high levels of supervisor agreeableness, emotional stability, extroversion, kindness and trust
are related to employee job satisfaction and commitment. Philbrick and Sherry (2004) found that
high school and college students most interested in pursuing a transportation career are those
who have conventional interests and who value employee assistance programs,
labor/management relations, career stability, travel opportunities, and opportunities for career
advancement and leadership. The transportation industry needs to identify factors specific to the
industry that predict career choice and change in job seekers and current transportation
professionals in order to adequately recruit and retain employees.
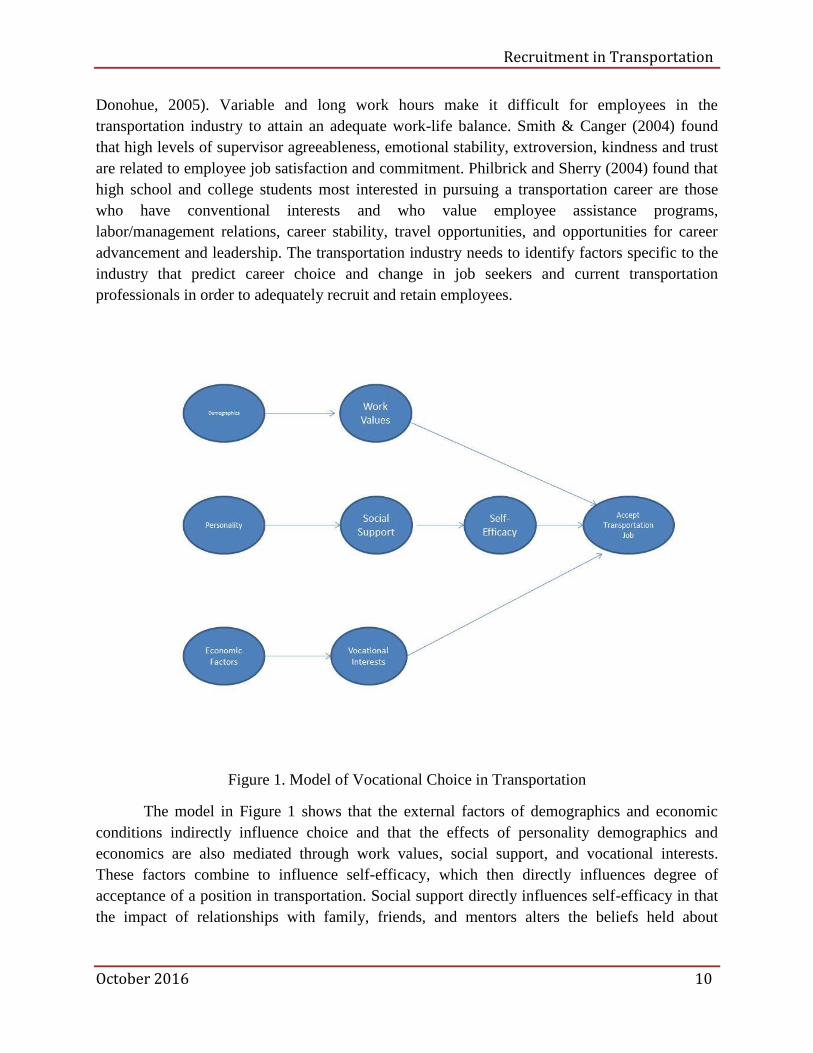
Figure 1. Model of Vocational Choice in Transportation
The model in Figure 1 shows that the external factors of demographics and economic
conditions indirectly influence choice and that the effects of personality demographics and
economics are also mediated through work values, social support, and vocational interests.
These factors combine to influence self-efficacy, which then directly influences degree of
acceptance of a position in transportation. Social support directly influences self-efficacy in that
the impact of relationships with family, friends, and mentors alters the beliefs held about
Recruitment in Transportation
October 2016 11
effectiveness and success in a particular work environment. When a friend or relative says “You
can do it. I know. I did,” this exerts a powerful influence on the job candidate.
The present study sought to improve recruiters’ and managers’ ability to identify
characteristics of persons likely to pursue or accept a job in the transportation industry. Results
of a number of questionnaires designed to measure occupational interests, values and attitudes
and administered to a sample of women in the general population and also those employed in
transportation were analyzed. Results of these analyses provided a descriptive profile of persons
likely to purse, accept and remain working in the transportation industry.
Recruitment in Transportation
October 2016 12
Method
Procedure
Surveys were distributed to a sample of professionals and nonprofessionals in a large
West Coast city. Participants from a group of high school students and professionals attending
seminars at a large Western University were invited to complete a survey on their career
intentions and aspirations. Participants were given information and a small incentive (a
Starbucks gift card) to complete an online survey.
Measures
The items in the seven sections listed below were all responded to on a five-point Likert
type scale ranging from one (to a little or no degree) to five (to a very great degree).
Occupational values. Work values were measured using a series of 18 items based on
Super’s (1970) work value inventory. Respondents were asked to what degree certain values
such as Career Stability, Potential for Financial Reward, Travel Opportunities, Competitive
Fringe Benefits, Geographic Location of the Company, Social Environment, Challenge,
Creativity, Flexible Work Hours, Achievement, Altruism, Autonomy, Job Security, Safety,
Status, Financial Assistance, Employee Assistance, Labor Management Relations, Career
Advancement, Competitive Salary, Competitive Benefits, and a Clear Path for Advancement
would influence their decision to take a job in the transportation industry.
Organizational commitment. The extent to which respondents felt that the mission and
objectives of the organization were consistent with their own or that they felt committed to the
mission and values of the organization was measured using the six continuance commitment
items from Meyer & Allen’s (1997) organizational commitment questionnaire. Sample items
include “Your personal values are in line with values found in transportation organizations” and
“the values and mission of a transportation job are worth supporting.”
Vocational Interests. Vocational interests and preference for certain vocational activities
were measured with an abbreviated set of six items designed to measure general interest in the
six main occupational types assessed by the Holland’s (1973) vocational theory. These six types
include: Realistic, Investigative, Artistic, Social, Enterprising, and Conventional (RIASEC) work
environments and occupational activities.
Self-Efficacy. The importance of self-efficacy as a predictor of occupational choice and
vocational interest has received increasing attention over the past decade. In the present study, a
set of items were designed to assess respondents’ beliefs in their ability to contribute and
perform successfully in the transportation field. Sample items included “I think that I am a good
fit with the transportation industry,” “I am confident that I will be successful working in the
transportation industry,” “I have skills that are valuable to the transportation industry,” “I will be
Recruitment in Transportation
October 2016 13
as good, or better, at my job as other people who hold the same position,” “I am confident that I
can handle any gender issues that might arise while working in transportation,” and “I am
confident that I will be an effective employee in the transportation industry.”
Social Support. Satisfaction with supervision was measured using a modified version of
the House and Wells (1978) supervisor support questionnaire. Sample items included “I expect
to be friends with my coworkers,” “I expect there will be lots of people with similar interests
working in transportation,” “I expect the transportation industry to be supportive of workers of
my gender,” and “I am confident that I can handle any gender issues that might arise while
working in transportation.”
Job satisfaction. Job satisfaction was measured by asking participants general questions
about their satisfaction with their current job (e.g. to what degree do you feel very satisfied with
this job?). Items include “I expect most people on this job to be very satisfied with the job,” “I
expect to be satisfied with the kind of work I do in this job,” and “I expect to be satisfied with
my job including the hours and amount of work.”
Intention to Pursue or Accept. Respondents’ overall intent to pursue a career in
transportation was assessed using single-item measures that said: “I want to work in
transportation,” “Even if I had a job offer in another industry I would still like to work in the
transportation industry,” and “I expect to work in transportation but would take another job, for
better pay, if offered.”
Analysis
To determine what factors were related to persons considering career change or choice, a
predictive model was used based on stepwise regression analysis of occupational values,
organizational commitment, supervision, RIASEC typology, and job satisfaction. The models
developed showed the effect of progressively adding a significant predictor from each of the sets
of variables (after determining what was not significant).
Results
Participants
There were 162 respondents to the survey, consisting of 41 females,106 males, and 15
who chose not to report gender. Respondents’ ages ranged from 13 to 63 years of age. The ethnic
breakdown was: 16 white (10.9%), 33 Latino (22.4%), 6 African American (4.1%), 79 Asian
(48.8%), 13 Pacific Islander (8.8%), and 15 unanswered. The education level of respondents
Recruitment in Transportation
October 2016 14
ranged from some high school to completion of a doctoral degree. A total of 136 or 92.55% of
the sample described themselves as students at various levels: high school, undergraduate, or
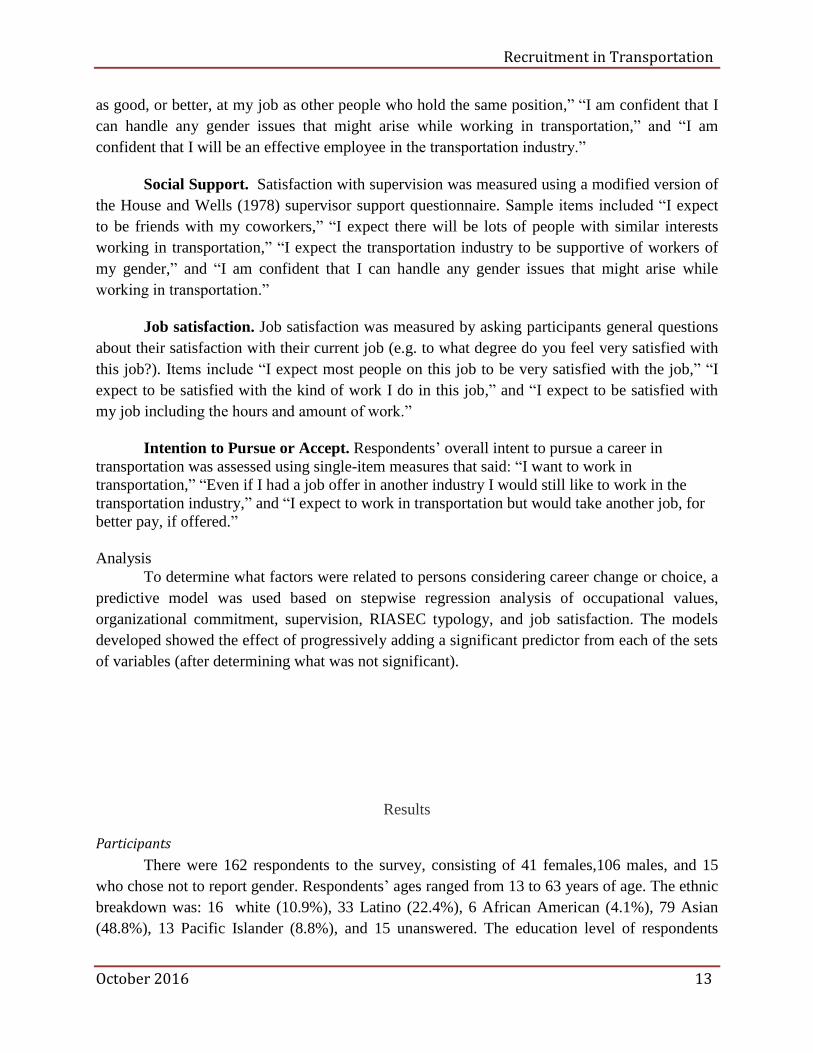
working professionals seeking additional training. Results of the descriptive analysis indicate
that members of the sample overall had some interest in accepting or pursuing a job in
transportation (see Figures 2 and 3).
Figure 2. Percent Likely to Ppursue a Position in Transportation
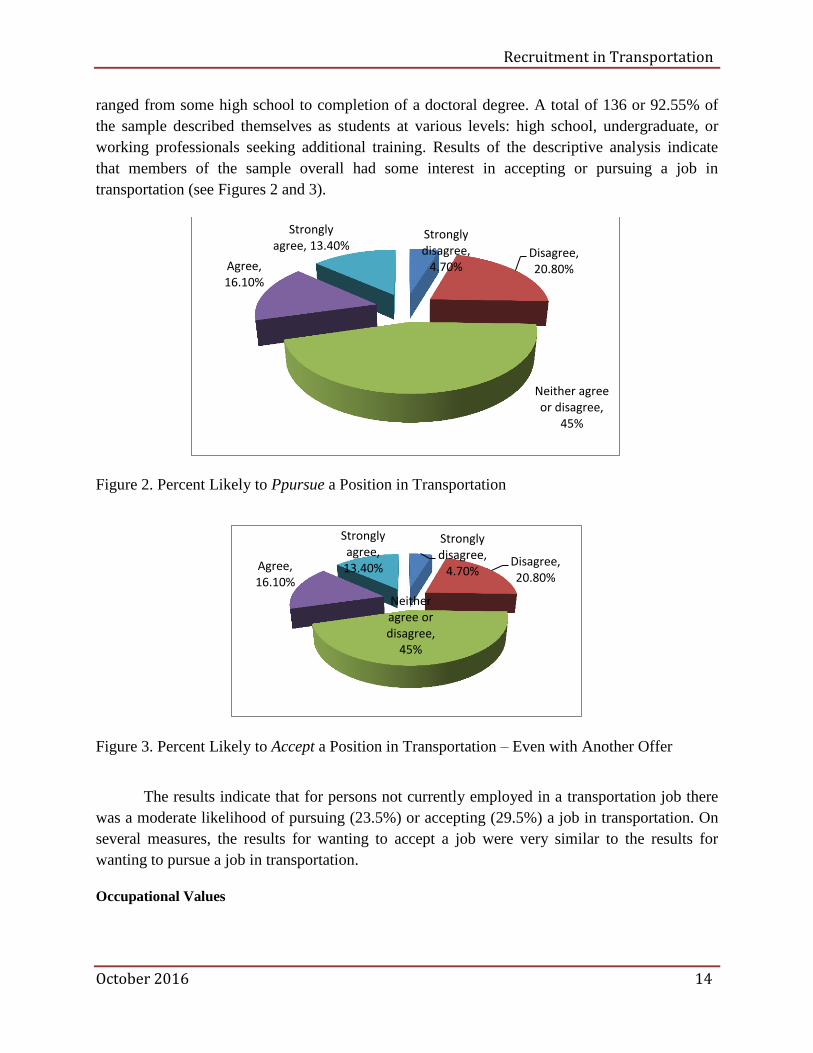
Figure 3. Percent Likely to Accept a Position in Transportation – Even with Another Offer
The results indicate that for persons not currently employed in a transportation job there
was a moderate likelihood of pursuing (23.5%) or accepting (29.5%) a job in transportation. On
several measures, the results for wanting to accept a job were very similar to the results for
wanting to pursue a job in transportation.
Occupational Values
Strongly disagree,
4.70% Disagree, 20.80%
Neither agree or disagree,
45%
Agree, 16.10%
Strongly agree, 13.40%
Strongly disagree,
4.70% Disagree, 20.80%
Neither agree or disagree,
45%
Agree, 16.10%
Strongly agree, 13.40%
Recruitment in Transportation
October 2016 15
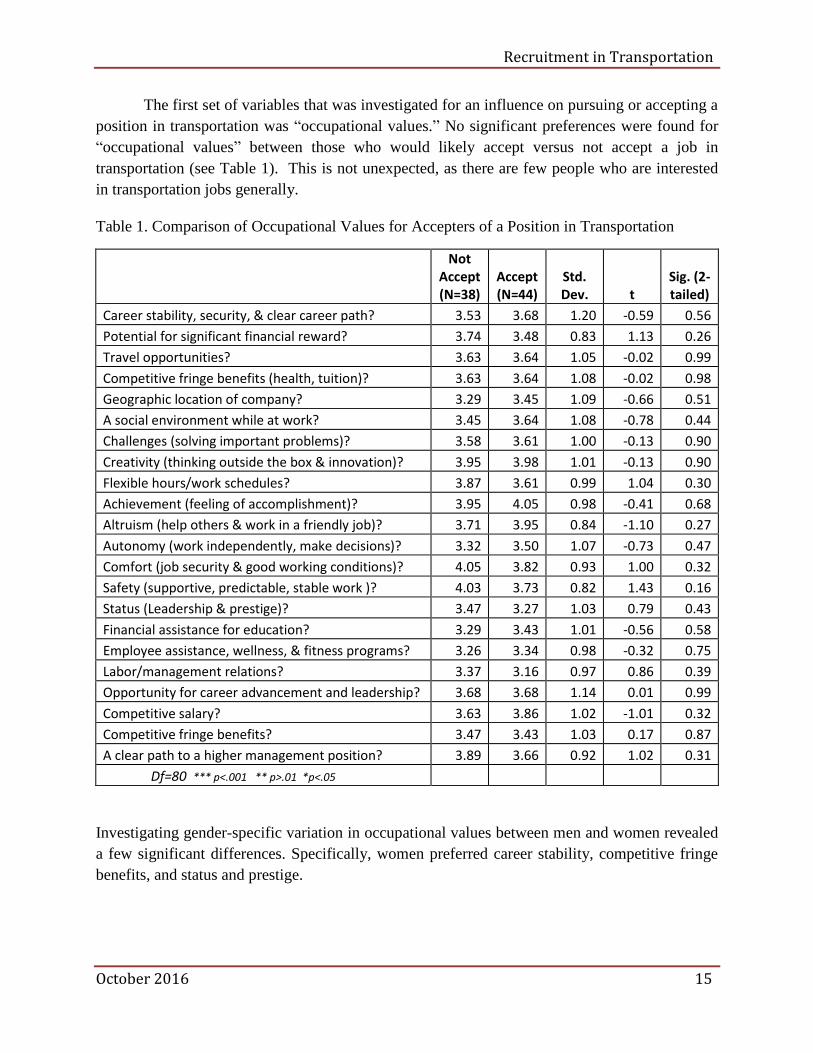
The first set of variables that was investigated for an influence on pursuing or accepting a
position in transportation was “occupational values.” No significant preferences were found for
“occupational values” between those who would likely accept versus not accept a job in
transportation (see Table 1). This is not unexpected, as there are few people who are interested
in transportation jobs generally.
Table 1. Comparison of Occupational Values for Accepters of a Position in Transportation
Not Accept (N=38)
Accept (N=44)
Std. Dev. t
Sig. (2-tailed)
Career stability, security, & clear career path? 3.53 3.68 1.20 -0.59 0.56
Potential for significant financial reward? 3.74 3.48 0.83 1.13 0.26
Travel opportunities? 3.63 3.64 1.05 -0.02 0.99
Competitive fringe benefits (health, tuition)? 3.63 3.64 1.08 -0.02 0.98
Geographic location of company? 3.29 3.45 1.09 -0.66 0.51
A social environment while at work? 3.45 3.64 1.08 -0.78 0.44
Challenges (solving important problems)? 3.58 3.61 1.00 -0.13 0.90
Creativity (thinking outside the box & innovation)? 3.95 3.98 1.01 -0.13 0.90
Flexible hours/work schedules? 3.87 3.61 0.99 1.04 0.30
Achievement (feeling of accomplishment)? 3.95 4.05 0.98 -0.41 0.68
Altruism (help others & work in a friendly job)? 3.71 3.95 0.84 -1.10 0.27
Autonomy (work independently, make decisions)? 3.32 3.50 1.07 -0.73 0.47
Comfort (job security & good working conditions)? 4.05 3.82 0.93 1.00 0.32
Safety (supportive, predictable, stable work )? 4.03 3.73 0.82 1.43 0.16
Status (Leadership & prestige)? 3.47 3.27 1.03 0.79 0.43
Financial assistance for education? 3.29 3.43 1.01 -0.56 0.58
Employee assistance, wellness, & fitness programs? 3.26 3.34 0.98 -0.32 0.75
Labor/management relations? 3.37 3.16 0.97 0.86 0.39
Opportunity for career advancement and leadership? 3.68 3.68 1.14 0.01 0.99
Competitive salary? 3.63 3.86 1.02 -1.01 0.32
Competitive fringe benefits? 3.47 3.43 1.03 0.17 0.87
A clear path to a higher management position? 3.89 3.66 0.92 1.02 0.31
Df=80 *** p<.001 ** p>.01 *p<.05
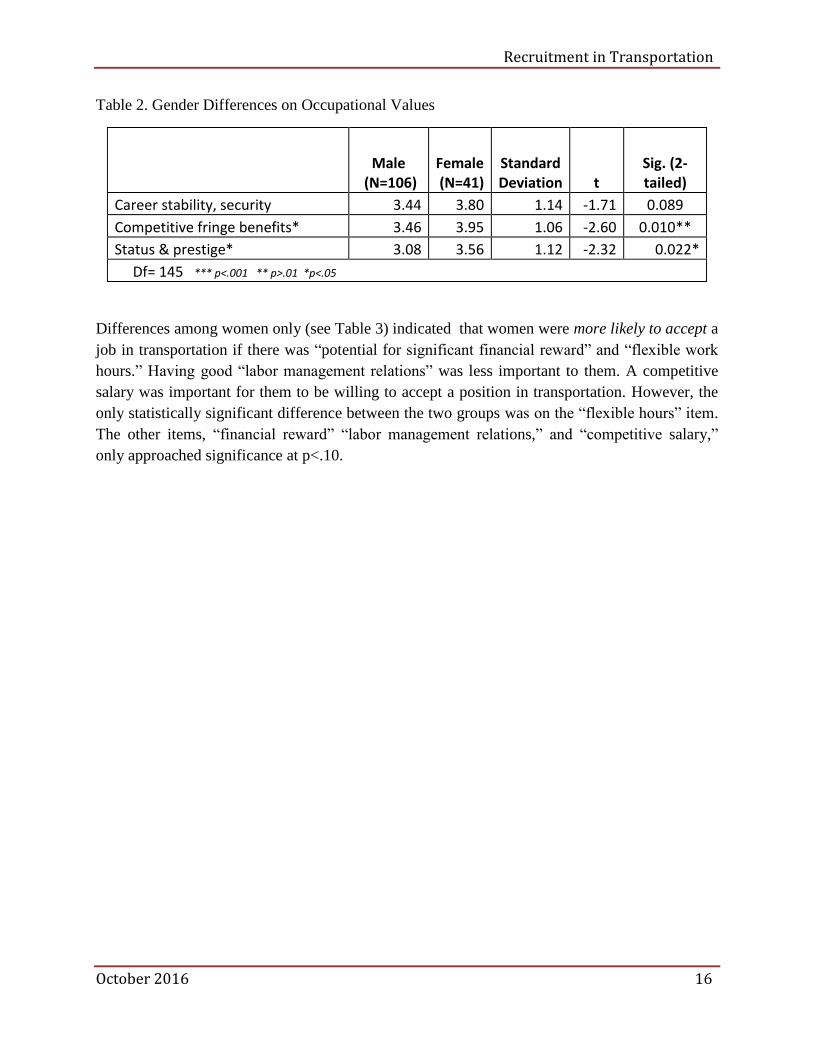
Investigating gender-specific variation in occupational values between men and women revealed
a few significant differences. Specifically, women preferred career stability, competitive fringe
benefits, and status and prestige.
Recruitment in Transportation
October 2016 16
Table 2. Gender Differences on Occupational Values
Male (N=106)
Female (N=41)
Standard Deviation t
Sig. (2-tailed)
Career stability, security 3.44 3.80 1.14 -1.71 0.089
Competitive fringe benefits* 3.46 3.95 1.06 -2.60 0.010**
Status & prestige* 3.08 3.56 1.12 -2.32 0.022*
Df= 145 *** p<.001 ** p>.01 *p<.05
Differences among women only (see Table 3) indicated that women were more likely to accept a
job in transportation if there was “potential for significant financial reward” and “flexible work
hours.” Having good “labor management relations” was less important to them. A competitive
salary was important for them to be willing to accept a position in transportation. However, the
only statistically significant difference between the two groups was on the “flexible hours” item.
The other items, “financial reward” “labor management relations,” and “competitive salary,”
only approached significance at p<.10.
Recruitment in Transportation
October 2016 17
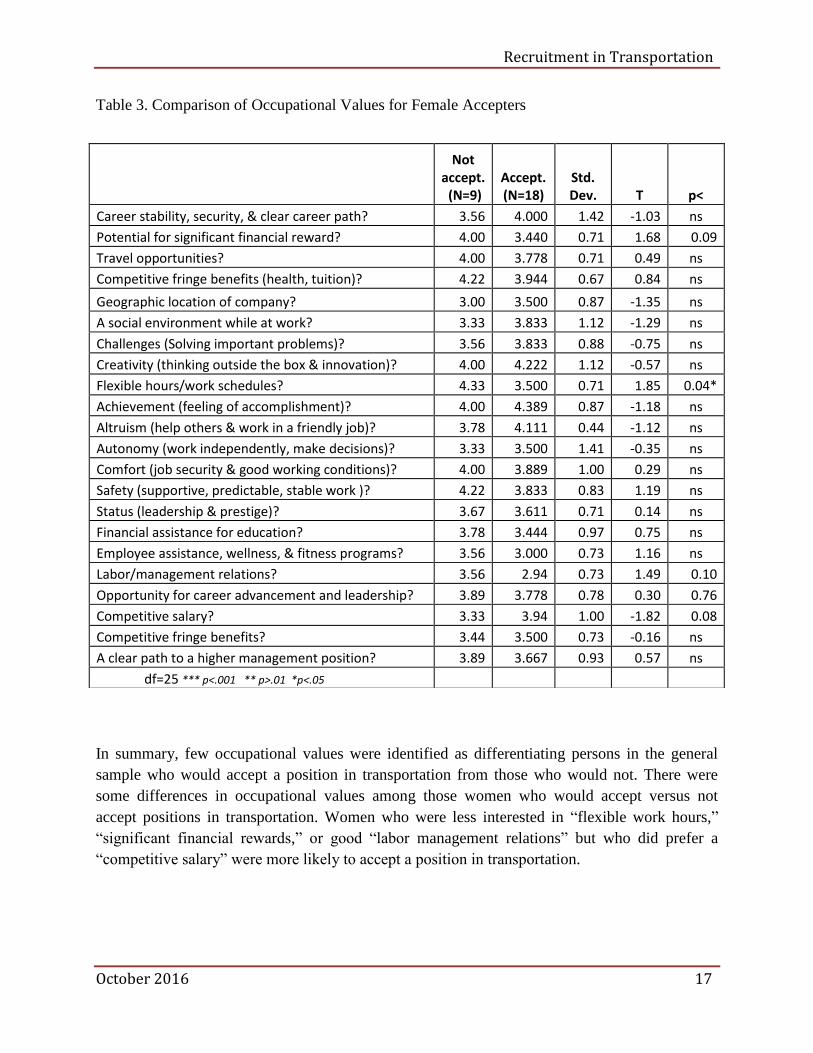
Table 3. Comparison of Occupational Values for Female Accepters
In summary, few occupational values were identified as differentiating persons in the general
sample who would accept a position in transportation from those who would not. There were
some differences in occupational values among those women who would accept versus not
accept positions in transportation. Women who were less interested in “flexible work hours,”
“significant financial rewards,” or good “labor management relations” but who did prefer a
“competitive salary” were more likely to accept a position in transportation.
Not accept. (N=9)
Accept. (N=18)
Std. Dev. T p<
Career stability, security, & clear career path? 3.56 4.000 1.42 -1.03 ns
Potential for significant financial reward? 4.00 3.440 0.71 1.68 0.09
Travel opportunities? 4.00 3.778 0.71 0.49 ns
Competitive fringe benefits (health, tuition)? 4.22 3.944 0.67 0.84 ns
Geographic location of company? 3.00 3.500 0.87 -1.35 ns
A social environment while at work? 3.33 3.833 1.12 -1.29 ns
Challenges (Solving important problems)? 3.56 3.833 0.88 -0.75 ns
Creativity (thinking outside the box & innovation)? 4.00 4.222 1.12 -0.57 ns
Flexible hours/work schedules? 4.33 3.500 0.71 1.85 0.04*
Achievement (feeling of accomplishment)? 4.00 4.389 0.87 -1.18 ns
Altruism (help others & work in a friendly job)? 3.78 4.111 0.44 -1.12 ns
Autonomy (work independently, make decisions)? 3.33 3.500 1.41 -0.35 ns
Comfort (job security & good working conditions)? 4.00 3.889 1.00 0.29 ns
Safety (supportive, predictable, stable work )? 4.22 3.833 0.83 1.19 ns
Status (leadership & prestige)? 3.67 3.611 0.71 0.14 ns
Financial assistance for education? 3.78 3.444 0.97 0.75 ns
Employee assistance, wellness, & fitness programs? 3.56 3.000 0.73 1.16 ns
Labor/management relations? 3.56 2.94 0.73 1.49 0.10
Opportunity for career advancement and leadership? 3.89 3.778 0.78 0.30 0.76
Competitive salary? 3.33 3.94 1.00 -1.82 0.08
Competitive fringe benefits? 3.44 3.500 0.73 -0.16 ns
A clear path to a higher management position? 3.89 3.667 0.93 0.57 ns
df=25 *** p<.001 ** p>.01 *p<.05
Recruitment in Transportation
October 2016 18
Vocational Interests
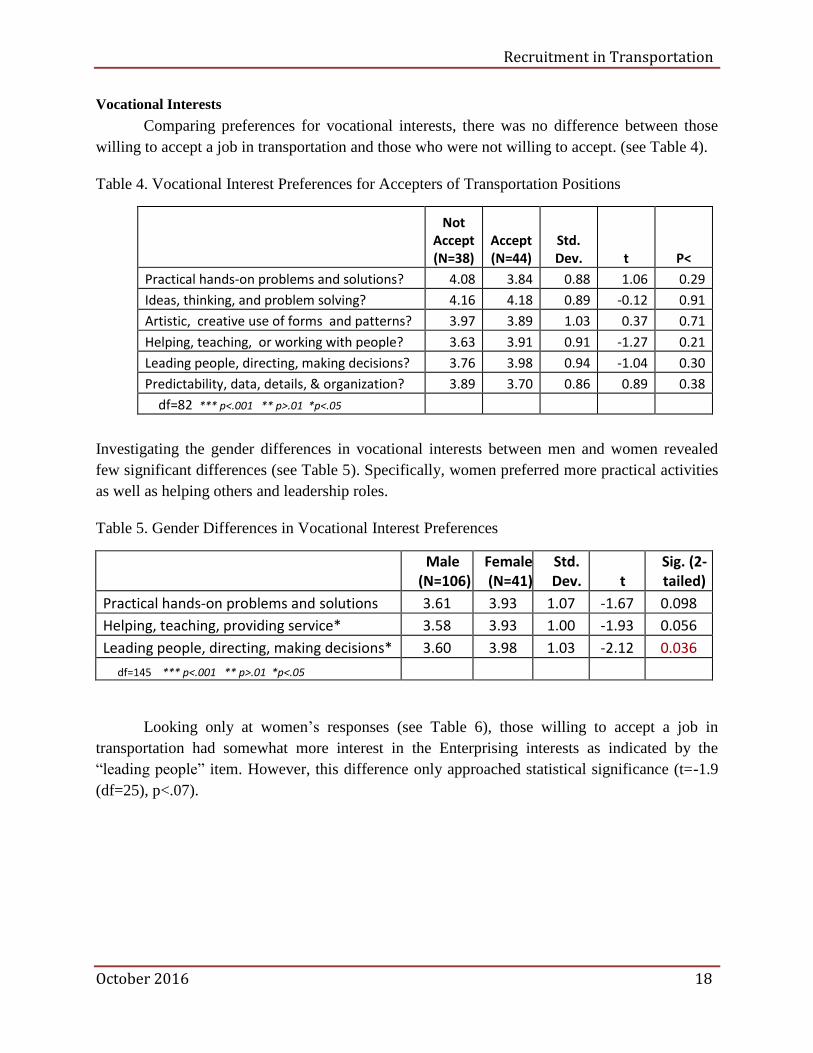
Comparing preferences for vocational interests, there was no difference between those
willing to accept a job in transportation and those who were not willing to accept. (see Table 4).
Table 4. Vocational Interest Preferences for Accepters of Transportation Positions
Not Accept (N=38)
Accept (N=44)
Std. Dev. t P<
Practical hands-on problems and solutions? 4.08 3.84 0.88 1.06 0.29
Ideas, thinking, and problem solving? 4.16 4.18 0.89 -0.12 0.91
Artistic, creative use of forms and patterns? 3.97 3.89 1.03 0.37 0.71
Helping, teaching, or working with people? 3.63 3.91 0.91 -1.27 0.21
Leading people, directing, making decisions? 3.76 3.98 0.94 -1.04 0.30
Predictability, data, details, & organization? 3.89 3.70 0.86 0.89 0.38
df=82 *** p<.001 ** p>.01 *p<.05
Investigating the gender differences in vocational interests between men and women revealed
few significant differences (see Table 5). Specifically, women preferred more practical activities
as well as helping others and leadership roles.
Table 5. Gender Differences in Vocational Interest Preferences
Male
(N=106) Female (N=41)
Std. Dev. t
Sig. (2-tailed)
Practical hands-on problems and solutions 3.61 3.93 1.07 -1.67 0.098
Helping, teaching, providing service* 3.58 3.93 1.00 -1.93 0.056
Leading people, directing, making decisions* 3.60 3.98 1.03 -2.12 0.036
df=145 *** p<.001 ** p>.01 *p<.05
Looking only at women’s responses (see Table 6), those willing to accept a job in
transportation had somewhat more interest in the Enterprising interests as indicated by the
“leading people” item. However, this difference only approached statistical significance (t=-1.9
(df=25), p<.07).
Recruitment in Transportation
October 2016 19
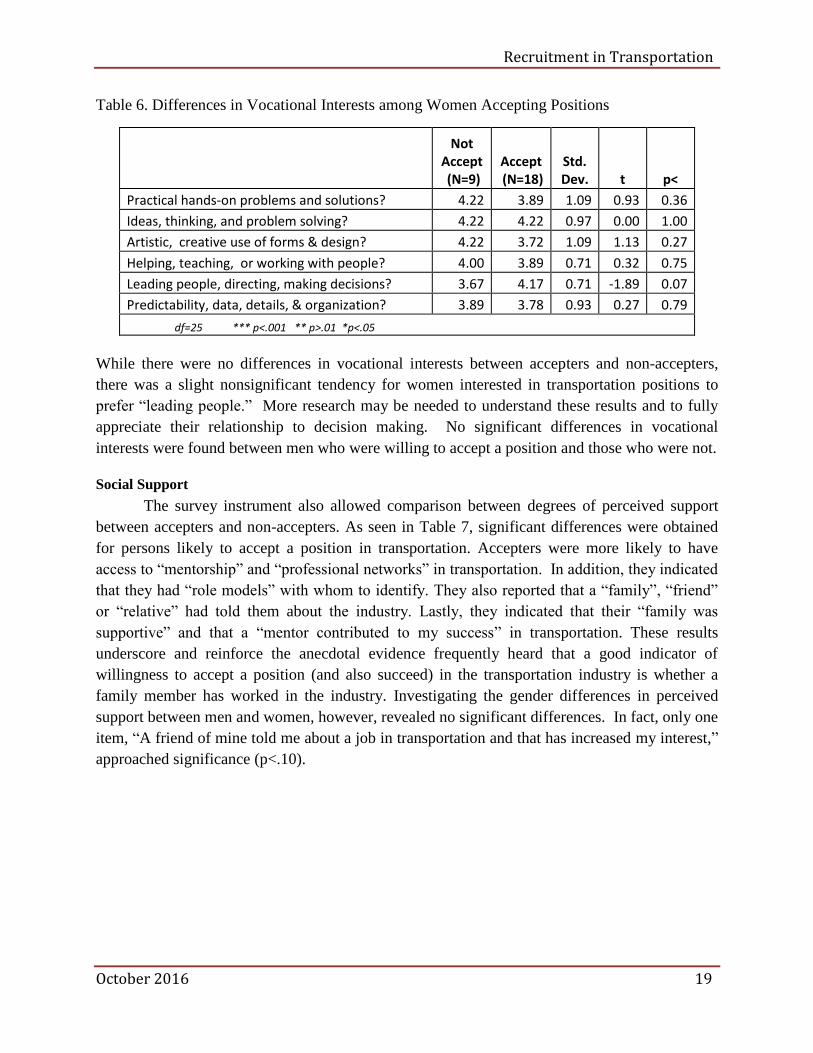
Table 6. Differences in Vocational Interests among Women Accepting Positions
Not Accept (N=9)
Accept (N=18)
Std. Dev. t p<
Practical hands-on problems and solutions? 4.22 3.89 1.09 0.93 0.36
Ideas, thinking, and problem solving? 4.22 4.22 0.97 0.00 1.00
Artistic, creative use of forms & design? 4.22 3.72 1.09 1.13 0.27
Helping, teaching, or working with people? 4.00 3.89 0.71 0.32 0.75
Leading people, directing, making decisions? 3.67 4.17 0.71 -1.89 0.07
Predictability, data, details, & organization? 3.89 3.78 0.93 0.27 0.79
df=25 *** p<.001 ** p>.01 *p<.05
While there were no differences in vocational interests between accepters and non-accepters,
there was a slight nonsignificant tendency for women interested in transportation positions to
prefer “leading people.” More research may be needed to understand these results and to fully
appreciate their relationship to decision making. No significant differences in vocational
interests were found between men who were willing to accept a position and those who were not.
Social Support
The survey instrument also allowed comparison between degrees of perceived support
between accepters and non-accepters. As seen in Table 7, significant differences were obtained
for persons likely to accept a position in transportation. Accepters were more likely to have
access to “mentorship” and “professional networks” in transportation. In addition, they indicated
that they had “role models” with whom to identify. They also reported that a “family”, “friend”
or “relative” had told them about the industry. Lastly, they indicated that their “family was
supportive” and that a “mentor contributed to my success” in transportation. These results
underscore and reinforce the anecdotal evidence frequently heard that a good indicator of
willingness to accept a position (and also succeed) in the transportation industry is whether a
family member has worked in the industry. Investigating the gender differences in perceived
support between men and women, however, revealed no significant differences. In fact, only one
item, “A friend of mine told me about a job in transportation and that has increased my interest,”
approached significance (p<.10).
Recruitment in Transportation
October 2016 20
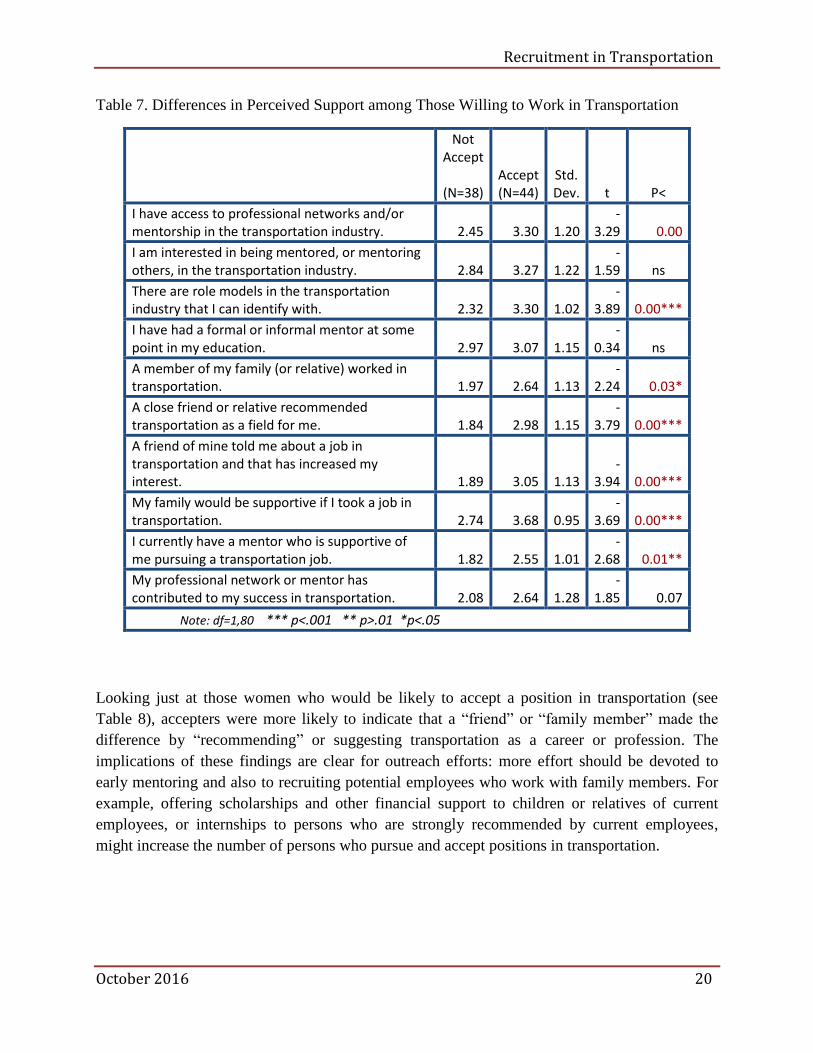
Table 7. Differences in Perceived Support among Those Willing to Work in Transportation
Not Accept
(N=38)
Accept (N=44)
Std. Dev. t P<
I have access to professional networks and/or mentorship in the transportation industry. 2.45 3.30 1.20
-3.29 0.00
I am interested in being mentored, or mentoring others, in the transportation industry. 2.84 3.27 1.22
-1.59 ns
There are role models in the transportation industry that I can identify with. 2.32 3.30 1.02
-3.89 0.00***
I have had a formal or informal mentor at some point in my education. 2.97 3.07 1.15
-0.34 ns
A member of my family (or relative) worked in transportation. 1.97 2.64 1.13
-2.24 0.03*
A close friend or relative recommended transportation as a field for me. 1.84 2.98 1.15
-3.79 0.00***
A friend of mine told me about a job in transportation and that has increased my interest. 1.89 3.05 1.13
-3.94 0.00***
My family would be supportive if I took a job in transportation. 2.74 3.68 0.95
-3.69 0.00***
I currently have a mentor who is supportive of me pursuing a transportation job. 1.82 2.55 1.01
-2.68 0.01**
My professional network or mentor has contributed to my success in transportation. 2.08 2.64 1.28
-1.85 0.07
Note: df=1,80 *** p<.001 ** p>.01 *p<.05
Looking just at those women who would be likely to accept a position in transportation (see
Table 8), accepters were more likely to indicate that a “friend” or “family member” made the
difference by “recommending” or suggesting transportation as a career or profession. The
implications of these findings are clear for outreach efforts: more effort should be devoted to
early mentoring and also to recruiting potential employees who work with family members. For
example, offering scholarships and other financial support to children or relatives of current
employees, or internships to persons who are strongly recommended by current employees,
might increase the number of persons who pursue and accept positions in transportation.
Recruitment in Transportation
October 2016 21
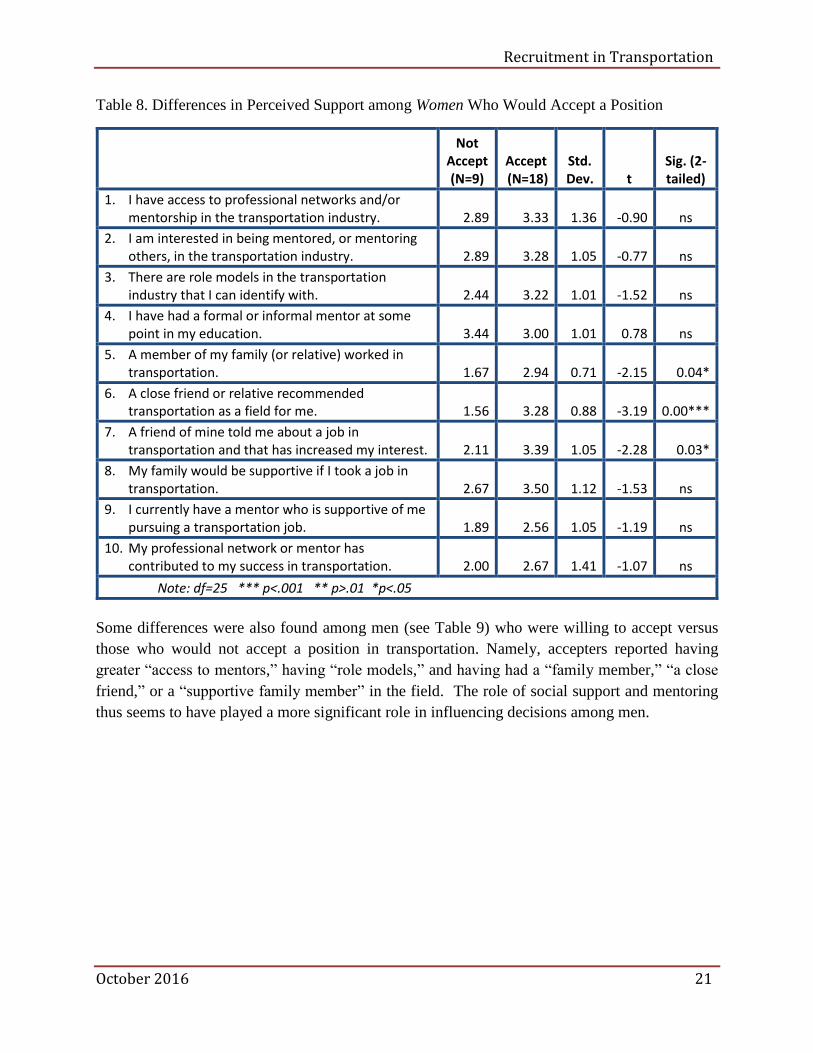
Table 8. Differences in Perceived Support among Women Who Would Accept a Position
Not Accept (N=9)
Accept (N=18)
Std. Dev. t
Sig. (2-tailed)
1. I have access to professional networks and/or mentorship in the transportation industry. 2.89 3.33 1.36 -0.90 ns
2. I am interested in being mentored, or mentoring others, in the transportation industry. 2.89 3.28 1.05 -0.77 ns
3. There are role models in the transportation industry that I can identify with. 2.44 3.22 1.01 -1.52 ns
4. I have had a formal or informal mentor at some point in my education. 3.44 3.00 1.01 0.78 ns
5. A member of my family (or relative) worked in transportation. 1.67 2.94 0.71 -2.15 0.04*
6. A close friend or relative recommended transportation as a field for me. 1.56 3.28 0.88 -3.19 0.00***
7. A friend of mine told me about a job in transportation and that has increased my interest. 2.11 3.39 1.05 -2.28 0.03*
8. My family would be supportive if I took a job in transportation. 2.67 3.50 1.12 -1.53 ns
9. I currently have a mentor who is supportive of me pursuing a transportation job. 1.89 2.56 1.05 -1.19 ns
10. My professional network or mentor has contributed to my success in transportation. 2.00 2.67 1.41 -1.07 ns
Note: df=25 *** p<.001 ** p>.01 *p<.05
Some differences were also found among men (see Table 9) who were willing to accept versus
those who would not accept a position in transportation. Namely, accepters reported having
greater “access to mentors,” having “role models,” and having had a “family member,” “a close
friend,” or a “supportive family member” in the field. The role of social support and mentoring
thus seems to have played a more significant role in influencing decisions among men.
Recruitment in Transportation
October 2016 22
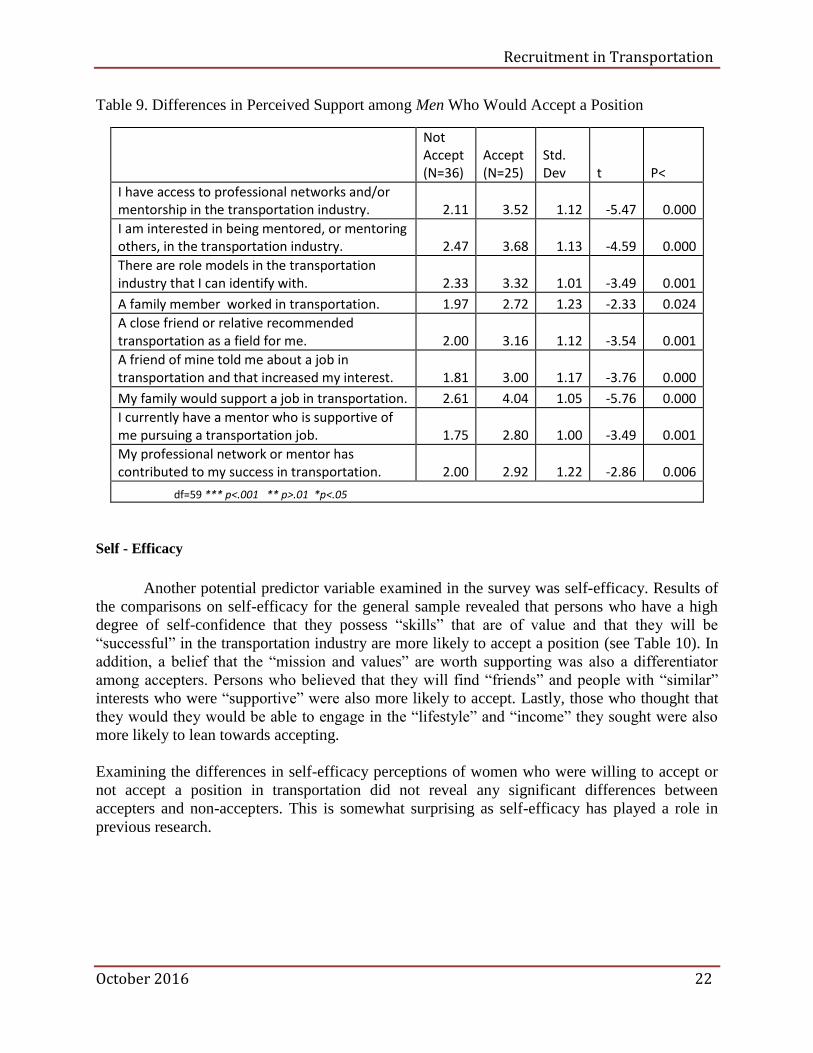
Table 9. Differences in Perceived Support among Men Who Would Accept a Position
Not Accept (N=36)
Accept (N=25)
Std. Dev t P<
I have access to professional networks and/or mentorship in the transportation industry. 2.11 3.52 1.12 -5.47 0.000
I am interested in being mentored, or mentoring others, in the transportation industry. 2.47 3.68 1.13 -4.59 0.000
There are role models in the transportation industry that I can identify with. 2.33 3.32 1.01 -3.49 0.001
A family member worked in transportation. 1.97 2.72 1.23 -2.33 0.024
A close friend or relative recommended transportation as a field for me. 2.00 3.16 1.12 -3.54 0.001
A friend of mine told me about a job in transportation and that increased my interest. 1.81 3.00 1.17 -3.76 0.000
My family would support a job in transportation. 2.61 4.04 1.05 -5.76 0.000
I currently have a mentor who is supportive of me pursuing a transportation job. 1.75 2.80 1.00 -3.49 0.001
My professional network or mentor has contributed to my success in transportation. 2.00 2.92 1.22 -2.86 0.006
df=59 *** p<.001 ** p>.01 *p<.05
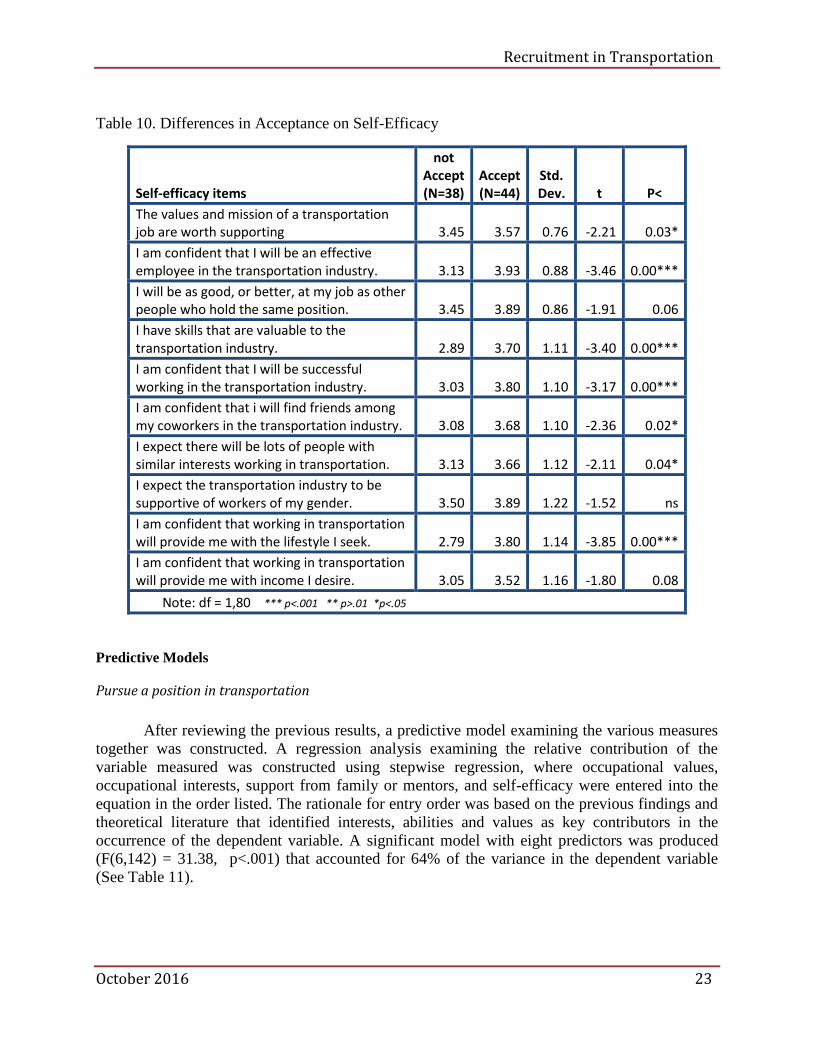
Self - Efficacy
Another potential predictor variable examined in the survey was self-efficacy. Results of
the comparisons on self-efficacy for the general sample revealed that persons who have a high
degree of self-confidence that they possess “skills” that are of value and that they will be
“successful” in the transportation industry are more likely to accept a position (see Table 10). In
addition, a belief that the “mission and values” are worth supporting was also a differentiator
among accepters. Persons who believed that they will find “friends” and people with “similar”
interests who were “supportive” were also more likely to accept. Lastly, those who thought that
they would they would be able to engage in the “lifestyle” and “income” they sought were also
more likely to lean towards accepting.
Examining the differences in self-efficacy perceptions of women who were willing to accept or
not accept a position in transportation did not reveal any significant differences between
accepters and non-accepters. This is somewhat surprising as self-efficacy has played a role in
previous research.
Recruitment in Transportation
October 2016 23
Table 10. Differences in Acceptance on Self-Efficacy
Self-efficacy items
not Accept (N=38)
Accept (N=44)
Std. Dev. t P<
The values and mission of a transportation job are worth supporting 3.45 3.57 0.76 -2.21 0.03*
I am confident that I will be an effective employee in the transportation industry. 3.13 3.93 0.88 -3.46 0.00***
I will be as good, or better, at my job as other people who hold the same position. 3.45 3.89 0.86 -1.91 0.06
I have skills that are valuable to the transportation industry. 2.89 3.70 1.11 -3.40 0.00***
I am confident that I will be successful working in the transportation industry. 3.03 3.80 1.10 -3.17 0.00***
I am confident that i will find friends among my coworkers in the transportation industry. 3.08 3.68 1.10 -2.36 0.02*
I expect there will be lots of people with similar interests working in transportation. 3.13 3.66 1.12 -2.11 0.04*
I expect the transportation industry to be supportive of workers of my gender. 3.50 3.89 1.22 -1.52 ns
I am confident that working in transportation will provide me with the lifestyle I seek. 2.79 3.80 1.14 -3.85 0.00***
I am confident that working in transportation will provide me with income I desire. 3.05 3.52 1.16 -1.80 0.08
Note: df = 1,80 *** p<.001 ** p>.01 *p<.05
Predictive Models
Pursue a position in transportation
After reviewing the previous results, a predictive model examining the various measures
together was constructed. A regression analysis examining the relative contribution of the
variable measured was constructed using stepwise regression, where occupational values,
occupational interests, support from family or mentors, and self-efficacy were entered into the
equation in the order listed. The rationale for entry order was based on the previous findings and
theoretical literature that identified interests, abilities and values as key contributors in the
occurrence of the dependent variable. A significant model with eight predictors was produced
(F(6,142) = 31.38, p<.001) that accounted for 64% of the variance in the dependent variable
(See Table 11).
Recruitment in Transportation
October 2016 24
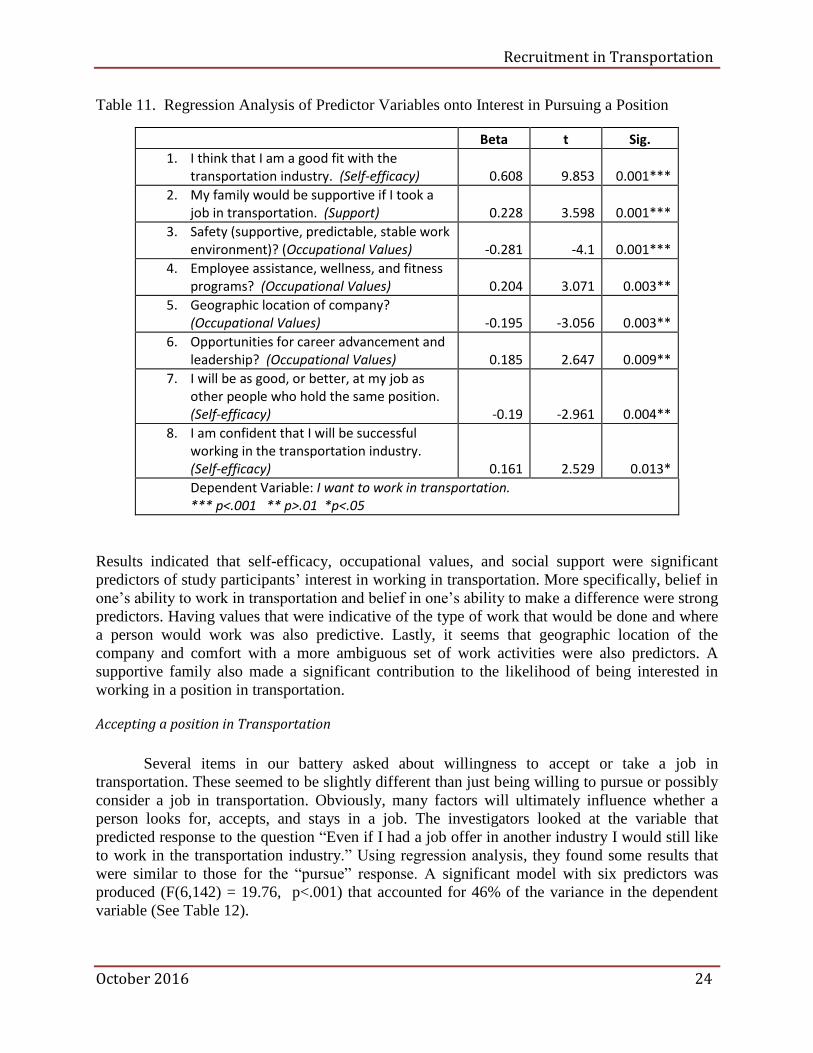
Table 11. Regression Analysis of Predictor Variables onto Interest in Pursuing a Position
Beta t Sig.
1. I think that I am a good fit with the transportation industry. (Self-efficacy) 0.608 9.853 0.001***
2. My family would be supportive if I took a job in transportation. (Support) 0.228 3.598 0.001***
3. Safety (supportive, predictable, stable work environment)? (Occupational Values) -0.281 -4.1 0.001***
4. Employee assistance, wellness, and fitness programs? (Occupational Values) 0.204 3.071 0.003**
5. Geographic location of company? (Occupational Values) -0.195 -3.056 0.003**
6. Opportunities for career advancement and leadership? (Occupational Values) 0.185 2.647 0.009**
7. I will be as good, or better, at my job as other people who hold the same position. (Self-efficacy) -0.19 -2.961 0.004**
8. I am confident that I will be successful working in the transportation industry. (Self-efficacy) 0.161 2.529 0.013*
Dependent Variable: I want to work in transportation. *** p<.001 ** p>.01 *p<.05
Results indicated that self-efficacy, occupational values, and social support were significant
predictors of study participants’ interest in working in transportation. More specifically, belief in
one’s ability to work in transportation and belief in one’s ability to make a difference were strong
predictors. Having values that were indicative of the type of work that would be done and where
a person would work was also predictive. Lastly, it seems that geographic location of the
company and comfort with a more ambiguous set of work activities were also predictors. A
supportive family also made a significant contribution to the likelihood of being interested in
working in a position in transportation.
Accepting a position in Transportation
Several items in our battery asked about willingness to accept or take a job in
transportation. These seemed to be slightly different than just being willing to pursue or possibly
consider a job in transportation. Obviously, many factors will ultimately influence whether a
person looks for, accepts, and stays in a job. The investigators looked at the variable that
predicted response to the question “Even if I had a job offer in another industry I would still like
to work in the transportation industry.” Using regression analysis, they found some results that
were similar to those for the “pursue” response. A significant model with six predictors was
produced (F(6,142) = 19.76, p<.001) that accounted for 46% of the variance in the dependent
variable (See Table 12).
Recruitment in Transportation
October 2016 25
Table 12. Regression Analysis of Variables onto Interest in Pursuing Jobs Transportation
Item Beta t Sig.
1. I think that I am a good fit with the transportation industry. (Self-efficacy) 0.321 4.228 0.000***
2. I expect to be satisfied with the kind of work I do in this job. (Self-efficacy) 0.275 3.555 0.001***
3. There are role models in the transportation industry that I can identify with. (Support) 0.279 3.787 0.001***
4. I am interested in being mentored, or mentoring others, in the transportation industry. (Support) -0.208
-2.649 0.009**
5. Potential for significant financial reward? (Occupational Values) -0.226
-3.368 0.001***
6. I expect to be satisfied with my job including the hours and amount of work. (Self-efficacy) 0.219 2.788 0.006**
Dependent Variable: I want to work in transportation. *** p<.001 ** p>.01 *p<.05
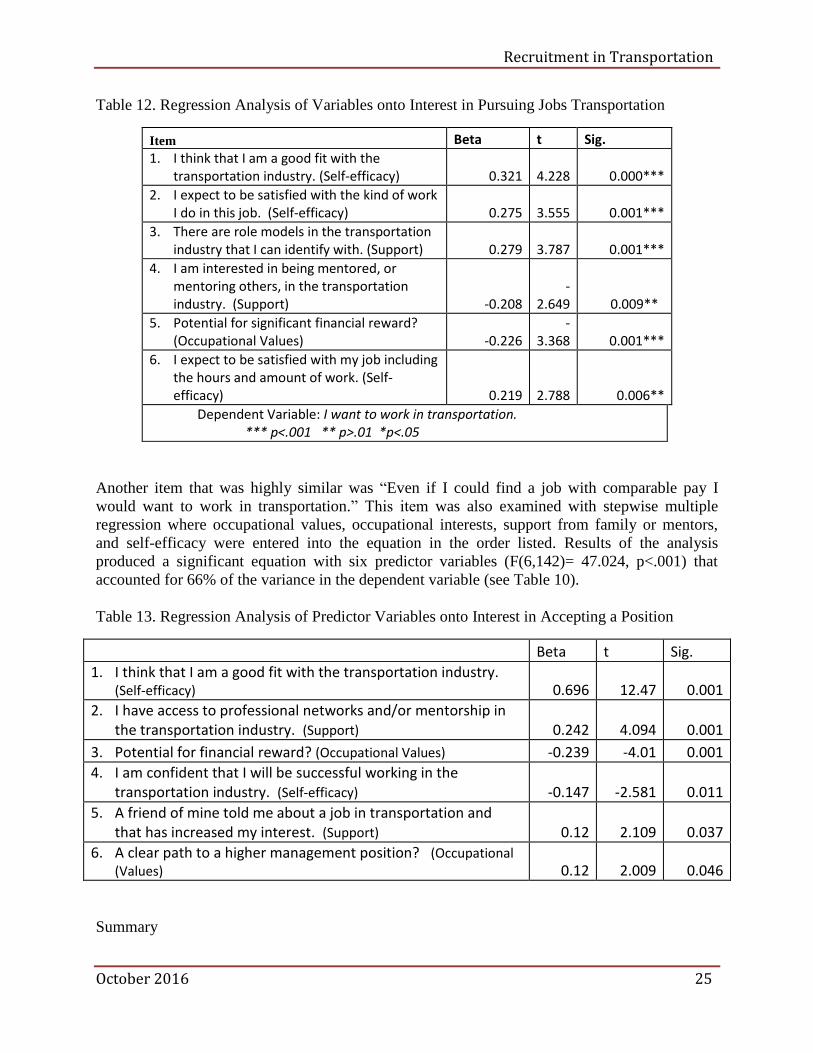
Another item that was highly similar was “Even if I could find a job with comparable pay I
would want to work in transportation.” This item was also examined with stepwise multiple
regression where occupational values, occupational interests, support from family or mentors,
and self-efficacy were entered into the equation in the order listed. Results of the analysis
produced a significant equation with six predictor variables (F(6,142)= 47.024, p<.001) that
accounted for 66% of the variance in the dependent variable (see Table 10).
Table 13. Regression Analysis of Predictor Variables onto Interest in Accepting a Position
Beta t Sig.
1. I think that I am a good fit with the transportation industry. (Self-efficacy) 0.696 12.47 0.001
2. I have access to professional networks and/or mentorship in the transportation industry. (Support) 0.242 4.094 0.001
3. Potential for financial reward? (Occupational Values) -0.239 -4.01 0.001
4. I am confident that I will be successful working in the transportation industry. (Self-efficacy) -0.147 -2.581 0.011
5. A friend of mine told me about a job in transportation and that has increased my interest. (Support) 0.12 2.109 0.037
6. A clear path to a higher management position? (Occupational (Values) 0.12 2.009 0.046
Summary
Recruitment in Transportation
October 2016 26
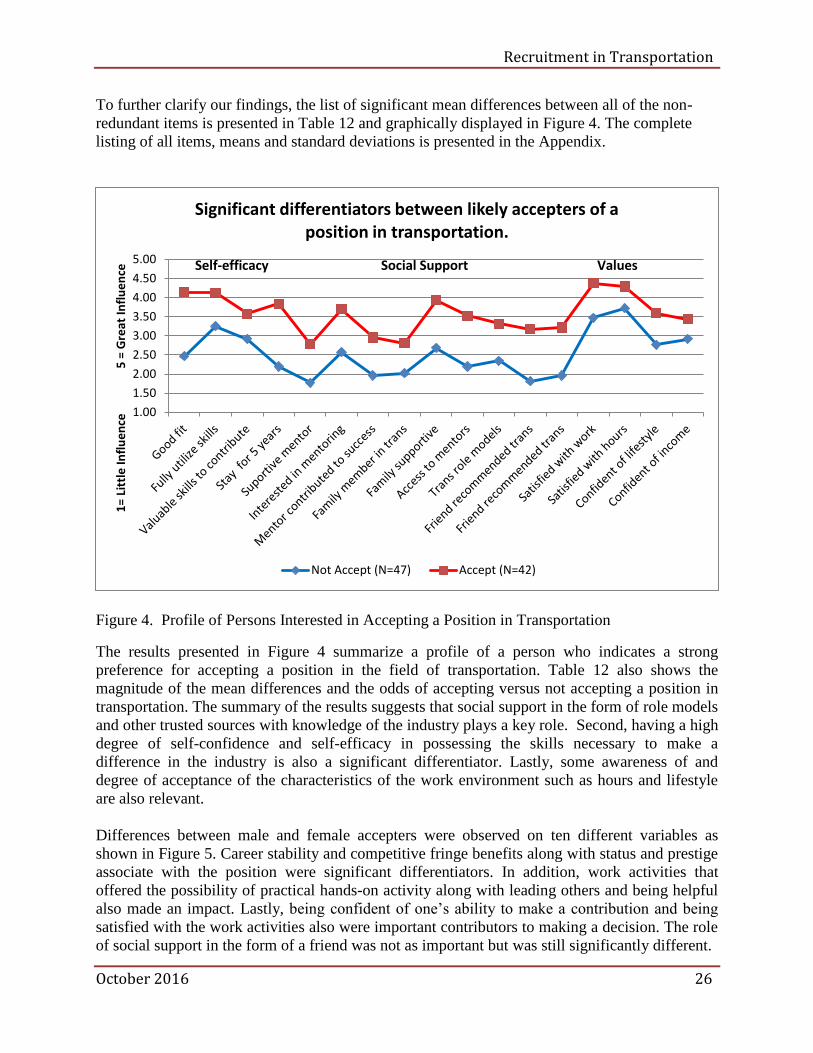
To further clarify our findings, the list of significant mean differences between all of the non-
redundant items is presented in Table 12 and graphically displayed in Figure 4. The complete
listing of all items, means and standard deviations is presented in the Appendix.
Figure 4. Profile of Persons Interested in Accepting a Position in Transportation
The results presented in Figure 4 summarize a profile of a person who indicates a strong
preference for accepting a position in the field of transportation. Table 12 also shows the
magnitude of the mean differences and the odds of accepting versus not accepting a position in
transportation. The summary of the results suggests that social support in the form of role models
and other trusted sources with knowledge of the industry plays a key role. Second, having a high
degree of self-confidence and self-efficacy in possessing the skills necessary to make a
difference in the industry is also a significant differentiator. Lastly, some awareness of and
degree of acceptance of the characteristics of the work environment such as hours and lifestyle
are also relevant.
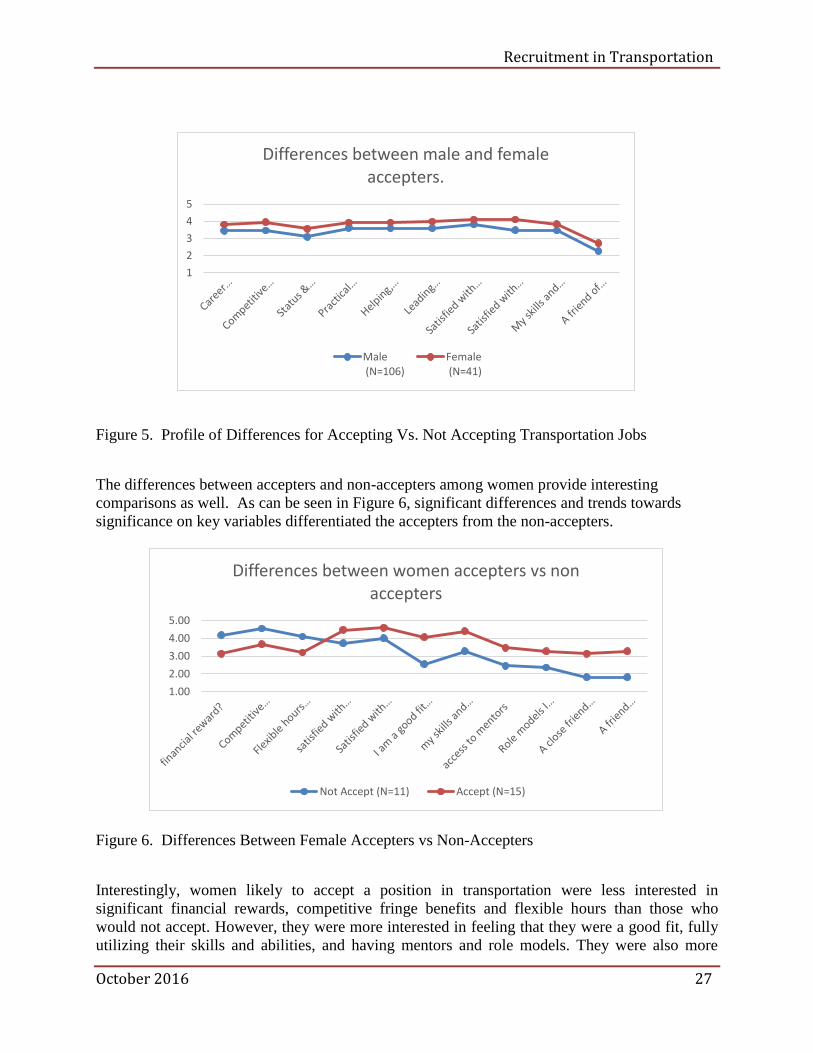
Differences between male and female accepters were observed on ten different variables as
shown in Figure 5. Career stability and competitive fringe benefits along with status and prestige
associate with the position were significant differentiators. In addition, work activities that
offered the possibility of practical hands-on activity along with leading others and being helpful
also made an impact. Lastly, being confident of one’s ability to make a contribution and being
satisfied with the work activities also were important contributors to making a decision. The role
of social support in the form of a friend was not as important but was still significantly different.
1.00
1.50
2.00
2.50
3.00
3.50
4.00
4.50
5.00
1=
Litt
le In
flu
en
ce
5 =
Gre
at In
flu
en
ce
Significant differentiators between likely accepters of a position in transportation.
Not Accept (N=47) Accept (N=42)
Self-efficacy Social Support Values
Recruitment in Transportation
October 2016 27
Figure 5. Profile of Differences for Accepting Vs. Not Accepting Transportation Jobs
The differences between accepters and non-accepters among women provide interesting
comparisons as well. As can be seen in Figure 6, significant differences and trends towards
significance on key variables differentiated the accepters from the non-accepters.
Figure 6. Differences Between Female Accepters vs Non-Accepters
Interestingly, women likely to accept a position in transportation were less interested in
significant financial rewards, competitive fringe benefits and flexible hours than those who
would not accept. However, they were more interested in feeling that they were a good fit, fully
utilizing their skills and abilities, and having mentors and role models. They were also more
1
2
3
4
5
Differences between male and female accepters.
Male (N=106)
Female (N=41)
1.00
2.00
3.00
4.00
5.00
Differences between women accepters vs non accepters
Not Accept (N=11) Accept (N=15)
Recruitment in Transportation
October 2016 28
likely to have been influenced by a close friend or relative to consider a position in
transportation.
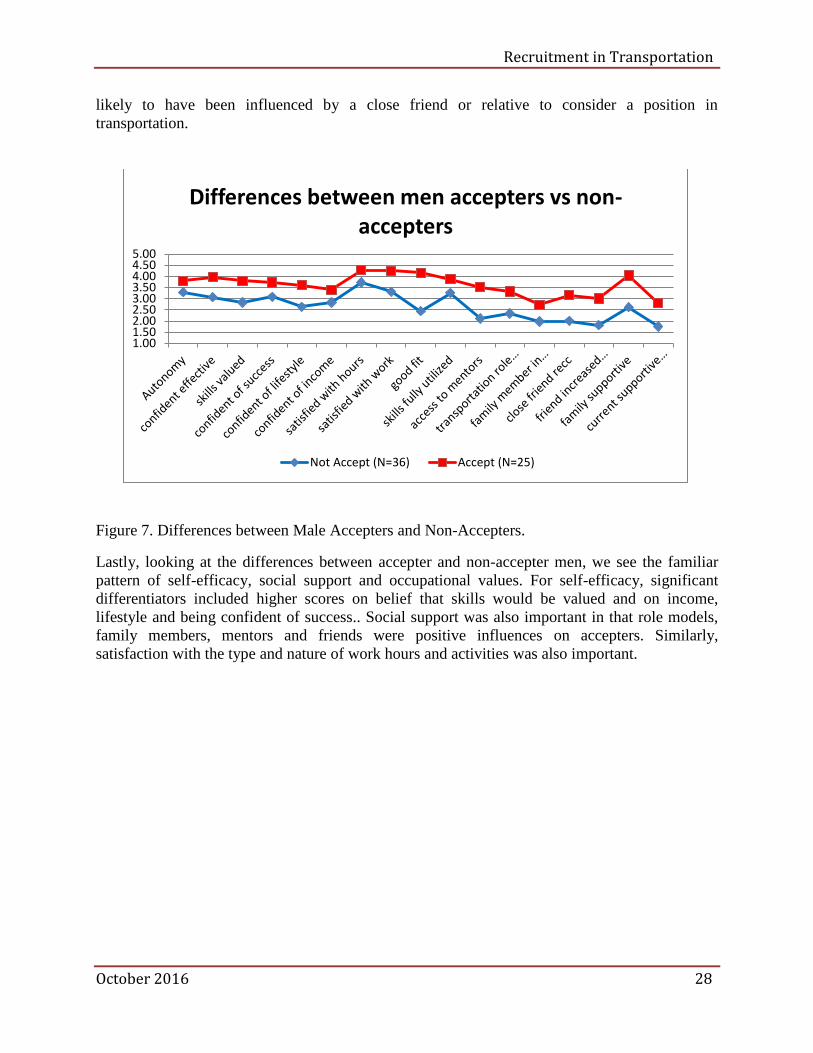
Figure 7. Differences between Male Accepters and Non-Accepters.
Lastly, looking at the differences between accepter and non-accepter men, we see the familiar
pattern of self-efficacy, social support and occupational values. For self-efficacy, significant
differentiators included higher scores on belief that skills would be valued and on income,
lifestyle and being confident of success.. Social support was also important in that role models,
family members, mentors and friends were positive influences on accepters. Similarly,
satisfaction with the type and nature of work hours and activities was also important.
1.001.502.002.503.003.504.004.505.00
Differences between men accepters vs non-accepters
Not Accept (N=36) Accept (N=25)
Recruitment in Transportation
October 2016 29
Odds of Accepting/Rejecting
The practical implications of these results are best seen when applied to selection interviews and
hiring. Indicators of what items and characteristics are most likely to lead to the identification of
a successful candidate (the responses to the items that were able to significantly differentiate
between accepters and non-accepters) were further analyzed. While the statistically significant
differences between means of assigned groups point to significant differences between the way
that people will respond, it is also important to understand the probability of accepting.
Interviewers and hiring managers will most likely want to understand the relative importance of
a particular response to an item. One way of determining the importance of a response is to
assess the odds of accepting or not accepting a position based on how the person responds. To
determine the odds, the data must be arranged in a two by two contingency table. Since the data
were originally obtained by using a five-point Likert response format, the decision to collapse
and dichotomize the data into relevant two by two matrices was made and a series of results was
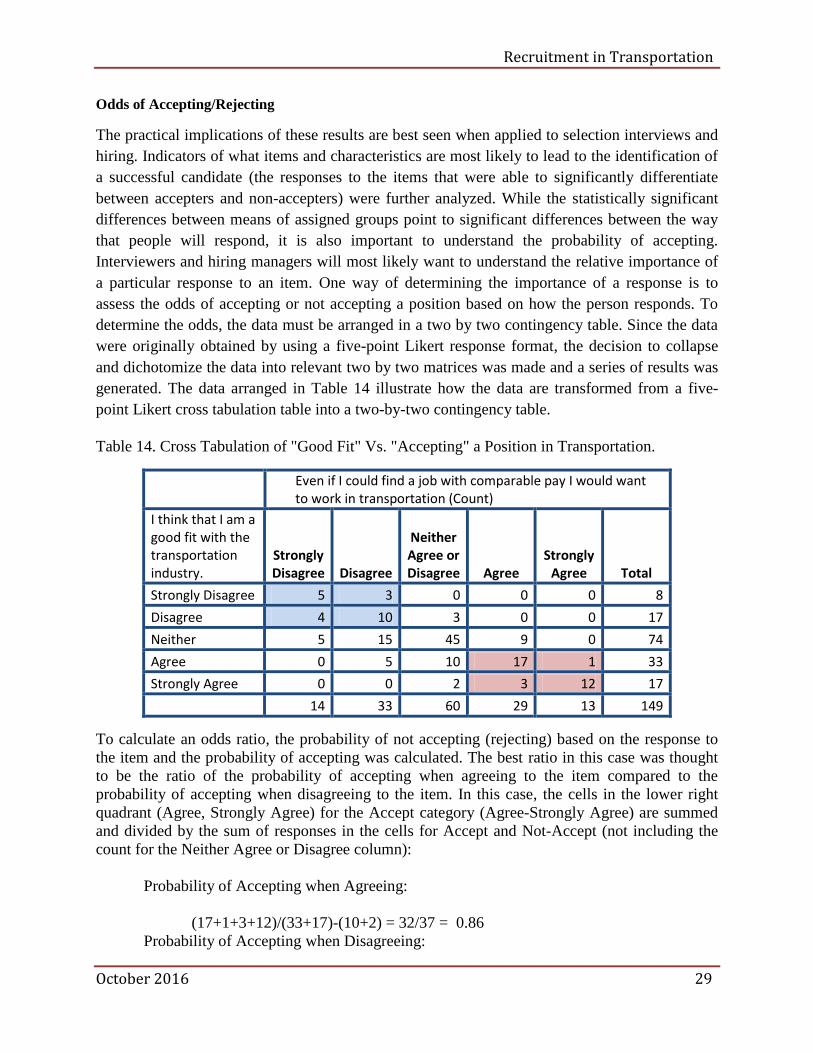
generated. The data arranged in Table 14 illustrate how the data are transformed from a five-
point Likert cross tabulation table into a two-by-two contingency table.
Table 14. Cross Tabulation of "Good Fit" Vs. "Accepting" a Position in Transportation.
Even if I could find a job with comparable pay I would want to work in transportation (Count)
I think that I am a good fit with the transportation industry.
Strongly Disagree Disagree
Neither Agree or Disagree Agree
Strongly Agree Total
Strongly Disagree 5 3 0 0 0 8
Disagree 4 10 3 0 0 17
Neither 5 15 45 9 0 74
Agree 0 5 10 17 1 33
Strongly Agree 0 0 2 3 12 17
14 33 60 29 13 149
To calculate an odds ratio, the probability of not accepting (rejecting) based on the response to
the item and the probability of accepting was calculated. The best ratio in this case was thought
to be the ratio of the probability of accepting when agreeing to the item compared to the
probability of accepting when disagreeing to the item. In this case, the cells in the lower right
quadrant (Agree, Strongly Agree) for the Accept category (Agree-Strongly Agree) are summed
and divided by the sum of responses in the cells for Accept and Not-Accept (not including the
count for the Neither Agree or Disagree column):
Probability of Accepting when Agreeing:
(17+1+3+12)/(33+17)-(10+2) = 32/37 = 0.86
Probability of Accepting when Disagreeing:
Recruitment in Transportation
October 2016 30
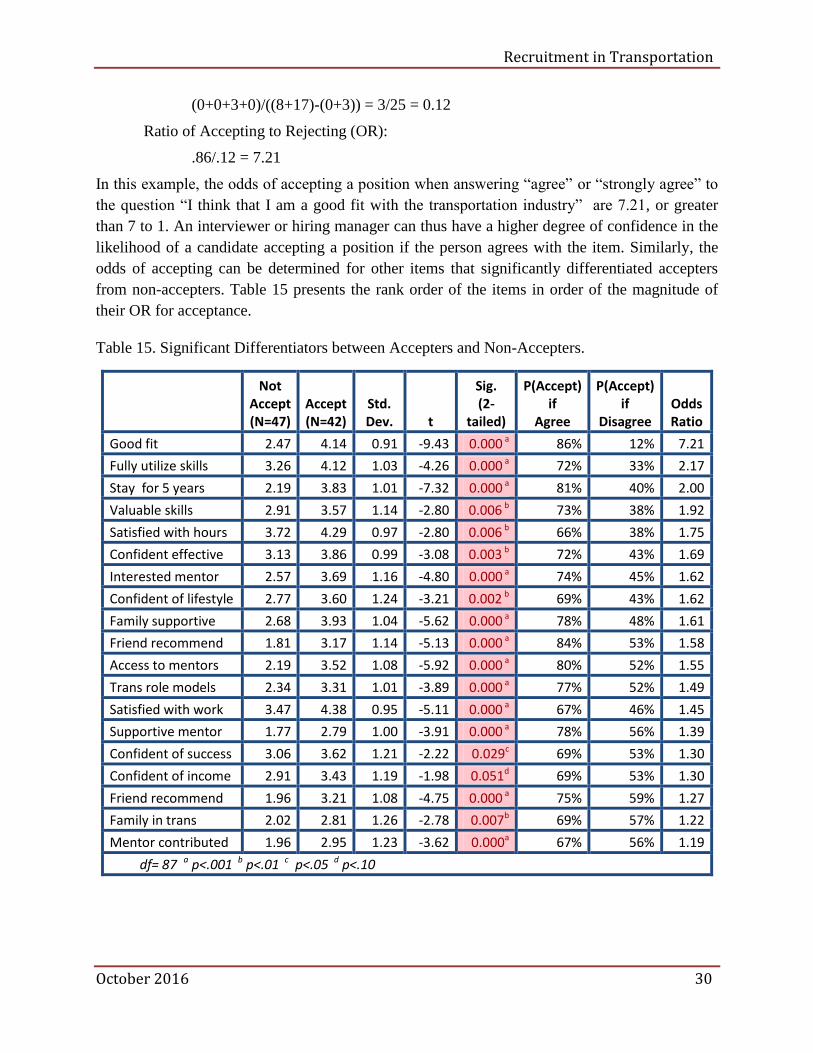
(0+0+3+0)/((8+17)-(0+3)) = 3/25 = 0.12
Ratio of Accepting to Rejecting (OR):
.86/.12 = 7.21
In this example, the odds of accepting a position when answering “agree” or “strongly agree” to
the question “I think that I am a good fit with the transportation industry” are 7.21, or greater
than 7 to 1. An interviewer or hiring manager can thus have a higher degree of confidence in the
likelihood of a candidate accepting a position if the person agrees with the item. Similarly, the
odds of accepting can be determined for other items that significantly differentiated accepters
from non-accepters. Table 15 presents the rank order of the items in order of the magnitude of
their OR for acceptance.
Table 15. Significant Differentiators between Accepters and Non-Accepters.
Not Accept (N=47)
Accept (N=42)
Std. Dev. t
Sig. (2-
tailed)
P(Accept) if
Agree
P(Accept) if
Disagree Odds Ratio
Good fit 2.47 4.14 0.91 -9.43 0.000 a 86% 12% 7.21
Fully utilize skills 3.26 4.12 1.03 -4.26 0.000 a 72% 33% 2.17
Stay for 5 years 2.19 3.83 1.01 -7.32 0.000 a 81% 40% 2.00
Valuable skills 2.91 3.57 1.14 -2.80 0.006 b 73% 38% 1.92
Satisfied with hours 3.72 4.29 0.97 -2.80 0.006 b 66% 38% 1.75
Confident effective 3.13 3.86 0.99 -3.08 0.003 b 72% 43% 1.69
Interested mentor 2.57 3.69 1.16 -4.80 0.000 a 74% 45% 1.62
Confident of lifestyle 2.77 3.60 1.24 -3.21 0.002 b 69% 43% 1.62
Family supportive 2.68 3.93 1.04 -5.62 0.000 a 78% 48% 1.61
Friend recommend 1.81 3.17 1.14 -5.13 0.000 a 84% 53% 1.58
Access to mentors 2.19 3.52 1.08 -5.92 0.000 a 80% 52% 1.55
Trans role models 2.34 3.31 1.01 -3.89 0.000 a 77% 52% 1.49
Satisfied with work 3.47 4.38 0.95 -5.11 0.000 a 67% 46% 1.45
Supportive mentor 1.77 2.79 1.00 -3.91 0.000 a 78% 56% 1.39
Confident of success 3.06 3.62 1.21 -2.22 0.029c 69% 53% 1.30
Confident of income 2.91 3.43 1.19 -1.98 0.051d 69% 53% 1.30
Friend recommend 1.96 3.21 1.08 -4.75 0.000 a 75% 59% 1.27
Family in trans 2.02 2.81 1.26 -2.78 0.007b 69% 57% 1.22
Mentor contributed 1.96 2.95 1.23 -3.62 0.000a 67% 56% 1.19
df= 87 a p<.001 b p<.01 c p<.05 d p<.10
Recruitment in Transportation
October 2016 31
Discussion
The results of this study point to a number of key findings about a varied sample of
individuals pursuing, accepting and remaining in a transportation job. The study determined that
for the general sample, 70% were not interested in or were unlikely to accept a job in
transportation. Put another way, only 30% were interested in possibly accepting a position in
transportation. It is apparent that the overall popularity of work in this field is not great.
Finding a low interest among members of the general population in transportation jobs is
not necessarily surprising. Similar results have been report by previous researchers (Philbrick &
Sherry, 2004). It should be noted that the transportation industry is not that large, as indicated by
the only 4,890,400 employees currently employed as reported by the BLS (2016). Consequently,
transportation organizations should probably focus their efforts and limited resources on those
who are highly likely to accept a position in transportation.
Because of the nonrandom nature of this sample, which could limit its generalizability,
different results may be found for different samples and geographic locations. However, these
results also point to a number of factors that are related to identifying persons who would be
interested in working in the transportation industry. Specifically, in this particular sample, those
who would accept a position in transportation were influenced by feelings of self-efficacy, social
support and the occupational values related to job characteristics.
Self-efficacy as a key factor in career decision-making has been studied for a number of
years beginning with Betz & Hackett (1981). The present results are consistent with past
research that has associated career decision self-efficacy with career choice (Quimby & O’Brien,
2004). In this study, self-efficacious beliefs and attitudes related to effectiveness and success in
the transportation industry clearly differentiated persons who were more likely to accept
positions in transportation from those who were less likely. Thus, the extent to which persons are
of the opinion that they can make a contribution and succeed in transportation can strongly
influence their decision to accept a position in transportation.
The results of the present study are also consistent with the notion that social support can
influence career decision and choice. The findings of Garcia et al. (2015) indicated that parental
and teacher social support were directly related to career decision-making and optimism relative
to career choice. Buday et al. (2012) also found that social support contributed directly to men's
and women's ability to envision themselves in a future science career, which in turn predicted
their interest in and motivation for a science career. In addition, Metheny & McWhirter (2013)
tested a model predicting career-related outcome expectations in a sample of 270 male and
female undergraduate students. Predictor variables included family support and family career-
related interactions. The results of their study suggested that family status and family support
were associated with career decisions. Results of the present study suggest that the contributions
of friends, family members, mentors and role models play a significant role in the decision to
accept a position in transportation.
Recruitment in Transportation
October 2016 32
Occupational values also contributed to the decision making process. As early as 1960,
Super showed that occupational values were strongly related to career choice and decision-
making. Carruthers (1968) demonstrated that different occupational groups endorsed different
occupational values. Duff & Cotgrove (1982) showed that the choices social science students
selected about values were related to choice of industry. Interestingly, Eley et al. (2010) found
that work and personal values were related to nurses’ decisions to leave the profession. More
recently, Abrahamsen (2015) showed that nurses’ later career choices were affected by career
values and that the tendency among undergraduate nursing students to choose care of older
people rather than general hospital care after graduation increased as their score on altruism
decreased. They concluded that the choice of clinical field after graduation correlates with
undergraduate nursing students’ perceived professional qualifications and job values.
Additionally, Weisgram, Dunella & Fulcher (2011) found that values were a larger contributing
factor to the traditionality of occupational choices than self-perceived masculinity/femininity. In
the present study, work values (specifically, financial rewards, career stability and advancement,
and to some extent geographic location) played a role in the prediction of career choice and
acceptance of positions in transportation. Financial rewards, however, were negatively related to
pursuing a position, In other words, individuals interested in high financial rewards were less
attracted to transportation. Similarly, geographic location was also negatively related to choosing
a career in transportation, suggesting that travel was less important than a specific location.
Taken together, the results support a model of career choice that combines self-efficacy,
work values, and social support in contributing to the decision to pursue or accept a position in
transportation.
Recruitment in Transportation
October 2016 33
Battery of Successful Screening Items
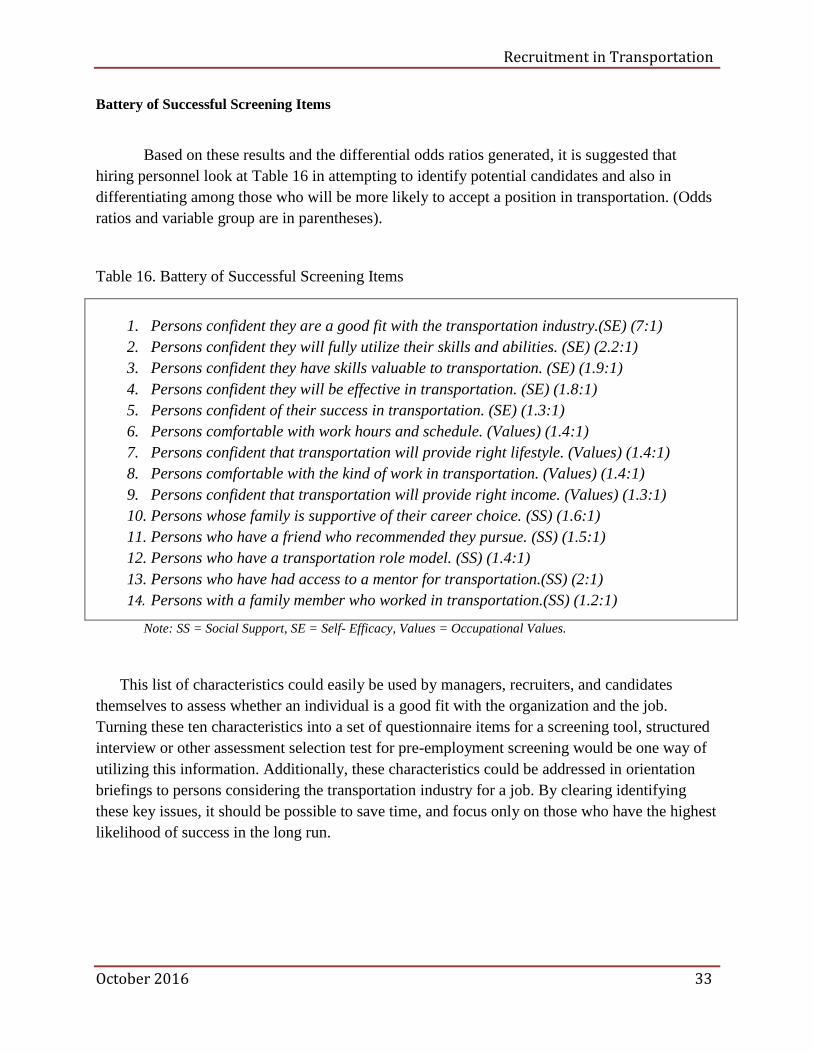
Based on these results and the differential odds ratios generated, it is suggested that
hiring personnel look at Table 16 in attempting to identify potential candidates and also in
differentiating among those who will be more likely to accept a position in transportation. (Odds
ratios and variable group are in parentheses).
Table 16. Battery of Successful Screening Items
1. Persons confident they are a good fit with the transportation industry.(SE) (7:1)
2. Persons confident they will fully utilize their skills and abilities. (SE) (2.2:1)
3. Persons confident they have skills valuable to transportation. (SE) (1.9:1)
4. Persons confident they will be effective in transportation. (SE) (1.8:1)
5. Persons confident of their success in transportation. (SE) (1.3:1)
6. Persons comfortable with work hours and schedule. (Values) (1.4:1)
7. Persons confident that transportation will provide right lifestyle. (Values) (1.4:1)
8. Persons comfortable with the kind of work in transportation. (Values) (1.4:1)
9. Persons confident that transportation will provide right income. (Values) (1.3:1)
10. Persons whose family is supportive of their career choice. (SS) (1.6:1)
11. Persons who have a friend who recommended they pursue. (SS) (1.5:1)
12. Persons who have a transportation role model. (SS) (1.4:1)
13. Persons who have had access to a mentor for transportation.(SS) (2:1)
14. Persons with a family member who worked in transportation.(SS) (1.2:1)
Note: SS = Social Support, SE = Self- Efficacy, Values = Occupational Values.
This list of characteristics could easily be used by managers, recruiters, and candidates
themselves to assess whether an individual is a good fit with the organization and the job.
Turning these ten characteristics into a set of questionnaire items for a screening tool, structured
interview or other assessment selection test for pre-employment screening would be one way of
utilizing this information. Additionally, these characteristics could be addressed in orientation
briefings to persons considering the transportation industry for a job. By clearing identifying
these key issues, it should be possible to save time, and focus only on those who have the highest
likelihood of success in the long run.
Recruitment in Transportation
October 2016 34
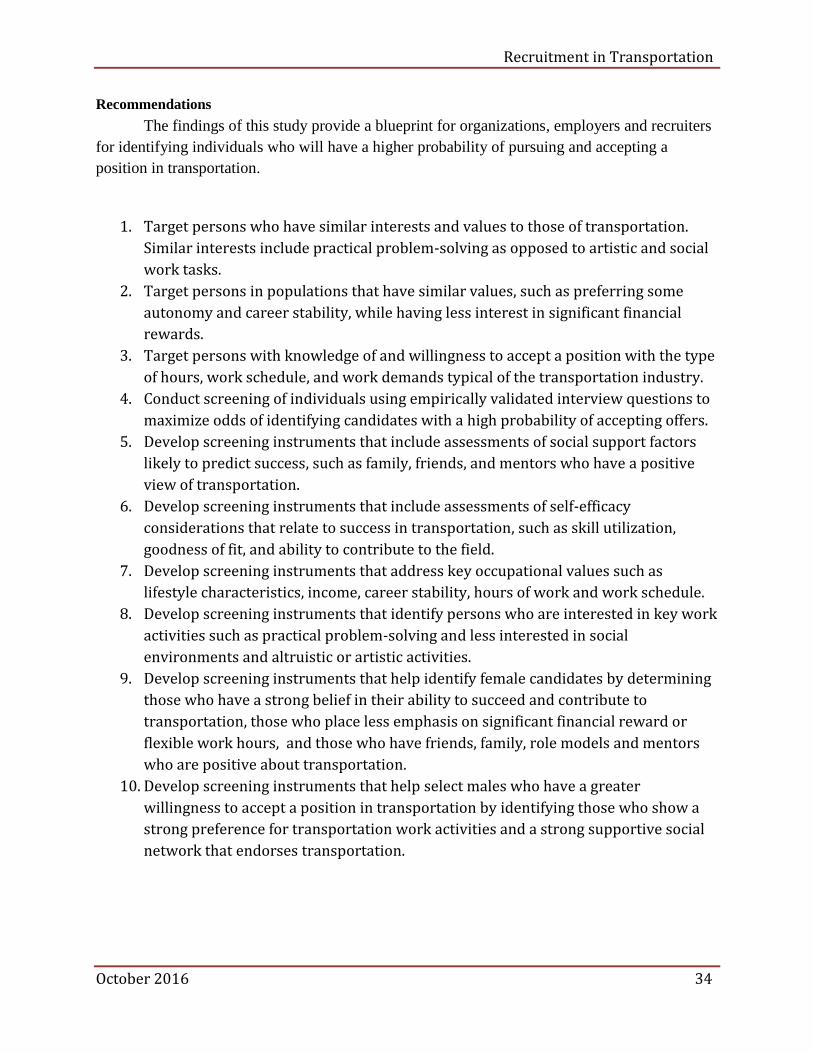
Recommendations
The findings of this study provide a blueprint for organizations, employers and recruiters
for identifying individuals who will have a higher probability of pursuing and accepting a
position in transportation.
1. Target persons who have similar interests and values to those of transportation.
Similar interests include practical problem-solving as opposed to artistic and social
work tasks.
2. Target persons in populations that have similar values, such as preferring some
autonomy and career stability, while having less interest in significant financial
rewards.
3. Target persons with knowledge of and willingness to accept a position with the type
of hours, work schedule, and work demands typical of the transportation industry.
4. Conduct screening of individuals using empirically validated interview questions to
maximize odds of identifying candidates with a high probability of accepting offers.
5. Develop screening instruments that include assessments of social support factors
likely to predict success, such as family, friends, and mentors who have a positive
view of transportation.
6. Develop screening instruments that include assessments of self-efficacy
considerations that relate to success in transportation, such as skill utilization,
goodness of fit, and ability to contribute to the field.
7. Develop screening instruments that address key occupational values such as
lifestyle characteristics, income, career stability, hours of work and work schedule.
8. Develop screening instruments that identify persons who are interested in key work
activities such as practical problem-solving and less interested in social
environments and altruistic or artistic activities.
9. Develop screening instruments that help identify female candidates by determining
those who have a strong belief in their ability to succeed and contribute to
transportation, those who place less emphasis on significant financial reward or
flexible work hours, and those who have friends, family, role models and mentors
who are positive about transportation.
10. Develop screening instruments that help select males who have a greater
willingness to accept a position in transportation by identifying those who show a
strong preference for transportation work activities and a strong supportive social
network that endorses transportation.
Recruitment in Transportation
October 2016 35
References
Abrahamsen, B. (2015). “Nurses' choice of clinical field in early career.” Journal of Advanced
Nursing, 71(2), 304.
Alexander, J. A. ; Lichtenstein, R. ; Oh, H. ; Ullman, E. (1998). “A causal model of voluntary
turnover among nursing personnel in long-term psychiatric settings.” Research in
Nursing & Health, 21(5), 415-427.
Barnett, R., Hyde, J. (2001). “Women, men, work, and family: An expansionist theory.”
American Psychologist, 56, 781-796.
Betz, N. E., & Hackett, G. (1981). “A Self-Efficacy Approach to the Career Development of
Women.” Journal of Vocational Behavior, 18(3), 326-39.
Basow, S. & Howe, K. (1980). “Role‐Model Influence: Effects of Sex and Sex‐Role Attitude in
College Students.” Psychology of Women Quarterly, 4(4), 558-572.
Buday, S. , Stake, J. & Peterson, Z. (2012). “Gender and the Choice of a Science Career: The
Impact of Social Support and Possible Selves.” Sex Roles, 66 (3-4), 197-209.
Bureau of Labor Statistics (BLS) (2007). “Employment statistics by gender and occupation.”
http://www.bls.gov/cps/wlf-databook2008.htm, accessed February 12, 2010.
Bureau of Labor Statistics (BLS) 2016. “Current Employment Statistics (CES-National).
Workforce statistics.” US Department of Labor. http://www.bls.gov/iag/tgs/iag48-49.htm.
Carruthers, T. E. (1968). “Work Values and Chosen Careers: Note on a Trial of an American
Work Values Inventory with British Subjects.” Occupational Psychology, 42(2/3), 111-
117.
Creswell, J.W. (2007). Qualitative Inquiry and Research Design: Choosing Among the Five
Approaches. Thousand Oaks, CA: Sage.
Cross, S. E. ; Bacon, P. L. ; Morris, M. L. (2000). “The Relational-Interdependent Self-Construal
and Relationships.” Journal of Personality and Social Psychology, 78(4), 791-808.
Crozier, S. (1999). “Women’s career development in a relational context.” International
Journal for the Advancement of Counseling, 21, 231–247.
Dawis, R., Lofquist, L. & Weiss, D. (1968), The Theory of work adjustment (A Revision).
Vocational Psychology Research Lab, Work Adjustment Project , Industrial Relations
Center, University of Minnesota Press.
Recruitment in Transportation
October 2016 36
Dobson, L. K., Gardner, M. K., Metz, A. J., & Gore, P. A. (2014). “The Relationship Between
Interests and Values in Career Decision Making: The Need for an Alternative Method of
Measuring Values.” Journal Of Career Assessment, 22(1), 113-122.
doi:10.1177/1069072713492929
Donohue, Ross. (2005). “Person-Environment Congruence in Relation to Career Change
and Career Persistence.” Journal of Vocational Behavior, 68(3), 504-515.
Duff, A., & Cotgrove, S. (1982). “Social values and the choice of careers in industry.” Journal of
Occupational Psychology, 55(2), 97-107.
Eley, R., Eley, D., & Rogers-Clark, C. (2010). “Reasons for entering and leaving nursing: an
Australian regional study.” Australian Journal of Advanced Nursing, 28(1), 6-13.
Farmer. H., Wardop, J., Anderson, M., Riesinger, R. (1995). “Women's career choices: Focus
on science, math, and technology careers.” Journal of Counseling Psychology, 42, 155-
170.
Flores, L, Y., O'Brien, K. M. (2002) “The Career Development of Mexican American
Adolescent Women : A Test of Social Cognitive Career Theory.” Journal of Counseling
Psychology. 49, 14-27.
Garcia, P. , Restubog, S., Bordia, P. , Bordia, S. & Roxas, R. (2015). “Career optimism: The
roles of contextual support and career decision-making self-efficacy.” Journal of
Vocational Behavior, 88, 10.
Hanson, S. and Murakami, E. (2010) “Women in transportation: improving the current gender
imbalance will require strategies on a number of fronts, from education to industry
organizations and the workplace,” Public Roads, 73, 5, 10.
Holland, J. (1973). Making vocational choices; a theory of careers. Englewood Cliffs: NJ ,
Prentice - Hall
House and Wells’ (1978). Occupational stress social support and health. NIOSH Document
Publication. 78-140.
Ibarra, H., Ely, R., & Kolb, D. (2013). “Women Rising: The Unseen Barriers.” Harvard
Business Review. September Issue.
Lofquist, L. H., & Dawis, R. V. (1969) Adjustment to work. New York: Appleton-Century-
Crofts.
Recruitment in Transportation
October 2016 37
Martin, C. (2015). Connecting the employment dots. Public Roads, FHWA-HRT-16-001, 79, 3,
November/December.
Metz, I., Tharenou, P. (2001). “Women's career advancement: The relative contribution of
human and social capital.” Group & Organization Management. 26, 312-341.
Metheny, J., & McWhirter, E. H. (2013). “Contributions of Social Status and Family Support
to College Students’ Career Decision Self-Efficacy and Outcome Expectations.” Journal
of Career Assessment, 21, 378-394.
Meyer, J. & Allen, J. (1997). Commitment in the workplace: Theory, research, and application.
Thousand Oaks, CA : Sage.
Moustakas, C. (1994). Phenomenological research methods. Thousand Oaks, CA: Sage.
Mulholland, R. (2014). The transportation industry: Investigating women as an underutilized
workforce in a traditionally male industry. Master’s Thesis University of Denver.
ProQuest Dissertations and Theses. ISBN: 9781321286458.
Nauta, M. M., & Kokaly, M. L. (2001). “Assessing role model influences on students’ academic
and vocational decisions.” Journal of Career Assessment, 9, 81–99.
O’Neil, D., Bilimoria, D. (2005). “Women’s career development phases: Idealism, endurance,
and reinvention.” Career Development International,10, 168-189.
Plas, J., Wallston, B. (1983). “Women oriented toward male-dominated careers: Is the
reference group male or female?” Journal of Counseling Psychology, 30, 46-54.
Philbrick, K. & Sherry, P. (2004). Perceptions of careers in transportation. National Center for
Intermodal Transportation. Denver, Colorado.
Quimby, J. L., & O’Brien, K. M. (2004). “Predictors of student and career decision-making self-
efficacy among nontraditional college women.” The Career Development Quarterly, 52,
323–339.
Quimby, J., DeSantis, A. (2006). “The Influence of Role Models on Women's Career Choices.”
The Career Development Quarterly, 54, 297-306.
Rivera, L., Blumburg, F., Chen, E., Ponterotto, J. Flores, L. (2007). “The effects of perceived
barriers, role models, and acculturation on the career self-efficacy and career consideration
of hispanic women.” The Career Development Quarterly, 56, 47-61.
Rosen, H., Korabik, K. (1990). “Marital and family correlates of women managers’ attrition
from organizations.” Journal of Vocational Behavior, 37, 104-120.
Recruitment in Transportation
October 2016 38
Smart, R., & Peterson, C. (1994). “Stability versus Transition in Women’s Career Development:
A test of Levinson’s Theory.” Journal of Vocational Behavior, 45, 241-260.
Smith, M. ; Canger, J. (2004). “Effects of Supervisor ‘Big Five’ Personality on Subordinate
Attitudes.” Journal of Business and Psychology. 18(4), 465-481.
Sökjer-Petersen, M. & Thorssell, J. (2008). “Women’s View of Trust and its Influence on
Entrepreneurship and Career Development.” Nordic Psychology, 2008, 60(2), 114-128.
Sullivan, S., Mainiero, L. (2006). “The changing nature of gender roles, alpha/beta careers and
work-life issues: Theory-driven implications for human resource management.” Career
Development International, 12, 238-263.
Super, D. E. (1970). Work Values Inventory: Manual. Chicago, IL: Riverside.
Sussman, J.M. (1999). “The new transportation faculty: The evolution to engineering systems.”
Transportation Quarterly, Summer.
United States Department of Labor Women’s Bureau; (2009). http://www.dol.gov/wb/
Van Iddekinge, C. H., Putka, D. J., & Campbell, J. P. (2011). “Reconsidering vocational interests
for personnel selection: The validity of an interest-based selection test in relation to job
knowledge, job performance, and continuance intentions.” Journal Of Applied
Psychology, 96(1), 13-33. doi:10.1037/a0021193
Van Iddekinge, C. H., Roth, P. L., Putka, D. J., & Lanivich, S. E. (2011). “Are you interested? A
meta-analysis of relations between vocational interests and employee performance and
turnover.” Journal Of Applied Psychology, 96(6), 1167-1194. doi:10.1037/a0024343
Weisgram, E., Dinella, L., & Fulcher, M. (2011). “The Role of Masculinity/Femininity, Values,
and Occupational Value Affordances in Shaping Young Men's and Women's
Occupational Choices.” Sex Roles, 65(3-4), 243-258. doi:10.1007/s11199-011-9998-0.
Weiss, D., Dawis, R., England, & Lofquist, L. (1964). Minnesota Importance Questionnaire
(MIQ). The Measurement of Vocational Needs. Industrial Relations Center, University of
Minnesota.
Whitmarsh, L., Brown, D., Cooper, J., Hawkins-Rogers, Y., Wentworth, D. (2007). “Choices
and challenges: A qualitative exploration of professional women's career patterns.”
Career Development Quarterly, 55, 225-226.
Women’s Bureau; (2009). United states department of Labor. http://www.dol.gov/wb/
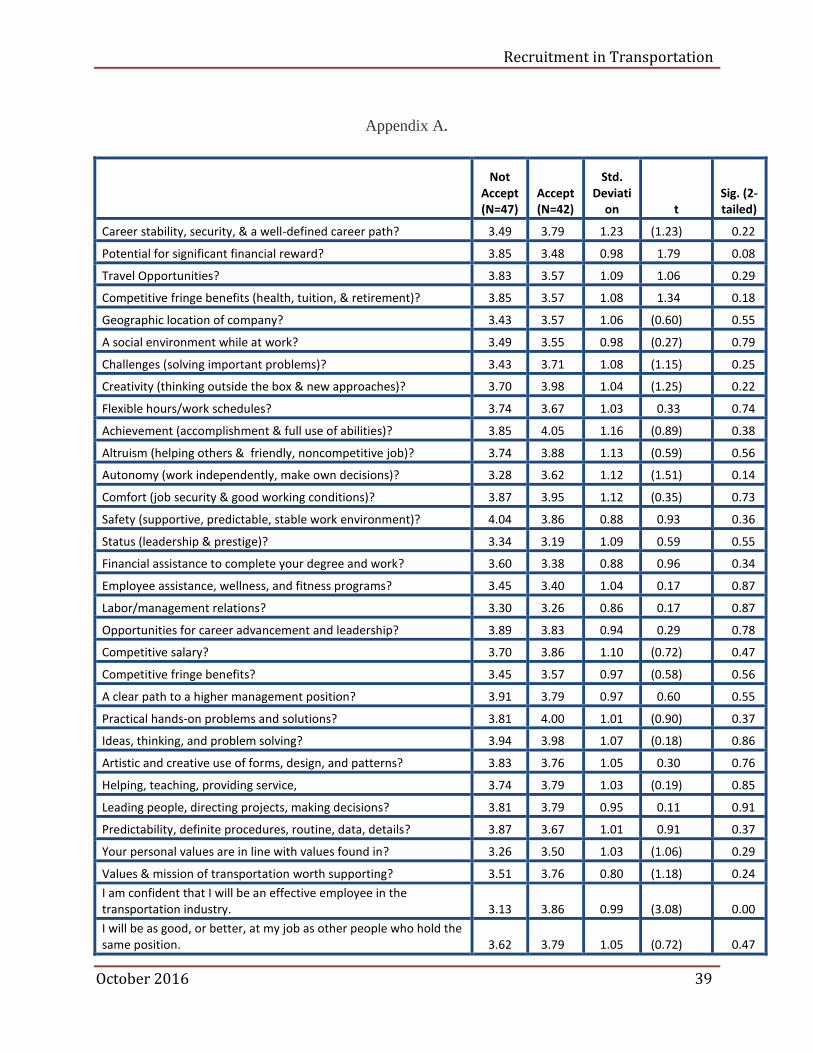
Recruitment in Transportation
October 2016 39
Appendix A.
Not Accept (N=47)
Accept (N=42)
Std. Deviati
on t Sig. (2-tailed)
Career stability, security, & a well-defined career path? 3.49 3.79 1.23 (1.23) 0.22
Potential for significant financial reward? 3.85 3.48 0.98 1.79 0.08
Travel Opportunities? 3.83 3.57 1.09 1.06 0.29
Competitive fringe benefits (health, tuition, & retirement)? 3.85 3.57 1.08 1.34 0.18
Geographic location of company? 3.43 3.57 1.06 (0.60) 0.55
A social environment while at work? 3.49 3.55 0.98 (0.27) 0.79
Challenges (solving important problems)? 3.43 3.71 1.08 (1.15) 0.25
Creativity (thinking outside the box & new approaches)? 3.70 3.98 1.04 (1.25) 0.22
Flexible hours/work schedules? 3.74 3.67 1.03 0.33 0.74
Achievement (accomplishment & full use of abilities)? 3.85 4.05 1.16 (0.89) 0.38
Altruism (helping others & friendly, noncompetitive job)? 3.74 3.88 1.13 (0.59) 0.56
Autonomy (work independently, make own decisions)? 3.28 3.62 1.12 (1.51) 0.14
Comfort (job security & good working conditions)? 3.87 3.95 1.12 (0.35) 0.73
Safety (supportive, predictable, stable work environment)? 4.04 3.86 0.88 0.93 0.36
Status (leadership & prestige)? 3.34 3.19 1.09 0.59 0.55
Financial assistance to complete your degree and work? 3.60 3.38 0.88 0.96 0.34
Employee assistance, wellness, and fitness programs? 3.45 3.40 1.04 0.17 0.87
Labor/management relations? 3.30 3.26 0.86 0.17 0.87
Opportunities for career advancement and leadership? 3.89 3.83 0.94 0.29 0.78
Competitive salary? 3.70 3.86 1.10 (0.72) 0.47
Competitive fringe benefits? 3.45 3.57 0.97 (0.58) 0.56
A clear path to a higher management position? 3.91 3.79 0.97 0.60 0.55
Practical hands-on problems and solutions? 3.81 4.00 1.01 (0.90) 0.37
Ideas, thinking, and problem solving? 3.94 3.98 1.07 (0.18) 0.86
Artistic and creative use of forms, design, and patterns? 3.83 3.76 1.05 0.30 0.76
Helping, teaching, providing service, 3.74 3.79 1.03 (0.19) 0.85
Leading people, directing projects, making decisions? 3.81 3.79 0.95 0.11 0.91
Predictability, definite procedures, routine, data, details? 3.87 3.67 1.01 0.91 0.37
Your personal values are in line with values found in? 3.26 3.50 1.03 (1.06) 0.29
Values & mission of transportation worth supporting? 3.51 3.76 0.80 (1.18) 0.24
I am confident that I will be an effective employee in the transportation industry. 3.13 3.86 0.99 (3.08) 0.00
I will be as good, or better, at my job as other people who hold the same position. 3.62 3.79 1.05 (0.72) 0.47
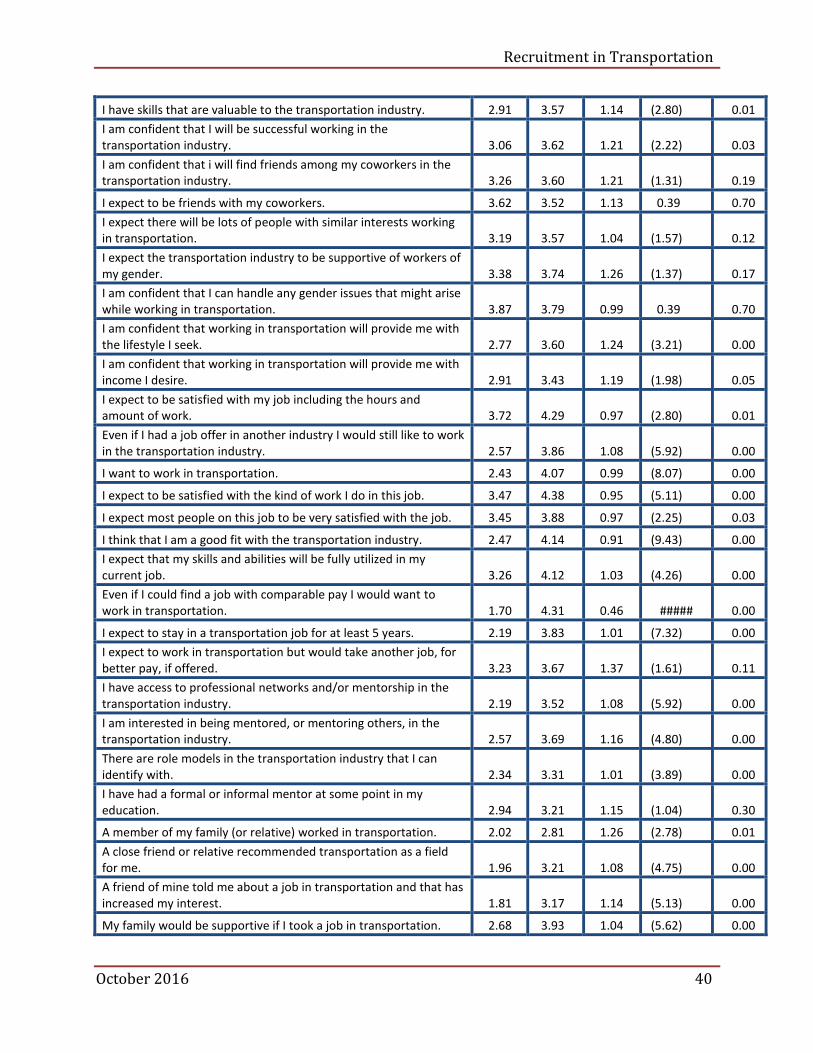
Recruitment in Transportation
October 2016 40
I have skills that are valuable to the transportation industry. 2.91 3.57 1.14 (2.80) 0.01
I am confident that I will be successful working in the transportation industry. 3.06 3.62 1.21 (2.22) 0.03
I am confident that i will find friends among my coworkers in the transportation industry. 3.26 3.60 1.21 (1.31) 0.19
I expect to be friends with my coworkers. 3.62 3.52 1.13 0.39 0.70
I expect there will be lots of people with similar interests working in transportation. 3.19 3.57 1.04 (1.57) 0.12
I expect the transportation industry to be supportive of workers of my gender. 3.38 3.74 1.26 (1.37) 0.17
I am confident that I can handle any gender issues that might arise while working in transportation. 3.87 3.79 0.99 0.39 0.70
I am confident that working in transportation will provide me with the lifestyle I seek. 2.77 3.60 1.24 (3.21) 0.00
I am confident that working in transportation will provide me with income I desire. 2.91 3.43 1.19 (1.98) 0.05
I expect to be satisfied with my job including the hours and amount of work. 3.72 4.29 0.97 (2.80) 0.01
Even if I had a job offer in another industry I would still like to work in the transportation industry. 2.57 3.86 1.08 (5.92) 0.00
I want to work in transportation. 2.43 4.07 0.99 (8.07) 0.00
I expect to be satisfied with the kind of work I do in this job. 3.47 4.38 0.95 (5.11) 0.00
I expect most people on this job to be very satisfied with the job. 3.45 3.88 0.97 (2.25) 0.03
I think that I am a good fit with the transportation industry. 2.47 4.14 0.91 (9.43) 0.00
I expect that my skills and abilities will be fully utilized in my current job. 3.26 4.12 1.03 (4.26) 0.00
Even if I could find a job with comparable pay I would want to work in transportation. 1.70 4.31 0.46 ##### 0.00
I expect to stay in a transportation job for at least 5 years. 2.19 3.83 1.01 (7.32) 0.00
I expect to work in transportation but would take another job, for better pay, if offered. 3.23 3.67 1.37 (1.61) 0.11
I have access to professional networks and/or mentorship in the transportation industry. 2.19 3.52 1.08 (5.92) 0.00
I am interested in being mentored, or mentoring others, in the transportation industry. 2.57 3.69 1.16 (4.80) 0.00
There are role models in the transportation industry that I can identify with. 2.34 3.31 1.01 (3.89) 0.00
I have had a formal or informal mentor at some point in my education. 2.94 3.21 1.15 (1.04) 0.30
A member of my family (or relative) worked in transportation. 2.02 2.81 1.26 (2.78) 0.01
A close friend or relative recommended transportation as a field for me. 1.96 3.21 1.08 (4.75) 0.00
A friend of mine told me about a job in transportation and that has increased my interest. 1.81 3.17 1.14 (5.13) 0.00
My family would be supportive if I took a job in transportation. 2.68 3.93 1.04 (5.62) 0.00
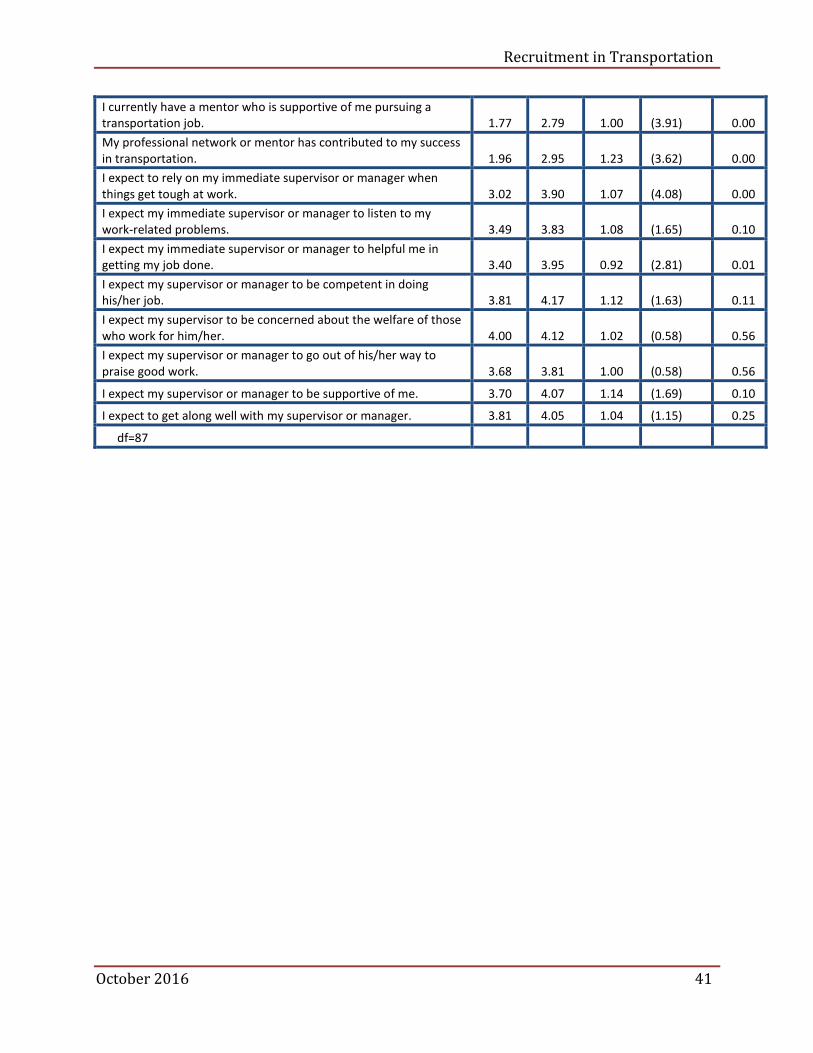
Recruitment in Transportation
October 2016 41
I currently have a mentor who is supportive of me pursuing a transportation job. 1.77 2.79 1.00 (3.91) 0.00
My professional network or mentor has contributed to my success in transportation. 1.96 2.95 1.23 (3.62) 0.00
I expect to rely on my immediate supervisor or manager when things get tough at work. 3.02 3.90 1.07 (4.08) 0.00
I expect my immediate supervisor or manager to listen to my work-related problems. 3.49 3.83 1.08 (1.65) 0.10
I expect my immediate supervisor or manager to helpful me in getting my job done. 3.40 3.95 0.92 (2.81) 0.01
I expect my supervisor or manager to be competent in doing his/her job. 3.81 4.17 1.12 (1.63) 0.11
I expect my supervisor to be concerned about the welfare of those who work for him/her. 4.00 4.12 1.02 (0.58) 0.56
I expect my supervisor or manager to go out of his/her way to praise good work. 3.68 3.81 1.00 (0.58) 0.56
I expect my supervisor or manager to be supportive of me. 3.70 4.07 1.14 (1.69) 0.10
I expect to get along well with my supervisor or manager. 3.81 4.05 1.04 (1.15) 0.25
df=87