national bureau of economic research … · building social capital through microfinance benjamin...
TRANSCRIPT
NBER WORKING PAPER SERIES
BUILDING SOCIAL CAPITAL THROUGH MICROFINANCE
Benjamin FeigenbergErica M. FieldRohini Pande
Working Paper 16018http://www.nber.org/papers/w16018
NATIONAL BUREAU OF ECONOMIC RESEARCH1050 Massachusetts Avenue
Cambridge, MA 02138May 2010
We thank Emmerich Davies, Sean Lewis Faupel, Sitaram Mukherjee and Anup Roy for superb fieldwork and research assistance, Alexandra Cirone and Gabe Scheffler for editorial assistance and VillageWelfare Society and Center for Micro-Finance for hosting this study, Theresa Chen, Annie Duflo,Nachiket Mor and Justin Oliver for enabling this work and ICICI, Exxon Mobil Educating Womenand Girls Initiative (administered through WAPP/CID at Harvard) and the Dubai Initiative for financialsupport. We also thank Attila Ambrus, Abhijit Banerjee, Tim Besley, Amitabh Chandra, Esther Duflo,Raquel Fernandez, Dominic Leggett, Muriel Niederle, Aloysius Sioux, Jesse Shapiro, Anil Somaniand numerous seminar participants for helpful comments. The views expressed herein are those ofthe authors and do not necessarily reflect the views of the National Bureau of Economic Research.
NBER working papers are circulated for discussion and comment purposes. They have not been peer-reviewed or been subject to the review by the NBER Board of Directors that accompanies officialNBER publications.
© 2010 by Benjamin Feigenberg, Erica M. Field, and Rohini Pande. All rights reserved. Short sectionsof text, not to exceed two paragraphs, may be quoted without explicit permission provided that fullcredit, including © notice, is given to the source.
Building Social Capital Through MicroFinanceBenjamin Feigenberg, Erica M. Field, and Rohini PandeNBER Working Paper No. 16018May 2010JEL No. C81,C93,O12,O16
ABSTRACT
A number of development assistance programs promote community interaction as a means of buildingsocial capital. Yet, despite strong theoretical underpinnings, the role of repeat interactions in sustainingcooperation has proven difficult to identify empirically. We provide the first experimental evidenceon the economic returns to social interaction in the context of microfinance. Random variation in thefrequency of mandatory meetings across first-time borrower groups generates exogenous and persistentchanges in clients' social ties. We show that the resulting increases in social interaction among clientsmore than a year later are associated with improvements in informal risk-sharing and reductions indefault. A second field experiment among a subset of clients provides direct evidence that more frequentinteraction increases economic cooperation among clients. Our results indicate that group lendingis successful in achieving low rates of default without collateral not only because it harnesses existingsocial capital, as has been emphasized in the literature, but also because it builds new social capitalamong participants.
Benjamin FeigenbergDepartment of EconomicsMITCambridge, [email protected]
Erica M. FieldDepartment of EconomicsHarvard UniversityM30 Littauer CenterCambridge, MA 02138and [email protected]
Rohini PandeKennedy School of GovernmentHarvard University79 JFK StreetCambridge, MA 02138and [email protected]
1 Introduction
Social capital, famously defined by Putnam (1993) as “features of social organization, such as trust,
norms and networks, that can improve the efficiency of society by facilitating coordinated actions,”
is thought to be particularly valuable in low-income countries where formal insurance is largely
unavailable and institutions for contract enforcement are weak.1 Since economic theory suggests
that repeated interactions among individuals can help build and maintain social capital (see, for
instance, Kreps et al., 1982), encouraging interaction could be an effective tool for development
policy. Indeed, numerous development assistance programs have introduced policies designed to
promote social contact among community members under the assumption that there are significant
economic returns to regular interaction. But can simply inducing people to interact more often
actually increase economic cooperation?
While a large body of research finds a positive correlation between social interaction and
cooperative outcomes, rigorous empirical evidence on this subject remains limited, largely due to
the difficulty of accounting for endogenous social ties (Manski, 1993, 2000). For instance, if more
cooperative individuals or societies are characterized by stronger or denser social networks, we
cannot assign a causal interpretation either to the positive association between community-level
social ties and public goods provision or to the higher levels of cooperation observed among friends
as compared to strangers in laboratory public goods games.2 In short, without randomly varying
social distance, it is difficult to validate the basic model of returns to repeated interaction and even
harder to determine whether small changes in social interaction can produce tangible returns.
This paper undertakes precisely this exercise in the context of a development program that
1Consistent with this idea, Guiso et al. (2004) demonstrate that residents in high social capital regions engage inmore sophisticated financial transactions, and Knack and Keefer (1997) show that a country’s level of trust correlatespositively with its growth rate.
2The public good provision and community ties literature includes Costa and Kahn (2003); Alesina and Ferrara(2002); DiPasquale and Glaeser (1999); Miguel et al. (2005); Olken (2009), while examples of laboratory gamesinclude Glaeser et al. (2000); Carter and Castillo (2004); Do et al. (2009); Karlan (2005); Ligon and Schecter (2008).Another shortcoming in the community ties and public goods literature is the use of survey-generated measures ofpropensity to cooperate, which are often inconsistent with incentivized trust measures generated by laboratory games(Glaeser et al., 2000).
2
emphasizes group interaction – microfinance. In the typical “Grameen Bank”-style microfinance
program, clients meet weekly in groups to make loan payments. In addition to facilitating debt
collection, these meetings encourage regular interaction among members of highly localized commu-
nities.3 To evaluate the economic returns to increased social contact that result from participation
in group lending, we randomly assigned first-time borrower groups of a microfinance institution
(MFI) in India to meet either once per week (weekly groups) or once per month (monthly groups).4
We show that mandated differences in meeting frequency over a ten-month period generated
persistent differences in individuals’ knowledge of and social contact with group members: Five
months into the loan cycle, clients in weekly groups were 90% more likely to have visited other
group members in their homes, and more than a year after their loan cycle ended they were 40%
more likely to attend social events together and visited one another 19% more often outside of
loan meetings. These gains were concentrated among clients who did not know each other well
before joining the MFI but had the ability to sustain social contact either through extended family
networks or geographic proximity.
Furthermore, reducing social distance had significant economic returns. Clients required to
meet more frequently in the experimental loan cycle were 19% more likely to report financial trans-
fers with people outside of their immediate family and 29% more likely to say that they would ask
another (former) group member for help in the event of a health emergency. They were also four
times less likely to default on their subsequent loan (during which all clients met at the same fre-
quency, irrespective of whether they had earlier been in weekly or monthly groups). While in theory
it is possible that more frequent repayment directly influenced default via long-run differences in
financial discipline, several pieces of evidence indicate that social ties were the central channel of
influence. Perhaps most striking, the reduction in default among weekly clients depended heavily
3In an anthropological study of Grameen Bank clients, Larance (2001) describes the social aspects of weeklyactivities such as “walking across the village to attend the center meeting, sitting in conversation with a diverse setof women, handling money for the group and receiving personal address.”
4In a similar spirit, Humphreys et al. (2009) randomize community development programs and show that theyencourage prosocial behavior. However, they are unable to identify the influence of social interactions, per se.
3
on those group characteristics – fraction of extended family members and close neighbors in the
group – that predicted differences in social capital formation. Importantly, these characteristics do
not directly influence default.
Not only do these results imply that development programs can readily generate economically
valuable social capital, but they provide an alternative explanation for the success of the classic
group lending model in achieving low rates of default without the use of collateral. Although joint
liability is almost universally emphasized as the key to mitigating default risk in group lending,
our results show that improvements in informal risk-sharing arrangements that develop among
clients in individual-liability lending groups significantly improve repayment rates. Further, recent
experimental evidence suggests that joint liability has little impact on default (Karlan and Gine,
2009). Our results also provide a rationale for the current trend among MFIs of maintaining
repayment in group meetings despite the transition from group to individual liability contracts
(Karlan and Gine, 2009).
To gather direct evidence on economic cooperation among clients and disentangle mechanisms
through which repeat interaction improves cooperation, we designed and implemented a second
field experiment (roughly sixteen months after the group meeting experiment ended). This lottery
experiment provided a unique opportunity to elicit clients’ willingness to share risk with group
members in a setting that did not trigger subjects’ awareness of being participants in an experiment.5
Each client entered a separate lottery in which she started with a 1 in 11 chance of winning a Rs.
200 ( $5) promotional coupon. She was offered the opportunity to give out additional lottery
tickets to any number of members of her first MFI group, reducing her individual probability of
winning but increasing the probability that someone from the group would win. Since ticket-giving
increases her expected payoff if and only if group members could be trusted to share their winnings
an individual’s willingness to give tickets captures the “resource potential” of her MFI network.
5Subjects’ awareness of being scrutinized has been shown to influence laboratory measures of pro-social behavior.In a recent overview of this literature, Levitt and List (2009) argue that individuals’ pro-social behavior in framedor artifactual experiments is likely to depend on the nature and degree of others’ scrutiny, the context in which adecision is embedded and the selection of participants, which significantly limits the generalizability of these results.
4
To distinguish insurance motivations for sharing from unconditional altruism, we varied the
form of lottery prize, randomly assigning each client to a lottery in which the prize was either one
Rs. 200 voucher or four Rs. 50 vouchers. Assuming the more easily divisible prize is perceived
as more conducive to sharing by the winner, a client will be more likely to give tickets to group
members when the prize is divisible if she is motivated at least in part by risk-sharing considerations
but no more likely if she is motivated only by selfless altruism.6 Consistent with this, we find that,
relative to a monthly client, a client who had been in a weekly group was 67% more likely to enter
a group member into the lottery when the prize was divisible but no more likely when it was not.
Further, in line with our earlier results we find that increased ticket-giving by weekly clients is
driven by increased giving to close neighbors and extended family.
Why do more frequent meetings facilitate risk-sharing? We exploit a unique feature of our
experimental setting to evaluate the importance of learning about fellow group members types
(level of impatience, trustworthiness, etc.), which implies only short-term benefits of more frequent
interaction, versus the possibility that regular interaction indefinitely improved risk-sharing capacity
by increasing clients’ effective discount factors or ability to implement punishment and reward
schemes that mitigate opportunistic behavior. At the time of the lottery, a subset of participants
were on a subsequent loan cycle in which their group had been re-randomized into weekly or
monthly repayment schedules. This provides experimental variation in the frequency of mandatory
interactions between group members at two points: once when they are new to each other and once
when they have been interacting regularly for almost two years. Clients randomly assigned to meet
frequently in both loan cycles give significantly more tickets than clients required to interact at a
high frequency only in the beginning. We interpret this as evidence that, in addition to any learning
effects that hasten the formation of reciprocal arrangements, higher meeting frequency also helps
6Similar variations of dictator or trust games have been used to parse out motives for giving in laboratoryexperiments. See for instance Ligon and Schecter (2008); Do et al. (2009); Carter and Castillo (2003). Perhapsclosest to our approach is Gneezy et al. (2000), who use a sequence of trust games with varying constraints on theamount that can be repaid in the second round to show that individuals contribute more when large repayments arefeasible.
5
sustain cooperation by reducing the costs or increasing the benefits of coordinating actions.
Our findings compliment existing work on microfinance, which has identified a role for social
connections in reducing default risk (Besley and Coate, 1995; Ghatak and Guinnane, 1999; Karlan,
2005).7 Our contributions are to generate and use random variation in social ties to establish
a causal effect of social interaction on cooperation that we cannot safely conclude from previous
studies (given the possibility of selection into social networks), and, in doing so, to demonstrate that
small changes in program design (here, the structure of the loan contract) can have a significant
effect on social capital. With respect to microfinance, our findings illustrate that the most popular
form of group lending not only harnesses social capital through joint liability contracts but actually
builds social capital among group members by encouraging regular social contact.
The rest of this paper is structured as follows: Section 2 describes the study setting and
experimental design. Section 3 documents the implications of meeting frequency for clients’ social
and financial behavior. Section 4 uses our second field experiment to disentangle channels through
which increases in social interaction increased economic cooperation, and Section 5 concludes.
2 Setting and Experimental Design
Our partner MFI, Village Welfare Society (VWS), started operations in the Indian state of West
Bengal in 1982. At the start of our field experiments, it had roughly 6.75 million dollars in outstand-
ing loans to over 56,000 female clients. According to the baseline survey, over 70% of households
in our sample owned a micro-enterprise, 30% report significant health shocks in the twelve months
prior to taking out a loan, and less than 40% had a savings account or formal insurance, suggesting
potentially significant returns to informal risk-sharing among group members.
Like most MFIs, VWS loan groups typically consist of clients from a single neighborhood,
which implies that members live in close proximity and are acquainted prior to joining. However,
7For instance, MFI clients in Peru who are more trustworthy in a trust game are less likely to default, andgroup-level default is lower in groups where clients have stronger social connections (Karlan, 2005, 2007).
6
while 67% of group members in our sample knew one another at group formation, most described
their relationship with other group members as neighbors (51%), acquaintances (6%), or strangers
(27%), rather than friends (7%) or family (9%).
The basic loan group works as follows: After clients are screened and groups approved by
loan officers, members choose a group leader in whose home the loan officer will conduct weekly
repayment meetings for the duration of the loan cycle. The first two meetings are for group nurturing
and training, and loan repayment starts in the third week. During each meeting clients take an
oath promising to make regular repayment, after which the loan officer collects payment from each
member individually and marks passbooks.8 Loan cycles last for forty four weeks and all clients must
attend meetings for at least twenty weeks, after which point they may repay the remaining balance
in a single installment. In our sample the median weekly group met thirty seven times during a
single loan cycle and the average meeting length was twenty-five minutes (excluding waiting time).
For the experiment, between April and September 2006 we recruited one hundred new ten-
member borrower groups of first-time clients from neighborhoods in the catchment areas of three
VWS branches.9 At the time of recruitment, clients were told that repayment schedules would be
determined by lottery. Before loan disbursal, we randomly assigned thirty groups to the standard
weekly repayment schedule and seventy groups to a monthly repayment schedule.10 Each client
received a Rs. 4000 ( $100) loan, a reasonably large amount given that the average client had
assets worth $250 at baseline. Clients assigned to the weekly schedule were required to repay their
loans through 44 weekly installments of Rs. 100 starting two weeks after loan disbursal, and those
assigned to the monthly schedule in eleven Rs. 400 installments starting one month after loan
8A client’s repayment behavior is, thus, observable to other group members, although, in practice most clientssocialize while awaiting their turn. While a client can repay at a branch this occurred very rarely. However, once amajority of clients in a group have repaid their loan, VWS asks remaining clients to repay at the branch office.
9Loan officers aimed to form ten-member groups. In practice, group size ranged between eight and thirteenmembers, with 77% of the groups consisting of ten members.
10We originally intended to have two monthly repayment treatment arms: One that met weekly and one that metmonthly. In practice, weekly meetings among clients required to repay monthly broke down almost immediately,and clients ended up meeting on a monthly basis for most of their loan cycle. On average the weekly-monthly andmonthly-monthly groups ended up meeting 10.13 and 10 times.
7
disbursal. No client dropped out after her repayment schedule was announced.
Between group formation and loan disbursement, we administered a baseline survey to 1016
of the 1026 clients. Table 1 and Appendix Table 1 provide a randomization check based on these
data. On average, monthly and weekly clients look similar at baseline across a wide range of
observable characteristics. No baseline characteristics out of 30 are significantly different at a 5%
level, and only two differences are statistically significant at the 10% level: whether a client is
Muslim and the number of years she has lived in her neighborhood. While monthly clients have
been in their neighborhoods for slightly longer, the difference is relatively small and is not associated
with differences in degree of social ties. For instance, they were no more likely to describe another
group member as family or friend (Table 1, Panel B). We have also verified that the results are
robust to excluding groups with Muslim clients. However, because of these differences, throughout
we report regressions with the controls listed in Table 1 and discuss any cases in which our results
are sensitive to the inclusion of controls.
3 Effect of Meeting Frequency on Client Behavior
To gauge the effect of meeting frequency on social capital formation, our study tracks clients for two
and a half loan cycles (roughly 100 weeks) beginning in April 2006. Appendix Figure 1 provides a
detailed timeline.
3.1 Social Capital Effects
We first measure short-run changes in group members’ social contact outside of repayment meetings
during the course of the experiment. To capture this, at the end of each meeting loan officers asked
clients four questions about their knowledge of and interactions outside of meetings with other
group members. Since data were collected in a relatively public setting, to maintain a degree of
anonymity clients were asked to aggregate their interactions across group members.
8
To capture the breadth of client interactions outside of meetings, each client was asked whether
all group members had visited her at home and whether she had visited all other group members in
their homes.11 For both outcomes, we construct an indicator that equals one if the client responded
in the affirmative at any group meeting. To capture clients’ knowledge of group members, each
client was asked if she knew the names of her group members’ husbands and children and whether
any of her group members had relatives visit in the last thirty days. For the first measure, we
again construct an indicator that equals one if the client responded in the affirmative at any group
meeting, and for the second we average across all responses for a client. To avoid inferences based
on selected outcomes, we report effects for a “social contact index” which averages across these four
outcomes (Kling et al., 2007).12 Since clients often repay early but never before the sixth month, we
restrict the analysis to data from the first five months of the loan cycle.13 To balance observations
across weekly and monthly clients, we randomly choose one meeting per month for weekly clients.
Figure 1 shows that the fraction of clients who had visited all group members in their homes
rose sharply in the first month and then increased gradually over the next five months to nearly 45%,
and the fraction of clients who knew whether their group members had been visited by relatives
increased steadily from 0% to 7%. We observe similar patterns for fraction of clients visited by all
group members and knowledge of the names of family members of other group clients (unreported).
These patterns are consistent with a “dose response” to mandatory meetings, in which case weekly
groups should end up with higher levels of social contact. To test this, we aggregate social contact
data to the group level – since client responses may have been influenced by being asked in a group
setting – and estimate for group g:
yg = β1Wg +Xgγ1 + αg + εg (1)
11Repayment meetings always occur at the group leader’s house.12The index is the equally weighted average of the four variables, with each variable normalized by subtracting
the mean for monthly clients and dividing by the standard deviation for these clients.13Due to delays in implementing the group meeting survey, 1.9% of clients (20 clients) lack eight weeks of data,
4.8% (49 clients) lack data for 6 weeks, and 7.8% (80 clients) lack four weeks of data.
9
where yg is the social capital index, Wg is an indicator for weekly group, αg is a loan officer fixed
effect, and Xg is the set of group-level controls in Table 1. Regression results, presented in column
(1) of Table 2, indicate that moving from monthly to weekly repayment leads to a four standard
deviation increase in social contact outside of meetings.14
To examine whether changes in social contact persisted beyond the experiment and measure
individual social interactions in a more controlled setting, we visited a random sample of 432 clients
an average of 16 months after they had repaid their loan and collected survey data on the client’s
perceptions of the trustworthiness of her previous (first loan cycle) group members and her current
contact with these members.15 For consistency with short-run data collected during loan meetings,
our first long-run contact measure is the number of times over the last thirty days the client had
visited with a previous group member in either person’s home. The next two outcomes measure
the strength of social contact – whether the client still talks to the group member about family and
whether they celebrated the main Bengali festival (Durga Puja) together during the previous year.
Since we have roughly nine observations per client (all other group members), our analysis
sample contains 4018 pairwise observations. In order to avoid double-counting, in cases in which
we interviewed both members of a pair, we randomly drop one observation when the outcome is
social contact (which cannot vary, in the absence of measurement error, within a pair) and keep all
observations for outcomes that can differ within a pair. For member i matched with group member
m in group g we estimate
ygmi = β1Wg +Xgγ1 +Xiγ2 + δ1Di + δ2li + αg + εgmi (2)
where overlapping variables are defined as in equation (1), Di controls for number of days between
loan disbursement and survey, and li controls for being the group leader. Additional controls, listed
14In Appendix Table 2, we report the differences for each of the index components (for ease of interpretation weconsider the non-normalized group outcomes). In each case, the magnitude of the effect is strikingly large. All resultsare robust to excluding controls.
15The client also provided information on her relationship with each group member prior to joining VWS.
10
in Table 1, are defined at the group- and individual- level (Xg and Xi respectively). Standard errors
are clustered by group.
According to the estimates in column (2) of Table 2, more than a year after graduating
from their first loan cycle, clients who met weekly remain significantly more likely to interact than
their monthly counterparts: Moving from a monthly to a weekly schedule leads to a 0.11 standard
deviation increase in long-run social contact between clients. The effect is similar in magnitude
but statistically insignificant without controls. Furthermore, all of the individual index components
indicate greater social contact among weekly clients and two out of three are statistically significant
(Appendix Table 2). In sum, higher levels of friendship among weekly clients persisted long after
mandatory meetings ended.
Next, we examine how long-run changes in social contact varied across five categories of
baseline social distance: (i) immediate family members and friends; (ii) relatives more than once
removed (distant relatives); (iii) neighbors living within a block (close neighbors); (iv) neighbors
living more than a block away (far neighbors); and (v) strangers.16 Column (3) reveals that increases
in long-run social contact that accrue to weekly groups are concentrated among client pairs who
are distant relatives and close neighbors. Reassuringly, we do not observe a change in social contact
among immediate relatives (the omitted group), and not surprisingly, we also observe no significant
change among clients with few means of sustaining a social connection outside of group meetings
(those who were unknown prior to joining VWS or distant neighbors). These results are robust to
the exclusion of controls.
Looking directly at the component of the index that measures repeat interaction – number
of times the pair visited each other at home in the last thirty days – we observe that the average
weekly client pair meets 19% more often than their monthly counterpart, but the estimate is very
noisy (column (4)). However, when weekly is interacted with categories of initial social distance,
we observe large and significant increases in meeting frequency where changes in social ties are
16Distances were measured using GPS coordinates collected at baseline. We define a city block as living within a50-meter radius, which is half of the distance used to define city blocks in developed countries.
11
most heavily concentrated - among distant family and close neighbors. Among weekly clients, close
neighbors see each other just as often as friends and family members once removed while in monthly
groups they see each other 27% less often.
The last two columns consider trust-based measures of social capital. The outcome in column
(6) is a client’s perception of her average group member’s trustworthiness.17 More than a year after
repaying the loan, those who were on a weekly schedule rank average group member trustworthiness
0.27 points higher (on a 1-5 scale) and the difference is statistically significant with or without
controls.18 In column (7), the outcome variable is the client’s response to a hypothetical question on
whether she believes that a particular group member would help her in the event of illness. Weekly
clients are six percentage points more likely to report that a group member would provide assistance
in such an emergency (29%), which is statistically significant with but not without controls.
3.2 Returns to Social Capital
According to the previous section, forcing people to meet more often for 6-10 months leads to
persistent increases in social ties. But do these social ties yield economic returns or simply change
patterns of friendship? Survey responses to a hypothetical scenario suggest that weekly clients are
also more willing to provide informal insurance to fellow group members (Table 2, column (7)), but
do informal risk-sharing arrangements develop in practice?
To test whether weekly meetings are associated with improvements in informal insurance, we
consider two measures of vulnerability to shocks: financial transfers between individuals other than
immediate family and loan default. At the end of the first loan cycle clients were administered a
survey that asked about the number and amount of transfers to and from individuals of fourteen
17Our regression specification is the individual level equivalent of equation (1).18The client was described the following scenario: “Imagine a person walking down the street sees someone in
front of him/her drop their wallet. Upon inspection, she finds that the wallet contains Rs 200 and the owner’s nameand phone number. The finder must decide whether to keep it or return it to its owner.” She was asked to rank thelikelihood that the finder would return the wallet if she was her average group member on a 1-5 scale described asfollows: “1-Would not return the money. 2- Unless someone knows she has got the wallet, would not return it. 3-Aslikely to return as not. 4- Will return, but might take up to a week. 5- Will return immediately.”
12
different relationship categories over the past year. Figure 2 shows the average transfers given by
a client by type of relationship. Overall, weekly clients give more transfers to all categories of
individuals except non-relatives who are neither friends nor neighbors, a category that is unlikely to
include members of a client’s loan group. Among client pairs in the two categories where gains in
social ties are concentrated - friends (at endline), neighbors and other relatives - , total transfers are
28% higher among weekly clients. Since the majority of clients report no transfers, for regression
estimates we consider the binary outcome of whether the client reports any transfers to or from
individuals inside or outside of her immediate family rather than amount of transfer.
To measure default, we use VWS transactions data to track client repayment behavior during
both the experimental and the subsequent loan cycle. At the end of our loan experiment, 69% of
clients took out a second loan with VWS, and the rate did not differ across monthly and weekly
clients. On average, the second loan was 35% larger than the first, and all clients repaid on a
fortnightly schedule.19 We consider a client in default on either loan if she failed to repay in full 44
weeks after the loan was due (roughly the length of an additional loan cycle).20
For both outcomes, we estimate OLS regressions of the form:
ygi = β1Wg +Xgγ1 +Xiγ2 + αg + εgi (3)
where variables and indices are defined as in Equation (2).
The results are presented in Table 3. Column (1) reveals that weekly clients are 19% more
likely to report transfers outside the family at the end of the experiment, and the difference is
significant at the 10% level. Furthermore, these transfers do not appear to displace transfers within
the immediate family or to individuals outside of the neighborhood (column (2)), suggesting a net
gain in informal insurance.
Since improvements in risk-sharing have implications for default rates, the next three columns
19Clients in the second loan cycle were subject to experimental variation in the timing of first repayment, but itwas independent of their first loan repayment schedule. See Appendix 7.3 for details.
20Results are very similar if we vary the time period over which default is defined.
13
look at default in the experimental and subsequent loan cycles. Column (3) shows that frequent
meetings are not associated with lower default in the first loan cycle. An important caveat is that
default is extremely low for first-time borrowers (1.8%), presumably due to the fact that, following
standard MFI practice, first loan sizes are below client demand for credit and “carrying capacity.”
However, once clients have graduated to larger loans, differences in default emerge despite the fact
that all clients have by that point converged to the same meeting frequency (fortnightly). Clients
assigned to monthly meetings for their first loan are four times more likely to default on their
second loan relative to clients assigned to weekly meetings for their first loan, and the difference is
statistically significant (column (4)).
Next we examine whether default reductions were concentrated among weekly clients most
likely to experience gains in social contact. The point estimates in column (5) indicate that this is the
case: There is a large and significant effect of weekly meeting on default only among clients with a
sufficient number of close neighbors and/or distant relatives in their group. This is reassuring since it
provides evidence that default patterns are not driven by the direct effect of meeting frequency. That
is, if the main channel of influence were the meeting itself (e.g. the oath, loan officer indoctrination,
ability to repay in small installments), we would not expect default rates to differ systematically
by features of group composition that do not directly predict default. We interpret the findings in
Table 3 as prima facie evidence that meeting more frequently helped clients build stronger social
ties and then leverage these social ties to deal with shocks (and maintain repayment).
The findings in Table 3 compliment Table 2 results in two ways: First, changes in social
contact that occur as a result of meeting regularly in loan groups have real economic returns and
therefore correspond to economically meaningful changes in social capital. Second, these measurable
returns to new relationships do not appear to be crowding out equally valuable relationships with
people outside of the loan group, as evidenced by lower overall vulnerability to shocks. Hence, we
can conclude that our intervention caused a net gain in social capital.
14
4 The Lottery: Disentangling Channels of Influence
A shortcoming of our survey data is that we cannot directly observe instances of risk-sharing
between group members, only aggregate outcomes (total transfers and default). Hence, to gather
direct evidence on the effect of group meetings on economic cooperation and evaluate the potential
channels of influence, we conducted a field experiment in the form of a promotional lottery more
than a year after clients completed their first loan cycle (average final repayment and survey dates
were April 2007 and July 2008, respectively). Our experiment, a variant of laboratory dictator and
trust games (Forsythe et al., 1994; Berg et al., 1995), was designed to elicit willingness to form
risk-sharing arrangements in a field setting.21
4.1 Design
We drew a random sample of 450 clients and successfully contacted 432 spread across 98 groups,
yielding a final sample of 129 weekly and 321 monthly clients (see Appendix for details). Table
1 provides a randomization check using group-level (Panel A) and client-level (Panel B) variables.
Column (4) shows that the lottery sample is representative of the experimental population, and
columns (5) and (6) examine the balance of voucher randomization (described below) on multiple
characteristics. As before, the two characteristics which are unbalanced remain fraction Muslim
and years in the neighborhood. The weekly clients in the Rs. 200 voucher randomization also
have slightly fewer closer neighbors (compared to monthly counterparts). We continue to report
regressions with the full set of controls and report any instances where the results vary with controls.
The protocol was as follows: Surveyors approached each selected client in her house and
invited her to enter a promotional lottery for the new VWS retail store.22 The lottery prize was gift
vouchers worth Rs. 200 ($5) redeemable at the store (see Appendix for the surveyor script). Aside
21In the dictator game, the experimenter asks an individual (sender) to divide a fixed amount of money betweenherself and another individual (receiver). In the trust game, the money transfer is typically tripled by the experimenterand the receiver is explicitly asked how much she wishes to send back to the sender.
22Importantly, the lottery protocol was conducted before the Table 4 survey data were collected.
15
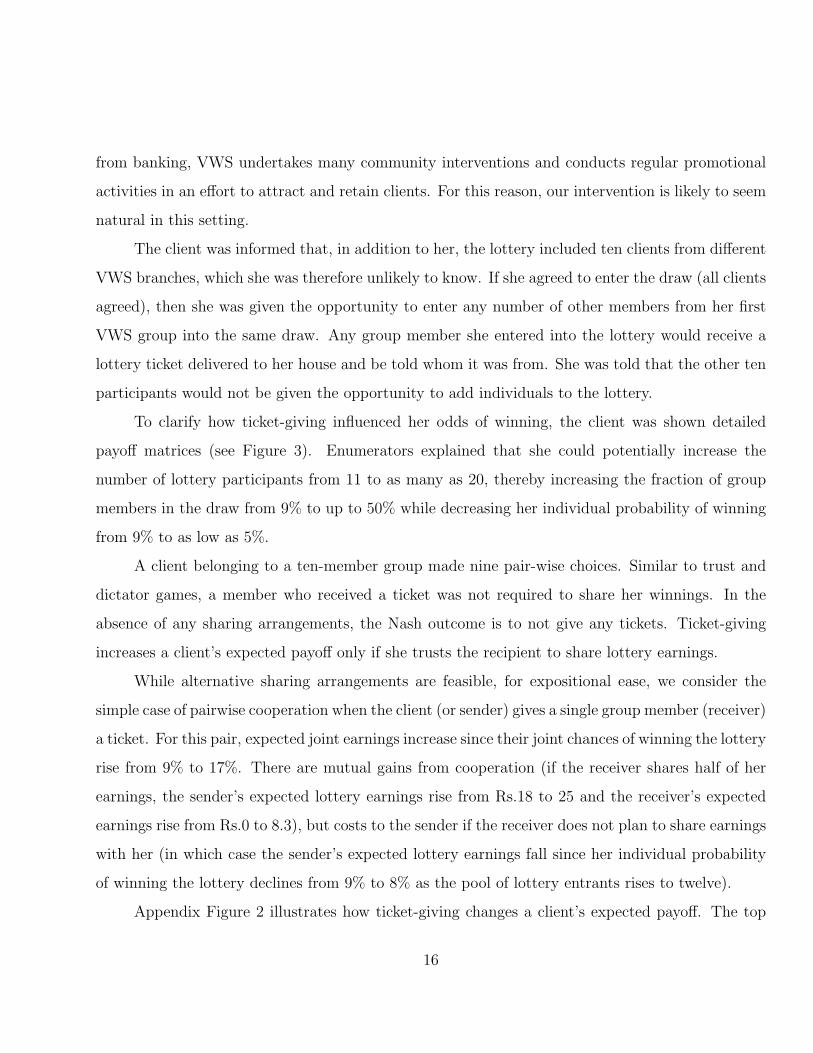
from banking, VWS undertakes many community interventions and conducts regular promotional
activities in an effort to attract and retain clients. For this reason, our intervention is likely to seem
natural in this setting.
The client was informed that, in addition to her, the lottery included ten clients from different
VWS branches, which she was therefore unlikely to know. If she agreed to enter the draw (all clients
agreed), then she was given the opportunity to enter any number of other members from her first
VWS group into the same draw. Any group member she entered into the lottery would receive a
lottery ticket delivered to her house and be told whom it was from. She was told that the other ten
participants would not be given the opportunity to add individuals to the lottery.
To clarify how ticket-giving influenced her odds of winning, the client was shown detailed
payoff matrices (see Figure 3). Enumerators explained that she could potentially increase the
number of lottery participants from 11 to as many as 20, thereby increasing the fraction of group
members in the draw from 9% to up to 50% while decreasing her individual probability of winning
from 9% to as low as 5%.
A client belonging to a ten-member group made nine pair-wise choices. Similar to trust and
dictator games, a member who received a ticket was not required to share her winnings. In the
absence of any sharing arrangements, the Nash outcome is to not give any tickets. Ticket-giving
increases a client’s expected payoff only if she trusts the recipient to share lottery earnings.
While alternative sharing arrangements are feasible, for expositional ease, we consider the
simple case of pairwise cooperation when the client (or sender) gives a single group member (receiver)
a ticket. For this pair, expected joint earnings increase since their joint chances of winning the lottery
rise from 9% to 17%. There are mutual gains from cooperation (if the receiver shares half of her
earnings, the sender’s expected lottery earnings rise from Rs.18 to 25 and the receiver’s expected
earnings rise from Rs.0 to 8.3), but costs to the sender if the receiver does not plan to share earnings
with her (in which case the sender’s expected lottery earnings fall since her individual probability
of winning the lottery declines from 9% to 8% as the pool of lottery entrants rises to twelve).
Appendix Figure 2 illustrates how ticket-giving changes a client’s expected payoff. The top
16
line shows her expected payoff when the receiver shares half her winnings with the client, and the
bottom line shows the reduction in her payoff if no receiver shares. The figure also illustrates a key
difference between our lottery and the trust game: Pairwise returns in the lottery depend on total
tickets given. If the sender trusts all other group members equally then she would give equally to
all group members. However, if trust of group members varies, then recognition of this externality
will further constrain ticket-giving to less trusted group members.23
Finally, to isolate cooperative from purely altruistic motives for giving tickets, our experiment
varied the divisibility of the lottery prize. For a randomly chosen half of participants, the lottery
prize was one Rs. 200 voucher, while for the other half it consisted of four Rs. 50 vouchers.
Appendix Figure 3 provides pictures of these vouchers. A voucher could only be redeemed by one
client and all vouchers expired within two weeks.
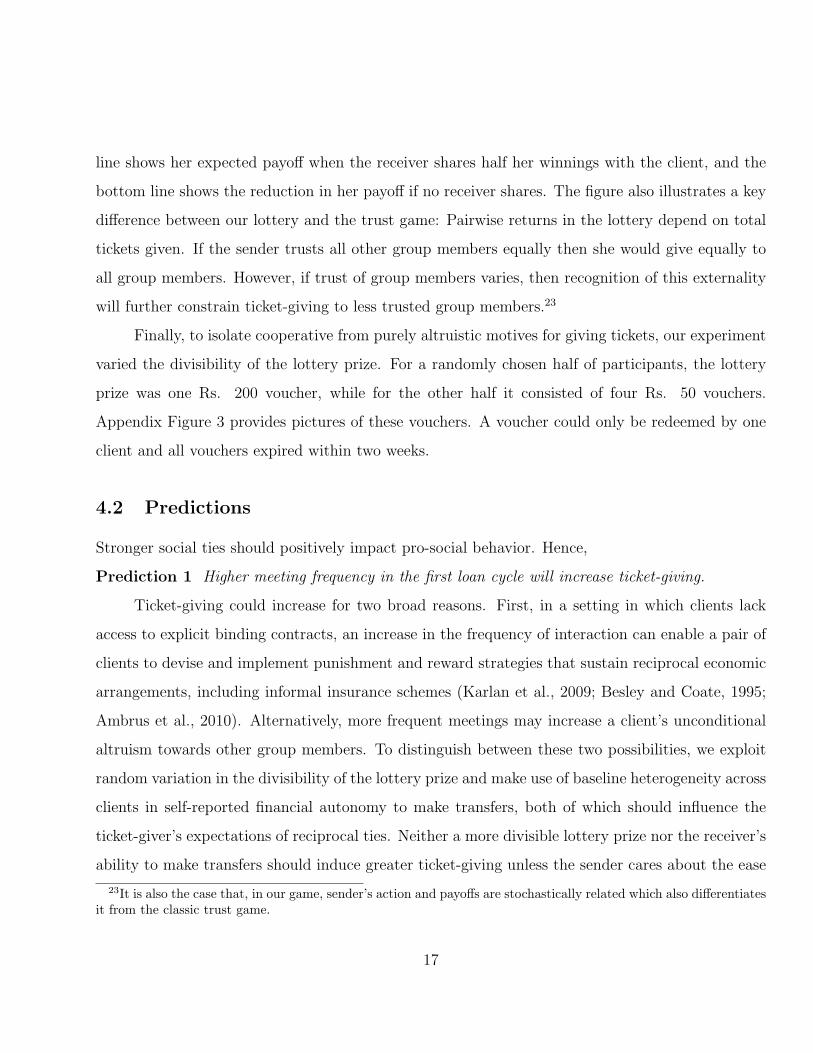
4.2 Predictions
Stronger social ties should positively impact pro-social behavior. Hence,
Prediction 1 Higher meeting frequency in the first loan cycle will increase ticket-giving.
Ticket-giving could increase for two broad reasons. First, in a setting in which clients lack
access to explicit binding contracts, an increase in the frequency of interaction can enable a pair of
clients to devise and implement punishment and reward strategies that sustain reciprocal economic
arrangements, including informal insurance schemes (Karlan et al., 2009; Besley and Coate, 1995;
Ambrus et al., 2010). Alternatively, more frequent meetings may increase a client’s unconditional
altruism towards other group members. To distinguish between these two possibilities, we exploit
random variation in the divisibility of the lottery prize and make use of baseline heterogeneity across
clients in self-reported financial autonomy to make transfers, both of which should influence the
ticket-giver’s expectations of reciprocal ties. Neither a more divisible lottery prize nor the receiver’s
ability to make transfers should induce greater ticket-giving unless the sender cares about the ease
23It is also the case that, in our game, sender’s action and payoffs are stochastically related which also differentiatesit from the classic trust game.
17
of reciprocal transfers. Hence,
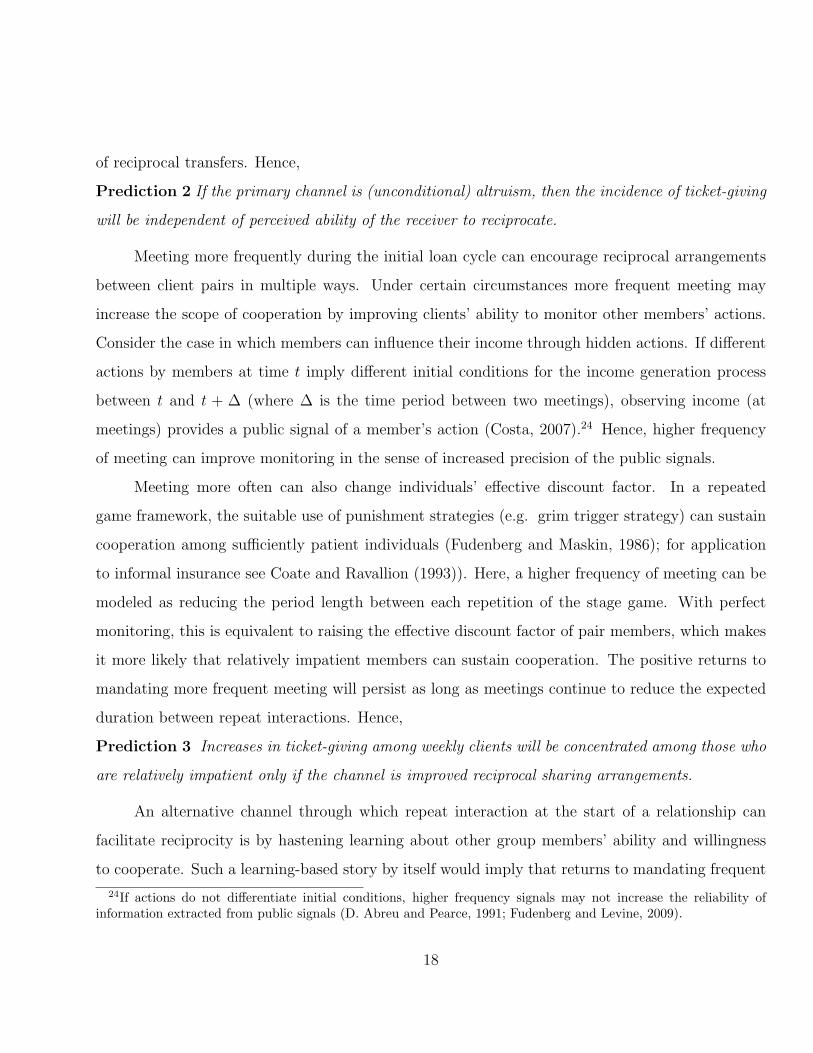
Prediction 2 If the primary channel is (unconditional) altruism, then the incidence of ticket-giving
will be independent of perceived ability of the receiver to reciprocate.
Meeting more frequently during the initial loan cycle can encourage reciprocal arrangements
between client pairs in multiple ways. Under certain circumstances more frequent meeting may
increase the scope of cooperation by improving clients’ ability to monitor other members’ actions.
Consider the case in which members can influence their income through hidden actions. If different
actions by members at time t imply different initial conditions for the income generation process
between t and t + ∆ (where ∆ is the time period between two meetings), observing income (at
meetings) provides a public signal of a member’s action (Costa, 2007).24 Hence, higher frequency
of meeting can improve monitoring in the sense of increased precision of the public signals.
Meeting more often can also change individuals’ effective discount factor. In a repeated
game framework, the suitable use of punishment strategies (e.g. grim trigger strategy) can sustain
cooperation among sufficiently patient individuals (Fudenberg and Maskin, 1986); for application
to informal insurance see Coate and Ravallion (1993)). Here, a higher frequency of meeting can be
modeled as reducing the period length between each repetition of the stage game. With perfect
monitoring, this is equivalent to raising the effective discount factor of pair members, which makes
it more likely that relatively impatient members can sustain cooperation. The positive returns to
mandating more frequent meeting will persist as long as meetings continue to reduce the expected
duration between repeat interactions. Hence,
Prediction 3 Increases in ticket-giving among weekly clients will be concentrated among those who
are relatively impatient only if the channel is improved reciprocal sharing arrangements.
An alternative channel through which repeat interaction at the start of a relationship can
facilitate reciprocity is by hastening learning about other group members’ ability and willingness
to cooperate. Such a learning-based story by itself would imply that returns to mandating frequent
24If actions do not differentiate initial conditions, higher frequency signals may not increase the reliability ofinformation extracted from public signals (D. Abreu and Pearce, 1991; Fudenberg and Levine, 2009).
18
interaction will diminish over time. To evaluate the importance of learning about types in explaining
our results, we exploit the following fact: At the time of our lottery, a subset of clients were on
a subsequent loan cycle in which they had been re-randomized onto weekly or monthly schedules.
This allows us to test the following prediction:
Prediction 4 If the primary channel is learning, the effect of more frequent interaction will be
significantly lower in future loan cycles.
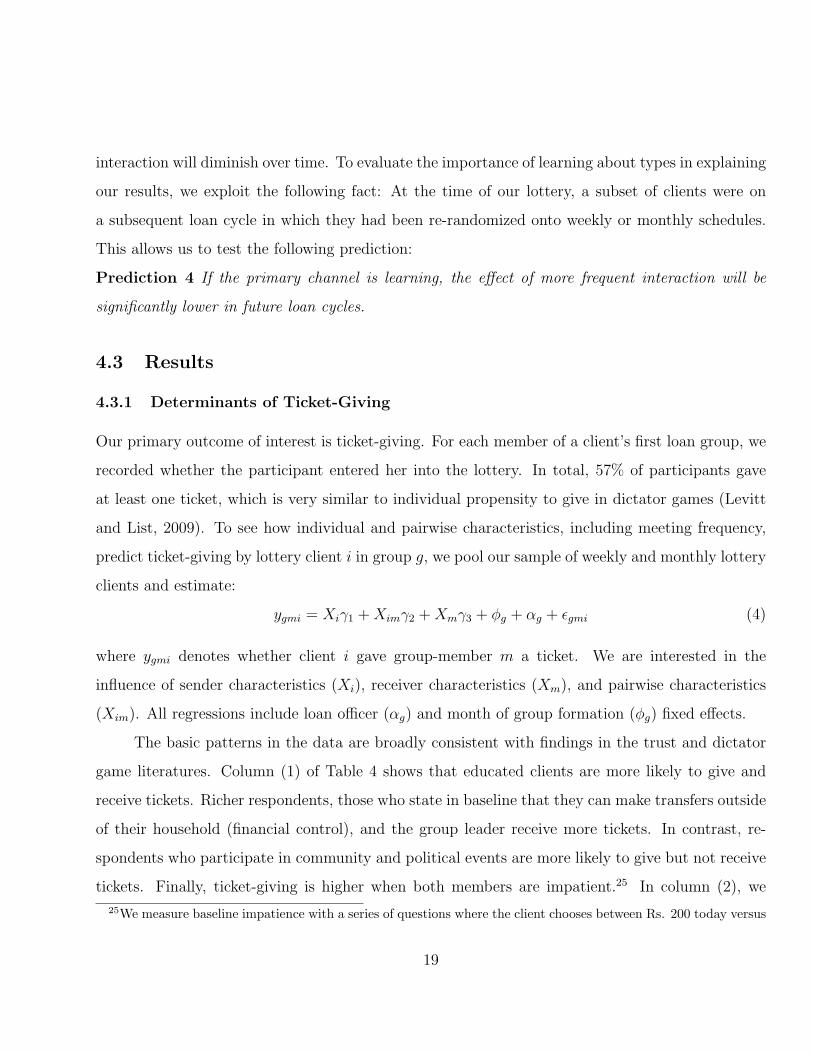
4.3 Results
4.3.1 Determinants of Ticket-Giving
Our primary outcome of interest is ticket-giving. For each member of a client’s first loan group, we
recorded whether the participant entered her into the lottery. In total, 57% of participants gave
at least one ticket, which is very similar to individual propensity to give in dictator games (Levitt
and List, 2009). To see how individual and pairwise characteristics, including meeting frequency,
predict ticket-giving by lottery client i in group g, we pool our sample of weekly and monthly lottery
clients and estimate:
ygmi = Xiγ1 +Ximγ2 +Xmγ3 + φg + αg + εgmi (4)
where ygmi denotes whether client i gave group-member m a ticket. We are interested in the
influence of sender characteristics (Xi), receiver characteristics (Xm), and pairwise characteristics
(Xim). All regressions include loan officer (αg) and month of group formation (φg) fixed effects.
The basic patterns in the data are broadly consistent with findings in the trust and dictator
game literatures. Column (1) of Table 4 shows that educated clients are more likely to give and
receive tickets. Richer respondents, those who state in baseline that they can make transfers outside
of their household (financial control), and the group leader receive more tickets. In contrast, re-
spondents who participate in community and political events are more likely to give but not receive
tickets. Finally, ticket-giving is higher when both members are impatient.25 In column (2), we
25We measure baseline impatience with a series of questions where the client chooses between Rs. 200 today versus
19
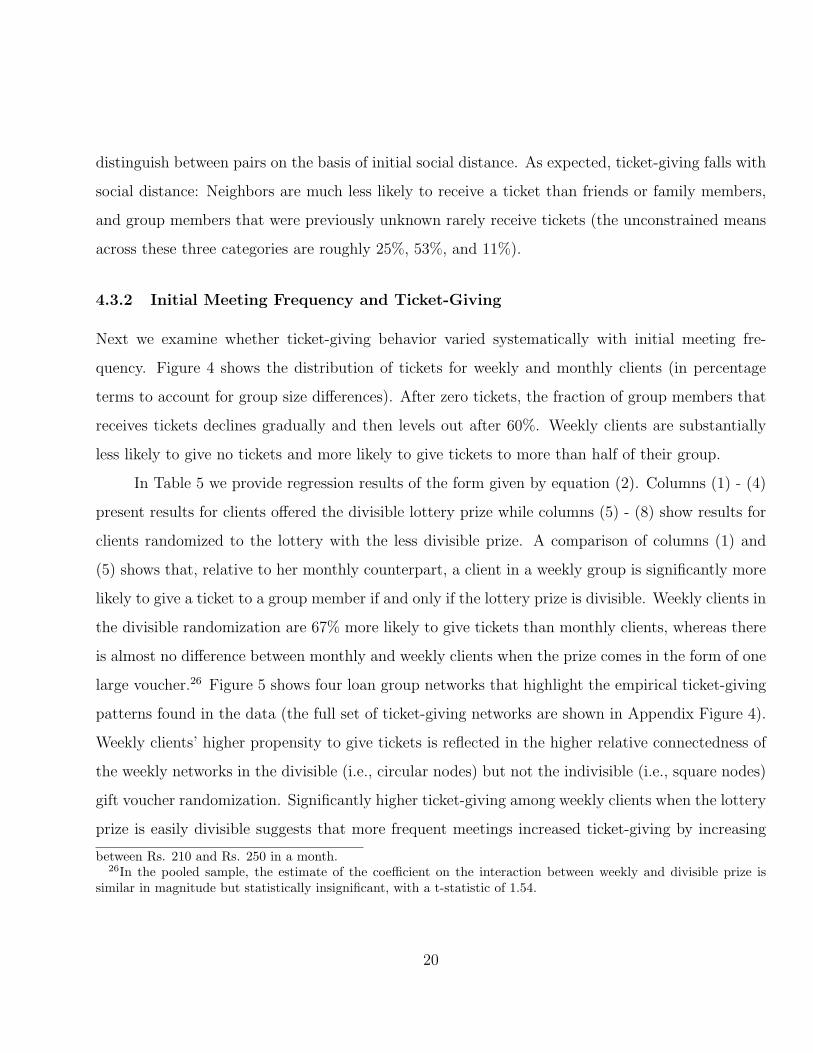
distinguish between pairs on the basis of initial social distance. As expected, ticket-giving falls with
social distance: Neighbors are much less likely to receive a ticket than friends or family members,
and group members that were previously unknown rarely receive tickets (the unconstrained means
across these three categories are roughly 25%, 53%, and 11%).
4.3.2 Initial Meeting Frequency and Ticket-Giving
Next we examine whether ticket-giving behavior varied systematically with initial meeting fre-
quency. Figure 4 shows the distribution of tickets for weekly and monthly clients (in percentage
terms to account for group size differences). After zero tickets, the fraction of group members that
receives tickets declines gradually and then levels out after 60%. Weekly clients are substantially
less likely to give no tickets and more likely to give tickets to more than half of their group.
In Table 5 we provide regression results of the form given by equation (2). Columns (1) - (4)
present results for clients offered the divisible lottery prize while columns (5) - (8) show results for
clients randomized to the lottery with the less divisible prize. A comparison of columns (1) and
(5) shows that, relative to her monthly counterpart, a client in a weekly group is significantly more
likely to give a ticket to a group member if and only if the lottery prize is divisible. Weekly clients in
the divisible randomization are 67% more likely to give tickets than monthly clients, whereas there
is almost no difference between monthly and weekly clients when the prize comes in the form of one
large voucher.26 Figure 5 shows four loan group networks that highlight the empirical ticket-giving
patterns found in the data (the full set of ticket-giving networks are shown in Appendix Figure 4).
Weekly clients’ higher propensity to give tickets is reflected in the higher relative connectedness of
the weekly networks in the divisible (i.e., circular nodes) but not the indivisible (i.e., square nodes)
gift voucher randomization. Significantly higher ticket-giving among weekly clients when the lottery
prize is easily divisible suggests that more frequent meetings increased ticket-giving by increasing
between Rs. 210 and Rs. 250 in a month.26In the pooled sample, the estimate of the coefficient on the interaction between weekly and divisible prize is
similar in magnitude but statistically insignificant, with a t-statistic of 1.54.
20
expectations of reciprocity.27 If frequent meetings had only increased unconditional altruism, then
ticket-giving would be independent of voucher divisibility.
In columns (2) and (6), we examine whether ticket-giving is sensitive to a client’s subjective
discount rate. If expectations of reciprocal transfers sustain ticket-giving, ticket-giving should only
be observed among sufficiently patient client pairs, and more frequent interaction can potentially
allow relatively impatient pairs to sustain cooperation. To investigate this, we create a dummy that
equals one if both members of a pair prefer Rs. 200 today to Rs. 250 in a month. In column (2),
we observe that weekly meetings make it more likely that impatient pairs engage in ticket-giving:
the coefficient estimate on the interaction between weekly and impatience is large and statistically
significant. Again, this relationship is only present for clients assigned to the divisible lottery prize,
consistent with the fact that ticket-giving is no greater for weekly clients when the prize is less
divisible. This pattern suggests that risk-sharing concerns underlie increased ticket-giving among
weekly clients, since impatience should not influence unconditionally altruistic behavior.28
In columns (3) and (7), we examine whether ticket giving is sensitive to the level of financial
control exercised by the receiver. In total, 89% of clients responded affirmatively to the baseline
survey question, “If a close relative like your parents or siblings fell sick and needed money, would
you be able to lend money to that relative, if you had the extra money?” If risk-sharing motivates
the higher level of ticket-giving observed in the divisible voucher case, and assuming that this
characteristic is to some extent observable to other members, we would expect a client to avoid
giving tickets to those who are unable to reciprocate. In line with this, we see that marginal ticket-
giving is concentrated among the set of potential receivers who report that they have the financial
independence to make transfers outside of the household.
Finally, in columns (4) and (8), we examine whether the weekly effect differs by initial social
27Anecdotal evidence from conversations with clients also suggested that they believed multiple vouchers increasedthe likelihood that those they gave tickets to would share any future winnings.
28We hypothesize that the net positive effect of pairwise impatience on ticket giving among weekly clients resultsfrom impatient clients likely having smaller social networks before the start of the loan cycle, and consequentlyhaving higher demand for risk-sharing arrangements.
21
distance. The coefficient estimates on the interaction terms indicate that increased ticket-giving
by weekly clients is driven by increased giving to close neighbors and distant family. The fact that
increased ticket-giving by weekly clients is concentrated among the categories of pairs in which we
also observe a significant effect on social contact (Table 2) is consistent with our interpretation
that higher long-run social contact increased propensity to form risk-sharing arrangements. The
fact that moving from a monthly to a weekly repayment schedule did not influence ticket-giving
to close family and friends provides an important placebo check: For immediate family members
or old friends, repayment schedules should not influence learning or monitoring since these pairs
presumably know each other well and see each other often outside of meetings. Also consistent with
this is the fact that ticket-giving is no higher among weekly relative to monthly clients who report
that they never see one another: Both sets of clients give tickets to roughly 15% of group members
whom they have not seen at all in the past 30 days.29
The fact that we observe no difference among monthly clients’ ticket-giving across the two
voucher categories, along with the fact that for monthly clients ticket-giving is independent of
impatience and ability to reciprocate, suggests that either ticket-giving among these members is not
primarily motivated by reciprocity, or that only marginal risk-sharing arrangements are sensitive to
small barriers to trust such as prize divisibility. A few empirical patterns support this interpretation:
First, 61% of tickets given by monthly clients do not appear to be reciprocal arrangements, based
on the fact that they are given either to individuals they have not seen in the last 30 days at the
time of the lottery or from whom they claim they would not ask for help in case of emergency, or
to immediate family members. Second, survey data indicate that monthly meetings did not lead
to long-run changes in social capital, indicating an absence of relatively new informal risk-sharing
arrangements among monthly clients. For instance, monthly group members are no more likely to
report giving or receiving transfers to individuals outside of the immediate family between baseline
and follow-up (unreported).
To examine whether ticket-giving was associated with reciprocal transfers, six months after
29Authors’ tabulations.
22
the lottery, we surveyed 39 of the 47 clients who received a ticket from a group member and won that
lottery.30. Although we do not observe explicit voucher-sharing (the winners always redeemed their
vouchers as opposed to giving them away), nearly all clients (85%) remembered who gave them
their ticket, and a quarter reported greater willingness to share post-lottery. We also observe a
significant difference across weekly and monthly clients, consistent with higher rates of risk-sharing
relative to altruism among ticket-givers – 7/23 (30.4%) of weekly clients but only 1/16 (6.3%) of
monthly clients report such willingness.31
4.3.3 Hastening versus Sustaining Cooperation
As explained in Section 4.2, more frequent interaction may help sustain cooperative arrangements
indefinitely, or it may simply hasten the formation of cooperative arrangements through more rapid
learning about client types. One basic piece of evidence against the learning story is that, at the
time of the lottery, the majority (69%) of clients have been in loan groups together for almost two
years, by which point types should arguably be revealed even among those who only met monthly
for the first several months (during the experiment).
To further disentangle these two channels, we exploit experimental variation in meeting fre-
quency at two different points in time. At the time of our lottery, roughly a third of the clients (137
out of 432) were on a subsequent VWS loan cycle in which groups were re-randomized into weekly
and monthly meetings (see Appendix Figure 1). VWS has a preference for keeping client groups
together across cycles, but group members are replaced when there is drop out. On average, 60%
of current group members were also in the first loan group.
We consider the sub-sample of 48 third loan cycle clients who had been on the weekly schedule
in the first intervention and examine whether current meeting frequency influences current levels of
30Among this subset of ”indirect” lottery winners, 25 were in weekly and 22 were in monthly groups.31The specific question was, “If your friend asked to borrow money or goods from you in the future, do you think
you are more, less, or equally likely to share with her than you were before the lottery?” In terms of actual sharing,the most commonly shared goods (post-lottery) were food and sarees. In two cases, winners reported lending moneyto the group member who had given them the ticket.
23
cooperation. This allows us to observe whether forcing clients who already know each other well to
continue interacting regularly further increases cooperation. If so, then it is likely that, in addition
to any short-run learning effects that hasten cooperation between members, meeting frequency has
persistent benefits via monitoring or discount rate channels.
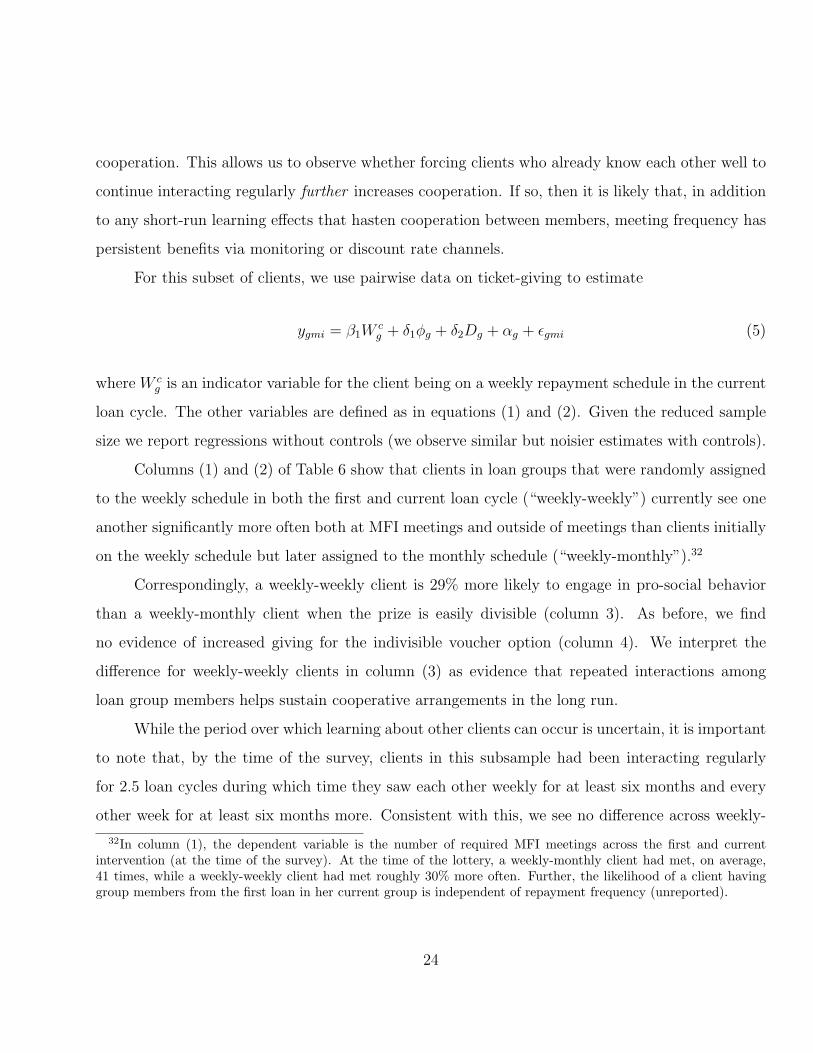
For this subset of clients, we use pairwise data on ticket-giving to estimate
ygmi = β1Wcg + δ1φg + δ2Dg + αg + εgmi (5)
where W cg is an indicator variable for the client being on a weekly repayment schedule in the current
loan cycle. The other variables are defined as in equations (1) and (2). Given the reduced sample
size we report regressions without controls (we observe similar but noisier estimates with controls).
Columns (1) and (2) of Table 6 show that clients in loan groups that were randomly assigned
to the weekly schedule in both the first and current loan cycle (“weekly-weekly”) currently see one
another significantly more often both at MFI meetings and outside of meetings than clients initially
on the weekly schedule but later assigned to the monthly schedule (“weekly-monthly”).32
Correspondingly, a weekly-weekly client is 29% more likely to engage in pro-social behavior
than a weekly-monthly client when the prize is easily divisible (column 3). As before, we find
no evidence of increased giving for the indivisible voucher option (column 4). We interpret the
difference for weekly-weekly clients in column (3) as evidence that repeated interactions among
loan group members helps sustain cooperative arrangements in the long run.
While the period over which learning about other clients can occur is uncertain, it is important
to note that, by the time of the survey, clients in this subsample had been interacting regularly
for 2.5 loan cycles during which time they saw each other weekly for at least six months and every
other week for at least six months more. Consistent with this, we see no difference across weekly-
32In column (1), the dependent variable is the number of required MFI meetings across the first and currentintervention (at the time of the survey). At the time of the lottery, a weekly-monthly client had met, on average,41 times, while a weekly-weekly client had met roughly 30% more often. Further, the likelihood of a client havinggroup members from the first loan in her current group is independent of repayment frequency (unreported).
24
weekly and weekly-monthly clients’ in the propensity to remember the names of their first loan
group members at the time of survey (column 5).
4.4 Social Capital and Default
The above evidence suggests that ticket-giving between clients reflects reciprocal economic ties.
Further, the strength of these ties is influenced by group composition and meeting frequency during
the lottery client’s first loan cycle. Based on these patterns, we can directly estimate the effect of
these ties on default risk using an instrumental variables (IV) approach in which random assignment
to a weekly group in the first loan cycle and having a distant relative or neighbor as a group member
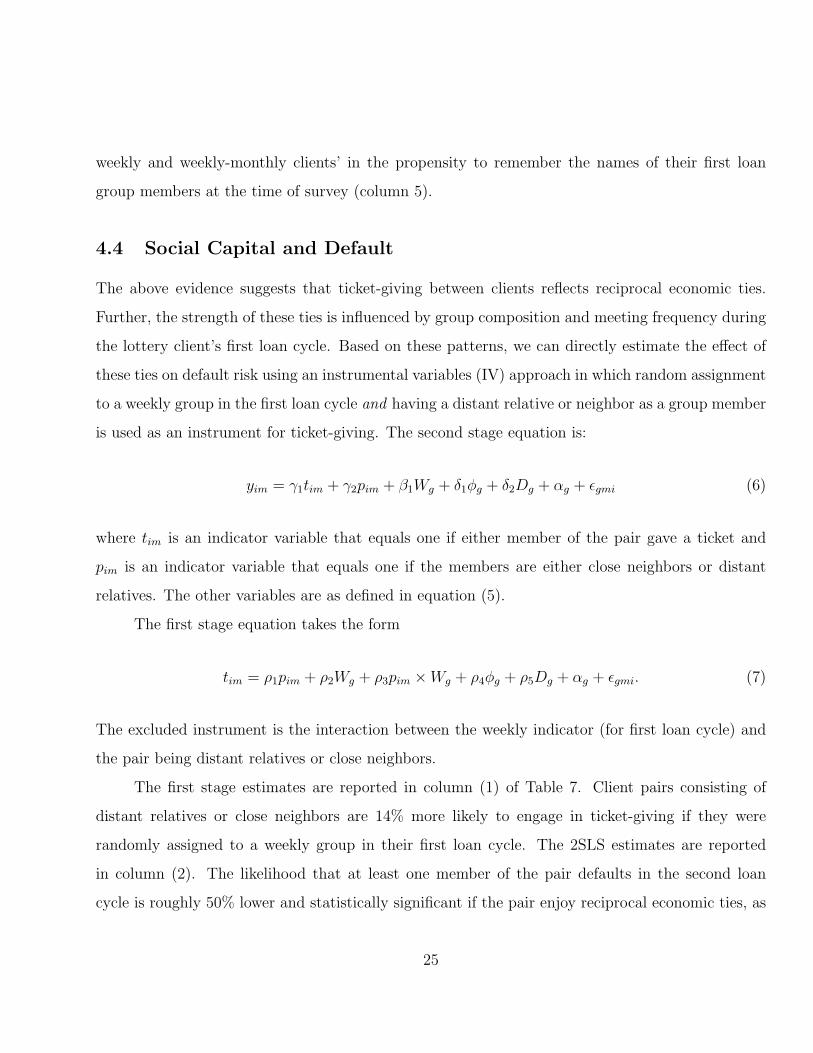
is used as an instrument for ticket-giving. The second stage equation is:
yim = γ1tim + γ2pim + β1Wg + δ1φg + δ2Dg + αg + εgmi (6)
where tim is an indicator variable that equals one if either member of the pair gave a ticket and
pim is an indicator variable that equals one if the members are either close neighbors or distant
relatives. The other variables are as defined in equation (5).
The first stage equation takes the form
tim = ρ1pim + ρ2Wg + ρ3pim ×Wg + ρ4φg + ρ5Dg + αg + εgmi. (7)
The excluded instrument is the interaction between the weekly indicator (for first loan cycle) and
the pair being distant relatives or close neighbors.
The first stage estimates are reported in column (1) of Table 7. Client pairs consisting of
distant relatives or close neighbors are 14% more likely to engage in ticket-giving if they were
randomly assigned to a weekly group in their first loan cycle. The 2SLS estimates are reported
in column (2). The likelihood that at least one member of the pair defaults in the second loan
cycle is roughly 50% lower and statistically significant if the pair enjoy reciprocal economic ties, as
25
evidenced by ticket-giving in the lottery.33
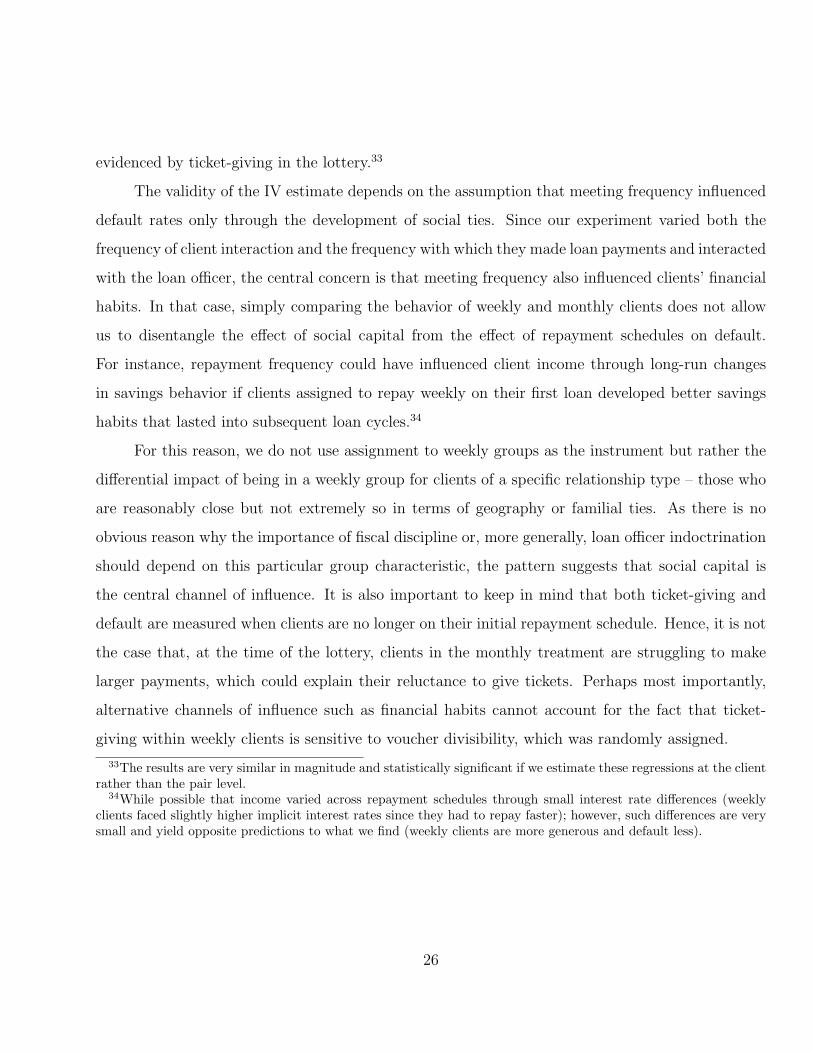
The validity of the IV estimate depends on the assumption that meeting frequency influenced
default rates only through the development of social ties. Since our experiment varied both the
frequency of client interaction and the frequency with which they made loan payments and interacted
with the loan officer, the central concern is that meeting frequency also influenced clients’ financial
habits. In that case, simply comparing the behavior of weekly and monthly clients does not allow
us to disentangle the effect of social capital from the effect of repayment schedules on default.
For instance, repayment frequency could have influenced client income through long-run changes
in savings behavior if clients assigned to repay weekly on their first loan developed better savings
habits that lasted into subsequent loan cycles.34
For this reason, we do not use assignment to weekly groups as the instrument but rather the
differential impact of being in a weekly group for clients of a specific relationship type – those who
are reasonably close but not extremely so in terms of geography or familial ties. As there is no
obvious reason why the importance of fiscal discipline or, more generally, loan officer indoctrination
should depend on this particular group characteristic, the pattern suggests that social capital is
the central channel of influence. It is also important to keep in mind that both ticket-giving and
default are measured when clients are no longer on their initial repayment schedule. Hence, it is not
the case that, at the time of the lottery, clients in the monthly treatment are struggling to make
larger payments, which could explain their reluctance to give tickets. Perhaps most importantly,
alternative channels of influence such as financial habits cannot account for the fact that ticket-
giving within weekly clients is sensitive to voucher divisibility, which was randomly assigned.
33The results are very similar in magnitude and statistically significant if we estimate these regressions at the clientrather than the pair level.
34While possible that income varied across repayment schedules through small interest rate differences (weeklyclients faced slightly higher implicit interest rates since they had to repay faster); however, such differences are verysmall and yield opposite predictions to what we find (weekly clients are more generous and default less).
26
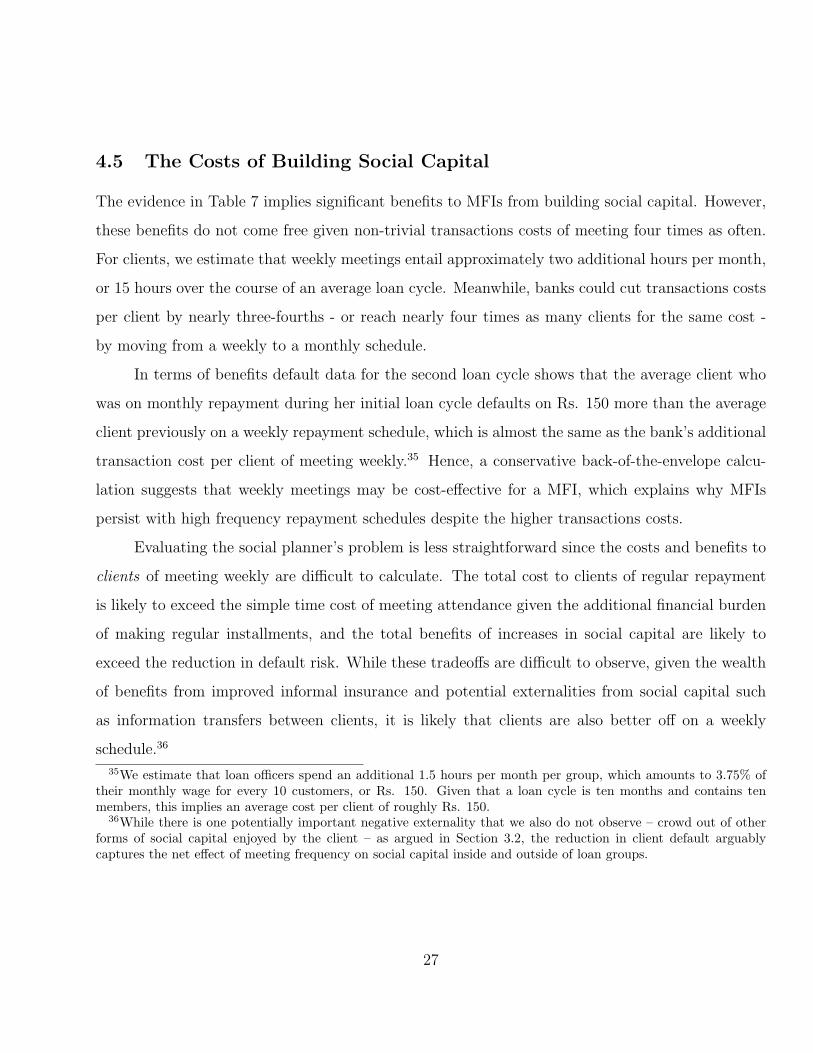
4.5 The Costs of Building Social Capital
The evidence in Table 7 implies significant benefits to MFIs from building social capital. However,
these benefits do not come free given non-trivial transactions costs of meeting four times as often.
For clients, we estimate that weekly meetings entail approximately two additional hours per month,
or 15 hours over the course of an average loan cycle. Meanwhile, banks could cut transactions costs
per client by nearly three-fourths - or reach nearly four times as many clients for the same cost -
by moving from a weekly to a monthly schedule.
In terms of benefits default data for the second loan cycle shows that the average client who
was on monthly repayment during her initial loan cycle defaults on Rs. 150 more than the average
client previously on a weekly repayment schedule, which is almost the same as the bank’s additional
transaction cost per client of meeting weekly.35 Hence, a conservative back-of-the-envelope calcu-
lation suggests that weekly meetings may be cost-effective for a MFI, which explains why MFIs
persist with high frequency repayment schedules despite the higher transactions costs.
Evaluating the social planner’s problem is less straightforward since the costs and benefits to
clients of meeting weekly are difficult to calculate. The total cost to clients of regular repayment
is likely to exceed the simple time cost of meeting attendance given the additional financial burden
of making regular installments, and the total benefits of increases in social capital are likely to
exceed the reduction in default risk. While these tradeoffs are difficult to observe, given the wealth
of benefits from improved informal insurance and potential externalities from social capital such
as information transfers between clients, it is likely that clients are also better off on a weekly
schedule.36
35We estimate that loan officers spend an additional 1.5 hours per month per group, which amounts to 3.75% oftheir monthly wage for every 10 customers, or Rs. 150. Given that a loan cycle is ten months and contains tenmembers, this implies an average cost per client of roughly Rs. 150.
36While there is one potentially important negative externality that we also do not observe – crowd out of otherforms of social capital enjoyed by the client – as argued in Section 3.2, the reduction in client default arguablycaptures the net effect of meeting frequency on social capital inside and outside of loan groups.
27
5 Conclusions
A widely held belief across social scientists in many disciplines is that social interactions encourage
norms of reciprocity and trust. In fact, participation in groups is often used to measure an indi-
vidual’s or community’s degree of economic cooperation (see, for instance, Narayan and Pritchett,
1999; Alesina and Ferrara, 2002). However, while the notion is theoretically well-grounded, it is
not clear from previous work whether the correlation between social distance and trust reflects the
causal effect of interaction on economic cooperation. Using field experiments, we provide rigor-
ous evidence that repeat interactions can in practice facilitate cooperative behavior by enabling
individuals to sustain reciprocal economic ties.
Further, our results demonstrate that development programs can increase social ties and
enhance social capital among members of a highly localized community in a strikingly short amount
of time. In our study, close neighbors from similar socio-economic backgrounds got to know each
other well enough to cooperate with only the outside stimulus of micro-finance meetings. While
many authors have suggested a link between social capital and MFI default rates, ours is the first
study to provide rigorous evidence on the role of microfinance in building social capital.
Our findings support the idea that complementarities in social capital acquisition creates the
possibility of multiple equilibria (Glaeser et al., 2002). This, in turn, suggests potentially large gains
from policies which facilitate interaction and help coordinate social capital investments, especially
in low income countries where formal risk-sharing arrangements remain limited. By broadening and
strengthening social networks the group-based lending model used by MFIs may provide an impor-
tant impetus for the economic development of poor communities and the empowerment of women.
While we cannot expect all communities to respond equally to such stimuli, our findings are likely
to be most readily applicable to the fast-growing urban and peri-urban areas of cities in developing
countries (such as Kolkata) where microfinance is spreading the most rapidly. Understanding how
other development programs or public policies can be designed to enhance the social infrastructure
of poor communities is a promising area of future research.
28
References
Alesina, A. and E. L. Ferrara (2002). Who Trusts Others? Journal of Public Economics 85 (2),
207–234.
Ambrus, A., M. Mobius, and A. Szeidl (2010). Consumption Risk-sharing in Social Networks .
mimeo.
Berg, J., J. Dickhaut, and K. McCabe (1995). Trust, Reciprocity and Social History. Games and
Economic Behavior 10, 122–142.
Besley, T. and S. Coate (1995). Group Lending, Repayment Incentives and Social Collateral. Journal
of Development Economics 46 (1), 1–18.
Carter, M. and M. Castillo (2003). Does It Take More than Markets to Get Ahead? An Experimental
Approach to Social Capital in South Africa. Agricultural and Applied Economics Staff Paper
Series, Paper No. 448, University of Wisconsin.
Carter, M. and M. Castillo (2004). Morals, Markets and Mutual Insurance: Using Economic
Experiments to Study Recovery from Hurricane Mitch. In C. Barrett (Ed.), Exploring the Moral
Dimensions of Economic Behavior. Routledge.
Coate, S. and M. Ravallion (1993). Reciprocity without Commitment: Characterization and Per-
formance of Informal Risk-Sharing. Journal of Development Economics 40 (1), 1–24.
Costa, A. O. (2007). Frequent Monitoring in Repeated Games under Brownian Uncertainty. Mimeo,
Universidad Carlos III de Madrid.
Costa, D. and M. Kahn (2003). Understanding the Decline in American Social Capital, 1953-1998.
Kyklos 56 (1), 17–46.
D. Abreu, P. M. and D. Pearce (1991). Information and Timing in Repeated Partnerships. Econo-
metrica 59.
29
DiPasquale, D. and E. Glaeser (1999). Incentives and Social Capital: Are Homeowners Better
Citizens? Journal of Urban Economics 45 (2), 354–384.
Do, Q.-A., S. Leider, M. Mobius, and T. Rosenblat (2009). Directed Altruism and Enforced Reci-
procity in Social Networks. Quarterly Journal of Economics, forthcoming 124 (4).
Forsythe, R., J. Horowitz, N.Savin, and M. Sefton (1994). Fairness in Simple Bargaining Games.
Games and Economic Behavior 6, 347–69.
Fudenberg, D. and D. Levine (2009). Repeated Games with Frequent Signals. Quarterly Journal
of Economics 124, 233–265.
Fudenberg, D. and E. Maskin (1986). Folk Theorem for Repeated Games with Discounting or with
Incomplete Information. Econometrica 54, 533–554.
Ghatak, M. and T. W. Guinnane (1999). The Economics of Lending with Joint Liability: Theory
and Practice. Journal of Development Economics 60 (1), 195–228.
Glaeser, E., D. Laibson, and B. Sacerdote (2002). An Economic Approach to Social Capital.
Economic Journal 112 (483), 437–458.
Glaeser, E., D. Laibson, J. Scheinkman, and C. Soutter (2000). Measuring Trust. Quarterly Journal
of Economics 115 (3), 811–846.
Gneezy, U., W.Guth, and F. Verboven (2000). Presents or Investments? An Experimental Analysis.
Journal of Economic Psychology 21 (5), 481–493.
Guiso, L., P. Sapienza, and L. Zingales (2004). The Role of Social Capital in Financial Development.
American Economic Review 94 (3), 526–556.
Humphreys, N., J. Fearon, and J. Weinstein (2009). Can Development Aid Contribute to Social
Cohesion After Civil War? American Economic Review 99 (2), 287–291.
30
Karlan, D. (2005). Using Experimental Economics to Measure Social Capital and Predict Real
Financial Decisions. American Economic Review 95 (5), 1688–1699.
Karlan, D. (2007). Social Connections and Group Banking. Economic Journal 117 (517), F52–F84,
02.
Karlan, D. and X. Gine (2009). Group versus Individual Liability: Long Term Evidence from
Philippine Microcredit Lending Groups. Working Paper.
Karlan, D., M. Mobius, T. Rosenblat, and A. Szeidl (2009). Trust and Social Collateral. Quarterly
Journal of Economics 124, 1307–1361.
Kling, J., J. Liebman, and L. Katz (2007). Experimental Analysis of Neighborhood Effects. Econo-
metrica 75, 83–119.
Knack, S. and P. Keefer (1997). Does Social Capital Have an Economic Payoff? A Cross-Country
Investigation. Quarterly Journal of Economics 112 (4), 1251–1288.
Kreps, D., P. Milgrom, J. Roberts, and R. Wilson (1982). Rational Cooperation in the Finitely
Repeated Prisoner’s Dilemma. Journal of Economic Theory 27, 245–52.
Larance, L. (2001). Fostering Social Capital Through NGO Design: Grameen Bank Membership in
Bangladesh. International Social Work 44.
Levitt, S. D. and J. A. List (2009). What Do Laboratory Experiments Measuring Social Preferences
Reveal About the Real World? Journal of Economic Perspectives 21 (2), 153–174.
Ligon, E. and L. Schecter (2008). The Value of Social Networks in Rural Paraguay. University of
Wisconsin Working Paper.
Manski, C. (1993). Identification of Endogenous Social Effects: The Reflection Problem. Review of
Economic Studies 60 (3), 531–542.
31
Manski, C. (2000). Economic Analysis of Social Interactions. Journal of Economic Perspec-
tives 14 (3), 115–136.
Miguel, E., P. Gertler, and David (2005). Does Social Capital Promote Industrialization? Evidence
from a Rapid Industrializer. Review of Economics and Statistics 87 (4), 754–762.
Narayan, D. and L. Pritchett (1999). Cents and Sociability: Household Income and Social Capital
in Rural Tanzania. Economic Development and Cultural Change 47 (4), 871–97.
Olken, B. (2009). Do Television and Radio Destroy Social Capital? Evidence from Indonesian
Villages. American Economic Journal: Applied Economics, forthcoming.
Putnam, R. (1993). Making Democracy Work: Civic Traditions in Modern Italy. Princeton, NJ:
Princeton University Press.
6 Appendix
6.1 VWS Protocol
Group Formation: The loan officer surveys the demographic make-up of a potential neighborhood.
If appropriate, then s/he conducts a meeting to inform potential clients about the VWS loan product
and invites them to a five-day Continuous Group Training (CGT) program. The program runs an
hour each day, and introduces clients to the benefits and responsibilities associated with the loan
product. Each potential loan group is assigned a separate CGT program. At the end of the CGT,
the loan officer forms women who were considered sufficiently informed and interested into a group,
identifies (with group members) a group leader and offers each member of the group a loan.37
Oath The following oath is read out by members in each meeting, “1. We will abide by the rules
and regulation of VWS and try to sort out the problems and disturbances in our locality. 2. We
37Group leader selection criteria include: (i) communicates well with group members and VWS staff; (ii) isresponsible and well accepted by group members; (iii) has a house or place to organize group meeting.
32
will send all our children to school. 3. We will maintain good health and keep our houses always
neat and clean. 4. We will neither accept nor give any dowry. 5. We will lead a simple life and
avoid unnecessary expenses. 6. We will attend the group meeting in time and act as a joint liability
group 7. We will use the loan amount for the right purpose.”
6.2 Lottery Protocol
Probability Script for Main Lottery: In the lottery, you and ten other VWS clients will receive
a ticket. Additionally, you have the option of selecting additional members of your VWS loan group
that you would like us to give tickets to. You can tell us not to give anybody else in your VWS
loan group a ticket, you can tell us to give each person in your group a ticket, or you can tell us
which specific members you would like us to give tickets to.
We will review the effect giving out tickets has on chances of winning. In picture 1 in which you
donot give out any tickets to members of your VWS group, you would have a 1 in 11 chance of
winning. In picture 2, you choose to give a ticket to four other members of your VWS group and
there are 15 tickets total. In that case, you would have a 1 in 15 chance of winning and each of
the members of your VWS group you gave a ticket to would have a 1 in 15 chance of winning. In
picture 3, you give a ticket to nine other members of your VWS group and there are 20 tickets total.
In that case, you would have a 1 in 20 chance of winning and each of the members of your VWS
group you gave a ticket to would have a 1 in 20 chance of winning.
These are only a few examples of what odds of winning you may have after you decide how many
tickets to give out. Remember that whether or not you give out tickets to other members of your
first VWS loan group, you keep the lottery ticket we have given you. Now, before we continue, do
you have any questions about how the lottery will work?
Additional Script for one 200 Rs. voucher: If you win the lottery, you will receive a single
200 Rs. voucher redeemable at the VWS village bazaar. You can use the voucher yourself or give
it to someone in your first VWS group. Either way, the voucher must be used within two weeks.
33
Additionally, only one person can redeem the voucher at the VWS store and the entire value of the
voucher must be used when the voucher is redeemed (so, for example, you cannot use 100 Rs. one
day and save 100 Rs. for another day). To summarize, if you win the lottery, you will be asked to
sign the 200 Rs. voucher when you receive it. However, you are still free to decide whether to keep
or give away the voucher that you receive.
Additional Script for four 50 Rs. vouchers: If you win the lottery, you will receive four 50 Rs.
vouchers redeemable at the VWS village bazaar. You may choose to use all four vouchers yourself,
to give away 1-3 of the vouchers to members of your first VWS group and keep the rest for yourself,
or to give away all of the vouchers to members of your first VWS group. In any case, the vouchers
must be used within two weeks. Additionally, the entire value of each of the vouchers must be used
when the voucher is redeemed (so, for example, you cannot use 25 Rs. of a 50 Rs. voucher one day
and save 25 Rs. for another day). To summarize, if you win the lottery, you will be asked to sign
each of the 50 Rs. vouchers when you receive them. However, you are still free to decide whether
to give away or keep each of the four vouchers that you receive.
6.3 Sample and Loan Terms
Our experimental sample consisted of 1026 clients who each received a Rs. 4000 loan and were
randomized into either a weekly or monthly group. Of these, 707 chose to take out a second loan
within 104 weeks of having taken out the first loan. 458 were on a fortnightly repayment schedule
without an initial delay, and 249 were on a fortnightly repayment schedule with a two month delay
before the first loan repayment was due. Of these, 137 took out a third loan where they were
re-randomized into monthly or weekly loans. Of these, 48 clients had been on a weekly schedule in
their first loan cycle and these clients enter the sample in Table 6. For these clients, the average
loan size in the third loan cycle was Rs. 9600.
We piloted the lottery among 128 clients and then randomly drew a sample of 450 clients from
the remaining 900. Of these, two had died and sixteen were away from the city.
34
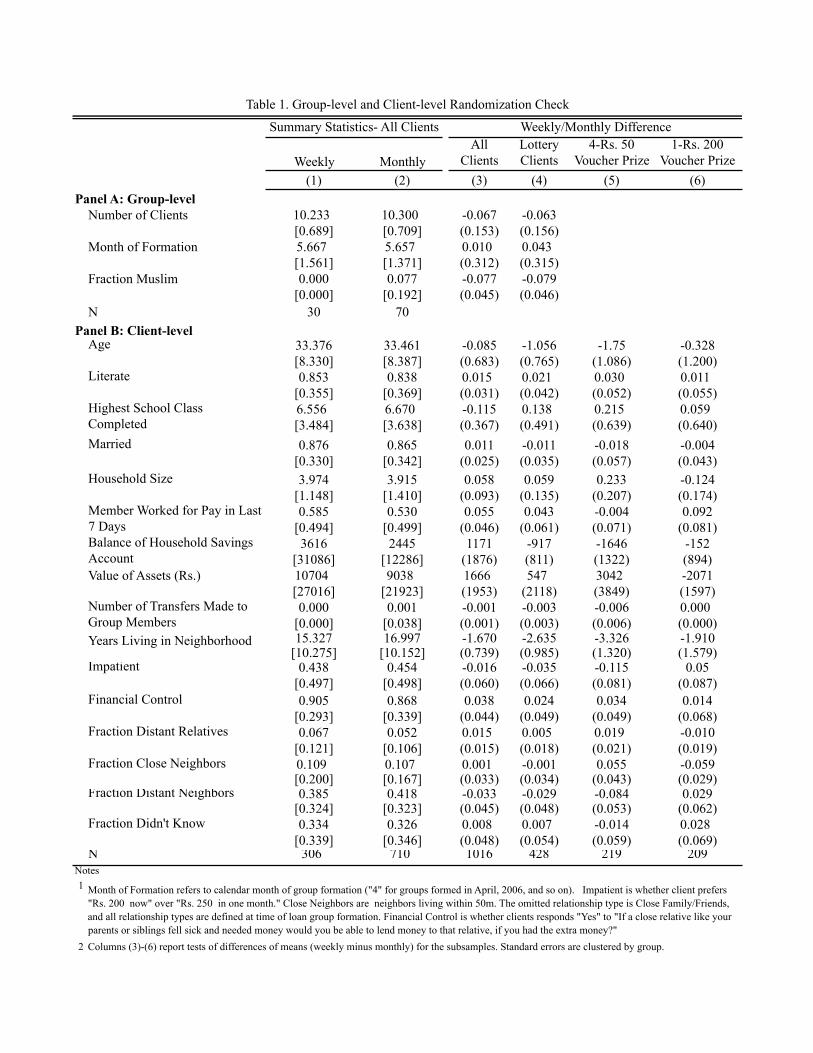
Weekly MonthlyAll
ClientsLottery Clients
4-Rs. 50 Voucher Prize
1-Rs. 200 Voucher Prize
Dif(1) (2) (3) (4) (5) (6)
Panel A: Group-level Number of Clients 10.233 10.300 -0.067 -0.063
[0.689] [0.709] (0.153) (0.156)Month of Formation 5.667 5.657 0.010 0.043
[1.561] [1.371] (0.312) (0.315)Fraction Muslim 0.000 0.077 -0.077 -0.079
[0.000] [0.192] (0.045) (0.046)N 30 70
Panel B: Client-level Age 33.376 33.461 -0.085 -1.056 -1.75 -0.328
[8.330] [8.387] (0.683) (0.765) (1.086) (1.200)Literate 0.853 0.838 0.015 0.021 0.030 0.011
[0.355] [0.369] (0.031) (0.042) (0.052) (0.055)6.556 6.670 -0.115 0.138 0.215 0.059[3.484] [3.638] (0.367) (0.491) (0.639) (0.640)
Married 0.876 0.865 0.011 -0.011 -0.018 -0.004[0.330] [0.342] (0.025) (0.035) (0.057) (0.043)
Household Size 3.974 3.915 0.058 0.059 0.233 -0.124[1.148] [1.410] (0.093) (0.135) (0.207) (0.174)0.585 0.530 0.055 0.043 -0.004 0.092
[0.494] [0.499] (0.046) (0.061) (0.071) (0.081)3616 2445 1171 -917 -1646 -152
[31086] [12286] (1876) (811) (1322) (894)Value of Assets (Rs.) 10704 9038 1666 547 3042 -2071
[27016] [21923] (1953) (2118) (3849) (1597)0.000 0.001 -0.001 -0.003 -0.006 0.000
[0.000] [0.038] (0.001) (0.003) (0.006) (0.000)15.327 16.997 -1.670 -2.635 -3.326 -1.910
[10.275] [10.152] (0.739) (0.985) (1.320) (1.579)Impatient 0.438 0.454 -0.016 -0.035 -0.115 0.05
[0.497] [0.498] (0.060) (0.066) (0.081) (0.087)Financial Control 0.905 0.868 0.038 0.024 0.034 0.014
[0.293] [0.339] (0.044) (0.049) (0.049) (0.068)Fraction Distant Relatives 0.067 0.052 0.015 0.005 0.019 -0.010
[0.121] [0.106] (0.015) (0.018) (0.021) (0.019)Fraction Close Neighbors 0.109 0.107 0.001 -0.001 0.055 -0.059
[0.200] [0.167] (0.033) (0.034) (0.043) (0.029)Fraction Distant Neighbors 0.385 0.418 -0.033 -0.029 -0.084 0.029
[0.324] [0.323] (0.045) (0.048) (0.053) (0.062)Fraction Didn't Know 0.334 0.326 0.008 0.007 -0.014 0.028
[0.339] [0.346] (0.048) (0.054) (0.059) (0.069)N 306 710 1016 428 219 209N
Notes1
2 Columns (3)-(6) report tests of differences of means (weekly minus monthly) for the subsamples. Standard errors are clustered by group.
Years Living in Neighborhood
Month of Formation refers to calendar month of group formation ("4" for groups formed in April, 2006, and so on). Impatient is whether client prefers "Rs. 200 now" over "Rs. 250 in one month." Close Neighbors are neighbors living within 50m. The omitted relationship type is Close Family/Friends, and all relationship types are defined at time of loan group formation. Financial Control is whether clients responds "Yes" to "If a close relative like your parents or siblings fell sick and needed money would you be able to lend money to that relative, if you had the extra money?"
Highest School Class Completed
Member Worked for Pay in Last 7 DaysBalance of Household Savings Account
Table 1. Group-level and Client-level Randomization Check
Summary Statistics- All Clients Weekly/Monthly Difference
Number of Transfers Made to Group Members
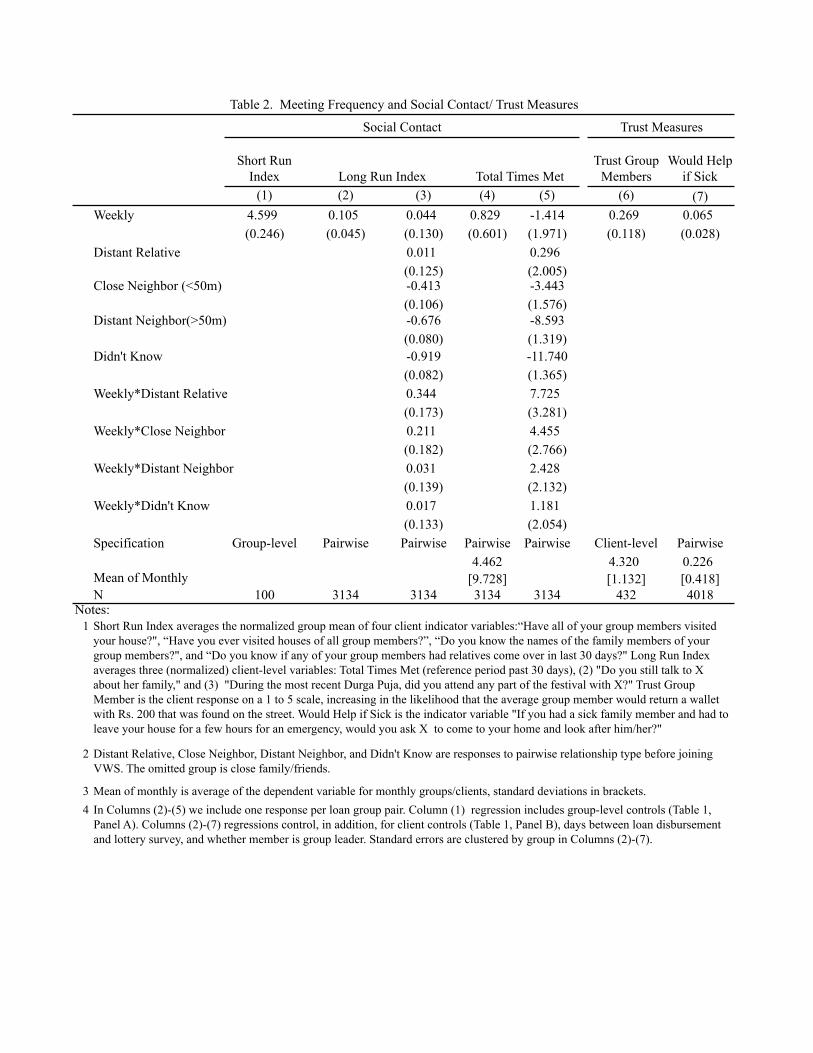
Short Run Index
Trust Group Members
(1) (2) (3) (4) (5) (6) (7)Weekly 4.599 0.105 0.044 0.829 -1.414 0.269 0.065
(0.246) (0.045) (0.130) (0.601) (1.971) (0.118) (0.028)Distant Relative 0.011 0.296
(0.125) (2.005)Close Neighbor (<50m) -0.413 -3.443
(0.106) (1.576)Distant Neighbor(>50m) -0.676 -8.593
(0.080) (1.319)Didn't Know -0.919 -11.740
(0.082) (1.365)Weekly*Distant Relative 0.344 7.725
(0.173) (3.281)Weekly*Close Neighbor 0.211 4.455
(0.182) (2.766)Weekly*Distant Neighbor 0.031 2.428
(0.139) (2.132)Weekly*Didn't Know 0.017 1.181
(0.133) (2.054)Specification Group-level Pairwise Pairwise Pairwise Pairwise Client-level Pairwise
4.462 4.320 0.226[9.728] [1.132] [0.418]
N 100 3134 3134 3134 3134 432 4018Notes:
1
2
34
Table 2. Meeting Frequency and Social Contact/ Trust Measures
Would Help if Sick
Mean of Monthly
Short Run Index averages the normalized group mean of four client indicator variables:“Have all of your group members visited your house?", “Have you ever visited houses of all group members?”, “Do you know the names of the family members of your group members?", and “Do you know if any of your group members had relatives come over in last 30 days?" Long Run Index averages three (normalized) client-level variables: Total Times Met (reference period past 30 days), (2) "Do you still talk to X about her family," and (3) "During the most recent Durga Puja, did you attend any part of the festival with X?" Trust Group Member is the client response on a 1 to 5 scale, increasing in the likelihood that the average group member would return a wallet with Rs. 200 that was found on the street. Would Help if Sick is the indicator variable "If you had a sick family member and had to leave your house for a few hours for an emergency, would you ask X to come to your home and look after him/her?"
Social Contact
Mean of monthly is average of the dependent variable for monthly groups/clients, standard deviations in brackets.
Long Run Index Total Times Met
Distant Relative, Close Neighbor, Distant Neighbor, and Didn't Know are responses to pairwise relationship type before joining VWS. The omitted group is close family/friends.
In Columns (2)-(5) we include one response per loan group pair. Column (1) regression includes group-level controls (Table 1, Panel A). Columns (2)-(7) regressions control, in addition, for client controls (Table 1, Panel B), days between loan disbursement and lottery survey, and whether member is group leader. Standard errors are clustered by group in Columns (2)-(7).
Trust Measures
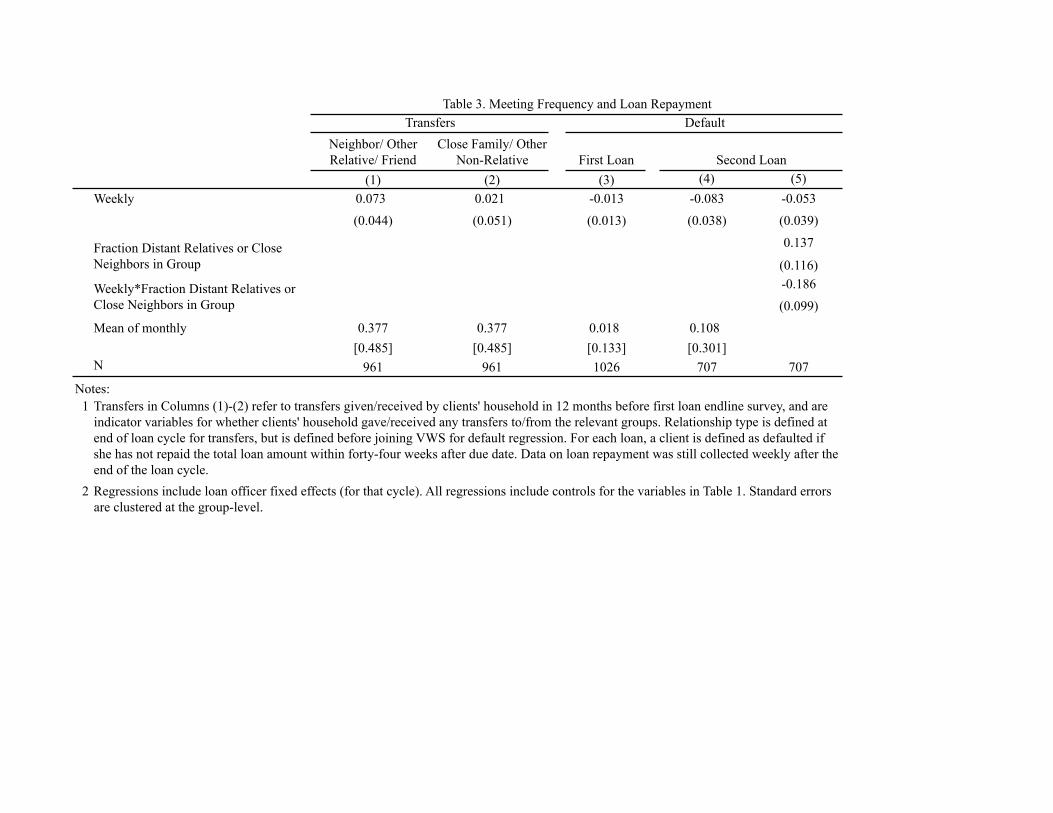
Neighbor/ Other Relative/ Friend
Close Family/ Other Non-Relative
(1) (2) (3) (4) (5)Weekly 0.073 0.021 -0.013 -0.083 -0.053
(0.044) (0.051) (0.013) (0.038) (0.039)
0.137
(0.116)-0.186
(0.099)
Mean of monthly 0.377 0.377 0.018 0.108[0.485] [0.485] [0.133] [0.301]
N 961 961 1026 707 707Notes:
1
2
Transfers in Columns (1)-(2) refer to transfers given/received by clients' household in 12 months before first loan endline survey, and are indicator variables for whether clients' household gave/received any transfers to/from the relevant groups. Relationship type is defined at end of loan cycle for transfers, but is defined before joining VWS for default regression. For each loan, a client is defined as defaulted if she has not repaid the total loan amount within forty-four weeks after due date. Data on loan repayment was still collected weekly after the end of the loan cycle. Regressions include loan officer fixed effects (for that cycle). All regressions include controls for the variables in Table 1. Standard errors are clustered at the group-level.
Table 3. Meeting Frequency and Loan Repayment
Second Loan
Fraction Distant Relatives or Close Neighbors in Group
Weekly*Fraction Distant Relatives or Close Neighbors in Group
Transfers Default
First Loan
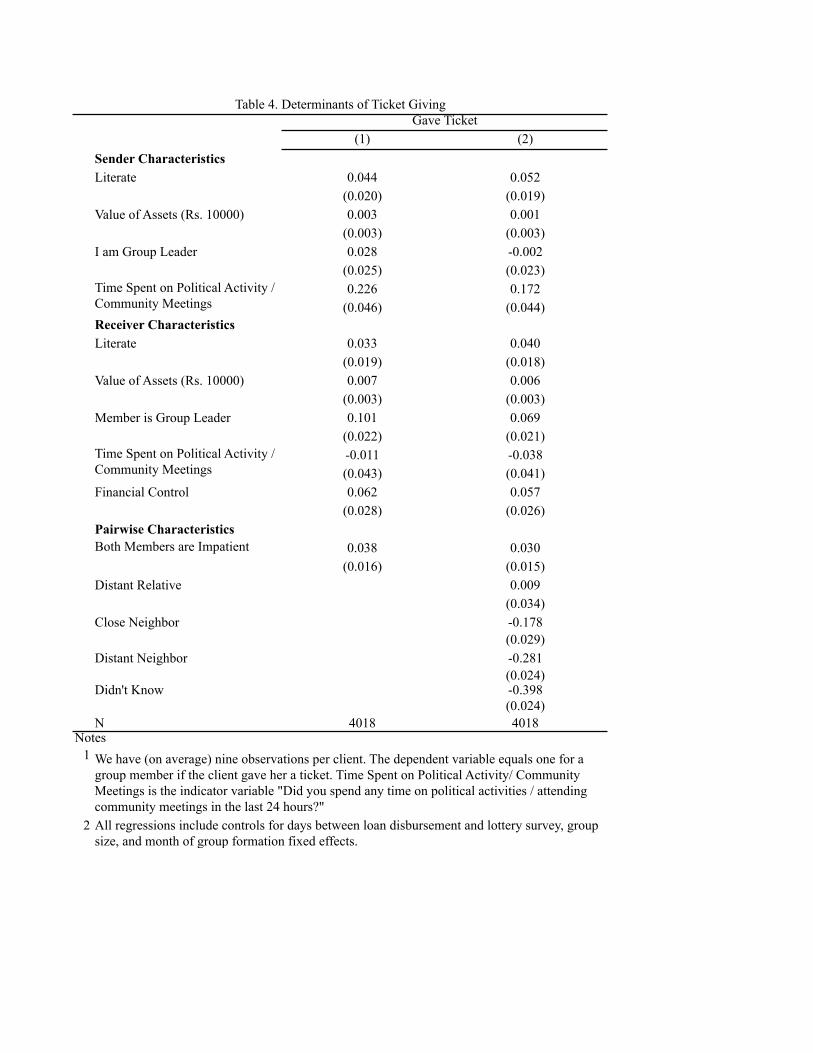
(1) (2)Sender CharacteristicsLiterate 0.044 0.052
(0.020) (0.019)Value of Assets (Rs. 10000) 0.003 0.001
(0.003) (0.003)I am Group Leader 0.028 -0.002
(0.025) (0.023)0.226 0.172
(0.046) (0.044)Receiver CharacteristicsLiterate 0.033 0.040
(0.019) (0.018)Value of Assets (Rs. 10000) 0.007 0.006
(0.003) (0.003)Member is Group Leader 0.101 0.069
(0.022) (0.021)-0.011 -0.038(0.043) (0.041)
Financial Control 0.062 0.057(0.028) (0.026)
Pairwise CharacteristicsBoth Members are Impatient 0.038 0.030
(0.016) (0.015)Distant Relative 0.009
(0.034)Close Neighbor -0.178
(0.029)Distant Neighbor -0.281
(0.024)Didn't Know -0.398
(0.024)N 4018 4018
Notes1
2
Gave TicketTable 4. Determinants of Ticket Giving
We have (on average) nine observations per client. The dependent variable equals one for a group member if the client gave her a ticket. Time Spent on Political Activity/ Community Meetings is the indicator variable "Did you spend any time on political activities / attending community meetings in the last 24 hours?" All regressions include controls for days between loan disbursement and lottery survey, group size, and month of group formation fixed effects.
Time Spent on Political Activity / Community Meetings
Time Spent on Political Activity / Community Meetings
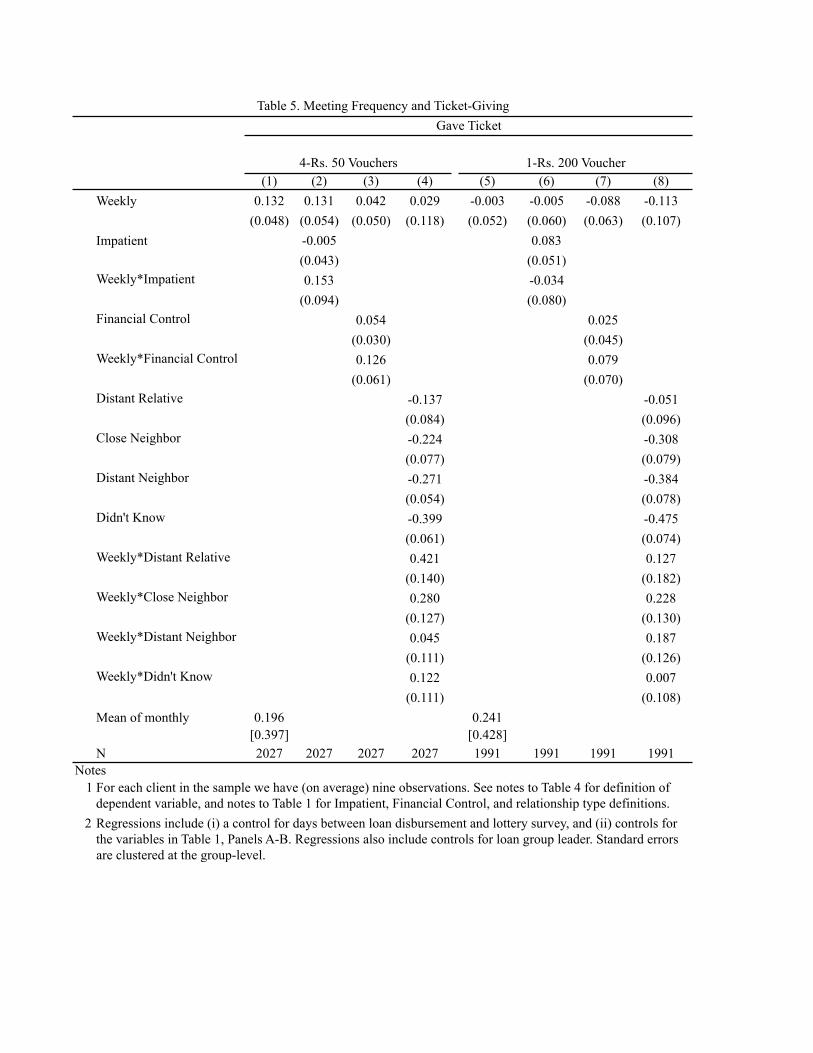
(1) (2) (3) (4) (5) (6) (7) (8)Weekly 0.132 0.131 0.042 0.029 -0.003 -0.005 -0.088 -0.113
(0.048) (0.054) (0.050) (0.118) (0.052) (0.060) (0.063) (0.107)Impatient -0.005 0.083
(0.043) (0.051)Weekly*Impatient 0.153 -0.034
(0.094) (0.080)Financial Control 0.054 0.025
(0.030) (0.045)Weekly*Financial Control 0.126 0.079
(0.061) (0.070)Distant Relative -0.137 -0.051
(0.084) (0.096)Close Neighbor -0.224 -0.308
(0.077) (0.079)Distant Neighbor -0.271 -0.384
(0.054) (0.078)Didn't Know -0.399 -0.475
(0.061) (0.074)Weekly*Distant Relative 0.421 0.127
(0.140) (0.182)Weekly*Close Neighbor 0.280 0.228
(0.127) (0.130)Weekly*Distant Neighbor 0.045 0.187
(0.111) (0.126)Weekly*Didn't Know 0.122 0.007
(0.111) (0.108)Mean of monthly 0.196 0.241
[0.397] [0.428]N 2027 2027 2027 2027 1991 1991 1991 1991
Notes
2
Table 5. Meeting Frequency and Ticket-Giving
Regressions include (i) a control for days between loan disbursement and lottery survey, and (ii) controls for the variables in Table 1, Panels A-B. Regressions also include controls for loan group leader. Standard errors are clustered at the group-level.
Gave Ticket
1 For each client in the sample we have (on average) nine observations. See notes to Table 4 for definition of dependent variable, and notes to Table 1 for Impatient, Financial Control, and relationship type definitions.
4-Rs. 50 Vouchers 1-Rs. 200 Voucher
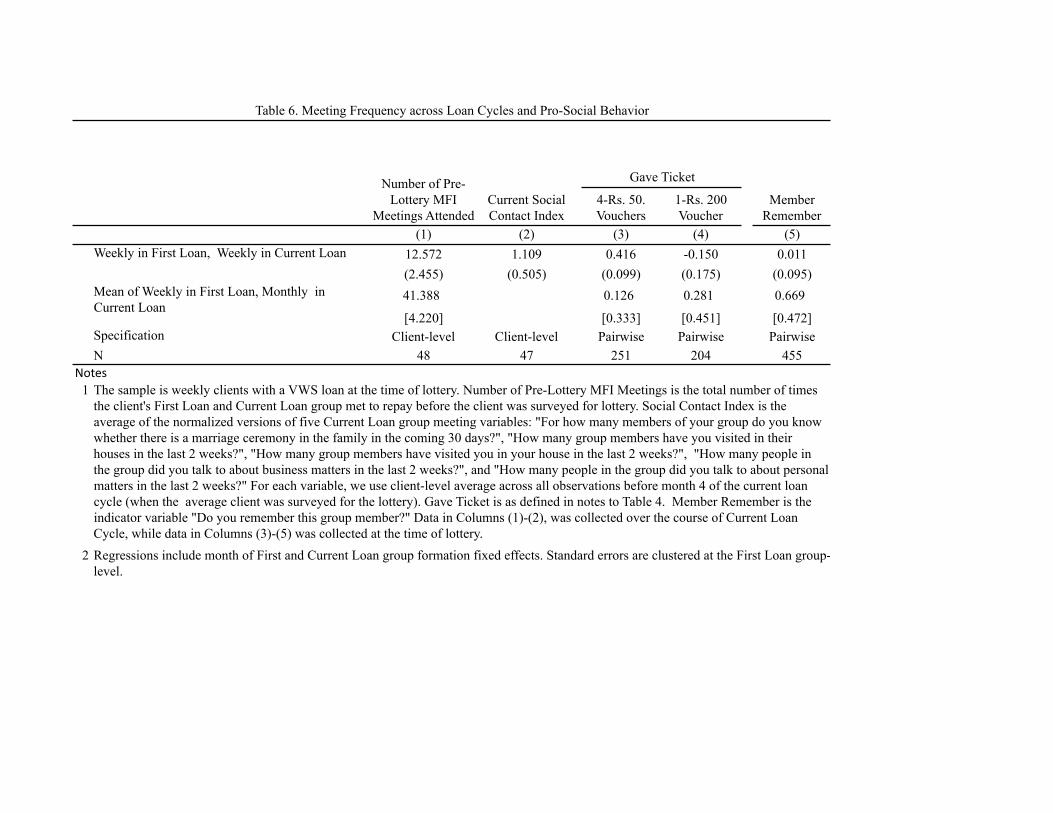
4-Rs. 50. Vouchers
1-Rs. 200 Voucher
(1) (2) (3) (4) (5)12.572 1.109 0.416 -0.150 0.011(2.455) (0.505) (0.099) (0.175) (0.095)41.388 0.126 0.281 0.669
[4.220] [0.333] [0.451] [0.472]Specification Client-level Client-level Pairwise Pairwise PairwiseN 48 47 251 204 455
Notes1
2
Mean of Weekly in First Loan, Monthly in Current Loan
Gave TicketNumber of Pre-Lottery MFI
Meetings AttendedCurrent Social Contact Index
Member Remember
Table 6. Meeting Frequency across Loan Cycles and Pro-Social Behavior
Regressions include month of First and Current Loan group formation fixed effects. Standard errors are clustered at the First Loan group-level.
The sample is weekly clients with a VWS loan at the time of lottery. Number of Pre-Lottery MFI Meetings is the total number of times the client's First Loan and Current Loan group met to repay before the client was surveyed for lottery. Social Contact Index is the average of the normalized versions of five Current Loan group meeting variables: "For how many members of your group do you know whether there is a marriage ceremony in the family in the coming 30 days?", "How many group members have you visited in their houses in the last 2 weeks?", "How many group members have visited you in your house in the last 2 weeks?", "How many people in the group did you talk to about business matters in the last 2 weeks?", and "How many people in the group did you talk to about personal matters in the last 2 weeks?" For each variable, we use client-level average across all observations before month 4 of the current loan cycle (when the average client was surveyed for the lottery). Gave Ticket is as defined in notes to Table 4. Member Remember is the indicator variable "Do you remember this group member?" Data in Columns (1)-(2), was collected over the course of Current Loan Cycle, while data in Columns (3)-(5) was collected at the time of lottery.
Weekly in First Loan, Weekly in Current Loan
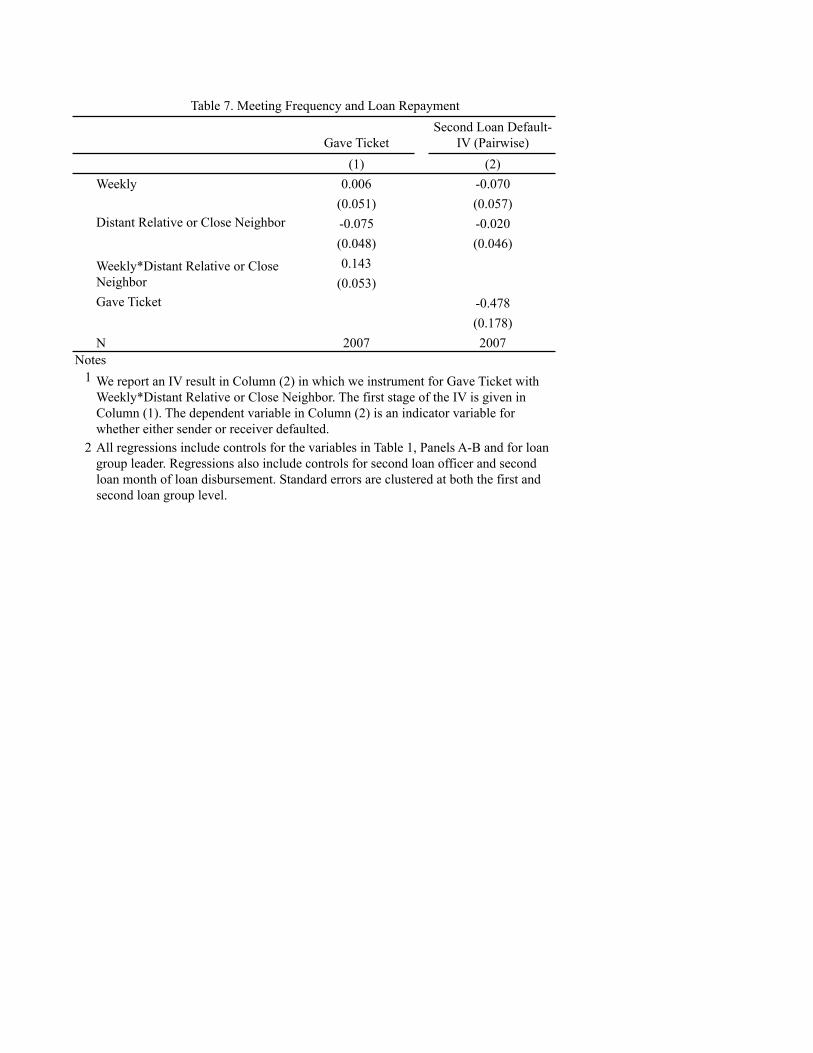
Gave TicketSecond Loan Default-
IV (Pairwise)(1) (2)
Weekly 0.006 -0.070(0.051) (0.057)
Distant Relative or Close Neighbor -0.075 -0.020(0.048) (0.046)0.143
(0.053)Gave Ticket -0.478
(0.178)N 2007 2007
Notes1
2
Weekly*Distant Relative or Close Neighbor
We report an IV result in Column (2) in which we instrument for Gave Ticket with Weekly*Distant Relative or Close Neighbor. The first stage of the IV is given in Column (1). The dependent variable in Column (2) is an indicator variable for whether either sender or receiver defaulted. All regressions include controls for the variables in Table 1, Panels A-B and for loan group leader. Regressions also include controls for second loan officer and second loan month of loan disbursement. Standard errors are clustered at both the first and second loan group level.
Table 7. Meeting Frequency and Loan Repayment
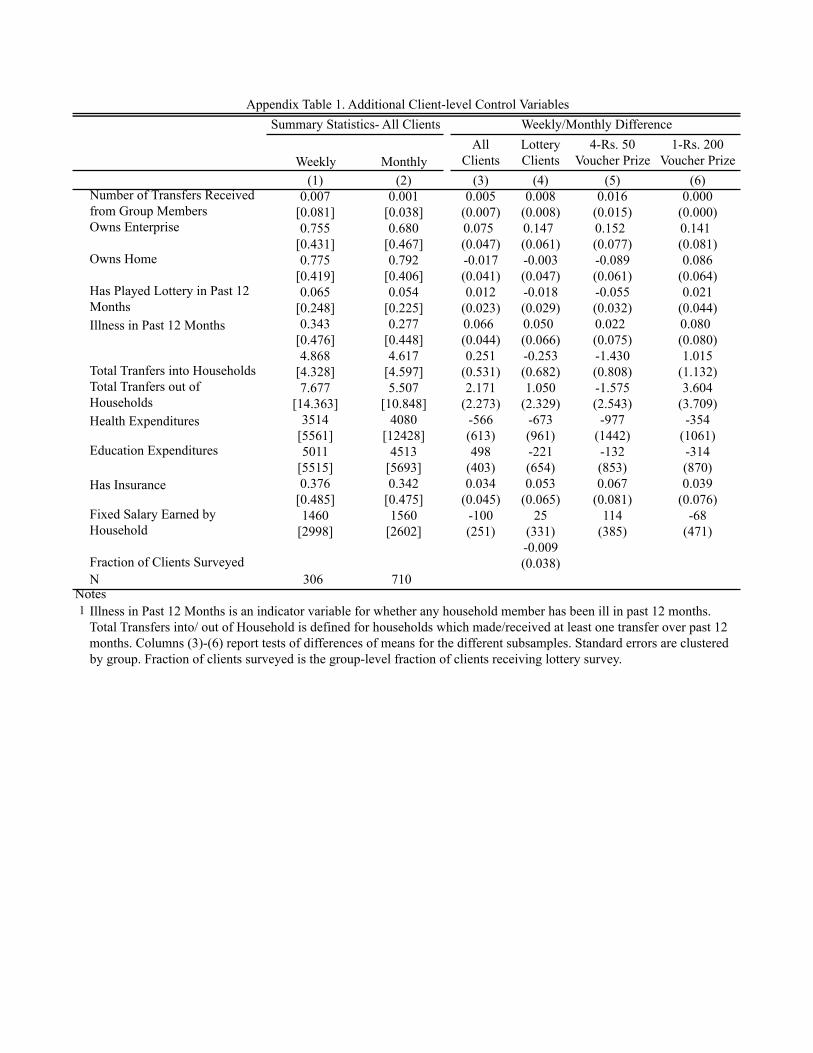
Weekly MonthlyAll
ClientsLottery Clients
4-Rs. 50 Voucher Prize
1-Rs. 200 Voucher Prize
(1) (2) (3) (4) (5) (6)0.007 0.001 0.005 0.008 0.016 0.000
[0.081] [0.038] (0.007) (0.008) (0.015) (0.000)Owns Enterprise 0.755 0.680 0.075 0.147 0.152 0.141
[0.431] [0.467] (0.047) (0.061) (0.077) (0.081)Owns Home 0.775 0.792 -0.017 -0.003 -0.089 0.086
[0.419] [0.406] (0.041) (0.047) (0.061) (0.064)0.065 0.054 0.012 -0.018 -0.055 0.021
[0.248] [0.225] (0.023) (0.029) (0.032) (0.044)0.343 0.277 0.066 0.050 0.022 0.080
[0.476] [0.448] (0.044) (0.066) (0.075) (0.080)4.868 4.617 0.251 -0.253 -1.430 1.015
[4.328] [4.597] (0.531) (0.682) (0.808) (1.132)7.677 5.507 2.171 1.050 -1.575 3.604
[14.363] [10.848] (2.273) (2.329) (2.543) (3.709)3514 4080 -566 -673 -977 -354
[5561] [12428] (613) (961) (1442) (1061)Education Expenditures 5011 4513 498 -221 -132 -314
[5515] [5693] (403) (654) (853) (870)0.376 0.342 0.034 0.053 0.067 0.039
[0.485] [0.475] (0.045) (0.065) (0.081) (0.076)1460 1560 -100 25 114 -68
[2998] [2602] (251) (331) (385) (471)-0.009(0.038)
N 306 710NNotes1
Number of Transfers Received from Group Members
Has Played Lottery in Past 12 Months
Fixed Salary Earned by Household
Total Tranfers into HouseholdsTotal Tranfers out of Households
Appendix Table 1. Additional Client-level Control Variables
Has Insurance
Fraction of Clients Surveyed
Summary Statistics- All Clients Weekly/Monthly Difference
Health Expenditures
Illness in Past 12 Months
Illness in Past 12 Months is an indicator variable for whether any household member has been ill in past 12 months. Total Transfers into/ out of Household is defined for households which made/received at least one transfer over past 12 months. Columns (3)-(6) report tests of differences of means for the different subsamples. Standard errors are clustered by group. Fraction of clients surveyed is the group-level fraction of clients receiving lottery survey.
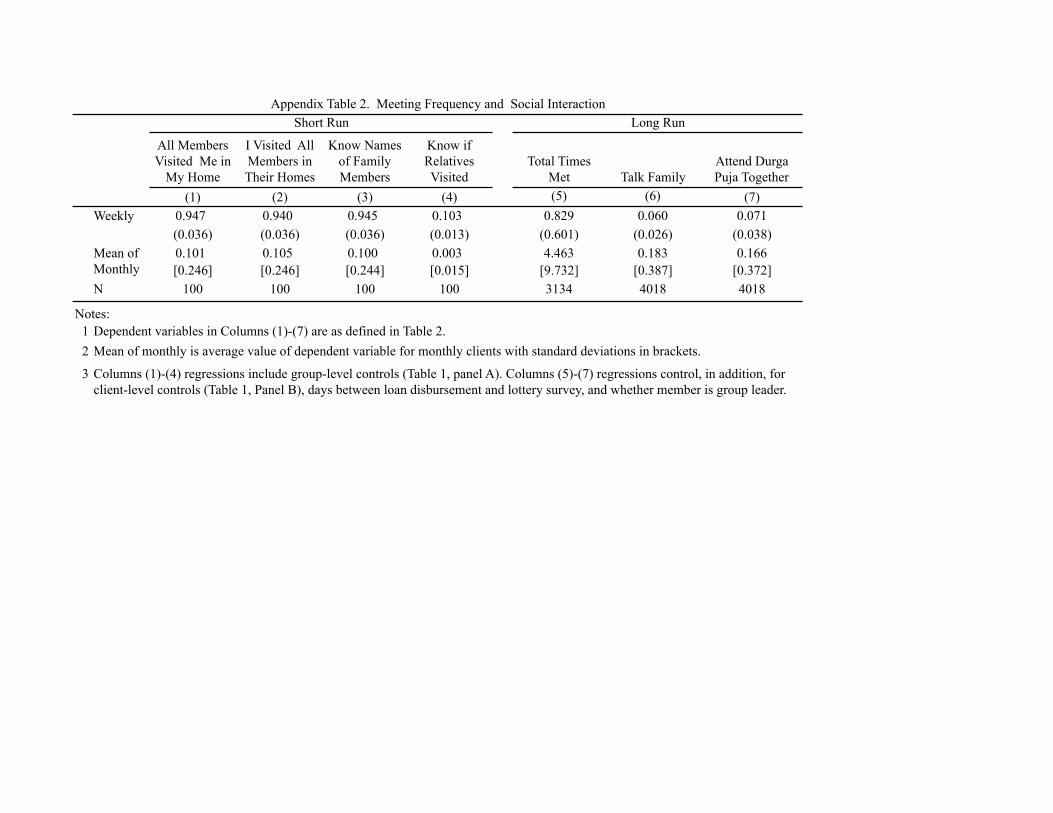
All Members Visited Me in
My Home
I Visited All Members in Their Homes
Know Names of Family Members
Know if Relatives Visited
Total Times Met
(1) (2) (3) (4) (5) (6) (7)Weekly 0.947 0.940 0.945 0.103 0.829 0.060 0.071
(0.036) (0.036) (0.036) (0.013) (0.601) (0.026) (0.038)0.101 0.105 0.100 0.003 4.463 0.183 0.166[0.246] [0.246] [0.244] [0.015] [9.732] [0.387] [0.372]
N 100 100 100 100 3134 4018 4018
Notes:12
3
Mean of Monthly
Short Run Long Run
Mean of monthly is average value of dependent variable for monthly clients with standard deviations in brackets.
Columns (1)-(4) regressions include group-level controls (Table 1, panel A). Columns (5)-(7) regressions control, in addition, for client-level controls (Table 1, Panel B), days between loan disbursement and lottery survey, and whether member is group leader.
Appendix Table 2. Meeting Frequency and Social Interaction
Dependent variables in Columns (1)-(7) are as defined in Table 2.
Attend Durga Puja TogetherTalk Family
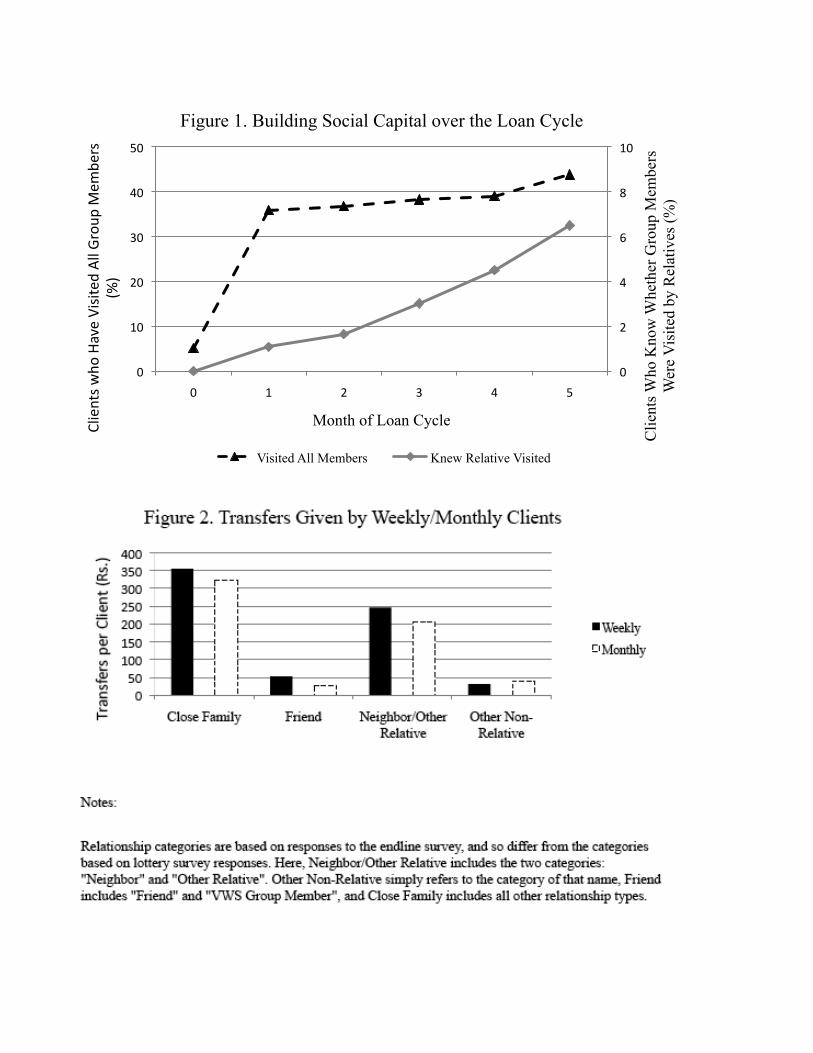
0
2
4
6
8
10
0
10
20
30
40
50
0 1 2 3 4 5
Clie
nts W
ho K
now
Whe
ther
Gro
up M
embe
rs
Wer
e V
isite
d by
Rel
ativ
es (%
)
Clientswho
HaveVisitedAllGroup
Mem
bers
(%)
Month of Loan Cycle
Figure 1. Building Social Capital over the Loan Cycle
Visited All Members Knew Relative Visited
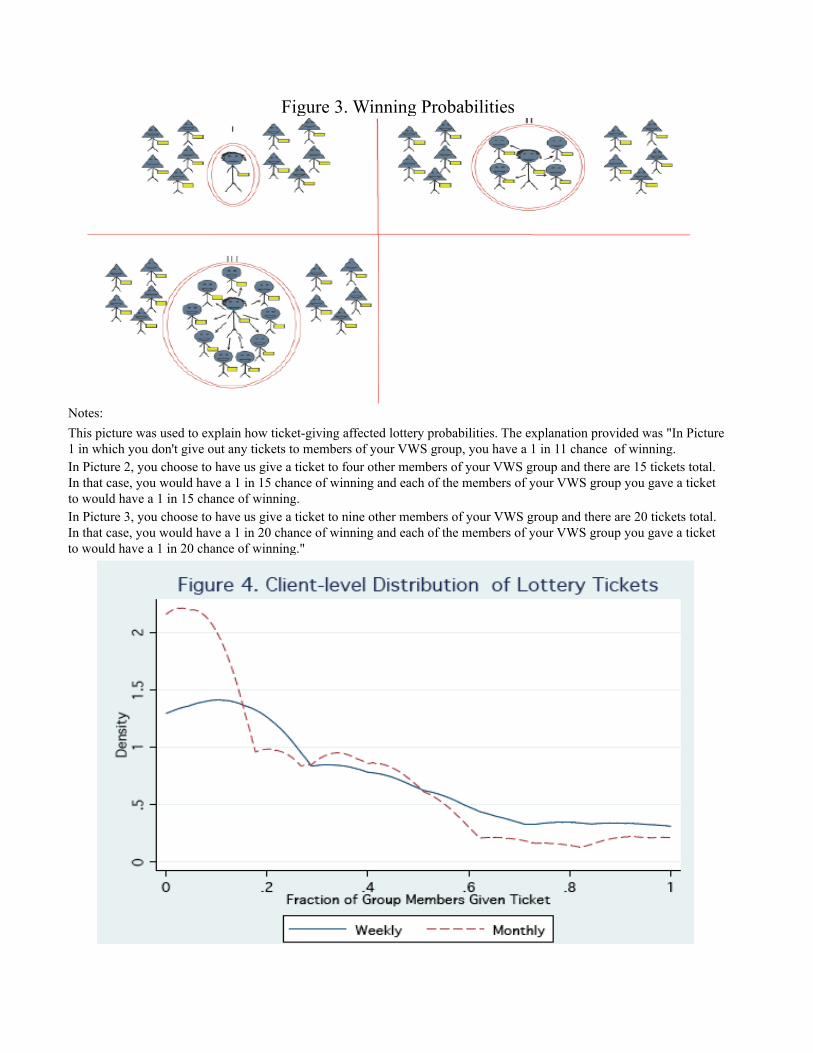
Notes:
In Picture 3, you choose to have us give a ticket to nine other members of your VWS group and there are 20 tickets total. In that case, you would have a 1 in 20 chance of winning and each of the members of your VWS group you gave a ticket to would have a 1 in 20 chance of winning."
Figure 3. Winning Probabilities
This picture was used to explain how ticket-giving affected lottery probabilities. The explanation provided was "In Picture 1 in which you don't give out any tickets to members of your VWS group, you have a 1 in 11 chance of winning. In Picture 2, you choose to have us give a ticket to four other members of your VWS group and there are 15 tickets total. In that case, you would have a 1 in 15 chance of winning and each of the members of your VWS group you gave a ticket to would have a 1 in 15 chance of winning.
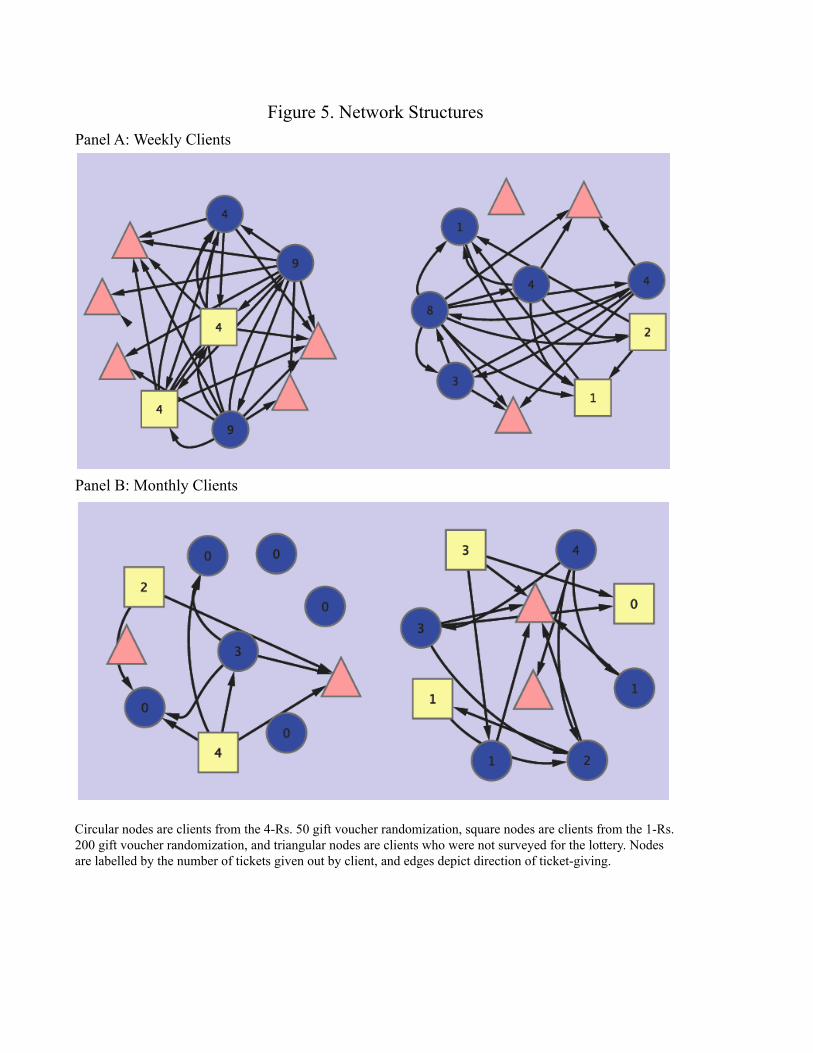
Panel B: Monthly Clients
Figure 5. Network Structures
Circular nodes are clients from the 4-Rs. 50 gift voucher randomization, square nodes are clients from the 1-Rs. 200 gift voucher randomization, and triangular nodes are clients who were not surveyed for the lottery. Nodes are labelled by the number of tickets given out by client, and edges depict direction of ticket-giving.
Panel A: Weekly Clients
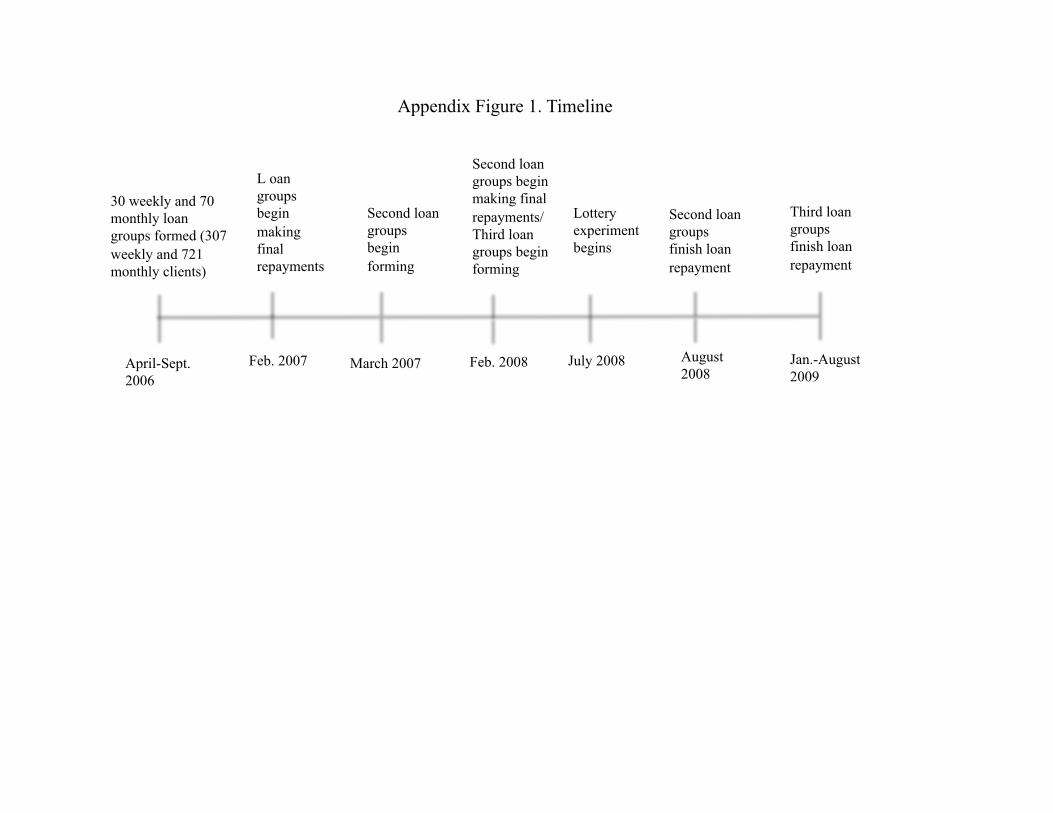
Appendix Figure 1. Timeline
April-Sept. 2006
30 weekly and 70 monthly loan groups formed (307 weekly and 721 monthly clients)
Feb. 2007
L oan groups begin making final repayments
March 2007
Second loan groups begin forming
Second loan groups begin making final repayments/ Third loan groups begin forming
Second loan groups finish loan repayment
Feb. 2008 Jan.-August 2009
Third loan groups finish loan repayment
July 2008
Lottery experiment begins
August 2008
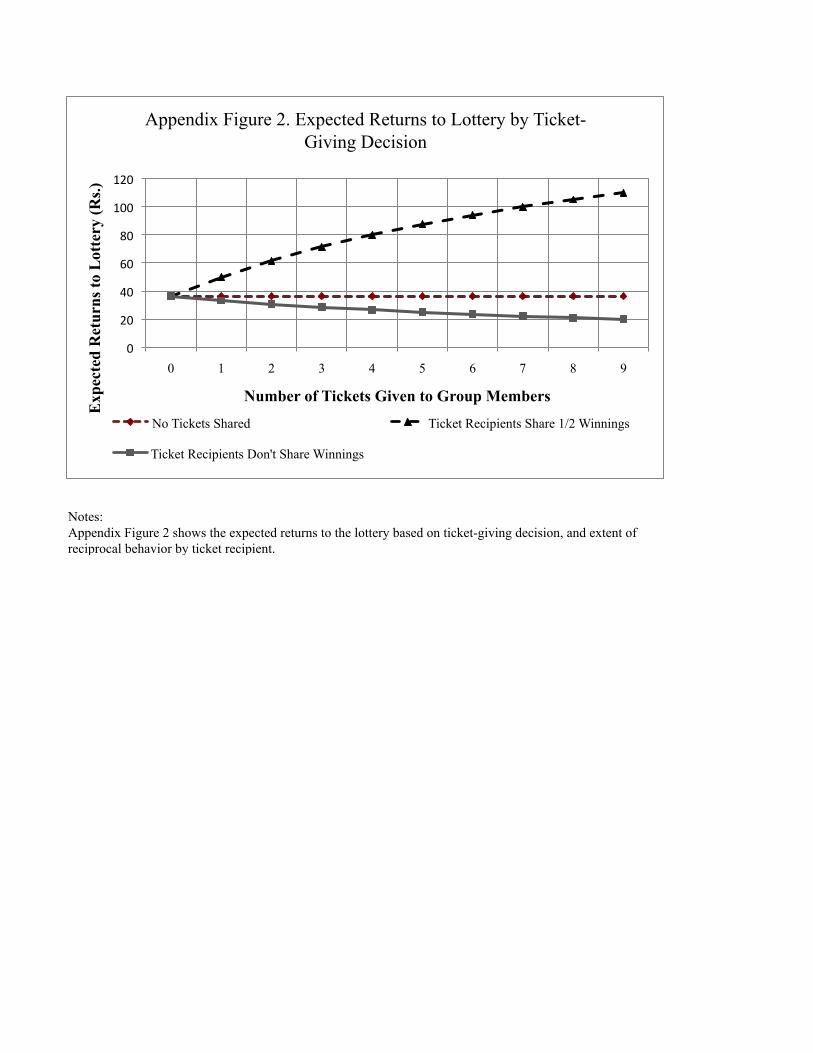
0.4282 00.1111 10.088 20.0926 30.1181 40.0486 50.0162 60.0255 70.0185 80.0532 9
Notes: Appendix Figure 2 shows the expected returns to the lottery based on ticket-giving decision, and extent of reciprocal behavior by ticket recipient.
0
20
40
60
80
100
120
0 1 2 3 4 5 6 7 8 9
Exp
ecte
d R
etur
ns to
Lot
tery
(Rs.)
Number of Tickets Given to Group Members
Appendix Figure 2. Expected Returns to Lottery by Ticket-Giving Decision
No Tickets Shared Ticket Recipients Share 1/2 Winnings
Ticket Recipients Don't Share Winnings
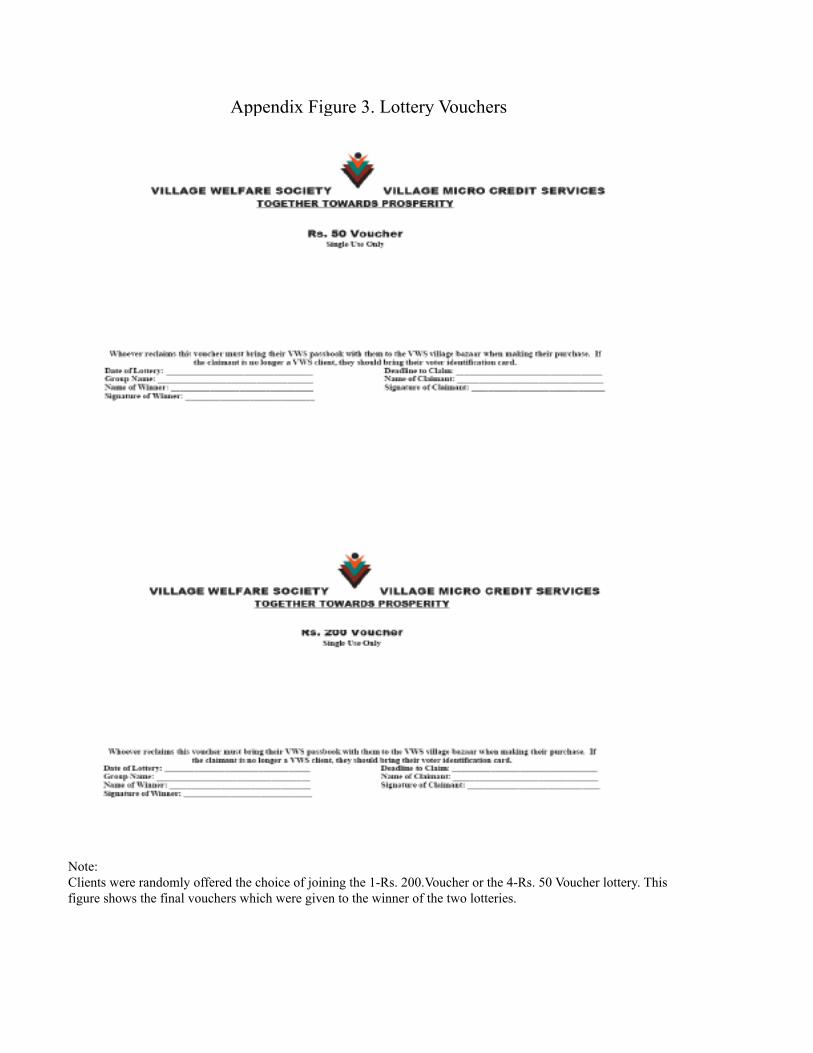
Note:
Appendix Figure 3. Lottery Vouchers
Clients were randomly offered the choice of joining the 1-Rs. 200.Voucher or the 4-Rs. 50 Voucher lottery. This figure shows the final vouchers which were given to the winner of the two lotteries.
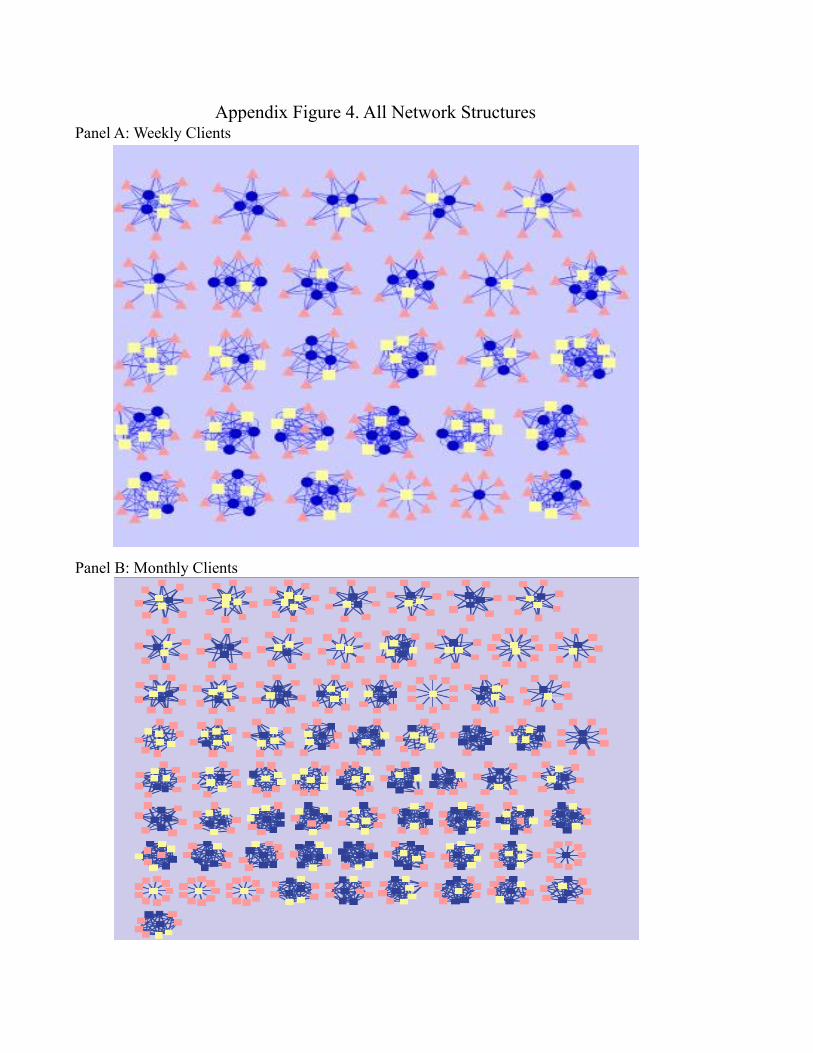
Panel A: Weekly Clients
Panel B: Monthly Clients
Appendix Figure 4. All Network Structures