national assessment program literacy and numeracy … · 2014 national assessment program literacy...
TRANSCRIPT
2014 National Assessment ProgramLiteracy and Numeracy
Achievement in Reading, Persuasive Writing, Language Conventions and Numeracy
National Report for 2014
2014National Assessment Program—Literacy and NumeracyAchievement in Reading, Persuasive Writing,Language Conventions and Numeracy:National Report for 2014
CopyrightThis work is copyright. In addition to any use permitted under the Copyright Act 1968, this work may be downloaded, displayed, printed, or reproduced in whole or in part for non-commercial purposes subject to an acknowledgement of the source. Enquiries concerning copyright should be directed to the Australian Curriculum, Assessment and Reporting Authority (ACARA).
Contact detailsAustralian Curriculum, Assessment and Reporting AuthorityLevel 10, 255 Pitt StreetSydney NSW 2000T 1300 895 563F 1800 982 118www.acara.edu.au
The appropriate citation for this report is:Australian Curriculum, Assessment and Reporting Authority 2014, NAPLAN Achievement in Reading, Persuasive Writing, Language Conventions and Numeracy: National Report for 2014, ACARA, Sydney.
iii
Contents
Introduction ............................................................... iv
2014 Results Year 3 ............................ 1Year 3 Reading .............................................................2
Year 3 Persuasive Writing .......................................... 13
Year 3 Spelling .......................................................... 24
Year 3 Grammar and Punctuation .............................. 35
Year 3 Numeracy ....................................................... 46
Year 3 Participation ................................................... 57
Year 3 Comparative Achievement .............................. 61
Commentary ............................................................. 63
2014 Results Year 5 .......................... 65Year 5 Reading .......................................................... 66
Year 5 Persuasive Writing .......................................... 77
Year 5 Spelling .......................................................... 88
Year 5 Grammar and Punctuation .............................. 99
Year 5 Numeracy ..................................................... 110
Year 5 Participation ................................................. 121
Year 5 Comparative Achievement ............................ 125
Commentary ........................................................... 127
2014 Results Year 7 ........................ 129Year 7 Reading ........................................................ 130
Year 7 Persuasive Writing ........................................ 141
Year 7 Spelling ........................................................ 152
Year 7 Grammar and Punctuation ............................ 163
Year 7 Numeracy ..................................................... 174
Year 7 Participation ................................................. 185
Year 7 Comparative Achievement ............................ 189
Commentary ........................................................... 191
2014 Results Year 9 ........................ 193Year 9 Reading ........................................................ 194
Year 9 Persuasive Writing ........................................ 205
Year 9 Spelling ........................................................ 216
Year 9 Grammar and Punctuation ............................ 227
Year 9 Numeracy ..................................................... 238
Year 9 Participation ................................................. 249
Year 9 Comparative Achievement ............................ 253Commentary ........................................................... 255
2008–2014 Time series .................. 257Years 3, 5, 7 and 9 Reading ..................................... 258
Years 3, 5, 7 and 9 Numeracy .................................. 279
Commentary ............................................................ 300
Years 3, 5, 7 and 9 Participation .............................. 303
Commentary ............................................................ 324
2010-2012, 2011-2013 and 2013-2014 Cohort gain ..................................... 326Year 3–Year 5 Reading ............................................ 327
Year 5–Year 7 Reading ............................................ 331
Year 7–Year 9 Reading ............................................ 335
Achievement of Students in Reading ........................ 339
Year 3–Year 5 Numeracy .......................................... 341
Year 5–Year 7 Numeracy .......................................... 345
Year 7–Year 9 Numeracy .......................................... 349
Achievement of Students in Numeracy .................... 353
Commentary ............................................................ 355
iv
Introduction
About ACARA The Australian Curriculum, Assessment and Reporting Authority (ACARA) is an independent authority focused on improving the learning of all young Australians through a national curriculum, the national assessment program and a national data collection and reporting program.
ACARA collaborates with teachers, principals, governments, state and territory education authorities, professional education associations, community groups and the general public to develop national education standards for use in every school in Australia.
About NAPLANThe National Assessment Program—Literacy and Numeracy (NAPLAN) tests are conducted in May for all students across Australia in Years 3, 5, 7 and 9. Each year, over one million students nationally sit the NAPLAN tests. All students in the same year level are assessed on the same test items in the assessment domains of reading, writing, language conventions (spelling, grammar and punctuation) and numeracy.
NAPLAN data provide parents, schools, governments and the non-government school sectors with important information about whether young Australians are reaching important educational goals.
NAPLAN tests are the only Australian assessments that provide nationally comparable data on the performance of students in the vital areas of literacy and numeracy. This gives NAPLAN a unique role in providing robust data to inform and support improvements to teaching and learning practices in Australian schools.
The NAPLAN assessment and reporting processNAPLAN tests are developed collaboratively by ACARA, the state and territory governments, the non-government school sectors and the Australian Government. The test administration authority in each jurisdiction is responsible for test administration, data capture and delivery of reports.
NAPLAN tests broadly reflect aspects of literacy and numeracy within the curriculum in all jurisdictions. The types of test questions and test formats are chosen so that they are familiar to students and teachers across Australia.
The National Protocols for Test Administration ensure consistency in the administration of NAPLAN tests by all test administration authorities and schools across Australia.
The test administration authority in each jurisdiction manages the marking of the tests. Tests for reading, language conventions (spelling, grammar and punctuation) and numeracy are marked using optical mark recognition software to score multiple-choice items. Writing tasks are marked using well established procedures for maintaining marker consistency across all jurisdictions.
Test administration authorities submit de-identified student data from all tests to a contractor appointed to undertake analysis of the test data on behalf of ACARA. This analysis determines individual student scores across the national achievement scale and enables comparisons over time.
Comparative data showing the performance of each jurisdiction and the nation are provided to each test administration authority.
Student reports are produced by the test administration authorities, using a common national reporting format.
Comparisons over timeNAPLAN tests are equated so that the 2014 results can be compared with those for previous years. Equating enables the results from NAPLAN tests in different years to be reported on the same achievement scale. As with all statistical calculations, the NAPLAN statistics provided in this report include some degree of uncertainty and this should be considered when interpreting differences in jurisdictional and national average scores, and percentages at or above national minimum standards.
To help interpret differences in results, an additional effect size measure has been included in the 2014 comparison calculations. Where comparisons of results are shown, a representation of the effect size and statistical significance of the comparison is also provided. This representation is referred to as ‘nature of the difference’. The ‘nature of the difference’ representation combines the outcomes of statistical significance tests with an effect size measure of the difference.
Comparisons are made for results within jurisdictions, between the current year and previous year, and between the current year and base year. For reading, narrative writing, spelling, grammar and punctuation, and numeracy, the base year is 2008. For persuasive writing, the base year is 2011.
Between 2008 and 2010, students were assessed using a narrative task. A persuasive task has been used since 2011. With the change in the writing genre in 2011, a new persuasive writing scale was introduced. As this is a separate scale to narrative writing, there is a break in the time series data. The persuasive writing results should not be directly compared to the narrative writing results.
Student achievementNAPLAN results are publicly reported through the summary and national reports. Results are also available for use by jurisdictions, non-government school sectors and schools.
Individual student reports, provided to parents/carers, show student results against the national average and the middle 60 per cent of students nationally. These reports contain a description of what was assessed in each of the tests and provide information about the knowledge and skills the student demonstrated in the tests.
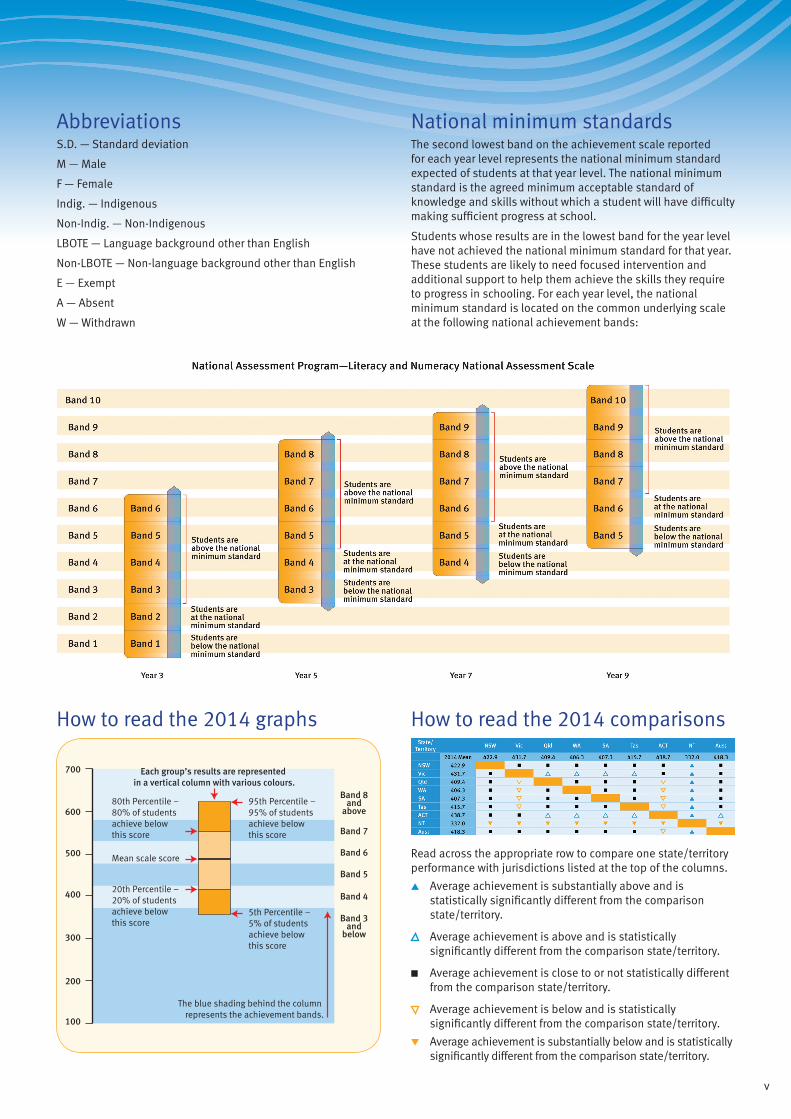
NAPLAN results are reported using five national achievement scales, one for each of the NAPLAN assessment domains of reading, writing, spelling, grammar and punctuation, and numeracy. In 2014, results for writing are reported on the persuasive writing scale. Each scale consists of ten bands, which represent the increasing complexity of the knowledge and skills assessed by NAPLAN from Years 3 to 9. Six of these bands are used for reporting student performance in each year level. Student raw scores on tests are converted to a NAPLAN ‘scale score’ so that those scores can be located on the national scale for each domain.
The NAPLAN reporting scales are constructed so that any given scale score represents the same level of achievement over time. For example, a score of 700 in reading in one year represents the same level of achievement in other testing years.
v
National minimum standardsThe second lowest band on the achievement scale reported for each year level represents the national minimum standard expected of students at that year level. The national minimum standard is the agreed minimum acceptable standard of knowledge and skills without which a student will have difficulty making sufficient progress at school.
Students whose results are in the lowest band for the year level have not achieved the national minimum standard for that year. These students are likely to need focused intervention and additional support to help them achieve the skills they require to progress in schooling. For each year level, the national minimum standard is located on the common underlying scale at the following national achievement bands:
AbbreviationsS.D. — Standard deviation
M — Male
F — Female
Indig. — Indigenous
Non-Indig. — Non-Indigenous
LBOTE — Language background other than English
Non-LBOTE — Non-language background other than English
E — Exempt
A — Absent
W — Withdrawn
How to read the 2014 graphs
Band 3and
below
Band 4
Band 5
Band 6
Band 7
Band 8and
above600
700
500
400
300
200
100
95th Percentile – 95% of studentsachieve belowthis score
80th Percentile – 80% of studentsachieve belowthis score
Mean scale score
20th Percentile – 20% of studentsachieve belowthis score
5th Percentile – 5% of studentsachieve belowthis score
Each group’s results are represented in a vertical column with various colours.
The blue shading behind the column represents the achievement bands.
How to read the 2014 comparisons
Read across the appropriate row to compare one state/territory performance with jurisdictions listed at the top of the columns.
▲▲ Average achievement is substantially above and is statistically significantly different from the comparison state/territory.
Average achievement is above and is statistically significantly different from the comparison state/territory.
■▲ Average achievement is close to or not statistically different from the comparison state/territory.
Average achievement is below and is statistically significantly different from the comparison state/territory.
▼ Average achievement is substantially below and is statistically significantly different from the comparison state/territory.
vi
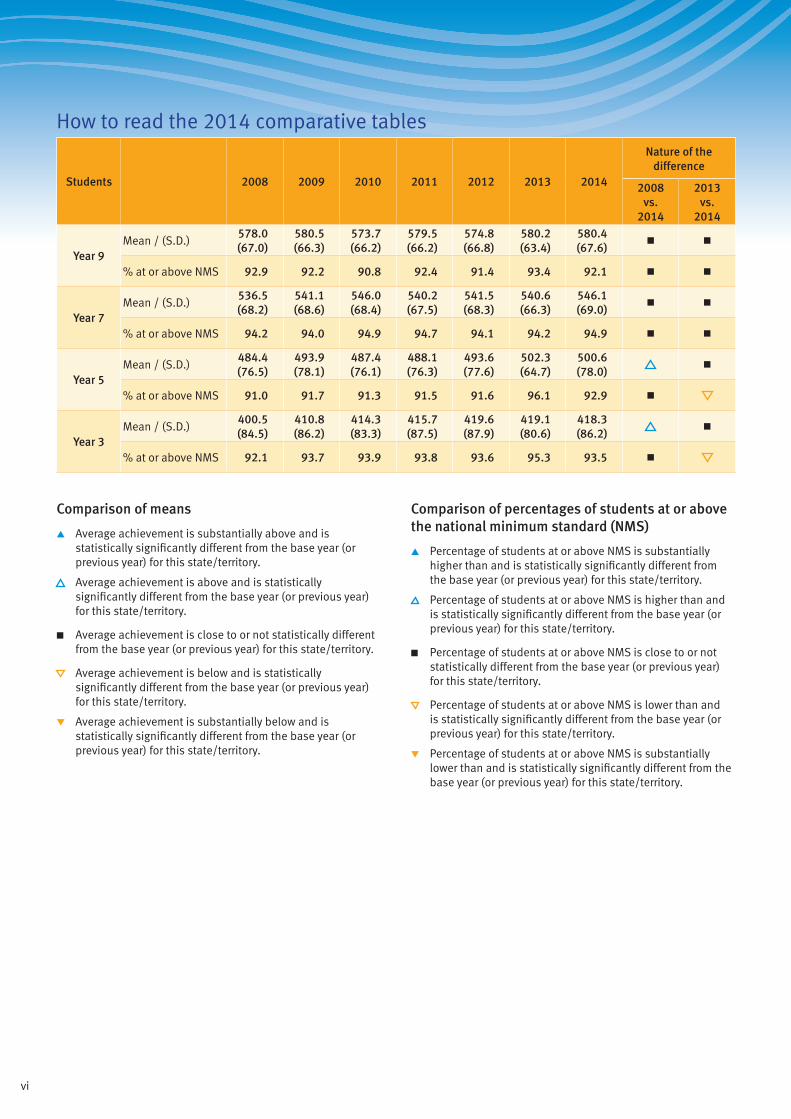
How to read the 2014 comparative tables
Students 2008 2009 2010 2011 2012 2013 2014
Nature of the difference
2008 vs.
2014
2013 vs.
2014
Year 9Mean / (S.D.)
578.0 (67.0)
580.5 (66.3)
573.7 (66.2)
579.5 (66.2)
574.8 (66.8)
580.2 (63.4)
580.4 (67.6)
■ ■
% at or above NMS 92.9 92.2 90.8 92.4 91.4 93.4 92.1 ■ ■
Year 7Mean / (S.D.)
536.5 (68.2)
541.1 (68.6)
546.0 (68.4)
540.2 (67.5)
541.5 (68.3)
540.6 (66.3)
546.1 (69.0)
■ ■
% at or above NMS 94.2 94.0 94.9 94.7 94.1 94.2 94.9 ■ ■
Year 5Mean / (S.D.)
484.4 (76.5)
493.9 (78.1)
487.4 (76.1)
488.1 (76.3)
493.6 (77.6)
502.3 (64.7)
500.6 (78.0)
■
% at or above NMS 91.0 91.7 91.3 91.5 91.6 96.1 92.9 ■
Year 3Mean / (S.D.)
400.5 (84.5)
410.8 (86.2)
414.3 (83.3)
415.7 (87.5)
419.6 (87.9)
419.1 (80.6)
418.3 (86.2)
■
% at or above NMS 92.1 93.7 93.9 93.8 93.6 95.3 93.5 ■
Comparison of means
▲▲ Average achievement is substantially above and is statistically significantly different from the base year (or previous year) for this state/territory.
Average achievement is above and is statistically significantly different from the base year (or previous year) for this state/territory.
■▲ Average achievement is close to or not statistically different from the base year (or previous year) for this state/territory.
Average achievement is below and is statistically significantly different from the base year (or previous year) for this state/territory.
▼ Average achievement is substantially below and is statistically significantly different from the base year (or previous year) for this state/territory.
Comparison of percentages of students at or above the national minimum standard (NMS)
▲▲ Percentage of students at or above NMS is substantially higher than and is statistically significantly different from the base year (or previous year) for this state/territory.
Percentage of students at or above NMS is higher than and is statistically significantly different from the base year (or previous year) for this state/territory.
■▲ Percentage of students at or above NMS is close to or not statistically different from the base year (or previous year) for this state/territory.
Percentage of students at or above NMS is lower than and is statistically significantly different from the base year (or previous year) for this state/territory.
▼ Percentage of students at or above NMS is substantially lower than and is statistically significantly different from the base year (or previous year) for this state/territory.
vii
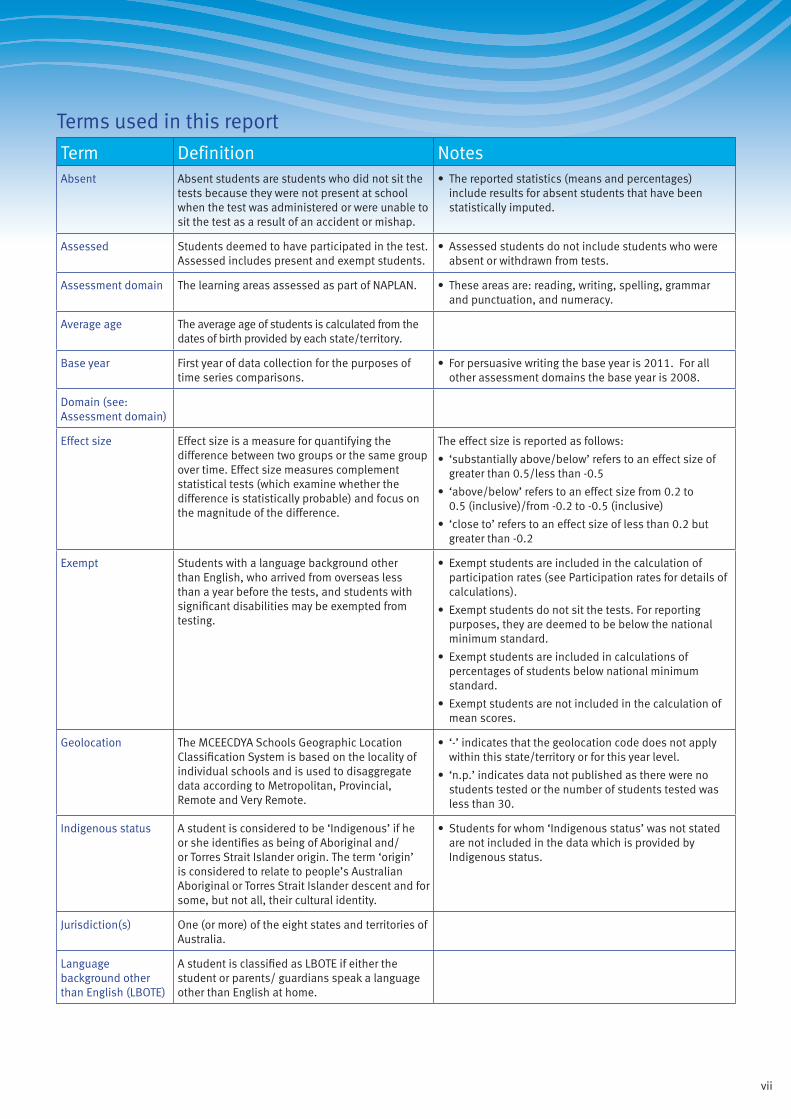
Terms used in this report
Term Definition NotesAbsent Absent students are students who did not sit the
tests because they were not present at school when the test was administered or were unable to sit the test as a result of an accident or mishap.
• The reported statistics (means and percentages) include results for absent students that have been statistically imputed.
Assessed Students deemed to have participated in the test. Assessed includes present and exempt students.
• Assessed students do not include students who were absent or withdrawn from tests.
Assessment domain The learning areas assessed as part of NAPLAN. • These areas are: reading, writing, spelling, grammar and punctuation, and numeracy.
Average age The average age of students is calculated from the dates of birth provided by each state/territory.
Base year First year of data collection for the purposes of time series comparisons.
• For persuasive writing the base year is 2011. For all other assessment domains the base year is 2008.
Domain (see: Assessment domain)
Effect size Effect size is a measure for quantifying the difference between two groups or the same group over time. Effect size measures complement statistical tests (which examine whether the difference is statistically probable) and focus on the magnitude of the difference.
The effect size is reported as follows:
• ‘substantially above/below’ refers to an effect size of greater than 0.5/less than -0.5
• ‘above/below’ refers to an effect size from 0.2 to 0.5 (inclusive)/from -0.2 to -0.5 (inclusive)
• ‘close to’ refers to an effect size of less than 0.2 but greater than -0.2
Exempt Students with a language background other than English, who arrived from overseas less than a year before the tests, and students with significant disabilities may be exempted from testing.
• Exempt students are included in the calculation of participation rates (see Participation rates for details of calculations).
• Exempt students do not sit the tests. For reporting purposes, they are deemed to be below the national minimum standard.
• Exempt students are included in calculations of percentages of students below national minimum standard.
• Exempt students are not included in the calculation of mean scores.
Geolocation The MCEECDYA Schools Geographic Location Classification System is based on the locality of individual schools and is used to disaggregate data according to Metropolitan, Provincial, Remote and Very Remote.
• ‘-’ indicates that the geolocation code does not apply within this state/territory or for this year level.
• ‘n.p.’ indicates data not published as there were no students tested or the number of students tested was less than 30.
Indigenous status A student is considered to be ‘Indigenous’ if he or she identifies as being of Aboriginal and/or Torres Strait Islander origin. The term ‘origin’ is considered to relate to people’s Australian Aboriginal or Torres Strait Islander descent and for some, but not all, their cultural identity.
• Students for whom ‘Indigenous status’ was not stated are not included in the data which is provided by Indigenous status.
Jurisdiction(s) One (or more) of the eight states and territories of Australia.
Language background other than English (LBOTE)
A student is classified as LBOTE if either the student or parents/ guardians speak a language other than English at home.
viii
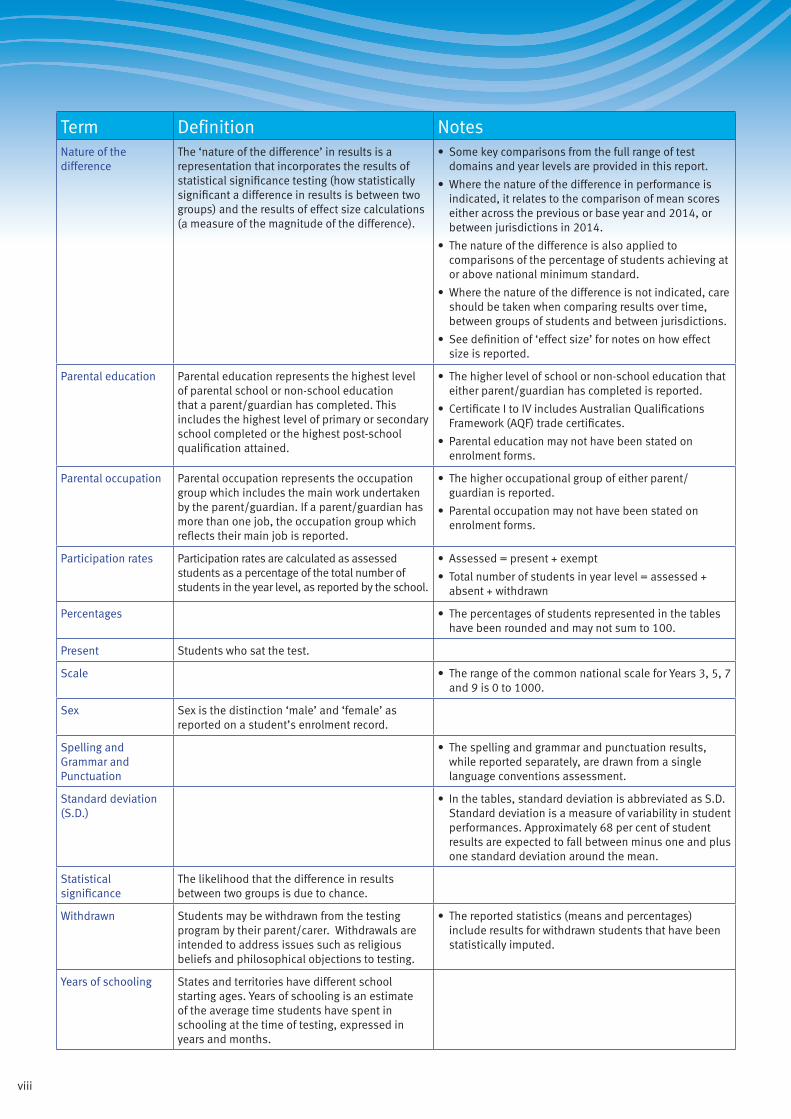
Term Definition NotesNature of the difference
The ‘nature of the difference’ in results is a representation that incorporates the results of statistical significance testing (how statistically significant a difference in results is between two groups) and the results of effect size calculations (a measure of the magnitude of the difference).
• Some key comparisons from the full range of test domains and year levels are provided in this report.
• Where the nature of the difference in performance is indicated, it relates to the comparison of mean scores either across the previous or base year and 2014, or between jurisdictions in 2014.
• The nature of the difference is also applied to comparisons of the percentage of students achieving at or above national minimum standard.
• Where the nature of the difference is not indicated, care should be taken when comparing results over time, between groups of students and between jurisdictions.
• See definition of ‘effect size’ for notes on how effect size is reported.
Parental education Parental education represents the highest level of parental school or non-school education that a parent/guardian has completed. This includes the highest level of primary or secondary school completed or the highest post-school qualification attained.
• The higher level of school or non-school education that either parent/guardian has completed is reported.
• Certificate I to IV includes Australian Qualifications Framework (AQF) trade certificates.
• Parental education may not have been stated on enrolment forms.
Parental occupation Parental occupation represents the occupation group which includes the main work undertaken by the parent/guardian. If a parent/guardian has more than one job, the occupation group which reflects their main job is reported.
• The higher occupational group of either parent/guardian is reported.
• Parental occupation may not have been stated on enrolment forms.
Participation rates Participation rates are calculated as assessed students as a percentage of the total number of students in the year level, as reported by the school.
• Assessed = present + exempt
• Total number of students in year level = assessed + absent + withdrawn
Percentages • The percentages of students represented in the tables have been rounded and may not sum to 100.
Present Students who sat the test.
Scale • The range of the common national scale for Years 3, 5, 7 and 9 is 0 to 1000.
Sex Sex is the distinction ‘male’ and ‘female’ as reported on a student’s enrolment record.
Spelling and Grammar and Punctuation
• The spelling and grammar and punctuation results, while reported separately, are drawn from a single language conventions assessment.
Standard deviation (S.D.)
• In the tables, standard deviation is abbreviated as S.D. Standard deviation is a measure of variability in student performances. Approximately 68 per cent of student results are expected to fall between minus one and plus one standard deviation around the mean.
Statistical significance
The likelihood that the difference in results between two groups is due to chance.
Withdrawn Students may be withdrawn from the testing program by their parent/carer. Withdrawals are intended to address issues such as religious beliefs and philosophical objections to testing.
• The reported statistics (means and percentages) include results for withdrawn students that have been statistically imputed.
Years of schooling States and territories have different school starting ages. Years of schooling is an estimate of the average time students have spent in schooling at the time of testing, expressed in years and months.
1
2014 Results NAPLAN Year 3
Year 3 Reading ..................................... 2• by State and Territory, 2014
• by Sex, by State and Territory, 2014
• by Indigenous Status, by State and Territory, 2014
• by LBOTE Status, by State and Territory, 2014
• by Geolocation, by State and Territory, 2014
• Indigenous Students by Geolocation, by State and Territory, 2014
• Non-Indigenous Students by Geolocation, by State and Territory, 2014
• by Parental Education, by State and Territory, 2014
• by Parental Occupation, by State and Territory, 2014
Year 3 Persuasive Writing ................... 13• by State and Territory, 2014
• by Sex, by State and Territory, 2014
• by Indigenous Status, by State and Territory, 2014
• by LBOTE Status, by State and Territory, 2014
• by Geolocation, by State and Territory, 2014
• Indigenous Students by Geolocation, by State and Territory, 2014
• Non-Indigenous Students by Geolocation, by State and Territory, 2014
• by Parental Education, by State and Territory, 2014
• by Parental Occupation, by State and Territory, 2014
Year 3 Spelling ................................... 24• by State and Territory, 2014
• by Sex, by State and Territory, 2014
• by Indigenous Status, by State and Territory, 2014
• by LBOTE Status, by State and Territory, 2014
• by Geolocation, by State and Territory, 2014
• Indigenous Students by Geolocation, by State and Territory, 2014
• Non-Indigenous Students by Geolocation, by State and Territory, 2014
• by Parental Education, by State and Territory, 2014
• by Parental Occupation, by State and Territory, 2014
Year 3 Grammar and Punctuation ....... 35• by State and Territory, 2014
• by Sex, by State and Territory, 2014
• by Indigenous Status, by State and Territory, 2014
• by LBOTE Status, by State and Territory, 2014
• by Geolocation, by State and Territory, 2014
• Indigenous Students by Geolocation, by State and Territory, 2014
• Non-Indigenous Students by Geolocation, by State and Territory, 2014
• by Parental Education, by State and Territory, 2014
• by Parental Occupation, by State and Territory, 2014
Year 3 Numeracy ................................ 46• by State and Territory, 2014
• by Sex, by State and Territory, 2014
• by Indigenous Status, by State and Territory, 2014
• by LBOTE Status, by State and Territory, 2014
• by Geolocation, by State and Territory, 2014
• Indigenous Students by Geolocation, by State and Territory, 2014
• Non-Indigenous Students by Geolocation, by State and Territory, 2014
• by Parental Education, by State and Territory, 2014
• by Parental Occupation, by State and Territory, 2014
Year 3 Participation .............................57• by State and Territory, 2014
• by Indigenous Status, by State and Territory, 2014
• Student Exemptions, Absences and Withdrawals, by State and Territory, 2014
• Student Exemptions, Absences and Withdrawals, by Indigenous Status, by State and Territory, 2014
Year 3 Comparative Achievement ........61• in Reading by State and Territory, 2014
• in Persuasive Writing, by State and Territory, 2014
• in Spelling, by State and Territory, 2014
• in Grammar and Punctuation, by State and Territory, 2014
• in Numeracy, by State and Territory, 2014
Year 3 Commentary ............................ 63
2
NAPLAN Year 3 Reading
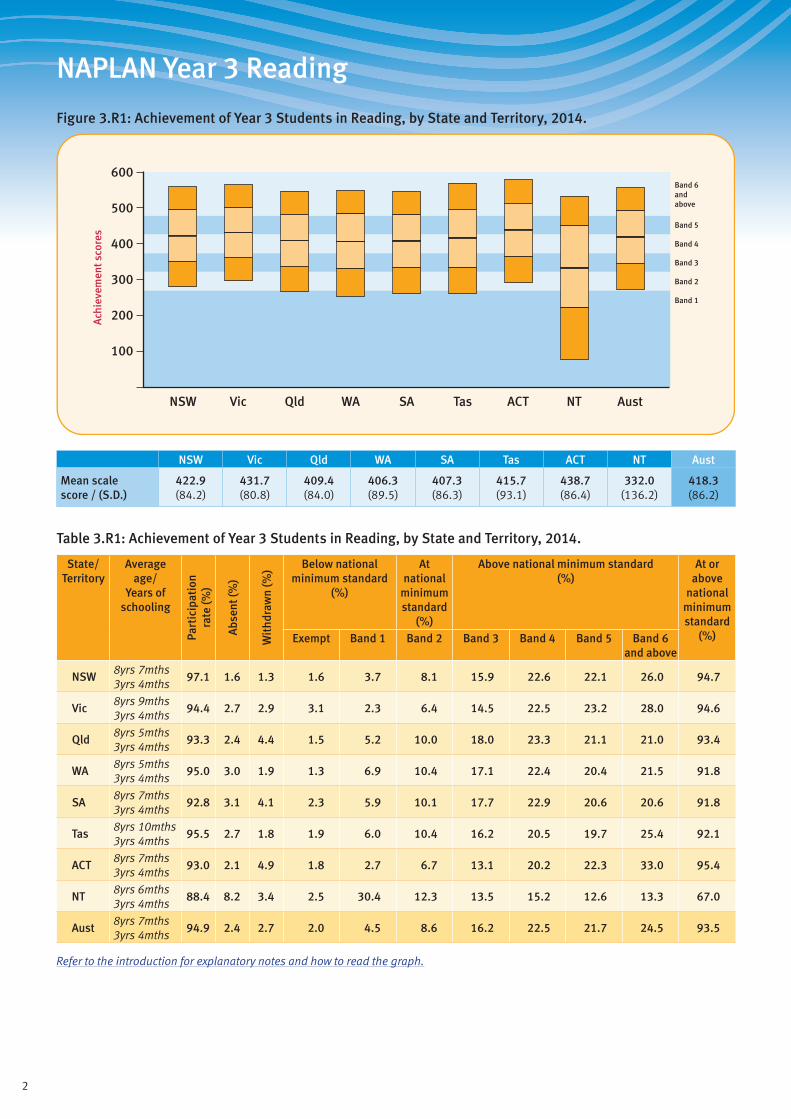
Figure 3.R1: Achievement of Year 3 Students in Reading, by State and Territory, 2014.
Band 1
Band 2
Band 3
Band 4
Band 5
Band 6andabove
600
500
400
300
200
100
Ach
ieve
men
t sco
res
ACTQld SAWA TasVicNSW NT Aust
NSW Vic Qld WA SA Tas ACT NT Aust
Mean scale score / (S.D.)
422.9 (84.2)
431.7 (80.8)
409.4 (84.0)
406.3 (89.5)
407.3 (86.3)
415.7 (93.1)
438.7 (86.4)
332.0 (136.2)
418.3 (86.2)
Table 3.R1: Achievement of Year 3 Students in Reading, by State and Territory, 2014.
State/ Territory
Average age/
Years of schooling
Part
icip
atio
nra
te (%
)
Abs
ent (
%)
Wit
hdra
wn
(%) Below national
minimum standard (%)
At national
minimum standard
(%)
Above national minimum standard (%)
At or above
national minimum standard
(%)Exempt Band 1 Band 2 Band 3 Band 4 Band 5 Band 6 and above
NSW8yrs 7mths 3yrs 4mths
97.1 1.6 1.3 1.6 3.7 8.1 15.9 22.6 22.1 26.0 94.7
Vic8yrs 9mths 3yrs 4mths
94.4 2.7 2.9 3.1 2.3 6.4 14.5 22.5 23.2 28.0 94.6
Qld8yrs 5mths 3yrs 4mths
93.3 2.4 4.4 1.5 5.2 10.0 18.0 23.3 21.1 21.0 93.4
WA8yrs 5mths 3yrs 4mths
95.0 3.0 1.9 1.3 6.9 10.4 17.1 22.4 20.4 21.5 91.8
SA8yrs 7mths 3yrs 4mths
92.8 3.1 4.1 2.3 5.9 10.1 17.7 22.9 20.6 20.6 91.8
Tas8yrs 10mths 3yrs 4mths
95.5 2.7 1.8 1.9 6.0 10.4 16.2 20.5 19.7 25.4 92.1
ACT8yrs 7mths 3yrs 4mths
93.0 2.1 4.9 1.8 2.7 6.7 13.1 20.2 22.3 33.0 95.4
NT8yrs 6mths 3yrs 4mths
88.4 8.2 3.4 2.5 30.4 12.3 13.5 15.2 12.6 13.3 67.0
Aust8yrs 7mths 3yrs 4mths
94.9 2.4 2.7 2.0 4.5 8.6 16.2 22.5 21.7 24.5 93.5
Refer to the introduction for explanatory notes and how to read the graph.
3
NAPLAN Year 3 Reading
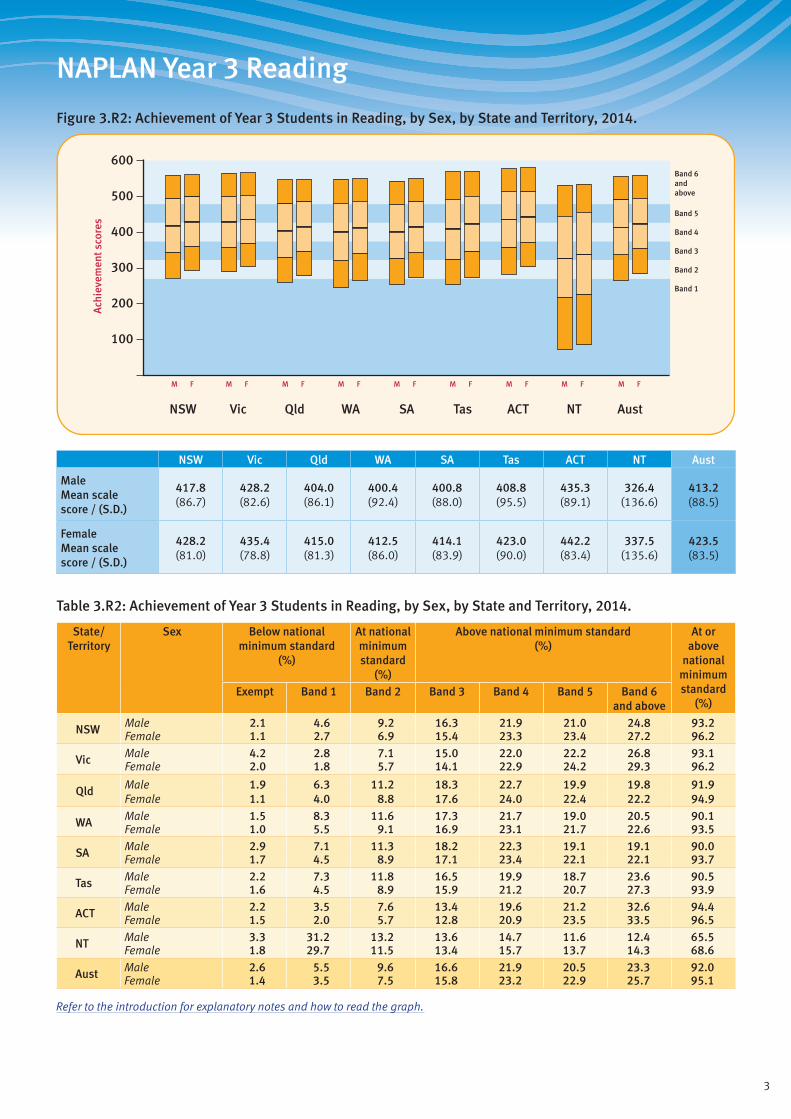
Figure 3.R2: Achievement of Year 3 Students in Reading, by Sex, by State and Territory, 2014.
Band 1
Band 2
Band 3
Band 4
Band 5
Band 6andabove
600
500
400
300
200
100
Ach
ieve
men
t sco
res
ACTQld SAWA TasVicNSW NT Aust
M F M F M F M F M F M F M F M F M F
NSW Vic Qld WA SA Tas ACT NT Aust
Male Mean scale score / (S.D.)
417.8 (86.7)
428.2 (82.6)
404.0 (86.1)
400.4 (92.4)
400.8 (88.0)
408.8 (95.5)
435.3 (89.1)
326.4 (136.6)
413.2 (88.5)
Female Mean scale score / (S.D.)
428.2 (81.0)
435.4 (78.8)
415.0 (81.3)
412.5 (86.0)
414.1 (83.9)
423.0 (90.0)
442.2 (83.4)
337.5 (135.6)
423.5 (83.5)
Table 3.R2: Achievement of Year 3 Students in Reading, by Sex, by State and Territory, 2014.
State/ Territory
Sex Below national minimum standard
(%)
At national minimum standard
(%)
Above national minimum standard (%)
At or above
national minimum standard
(%)Exempt Band 1 Band 2 Band 3 Band 4 Band 5 Band 6
and above
NSW Male 2.1 4.6 9.2 16.3 21.9 21.0 24.8 93.2Female 1.1 2.7 6.9 15.4 23.3 23.4 27.2 96.2
Vic Male 4.2 2.8 7.1 15.0 22.0 22.2 26.8 93.1Female 2.0 1.8 5.7 14.1 22.9 24.2 29.3 96.2
Qld Male 1.9 6.3 11.2 18.3 22.7 19.9 19.8 91.9Female 1.1 4.0 8.8 17.6 24.0 22.4 22.2 94.9
WA Male 1.5 8.3 11.6 17.3 21.7 19.0 20.5 90.1Female 1.0 5.5 9.1 16.9 23.1 21.7 22.6 93.5
SA Male 2.9 7.1 11.3 18.2 22.3 19.1 19.1 90.0Female 1.7 4.5 8.9 17.1 23.4 22.1 22.1 93.7
Tas Male 2.2 7.3 11.8 16.5 19.9 18.7 23.6 90.5Female 1.6 4.5 8.9 15.9 21.2 20.7 27.3 93.9
ACT Male 2.2 3.5 7.6 13.4 19.6 21.2 32.6 94.4Female 1.5 2.0 5.7 12.8 20.9 23.5 33.5 96.5
NT Male 3.3 31.2 13.2 13.6 14.7 11.6 12.4 65.5Female 1.8 29.7 11.5 13.4 15.7 13.7 14.3 68.6
Aust Male 2.6 5.5 9.6 16.6 21.9 20.5 23.3 92.0Female 1.4 3.5 7.5 15.8 23.2 22.9 25.7 95.1
Refer to the introduction for explanatory notes and how to read the graph.
4
NAPLAN Year 3 Reading
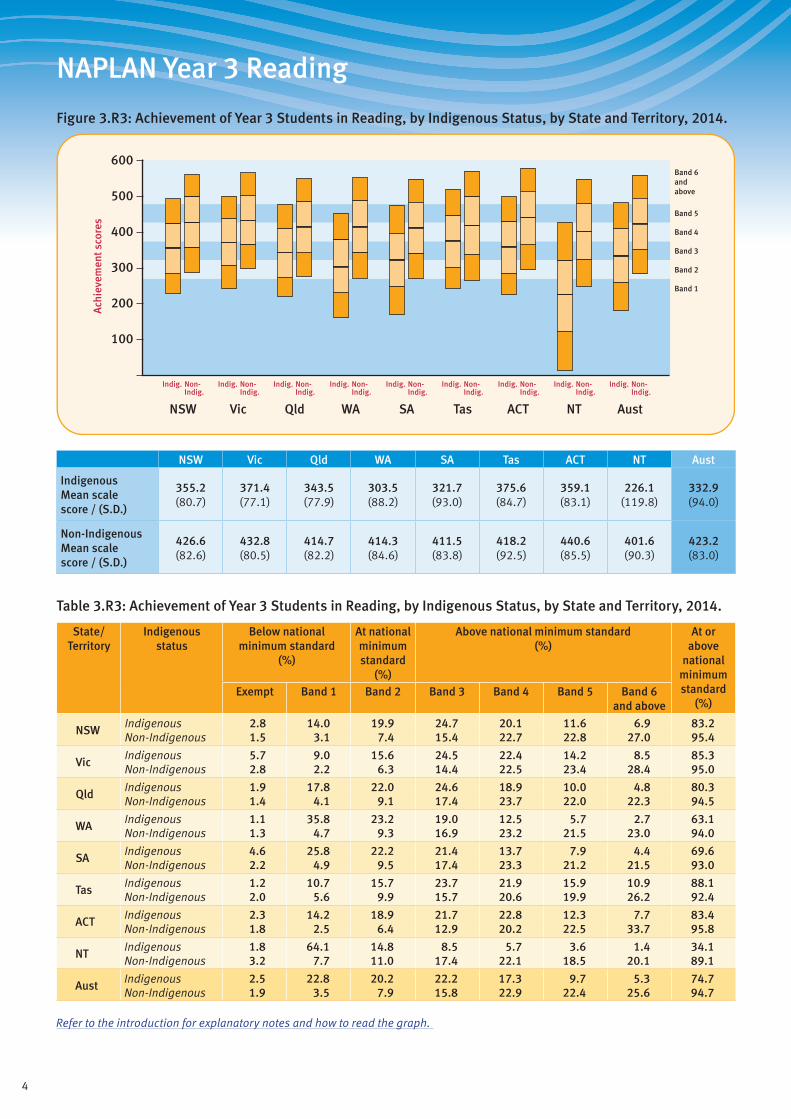
Figure 3.R3: Achievement of Year 3 Students in Reading, by Indigenous Status, by State and Territory, 2014.
Band 1
Band 2
Band 3
Band 4
Band 5
Band 6and above
600
500
400
300
200
100
Ach
ieve
men
t sco
res
ACTQld SAWA TasVicNSW NT Aust
Indig. Non-Indig.
Indig. Non-Indig.
Indig. Non-Indig.
Indig. Non-Indig.
Indig. Non-Indig.
Indig. Non-Indig.
Indig. Non-Indig.
Indig. Non-Indig.
Indig. Non-Indig.
NSW Vic Qld WA SA Tas ACT NT Aust
Indigenous Mean scale score / (S.D.)
355.2 (80.7)
371.4 (77.1)
343.5 (77.9)
303.5 (88.2)
321.7 (93.0)
375.6 (84.7)
359.1 (83.1)
226.1 (119.8)
332.9 (94.0)
Non-Indigenous Mean scale score / (S.D.)
426.6 (82.6)
432.8 (80.5)
414.7 (82.2)
414.3 (84.6)
411.5 (83.8)
418.2 (92.5)
440.6 (85.5)
401.6 (90.3)
423.2 (83.0)
Table 3.R3: Achievement of Year 3 Students in Reading, by Indigenous Status, by State and Territory, 2014.
State/ Territory
Indigenous status
Below national minimum standard
(%)
At national minimum standard
(%)
Above national minimum standard (%)
At or above
national minimum standard
(%)Exempt Band 1 Band 2 Band 3 Band 4 Band 5 Band 6
and above
NSWIndigenous 2.8 14.0 19.9 24.7 20.1 11.6 6.9 83.2Non-Indigenous 1.5 3.1 7.4 15.4 22.7 22.8 27.0 95.4
VicIndigenous 5.7 9.0 15.6 24.5 22.4 14.2 8.5 85.3Non-Indigenous 2.8 2.2 6.3 14.4 22.5 23.4 28.4 95.0
QldIndigenous 1.9 17.8 22.0 24.6 18.9 10.0 4.8 80.3Non-Indigenous 1.4 4.1 9.1 17.4 23.7 22.0 22.3 94.5
WAIndigenous 1.1 35.8 23.2 19.0 12.5 5.7 2.7 63.1Non-Indigenous 1.3 4.7 9.3 16.9 23.2 21.5 23.0 94.0
SAIndigenous 4.6 25.8 22.2 21.4 13.7 7.9 4.4 69.6Non-Indigenous 2.2 4.9 9.5 17.4 23.3 21.2 21.5 93.0
TasIndigenous 1.2 10.7 15.7 23.7 21.9 15.9 10.9 88.1Non-Indigenous 2.0 5.6 9.9 15.7 20.6 19.9 26.2 92.4
ACTIndigenous 2.3 14.2 18.9 21.7 22.8 12.3 7.7 83.4Non-Indigenous 1.8 2.5 6.4 12.9 20.2 22.5 33.7 95.8
NTIndigenous 1.8 64.1 14.8 8.5 5.7 3.6 1.4 34.1Non-Indigenous 3.2 7.7 11.0 17.4 22.1 18.5 20.1 89.1
AustIndigenous 2.5 22.8 20.2 22.2 17.3 9.7 5.3 74.7Non-Indigenous 1.9 3.5 7.9 15.8 22.9 22.4 25.6 94.7
Refer to the introduction for explanatory notes and how to read the graph.
5
NAPLAN Year 3 Reading
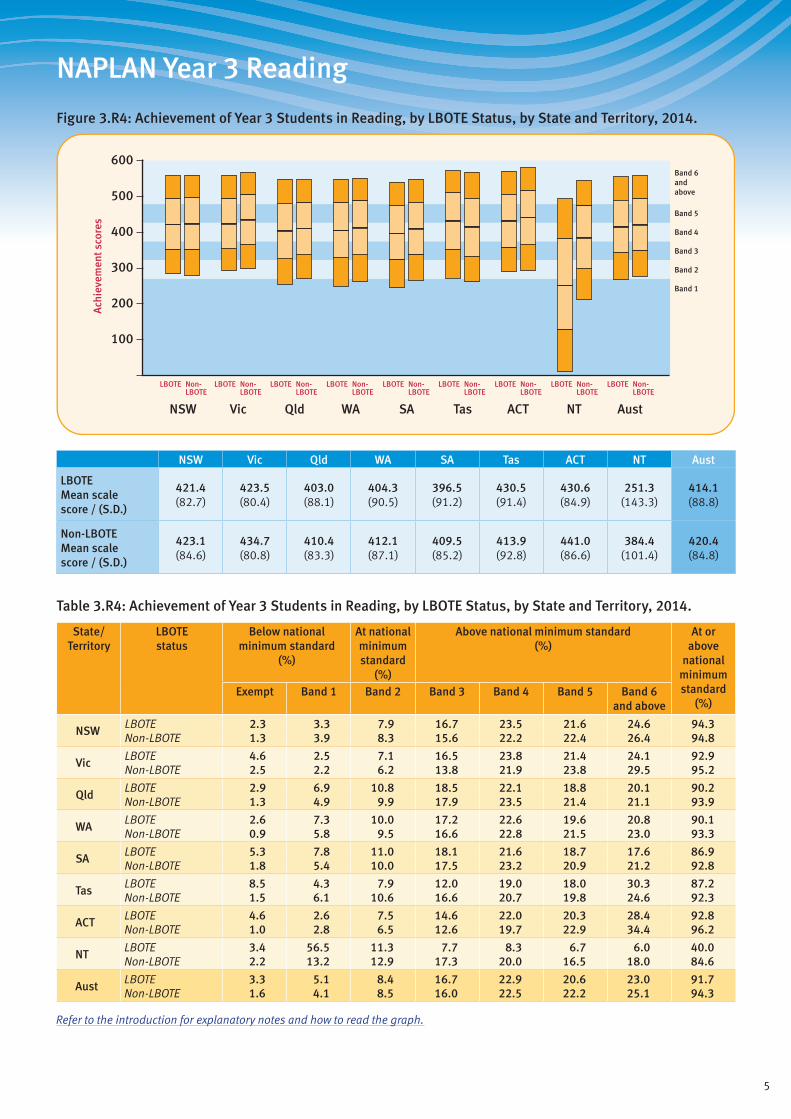
Figure 3.R4: Achievement of Year 3 Students in Reading, by LBOTE Status, by State and Territory, 2014.
Band 1
Band 2
Band 3
Band 4
Band 5
Band 6andabove
600
500
400
300
200
100
Ach
ieve
men
t sco
res
ACTQld SAWA TasVicNSW NT Aust
LBOTE Non-LBOTE
LBOTE Non-LBOTE
LBOTE Non-LBOTE
LBOTE Non-LBOTE
LBOTE Non-LBOTE
LBOTE Non-LBOTE
LBOTE Non-LBOTE
LBOTE Non-LBOTE
LBOTE Non-LBOTE
NSW Vic Qld WA SA Tas ACT NT Aust
LBOTE Mean scale score / (S.D.)
421.4 (82.7)
423.5 (80.4)
403.0 (88.1)
404.3 (90.5)
396.5 (91.2)
430.5 (91.4)
430.6 (84.9)
251.3 (143.3)
414.1 (88.8)
Non-LBOTE Mean scale score / (S.D.)
423.1 (84.6)
434.7 (80.8)
410.4 (83.3)
412.1 (87.1)
409.5 (85.2)
413.9 (92.8)
441.0 (86.6)
384.4 (101.4)
420.4 (84.8)
Table 3.R4: Achievement of Year 3 Students in Reading, by LBOTE Status, by State and Territory, 2014.
State/ Territory
LBOTE status
Below national minimum standard
(%)
At national minimum standard
(%)
Above national minimum standard (%)
At or above
national minimum standard
(%)Exempt Band 1 Band 2 Band 3 Band 4 Band 5 Band 6
and above
NSWLBOTE 2.3 3.3 7.9 16.7 23.5 21.6 24.6 94.3Non-LBOTE 1.3 3.9 8.3 15.6 22.2 22.4 26.4 94.8
VicLBOTE 4.6 2.5 7.1 16.5 23.8 21.4 24.1 92.9Non-LBOTE 2.5 2.2 6.2 13.8 21.9 23.8 29.5 95.2
QldLBOTE 2.9 6.9 10.8 18.5 22.1 18.8 20.1 90.2Non-LBOTE 1.3 4.9 9.9 17.9 23.5 21.4 21.1 93.9
WALBOTE 2.6 7.3 10.0 17.2 22.6 19.6 20.8 90.1Non-LBOTE 0.9 5.8 9.5 16.6 22.8 21.5 23.0 93.3
SALBOTE 5.3 7.8 11.0 18.1 21.6 18.7 17.6 86.9Non-LBOTE 1.8 5.4 10.0 17.5 23.2 20.9 21.2 92.8
TasLBOTE 8.5 4.3 7.9 12.0 19.0 18.0 30.3 87.2Non-LBOTE 1.5 6.1 10.6 16.6 20.7 19.8 24.6 92.3
ACTLBOTE 4.6 2.6 7.5 14.6 22.0 20.3 28.4 92.8Non-LBOTE 1.0 2.8 6.5 12.6 19.7 22.9 34.4 96.2
NTLBOTE 3.4 56.5 11.3 7.7 8.3 6.7 6.0 40.0Non-LBOTE 2.2 13.2 12.9 17.3 20.0 16.5 18.0 84.6
AustLBOTE 3.3 5.1 8.4 16.7 22.9 20.6 23.0 91.7Non-LBOTE 1.6 4.1 8.5 16.0 22.5 22.2 25.1 94.3
Refer to the introduction for explanatory notes and how to read the graph.
6
NAPLAN Year 3 Reading
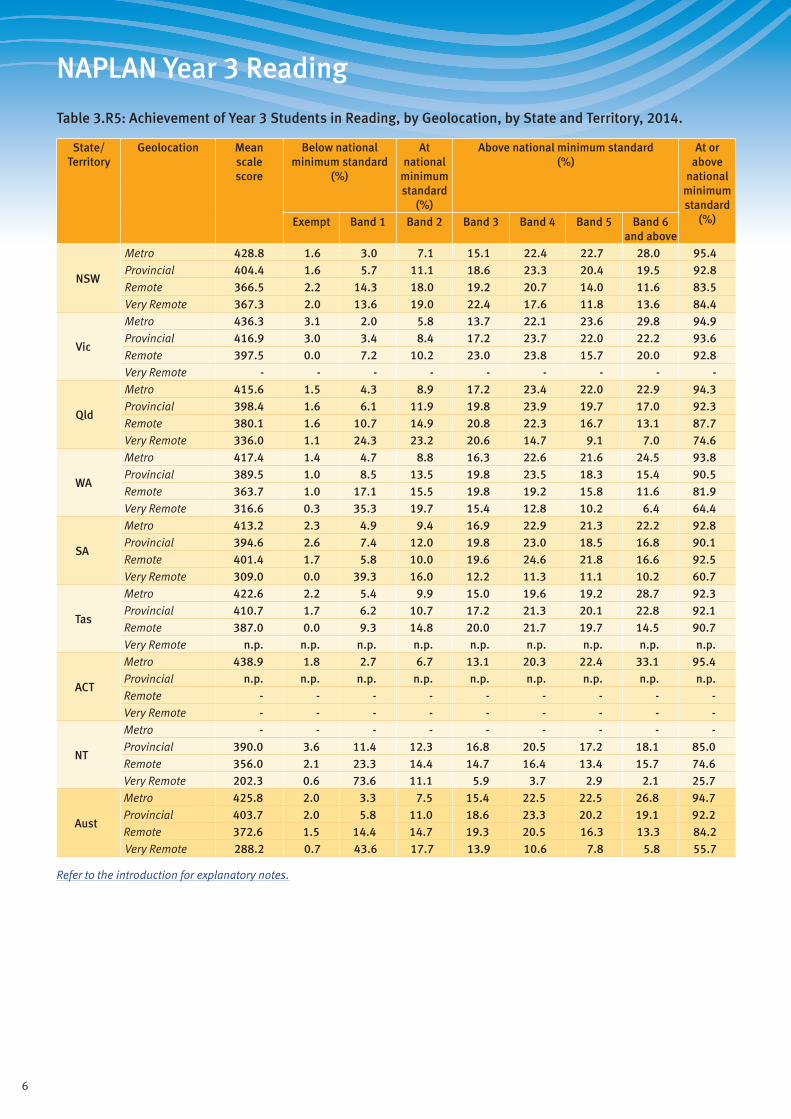
Table 3.R5: Achievement of Year 3 Students in Reading, by Geolocation, by State and Territory, 2014.
State/ Territory
Geolocation Mean scale score
Below national minimum standard
(%)
At national
minimum standard
(%)
Above national minimum standard (%)
At or above
national minimum standard
(%)Exempt Band 1 Band 2 Band 3 Band 4 Band 5 Band 6 and above
NSW
Metro 428.8 1.6 3.0 7.1 15.1 22.4 22.7 28.0 95.4Provincial 404.4 1.6 5.7 11.1 18.6 23.3 20.4 19.5 92.8Remote 366.5 2.2 14.3 18.0 19.2 20.7 14.0 11.6 83.5Very Remote 367.3 2.0 13.6 19.0 22.4 17.6 11.8 13.6 84.4
Vic
Metro 436.3 3.1 2.0 5.8 13.7 22.1 23.6 29.8 94.9Provincial 416.9 3.0 3.4 8.4 17.2 23.7 22.0 22.2 93.6Remote 397.5 0.0 7.2 10.2 23.0 23.8 15.7 20.0 92.8Very Remote - - - - - - - - -
Qld
Metro 415.6 1.5 4.3 8.9 17.2 23.4 22.0 22.9 94.3Provincial 398.4 1.6 6.1 11.9 19.8 23.9 19.7 17.0 92.3Remote 380.1 1.6 10.7 14.9 20.8 22.3 16.7 13.1 87.7Very Remote 336.0 1.1 24.3 23.2 20.6 14.7 9.1 7.0 74.6
WA
Metro 417.4 1.4 4.7 8.8 16.3 22.6 21.6 24.5 93.8Provincial 389.5 1.0 8.5 13.5 19.8 23.5 18.3 15.4 90.5Remote 363.7 1.0 17.1 15.5 19.8 19.2 15.8 11.6 81.9Very Remote 316.6 0.3 35.3 19.7 15.4 12.8 10.2 6.4 64.4
SA
Metro 413.2 2.3 4.9 9.4 16.9 22.9 21.3 22.2 92.8Provincial 394.6 2.6 7.4 12.0 19.8 23.0 18.5 16.8 90.1Remote 401.4 1.7 5.8 10.0 19.6 24.6 21.8 16.6 92.5Very Remote 309.0 0.0 39.3 16.0 12.2 11.3 11.1 10.2 60.7
Tas
Metro 422.6 2.2 5.4 9.9 15.0 19.6 19.2 28.7 92.3Provincial 410.7 1.7 6.2 10.7 17.2 21.3 20.1 22.8 92.1Remote 387.0 0.0 9.3 14.8 20.0 21.7 19.7 14.5 90.7Very Remote n.p. n.p. n.p. n.p. n.p. n.p. n.p. n.p. n.p.
ACT
Metro 438.9 1.8 2.7 6.7 13.1 20.3 22.4 33.1 95.4Provincial n.p. n.p. n.p. n.p. n.p. n.p. n.p. n.p. n.p.Remote - - - - - - - - -Very Remote - - - - - - - - -
NT
Metro - - - - - - - - -Provincial 390.0 3.6 11.4 12.3 16.8 20.5 17.2 18.1 85.0Remote 356.0 2.1 23.3 14.4 14.7 16.4 13.4 15.7 74.6Very Remote 202.3 0.6 73.6 11.1 5.9 3.7 2.9 2.1 25.7
Aust
Metro 425.8 2.0 3.3 7.5 15.4 22.5 22.5 26.8 94.7Provincial 403.7 2.0 5.8 11.0 18.6 23.3 20.2 19.1 92.2Remote 372.6 1.5 14.4 14.7 19.3 20.5 16.3 13.3 84.2Very Remote 288.2 0.7 43.6 17.7 13.9 10.6 7.8 5.8 55.7
Refer to the introduction for explanatory notes.
7
NAPLAN Year 3 Reading
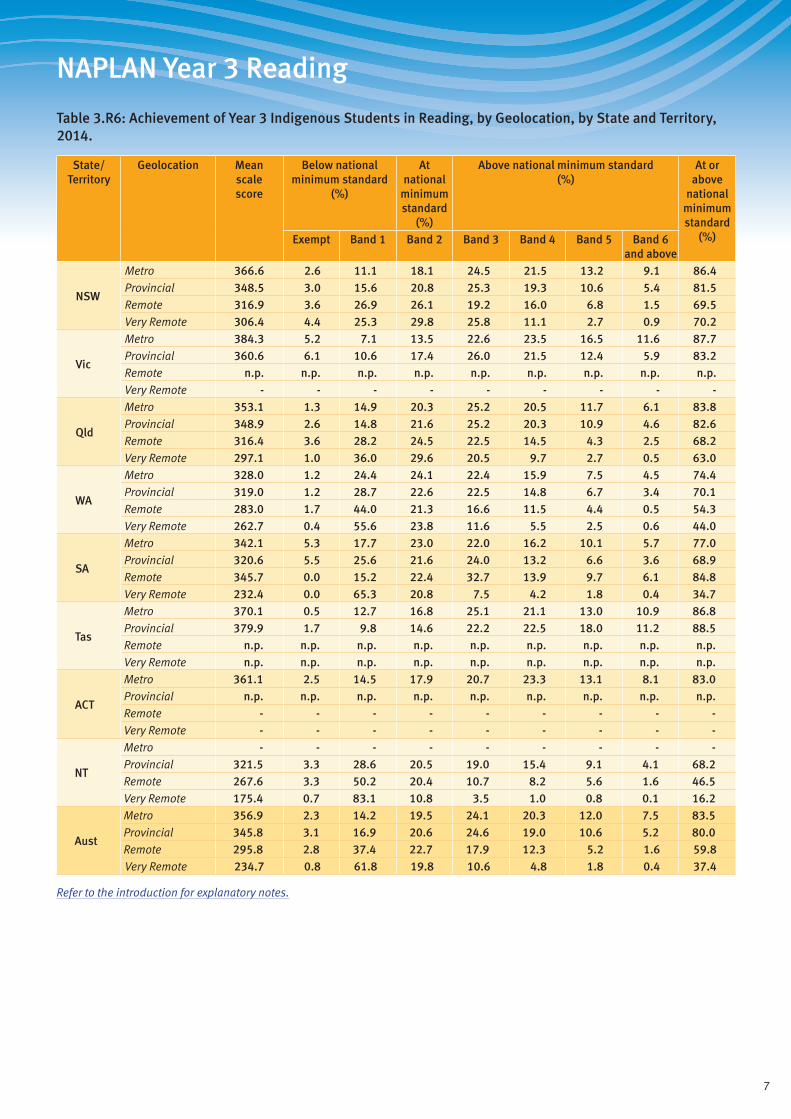
Table 3.R6: Achievement of Year 3 Indigenous Students in Reading, by Geolocation, by State and Territory, 2014.
State/ Territory
Geolocation Mean scale score
Below national minimum standard
(%)
At national
minimum standard
(%)
Above national minimum standard (%)
At or above
national minimum standard
(%)Exempt Band 1 Band 2 Band 3 Band 4 Band 5 Band 6 and above
NSW
Metro 366.6 2.6 11.1 18.1 24.5 21.5 13.2 9.1 86.4Provincial 348.5 3.0 15.6 20.8 25.3 19.3 10.6 5.4 81.5Remote 316.9 3.6 26.9 26.1 19.2 16.0 6.8 1.5 69.5Very Remote 306.4 4.4 25.3 29.8 25.8 11.1 2.7 0.9 70.2
Vic
Metro 384.3 5.2 7.1 13.5 22.6 23.5 16.5 11.6 87.7Provincial 360.6 6.1 10.6 17.4 26.0 21.5 12.4 5.9 83.2Remote n.p. n.p. n.p. n.p. n.p. n.p. n.p. n.p. n.p.Very Remote - - - - - - - - -
Qld
Metro 353.1 1.3 14.9 20.3 25.2 20.5 11.7 6.1 83.8Provincial 348.9 2.6 14.8 21.6 25.2 20.3 10.9 4.6 82.6Remote 316.4 3.6 28.2 24.5 22.5 14.5 4.3 2.5 68.2Very Remote 297.1 1.0 36.0 29.6 20.5 9.7 2.7 0.5 63.0
WA
Metro 328.0 1.2 24.4 24.1 22.4 15.9 7.5 4.5 74.4Provincial 319.0 1.2 28.7 22.6 22.5 14.8 6.7 3.4 70.1Remote 283.0 1.7 44.0 21.3 16.6 11.5 4.4 0.5 54.3Very Remote 262.7 0.4 55.6 23.8 11.6 5.5 2.5 0.6 44.0
SA
Metro 342.1 5.3 17.7 23.0 22.0 16.2 10.1 5.7 77.0Provincial 320.6 5.5 25.6 21.6 24.0 13.2 6.6 3.6 68.9Remote 345.7 0.0 15.2 22.4 32.7 13.9 9.7 6.1 84.8Very Remote 232.4 0.0 65.3 20.8 7.5 4.2 1.8 0.4 34.7
Tas
Metro 370.1 0.5 12.7 16.8 25.1 21.1 13.0 10.9 86.8Provincial 379.9 1.7 9.8 14.6 22.2 22.5 18.0 11.2 88.5Remote n.p. n.p. n.p. n.p. n.p. n.p. n.p. n.p. n.p.Very Remote n.p. n.p. n.p. n.p. n.p. n.p. n.p. n.p. n.p.
ACT
Metro 361.1 2.5 14.5 17.9 20.7 23.3 13.1 8.1 83.0Provincial n.p. n.p. n.p. n.p. n.p. n.p. n.p. n.p. n.p.Remote - - - - - - - - -Very Remote - - - - - - - - -
NT
Metro - - - - - - - - -Provincial 321.5 3.3 28.6 20.5 19.0 15.4 9.1 4.1 68.2Remote 267.6 3.3 50.2 20.4 10.7 8.2 5.6 1.6 46.5Very Remote 175.4 0.7 83.1 10.8 3.5 1.0 0.8 0.1 16.2
Aust
Metro 356.9 2.3 14.2 19.5 24.1 20.3 12.0 7.5 83.5Provincial 345.8 3.1 16.9 20.6 24.6 19.0 10.6 5.2 80.0Remote 295.8 2.8 37.4 22.7 17.9 12.3 5.2 1.6 59.8Very Remote 234.7 0.8 61.8 19.8 10.6 4.8 1.8 0.4 37.4
Refer to the introduction for explanatory notes.
8
NAPLAN Year 3 Reading
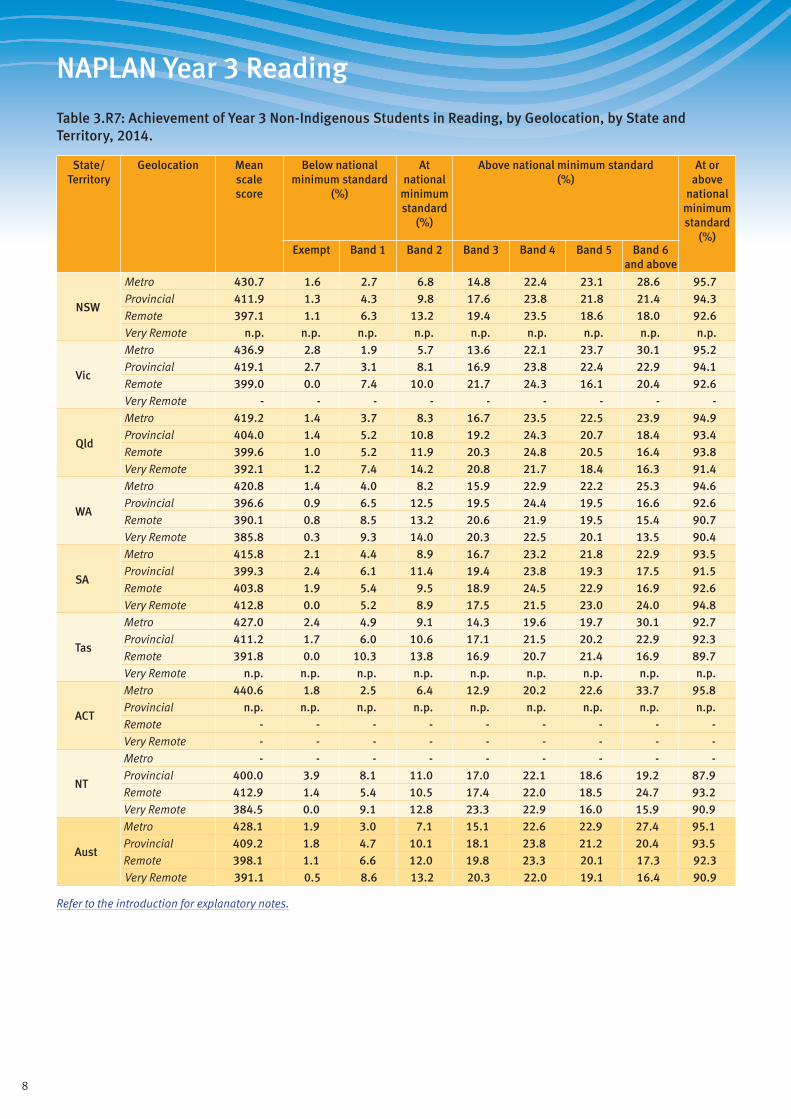
Table 3.R7: Achievement of Year 3 Non-Indigenous Students in Reading, by Geolocation, by State and Territory, 2014.
State/ Territory
Geolocation Mean scale score
Below national minimum standard
(%)
At national
minimum standard
(%)
Above national minimum standard (%)
At or above
national minimum standard
(%)Exempt Band 1 Band 2 Band 3 Band 4 Band 5 Band 6
and above
NSW
Metro 430.7 1.6 2.7 6.8 14.8 22.4 23.1 28.6 95.7Provincial 411.9 1.3 4.3 9.8 17.6 23.8 21.8 21.4 94.3Remote 397.1 1.1 6.3 13.2 19.4 23.5 18.6 18.0 92.6Very Remote n.p. n.p. n.p. n.p. n.p. n.p. n.p. n.p. n.p.
Vic
Metro 436.9 2.8 1.9 5.7 13.6 22.1 23.7 30.1 95.2Provincial 419.1 2.7 3.1 8.1 16.9 23.8 22.4 22.9 94.1Remote 399.0 0.0 7.4 10.0 21.7 24.3 16.1 20.4 92.6Very Remote - - - - - - - - -
Qld
Metro 419.2 1.4 3.7 8.3 16.7 23.5 22.5 23.9 94.9Provincial 404.0 1.4 5.2 10.8 19.2 24.3 20.7 18.4 93.4Remote 399.6 1.0 5.2 11.9 20.3 24.8 20.5 16.4 93.8Very Remote 392.1 1.2 7.4 14.2 20.8 21.7 18.4 16.3 91.4
WA
Metro 420.8 1.4 4.0 8.2 15.9 22.9 22.2 25.3 94.6Provincial 396.6 0.9 6.5 12.5 19.5 24.4 19.5 16.6 92.6Remote 390.1 0.8 8.5 13.2 20.6 21.9 19.5 15.4 90.7Very Remote 385.8 0.3 9.3 14.0 20.3 22.5 20.1 13.5 90.4
SA
Metro 415.8 2.1 4.4 8.9 16.7 23.2 21.8 22.9 93.5Provincial 399.3 2.4 6.1 11.4 19.4 23.8 19.3 17.5 91.5Remote 403.8 1.9 5.4 9.5 18.9 24.5 22.9 16.9 92.6Very Remote 412.8 0.0 5.2 8.9 17.5 21.5 23.0 24.0 94.8
Tas
Metro 427.0 2.4 4.9 9.1 14.3 19.6 19.7 30.1 92.7Provincial 411.2 1.7 6.0 10.6 17.1 21.5 20.2 22.9 92.3Remote 391.8 0.0 10.3 13.8 16.9 20.7 21.4 16.9 89.7Very Remote n.p. n.p. n.p. n.p. n.p. n.p. n.p. n.p. n.p.
ACT
Metro 440.6 1.8 2.5 6.4 12.9 20.2 22.6 33.7 95.8Provincial n.p. n.p. n.p. n.p. n.p. n.p. n.p. n.p. n.p.Remote - - - - - - - - -Very Remote - - - - - - - - -
NT
Metro - - - - - - - - -Provincial 400.0 3.9 8.1 11.0 17.0 22.1 18.6 19.2 87.9Remote 412.9 1.4 5.4 10.5 17.4 22.0 18.5 24.7 93.2Very Remote 384.5 0.0 9.1 12.8 23.3 22.9 16.0 15.9 90.9
Aust
Metro 428.1 1.9 3.0 7.1 15.1 22.6 22.9 27.4 95.1Provincial 409.2 1.8 4.7 10.1 18.1 23.8 21.2 20.4 93.5Remote 398.1 1.1 6.6 12.0 19.8 23.3 20.1 17.3 92.3Very Remote 391.1 0.5 8.6 13.2 20.3 22.0 19.1 16.4 90.9
Refer to the introduction for explanatory notes.

9
NAPLAN Year 3 Reading
Table 3.R8: Achievement of Year 3 Students in Reading, by Parental Education, by State and Territory, 2014.
State/ Territory
Parental education
Mean scale score
Below national minimum standard
(%)
At national
minimum standard
(%)
Above national minimum standard (%)
At or above
national minimum standard
(%)Exempt Band 1 Band 2 Band 3 Band 4 Band 5 Band 6 and above
NSW
Bachelor 462.5 1.1 0.9 2.9 8.5 18.6 25.4 42.7 98.0Diploma 422.3 1.3 2.5 6.6 16.2 25.4 25.0 23.0 96.2Certificate 398.3 1.4 4.7 11.0 21.0 26.3 21.1 14.5 93.9Year 12 395.4 2.2 5.4 11.5 21.6 25.4 19.6 14.4 92.4Year 11 359.6 3.2 11.3 19.3 25.5 22.5 12.0 6.1 85.5Not stated (4%) 406.3 3.5 5.9 10.9 18.6 22.2 17.9 21.0 90.6
Vic
Bachelor 463.2 1.9 0.6 3.0 8.8 18.2 25.1 42.4 97.5Diploma 425.3 2.4 2.0 6.4 15.2 25.1 25.2 23.7 95.6Certificate 408.3 2.9 3.2 8.8 19.1 26.4 22.3 17.1 93.8Year 12 411.3 4.0 3.2 8.3 17.6 26.3 22.6 18.0 92.8Year 11 376.9 7.8 7.1 13.8 23.9 24.2 15.0 8.2 85.0Not stated (3%) 439.8 6.2 1.7 6.2 13.6 19.0 21.7 31.6 92.1
Qld
Bachelor 451.0 1.0 1.3 3.9 10.9 20.6 25.5 36.9 97.7Diploma 412.1 1.0 3.4 8.6 18.0 26.3 23.4 19.3 95.6Certificate 394.6 1.2 5.5 11.8 21.4 26.0 20.2 14.0 93.3Year 12 388.3 1.3 7.2 13.5 21.7 24.3 18.9 13.1 91.5Year 11 354.6 2.9 14.2 19.5 24.8 20.8 12.0 5.9 83.0Not stated (11%) 388.2 3.0 8.1 13.9 20.4 22.3 17.8 14.6 88.9
WA
Bachelor 449.9 1.1 1.5 4.3 10.9 20.6 24.4 37.2 97.4Diploma 408.9 1.1 4.4 9.2 18.0 25.2 23.6 18.6 94.5Certificate 391.3 0.9 7.0 12.6 21.1 25.0 19.4 14.0 92.2Year 12 391.7 1.5 6.3 12.3 21.6 24.6 19.8 13.8 92.3Year 11 347.5 1.7 17.9 19.7 22.5 20.7 11.6 5.9 80.4Not stated (14%) 375.4 2.1 14.7 14.5 18.1 19.8 15.9 14.9 83.2
SA
Bachelor 449.1 1.5 1.6 4.3 11.1 19.6 25.8 36.1 96.9Diploma 411.3 1.1 3.8 8.8 18.3 25.8 22.6 19.6 95.1Certificate 392.1 2.2 6.5 12.4 20.7 25.0 19.1 14.1 91.3Year 12 393.4 2.2 5.4 12.4 21.5 26.0 18.5 14.0 92.4Year 11 354.9 4.2 14.3 18.7 23.4 21.5 12.1 5.7 81.6Not stated (10%) 382.8 4.5 10.7 11.9 19.1 22.6 17.2 14.0 84.8
KeyBachelor: Bachelor degree or aboveDiploma: Advanced diploma/diplomaCertificate: Certificate I to IVYear 12: Year 12 or equivalentYear 11: Year 11 or equivalent or belowNot stated: No data was provided for parental education at the time of student enrolment. The higher the percentage of missing data, the less informative are the results for the other categories.
Refer to the introduction for explanatory notes.
10
NAPLAN Year 3 Reading
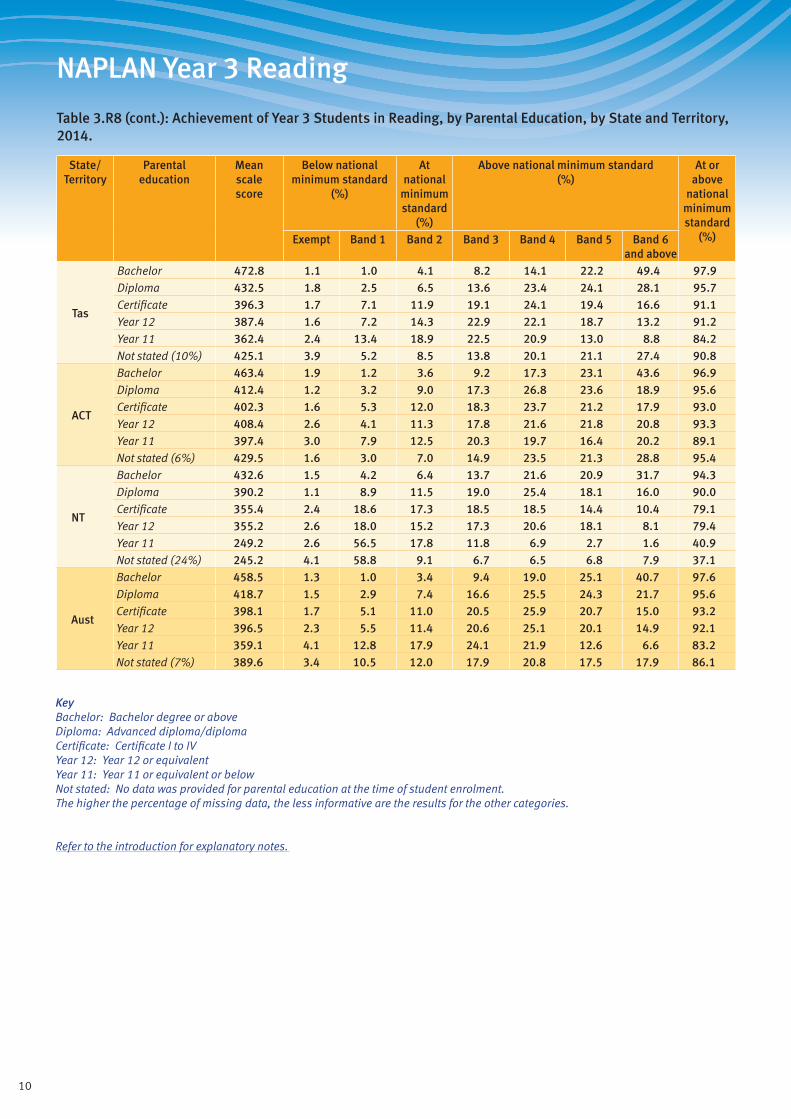
Table 3.R8 (cont.): Achievement of Year 3 Students in Reading, by Parental Education, by State and Territory, 2014.
State/ Territory
Parental education
Mean scale score
Below national minimum standard
(%)
At national
minimum standard
(%)
Above national minimum standard (%)
At or above
national minimum standard
(%)Exempt Band 1 Band 2 Band 3 Band 4 Band 5 Band 6 and above
Tas
Bachelor 472.8 1.1 1.0 4.1 8.2 14.1 22.2 49.4 97.9Diploma 432.5 1.8 2.5 6.5 13.6 23.4 24.1 28.1 95.7Certificate 396.3 1.7 7.1 11.9 19.1 24.1 19.4 16.6 91.1Year 12 387.4 1.6 7.2 14.3 22.9 22.1 18.7 13.2 91.2Year 11 362.4 2.4 13.4 18.9 22.5 20.9 13.0 8.8 84.2Not stated (10%) 425.1 3.9 5.2 8.5 13.8 20.1 21.1 27.4 90.8
ACT
Bachelor 463.4 1.9 1.2 3.6 9.2 17.3 23.1 43.6 96.9Diploma 412.4 1.2 3.2 9.0 17.3 26.8 23.6 18.9 95.6Certificate 402.3 1.6 5.3 12.0 18.3 23.7 21.2 17.9 93.0Year 12 408.4 2.6 4.1 11.3 17.8 21.6 21.8 20.8 93.3Year 11 397.4 3.0 7.9 12.5 20.3 19.7 16.4 20.2 89.1Not stated (6%) 429.5 1.6 3.0 7.0 14.9 23.5 21.3 28.8 95.4
NT
Bachelor 432.6 1.5 4.2 6.4 13.7 21.6 20.9 31.7 94.3Diploma 390.2 1.1 8.9 11.5 19.0 25.4 18.1 16.0 90.0Certificate 355.4 2.4 18.6 17.3 18.5 18.5 14.4 10.4 79.1Year 12 355.2 2.6 18.0 15.2 17.3 20.6 18.1 8.1 79.4Year 11 249.2 2.6 56.5 17.8 11.8 6.9 2.7 1.6 40.9Not stated (24%) 245.2 4.1 58.8 9.1 6.7 6.5 6.8 7.9 37.1
Aust
Bachelor 458.5 1.3 1.0 3.4 9.4 19.0 25.1 40.7 97.6Diploma 418.7 1.5 2.9 7.4 16.6 25.5 24.3 21.7 95.6Certificate 398.1 1.7 5.1 11.0 20.5 25.9 20.7 15.0 93.2Year 12 396.5 2.3 5.5 11.4 20.6 25.1 20.1 14.9 92.1Year 11 359.1 4.1 12.8 17.9 24.1 21.9 12.6 6.6 83.2Not stated (7%) 389.6 3.4 10.5 12.0 17.9 20.8 17.5 17.9 86.1
KeyBachelor: Bachelor degree or aboveDiploma: Advanced diploma/diplomaCertificate: Certificate I to IVYear 12: Year 12 or equivalentYear 11: Year 11 or equivalent or belowNot stated: No data was provided for parental education at the time of student enrolment. The higher the percentage of missing data, the less informative are the results for the other categories.
Refer to the introduction for explanatory notes.

11
NAPLAN Year 3 Reading
Table 3.R9: Achievement of Year 3 Students in Reading, by Parental Occupation, by State and Territory, 2014.
State/ Territory
Parental occupation
Mean scale score
Below national minimum standard
(%)
At national
minimum standard
(%)
Above national minimum standard (%)
At or above
national minimum standard
(%)Exempt Band 1 Band 2 Band 3 Band 4 Band 5 Band 6 and above
NSW
Group 1 463.7 0.9 1.0 2.9 8.1 18.4 25.3 43.5 98.1Group 2 437.5 1.0 1.8 5.1 13.4 22.9 25.6 30.3 97.2Group 3 408.3 1.2 3.5 9.1 19.3 26.6 22.7 17.7 95.4Group 4 389.0 1.7 6.1 13.2 22.5 25.3 18.6 12.6 92.2Not in paid work 369.5 4.2 10.1 17.4 23.7 22.0 13.3 9.2 85.7Not stated (10%) 392.1 3.6 7.4 13.1 21.0 22.3 16.5 16.1 89.0
Vic
Group 1 468.6 1.3 0.5 2.7 7.9 16.9 25.1 45.5 98.1Group 2 443.2 1.7 1.3 4.4 12.0 22.3 26.1 32.2 97.0Group 3 419.9 2.1 2.3 7.2 16.7 25.8 24.3 21.5 95.6Group 4 399.5 4.3 4.0 9.9 21.0 26.9 19.8 14.1 91.7Not in paid work 386.5 9.2 6.1 12.5 21.7 23.5 15.7 11.4 84.7Not stated (3%) 441.0 5.6 1.7 6.0 12.8 19.5 22.4 31.9 92.7
Qld
Group 1 450.7 0.8 1.3 4.1 11.0 20.5 25.1 37.1 97.9Group 2 424.8 0.8 2.6 6.7 15.9 24.7 24.7 24.6 96.6Group 3 401.2 1.1 4.6 10.8 20.2 25.9 21.3 16.1 94.3Group 4 377.7 1.6 8.8 15.3 23.0 24.3 16.6 10.3 89.5Not in paid work 358.3 3.3 14.1 18.9 23.4 20.5 12.5 7.2 82.7Not stated (16%) 386.3 2.8 8.2 14.1 21.2 22.4 17.5 13.8 88.9
WA
Group 1 448.8 0.8 1.7 4.5 11.2 20.2 24.7 36.9 97.5Group 2 420.9 0.8 3.6 7.6 15.8 24.6 23.3 24.3 95.6Group 3 399.7 1.0 5.3 11.3 19.9 25.7 20.7 16.2 93.7Group 4 378.7 1.5 9.2 15.1 22.1 24.0 16.8 11.3 89.3Not in paid work 358.8 2.0 16.6 18.3 21.3 18.1 14.0 9.7 81.4Not stated (23%) 377.9 2.1 13.0 14.1 19.1 21.0 16.4 14.3 84.9
SA
Group 1 452.0 1.2 1.3 4.2 10.7 19.5 25.4 37.7 97.4Group 2 422.6 0.9 3.1 7.7 16.1 23.5 23.7 25.0 96.0Group 3 401.1 1.5 4.9 10.5 19.6 26.4 20.9 16.1 93.6Group 4 382.7 2.8 7.6 14.4 22.0 24.7 17.6 10.9 89.6Not in paid work 367.4 4.7 12.1 16.5 22.1 21.3 13.7 9.6 83.2Not stated (19%) 374.5 4.6 11.5 14.0 20.9 22.1 15.8 11.0 83.9
KeyGroup 1: Senior management and qualified professionalsGroup 2: Other business managers and associate professionalsGroup 3: Tradespeople, clerks, skilled office, sales and service staffGroup 4: Machine operators, hospitality staff, assistants, labourersNot in paid work: Not in paid work in the previous 12 monthsNot stated: No data was provided for parental occupation at the time of student enrolment. The higher the percentage of missing data, the less informative are the results for the other categories.
Refer to the introduction for explanatory notes.

12
NAPLAN Year 3 Reading
Table 3.R9 (cont.): Achievement of Year 3 Students in Reading, by Parental Occupation, by State and Territory, 2014.
State/ Territory
Parental occupation
Mean scale score
Below national minimum standard
(%)
At national
minimum standard
(%)
Above national minimum standard (%)
At or above
national minimum standard
(%)Exempt Band 1 Band 2 Band 3 Band 4 Band 5 Band 6 and above
Tas
Group 1 468.4 0.7 1.7 4.4 7.8 15.2 22.7 47.4 97.6Group 2 433.8 1.3 3.0 6.8 14.1 22.0 22.6 30.3 95.8Group 3 410.4 1.3 4.7 10.2 18.3 23.1 22.0 20.5 94.0Group 4 380.3 1.7 9.1 15.1 22.4 23.4 15.8 12.6 89.3Not in paid work 360.9 2.8 14.4 18.5 23.4 19.5 12.0 9.4 82.8Not stated (14%) 408.5 4.8 7.3 11.9 14.8 20.0 19.0 22.3 87.9
ACT
Group 1 464.6 1.5 1.3 4.1 8.8 17.2 22.2 44.9 97.2Group 2 437.0 1.1 2.6 6.2 13.0 20.4 26.0 30.7 96.3Group 3 420.1 1.6 3.4 9.7 15.4 22.6 22.3 25.1 95.0Group 4 389.0 2.3 6.6 12.4 21.8 27.0 17.7 12.2 91.1Not in paid work 385.9 5.5 6.9 13.4 23.2 22.1 15.7 13.2 87.7Not stated (13%) 415.4 3.1 4.1 8.4 17.7 23.9 19.8 23.0 92.8
NT
Group 1 421.2 1.0 5.6 9.8 14.5 20.2 19.9 29.0 93.4Group 2 392.6 1.0 11.4 10.5 17.4 21.9 18.5 19.4 87.6Group 3 371.1 2.5 14.6 13.4 20.2 21.2 15.9 12.2 82.9Group 4 306.3 2.4 37.5 20.0 12.3 12.1 8.8 7.0 60.1Not in paid work 253.4 3.4 56.0 17.1 10.0 8.0 3.7 1.9 40.6Not stated (23%) 226.4 4.6 61.8 9.5 7.3 6.8 5.9 4.1 33.6
Aust
Group 1 459.6 1.0 1.1 3.5 9.2 18.7 25.0 41.6 97.9Group 2 433.6 1.1 2.2 5.7 14.0 23.2 25.1 28.7 96.7Group 3 408.1 1.4 3.9 9.4 18.9 25.9 22.4 18.1 94.7Group 4 387.3 2.5 6.8 13.0 22.0 25.2 18.2 12.3 90.7Not in paid work 370.1 5.5 10.9 16.0 22.4 21.6 13.9 9.6 83.6Not stated (12%) 385.3 3.3 10.1 13.1 19.7 21.5 16.9 15.4 86.5
KeyGroup 1: Senior management and qualified professionalsGroup 2: Other business managers and associate professionalsGroup 3: Tradespeople, clerks, skilled office, sales and service staffGroup 4: Machine operators, hospitality staff, assistants, labourersNot in paid work: Not in paid work in the previous 12 monthsNot stated: No data was provided for parental occupation at the time of student enrolment. The higher the percentage of missing data, the less informative are the results for the other categories.
Refer to the introduction for explanatory notes.
13
NAPLAN Year 3 Persuasive Writing
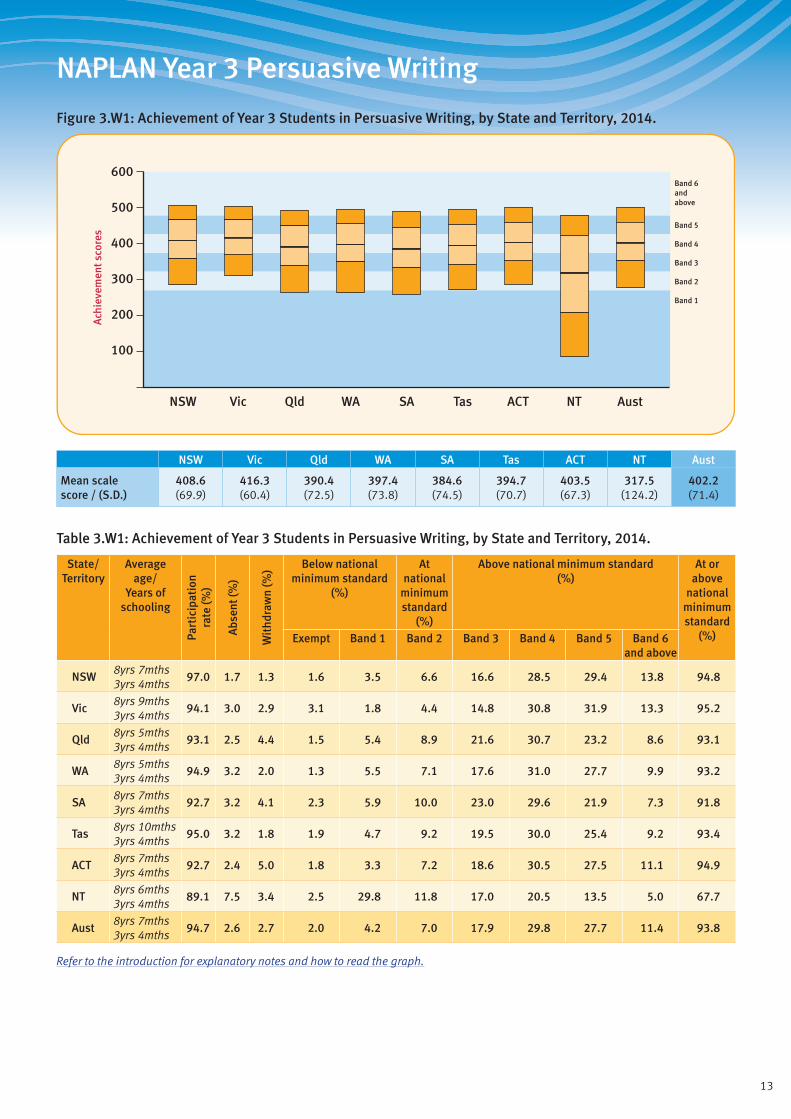
Figure 3.W1: Achievement of Year 3 Students in Persuasive Writing, by State and Territory, 2014.
Band 1
Band 2
Band 3
Band 4
Band 5
Band 6andabove
600
500
400
300
200
100
Ach
ieve
men
t sco
res
ACTQld SAWA TasVicNSW NT Aust
NSW Vic Qld WA SA Tas ACT NT Aust
Mean scale score / (S.D.)
408.6 (69.9)
416.3 (60.4)
390.4 (72.5)
397.4 (73.8)
384.6 (74.5)
394.7 (70.7)
403.5 (67.3)
317.5 (124.2)
402.2 (71.4)
Table 3.W1: Achievement of Year 3 Students in Persuasive Writing, by State and Territory, 2014.
State/ Territory
Average age/
Years of schooling
Part
icip
atio
nra
te (%
)
Abs
ent (
%)
Wit
hdra
wn
(%) Below national
minimum standard (%)
At national
minimum standard
(%)
Above national minimum standard (%)
At or above
national minimum standard
(%)Exempt Band 1 Band 2 Band 3 Band 4 Band 5 Band 6 and above
NSW8yrs 7mths 3yrs 4mths
97.0 1.7 1.3 1.6 3.5 6.6 16.6 28.5 29.4 13.8 94.8
Vic8yrs 9mths 3yrs 4mths
94.1 3.0 2.9 3.1 1.8 4.4 14.8 30.8 31.9 13.3 95.2
Qld8yrs 5mths 3yrs 4mths
93.1 2.5 4.4 1.5 5.4 8.9 21.6 30.7 23.2 8.6 93.1
WA8yrs 5mths 3yrs 4mths
94.9 3.2 2.0 1.3 5.5 7.1 17.6 31.0 27.7 9.9 93.2
SA8yrs 7mths 3yrs 4mths
92.7 3.2 4.1 2.3 5.9 10.0 23.0 29.6 21.9 7.3 91.8
Tas8yrs 10mths 3yrs 4mths
95.0 3.2 1.8 1.9 4.7 9.2 19.5 30.0 25.4 9.2 93.4
ACT8yrs 7mths 3yrs 4mths
92.7 2.4 5.0 1.8 3.3 7.2 18.6 30.5 27.5 11.1 94.9
NT8yrs 6mths 3yrs 4mths
89.1 7.5 3.4 2.5 29.8 11.8 17.0 20.5 13.5 5.0 67.7
Aust8yrs 7mths 3yrs 4mths
94.7 2.6 2.7 2.0 4.2 7.0 17.9 29.8 27.7 11.4 93.8
Refer to the introduction for explanatory notes and how to read the graph.
14
NAPLAN Year 3 Persuasive Writing
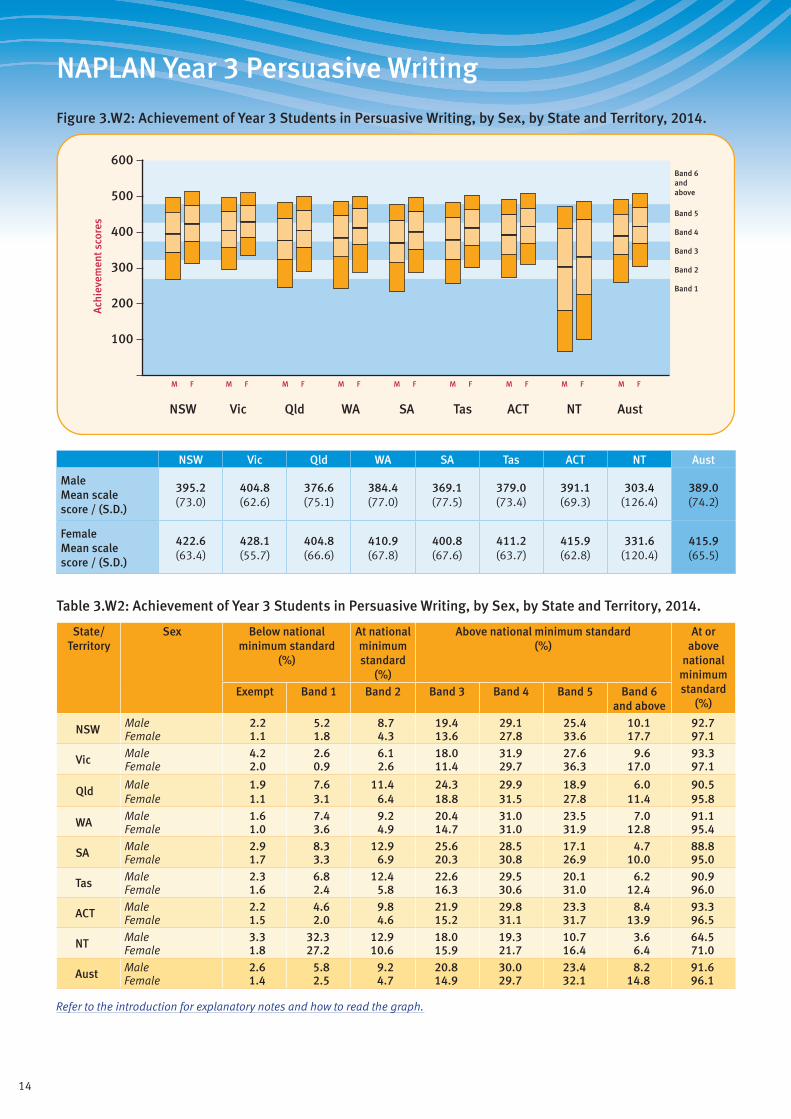
Figure 3.W2: Achievement of Year 3 Students in Persuasive Writing, by Sex, by State and Territory, 2014.
Band 1
Band 2
Band 3
Band 4
Band 5
Band 6andabove
600
500
400
300
200
100
Ach
ieve
men
t sco
res
ACTQld SAWA TasVicNSW NT Aust
M F M F M F M F M F M F M F M F M F
NSW Vic Qld WA SA Tas ACT NT Aust
Male Mean scale score / (S.D.)
395.2 (73.0)
404.8 (62.6)
376.6 (75.1)
384.4 (77.0)
369.1 (77.5)
379.0 (73.4)
391.1 (69.3)
303.4 (126.4)
389.0 (74.2)
Female Mean scale score / (S.D.)
422.6 (63.4)
428.1 (55.7)
404.8 (66.6)
410.9 (67.8)
400.8 (67.6)
411.2 (63.7)
415.9 (62.8)
331.6 (120.4)
415.9 (65.5)
Table 3.W2: Achievement of Year 3 Students in Persuasive Writing, by Sex, by State and Territory, 2014.
State/ Territory
Sex Below national minimum standard
(%)
At national minimum standard
(%)
Above national minimum standard (%)
At or above
national minimum standard
(%)Exempt Band 1 Band 2 Band 3 Band 4 Band 5 Band 6
and above
NSW Male 2.2 5.2 8.7 19.4 29.1 25.4 10.1 92.7Female 1.1 1.8 4.3 13.6 27.8 33.6 17.7 97.1
Vic Male 4.2 2.6 6.1 18.0 31.9 27.6 9.6 93.3Female 2.0 0.9 2.6 11.4 29.7 36.3 17.0 97.1
Qld Male 1.9 7.6 11.4 24.3 29.9 18.9 6.0 90.5Female 1.1 3.1 6.4 18.8 31.5 27.8 11.4 95.8
WA Male 1.6 7.4 9.2 20.4 31.0 23.5 7.0 91.1Female 1.0 3.6 4.9 14.7 31.0 31.9 12.8 95.4
SA Male 2.9 8.3 12.9 25.6 28.5 17.1 4.7 88.8Female 1.7 3.3 6.9 20.3 30.8 26.9 10.0 95.0
Tas Male 2.3 6.8 12.4 22.6 29.5 20.1 6.2 90.9Female 1.6 2.4 5.8 16.3 30.6 31.0 12.4 96.0
ACT Male 2.2 4.6 9.8 21.9 29.8 23.3 8.4 93.3Female 1.5 2.0 4.6 15.2 31.1 31.7 13.9 96.5
NT Male 3.3 32.3 12.9 18.0 19.3 10.7 3.6 64.5Female 1.8 27.2 10.6 15.9 21.7 16.4 6.4 71.0
Aust Male 2.6 5.8 9.2 20.8 30.0 23.4 8.2 91.6Female 1.4 2.5 4.7 14.9 29.7 32.1 14.8 96.1
Refer to the introduction for explanatory notes and how to read the graph.
15
NAPLAN Year 3 Persuasive Writing
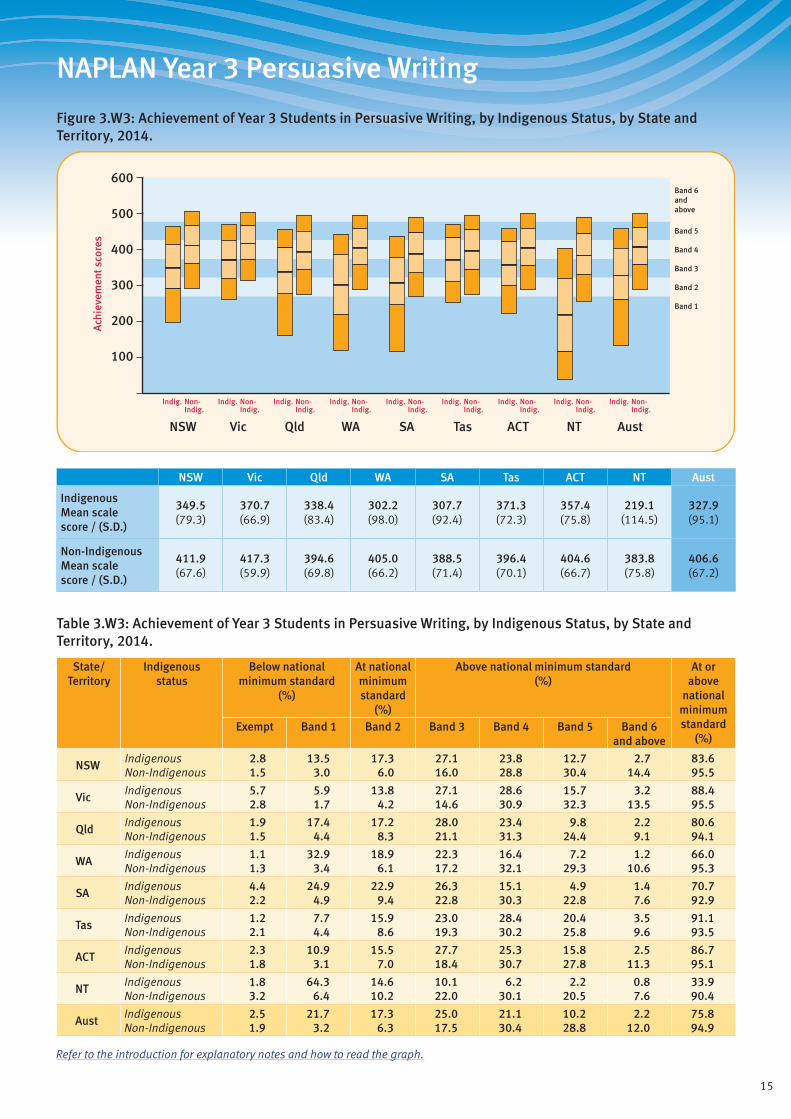
Figure 3.W3: Achievement of Year 3 Students in Persuasive Writing, by Indigenous Status, by State and Territory, 2014.
Band 1
Band 2
Band 3
Band 4
Band 5
Band 6andabove
600
500
400
300
200
100
Ach
ieve
men
t sco
res
ACTQld SAWA TasVicNSW NT Aust
Indig. Non-Indig.
Indig. Non-Indig.
Indig. Non-Indig.
Indig. Non-Indig.
Indig. Non-Indig.
Indig. Non-Indig.
Indig. Non-Indig.
Indig. Non-Indig.
Indig. Non-Indig.
NSW Vic Qld WA SA Tas ACT NT Aust
Indigenous Mean scale score / (S.D.)
349.5 (79.3)
370.7 (66.9)
338.4 (83.4)
302.2 (98.0)
307.7 (92.4)
371.3 (72.3)
357.4 (75.8)
219.1 (114.5)
327.9 (95.1)
Non-Indigenous Mean scale score / (S.D.)
411.9 (67.6)
417.3 (59.9)
394.6 (69.8)
405.0 (66.2)
388.5 (71.4)
396.4 (70.1)
404.6 (66.7)
383.8 (75.8)
406.6 (67.2)
Table 3.W3: Achievement of Year 3 Students in Persuasive Writing, by Indigenous Status, by State and Territory, 2014.
State/ Territory
Indigenous status
Below national minimum standard
(%)
At national minimum standard
(%)
Above national minimum standard (%)
At or above
national minimum standard
(%)Exempt Band 1 Band 2 Band 3 Band 4 Band 5 Band 6
and above
NSWIndigenous 2.8 13.5 17.3 27.1 23.8 12.7 2.7 83.6Non-Indigenous 1.5 3.0 6.0 16.0 28.8 30.4 14.4 95.5
VicIndigenous 5.7 5.9 13.8 27.1 28.6 15.7 3.2 88.4Non-Indigenous 2.8 1.7 4.2 14.6 30.9 32.3 13.5 95.5
QldIndigenous 1.9 17.4 17.2 28.0 23.4 9.8 2.2 80.6Non-Indigenous 1.5 4.4 8.3 21.1 31.3 24.4 9.1 94.1
WAIndigenous 1.1 32.9 18.9 22.3 16.4 7.2 1.2 66.0Non-Indigenous 1.3 3.4 6.1 17.2 32.1 29.3 10.6 95.3
SAIndigenous 4.4 24.9 22.9 26.3 15.1 4.9 1.4 70.7Non-Indigenous 2.2 4.9 9.4 22.8 30.3 22.8 7.6 92.9
TasIndigenous 1.2 7.7 15.9 23.0 28.4 20.4 3.5 91.1Non-Indigenous 2.1 4.4 8.6 19.3 30.2 25.8 9.6 93.5
ACTIndigenous 2.3 10.9 15.5 27.7 25.3 15.8 2.5 86.7Non-Indigenous 1.8 3.1 7.0 18.4 30.7 27.8 11.3 95.1
NTIndigenous 1.8 64.3 14.6 10.1 6.2 2.2 0.8 33.9Non-Indigenous 3.2 6.4 10.2 22.0 30.1 20.5 7.6 90.4
AustIndigenous 2.5 21.7 17.3 25.0 21.1 10.2 2.2 75.8Non-Indigenous 1.9 3.2 6.3 17.5 30.4 28.8 12.0 94.9
Refer to the introduction for explanatory notes and how to read the graph.
16
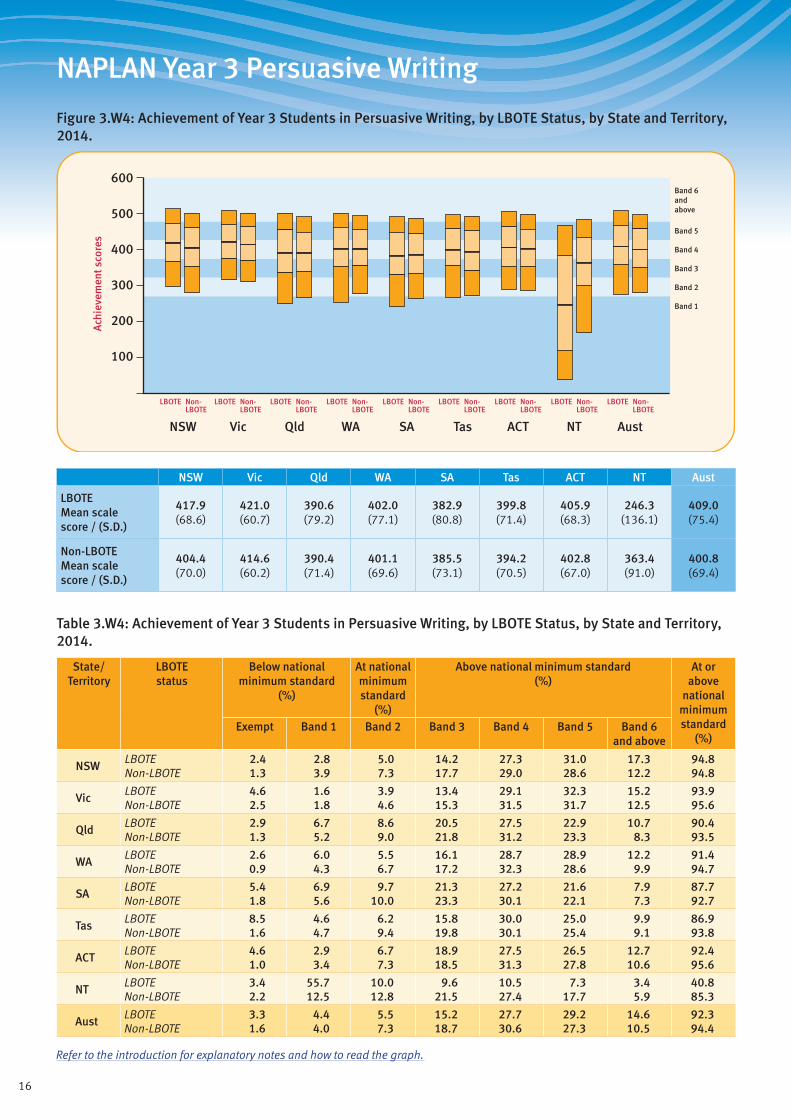
NAPLAN Year 3 Persuasive Writing
Figure 3.W4: Achievement of Year 3 Students in Persuasive Writing, by LBOTE Status, by State and Territory, 2014.
Band 1
Band 2
Band 3
Band 4
Band 5
Band 6andabove
600
500
400
300
200
100
Ach
ieve
men
t sco
res
ACTQld SAWA TasVicNSW NT Aust
LBOTE Non-LBOTE
LBOTE Non-LBOTE
LBOTE Non-LBOTE
LBOTE Non-LBOTE
LBOTE Non-LBOTE
LBOTE Non-LBOTE
LBOTE Non-LBOTE
LBOTE Non-LBOTE
LBOTE Non-LBOTE
NSW Vic Qld WA SA Tas ACT NT Aust
LBOTE Mean scale score / (S.D.)
417.9 (68.6)
421.0 (60.7)
390.6 (79.2)
402.0 (77.1)
382.9 (80.8)
399.8 (71.4)
405.9 (68.3)
246.3 (136.1)
409.0 (75.4)
Non-LBOTE Mean scale score / (S.D.)
404.4 (70.0)
414.6 (60.2)
390.4 (71.4)
401.1 (69.6)
385.5 (73.1)
394.2 (70.5)
402.8 (67.0)
363.4 (91.0)
400.8 (69.4)
Table 3.W4: Achievement of Year 3 Students in Persuasive Writing, by LBOTE Status, by State and Territory, 2014.
State/ Territory
LBOTE status
Below national minimum standard
(%)
At national minimum standard
(%)
Above national minimum standard (%)
At or above
national minimum standard
(%)Exempt Band 1 Band 2 Band 3 Band 4 Band 5 Band 6
and above
NSWLBOTE 2.4 2.8 5.0 14.2 27.3 31.0 17.3 94.8Non-LBOTE 1.3 3.9 7.3 17.7 29.0 28.6 12.2 94.8
VicLBOTE 4.6 1.6 3.9 13.4 29.1 32.3 15.2 93.9Non-LBOTE 2.5 1.8 4.6 15.3 31.5 31.7 12.5 95.6
QldLBOTE 2.9 6.7 8.6 20.5 27.5 22.9 10.7 90.4Non-LBOTE 1.3 5.2 9.0 21.8 31.2 23.3 8.3 93.5
WALBOTE 2.6 6.0 5.5 16.1 28.7 28.9 12.2 91.4Non-LBOTE 0.9 4.3 6.7 17.2 32.3 28.6 9.9 94.7
SALBOTE 5.4 6.9 9.7 21.3 27.2 21.6 7.9 87.7Non-LBOTE 1.8 5.6 10.0 23.3 30.1 22.1 7.3 92.7
TasLBOTE 8.5 4.6 6.2 15.8 30.0 25.0 9.9 86.9Non-LBOTE 1.6 4.7 9.4 19.8 30.1 25.4 9.1 93.8
ACTLBOTE 4.6 2.9 6.7 18.9 27.5 26.5 12.7 92.4Non-LBOTE 1.0 3.4 7.3 18.5 31.3 27.8 10.6 95.6
NTLBOTE 3.4 55.7 10.0 9.6 10.5 7.3 3.4 40.8Non-LBOTE 2.2 12.5 12.8 21.5 27.4 17.7 5.9 85.3
AustLBOTE 3.3 4.4 5.5 15.2 27.7 29.2 14.6 92.3Non-LBOTE 1.6 4.0 7.3 18.7 30.6 27.3 10.5 94.4
Refer to the introduction for explanatory notes and how to read the graph.
17
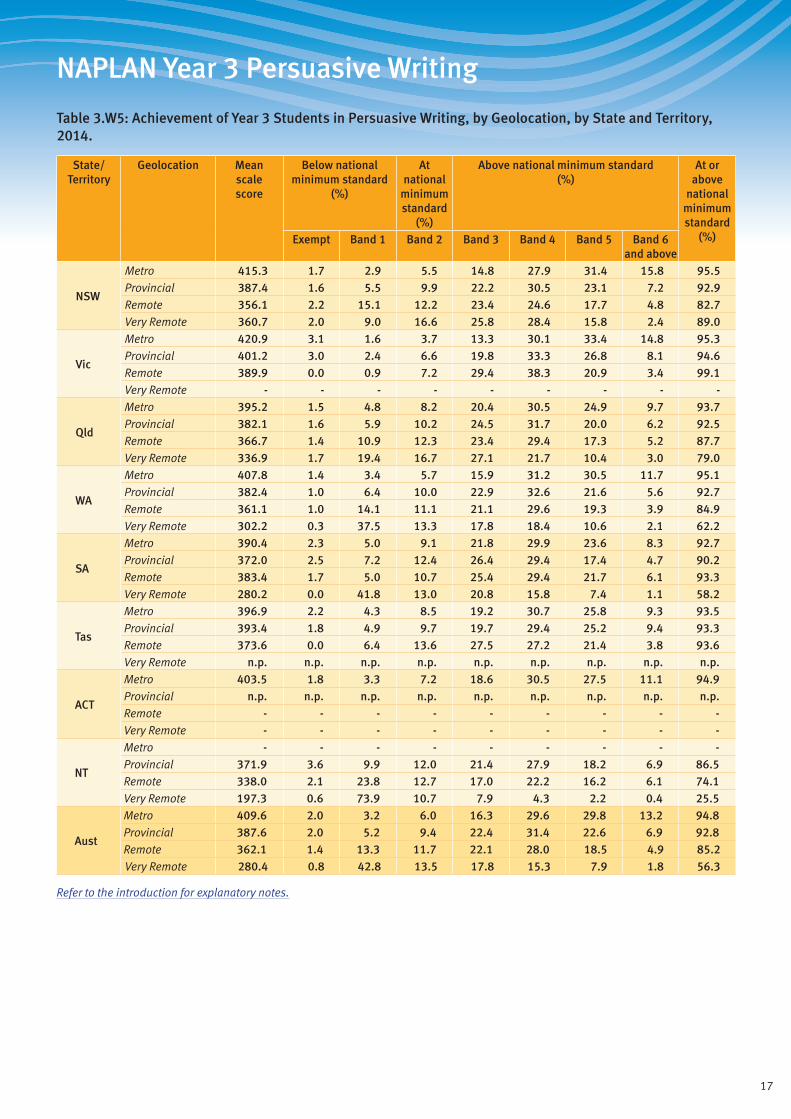
NAPLAN Year 3 Persuasive Writing
Table 3.W5: Achievement of Year 3 Students in Persuasive Writing, by Geolocation, by State and Territory, 2014.
State/ Territory
Geolocation Mean scale score
Below national minimum standard
(%)
At national
minimum standard
(%)
Above national minimum standard (%)
At or above
national minimum standard
(%)Exempt Band 1 Band 2 Band 3 Band 4 Band 5 Band 6 and above
NSW
Metro 415.3 1.7 2.9 5.5 14.8 27.9 31.4 15.8 95.5Provincial 387.4 1.6 5.5 9.9 22.2 30.5 23.1 7.2 92.9Remote 356.1 2.2 15.1 12.2 23.4 24.6 17.7 4.8 82.7Very Remote 360.7 2.0 9.0 16.6 25.8 28.4 15.8 2.4 89.0
Vic
Metro 420.9 3.1 1.6 3.7 13.3 30.1 33.4 14.8 95.3Provincial 401.2 3.0 2.4 6.6 19.8 33.3 26.8 8.1 94.6Remote 389.9 0.0 0.9 7.2 29.4 38.3 20.9 3.4 99.1Very Remote - - - - - - - - -
Qld
Metro 395.2 1.5 4.8 8.2 20.4 30.5 24.9 9.7 93.7Provincial 382.1 1.6 5.9 10.2 24.5 31.7 20.0 6.2 92.5Remote 366.7 1.4 10.9 12.3 23.4 29.4 17.3 5.2 87.7Very Remote 336.9 1.7 19.4 16.7 27.1 21.7 10.4 3.0 79.0
WA
Metro 407.8 1.4 3.4 5.7 15.9 31.2 30.5 11.7 95.1Provincial 382.4 1.0 6.4 10.0 22.9 32.6 21.6 5.6 92.7Remote 361.1 1.0 14.1 11.1 21.1 29.6 19.3 3.9 84.9Very Remote 302.2 0.3 37.5 13.3 17.8 18.4 10.6 2.1 62.2
SA
Metro 390.4 2.3 5.0 9.1 21.8 29.9 23.6 8.3 92.7Provincial 372.0 2.5 7.2 12.4 26.4 29.4 17.4 4.7 90.2Remote 383.4 1.7 5.0 10.7 25.4 29.4 21.7 6.1 93.3Very Remote 280.2 0.0 41.8 13.0 20.8 15.8 7.4 1.1 58.2
Tas
Metro 396.9 2.2 4.3 8.5 19.2 30.7 25.8 9.3 93.5Provincial 393.4 1.8 4.9 9.7 19.7 29.4 25.2 9.4 93.3Remote 373.6 0.0 6.4 13.6 27.5 27.2 21.4 3.8 93.6Very Remote n.p. n.p. n.p. n.p. n.p. n.p. n.p. n.p. n.p.
ACT
Metro 403.5 1.8 3.3 7.2 18.6 30.5 27.5 11.1 94.9Provincial n.p. n.p. n.p. n.p. n.p. n.p. n.p. n.p. n.p.Remote - - - - - - - - -Very Remote - - - - - - - - -
NT
Metro - - - - - - - - -Provincial 371.9 3.6 9.9 12.0 21.4 27.9 18.2 6.9 86.5Remote 338.0 2.1 23.8 12.7 17.0 22.2 16.2 6.1 74.1Very Remote 197.3 0.6 73.9 10.7 7.9 4.3 2.2 0.4 25.5
Aust
Metro 409.6 2.0 3.2 6.0 16.3 29.6 29.8 13.2 94.8Provincial 387.6 2.0 5.2 9.4 22.4 31.4 22.6 6.9 92.8Remote 362.1 1.4 13.3 11.7 22.1 28.0 18.5 4.9 85.2Very Remote 280.4 0.8 42.8 13.5 17.8 15.3 7.9 1.8 56.3
Refer to the introduction for explanatory notes.
18
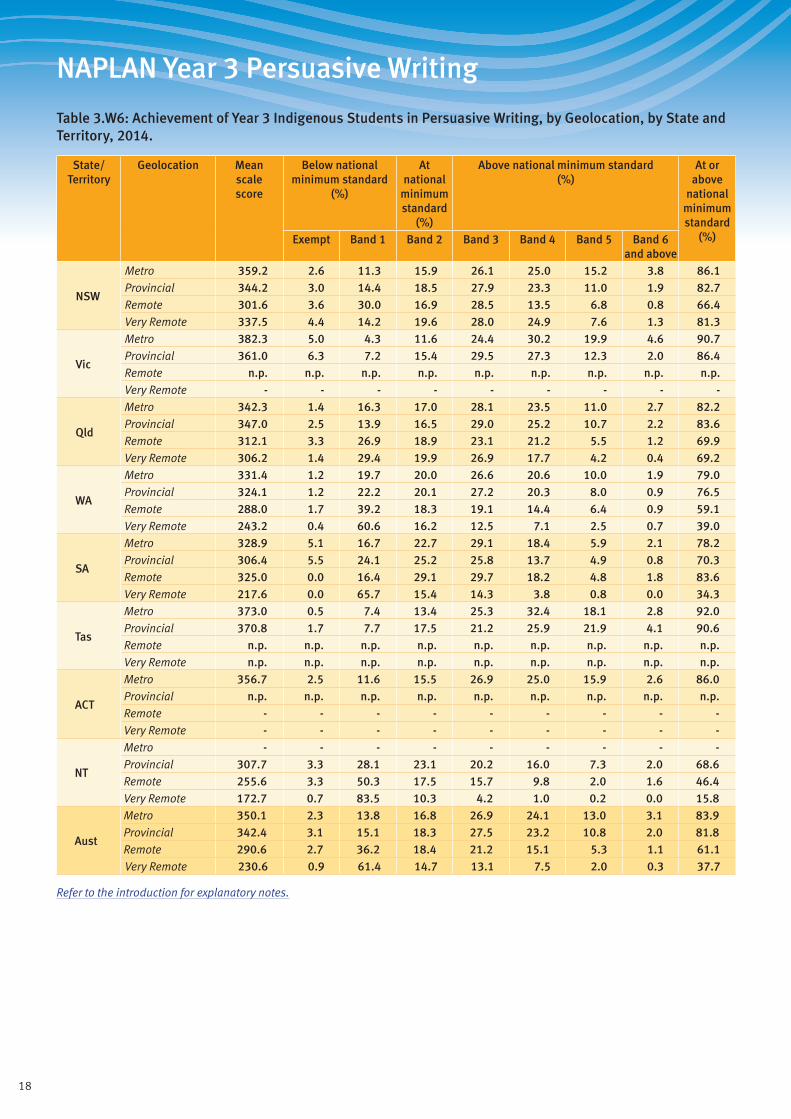
NAPLAN Year 3 Persuasive Writing
Table 3.W6: Achievement of Year 3 Indigenous Students in Persuasive Writing, by Geolocation, by State and Territory, 2014.
State/ Territory
Geolocation Mean scale score
Below national minimum standard
(%)
At national
minimum standard
(%)
Above national minimum standard (%)
At or above
national minimum standard
(%)Exempt Band 1 Band 2 Band 3 Band 4 Band 5 Band 6 and above
NSW
Metro 359.2 2.6 11.3 15.9 26.1 25.0 15.2 3.8 86.1Provincial 344.2 3.0 14.4 18.5 27.9 23.3 11.0 1.9 82.7Remote 301.6 3.6 30.0 16.9 28.5 13.5 6.8 0.8 66.4Very Remote 337.5 4.4 14.2 19.6 28.0 24.9 7.6 1.3 81.3
Vic
Metro 382.3 5.0 4.3 11.6 24.4 30.2 19.9 4.6 90.7Provincial 361.0 6.3 7.2 15.4 29.5 27.3 12.3 2.0 86.4Remote n.p. n.p. n.p. n.p. n.p. n.p. n.p. n.p. n.p.Very Remote - - - - - - - - -
Qld
Metro 342.3 1.4 16.3 17.0 28.1 23.5 11.0 2.7 82.2Provincial 347.0 2.5 13.9 16.5 29.0 25.2 10.7 2.2 83.6Remote 312.1 3.3 26.9 18.9 23.1 21.2 5.5 1.2 69.9Very Remote 306.2 1.4 29.4 19.9 26.9 17.7 4.2 0.4 69.2
WA
Metro 331.4 1.2 19.7 20.0 26.6 20.6 10.0 1.9 79.0Provincial 324.1 1.2 22.2 20.1 27.2 20.3 8.0 0.9 76.5Remote 288.0 1.7 39.2 18.3 19.1 14.4 6.4 0.9 59.1Very Remote 243.2 0.4 60.6 16.2 12.5 7.1 2.5 0.7 39.0
SA
Metro 328.9 5.1 16.7 22.7 29.1 18.4 5.9 2.1 78.2Provincial 306.4 5.5 24.1 25.2 25.8 13.7 4.9 0.8 70.3Remote 325.0 0.0 16.4 29.1 29.7 18.2 4.8 1.8 83.6Very Remote 217.6 0.0 65.7 15.4 14.3 3.8 0.8 0.0 34.3
Tas
Metro 373.0 0.5 7.4 13.4 25.3 32.4 18.1 2.8 92.0Provincial 370.8 1.7 7.7 17.5 21.2 25.9 21.9 4.1 90.6Remote n.p. n.p. n.p. n.p. n.p. n.p. n.p. n.p. n.p.Very Remote n.p. n.p. n.p. n.p. n.p. n.p. n.p. n.p. n.p.
ACT
Metro 356.7 2.5 11.6 15.5 26.9 25.0 15.9 2.6 86.0Provincial n.p. n.p. n.p. n.p. n.p. n.p. n.p. n.p. n.p.Remote - - - - - - - - -Very Remote - - - - - - - - -
NT
Metro - - - - - - - - -Provincial 307.7 3.3 28.1 23.1 20.2 16.0 7.3 2.0 68.6Remote 255.6 3.3 50.3 17.5 15.7 9.8 2.0 1.6 46.4Very Remote 172.7 0.7 83.5 10.3 4.2 1.0 0.2 0.0 15.8
Aust
Metro 350.1 2.3 13.8 16.8 26.9 24.1 13.0 3.1 83.9Provincial 342.4 3.1 15.1 18.3 27.5 23.2 10.8 2.0 81.8Remote 290.6 2.7 36.2 18.4 21.2 15.1 5.3 1.1 61.1Very Remote 230.6 0.9 61.4 14.7 13.1 7.5 2.0 0.3 37.7
Refer to the introduction for explanatory notes.
19
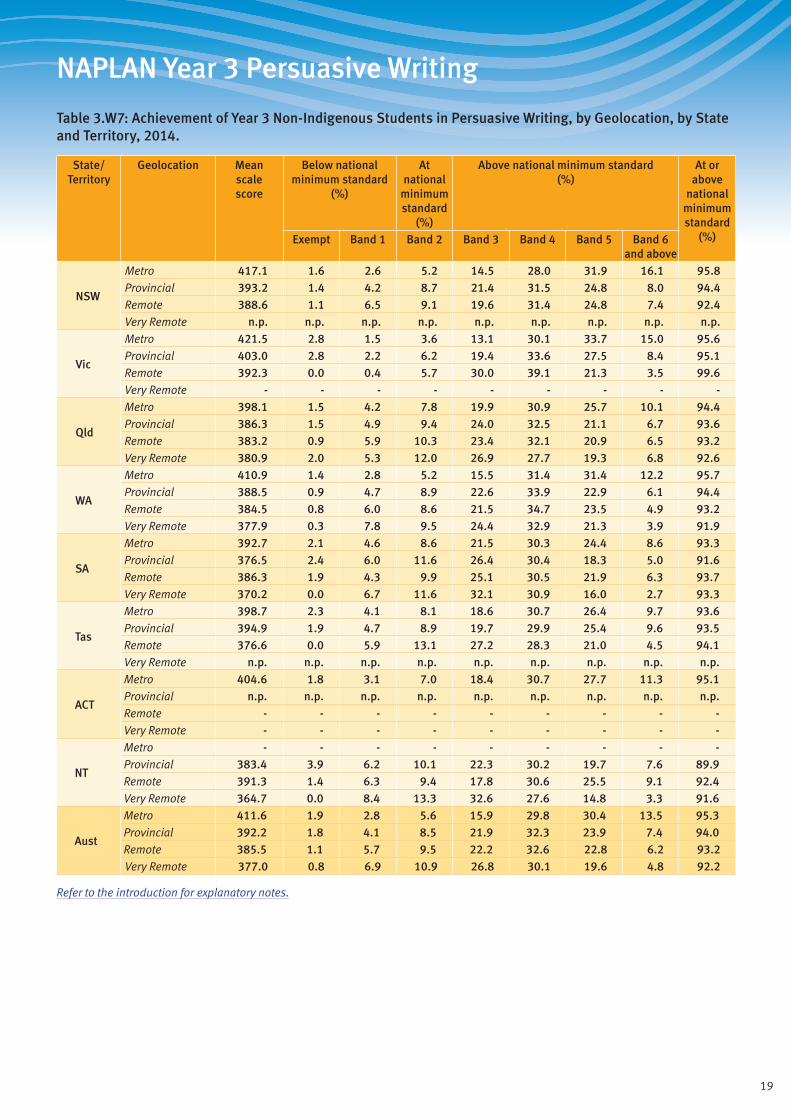
NAPLAN Year 3 Persuasive Writing
Table 3.W7: Achievement of Year 3 Non-Indigenous Students in Persuasive Writing, by Geolocation, by State and Territory, 2014.
State/ Territory
Geolocation Mean scale score
Below national minimum standard
(%)
At national
minimum standard
(%)
Above national minimum standard (%)
At or above
national minimum standard
(%)Exempt Band 1 Band 2 Band 3 Band 4 Band 5 Band 6 and above
NSW
Metro 417.1 1.6 2.6 5.2 14.5 28.0 31.9 16.1 95.8Provincial 393.2 1.4 4.2 8.7 21.4 31.5 24.8 8.0 94.4Remote 388.6 1.1 6.5 9.1 19.6 31.4 24.8 7.4 92.4Very Remote n.p. n.p. n.p. n.p. n.p. n.p. n.p. n.p. n.p.
Vic
Metro 421.5 2.8 1.5 3.6 13.1 30.1 33.7 15.0 95.6Provincial 403.0 2.8 2.2 6.2 19.4 33.6 27.5 8.4 95.1Remote 392.3 0.0 0.4 5.7 30.0 39.1 21.3 3.5 99.6Very Remote - - - - - - - - -
Qld
Metro 398.1 1.5 4.2 7.8 19.9 30.9 25.7 10.1 94.4Provincial 386.3 1.5 4.9 9.4 24.0 32.5 21.1 6.7 93.6Remote 383.2 0.9 5.9 10.3 23.4 32.1 20.9 6.5 93.2Very Remote 380.9 2.0 5.3 12.0 26.9 27.7 19.3 6.8 92.6
WA
Metro 410.9 1.4 2.8 5.2 15.5 31.4 31.4 12.2 95.7Provincial 388.5 0.9 4.7 8.9 22.6 33.9 22.9 6.1 94.4Remote 384.5 0.8 6.0 8.6 21.5 34.7 23.5 4.9 93.2Very Remote 377.9 0.3 7.8 9.5 24.4 32.9 21.3 3.9 91.9
SA
Metro 392.7 2.1 4.6 8.6 21.5 30.3 24.4 8.6 93.3Provincial 376.5 2.4 6.0 11.6 26.4 30.4 18.3 5.0 91.6Remote 386.3 1.9 4.3 9.9 25.1 30.5 21.9 6.3 93.7Very Remote 370.2 0.0 6.7 11.6 32.1 30.9 16.0 2.7 93.3
Tas
Metro 398.7 2.3 4.1 8.1 18.6 30.7 26.4 9.7 93.6Provincial 394.9 1.9 4.7 8.9 19.7 29.9 25.4 9.6 93.5Remote 376.6 0.0 5.9 13.1 27.2 28.3 21.0 4.5 94.1Very Remote n.p. n.p. n.p. n.p. n.p. n.p. n.p. n.p. n.p.
ACT
Metro 404.6 1.8 3.1 7.0 18.4 30.7 27.7 11.3 95.1Provincial n.p. n.p. n.p. n.p. n.p. n.p. n.p. n.p. n.p.Remote - - - - - - - - -Very Remote - - - - - - - - -
NT
Metro - - - - - - - - -Provincial 383.4 3.9 6.2 10.1 22.3 30.2 19.7 7.6 89.9Remote 391.3 1.4 6.3 9.4 17.8 30.6 25.5 9.1 92.4Very Remote 364.7 0.0 8.4 13.3 32.6 27.6 14.8 3.3 91.6
Aust
Metro 411.6 1.9 2.8 5.6 15.9 29.8 30.4 13.5 95.3Provincial 392.2 1.8 4.1 8.5 21.9 32.3 23.9 7.4 94.0Remote 385.5 1.1 5.7 9.5 22.2 32.6 22.8 6.2 93.2Very Remote 377.0 0.8 6.9 10.9 26.8 30.1 19.6 4.8 92.2
Refer to the introduction for explanatory notes.
20
NAPLAN Year 3 Persuasive Writing
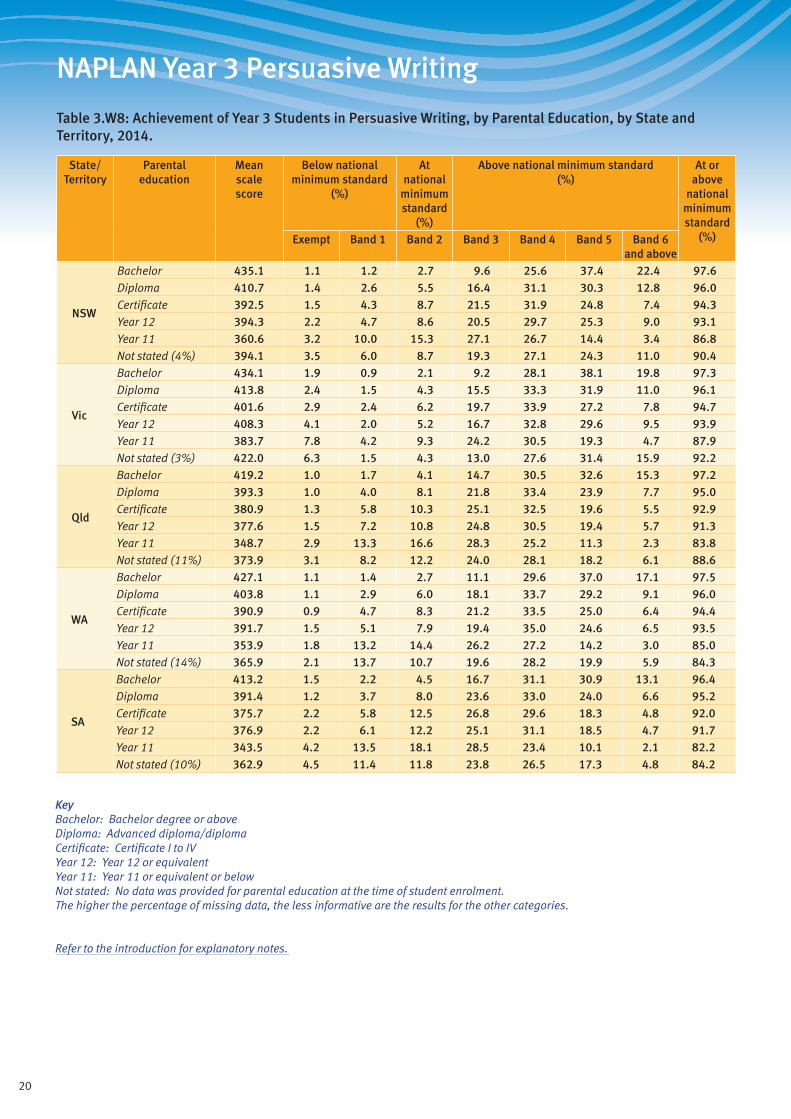
Table 3.W8: Achievement of Year 3 Students in Persuasive Writing, by Parental Education, by State and Territory, 2014.
State/ Territory
Parental education
Mean scale score
Below national minimum standard
(%)
At national
minimum standard
(%)
Above national minimum standard (%)
At or above
national minimum standard
(%)Exempt Band 1 Band 2 Band 3 Band 4 Band 5 Band 6 and above
NSW
Bachelor 435.1 1.1 1.2 2.7 9.6 25.6 37.4 22.4 97.6Diploma 410.7 1.4 2.6 5.5 16.4 31.1 30.3 12.8 96.0Certificate 392.5 1.5 4.3 8.7 21.5 31.9 24.8 7.4 94.3Year 12 394.3 2.2 4.7 8.6 20.5 29.7 25.3 9.0 93.1Year 11 360.6 3.2 10.0 15.3 27.1 26.7 14.4 3.4 86.8Not stated (4%) 394.1 3.5 6.0 8.7 19.3 27.1 24.3 11.0 90.4
Vic
Bachelor 434.1 1.9 0.9 2.1 9.2 28.1 38.1 19.8 97.3Diploma 413.8 2.4 1.5 4.3 15.5 33.3 31.9 11.0 96.1Certificate 401.6 2.9 2.4 6.2 19.7 33.9 27.2 7.8 94.7Year 12 408.3 4.1 2.0 5.2 16.7 32.8 29.6 9.5 93.9Year 11 383.7 7.8 4.2 9.3 24.2 30.5 19.3 4.7 87.9Not stated (3%) 422.0 6.3 1.5 4.3 13.0 27.6 31.4 15.9 92.2
Qld
Bachelor 419.2 1.0 1.7 4.1 14.7 30.5 32.6 15.3 97.2Diploma 393.3 1.0 4.0 8.1 21.8 33.4 23.9 7.7 95.0Certificate 380.9 1.3 5.8 10.3 25.1 32.5 19.6 5.5 92.9Year 12 377.6 1.5 7.2 10.8 24.8 30.5 19.4 5.7 91.3Year 11 348.7 2.9 13.3 16.6 28.3 25.2 11.3 2.3 83.8Not stated (11%) 373.9 3.1 8.2 12.2 24.0 28.1 18.2 6.1 88.6
WA
Bachelor 427.1 1.1 1.4 2.7 11.1 29.6 37.0 17.1 97.5Diploma 403.8 1.1 2.9 6.0 18.1 33.7 29.2 9.1 96.0Certificate 390.9 0.9 4.7 8.3 21.2 33.5 25.0 6.4 94.4Year 12 391.7 1.5 5.1 7.9 19.4 35.0 24.6 6.5 93.5Year 11 353.9 1.8 13.2 14.4 26.2 27.2 14.2 3.0 85.0Not stated (14%) 365.9 2.1 13.7 10.7 19.6 28.2 19.9 5.9 84.3
SA
Bachelor 413.2 1.5 2.2 4.5 16.7 31.1 30.9 13.1 96.4Diploma 391.4 1.2 3.7 8.0 23.6 33.0 24.0 6.6 95.2Certificate 375.7 2.2 5.8 12.5 26.8 29.6 18.3 4.8 92.0Year 12 376.9 2.2 6.1 12.2 25.1 31.1 18.5 4.7 91.7Year 11 343.5 4.2 13.5 18.1 28.5 23.4 10.1 2.1 82.2Not stated (10%) 362.9 4.5 11.4 11.8 23.8 26.5 17.3 4.8 84.2
KeyBachelor: Bachelor degree or aboveDiploma: Advanced diploma/diplomaCertificate: Certificate I to IVYear 12: Year 12 or equivalentYear 11: Year 11 or equivalent or belowNot stated: No data was provided for parental education at the time of student enrolment. The higher the percentage of missing data, the less informative are the results for the other categories.
Refer to the introduction for explanatory notes.
21
NAPLAN Year 3 Persuasive Writing
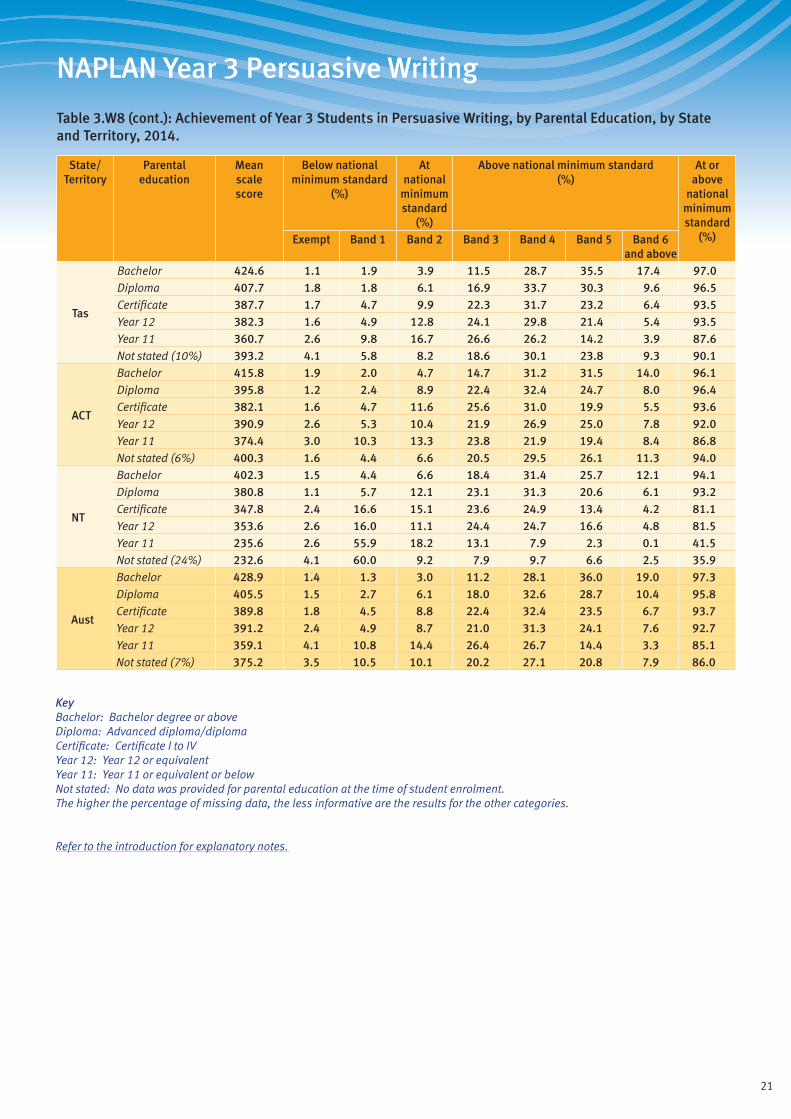
Table 3.W8 (cont.): Achievement of Year 3 Students in Persuasive Writing, by Parental Education, by State and Territory, 2014.
State/ Territory
Parental education
Mean scale score
Below national minimum standard
(%)
At national
minimum standard
(%)
Above national minimum standard (%)
At or above
national minimum standard
(%)Exempt Band 1 Band 2 Band 3 Band 4 Band 5 Band 6 and above
Tas
Bachelor 424.6 1.1 1.9 3.9 11.5 28.7 35.5 17.4 97.0Diploma 407.7 1.8 1.8 6.1 16.9 33.7 30.3 9.6 96.5Certificate 387.7 1.7 4.7 9.9 22.3 31.7 23.2 6.4 93.5Year 12 382.3 1.6 4.9 12.8 24.1 29.8 21.4 5.4 93.5Year 11 360.7 2.6 9.8 16.7 26.6 26.2 14.2 3.9 87.6Not stated (10%) 393.2 4.1 5.8 8.2 18.6 30.1 23.8 9.3 90.1
ACT
Bachelor 415.8 1.9 2.0 4.7 14.7 31.2 31.5 14.0 96.1Diploma 395.8 1.2 2.4 8.9 22.4 32.4 24.7 8.0 96.4Certificate 382.1 1.6 4.7 11.6 25.6 31.0 19.9 5.5 93.6Year 12 390.9 2.6 5.3 10.4 21.9 26.9 25.0 7.8 92.0Year 11 374.4 3.0 10.3 13.3 23.8 21.9 19.4 8.4 86.8Not stated (6%) 400.3 1.6 4.4 6.6 20.5 29.5 26.1 11.3 94.0
NT
Bachelor 402.3 1.5 4.4 6.6 18.4 31.4 25.7 12.1 94.1Diploma 380.8 1.1 5.7 12.1 23.1 31.3 20.6 6.1 93.2Certificate 347.8 2.4 16.6 15.1 23.6 24.9 13.4 4.2 81.1Year 12 353.6 2.6 16.0 11.1 24.4 24.7 16.6 4.8 81.5Year 11 235.6 2.6 55.9 18.2 13.1 7.9 2.3 0.1 41.5Not stated (24%) 232.6 4.1 60.0 9.2 7.9 9.7 6.6 2.5 35.9
Aust
Bachelor 428.9 1.4 1.3 3.0 11.2 28.1 36.0 19.0 97.3Diploma 405.5 1.5 2.7 6.1 18.0 32.6 28.7 10.4 95.8Certificate 389.8 1.8 4.5 8.8 22.4 32.4 23.5 6.7 93.7Year 12 391.2 2.4 4.9 8.7 21.0 31.3 24.1 7.6 92.7Year 11 359.1 4.1 10.8 14.4 26.4 26.7 14.4 3.3 85.1Not stated (7%) 375.2 3.5 10.5 10.1 20.2 27.1 20.8 7.9 86.0
KeyBachelor: Bachelor degree or aboveDiploma: Advanced diploma/diplomaCertificate: Certificate I to IVYear 12: Year 12 or equivalentYear 11: Year 11 or equivalent or belowNot stated: No data was provided for parental education at the time of student enrolment. The higher the percentage of missing data, the less informative are the results for the other categories.
Refer to the introduction for explanatory notes.

22
NAPLAN Year 3 Persuasive Writing
Table 3.W9: Achievement of Year 3 Students in Persuasive Writing, by Parental Occupation, by State and Territory, 2014.
State/ Territory
Parental occupation
Mean scale score
Below national minimum standard
(%)
At national
minimum standard
(%)
Above national minimum standard (%)
At or above
national minimum standard
(%)Exempt Band 1 Band 2 Band 3 Band 4 Band 5 Band 6 and above
NSW
Group 1 435.1 0.9 1.2 2.7 9.6 25.8 37.4 22.4 97.9Group 2 419.7 1.0 2.0 4.4 13.9 29.5 33.2 16.0 97.0Group 3 402.4 1.2 3.1 7.0 19.3 31.4 27.9 10.1 95.7Group 4 387.3 1.7 5.2 10.0 22.8 30.6 22.6 7.1 93.1Not in paid work 365.1 4.2 9.9 14.3 24.7 26.1 16.0 4.8 85.9Not stated (10%) 385.1 3.6 6.8 10.7 21.6 26.7 21.6 8.9 89.6
Vic
Group 1 435.8 1.3 0.8 1.8 8.8 27.8 38.8 20.7 97.9Group 2 423.2 1.7 1.1 3.2 12.7 31.2 35.3 14.8 97.2Group 3 411.1 2.1 1.7 4.7 16.7 33.7 30.8 10.4 96.2Group 4 399.9 4.3 2.6 6.7 19.8 33.0 25.7 7.9 93.1Not in paid work 386.8 9.2 4.1 9.0 22.4 29.4 20.2 5.6 86.7Not stated (3%) 424.8 5.7 1.7 3.8 12.2 27.2 32.2 17.3 92.7
Qld
Group 1 419.0 0.9 1.7 4.3 14.8 30.3 32.7 15.3 97.4Group 2 403.2 0.9 3.0 6.4 19.4 32.4 27.4 10.5 96.1Group 3 386.5 1.2 4.9 9.3 23.7 33.1 21.5 6.3 93.9Group 4 368.9 1.8 8.5 12.5 26.6 30.2 16.3 4.1 89.7Not in paid work 349.7 3.3 13.4 16.6 27.6 24.7 11.4 3.0 83.3Not stated (16%) 370.7 2.9 8.8 12.6 24.9 28.3 16.9 5.6 88.3
WA
Group 1 426.1 0.8 1.4 3.1 11.2 30.0 36.4 17.1 97.8Group 2 410.7 0.9 2.5 4.6 15.9 33.4 31.8 10.9 96.7Group 3 397.6 1.0 3.6 7.2 19.7 34.0 26.8 7.7 95.4Group 4 381.5 1.5 6.3 9.8 24.2 31.8 20.6 5.9 92.2Not in paid work 358.9 2.0 13.8 13.5 22.2 26.5 17.4 4.6 84.2Not stated (23%) 372.2 2.1 11.3 10.3 20.2 28.8 21.3 6.0 86.6
SA
Group 1 414.1 1.2 2.0 4.3 16.6 31.4 31.1 13.4 96.8Group 2 396.5 1.0 3.3 7.5 21.8 32.8 25.1 8.5 95.7Group 3 384.4 1.5 4.6 10.0 25.3 31.9 21.0 5.7 94.0Group 4 368.8 2.8 7.3 13.7 27.1 28.3 16.6 4.2 89.9Not in paid work 348.8 4.7 12.8 16.8 27.7 23.0 11.8 3.1 82.5Not stated (19%) 360.3 4.7 10.9 14.3 25.1 25.3 15.8 4.0 84.5
KeyGroup 1: Senior management and qualified professionalsGroup 2: Other business managers and associate professionalsGroup 3: Tradespeople, clerks, skilled office, sales and service staffGroup 4: Machine operators, hospitality staff, assistants, labourersNot in paid work: Not in paid work in the previous 12 monthsNot stated: No data was provided for parental occupation at the time of student enrolment. The higher the percentage of missing data, the less informative are the results for the other categories.
Refer to the introduction for explanatory notes.

23
NAPLAN Year 3 Persuasive Writing
Table 3.W9 (cont.): Achievement of Year 3 Students in Persuasive Writing, by Parental Occupation, by State and Territory, 2014.
State/ Territory
Parental occupation
Mean scale score
Below national minimum standard
(%)
At national
minimum standard
(%)
Above national minimum standard (%)
At or above
national minimum standard
(%)Exempt Band 1 Band 2 Band 3 Band 4 Band 5 Band 6 and above
Tas
Group 1 423.3 0.7 1.9 4.2 11.5 30.0 34.7 17.0 97.3Group 2 407.7 1.3 2.3 5.5 18.5 31.3 30.5 10.6 96.5Group 3 396.3 1.4 3.3 8.7 19.9 33.1 25.8 7.9 95.4Group 4 377.8 1.7 5.8 12.7 25.7 29.5 19.4 5.2 92.5Not in paid work 357.8 3.0 11.0 17.4 24.2 26.2 14.5 3.7 86.0Not stated (14%) 383.1 4.8 7.2 11.1 20.5 27.7 21.0 7.7 88.0
ACT
Group 1 416.4 1.5 2.4 4.8 14.5 30.4 31.2 15.1 96.1Group 2 404.8 1.1 2.2 6.7 18.8 32.7 28.7 9.8 96.7Group 3 395.6 1.6 3.0 9.0 22.6 31.7 23.7 8.5 95.4Group 4 364.7 2.3 9.7 14.0 27.8 25.8 16.9 3.5 88.0Not in paid work 370.7 5.5 8.0 14.1 22.4 28.4 17.1 4.6 86.6Not stated (13%) 392.5 3.1 4.7 9.1 22.0 27.6 25.0 8.5 92.2
NT
Group 1 392.4 1.0 5.4 9.5 19.5 31.5 23.4 9.6 93.5Group 2 374.3 1.0 10.1 11.4 20.4 29.0 21.6 6.6 88.9Group 3 363.2 2.5 12.2 12.2 23.9 26.4 16.8 6.1 85.4Group 4 298.7 2.4 35.4 15.9 19.0 14.8 8.6 4.0 62.2Not in paid work 234.2 3.4 57.8 14.5 12.2 9.1 2.4 0.6 38.8Not stated (23%) 223.1 4.6 61.6 10.7 8.8 8.5 4.3 1.5 33.8
Aust
Group 1 428.7 1.0 1.4 3.1 11.3 28.2 36.0 19.0 97.6Group 2 414.2 1.2 2.2 4.8 15.6 31.2 31.7 13.4 96.7Group 3 398.6 1.5 3.4 7.3 20.2 32.7 26.3 8.6 95.1Group 4 384.1 2.5 5.7 9.9 23.2 30.9 21.4 6.3 91.8Not in paid work 365.8 5.6 9.8 13.0 24.1 26.6 16.3 4.6 84.6Not stated (12%) 374.1 3.4 9.7 11.2 21.8 27.1 19.8 7.1 86.9
KeyGroup 1: Senior management and qualified professionalsGroup 2: Other business managers and associate professionalsGroup 3: Tradespeople, clerks, skilled office, sales and service staffGroup 4: Machine operators, hospitality staff, assistants, labourersNot in paid work: Not in paid work in the previous 12 monthsNot stated: No data was provided for parental occupation at the time of student enrolment. The higher the percentage of missing data, the less informative are the results for the other categories.
Refer to the introduction for explanatory notes.
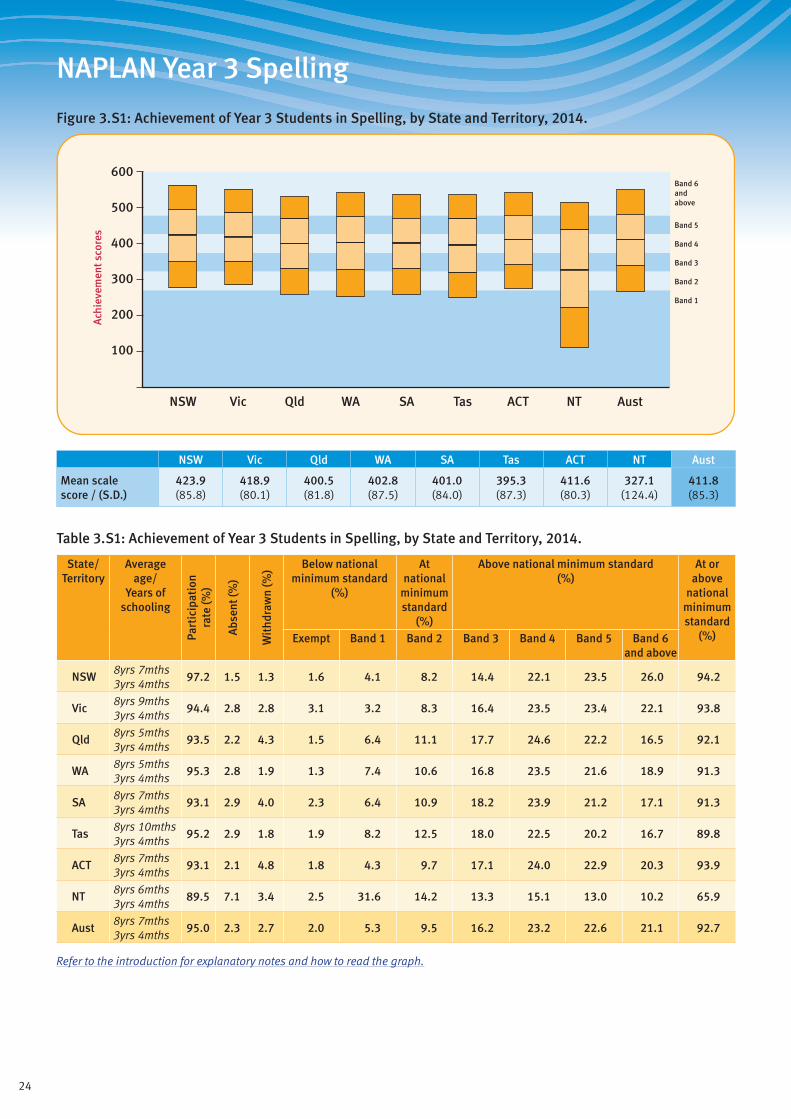
24
NAPLAN Year 3 Spelling
Figure 3.S1: Achievement of Year 3 Students in Spelling, by State and Territory, 2014.
Band 1
Band 2
Band 3
Band 4
Band 5
Band 6andabove
600
500
400
300
200
100
Ach
ieve
men
t sco
res
ACTQld SAWA TasVicNSW NT Aust
NSW Vic Qld WA SA Tas ACT NT Aust
Mean scale score / (S.D.)
423.9 (85.8)
418.9 (80.1)
400.5 (81.8)
402.8 (87.5)
401.0 (84.0)
395.3 (87.3)
411.6 (80.3)
327.1 (124.4)
411.8 (85.3)
Table 3.S1: Achievement of Year 3 Students in Spelling, by State and Territory, 2014.
State/ Territory
Average age/
Years of schooling
Part
icip
atio
nra
te (%
)
Abs
ent (
%)
Wit
hdra
wn
(%) Below national
minimum standard (%)
At national
minimum standard
(%)
Above national minimum standard (%)
At or above
national minimum standard
(%)Exempt Band 1 Band 2 Band 3 Band 4 Band 5 Band 6 and above
NSW8yrs 7mths 3yrs 4mths
97.2 1.5 1.3 1.6 4.1 8.2 14.4 22.1 23.5 26.0 94.2
Vic8yrs 9mths 3yrs 4mths
94.4 2.8 2.8 3.1 3.2 8.3 16.4 23.5 23.4 22.1 93.8
Qld8yrs 5mths 3yrs 4mths
93.5 2.2 4.3 1.5 6.4 11.1 17.7 24.6 22.2 16.5 92.1
WA8yrs 5mths 3yrs 4mths
95.3 2.8 1.9 1.3 7.4 10.6 16.8 23.5 21.6 18.9 91.3
SA8yrs 7mths 3yrs 4mths
93.1 2.9 4.0 2.3 6.4 10.9 18.2 23.9 21.2 17.1 91.3
Tas8yrs 10mths 3yrs 4mths
95.2 2.9 1.8 1.9 8.2 12.5 18.0 22.5 20.2 16.7 89.8
ACT8yrs 7mths 3yrs 4mths
93.1 2.1 4.8 1.8 4.3 9.7 17.1 24.0 22.9 20.3 93.9
NT8yrs 6mths 3yrs 4mths
89.5 7.1 3.4 2.5 31.6 14.2 13.3 15.1 13.0 10.2 65.9
Aust8yrs 7mths 3yrs 4mths
95.0 2.3 2.7 2.0 5.3 9.5 16.2 23.2 22.6 21.1 92.7
Refer to the introduction for explanatory notes and how to read the graph.
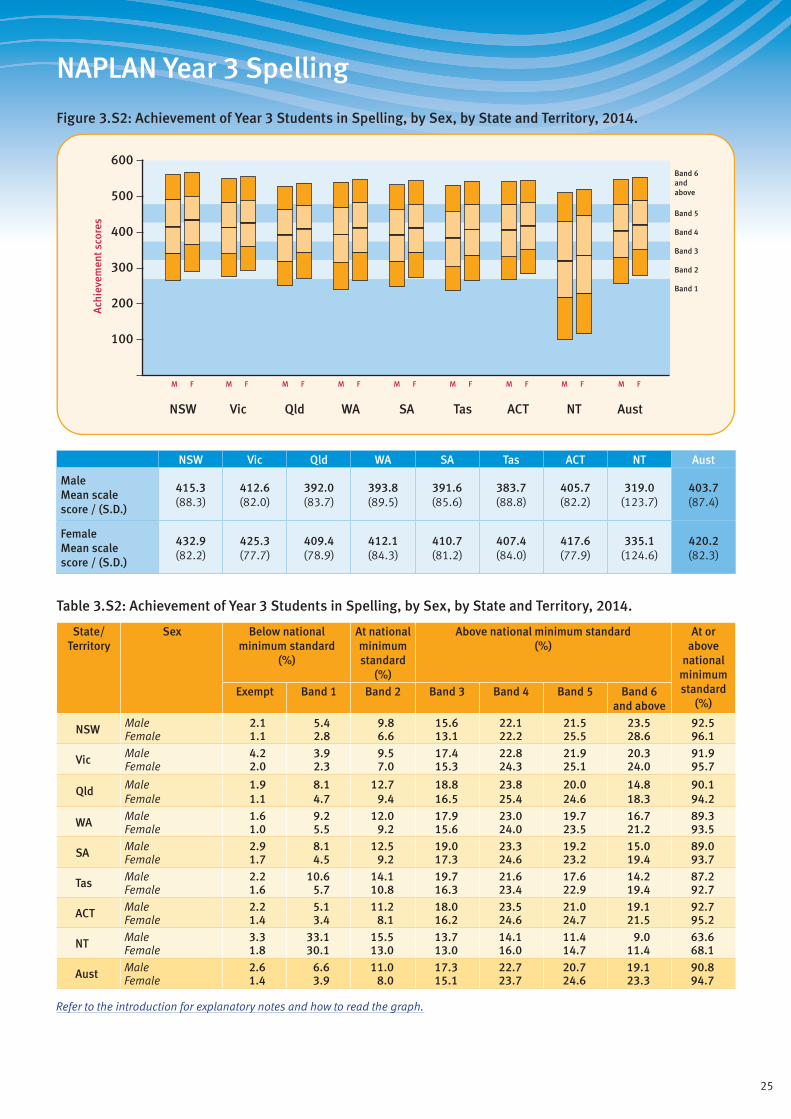
25
NAPLAN Year 3 Spelling
Figure 3.S2: Achievement of Year 3 Students in Spelling, by Sex, by State and Territory, 2014.
Band 1
Band 2
Band 3
Band 4
Band 5
Band 6andabove
600
500
400
300
200
100
Ach
ieve
men
t sco
res
ACTQld SAWA TasVicNSW NT Aust
M F M F M F M F M F M F M F M F M F
NSW Vic Qld WA SA Tas ACT NT Aust
Male Mean scale score / (S.D.)
415.3 (88.3)
412.6 (82.0)
392.0 (83.7)
393.8 (89.5)
391.6 (85.6)
383.7 (88.8)
405.7 (82.2)
319.0 (123.7)
403.7 (87.4)
Female Mean scale score / (S.D.)
432.9 (82.2)
425.3 (77.7)
409.4 (78.9)
412.1 (84.3)
410.7 (81.2)
407.4 (84.0)
417.6 (77.9)
335.1 (124.6)
420.2 (82.3)
Table 3.S2: Achievement of Year 3 Students in Spelling, by Sex, by State and Territory, 2014.
State/ Territory
Sex Below national minimum standard
(%)
At national minimum standard
(%)
Above national minimum standard (%)
At or above
national minimum standard
(%)Exempt Band 1 Band 2 Band 3 Band 4 Band 5 Band 6
and above
NSW Male 2.1 5.4 9.8 15.6 22.1 21.5 23.5 92.5Female 1.1 2.8 6.6 13.1 22.2 25.5 28.6 96.1
Vic Male 4.2 3.9 9.5 17.4 22.8 21.9 20.3 91.9Female 2.0 2.3 7.0 15.3 24.3 25.1 24.0 95.7
Qld Male 1.9 8.1 12.7 18.8 23.8 20.0 14.8 90.1Female 1.1 4.7 9.4 16.5 25.4 24.6 18.3 94.2
WA Male 1.6 9.2 12.0 17.9 23.0 19.7 16.7 89.3Female 1.0 5.5 9.2 15.6 24.0 23.5 21.2 93.5
SA Male 2.9 8.1 12.5 19.0 23.3 19.2 15.0 89.0Female 1.7 4.5 9.2 17.3 24.6 23.2 19.4 93.7
Tas Male 2.2 10.6 14.1 19.7 21.6 17.6 14.2 87.2Female 1.6 5.7 10.8 16.3 23.4 22.9 19.4 92.7
ACT Male 2.2 5.1 11.2 18.0 23.5 21.0 19.1 92.7Female 1.4 3.4 8.1 16.2 24.6 24.7 21.5 95.2
NT Male 3.3 33.1 15.5 13.7 14.1 11.4 9.0 63.6Female 1.8 30.1 13.0 13.0 16.0 14.7 11.4 68.1
Aust Male 2.6 6.6 11.0 17.3 22.7 20.7 19.1 90.8Female 1.4 3.9 8.0 15.1 23.7 24.6 23.3 94.7
Refer to the introduction for explanatory notes and how to read the graph.
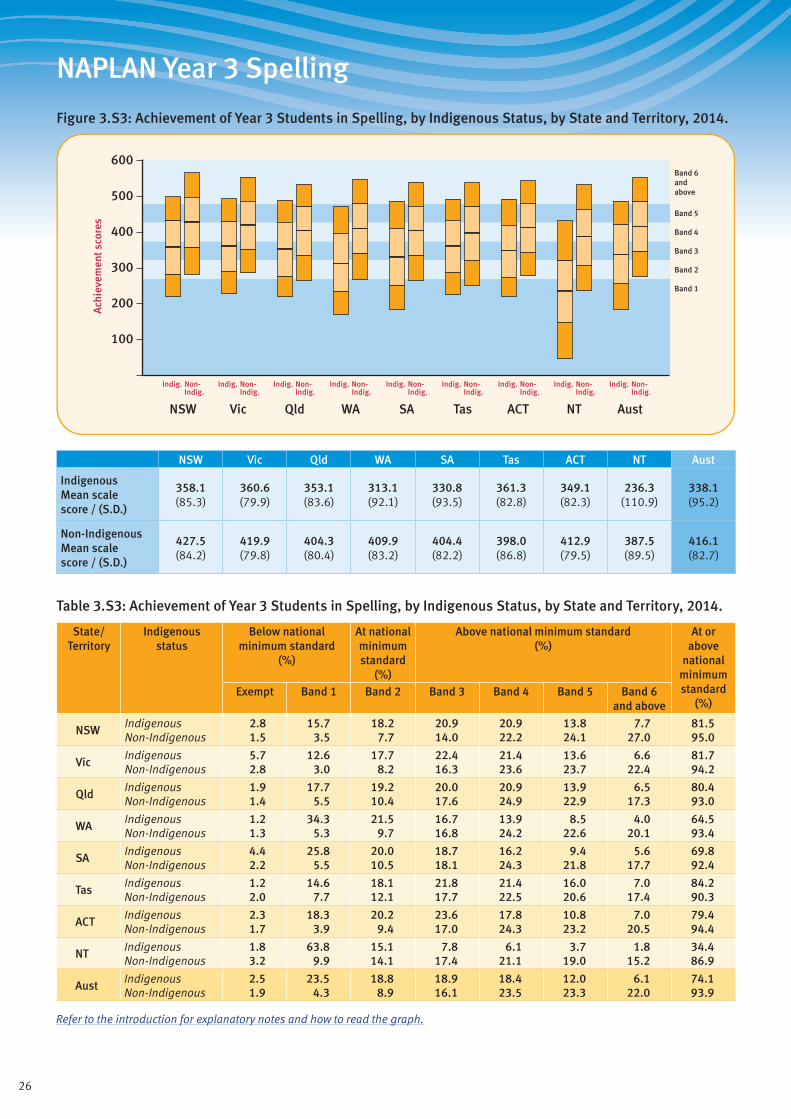
26
NAPLAN Year 3 Spelling
Figure 3.S3: Achievement of Year 3 Students in Spelling, by Indigenous Status, by State and Territory, 2014.
Band 1
Band 2
Band 3
Band 4
Band 5
Band 6andabove
600
500
400
300
200
100
Ach
ieve
men
t sco
res
ACTQld SAWA TasVicNSW NT Aust
Indig. Non-Indig.
Indig. Non-Indig.
Indig. Non-Indig.
Indig. Non-Indig.
Indig. Non-Indig.
Indig. Non-Indig.
Indig. Non-Indig.
Indig. Non-Indig.
Indig. Non-Indig.
NSW Vic Qld WA SA Tas ACT NT Aust
Indigenous Mean scale score / (S.D.)
358.1 (85.3)
360.6 (79.9)
353.1 (83.6)
313.1 (92.1)
330.8 (93.5)
361.3 (82.8)
349.1 (82.3)
236.3 (110.9)
338.1 (95.2)
Non-Indigenous Mean scale score / (S.D.)
427.5 (84.2)
419.9 (79.8)
404.3 (80.4)
409.9 (83.2)
404.4 (82.2)
398.0 (86.8)
412.9 (79.5)
387.5 (89.5)
416.1 (82.7)
Table 3.S3: Achievement of Year 3 Students in Spelling, by Indigenous Status, by State and Territory, 2014.
State/ Territory
Indigenous status
Below national minimum standard
(%)
At national minimum standard
(%)
Above national minimum standard (%)
At or above
national minimum standard
(%)Exempt Band 1 Band 2 Band 3 Band 4 Band 5 Band 6
and above
NSWIndigenous 2.8 15.7 18.2 20.9 20.9 13.8 7.7 81.5Non-Indigenous 1.5 3.5 7.7 14.0 22.2 24.1 27.0 95.0
VicIndigenous 5.7 12.6 17.7 22.4 21.4 13.6 6.6 81.7Non-Indigenous 2.8 3.0 8.2 16.3 23.6 23.7 22.4 94.2
QldIndigenous 1.9 17.7 19.2 20.0 20.9 13.9 6.5 80.4Non-Indigenous 1.4 5.5 10.4 17.6 24.9 22.9 17.3 93.0
WAIndigenous 1.2 34.3 21.5 16.7 13.9 8.5 4.0 64.5Non-Indigenous 1.3 5.3 9.7 16.8 24.2 22.6 20.1 93.4
SAIndigenous 4.4 25.8 20.0 18.7 16.2 9.4 5.6 69.8Non-Indigenous 2.2 5.5 10.5 18.1 24.3 21.8 17.7 92.4
TasIndigenous 1.2 14.6 18.1 21.8 21.4 16.0 7.0 84.2Non-Indigenous 2.0 7.7 12.1 17.7 22.5 20.6 17.4 90.3
ACTIndigenous 2.3 18.3 20.2 23.6 17.8 10.8 7.0 79.4Non-Indigenous 1.7 3.9 9.4 17.0 24.3 23.2 20.5 94.4
NTIndigenous 1.8 63.8 15.1 7.8 6.1 3.7 1.8 34.4Non-Indigenous 3.2 9.9 14.1 17.4 21.1 19.0 15.2 86.9
AustIndigenous 2.5 23.5 18.8 18.9 18.4 12.0 6.1 74.1Non-Indigenous 1.9 4.3 8.9 16.1 23.5 23.3 22.0 93.9
Refer to the introduction for explanatory notes and how to read the graph.
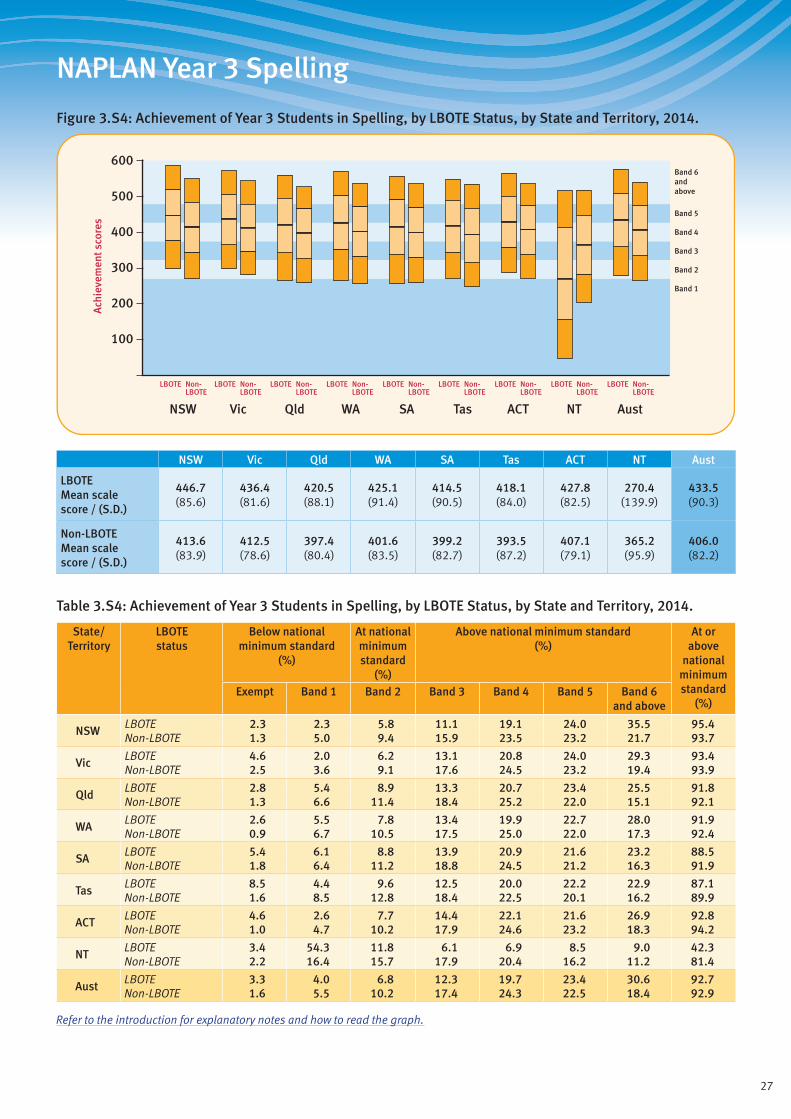
27
NAPLAN Year 3 Spelling
Figure 3.S4: Achievement of Year 3 Students in Spelling, by LBOTE Status, by State and Territory, 2014.
Band 1
Band 2
Band 3
Band 4
Band 5
Band 6andabove
600
500
400
300
200
100
Ach
ieve
men
t sco
res
ACTQld SAWA TasVicNSW NT Aust
LBOTE Non-LBOTE
LBOTE Non-LBOTE
LBOTE Non-LBOTE
LBOTE Non-LBOTE
LBOTE Non-LBOTE
LBOTE Non-LBOTE
LBOTE Non-LBOTE
LBOTE Non-LBOTE
LBOTE Non-LBOTE
NSW Vic Qld WA SA Tas ACT NT Aust
LBOTE Mean scale score / (S.D.)
446.7 (85.6)
436.4 (81.6)
420.5 (88.1)
425.1 (91.4)
414.5 (90.5)
418.1 (84.0)
427.8 (82.5)
270.4 (139.9)
433.5 (90.3)
Non-LBOTE Mean scale score / (S.D.)
413.6 (83.9)
412.5 (78.6)
397.4 (80.4)
401.6 (83.5)
399.2 (82.7)
393.5 (87.2)
407.1 (79.1)
365.2 (95.9)
406.0 (82.2)
Table 3.S4: Achievement of Year 3 Students in Spelling, by LBOTE Status, by State and Territory, 2014.
State/ Territory
LBOTE status
Below national minimum standard
(%)
At national minimum standard
(%)
Above national minimum standard (%)
At or above
national minimum standard
(%)Exempt Band 1 Band 2 Band 3 Band 4 Band 5 Band 6
and above
NSWLBOTE 2.3 2.3 5.8 11.1 19.1 24.0 35.5 95.4Non-LBOTE 1.3 5.0 9.4 15.9 23.5 23.2 21.7 93.7
VicLBOTE 4.6 2.0 6.2 13.1 20.8 24.0 29.3 93.4Non-LBOTE 2.5 3.6 9.1 17.6 24.5 23.2 19.4 93.9
QldLBOTE 2.8 5.4 8.9 13.3 20.7 23.4 25.5 91.8Non-LBOTE 1.3 6.6 11.4 18.4 25.2 22.0 15.1 92.1
WALBOTE 2.6 5.5 7.8 13.4 19.9 22.7 28.0 91.9Non-LBOTE 0.9 6.7 10.5 17.5 25.0 22.0 17.3 92.4
SALBOTE 5.4 6.1 8.8 13.9 20.9 21.6 23.2 88.5Non-LBOTE 1.8 6.4 11.2 18.8 24.5 21.2 16.3 91.9
TasLBOTE 8.5 4.4 9.6 12.5 20.0 22.2 22.9 87.1Non-LBOTE 1.6 8.5 12.8 18.4 22.5 20.1 16.2 89.9
ACTLBOTE 4.6 2.6 7.7 14.4 22.1 21.6 26.9 92.8Non-LBOTE 1.0 4.7 10.2 17.9 24.6 23.2 18.3 94.2
NTLBOTE 3.4 54.3 11.8 6.1 6.9 8.5 9.0 42.3Non-LBOTE 2.2 16.4 15.7 17.9 20.4 16.2 11.2 81.4
AustLBOTE 3.3 4.0 6.8 12.3 19.7 23.4 30.6 92.7Non-LBOTE 1.6 5.5 10.2 17.4 24.3 22.5 18.4 92.9
Refer to the introduction for explanatory notes and how to read the graph.
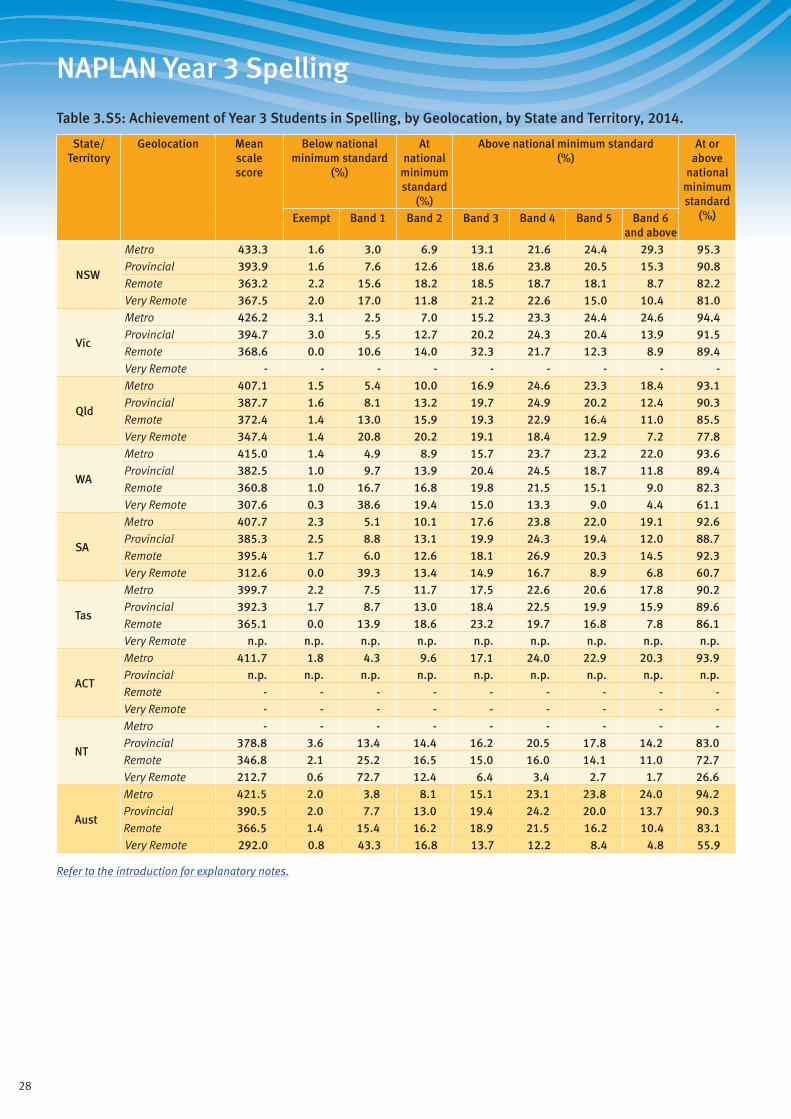
28
NAPLAN Year 3 Spelling
Table 3.S5: Achievement of Year 3 Students in Spelling, by Geolocation, by State and Territory, 2014.
State/ Territory
Geolocation Mean scale score
Below national minimum standard
(%)
At national
minimum standard
(%)
Above national minimum standard (%)
At or above
national minimum standard
(%)Exempt Band 1 Band 2 Band 3 Band 4 Band 5 Band 6 and above
NSW
Metro 433.3 1.6 3.0 6.9 13.1 21.6 24.4 29.3 95.3Provincial 393.9 1.6 7.6 12.6 18.6 23.8 20.5 15.3 90.8Remote 363.2 2.2 15.6 18.2 18.5 18.7 18.1 8.7 82.2Very Remote 367.5 2.0 17.0 11.8 21.2 22.6 15.0 10.4 81.0
Vic
Metro 426.2 3.1 2.5 7.0 15.2 23.3 24.4 24.6 94.4Provincial 394.7 3.0 5.5 12.7 20.2 24.3 20.4 13.9 91.5Remote 368.6 0.0 10.6 14.0 32.3 21.7 12.3 8.9 89.4Very Remote - - - - - - - - -
Qld
Metro 407.1 1.5 5.4 10.0 16.9 24.6 23.3 18.4 93.1Provincial 387.7 1.6 8.1 13.2 19.7 24.9 20.2 12.4 90.3Remote 372.4 1.4 13.0 15.9 19.3 22.9 16.4 11.0 85.5Very Remote 347.4 1.4 20.8 20.2 19.1 18.4 12.9 7.2 77.8
WA
Metro 415.0 1.4 4.9 8.9 15.7 23.7 23.2 22.0 93.6Provincial 382.5 1.0 9.7 13.9 20.4 24.5 18.7 11.8 89.4Remote 360.8 1.0 16.7 16.8 19.8 21.5 15.1 9.0 82.3Very Remote 307.6 0.3 38.6 19.4 15.0 13.3 9.0 4.4 61.1
SA
Metro 407.7 2.3 5.1 10.1 17.6 23.8 22.0 19.1 92.6Provincial 385.3 2.5 8.8 13.1 19.9 24.3 19.4 12.0 88.7Remote 395.4 1.7 6.0 12.6 18.1 26.9 20.3 14.5 92.3Very Remote 312.6 0.0 39.3 13.4 14.9 16.7 8.9 6.8 60.7
Tas
Metro 399.7 2.2 7.5 11.7 17.5 22.6 20.6 17.8 90.2Provincial 392.3 1.7 8.7 13.0 18.4 22.5 19.9 15.9 89.6Remote 365.1 0.0 13.9 18.6 23.2 19.7 16.8 7.8 86.1Very Remote n.p. n.p. n.p. n.p. n.p. n.p. n.p. n.p. n.p.
ACT
Metro 411.7 1.8 4.3 9.6 17.1 24.0 22.9 20.3 93.9Provincial n.p. n.p. n.p. n.p. n.p. n.p. n.p. n.p. n.p.Remote - - - - - - - - -Very Remote - - - - - - - - -
NT
Metro - - - - - - - - -Provincial 378.8 3.6 13.4 14.4 16.2 20.5 17.8 14.2 83.0Remote 346.8 2.1 25.2 16.5 15.0 16.0 14.1 11.0 72.7Very Remote 212.7 0.6 72.7 12.4 6.4 3.4 2.7 1.7 26.6
Aust
Metro 421.5 2.0 3.8 8.1 15.1 23.1 23.8 24.0 94.2Provincial 390.5 2.0 7.7 13.0 19.4 24.2 20.0 13.7 90.3Remote 366.5 1.4 15.4 16.2 18.9 21.5 16.2 10.4 83.1Very Remote 292.0 0.8 43.3 16.8 13.7 12.2 8.4 4.8 55.9
Refer to the introduction for explanatory notes.
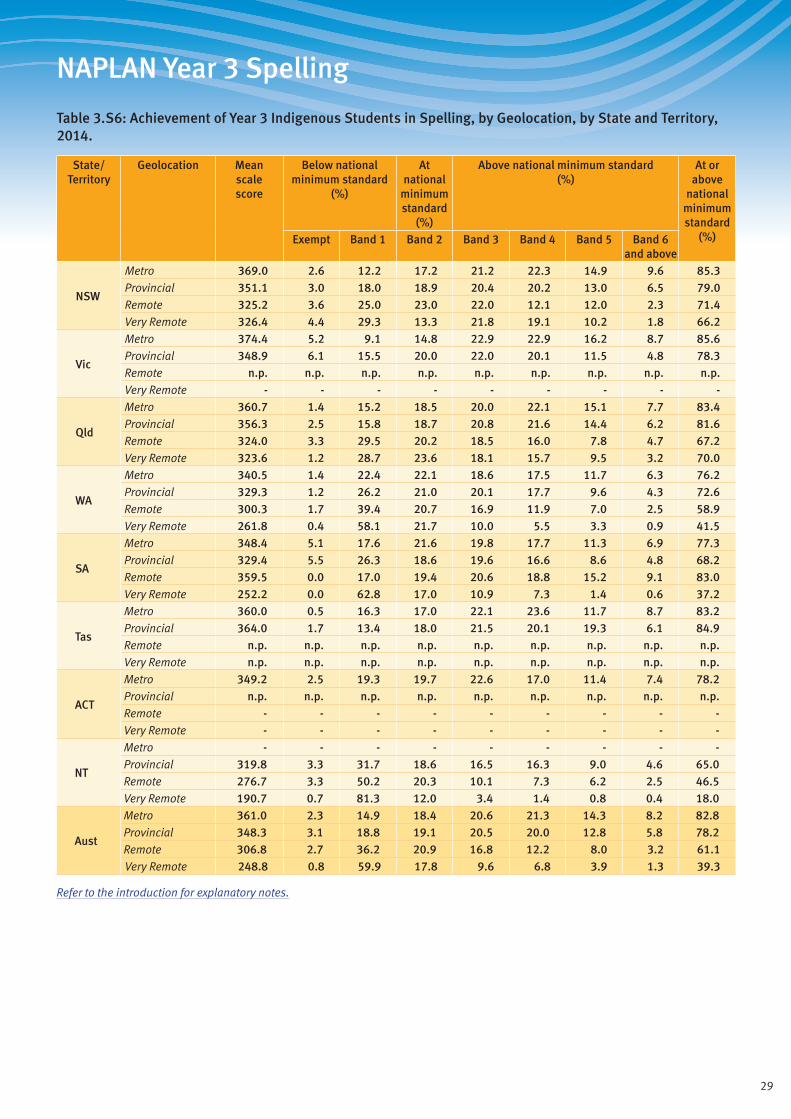
29
NAPLAN Year 3 Spelling
Table 3.S6: Achievement of Year 3 Indigenous Students in Spelling, by Geolocation, by State and Territory, 2014.
State/ Territory
Geolocation Mean scale score
Below national minimum standard
(%)
At national
minimum standard
(%)
Above national minimum standard (%)
At or above
national minimum standard
(%)Exempt Band 1 Band 2 Band 3 Band 4 Band 5 Band 6 and above
NSW
Metro 369.0 2.6 12.2 17.2 21.2 22.3 14.9 9.6 85.3Provincial 351.1 3.0 18.0 18.9 20.4 20.2 13.0 6.5 79.0Remote 325.2 3.6 25.0 23.0 22.0 12.1 12.0 2.3 71.4Very Remote 326.4 4.4 29.3 13.3 21.8 19.1 10.2 1.8 66.2
Vic
Metro 374.4 5.2 9.1 14.8 22.9 22.9 16.2 8.7 85.6Provincial 348.9 6.1 15.5 20.0 22.0 20.1 11.5 4.8 78.3Remote n.p. n.p. n.p. n.p. n.p. n.p. n.p. n.p. n.p.Very Remote - - - - - - - - -
Qld
Metro 360.7 1.4 15.2 18.5 20.0 22.1 15.1 7.7 83.4Provincial 356.3 2.5 15.8 18.7 20.8 21.6 14.4 6.2 81.6Remote 324.0 3.3 29.5 20.2 18.5 16.0 7.8 4.7 67.2Very Remote 323.6 1.2 28.7 23.6 18.1 15.7 9.5 3.2 70.0
WA
Metro 340.5 1.4 22.4 22.1 18.6 17.5 11.7 6.3 76.2Provincial 329.3 1.2 26.2 21.0 20.1 17.7 9.6 4.3 72.6Remote 300.3 1.7 39.4 20.7 16.9 11.9 7.0 2.5 58.9Very Remote 261.8 0.4 58.1 21.7 10.0 5.5 3.3 0.9 41.5
SA
Metro 348.4 5.1 17.6 21.6 19.8 17.7 11.3 6.9 77.3Provincial 329.4 5.5 26.3 18.6 19.6 16.6 8.6 4.8 68.2Remote 359.5 0.0 17.0 19.4 20.6 18.8 15.2 9.1 83.0Very Remote 252.2 0.0 62.8 17.0 10.9 7.3 1.4 0.6 37.2
Tas
Metro 360.0 0.5 16.3 17.0 22.1 23.6 11.7 8.7 83.2Provincial 364.0 1.7 13.4 18.0 21.5 20.1 19.3 6.1 84.9Remote n.p. n.p. n.p. n.p. n.p. n.p. n.p. n.p. n.p.Very Remote n.p. n.p. n.p. n.p. n.p. n.p. n.p. n.p. n.p.
ACT
Metro 349.2 2.5 19.3 19.7 22.6 17.0 11.4 7.4 78.2Provincial n.p. n.p. n.p. n.p. n.p. n.p. n.p. n.p. n.p.Remote - - - - - - - - -Very Remote - - - - - - - - -
NT
Metro - - - - - - - - -Provincial 319.8 3.3 31.7 18.6 16.5 16.3 9.0 4.6 65.0Remote 276.7 3.3 50.2 20.3 10.1 7.3 6.2 2.5 46.5Very Remote 190.7 0.7 81.3 12.0 3.4 1.4 0.8 0.4 18.0
Aust
Metro 361.0 2.3 14.9 18.4 20.6 21.3 14.3 8.2 82.8Provincial 348.3 3.1 18.8 19.1 20.5 20.0 12.8 5.8 78.2Remote 306.8 2.7 36.2 20.9 16.8 12.2 8.0 3.2 61.1Very Remote 248.8 0.8 59.9 17.8 9.6 6.8 3.9 1.3 39.3
Refer to the introduction for explanatory notes.
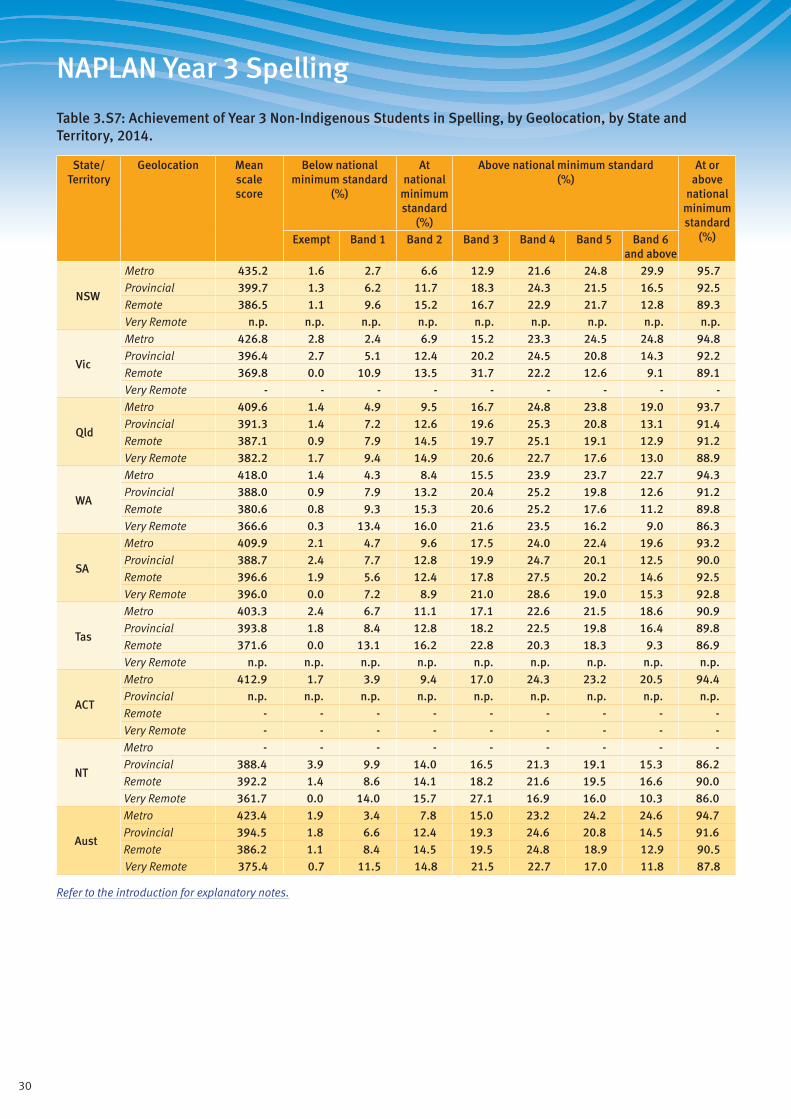
30
NAPLAN Year 3 Spelling
Table 3.S7: Achievement of Year 3 Non-Indigenous Students in Spelling, by Geolocation, by State and Territory, 2014.
State/ Territory
Geolocation Mean scale score
Below national minimum standard
(%)
At national
minimum standard
(%)
Above national minimum standard (%)
At or above
national minimum standard
(%)Exempt Band 1 Band 2 Band 3 Band 4 Band 5 Band 6 and above
NSW
Metro 435.2 1.6 2.7 6.6 12.9 21.6 24.8 29.9 95.7Provincial 399.7 1.3 6.2 11.7 18.3 24.3 21.5 16.5 92.5Remote 386.5 1.1 9.6 15.2 16.7 22.9 21.7 12.8 89.3Very Remote n.p. n.p. n.p. n.p. n.p. n.p. n.p. n.p. n.p.
Vic
Metro 426.8 2.8 2.4 6.9 15.2 23.3 24.5 24.8 94.8Provincial 396.4 2.7 5.1 12.4 20.2 24.5 20.8 14.3 92.2Remote 369.8 0.0 10.9 13.5 31.7 22.2 12.6 9.1 89.1Very Remote - - - - - - - - -
Qld
Metro 409.6 1.4 4.9 9.5 16.7 24.8 23.8 19.0 93.7Provincial 391.3 1.4 7.2 12.6 19.6 25.3 20.8 13.1 91.4Remote 387.1 0.9 7.9 14.5 19.7 25.1 19.1 12.9 91.2Very Remote 382.2 1.7 9.4 14.9 20.6 22.7 17.6 13.0 88.9
WA
Metro 418.0 1.4 4.3 8.4 15.5 23.9 23.7 22.7 94.3Provincial 388.0 0.9 7.9 13.2 20.4 25.2 19.8 12.6 91.2Remote 380.6 0.8 9.3 15.3 20.6 25.2 17.6 11.2 89.8Very Remote 366.6 0.3 13.4 16.0 21.6 23.5 16.2 9.0 86.3
SA
Metro 409.9 2.1 4.7 9.6 17.5 24.0 22.4 19.6 93.2Provincial 388.7 2.4 7.7 12.8 19.9 24.7 20.1 12.5 90.0Remote 396.6 1.9 5.6 12.4 17.8 27.5 20.2 14.6 92.5Very Remote 396.0 0.0 7.2 8.9 21.0 28.6 19.0 15.3 92.8
Tas
Metro 403.3 2.4 6.7 11.1 17.1 22.6 21.5 18.6 90.9Provincial 393.8 1.8 8.4 12.8 18.2 22.5 19.8 16.4 89.8Remote 371.6 0.0 13.1 16.2 22.8 20.3 18.3 9.3 86.9Very Remote n.p. n.p. n.p. n.p. n.p. n.p. n.p. n.p. n.p.
ACT
Metro 412.9 1.7 3.9 9.4 17.0 24.3 23.2 20.5 94.4Provincial n.p. n.p. n.p. n.p. n.p. n.p. n.p. n.p. n.p.Remote - - - - - - - - -Very Remote - - - - - - - - -
NT
Metro - - - - - - - - -Provincial 388.4 3.9 9.9 14.0 16.5 21.3 19.1 15.3 86.2Remote 392.2 1.4 8.6 14.1 18.2 21.6 19.5 16.6 90.0Very Remote 361.7 0.0 14.0 15.7 27.1 16.9 16.0 10.3 86.0
Aust
Metro 423.4 1.9 3.4 7.8 15.0 23.2 24.2 24.6 94.7Provincial 394.5 1.8 6.6 12.4 19.3 24.6 20.8 14.5 91.6Remote 386.2 1.1 8.4 14.5 19.5 24.8 18.9 12.9 90.5Very Remote 375.4 0.7 11.5 14.8 21.5 22.7 17.0 11.8 87.8
Refer to the introduction for explanatory notes.

31
NAPLAN Year 3 Spelling
Table 3.S8: Achievement of Year 3 Students in Spelling, by Parental Education, by State and Territory, 2014.
State/ Territory
Parental education
Mean scale score
Below national minimum standard
(%)
At national
minimum standard
(%)
Above national minimum standard (%)
At or above
national minimum standard
(%)Exempt Band 1 Band 2 Band 3 Band 4 Band 5 Band 6 and above
NSW
Bachelor 457.7 1.1 1.0 3.8 9.3 19.2 26.1 39.5 97.9Diploma 423.9 1.4 2.8 7.2 15.0 24.6 25.2 23.8 95.8Certificate 401.3 1.4 5.6 11.0 18.5 24.9 22.3 16.2 93.0Year 12 407.5 2.2 5.5 10.1 16.6 23.4 23.1 19.1 92.3Year 11 369.3 3.2 12.2 17.2 20.4 21.8 15.5 9.6 84.6Not stated (4%) 407.2 3.5 7.0 10.8 15.6 22.1 20.2 20.9 89.5
Vic
Bachelor 443.1 1.9 1.1 4.6 12.5 22.3 26.0 31.6 97.0Diploma 413.2 2.4 2.9 8.5 18.0 25.2 24.1 18.9 94.7Certificate 397.8 2.9 4.7 11.6 20.4 25.0 21.6 13.9 92.4Year 12 408.0 4.0 4.0 9.5 17.8 24.1 23.4 17.2 91.9Year 11 379.0 7.8 8.0 15.0 20.0 23.2 16.8 9.3 84.2Not stated (3%) 431.8 6.2 2.4 7.1 14.6 20.0 22.2 27.6 91.4
Qld
Bachelor 431.7 1.0 1.9 6.0 13.9 23.9 27.0 26.4 97.1Diploma 402.0 1.0 5.1 10.6 18.5 25.8 23.7 15.4 94.0Certificate 389.1 1.2 7.2 12.8 20.1 26.2 20.5 12.0 91.6Year 12 388.4 1.4 8.3 13.1 19.1 24.8 20.9 12.5 90.4Year 11 357.2 2.9 15.8 18.2 20.5 22.0 14.1 6.6 81.3Not stated (11%) 384.7 3.1 9.8 13.9 18.1 23.2 19.2 12.7 87.1
WA
Bachelor 438.8 1.1 1.6 5.3 12.8 22.8 26.4 30.0 97.3Diploma 404.8 1.1 5.0 10.3 17.5 25.8 23.3 16.9 93.9Certificate 388.6 0.9 7.8 13.0 20.3 25.6 19.8 12.6 91.3Year 12 395.1 1.5 7.4 11.2 18.7 25.6 20.9 14.8 91.2Year 11 354.5 1.7 18.4 17.6 20.1 20.2 14.3 7.7 79.9Not stated (14%) 377.0 2.1 14.7 14.3 16.6 20.7 16.9 14.7 83.2
SA
Bachelor 434.2 1.5 2.0 5.5 13.9 23.7 25.4 28.0 96.5Diploma 405.0 1.2 3.8 10.1 19.8 25.4 23.3 16.4 95.0Certificate 387.1 2.2 7.2 13.6 20.8 24.9 19.3 12.0 90.6Year 12 392.2 2.3 6.7 12.4 19.3 25.2 21.5 12.4 91.0Year 11 356.7 4.2 15.5 17.6 21.2 21.4 13.6 6.4 80.3Not stated (10%) 385.9 4.5 10.2 12.6 17.7 22.2 18.5 14.4 85.4
KeyBachelor: Bachelor degree or aboveDiploma: Advanced diploma/diplomaCertificate: Certificate I to IVYear 12: Year 12 or equivalentYear 11: Year 11 or equivalent or belowNot stated: No data was provided for parental education at the time of student enrolment. The higher the percentage of missing data, the less informative are the results for the other categories.
Refer to the introduction for explanatory notes.
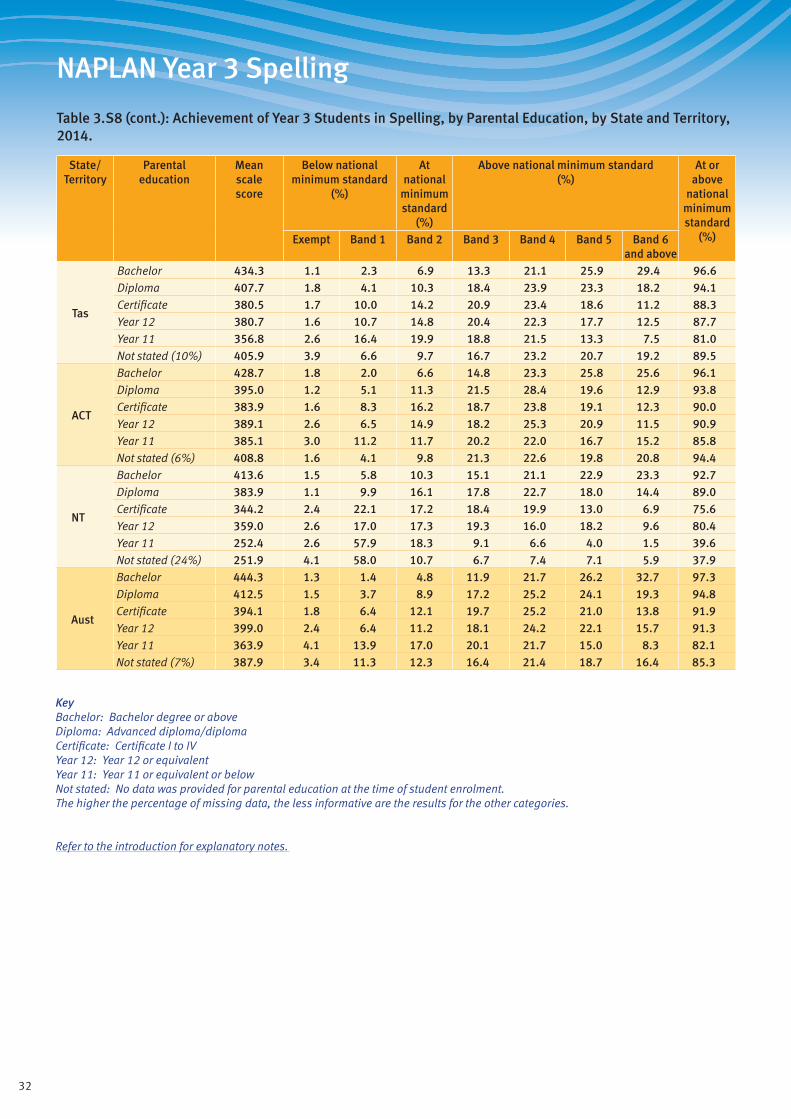
32
NAPLAN Year 3 Spelling
Table 3.S8 (cont.): Achievement of Year 3 Students in Spelling, by Parental Education, by State and Territory, 2014.
State/ Territory
Parental education
Mean scale score
Below national minimum standard
(%)
At national
minimum standard
(%)
Above national minimum standard (%)
At or above
national minimum standard
(%)Exempt Band 1 Band 2 Band 3 Band 4 Band 5 Band 6 and above
Tas
Bachelor 434.3 1.1 2.3 6.9 13.3 21.1 25.9 29.4 96.6Diploma 407.7 1.8 4.1 10.3 18.4 23.9 23.3 18.2 94.1Certificate 380.5 1.7 10.0 14.2 20.9 23.4 18.6 11.2 88.3Year 12 380.7 1.6 10.7 14.8 20.4 22.3 17.7 12.5 87.7Year 11 356.8 2.6 16.4 19.9 18.8 21.5 13.3 7.5 81.0Not stated (10%) 405.9 3.9 6.6 9.7 16.7 23.2 20.7 19.2 89.5
ACT
Bachelor 428.7 1.8 2.0 6.6 14.8 23.3 25.8 25.6 96.1Diploma 395.0 1.2 5.1 11.3 21.5 28.4 19.6 12.9 93.8Certificate 383.9 1.6 8.3 16.2 18.7 23.8 19.1 12.3 90.0Year 12 389.1 2.6 6.5 14.9 18.2 25.3 20.9 11.5 90.9Year 11 385.1 3.0 11.2 11.7 20.2 22.0 16.7 15.2 85.8Not stated (6%) 408.8 1.6 4.1 9.8 21.3 22.6 19.8 20.8 94.4
NT
Bachelor 413.6 1.5 5.8 10.3 15.1 21.1 22.9 23.3 92.7Diploma 383.9 1.1 9.9 16.1 17.8 22.7 18.0 14.4 89.0Certificate 344.2 2.4 22.1 17.2 18.4 19.9 13.0 6.9 75.6Year 12 359.0 2.6 17.0 17.3 19.3 16.0 18.2 9.6 80.4Year 11 252.4 2.6 57.9 18.3 9.1 6.6 4.0 1.5 39.6Not stated (24%) 251.9 4.1 58.0 10.7 6.7 7.4 7.1 5.9 37.9
Aust
Bachelor 444.3 1.3 1.4 4.8 11.9 21.7 26.2 32.7 97.3Diploma 412.5 1.5 3.7 8.9 17.2 25.2 24.1 19.3 94.8Certificate 394.1 1.8 6.4 12.1 19.7 25.2 21.0 13.8 91.9Year 12 399.0 2.4 6.4 11.2 18.1 24.2 22.1 15.7 91.3Year 11 363.9 4.1 13.9 17.0 20.1 21.7 15.0 8.3 82.1Not stated (7%) 387.9 3.4 11.3 12.3 16.4 21.4 18.7 16.4 85.3
KeyBachelor: Bachelor degree or aboveDiploma: Advanced diploma/diplomaCertificate: Certificate I to IVYear 12: Year 12 or equivalentYear 11: Year 11 or equivalent or belowNot stated: No data was provided for parental education at the time of student enrolment. The higher the percentage of missing data, the less informative are the results for the other categories.
Refer to the introduction for explanatory notes.
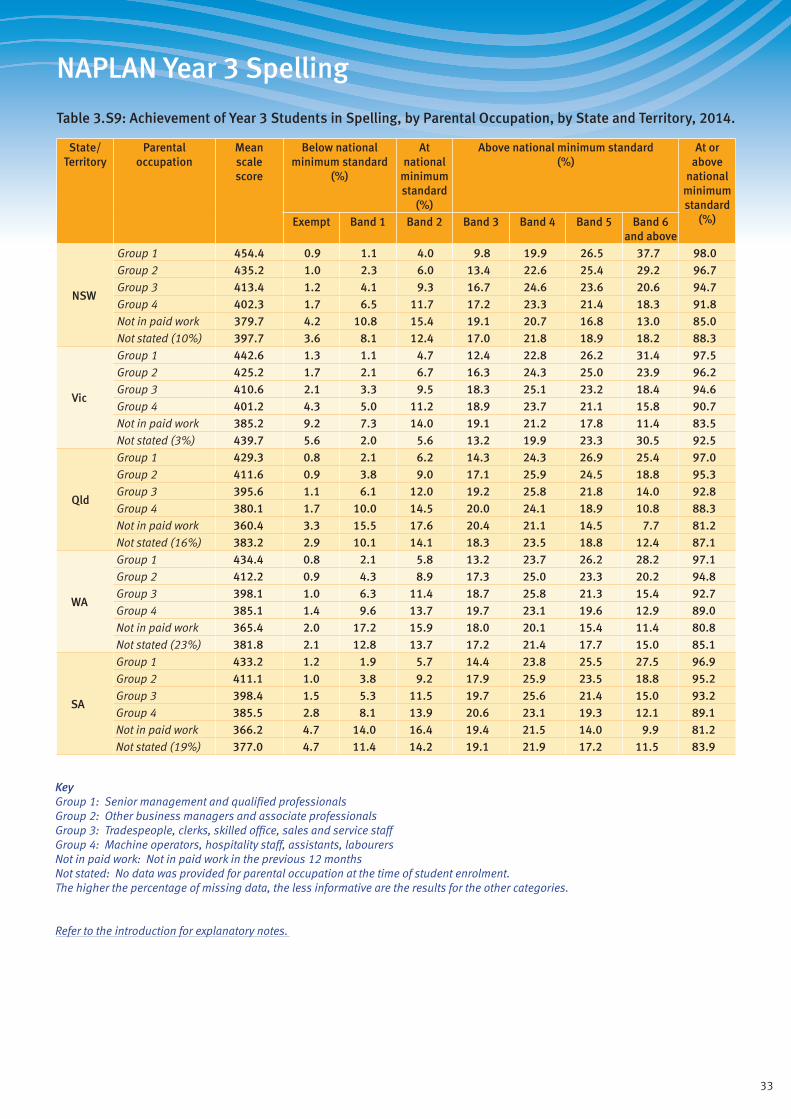
33
NAPLAN Year 3 Spelling
Table 3.S9: Achievement of Year 3 Students in Spelling, by Parental Occupation, by State and Territory, 2014.
State/ Territory
Parental occupation
Mean scale score
Below national minimum standard
(%)
At national
minimum standard
(%)
Above national minimum standard (%)
At or above
national minimum standard
(%)Exempt Band 1 Band 2 Band 3 Band 4 Band 5 Band 6 and above
NSW
Group 1 454.4 0.9 1.1 4.0 9.8 19.9 26.5 37.7 98.0Group 2 435.2 1.0 2.3 6.0 13.4 22.6 25.4 29.2 96.7Group 3 413.4 1.2 4.1 9.3 16.7 24.6 23.6 20.6 94.7Group 4 402.3 1.7 6.5 11.7 17.2 23.3 21.4 18.3 91.8Not in paid work 379.7 4.2 10.8 15.4 19.1 20.7 16.8 13.0 85.0Not stated (10%) 397.7 3.6 8.1 12.4 17.0 21.8 18.9 18.2 88.3
Vic
Group 1 442.6 1.3 1.1 4.7 12.4 22.8 26.2 31.4 97.5Group 2 425.2 1.7 2.1 6.7 16.3 24.3 25.0 23.9 96.2Group 3 410.6 2.1 3.3 9.5 18.3 25.1 23.2 18.4 94.6Group 4 401.2 4.3 5.0 11.2 18.9 23.7 21.1 15.8 90.7Not in paid work 385.2 9.2 7.3 14.0 19.1 21.2 17.8 11.4 83.5Not stated (3%) 439.7 5.6 2.0 5.6 13.2 19.9 23.3 30.5 92.5
Qld
Group 1 429.3 0.8 2.1 6.2 14.3 24.3 26.9 25.4 97.0Group 2 411.6 0.9 3.8 9.0 17.1 25.9 24.5 18.8 95.3Group 3 395.6 1.1 6.1 12.0 19.2 25.8 21.8 14.0 92.8Group 4 380.1 1.7 10.0 14.5 20.0 24.1 18.9 10.8 88.3Not in paid work 360.4 3.3 15.5 17.6 20.4 21.1 14.5 7.7 81.2Not stated (16%) 383.2 2.9 10.1 14.1 18.3 23.5 18.8 12.4 87.1
WA
Group 1 434.4 0.8 2.1 5.8 13.2 23.7 26.2 28.2 97.1Group 2 412.2 0.9 4.3 8.9 17.3 25.0 23.3 20.2 94.8Group 3 398.1 1.0 6.3 11.4 18.7 25.8 21.3 15.4 92.7Group 4 385.1 1.4 9.6 13.7 19.7 23.1 19.6 12.9 89.0Not in paid work 365.4 2.0 17.2 15.9 18.0 20.1 15.4 11.4 80.8Not stated (23%) 381.8 2.1 12.8 13.7 17.2 21.4 17.7 15.0 85.1
SA
Group 1 433.2 1.2 1.9 5.7 14.4 23.8 25.5 27.5 96.9Group 2 411.1 1.0 3.8 9.2 17.9 25.9 23.5 18.8 95.2Group 3 398.4 1.5 5.3 11.5 19.7 25.6 21.4 15.0 93.2Group 4 385.5 2.8 8.1 13.9 20.6 23.1 19.3 12.1 89.1Not in paid work 366.2 4.7 14.0 16.4 19.4 21.5 14.0 9.9 81.2Not stated (19%) 377.0 4.7 11.4 14.2 19.1 21.9 17.2 11.5 83.9
KeyGroup 1: Senior management and qualified professionalsGroup 2: Other business managers and associate professionalsGroup 3: Tradespeople, clerks, skilled office, sales and service staffGroup 4: Machine operators, hospitality staff, assistants, labourersNot in paid work: Not in paid work in the previous 12 monthsNot stated: No data was provided for parental occupation at the time of student enrolment. The higher the percentage of missing data, the less informative are the results for the other categories.
Refer to the introduction for explanatory notes.
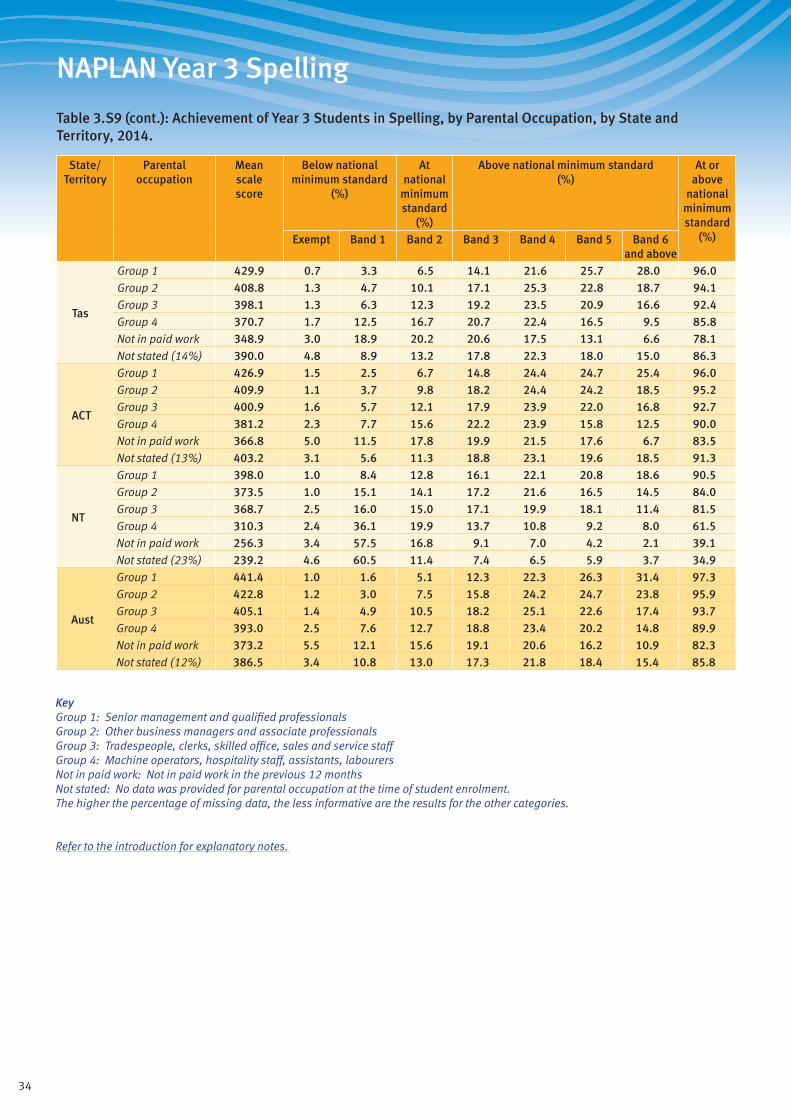
34
NAPLAN Year 3 Spelling
Table 3.S9 (cont.): Achievement of Year 3 Students in Spelling, by Parental Occupation, by State and Territory, 2014.
State/ Territory
Parental occupation
Mean scale score
Below national minimum standard
(%)
At national
minimum standard
(%)
Above national minimum standard (%)
At or above
national minimum standard
(%)Exempt Band 1 Band 2 Band 3 Band 4 Band 5 Band 6 and above
Tas
Group 1 429.9 0.7 3.3 6.5 14.1 21.6 25.7 28.0 96.0Group 2 408.8 1.3 4.7 10.1 17.1 25.3 22.8 18.7 94.1Group 3 398.1 1.3 6.3 12.3 19.2 23.5 20.9 16.6 92.4Group 4 370.7 1.7 12.5 16.7 20.7 22.4 16.5 9.5 85.8Not in paid work 348.9 3.0 18.9 20.2 20.6 17.5 13.1 6.6 78.1Not stated (14%) 390.0 4.8 8.9 13.2 17.8 22.3 18.0 15.0 86.3
ACT
Group 1 426.9 1.5 2.5 6.7 14.8 24.4 24.7 25.4 96.0Group 2 409.9 1.1 3.7 9.8 18.2 24.4 24.2 18.5 95.2Group 3 400.9 1.6 5.7 12.1 17.9 23.9 22.0 16.8 92.7Group 4 381.2 2.3 7.7 15.6 22.2 23.9 15.8 12.5 90.0Not in paid work 366.8 5.0 11.5 17.8 19.9 21.5 17.6 6.7 83.5Not stated (13%) 403.2 3.1 5.6 11.3 18.8 23.1 19.6 18.5 91.3
NT
Group 1 398.0 1.0 8.4 12.8 16.1 22.1 20.8 18.6 90.5Group 2 373.5 1.0 15.1 14.1 17.2 21.6 16.5 14.5 84.0Group 3 368.7 2.5 16.0 15.0 17.1 19.9 18.1 11.4 81.5Group 4 310.3 2.4 36.1 19.9 13.7 10.8 9.2 8.0 61.5Not in paid work 256.3 3.4 57.5 16.8 9.1 7.0 4.2 2.1 39.1Not stated (23%) 239.2 4.6 60.5 11.4 7.4 6.5 5.9 3.7 34.9
Aust
Group 1 441.4 1.0 1.6 5.1 12.3 22.3 26.3 31.4 97.3Group 2 422.8 1.2 3.0 7.5 15.8 24.2 24.7 23.8 95.9Group 3 405.1 1.4 4.9 10.5 18.2 25.1 22.6 17.4 93.7Group 4 393.0 2.5 7.6 12.7 18.8 23.4 20.2 14.8 89.9Not in paid work 373.2 5.5 12.1 15.6 19.1 20.6 16.2 10.9 82.3Not stated (12%) 386.5 3.4 10.8 13.0 17.3 21.8 18.4 15.4 85.8
KeyGroup 1: Senior management and qualified professionalsGroup 2: Other business managers and associate professionalsGroup 3: Tradespeople, clerks, skilled office, sales and service staffGroup 4: Machine operators, hospitality staff, assistants, labourersNot in paid work: Not in paid work in the previous 12 monthsNot stated: No data was provided for parental occupation at the time of student enrolment. The higher the percentage of missing data, the less informative are the results for the other categories.
Refer to the introduction for explanatory notes.
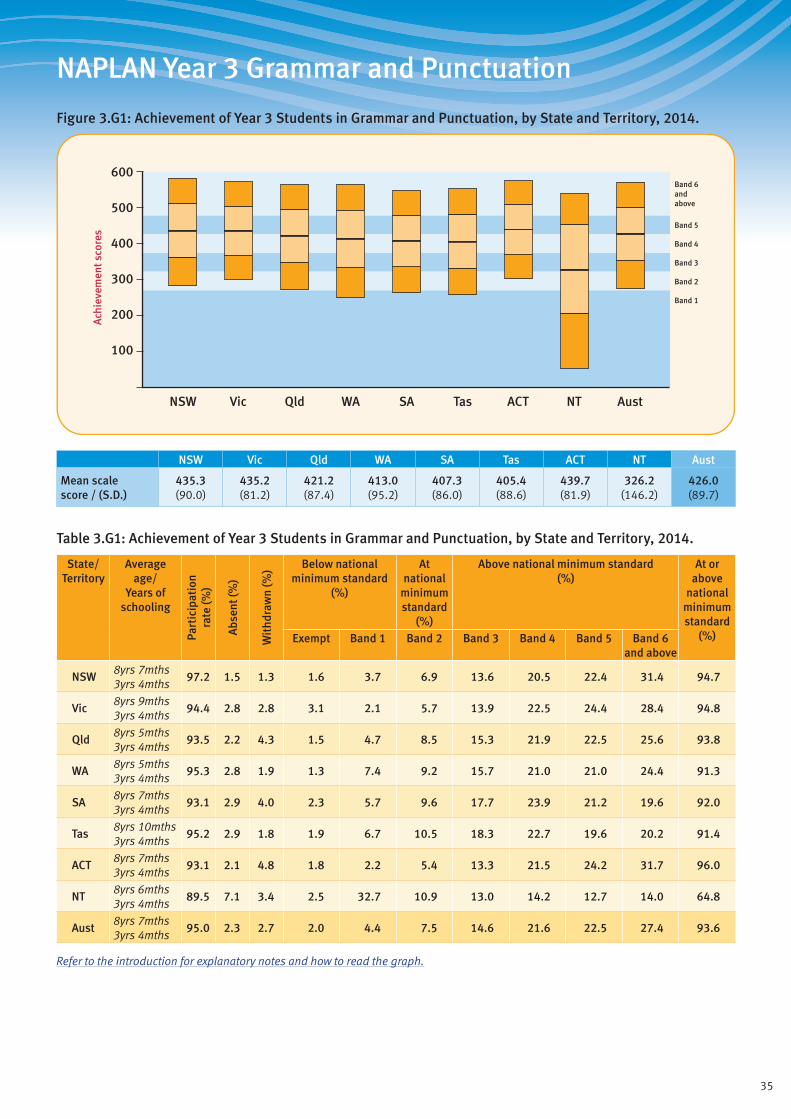
35
NAPLAN Year 3 Grammar and Punctuation
Figure 3.G1: Achievement of Year 3 Students in Grammar and Punctuation, by State and Territory, 2014.
Band 1
Band 2
Band 3
Band 4
Band 5
Band 6andabove
600
500
400
300
200
100
Ach
ieve
men
t sco
res
ACTQld SAWA TasVicNSW NT Aust
NSW Vic Qld WA SA Tas ACT NT Aust
Mean scale score / (S.D.)
435.3 (90.0)
435.2 (81.2)
421.2 (87.4)
413.0 (95.2)
407.3 (86.0)
405.4 (88.6)
439.7 (81.9)
326.2 (146.2)
426.0 (89.7)
Table 3.G1: Achievement of Year 3 Students in Grammar and Punctuation, by State and Territory, 2014.
State/ Territory
Average age/
Years of schooling
Part
icip
atio
nra
te (%
)
Abs
ent (
%)
Wit
hdra
wn
(%) Below national
minimum standard (%)
At national
minimum standard
(%)
Above national minimum standard (%)
At or above
national minimum standard
(%)Exempt Band 1 Band 2 Band 3 Band 4 Band 5 Band 6 and above
NSW8yrs 7mths 3yrs 4mths
97.2 1.5 1.3 1.6 3.7 6.9 13.6 20.5 22.4 31.4 94.7
Vic8yrs 9mths 3yrs 4mths
94.4 2.8 2.8 3.1 2.1 5.7 13.9 22.5 24.4 28.4 94.8
Qld8yrs 5mths 3yrs 4mths
93.5 2.2 4.3 1.5 4.7 8.5 15.3 21.9 22.5 25.6 93.8
WA8yrs 5mths 3yrs 4mths
95.3 2.8 1.9 1.3 7.4 9.2 15.7 21.0 21.0 24.4 91.3
SA8yrs 7mths 3yrs 4mths
93.1 2.9 4.0 2.3 5.7 9.6 17.7 23.9 21.2 19.6 92.0
Tas8yrs 10mths 3yrs 4mths
95.2 2.9 1.8 1.9 6.7 10.5 18.3 22.7 19.6 20.2 91.4
ACT8yrs 7mths 3yrs 4mths
93.1 2.1 4.8 1.8 2.2 5.4 13.3 21.5 24.2 31.7 96.0
NT8yrs 6mths 3yrs 4mths
89.5 7.1 3.4 2.5 32.7 10.9 13.0 14.2 12.7 14.0 64.8
Aust8yrs 7mths 3yrs 4mths
95.0 2.3 2.7 2.0 4.4 7.5 14.6 21.6 22.5 27.4 93.6
Refer to the introduction for explanatory notes and how to read the graph.
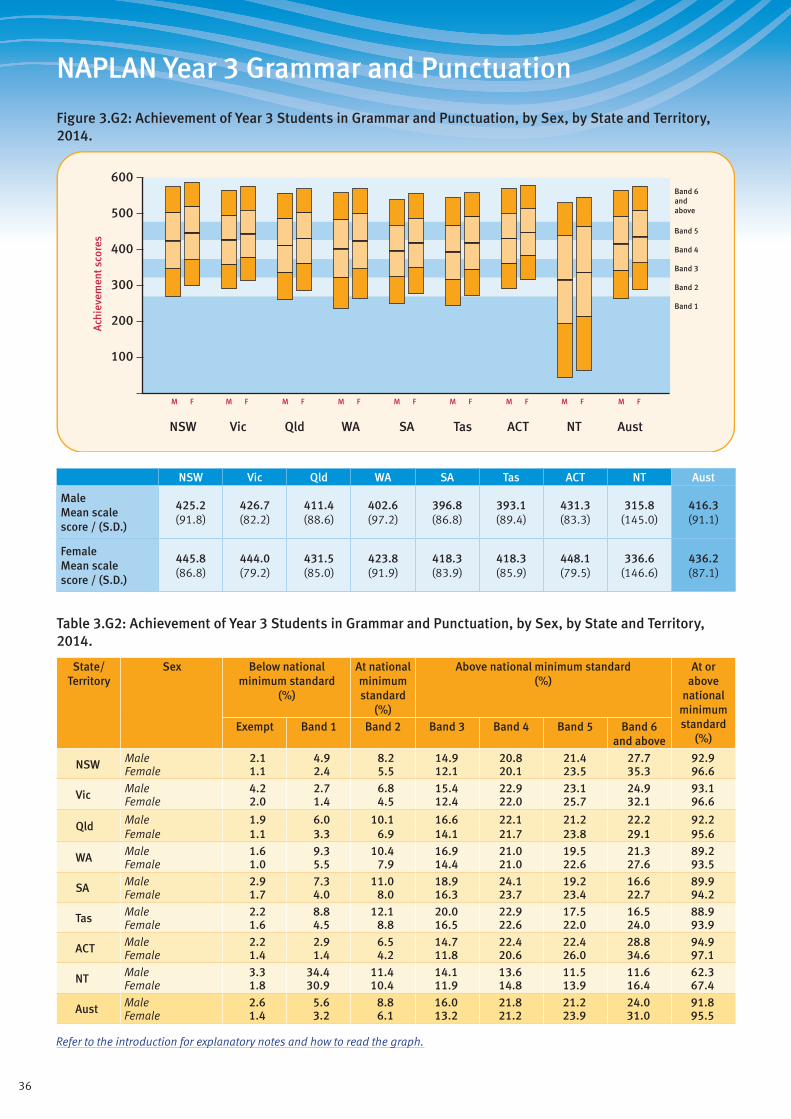
36
NAPLAN Year 3 Grammar and Punctuation
Figure 3.G2: Achievement of Year 3 Students in Grammar and Punctuation, by Sex, by State and Territory, 2014.
Band 1
Band 2
Band 3
Band 4
Band 5
Band 6andabove
600
500
400
300
200
100
Ach
ieve
men
t sco
res
ACTQld SAWA TasVicNSW NT Aust
M F M F M F M F M F M F M F M F M F
NSW Vic Qld WA SA Tas ACT NT Aust
Male Mean scale score / (S.D.)
425.2 (91.8)
426.7 (82.2)
411.4 (88.6)
402.6 (97.2)
396.8 (86.8)
393.1 (89.4)
431.3 (83.3)
315.8 (145.0)
416.3 (91.1)
Female Mean scale score / (S.D.)
445.8 (86.8)
444.0 (79.2)
431.5 (85.0)
423.8 (91.9)
418.3 (83.9)
418.3 (85.9)
448.1 (79.5)
336.6 (146.6)
436.2 (87.1)
Table 3.G2: Achievement of Year 3 Students in Grammar and Punctuation, by Sex, by State and Territory, 2014.
State/ Territory
Sex Below national minimum standard
(%)
At national minimum standard
(%)
Above national minimum standard (%)
At or above
national minimum standard
(%)Exempt Band 1 Band 2 Band 3 Band 4 Band 5 Band 6
and above
NSW Male 2.1 4.9 8.2 14.9 20.8 21.4 27.7 92.9Female 1.1 2.4 5.5 12.1 20.1 23.5 35.3 96.6
Vic Male 4.2 2.7 6.8 15.4 22.9 23.1 24.9 93.1Female 2.0 1.4 4.5 12.4 22.0 25.7 32.1 96.6
Qld Male 1.9 6.0 10.1 16.6 22.1 21.2 22.2 92.2Female 1.1 3.3 6.9 14.1 21.7 23.8 29.1 95.6
WA Male 1.6 9.3 10.4 16.9 21.0 19.5 21.3 89.2Female 1.0 5.5 7.9 14.4 21.0 22.6 27.6 93.5
SA Male 2.9 7.3 11.0 18.9 24.1 19.2 16.6 89.9Female 1.7 4.0 8.0 16.3 23.7 23.4 22.7 94.2
Tas Male 2.2 8.8 12.1 20.0 22.9 17.5 16.5 88.9Female 1.6 4.5 8.8 16.5 22.6 22.0 24.0 93.9
ACT Male 2.2 2.9 6.5 14.7 22.4 22.4 28.8 94.9Female 1.4 1.4 4.2 11.8 20.6 26.0 34.6 97.1
NT Male 3.3 34.4 11.4 14.1 13.6 11.5 11.6 62.3Female 1.8 30.9 10.4 11.9 14.8 13.9 16.4 67.4
Aust Male 2.6 5.6 8.8 16.0 21.8 21.2 24.0 91.8Female 1.4 3.2 6.1 13.2 21.2 23.9 31.0 95.5
Refer to the introduction for explanatory notes and how to read the graph.
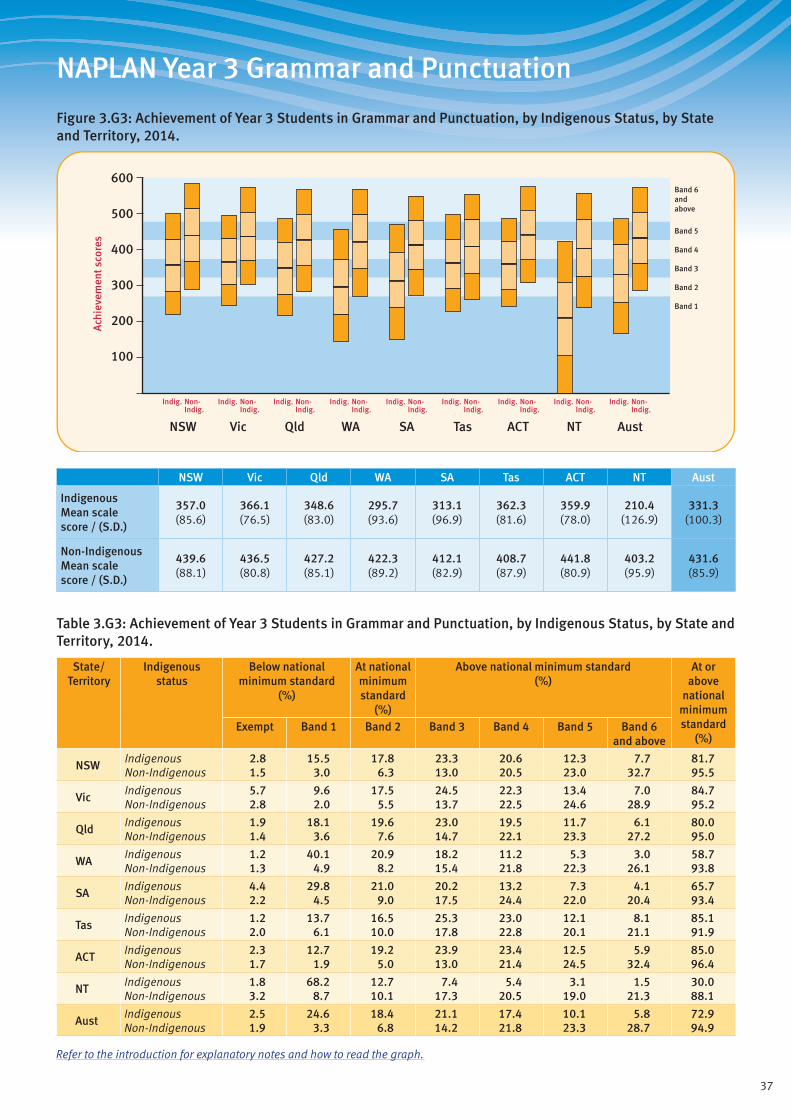
37
NAPLAN Year 3 Grammar and Punctuation
Figure 3.G3: Achievement of Year 3 Students in Grammar and Punctuation, by Indigenous Status, by State and Territory, 2014.
Band 1
Band 2
Band 3
Band 4
Band 5
Band 6andabove
600
500
400
300
200
100
Ach
ieve
men
t sco
res
ACTQld SAWA TasVicNSW NT Aust
Indig. Non-Indig.
Indig. Non-Indig.
Indig. Non-Indig.
Indig. Non-Indig.
Indig. Non-Indig.
Indig. Non-Indig.
Indig. Non-Indig.
Indig. Non-Indig.
Indig. Non-Indig.
NSW Vic Qld WA SA Tas ACT NT Aust
Indigenous Mean scale score / (S.D.)
357.0 (85.6)
366.1 (76.5)
348.6 (83.0)
295.7 (93.6)
313.1 (96.9)
362.3 (81.6)
359.9 (78.0)
210.4 (126.9)
331.3 (100.3)
Non-Indigenous Mean scale score / (S.D.)
439.6 (88.1)
436.5 (80.8)
427.2 (85.1)
422.3 (89.2)
412.1 (82.9)
408.7 (87.9)
441.8 (80.9)
403.2 (95.9)
431.6 (85.9)
Table 3.G3: Achievement of Year 3 Students in Grammar and Punctuation, by Indigenous Status, by State and Territory, 2014.
State/ Territory
Indigenous status
Below national minimum standard
(%)
At national minimum standard
(%)
Above national minimum standard (%)
At or above
national minimum standard
(%)Exempt Band 1 Band 2 Band 3 Band 4 Band 5 Band 6
and above
NSWIndigenous 2.8 15.5 17.8 23.3 20.6 12.3 7.7 81.7Non-Indigenous 1.5 3.0 6.3 13.0 20.5 23.0 32.7 95.5
VicIndigenous 5.7 9.6 17.5 24.5 22.3 13.4 7.0 84.7Non-Indigenous 2.8 2.0 5.5 13.7 22.5 24.6 28.9 95.2
QldIndigenous 1.9 18.1 19.6 23.0 19.5 11.7 6.1 80.0Non-Indigenous 1.4 3.6 7.6 14.7 22.1 23.3 27.2 95.0
WAIndigenous 1.2 40.1 20.9 18.2 11.2 5.3 3.0 58.7Non-Indigenous 1.3 4.9 8.2 15.4 21.8 22.3 26.1 93.8
SAIndigenous 4.4 29.8 21.0 20.2 13.2 7.3 4.1 65.7Non-Indigenous 2.2 4.5 9.0 17.5 24.4 22.0 20.4 93.4
TasIndigenous 1.2 13.7 16.5 25.3 23.0 12.1 8.1 85.1Non-Indigenous 2.0 6.1 10.0 17.8 22.8 20.1 21.1 91.9
ACTIndigenous 2.3 12.7 19.2 23.9 23.4 12.5 5.9 85.0Non-Indigenous 1.7 1.9 5.0 13.0 21.4 24.5 32.4 96.4
NTIndigenous 1.8 68.2 12.7 7.4 5.4 3.1 1.5 30.0Non-Indigenous 3.2 8.7 10.1 17.3 20.5 19.0 21.3 88.1
AustIndigenous 2.5 24.6 18.4 21.1 17.4 10.1 5.8 72.9Non-Indigenous 1.9 3.3 6.8 14.2 21.8 23.3 28.7 94.9
Refer to the introduction for explanatory notes and how to read the graph.
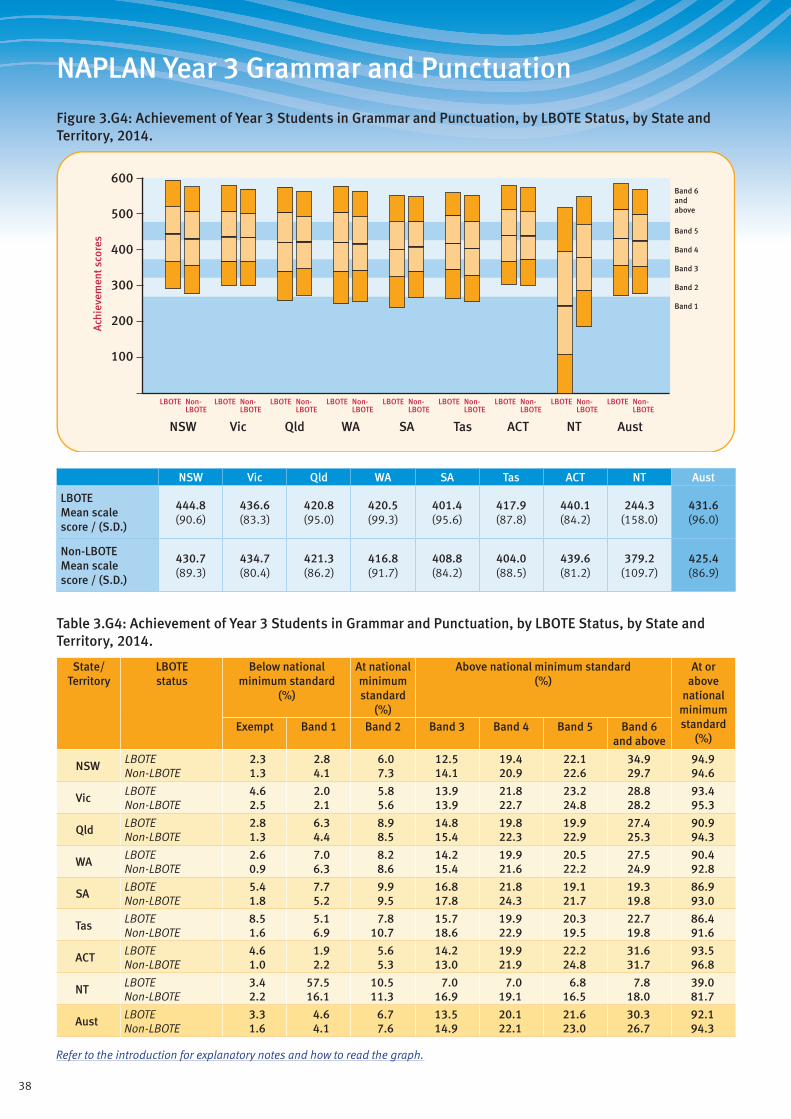
38
NAPLAN Year 3 Grammar and Punctuation
Figure 3.G4: Achievement of Year 3 Students in Grammar and Punctuation, by LBOTE Status, by State and Territory, 2014.
Band 1
Band 2
Band 3
Band 4
Band 5
Band 6andabove
600
500
400
300
200
100
Ach
ieve
men
t sco
res
ACTQld SAWA TasVicNSW NT Aust
LBOTE Non-LBOTE
LBOTE Non-LBOTE
LBOTE Non-LBOTE
LBOTE Non-LBOTE
LBOTE Non-LBOTE
LBOTE Non-LBOTE
LBOTE Non-LBOTE
LBOTE Non-LBOTE
LBOTE Non-LBOTE
NSW Vic Qld WA SA Tas ACT NT Aust
LBOTE Mean scale score / (S.D.)
444.8 (90.6)
436.6 (83.3)
420.8 (95.0)
420.5 (99.3)
401.4 (95.6)
417.9 (87.8)
440.1 (84.2)
244.3 (158.0)
431.6 (96.0)
Non-LBOTE Mean scale score / (S.D.)
430.7 (89.3)
434.7 (80.4)
421.3 (86.2)
416.8 (91.7)
408.8 (84.2)
404.0 (88.5)
439.6 (81.2)
379.2 (109.7)
425.4 (86.9)
Table 3.G4: Achievement of Year 3 Students in Grammar and Punctuation, by LBOTE Status, by State and Territory, 2014.
State/ Territory
LBOTE status
Below national minimum standard
(%)
At national minimum standard
(%)
Above national minimum standard (%)
At or above
national minimum standard
(%)Exempt Band 1 Band 2 Band 3 Band 4 Band 5 Band 6
and above
NSWLBOTE 2.3 2.8 6.0 12.5 19.4 22.1 34.9 94.9Non-LBOTE 1.3 4.1 7.3 14.1 20.9 22.6 29.7 94.6
VicLBOTE 4.6 2.0 5.8 13.9 21.8 23.2 28.8 93.4Non-LBOTE 2.5 2.1 5.6 13.9 22.7 24.8 28.2 95.3
QldLBOTE 2.8 6.3 8.9 14.8 19.8 19.9 27.4 90.9Non-LBOTE 1.3 4.4 8.5 15.4 22.3 22.9 25.3 94.3
WALBOTE 2.6 7.0 8.2 14.2 19.9 20.5 27.5 90.4Non-LBOTE 0.9 6.3 8.6 15.4 21.6 22.2 24.9 92.8
SALBOTE 5.4 7.7 9.9 16.8 21.8 19.1 19.3 86.9Non-LBOTE 1.8 5.2 9.5 17.8 24.3 21.7 19.8 93.0
TasLBOTE 8.5 5.1 7.8 15.7 19.9 20.3 22.7 86.4Non-LBOTE 1.6 6.9 10.7 18.6 22.9 19.5 19.8 91.6
ACTLBOTE 4.6 1.9 5.6 14.2 19.9 22.2 31.6 93.5Non-LBOTE 1.0 2.2 5.3 13.0 21.9 24.8 31.7 96.8
NTLBOTE 3.4 57.5 10.5 7.0 7.0 6.8 7.8 39.0Non-LBOTE 2.2 16.1 11.3 16.9 19.1 16.5 18.0 81.7
AustLBOTE 3.3 4.6 6.7 13.5 20.1 21.6 30.3 92.1Non-LBOTE 1.6 4.1 7.6 14.9 22.1 23.0 26.7 94.3
Refer to the introduction for explanatory notes and how to read the graph.
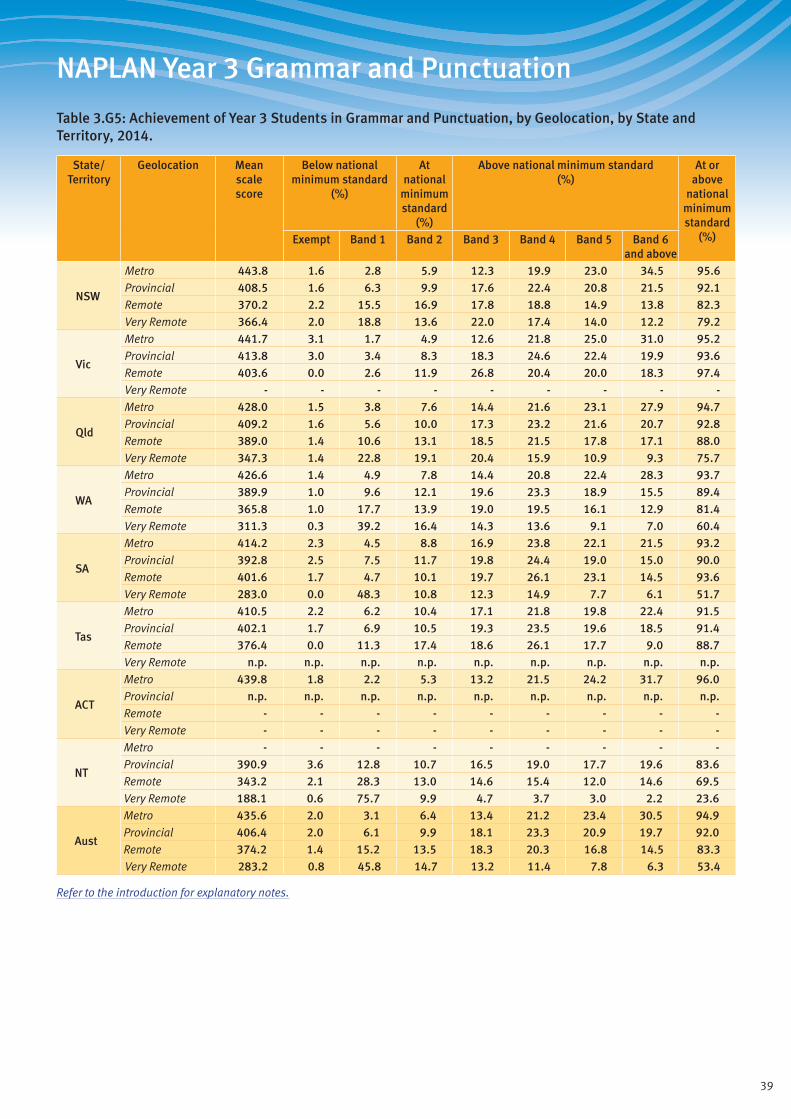
39
NAPLAN Year 3 Grammar and Punctuation
Table 3.G5: Achievement of Year 3 Students in Grammar and Punctuation, by Geolocation, by State and Territory, 2014.
State/ Territory
Geolocation Mean scale score
Below national minimum standard
(%)
At national
minimum standard
(%)
Above national minimum standard (%)
At or above
national minimum standard
(%)Exempt Band 1 Band 2 Band 3 Band 4 Band 5 Band 6 and above
NSW
Metro 443.8 1.6 2.8 5.9 12.3 19.9 23.0 34.5 95.6Provincial 408.5 1.6 6.3 9.9 17.6 22.4 20.8 21.5 92.1Remote 370.2 2.2 15.5 16.9 17.8 18.8 14.9 13.8 82.3Very Remote 366.4 2.0 18.8 13.6 22.0 17.4 14.0 12.2 79.2
Vic
Metro 441.7 3.1 1.7 4.9 12.6 21.8 25.0 31.0 95.2Provincial 413.8 3.0 3.4 8.3 18.3 24.6 22.4 19.9 93.6Remote 403.6 0.0 2.6 11.9 26.8 20.4 20.0 18.3 97.4Very Remote - - - - - - - - -
Qld
Metro 428.0 1.5 3.8 7.6 14.4 21.6 23.1 27.9 94.7Provincial 409.2 1.6 5.6 10.0 17.3 23.2 21.6 20.7 92.8Remote 389.0 1.4 10.6 13.1 18.5 21.5 17.8 17.1 88.0Very Remote 347.3 1.4 22.8 19.1 20.4 15.9 10.9 9.3 75.7
WA
Metro 426.6 1.4 4.9 7.8 14.4 20.8 22.4 28.3 93.7Provincial 389.9 1.0 9.6 12.1 19.6 23.3 18.9 15.5 89.4Remote 365.8 1.0 17.7 13.9 19.0 19.5 16.1 12.9 81.4Very Remote 311.3 0.3 39.2 16.4 14.3 13.6 9.1 7.0 60.4
SA
Metro 414.2 2.3 4.5 8.8 16.9 23.8 22.1 21.5 93.2Provincial 392.8 2.5 7.5 11.7 19.8 24.4 19.0 15.0 90.0Remote 401.6 1.7 4.7 10.1 19.7 26.1 23.1 14.5 93.6Very Remote 283.0 0.0 48.3 10.8 12.3 14.9 7.7 6.1 51.7
Tas
Metro 410.5 2.2 6.2 10.4 17.1 21.8 19.8 22.4 91.5Provincial 402.1 1.7 6.9 10.5 19.3 23.5 19.6 18.5 91.4Remote 376.4 0.0 11.3 17.4 18.6 26.1 17.7 9.0 88.7Very Remote n.p. n.p. n.p. n.p. n.p. n.p. n.p. n.p. n.p.
ACT
Metro 439.8 1.8 2.2 5.3 13.2 21.5 24.2 31.7 96.0Provincial n.p. n.p. n.p. n.p. n.p. n.p. n.p. n.p. n.p.Remote - - - - - - - - -Very Remote - - - - - - - - -
NT
Metro - - - - - - - - -Provincial 390.9 3.6 12.8 10.7 16.5 19.0 17.7 19.6 83.6Remote 343.2 2.1 28.3 13.0 14.6 15.4 12.0 14.6 69.5Very Remote 188.1 0.6 75.7 9.9 4.7 3.7 3.0 2.2 23.6
Aust
Metro 435.6 2.0 3.1 6.4 13.4 21.2 23.4 30.5 94.9Provincial 406.4 2.0 6.1 9.9 18.1 23.3 20.9 19.7 92.0Remote 374.2 1.4 15.2 13.5 18.3 20.3 16.8 14.5 83.3Very Remote 283.2 0.8 45.8 14.7 13.2 11.4 7.8 6.3 53.4
Refer to the introduction for explanatory notes.
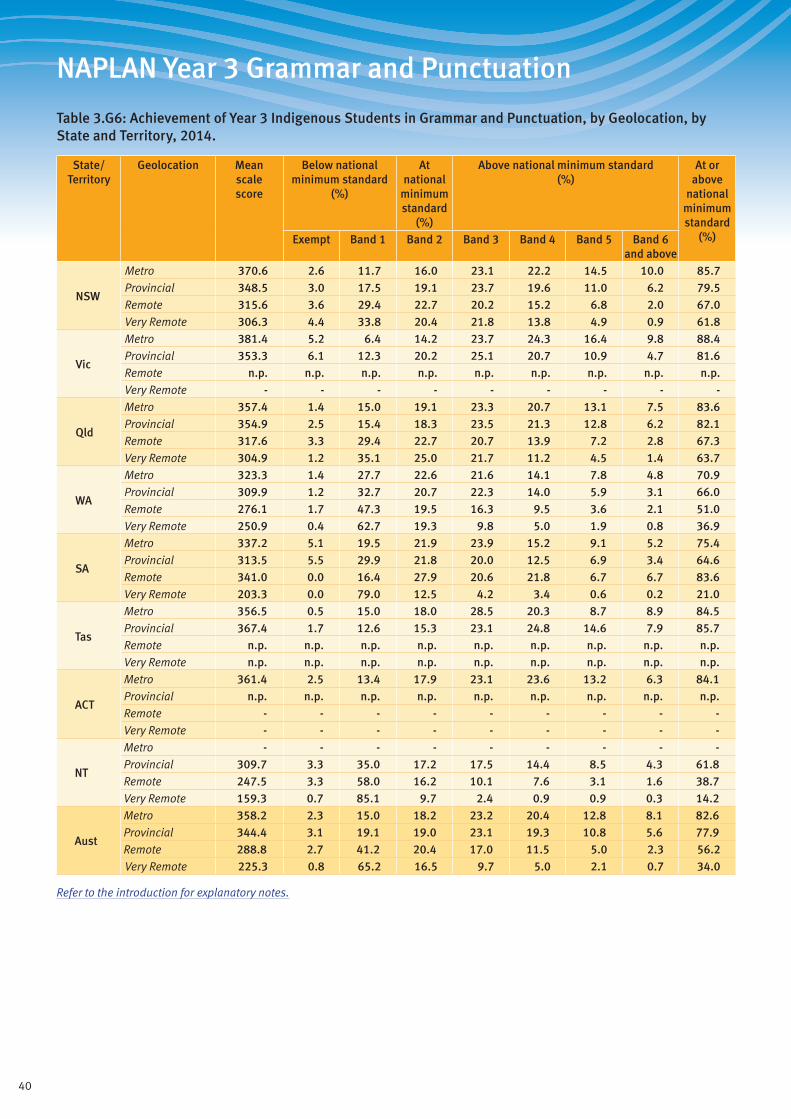
40
NAPLAN Year 3 Grammar and Punctuation
Table 3.G6: Achievement of Year 3 Indigenous Students in Grammar and Punctuation, by Geolocation, by State and Territory, 2014.
State/ Territory
Geolocation Mean scale score
Below national minimum standard
(%)
At national
minimum standard
(%)
Above national minimum standard (%)
At or above
national minimum standard
(%)Exempt Band 1 Band 2 Band 3 Band 4 Band 5 Band 6 and above
NSW
Metro 370.6 2.6 11.7 16.0 23.1 22.2 14.5 10.0 85.7Provincial 348.5 3.0 17.5 19.1 23.7 19.6 11.0 6.2 79.5Remote 315.6 3.6 29.4 22.7 20.2 15.2 6.8 2.0 67.0Very Remote 306.3 4.4 33.8 20.4 21.8 13.8 4.9 0.9 61.8
Vic
Metro 381.4 5.2 6.4 14.2 23.7 24.3 16.4 9.8 88.4Provincial 353.3 6.1 12.3 20.2 25.1 20.7 10.9 4.7 81.6Remote n.p. n.p. n.p. n.p. n.p. n.p. n.p. n.p. n.p.Very Remote - - - - - - - - -
Qld
Metro 357.4 1.4 15.0 19.1 23.3 20.7 13.1 7.5 83.6Provincial 354.9 2.5 15.4 18.3 23.5 21.3 12.8 6.2 82.1Remote 317.6 3.3 29.4 22.7 20.7 13.9 7.2 2.8 67.3Very Remote 304.9 1.2 35.1 25.0 21.7 11.2 4.5 1.4 63.7
WA
Metro 323.3 1.4 27.7 22.6 21.6 14.1 7.8 4.8 70.9Provincial 309.9 1.2 32.7 20.7 22.3 14.0 5.9 3.1 66.0Remote 276.1 1.7 47.3 19.5 16.3 9.5 3.6 2.1 51.0Very Remote 250.9 0.4 62.7 19.3 9.8 5.0 1.9 0.8 36.9
SA
Metro 337.2 5.1 19.5 21.9 23.9 15.2 9.1 5.2 75.4Provincial 313.5 5.5 29.9 21.8 20.0 12.5 6.9 3.4 64.6Remote 341.0 0.0 16.4 27.9 20.6 21.8 6.7 6.7 83.6Very Remote 203.3 0.0 79.0 12.5 4.2 3.4 0.6 0.2 21.0
Tas
Metro 356.5 0.5 15.0 18.0 28.5 20.3 8.7 8.9 84.5Provincial 367.4 1.7 12.6 15.3 23.1 24.8 14.6 7.9 85.7Remote n.p. n.p. n.p. n.p. n.p. n.p. n.p. n.p. n.p.Very Remote n.p. n.p. n.p. n.p. n.p. n.p. n.p. n.p. n.p.
ACT
Metro 361.4 2.5 13.4 17.9 23.1 23.6 13.2 6.3 84.1Provincial n.p. n.p. n.p. n.p. n.p. n.p. n.p. n.p. n.p.Remote - - - - - - - - -Very Remote - - - - - - - - -
NT
Metro - - - - - - - - -Provincial 309.7 3.3 35.0 17.2 17.5 14.4 8.5 4.3 61.8Remote 247.5 3.3 58.0 16.2 10.1 7.6 3.1 1.6 38.7Very Remote 159.3 0.7 85.1 9.7 2.4 0.9 0.9 0.3 14.2
Aust
Metro 358.2 2.3 15.0 18.2 23.2 20.4 12.8 8.1 82.6Provincial 344.4 3.1 19.1 19.0 23.1 19.3 10.8 5.6 77.9Remote 288.8 2.7 41.2 20.4 17.0 11.5 5.0 2.3 56.2Very Remote 225.3 0.8 65.2 16.5 9.7 5.0 2.1 0.7 34.0
Refer to the introduction for explanatory notes.
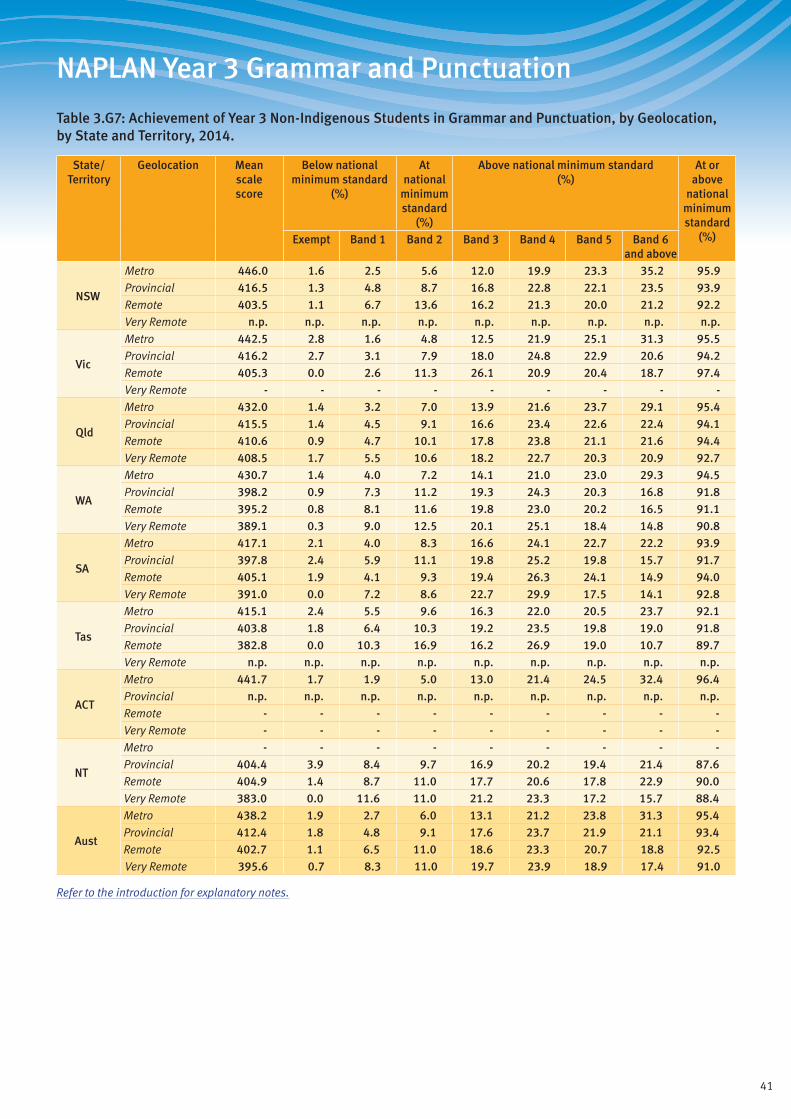
41
NAPLAN Year 3 Grammar and Punctuation
Table 3.G7: Achievement of Year 3 Non-Indigenous Students in Grammar and Punctuation, by Geolocation, by State and Territory, 2014.
State/ Territory
Geolocation Mean scale score
Below national minimum standard
(%)
At national
minimum standard
(%)
Above national minimum standard (%)
At or above
national minimum standard
(%)Exempt Band 1 Band 2 Band 3 Band 4 Band 5 Band 6 and above
NSW
Metro 446.0 1.6 2.5 5.6 12.0 19.9 23.3 35.2 95.9Provincial 416.5 1.3 4.8 8.7 16.8 22.8 22.1 23.5 93.9Remote 403.5 1.1 6.7 13.6 16.2 21.3 20.0 21.2 92.2Very Remote n.p. n.p. n.p. n.p. n.p. n.p. n.p. n.p. n.p.
Vic
Metro 442.5 2.8 1.6 4.8 12.5 21.9 25.1 31.3 95.5Provincial 416.2 2.7 3.1 7.9 18.0 24.8 22.9 20.6 94.2Remote 405.3 0.0 2.6 11.3 26.1 20.9 20.4 18.7 97.4Very Remote - - - - - - - - -
Qld
Metro 432.0 1.4 3.2 7.0 13.9 21.6 23.7 29.1 95.4Provincial 415.5 1.4 4.5 9.1 16.6 23.4 22.6 22.4 94.1Remote 410.6 0.9 4.7 10.1 17.8 23.8 21.1 21.6 94.4Very Remote 408.5 1.7 5.5 10.6 18.2 22.7 20.3 20.9 92.7
WA
Metro 430.7 1.4 4.0 7.2 14.1 21.0 23.0 29.3 94.5Provincial 398.2 0.9 7.3 11.2 19.3 24.3 20.3 16.8 91.8Remote 395.2 0.8 8.1 11.6 19.8 23.0 20.2 16.5 91.1Very Remote 389.1 0.3 9.0 12.5 20.1 25.1 18.4 14.8 90.8
SA
Metro 417.1 2.1 4.0 8.3 16.6 24.1 22.7 22.2 93.9Provincial 397.8 2.4 5.9 11.1 19.8 25.2 19.8 15.7 91.7Remote 405.1 1.9 4.1 9.3 19.4 26.3 24.1 14.9 94.0Very Remote 391.0 0.0 7.2 8.6 22.7 29.9 17.5 14.1 92.8
Tas
Metro 415.1 2.4 5.5 9.6 16.3 22.0 20.5 23.7 92.1Provincial 403.8 1.8 6.4 10.3 19.2 23.5 19.8 19.0 91.8Remote 382.8 0.0 10.3 16.9 16.2 26.9 19.0 10.7 89.7Very Remote n.p. n.p. n.p. n.p. n.p. n.p. n.p. n.p. n.p.
ACT
Metro 441.7 1.7 1.9 5.0 13.0 21.4 24.5 32.4 96.4Provincial n.p. n.p. n.p. n.p. n.p. n.p. n.p. n.p. n.p.Remote - - - - - - - - -Very Remote - - - - - - - - -
NT
Metro - - - - - - - - -Provincial 404.4 3.9 8.4 9.7 16.9 20.2 19.4 21.4 87.6Remote 404.9 1.4 8.7 11.0 17.7 20.6 17.8 22.9 90.0Very Remote 383.0 0.0 11.6 11.0 21.2 23.3 17.2 15.7 88.4
Aust
Metro 438.2 1.9 2.7 6.0 13.1 21.2 23.8 31.3 95.4Provincial 412.4 1.8 4.8 9.1 17.6 23.7 21.9 21.1 93.4Remote 402.7 1.1 6.5 11.0 18.6 23.3 20.7 18.8 92.5Very Remote 395.6 0.7 8.3 11.0 19.7 23.9 18.9 17.4 91.0
Refer to the introduction for explanatory notes.
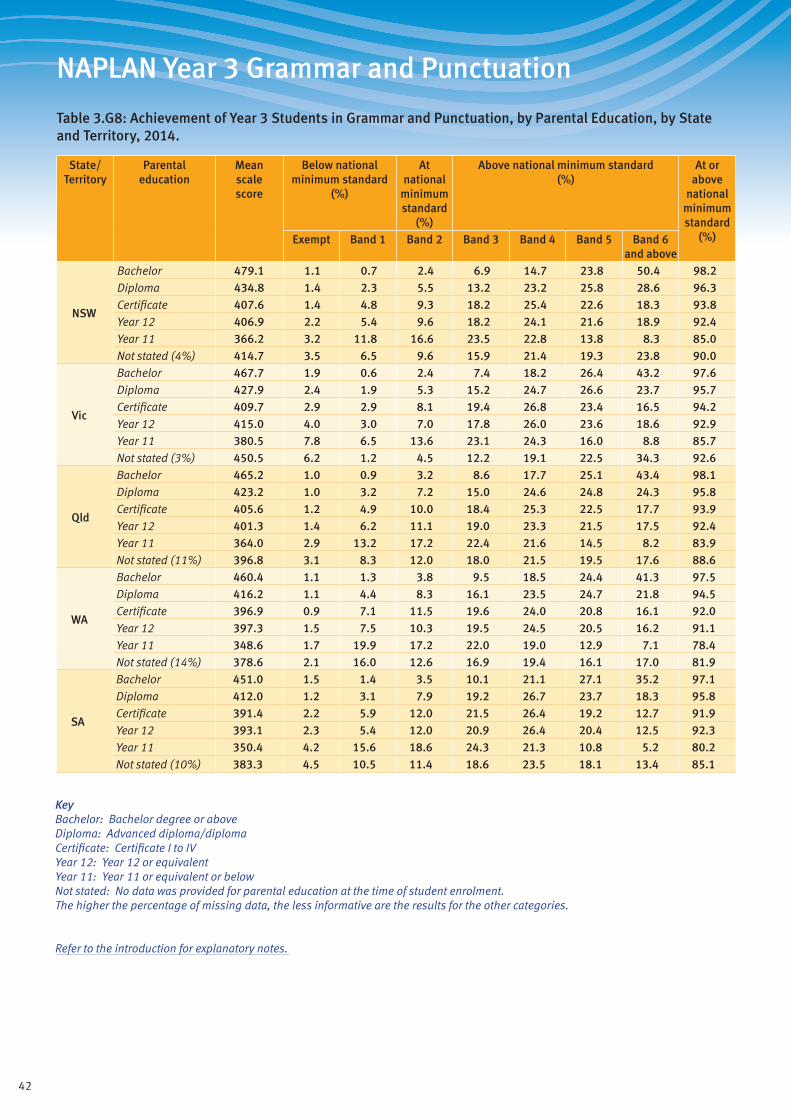
42
NAPLAN Year 3 Grammar and Punctuation
Table 3.G8: Achievement of Year 3 Students in Grammar and Punctuation, by Parental Education, by State and Territory, 2014.
State/ Territory
Parental education
Mean scale score
Below national minimum standard
(%)
At national
minimum standard
(%)
Above national minimum standard (%)
At or above
national minimum standard
(%)Exempt Band 1 Band 2 Band 3 Band 4 Band 5 Band 6 and above
NSW
Bachelor 479.1 1.1 0.7 2.4 6.9 14.7 23.8 50.4 98.2Diploma 434.8 1.4 2.3 5.5 13.2 23.2 25.8 28.6 96.3Certificate 407.6 1.4 4.8 9.3 18.2 25.4 22.6 18.3 93.8Year 12 406.9 2.2 5.4 9.6 18.2 24.1 21.6 18.9 92.4Year 11 366.2 3.2 11.8 16.6 23.5 22.8 13.8 8.3 85.0Not stated (4%) 414.7 3.5 6.5 9.6 15.9 21.4 19.3 23.8 90.0
Vic
Bachelor 467.7 1.9 0.6 2.4 7.4 18.2 26.4 43.2 97.6Diploma 427.9 2.4 1.9 5.3 15.2 24.7 26.6 23.7 95.7Certificate 409.7 2.9 2.9 8.1 19.4 26.8 23.4 16.5 94.2Year 12 415.0 4.0 3.0 7.0 17.8 26.0 23.6 18.6 92.9Year 11 380.5 7.8 6.5 13.6 23.1 24.3 16.0 8.8 85.7Not stated (3%) 450.5 6.2 1.2 4.5 12.2 19.1 22.5 34.3 92.6
Qld
Bachelor 465.2 1.0 0.9 3.2 8.6 17.7 25.1 43.4 98.1Diploma 423.2 1.0 3.2 7.2 15.0 24.6 24.8 24.3 95.8Certificate 405.6 1.2 4.9 10.0 18.4 25.3 22.5 17.7 93.9Year 12 401.3 1.4 6.2 11.1 19.0 23.3 21.5 17.5 92.4Year 11 364.0 2.9 13.2 17.2 22.4 21.6 14.5 8.2 83.9Not stated (11%) 396.8 3.1 8.3 12.0 18.0 21.5 19.5 17.6 88.6
WA
Bachelor 460.4 1.1 1.3 3.8 9.5 18.5 24.4 41.3 97.5Diploma 416.2 1.1 4.4 8.3 16.1 23.5 24.7 21.8 94.5Certificate 396.9 0.9 7.1 11.5 19.6 24.0 20.8 16.1 92.0Year 12 397.3 1.5 7.5 10.3 19.5 24.5 20.5 16.2 91.1Year 11 348.6 1.7 19.9 17.2 22.0 19.0 12.9 7.1 78.4Not stated (14%) 378.6 2.1 16.0 12.6 16.9 19.4 16.1 17.0 81.9
SA
Bachelor 451.0 1.5 1.4 3.5 10.1 21.1 27.1 35.2 97.1Diploma 412.0 1.2 3.1 7.9 19.2 26.7 23.7 18.3 95.8Certificate 391.4 2.2 5.9 12.0 21.5 26.4 19.2 12.7 91.9Year 12 393.1 2.3 5.4 12.0 20.9 26.4 20.4 12.5 92.3Year 11 350.4 4.2 15.6 18.6 24.3 21.3 10.8 5.2 80.2Not stated (10%) 383.3 4.5 10.5 11.4 18.6 23.5 18.1 13.4 85.1
KeyBachelor: Bachelor degree or aboveDiploma: Advanced diploma/diplomaCertificate: Certificate I to IVYear 12: Year 12 or equivalentYear 11: Year 11 or equivalent or belowNot stated: No data was provided for parental education at the time of student enrolment. The higher the percentage of missing data, the less informative are the results for the other categories.
Refer to the introduction for explanatory notes.
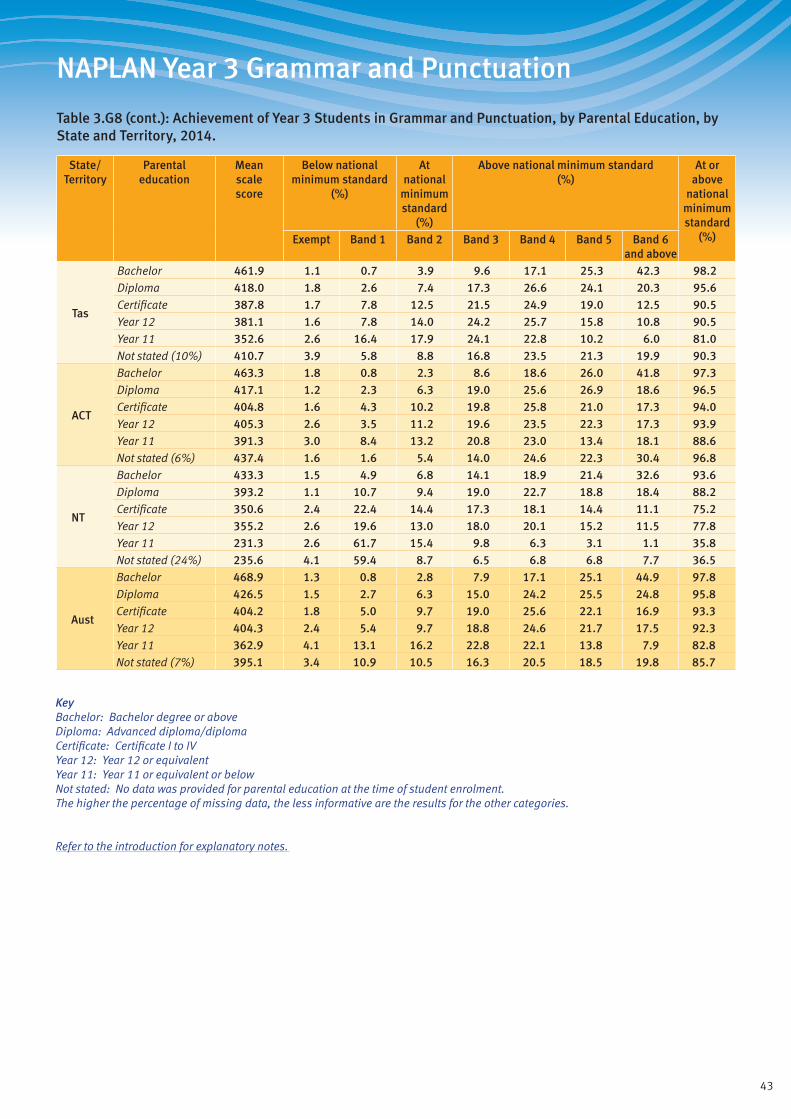
43
NAPLAN Year 3 Grammar and Punctuation
Table 3.G8 (cont.): Achievement of Year 3 Students in Grammar and Punctuation, by Parental Education, by State and Territory, 2014.
State/ Territory
Parental education
Mean scale score
Below national minimum standard
(%)
At national
minimum standard
(%)
Above national minimum standard (%)
At or above
national minimum standard
(%)Exempt Band 1 Band 2 Band 3 Band 4 Band 5 Band 6 and above
Tas
Bachelor 461.9 1.1 0.7 3.9 9.6 17.1 25.3 42.3 98.2Diploma 418.0 1.8 2.6 7.4 17.3 26.6 24.1 20.3 95.6Certificate 387.8 1.7 7.8 12.5 21.5 24.9 19.0 12.5 90.5Year 12 381.1 1.6 7.8 14.0 24.2 25.7 15.8 10.8 90.5Year 11 352.6 2.6 16.4 17.9 24.1 22.8 10.2 6.0 81.0Not stated (10%) 410.7 3.9 5.8 8.8 16.8 23.5 21.3 19.9 90.3
ACT
Bachelor 463.3 1.8 0.8 2.3 8.6 18.6 26.0 41.8 97.3Diploma 417.1 1.2 2.3 6.3 19.0 25.6 26.9 18.6 96.5Certificate 404.8 1.6 4.3 10.2 19.8 25.8 21.0 17.3 94.0Year 12 405.3 2.6 3.5 11.2 19.6 23.5 22.3 17.3 93.9Year 11 391.3 3.0 8.4 13.2 20.8 23.0 13.4 18.1 88.6Not stated (6%) 437.4 1.6 1.6 5.4 14.0 24.6 22.3 30.4 96.8
NT
Bachelor 433.3 1.5 4.9 6.8 14.1 18.9 21.4 32.6 93.6Diploma 393.2 1.1 10.7 9.4 19.0 22.7 18.8 18.4 88.2Certificate 350.6 2.4 22.4 14.4 17.3 18.1 14.4 11.1 75.2Year 12 355.2 2.6 19.6 13.0 18.0 20.1 15.2 11.5 77.8Year 11 231.3 2.6 61.7 15.4 9.8 6.3 3.1 1.1 35.8Not stated (24%) 235.6 4.1 59.4 8.7 6.5 6.8 6.8 7.7 36.5
Aust
Bachelor 468.9 1.3 0.8 2.8 7.9 17.1 25.1 44.9 97.8Diploma 426.5 1.5 2.7 6.3 15.0 24.2 25.5 24.8 95.8Certificate 404.2 1.8 5.0 9.7 19.0 25.6 22.1 16.9 93.3Year 12 404.3 2.4 5.4 9.7 18.8 24.6 21.7 17.5 92.3Year 11 362.9 4.1 13.1 16.2 22.8 22.1 13.8 7.9 82.8Not stated (7%) 395.1 3.4 10.9 10.5 16.3 20.5 18.5 19.8 85.7
KeyBachelor: Bachelor degree or aboveDiploma: Advanced diploma/diplomaCertificate: Certificate I to IVYear 12: Year 12 or equivalentYear 11: Year 11 or equivalent or belowNot stated: No data was provided for parental education at the time of student enrolment. The higher the percentage of missing data, the less informative are the results for the other categories.
Refer to the introduction for explanatory notes.
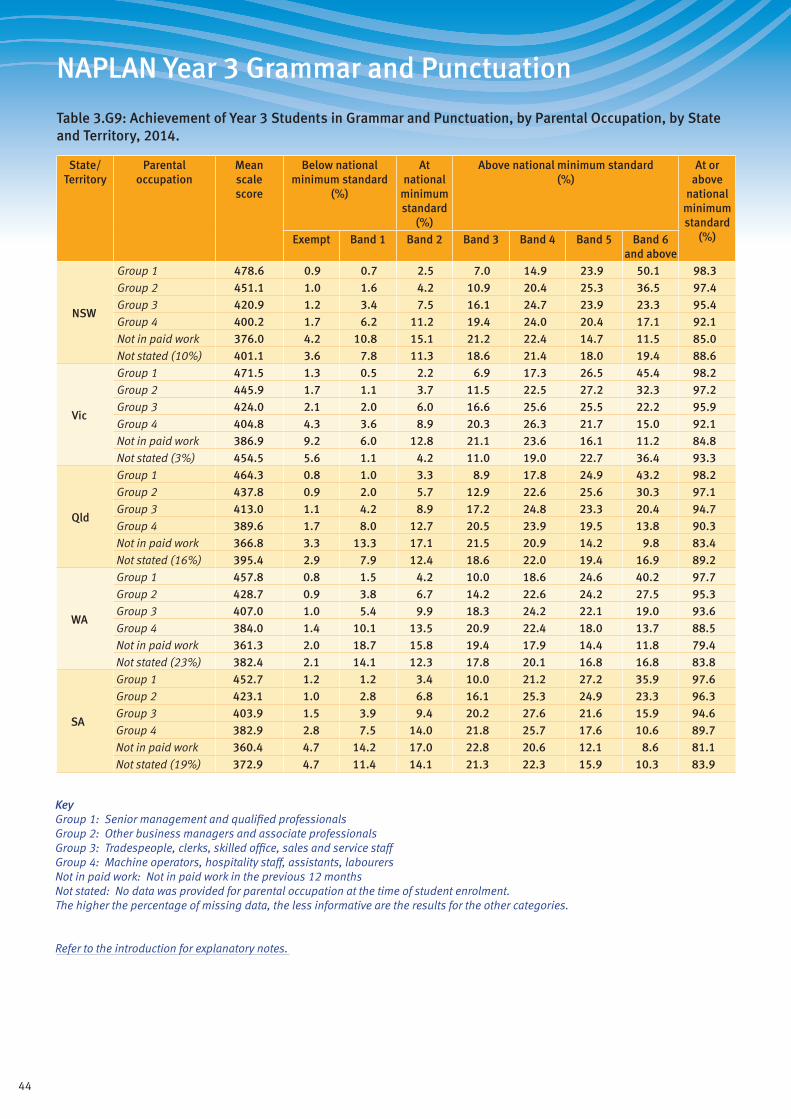
44
NAPLAN Year 3 Grammar and Punctuation
Table 3.G9: Achievement of Year 3 Students in Grammar and Punctuation, by Parental Occupation, by State and Territory, 2014.
State/ Territory
Parental occupation
Mean scale score
Below national minimum standard
(%)
At national
minimum standard
(%)
Above national minimum standard (%)
At or above
national minimum standard
(%)Exempt Band 1 Band 2 Band 3 Band 4 Band 5 Band 6 and above
NSW
Group 1 478.6 0.9 0.7 2.5 7.0 14.9 23.9 50.1 98.3Group 2 451.1 1.0 1.6 4.2 10.9 20.4 25.3 36.5 97.4Group 3 420.9 1.2 3.4 7.5 16.1 24.7 23.9 23.3 95.4Group 4 400.2 1.7 6.2 11.2 19.4 24.0 20.4 17.1 92.1Not in paid work 376.0 4.2 10.8 15.1 21.2 22.4 14.7 11.5 85.0Not stated (10%) 401.1 3.6 7.8 11.3 18.6 21.4 18.0 19.4 88.6
Vic
Group 1 471.5 1.3 0.5 2.2 6.9 17.3 26.5 45.4 98.2Group 2 445.9 1.7 1.1 3.7 11.5 22.5 27.2 32.3 97.2Group 3 424.0 2.1 2.0 6.0 16.6 25.6 25.5 22.2 95.9Group 4 404.8 4.3 3.6 8.9 20.3 26.3 21.7 15.0 92.1Not in paid work 386.9 9.2 6.0 12.8 21.1 23.6 16.1 11.2 84.8Not stated (3%) 454.5 5.6 1.1 4.2 11.0 19.0 22.7 36.4 93.3
Qld
Group 1 464.3 0.8 1.0 3.3 8.9 17.8 24.9 43.2 98.2Group 2 437.8 0.9 2.0 5.7 12.9 22.6 25.6 30.3 97.1Group 3 413.0 1.1 4.2 8.9 17.2 24.8 23.3 20.4 94.7Group 4 389.6 1.7 8.0 12.7 20.5 23.9 19.5 13.8 90.3Not in paid work 366.8 3.3 13.3 17.1 21.5 20.9 14.2 9.8 83.4Not stated (16%) 395.4 2.9 7.9 12.4 18.6 22.0 19.4 16.9 89.2
WA
Group 1 457.8 0.8 1.5 4.2 10.0 18.6 24.6 40.2 97.7Group 2 428.7 0.9 3.8 6.7 14.2 22.6 24.2 27.5 95.3Group 3 407.0 1.0 5.4 9.9 18.3 24.2 22.1 19.0 93.6Group 4 384.0 1.4 10.1 13.5 20.9 22.4 18.0 13.7 88.5Not in paid work 361.3 2.0 18.7 15.8 19.4 17.9 14.4 11.8 79.4Not stated (23%) 382.4 2.1 14.1 12.3 17.8 20.1 16.8 16.8 83.8
SA
Group 1 452.7 1.2 1.2 3.4 10.0 21.2 27.2 35.9 97.6Group 2 423.1 1.0 2.8 6.8 16.1 25.3 24.9 23.3 96.3Group 3 403.9 1.5 3.9 9.4 20.2 27.6 21.6 15.9 94.6Group 4 382.9 2.8 7.5 14.0 21.8 25.7 17.6 10.6 89.7Not in paid work 360.4 4.7 14.2 17.0 22.8 20.6 12.1 8.6 81.1Not stated (19%) 372.9 4.7 11.4 14.1 21.3 22.3 15.9 10.3 83.9
KeyGroup 1: Senior management and qualified professionalsGroup 2: Other business managers and associate professionalsGroup 3: Tradespeople, clerks, skilled office, sales and service staffGroup 4: Machine operators, hospitality staff, assistants, labourersNot in paid work: Not in paid work in the previous 12 monthsNot stated: No data was provided for parental occupation at the time of student enrolment. The higher the percentage of missing data, the less informative are the results for the other categories.
Refer to the introduction for explanatory notes.
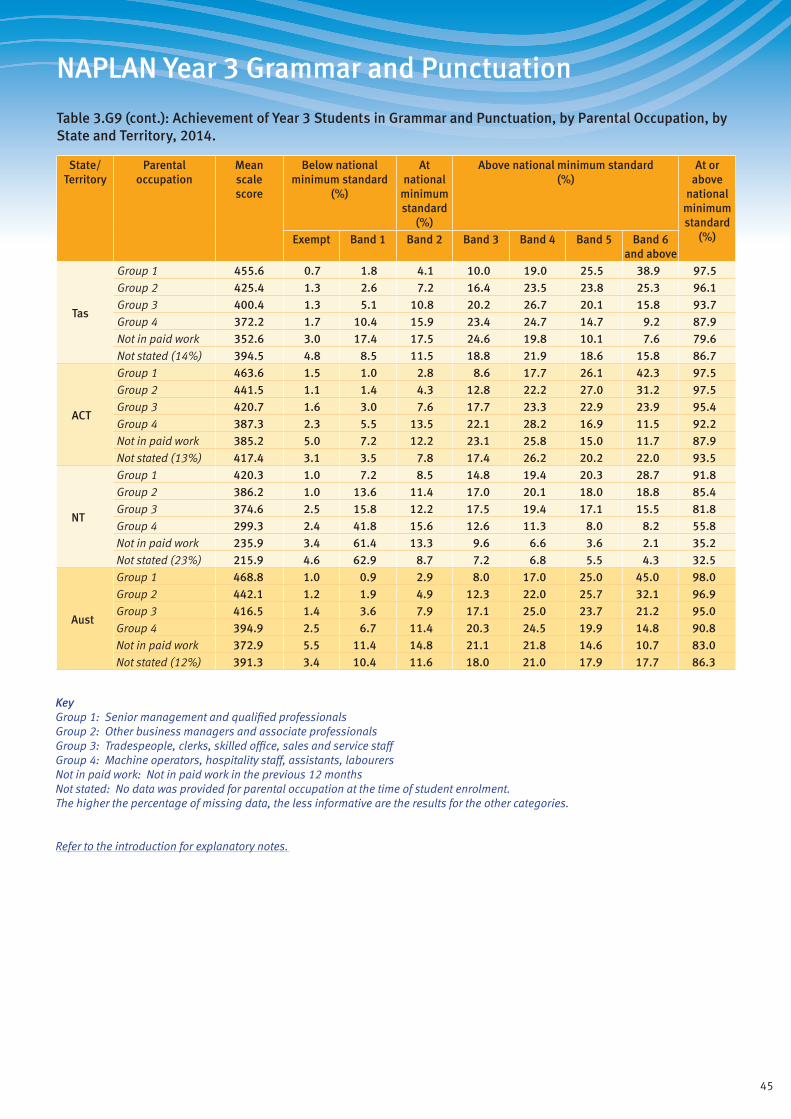
45
NAPLAN Year 3 Grammar and Punctuation
Table 3.G9 (cont.): Achievement of Year 3 Students in Grammar and Punctuation, by Parental Occupation, by State and Territory, 2014.
State/ Territory
Parental occupation
Mean scale score
Below national minimum standard
(%)
At national
minimum standard
(%)
Above national minimum standard (%)
At or above
national minimum standard
(%)Exempt Band 1 Band 2 Band 3 Band 4 Band 5 Band 6 and above
Tas
Group 1 455.6 0.7 1.8 4.1 10.0 19.0 25.5 38.9 97.5Group 2 425.4 1.3 2.6 7.2 16.4 23.5 23.8 25.3 96.1Group 3 400.4 1.3 5.1 10.8 20.2 26.7 20.1 15.8 93.7Group 4 372.2 1.7 10.4 15.9 23.4 24.7 14.7 9.2 87.9Not in paid work 352.6 3.0 17.4 17.5 24.6 19.8 10.1 7.6 79.6Not stated (14%) 394.5 4.8 8.5 11.5 18.8 21.9 18.6 15.8 86.7
ACT
Group 1 463.6 1.5 1.0 2.8 8.6 17.7 26.1 42.3 97.5Group 2 441.5 1.1 1.4 4.3 12.8 22.2 27.0 31.2 97.5Group 3 420.7 1.6 3.0 7.6 17.7 23.3 22.9 23.9 95.4Group 4 387.3 2.3 5.5 13.5 22.1 28.2 16.9 11.5 92.2Not in paid work 385.2 5.0 7.2 12.2 23.1 25.8 15.0 11.7 87.9Not stated (13%) 417.4 3.1 3.5 7.8 17.4 26.2 20.2 22.0 93.5
NT
Group 1 420.3 1.0 7.2 8.5 14.8 19.4 20.3 28.7 91.8Group 2 386.2 1.0 13.6 11.4 17.0 20.1 18.0 18.8 85.4Group 3 374.6 2.5 15.8 12.2 17.5 19.4 17.1 15.5 81.8Group 4 299.3 2.4 41.8 15.6 12.6 11.3 8.0 8.2 55.8Not in paid work 235.9 3.4 61.4 13.3 9.6 6.6 3.6 2.1 35.2Not stated (23%) 215.9 4.6 62.9 8.7 7.2 6.8 5.5 4.3 32.5
Aust
Group 1 468.8 1.0 0.9 2.9 8.0 17.0 25.0 45.0 98.0Group 2 442.1 1.2 1.9 4.9 12.3 22.0 25.7 32.1 96.9Group 3 416.5 1.4 3.6 7.9 17.1 25.0 23.7 21.2 95.0Group 4 394.9 2.5 6.7 11.4 20.3 24.5 19.9 14.8 90.8Not in paid work 372.9 5.5 11.4 14.8 21.1 21.8 14.6 10.7 83.0Not stated (12%) 391.3 3.4 10.4 11.6 18.0 21.0 17.9 17.7 86.3
KeyGroup 1: Senior management and qualified professionalsGroup 2: Other business managers and associate professionalsGroup 3: Tradespeople, clerks, skilled office, sales and service staffGroup 4: Machine operators, hospitality staff, assistants, labourersNot in paid work: Not in paid work in the previous 12 monthsNot stated: No data was provided for parental occupation at the time of student enrolment. The higher the percentage of missing data, the less informative are the results for the other categories.
Refer to the introduction for explanatory notes.
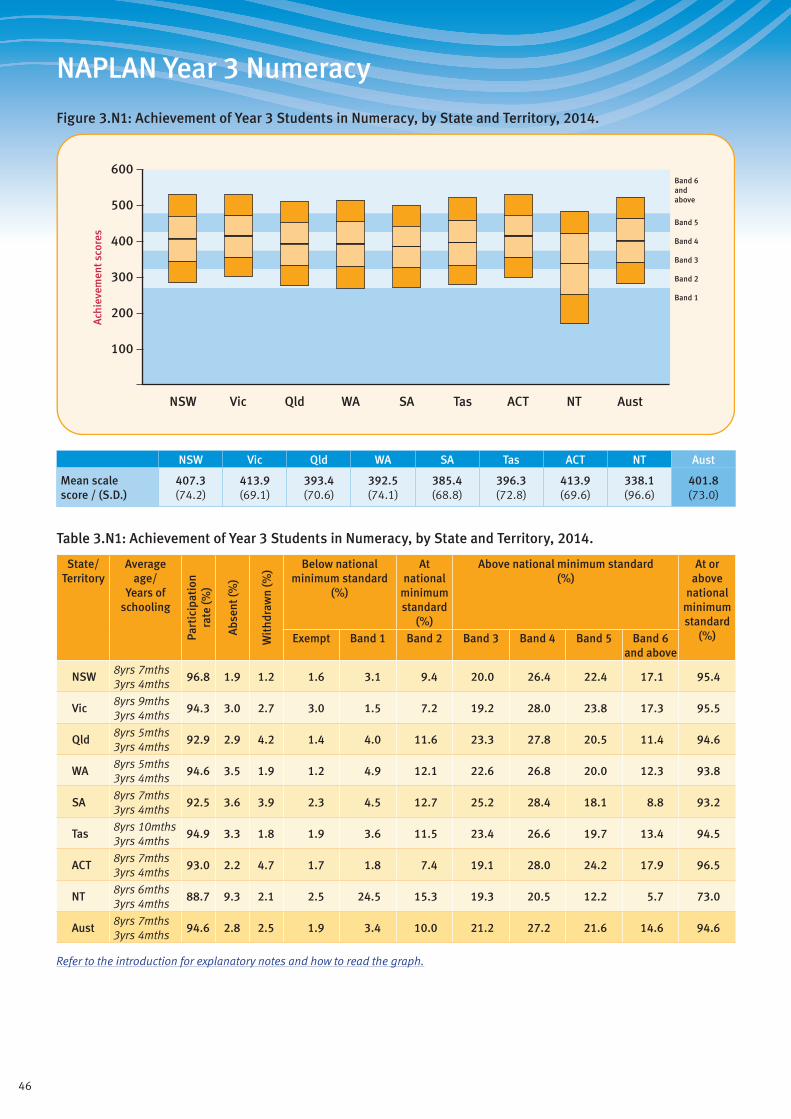
46
NAPLAN Year 3 Numeracy
Figure 3.N1: Achievement of Year 3 Students in Numeracy, by State and Territory, 2014.
Band 1
Band 2
Band 3
Band 4
Band 5
Band 6andabove
600
500
400
300
200
100
Ach
ieve
men
t sco
res
ACTQld SAWA TasVicNSW NT Aust
NSW Vic Qld WA SA Tas ACT NT Aust
Mean scale score / (S.D.)
407.3 (74.2)
413.9 (69.1)
393.4 (70.6)
392.5 (74.1)
385.4 (68.8)
396.3 (72.8)
413.9 (69.6)
338.1 (96.6)
401.8 (73.0)
Table 3.N1: Achievement of Year 3 Students in Numeracy, by State and Territory, 2014.
State/ Territory
Average age/
Years of schooling
Part
icip
atio
nra
te (%
)
Abs
ent (
%)
Wit
hdra
wn
(%) Below national
minimum standard (%)
At national
minimum standard
(%)
Above national minimum standard (%)
At or above
national minimum standard
(%)Exempt Band 1 Band 2 Band 3 Band 4 Band 5 Band 6 and above
NSW8yrs 7mths 3yrs 4mths
96.8 1.9 1.2 1.6 3.1 9.4 20.0 26.4 22.4 17.1 95.4
Vic8yrs 9mths 3yrs 4mths
94.3 3.0 2.7 3.0 1.5 7.2 19.2 28.0 23.8 17.3 95.5
Qld8yrs 5mths 3yrs 4mths
92.9 2.9 4.2 1.4 4.0 11.6 23.3 27.8 20.5 11.4 94.6
WA8yrs 5mths 3yrs 4mths
94.6 3.5 1.9 1.2 4.9 12.1 22.6 26.8 20.0 12.3 93.8
SA8yrs 7mths 3yrs 4mths
92.5 3.6 3.9 2.3 4.5 12.7 25.2 28.4 18.1 8.8 93.2
Tas8yrs 10mths 3yrs 4mths
94.9 3.3 1.8 1.9 3.6 11.5 23.4 26.6 19.7 13.4 94.5
ACT8yrs 7mths 3yrs 4mths
93.0 2.2 4.7 1.7 1.8 7.4 19.1 28.0 24.2 17.9 96.5
NT8yrs 6mths 3yrs 4mths
88.7 9.3 2.1 2.5 24.5 15.3 19.3 20.5 12.2 5.7 73.0
Aust8yrs 7mths 3yrs 4mths
94.6 2.8 2.5 1.9 3.4 10.0 21.2 27.2 21.6 14.6 94.6
Refer to the introduction for explanatory notes and how to read the graph.
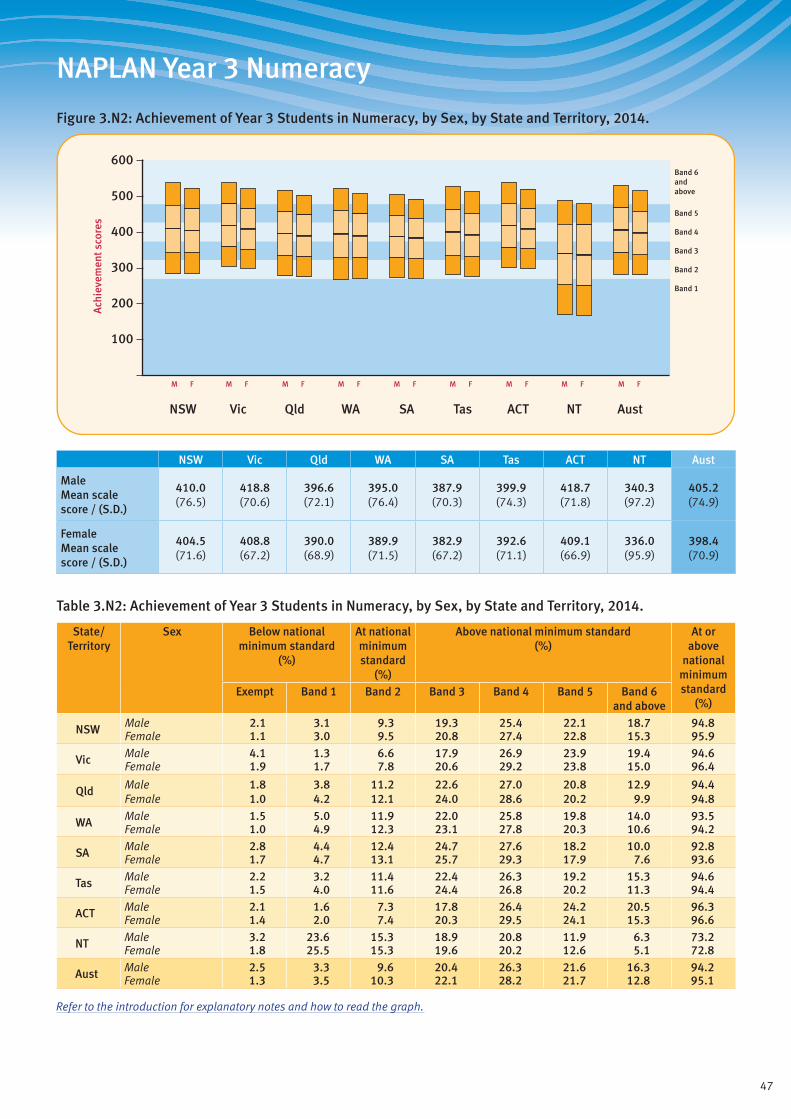
47
NAPLAN Year 3 Numeracy
Figure 3.N2: Achievement of Year 3 Students in Numeracy, by Sex, by State and Territory, 2014.
Band 1
Band 2
Band 3
Band 4
Band 5
Band 6andabove
600
500
400
300
200
100
Ach
ieve
men
t sco
res
ACTQld SAWA TasVicNSW NT Aust
M F M F M F M F M F M F M F M F M F
NSW Vic Qld WA SA Tas ACT NT Aust
Male Mean scale score / (S.D.)
410.0 (76.5)
418.8 (70.6)
396.6 (72.1)
395.0 (76.4)
387.9 (70.3)
399.9 (74.3)
418.7 (71.8)
340.3 (97.2)
405.2 (74.9)
Female Mean scale score / (S.D.)
404.5 (71.6)
408.8 (67.2)
390.0 (68.9)
389.9 (71.5)
382.9 (67.2)
392.6 (71.1)
409.1 (66.9)
336.0 (95.9)
398.4 (70.9)
Table 3.N2: Achievement of Year 3 Students in Numeracy, by Sex, by State and Territory, 2014.
State/ Territory
Sex Below national minimum standard
(%)
At national minimum standard
(%)
Above national minimum standard (%)
At or above
national minimum standard
(%)Exempt Band 1 Band 2 Band 3 Band 4 Band 5 Band 6
and above
NSW Male 2.1 3.1 9.3 19.3 25.4 22.1 18.7 94.8Female 1.1 3.0 9.5 20.8 27.4 22.8 15.3 95.9
Vic Male 4.1 1.3 6.6 17.9 26.9 23.9 19.4 94.6Female 1.9 1.7 7.8 20.6 29.2 23.8 15.0 96.4
Qld Male 1.8 3.8 11.2 22.6 27.0 20.8 12.9 94.4Female 1.0 4.2 12.1 24.0 28.6 20.2 9.9 94.8
WA Male 1.5 5.0 11.9 22.0 25.8 19.8 14.0 93.5Female 1.0 4.9 12.3 23.1 27.8 20.3 10.6 94.2
SA Male 2.8 4.4 12.4 24.7 27.6 18.2 10.0 92.8Female 1.7 4.7 13.1 25.7 29.3 17.9 7.6 93.6
Tas Male 2.2 3.2 11.4 22.4 26.3 19.2 15.3 94.6Female 1.5 4.0 11.6 24.4 26.8 20.2 11.3 94.4
ACT Male 2.1 1.6 7.3 17.8 26.4 24.2 20.5 96.3Female 1.4 2.0 7.4 20.3 29.5 24.1 15.3 96.6
NT Male 3.2 23.6 15.3 18.9 20.8 11.9 6.3 73.2Female 1.8 25.5 15.3 19.6 20.2 12.6 5.1 72.8
Aust Male 2.5 3.3 9.6 20.4 26.3 21.6 16.3 94.2Female 1.3 3.5 10.3 22.1 28.2 21.7 12.8 95.1
Refer to the introduction for explanatory notes and how to read the graph.

48
NAPLAN Year 3 Numeracy
Figure 3.N3: Achievement of Year 3 Students in Numeracy, by Indigenous Status, by State and Territory, 2014.
Band 1
Band 2
Band 3
Band 4
Band 5
Band 6andabove
600
500
400
300
200
100
Ach
ieve
men
t sco
res
ACTQld SAWA TasVicNSW NT Aust
Indig. Non-Indig.
Indig. Non-Indig.
Indig. Non-Indig.
Indig. Non-Indig.
Indig. Non-Indig.
Indig. Non-Indig.
Indig. Non-Indig.
Indig. Non-Indig.
Indig. Non-Indig.
NSW Vic Qld WA SA Tas ACT NT Aust
Indigenous Mean scale score / (S.D.)
348.1 (69.5)
365.2 (63.1)
336.0 (66.3)
310.4 (69.8)
316.4 (74.1)
365.2 (66.7)
356.1 (67.3)
260.8 (79.8)
331.5 (74.4)
Non-Indigenous Mean scale score / (S.D.)
410.6 (72.9)
414.8 (69.0)
398.1 (68.9)
399.0 (70.5)
388.9 (66.8)
398.2 (72.4)
415.2 (69.0)
388.4 (64.7)
405.9 (70.8)
Table 3.N3: Achievement of Year 3 Students in Numeracy, by Indigenous Status, by State and Territory, 2014.
State/ Territory
Indigenous status
Below national minimum standard
(%)
At national minimum standard
(%)
Above national minimum standard (%)
At or above
national minimum standard
(%)Exempt Band 1 Band 2 Band 3 Band 4 Band 5 Band 6
and above
NSWIndigenous 2.8 12.4 23.0 28.7 20.2 9.1 3.8 84.8Non-Indigenous 1.5 2.5 8.6 19.5 26.8 23.2 17.8 96.0
VicIndigenous 5.5 6.0 17.2 30.7 24.6 11.9 3.9 88.5Non-Indigenous 2.8 1.4 7.0 19.0 28.1 24.1 17.6 95.8
QldIndigenous 1.9 15.8 26.3 28.9 17.8 7.4 2.0 82.4Non-Indigenous 1.4 3.0 10.4 22.8 28.6 21.6 12.2 95.6
WAIndigenous 1.2 28.3 29.1 24.3 11.6 4.2 1.3 70.5Non-Indigenous 1.2 3.1 10.7 22.4 28.0 21.3 13.2 95.6
SAIndigenous 4.6 23.8 28.2 23.3 13.9 4.5 1.7 71.7Non-Indigenous 2.1 3.5 12.0 25.2 29.2 18.8 9.2 94.3
TasIndigenous 1.2 6.3 19.5 31.0 24.5 11.7 5.7 92.5Non-Indigenous 2.0 3.4 10.9 22.9 26.9 20.3 13.6 94.6
ACTIndigenous 2.3 9.5 21.3 29.1 24.2 9.5 4.1 88.1Non-Indigenous 1.7 1.6 7.1 18.8 28.0 24.5 18.3 96.7
NTIndigenous 1.8 55.3 22.3 12.0 6.5 1.8 0.4 43.0Non-Indigenous 3.2 3.7 10.9 25.1 30.4 18.7 8.0 93.2
AustIndigenous 2.4 19.3 24.5 26.6 17.2 7.3 2.6 78.2Non-Indigenous 1.8 2.5 9.1 20.9 27.9 22.5 15.3 95.7
Refer to the introduction for explanatory notes and how to read the graph.
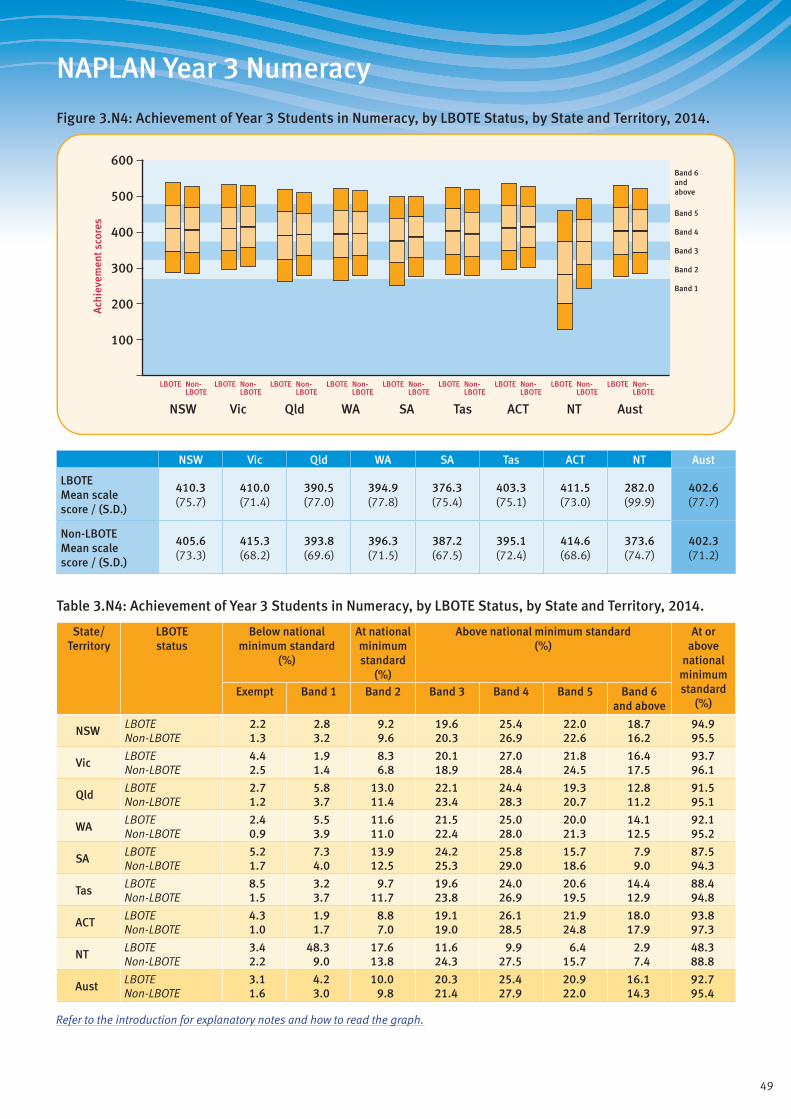
49
NAPLAN Year 3 Numeracy
Figure 3.N4: Achievement of Year 3 Students in Numeracy, by LBOTE Status, by State and Territory, 2014.
Band 1
Band 2
Band 3
Band 4
Band 5
Band 6andabove
600
500
400
300
200
100
Ach
ieve
men
t sco
res
ACTQld SAWA TasVicNSW NT Aust
LBOTE Non-LBOTE
LBOTE Non-LBOTE
LBOTE Non-LBOTE
LBOTE Non-LBOTE
LBOTE Non-LBOTE
LBOTE Non-LBOTE
LBOTE Non-LBOTE
LBOTE Non-LBOTE
LBOTE Non-LBOTE
NSW Vic Qld WA SA Tas ACT NT Aust
LBOTE Mean scale score / (S.D.)
410.3 (75.7)
410.0 (71.4)
390.5 (77.0)
394.9 (77.8)
376.3 (75.4)
403.3 (75.1)
411.5 (73.0)
282.0 (99.9)
402.6 (77.7)
Non-LBOTE Mean scale score / (S.D.)
405.6 (73.3)
415.3 (68.2)
393.8 (69.6)
396.3 (71.5)
387.2 (67.5)
395.1 (72.4)
414.6 (68.6)
373.6 (74.7)
402.3 (71.2)
Table 3.N4: Achievement of Year 3 Students in Numeracy, by LBOTE Status, by State and Territory, 2014.
State/ Territory
LBOTE status
Below national minimum standard
(%)
At national minimum standard
(%)
Above national minimum standard (%)
At or above
national minimum standard
(%)Exempt Band 1 Band 2 Band 3 Band 4 Band 5 Band 6
and above
NSWLBOTE 2.2 2.8 9.2 19.6 25.4 22.0 18.7 94.9Non-LBOTE 1.3 3.2 9.6 20.3 26.9 22.6 16.2 95.5
VicLBOTE 4.4 1.9 8.3 20.1 27.0 21.8 16.4 93.7Non-LBOTE 2.5 1.4 6.8 18.9 28.4 24.5 17.5 96.1
QldLBOTE 2.7 5.8 13.0 22.1 24.4 19.3 12.8 91.5Non-LBOTE 1.2 3.7 11.4 23.4 28.3 20.7 11.2 95.1
WALBOTE 2.4 5.5 11.6 21.5 25.0 20.0 14.1 92.1Non-LBOTE 0.9 3.9 11.0 22.4 28.0 21.3 12.5 95.2
SALBOTE 5.2 7.3 13.9 24.2 25.8 15.7 7.9 87.5Non-LBOTE 1.7 4.0 12.5 25.3 29.0 18.6 9.0 94.3
TasLBOTE 8.5 3.2 9.7 19.6 24.0 20.6 14.4 88.4Non-LBOTE 1.5 3.7 11.7 23.8 26.9 19.5 12.9 94.8
ACTLBOTE 4.3 1.9 8.8 19.1 26.1 21.9 18.0 93.8Non-LBOTE 1.0 1.7 7.0 19.0 28.5 24.8 17.9 97.3
NTLBOTE 3.4 48.3 17.6 11.6 9.9 6.4 2.9 48.3Non-LBOTE 2.2 9.0 13.8 24.3 27.5 15.7 7.4 88.8
AustLBOTE 3.1 4.2 10.0 20.3 25.4 20.9 16.1 92.7Non-LBOTE 1.6 3.0 9.8 21.4 27.9 22.0 14.3 95.4
Refer to the introduction for explanatory notes and how to read the graph.

50
NAPLAN Year 3 Numeracy
Table 3.N5: Achievement of Year 3 Students in Numeracy, by Geolocation, by State and Territory, 2014.
State/ Territory
Geolocation Mean scale score
Below national minimum standard
(%)
At national
minimum standard
(%)
Above national minimum standard (%)
At or above
national minimum standard
(%)Exempt Band 1 Band 2 Band 3 Band 4 Band 5 Band 6 and above
NSW
Metro 413.0 1.6 2.5 8.4 18.8 26.3 23.5 18.9 95.9Provincial 389.5 1.5 4.7 12.7 23.9 26.9 19.2 11.1 93.8Remote 361.6 2.2 10.8 20.7 24.0 21.4 13.5 7.5 87.0Very Remote 360.6 2.0 12.0 20.2 26.8 18.8 12.4 7.8 86.0
Vic
Metro 417.5 3.1 1.4 6.6 18.2 27.6 24.6 18.6 95.6Provincial 402.0 2.9 2.0 9.1 22.6 29.4 21.4 12.7 95.1Remote 402.0 0.0 2.6 13.2 24.3 23.8 15.3 20.9 97.4Very Remote - - - - - - - - -
Qld
Metro 398.2 1.4 3.3 10.5 22.4 28.0 21.8 12.6 95.3Provincial 385.1 1.5 4.4 13.6 25.4 27.9 18.1 9.0 94.1Remote 368.8 1.5 9.5 16.1 26.2 24.9 14.8 7.0 88.9Very Remote 334.2 1.2 20.4 26.0 24.5 15.4 8.2 4.3 78.4
WA
Metro 401.6 1.4 3.2 10.3 21.5 27.3 21.9 14.4 95.4Provincial 377.7 0.9 5.8 15.6 26.4 27.4 16.4 7.5 93.3Remote 362.0 1.0 12.5 16.9 25.2 24.0 14.3 6.1 86.5Very Remote 319.2 0.3 29.0 25.1 19.5 15.7 7.1 3.3 70.7
SA
Metro 390.1 2.3 3.7 11.8 24.4 28.8 19.2 9.8 94.0Provincial 375.6 2.5 5.5 15.2 27.5 27.3 15.5 6.5 92.0Remote 377.4 1.5 4.3 13.4 27.8 32.9 14.9 5.2 94.2Very Remote 307.6 0.0 39.0 14.7 15.8 18.4 8.6 3.6 61.0
Tas
Metro 400.0 2.2 3.4 11.0 22.2 26.2 20.0 15.0 94.4Provincial 394.1 1.7 3.6 11.6 24.4 27.0 19.6 12.1 94.7Remote 363.9 0.0 6.4 24.9 26.1 24.6 12.2 5.8 93.6Very Remote n.p. n.p. n.p. n.p. n.p. n.p. n.p. n.p. n.p.
ACT
Metro 414.0 1.7 1.8 7.4 19.0 28.0 24.2 18.0 96.5Provincial n.p. n.p. n.p. n.p. n.p. n.p. n.p. n.p. n.p.Remote - - - - - - - - -Very Remote - - - - - - - - -
NT
Metro - - - - - - - - -Provincial 379.7 3.5 7.2 12.7 24.2 27.3 17.1 7.9 89.3Remote 353.2 2.1 17.0 17.9 21.3 23.0 12.2 6.5 80.9Very Remote 246.6 0.6 64.7 18.7 7.9 5.0 2.4 0.7 34.7
Aust
Metro 408.2 2.0 2.5 8.8 20.1 27.3 22.9 16.4 95.5Provincial 389.2 1.9 4.2 12.5 24.5 27.8 18.9 10.3 93.9Remote 364.9 1.4 10.9 16.9 25.1 24.9 14.1 6.6 87.6Very Remote 301.8 0.7 37.6 22.5 17.3 12.6 6.3 3.0 61.7
Refer to the introduction for explanatory notes.

51
NAPLAN Year 3 Numeracy
Table 3.N6: Achievement of Year 3 Indigenous Students in Numeracy, by Geolocation, by State and Territory, 2014.
State/ Territory
Geolocation Mean scale score
Below national minimum standard
(%)
At national
minimum standard
(%)
Above national minimum standard (%)
At or above
national minimum standard
(%)Exempt Band 1 Band 2 Band 3 Band 4 Band 5 Band 6 and above
NSW
Metro 357.5 2.5 10.0 20.6 29.2 21.6 11.2 4.9 87.5Provincial 342.6 2.9 13.7 24.5 28.8 19.6 7.4 3.1 83.4Remote 315.9 3.6 22.1 33.3 21.9 12.1 6.1 0.8 74.3Very Remote 313.1 4.4 25.8 27.1 24.9 12.9 4.9 0.0 69.8
Vic
Metro 373.2 5.0 4.8 15.6 29.9 25.5 13.3 5.9 90.1Provincial 358.4 6.0 6.9 18.7 31.4 23.9 10.8 2.3 87.1Remote n.p. n.p. n.p. n.p. n.p. n.p. n.p. n.p. n.p.Very Remote - - - - - - - - -
Qld
Metro 343.3 1.3 12.9 24.9 30.0 19.7 8.8 2.3 85.8Provincial 340.8 2.5 12.8 25.6 30.4 19.2 7.4 2.1 84.7Remote 313.3 3.6 26.6 28.1 24.6 11.8 4.2 1.0 69.7Very Remote 298.9 1.2 32.6 33.8 21.4 7.9 2.6 0.5 66.2
WA
Metro 329.1 1.5 18.6 27.8 28.8 15.5 5.5 2.3 79.9Provincial 321.8 1.2 21.0 29.5 28.7 13.1 5.3 1.2 77.8Remote 299.8 1.7 34.8 27.0 22.7 9.8 3.5 0.5 63.5Very Remote 276.4 0.4 46.8 32.2 13.5 5.1 1.6 0.4 52.8
SA
Metro 335.2 5.3 14.4 28.5 26.3 17.2 5.7 2.5 80.3Provincial 312.7 5.5 24.7 29.4 23.2 12.3 3.7 1.2 69.8Remote 326.4 0.0 19.4 33.3 26.7 12.7 7.3 0.6 80.6Very Remote 245.7 0.0 63.6 21.6 9.5 4.4 0.8 0.0 36.4
Tas
Metro 362.0 0.5 7.3 20.3 31.9 25.0 8.5 6.4 92.1Provincial 368.3 1.7 5.5 18.5 30.4 24.1 14.2 5.6 92.8Remote n.p. n.p. n.p. n.p. n.p. n.p. n.p. n.p. n.p.Very Remote n.p. n.p. n.p. n.p. n.p. n.p. n.p. n.p. n.p.
ACT
Metro 357.8 2.5 9.3 20.8 28.4 24.6 10.1 4.3 88.3Provincial n.p. n.p. n.p. n.p. n.p. n.p. n.p. n.p. n.p.Remote - - - - - - - - -Very Remote - - - - - - - - -
NT
Metro - - - - - - - - -Provincial 323.7 3.3 23.2 23.9 25.6 17.2 5.6 1.3 73.6Remote 288.5 3.3 39.3 28.8 17.1 9.4 1.9 0.2 57.4Very Remote 227.3 0.7 73.3 19.7 4.8 1.2 0.3 0.0 25.9
Aust
Metro 349.0 2.3 11.8 23.1 29.4 20.4 9.4 3.7 85.9Provincial 340.6 3.0 14.1 24.6 29.2 19.1 7.6 2.5 82.9Remote 304.4 2.8 31.1 28.9 22.0 10.9 3.8 0.6 66.2Very Remote 261.0 0.8 54.5 26.8 11.9 4.4 1.3 0.2 44.6
Refer to the introduction for explanatory notes.
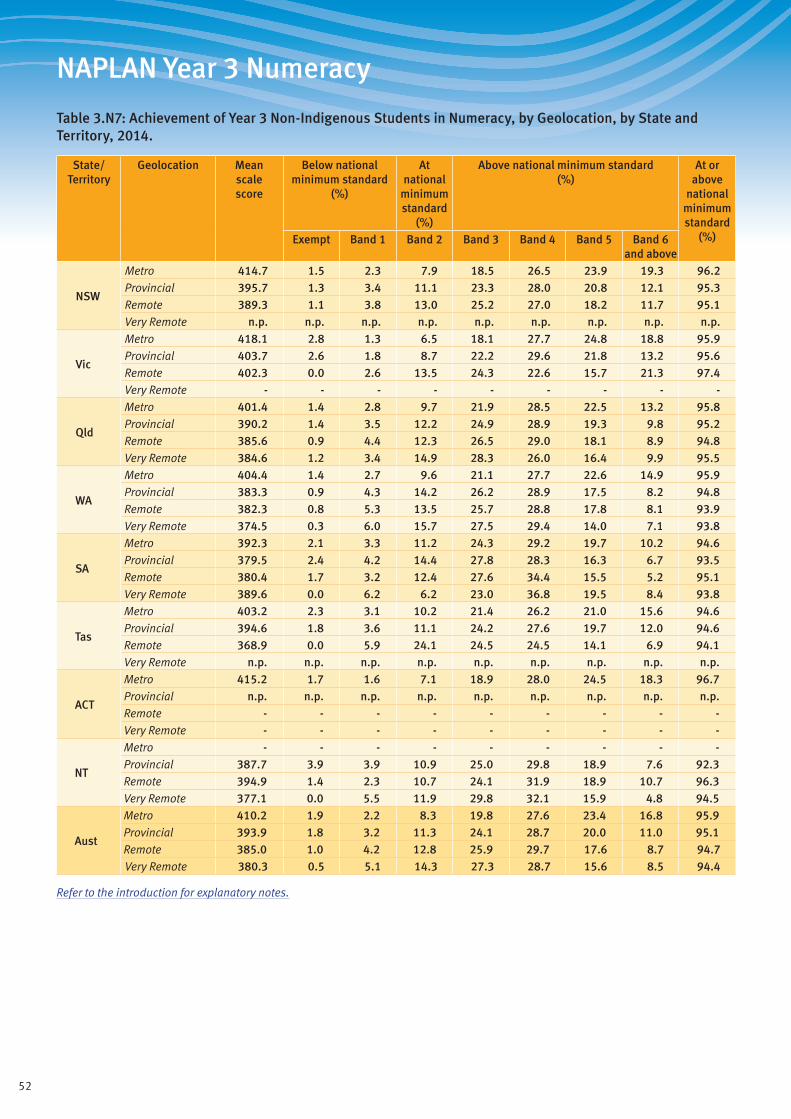
52
NAPLAN Year 3 Numeracy
Table 3.N7: Achievement of Year 3 Non-Indigenous Students in Numeracy, by Geolocation, by State and Territory, 2014.
State/ Territory
Geolocation Mean scale score
Below national minimum standard
(%)
At national
minimum standard
(%)
Above national minimum standard (%)
At or above
national minimum standard
(%)Exempt Band 1 Band 2 Band 3 Band 4 Band 5 Band 6 and above
NSW
Metro 414.7 1.5 2.3 7.9 18.5 26.5 23.9 19.3 96.2Provincial 395.7 1.3 3.4 11.1 23.3 28.0 20.8 12.1 95.3Remote 389.3 1.1 3.8 13.0 25.2 27.0 18.2 11.7 95.1Very Remote n.p. n.p. n.p. n.p. n.p. n.p. n.p. n.p. n.p.
Vic
Metro 418.1 2.8 1.3 6.5 18.1 27.7 24.8 18.8 95.9Provincial 403.7 2.6 1.8 8.7 22.2 29.6 21.8 13.2 95.6Remote 402.3 0.0 2.6 13.5 24.3 22.6 15.7 21.3 97.4Very Remote - - - - - - - - -
Qld
Metro 401.4 1.4 2.8 9.7 21.9 28.5 22.5 13.2 95.8Provincial 390.2 1.4 3.5 12.2 24.9 28.9 19.3 9.8 95.2Remote 385.6 0.9 4.4 12.3 26.5 29.0 18.1 8.9 94.8Very Remote 384.6 1.2 3.4 14.9 28.3 26.0 16.4 9.9 95.5
WA
Metro 404.4 1.4 2.7 9.6 21.1 27.7 22.6 14.9 95.9Provincial 383.3 0.9 4.3 14.2 26.2 28.9 17.5 8.2 94.8Remote 382.3 0.8 5.3 13.5 25.7 28.8 17.8 8.1 93.9Very Remote 374.5 0.3 6.0 15.7 27.5 29.4 14.0 7.1 93.8
SA
Metro 392.3 2.1 3.3 11.2 24.3 29.2 19.7 10.2 94.6Provincial 379.5 2.4 4.2 14.4 27.8 28.3 16.3 6.7 93.5Remote 380.4 1.7 3.2 12.4 27.6 34.4 15.5 5.2 95.1Very Remote 389.6 0.0 6.2 6.2 23.0 36.8 19.5 8.4 93.8
Tas
Metro 403.2 2.3 3.1 10.2 21.4 26.2 21.0 15.6 94.6Provincial 394.6 1.8 3.6 11.1 24.2 27.6 19.7 12.0 94.6Remote 368.9 0.0 5.9 24.1 24.5 24.5 14.1 6.9 94.1Very Remote n.p. n.p. n.p. n.p. n.p. n.p. n.p. n.p. n.p.
ACT
Metro 415.2 1.7 1.6 7.1 18.9 28.0 24.5 18.3 96.7Provincial n.p. n.p. n.p. n.p. n.p. n.p. n.p. n.p. n.p.Remote - - - - - - - - -Very Remote - - - - - - - - -
NT
Metro - - - - - - - - -Provincial 387.7 3.9 3.9 10.9 25.0 29.8 18.9 7.6 92.3Remote 394.9 1.4 2.3 10.7 24.1 31.9 18.9 10.7 96.3Very Remote 377.1 0.0 5.5 11.9 29.8 32.1 15.9 4.8 94.5
Aust
Metro 410.2 1.9 2.2 8.3 19.8 27.6 23.4 16.8 95.9Provincial 393.9 1.8 3.2 11.3 24.1 28.7 20.0 11.0 95.1Remote 385.0 1.0 4.2 12.8 25.9 29.7 17.6 8.7 94.7Very Remote 380.3 0.5 5.1 14.3 27.3 28.7 15.6 8.5 94.4
Refer to the introduction for explanatory notes.

53
NAPLAN Year 3 Numeracy
Table 3.N8: Achievement of Year 3 Students in Numeracy, by Parental Education, by State and Territory, 2014.
State/ Territory
Parental education
Mean scale score
Below national minimum standard
(%)
At national
minimum standard
(%)
Above national minimum standard (%)
At or above
national minimum standard
(%)Exempt Band 1 Band 2 Band 3 Band 4 Band 5 Band 6 and above
NSW
Bachelor 442.2 1.1 0.6 3.3 11.7 24.4 29.0 30.0 98.3Diploma 406.3 1.3 2.0 7.7 21.4 29.8 24.2 13.6 96.7Certificate 385.9 1.4 3.8 12.7 25.9 29.3 18.9 8.0 94.8Year 12 383.1 2.1 4.4 14.0 26.3 27.2 17.4 8.6 93.4Year 11 352.4 3.2 10.1 21.9 29.4 22.4 9.6 3.4 86.7Not stated (4%) 392.3 3.4 5.2 12.8 23.0 24.1 17.6 13.8 91.4
Vic
Bachelor 440.1 1.8 0.4 3.1 12.4 25.5 29.0 27.9 97.8Diploma 407.5 2.3 1.4 7.4 20.2 31.5 24.1 13.0 96.3Certificate 394.4 2.9 2.1 9.8 24.9 30.9 20.4 9.0 95.0Year 12 396.7 4.0 2.2 9.7 23.6 30.0 20.3 10.3 93.9Year 11 370.2 7.8 4.7 15.6 29.3 25.1 13.1 4.3 87.5Not stated (3%) 419.3 6.1 1.1 7.1 16.9 26.7 22.8 19.4 92.7
Qld
Bachelor 428.4 1.0 0.8 4.3 15.4 27.5 28.8 22.3 98.2Diploma 394.9 1.0 2.5 10.0 24.5 31.0 21.6 9.4 96.6Certificate 381.2 1.2 4.0 13.7 27.4 29.8 17.5 6.5 94.8Year 12 375.9 1.3 5.6 15.7 27.2 27.4 16.6 6.2 93.1Year 11 348.2 2.8 11.7 22.9 29.0 21.6 9.2 2.8 85.5Not stated (11%) 374.7 2.9 6.7 16.3 25.5 25.2 16.0 7.3 90.4
WA
Bachelor 428.9 1.1 0.8 4.5 15.4 27.2 27.9 23.1 98.1Diploma 392.7 1.0 2.9 11.0 24.4 30.4 20.9 9.4 96.1Certificate 378.7 0.8 4.8 14.8 27.5 28.6 16.8 6.7 94.3Year 12 379.5 1.5 5.0 14.6 26.4 28.2 17.4 6.9 93.5Year 11 346.0 1.8 13.0 23.6 28.6 20.8 9.1 3.1 85.2Not stated (14%) 368.9 2.1 10.8 16.9 23.4 23.2 15.0 8.5 87.1
SA
Bachelor 418.8 1.4 0.9 5.5 17.1 30.7 26.9 17.5 97.7Diploma 389.0 1.1 2.5 11.4 26.4 31.4 19.4 7.8 96.4Certificate 373.6 2.2 4.8 15.1 29.5 29.0 14.5 4.9 93.0Year 12 372.7 2.3 4.4 15.4 30.9 27.9 14.5 4.6 93.3Year 11 343.6 4.1 11.5 23.8 30.9 20.2 7.6 1.9 84.3Not stated (10%) 366.0 4.5 9.3 15.6 25.6 25.9 13.6 5.5 86.2
KeyBachelor: Bachelor degree or aboveDiploma: Advanced diploma/diplomaCertificate: Certificate I to IVYear 12: Year 12 or equivalentYear 11: Year 11 or equivalent or belowNot stated: No data was provided for parental education at the time of student enrolment. The higher the percentage of missing data, the less informative are the results for the other categories.
Refer to the introduction for explanatory notes.

54
NAPLAN Year 3 Numeracy
Table 3.N8 (cont.): Achievement of Year 3 Students in Numeracy, by Parental Education, by State and Territory, 2014.
State/ Territory
Parental education
Mean scale score
Below national minimum standard
(%)
At national
minimum standard
(%)
Above national minimum standard (%)
At or above
national minimum standard
(%)Exempt Band 1 Band 2 Band 3 Band 4 Band 5 Band 6 and above
Tas
Bachelor 440.6 1.1 0.4 3.7 12.4 24.9 29.0 28.6 98.5Diploma 406.4 1.8 2.3 6.8 21.2 31.7 22.3 13.9 95.9Certificate 383.2 1.7 3.7 13.6 27.6 28.0 17.6 7.8 94.5Year 12 372.3 1.6 4.3 15.9 33.3 26.2 13.6 5.0 94.1Year 11 355.4 2.6 8.8 21.3 29.7 24.2 10.5 3.0 88.6Not stated (10%) 401.3 3.6 3.7 10.1 21.5 25.2 20.2 15.7 92.7
ACT
Bachelor 433.8 1.7 0.9 3.9 13.5 26.4 28.5 25.1 97.5Diploma 391.7 1.2 1.6 9.8 28.7 31.3 19.6 8.0 97.2Certificate 383.8 1.6 3.1 13.1 27.5 30.2 17.0 7.4 95.2Year 12 388.3 2.6 3.3 11.0 25.6 29.1 19.9 8.5 94.0Year 11 376.3 3.0 6.5 16.6 25.0 24.1 16.4 8.4 90.5Not stated (6%) 414.6 1.6 1.6 7.6 16.6 31.0 23.8 17.9 96.9
NT
Bachelor 409.8 1.7 1.8 6.1 20.1 31.6 24.8 14.0 96.5Diploma 383.4 1.1 3.4 11.9 26.7 33.0 19.1 4.8 95.5Certificate 352.9 2.2 13.0 18.0 27.6 24.6 10.8 3.8 84.8Year 12 357.1 2.6 13.0 16.8 25.4 24.5 14.2 3.6 84.5Year 11 275.4 2.6 46.7 25.8 15.0 7.9 1.8 0.3 50.7Not stated (24%) 278.5 4.0 51.7 15.1 9.2 9.1 6.1 4.7 44.3
Aust
Bachelor 435.9 1.3 0.6 3.7 13.4 26.0 28.7 26.3 98.1Diploma 401.4 1.5 2.1 8.7 22.5 30.7 22.9 11.7 96.5Certificate 384.7 1.7 3.7 12.7 26.5 29.6 18.3 7.5 94.6Year 12 383.0 2.3 4.3 13.6 26.3 28.0 17.6 7.8 93.4Year 11 353.0 4.1 10.2 21.0 29.0 22.4 10.1 3.3 85.7Not stated (7%) 378.0 3.4 8.6 14.4 22.8 24.2 16.4 10.2 88.1
KeyBachelor: Bachelor degree or aboveDiploma: Advanced diploma/diplomaCertificate: Certificate I to IVYear 12: Year 12 or equivalentYear 11: Year 11 or equivalent or belowNot stated: No data was provided for parental education at the time of student enrolment. The higher the percentage of missing data, the less informative are the results for the other categories.
Refer to the introduction for explanatory notes.
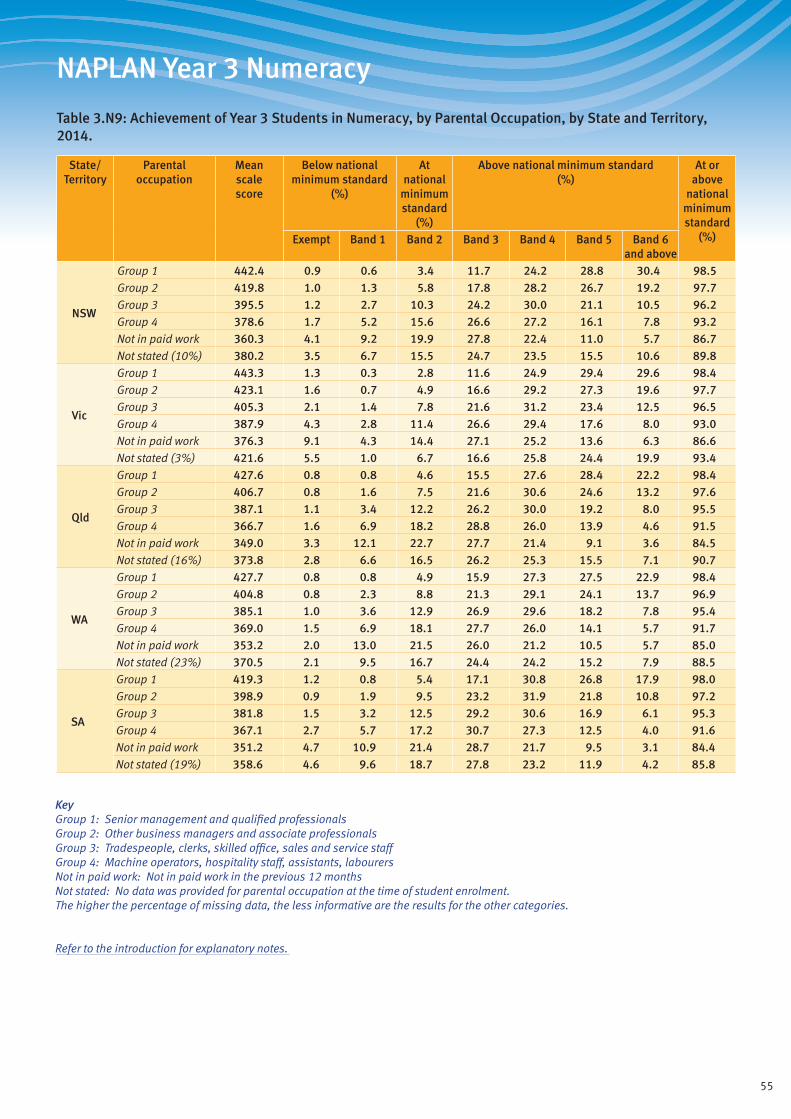
55
NAPLAN Year 3 Numeracy
Table 3.N9: Achievement of Year 3 Students in Numeracy, by Parental Occupation, by State and Territory, 2014.
State/ Territory
Parental occupation
Mean scale score
Below national minimum standard
(%)
At national
minimum standard
(%)
Above national minimum standard (%)
At or above
national minimum standard
(%)Exempt Band 1 Band 2 Band 3 Band 4 Band 5 Band 6 and above
NSW
Group 1 442.4 0.9 0.6 3.4 11.7 24.2 28.8 30.4 98.5Group 2 419.8 1.0 1.3 5.8 17.8 28.2 26.7 19.2 97.7Group 3 395.5 1.2 2.7 10.3 24.2 30.0 21.1 10.5 96.2Group 4 378.6 1.7 5.2 15.6 26.6 27.2 16.1 7.8 93.2Not in paid work 360.3 4.1 9.2 19.9 27.8 22.4 11.0 5.7 86.7Not stated (10%) 380.2 3.5 6.7 15.5 24.7 23.5 15.5 10.6 89.8
Vic
Group 1 443.3 1.3 0.3 2.8 11.6 24.9 29.4 29.6 98.4Group 2 423.1 1.6 0.7 4.9 16.6 29.2 27.3 19.6 97.7Group 3 405.3 2.1 1.4 7.8 21.6 31.2 23.4 12.5 96.5Group 4 387.9 4.3 2.8 11.4 26.6 29.4 17.6 8.0 93.0Not in paid work 376.3 9.1 4.3 14.4 27.1 25.2 13.6 6.3 86.6Not stated (3%) 421.6 5.5 1.0 6.7 16.6 25.8 24.4 19.9 93.4
Qld
Group 1 427.6 0.8 0.8 4.6 15.5 27.6 28.4 22.2 98.4Group 2 406.7 0.8 1.6 7.5 21.6 30.6 24.6 13.2 97.6Group 3 387.1 1.1 3.4 12.2 26.2 30.0 19.2 8.0 95.5Group 4 366.7 1.6 6.9 18.2 28.8 26.0 13.9 4.6 91.5Not in paid work 349.0 3.3 12.1 22.7 27.7 21.4 9.1 3.6 84.5Not stated (16%) 373.8 2.8 6.6 16.5 26.2 25.3 15.5 7.1 90.7
WA
Group 1 427.7 0.8 0.8 4.9 15.9 27.3 27.5 22.9 98.4Group 2 404.8 0.8 2.3 8.8 21.3 29.1 24.1 13.7 96.9Group 3 385.1 1.0 3.6 12.9 26.9 29.6 18.2 7.8 95.4Group 4 369.0 1.5 6.9 18.1 27.7 26.0 14.1 5.7 91.7Not in paid work 353.2 2.0 13.0 21.5 26.0 21.2 10.5 5.7 85.0Not stated (23%) 370.5 2.1 9.5 16.7 24.4 24.2 15.2 7.9 88.5
SA
Group 1 419.3 1.2 0.8 5.4 17.1 30.8 26.8 17.9 98.0Group 2 398.9 0.9 1.9 9.5 23.2 31.9 21.8 10.8 97.2Group 3 381.8 1.5 3.2 12.5 29.2 30.6 16.9 6.1 95.3Group 4 367.1 2.7 5.7 17.2 30.7 27.3 12.5 4.0 91.6Not in paid work 351.2 4.7 10.9 21.4 28.7 21.7 9.5 3.1 84.4Not stated (19%) 358.6 4.6 9.6 18.7 27.8 23.2 11.9 4.2 85.8
KeyGroup 1: Senior management and qualified professionalsGroup 2: Other business managers and associate professionalsGroup 3: Tradespeople, clerks, skilled office, sales and service staffGroup 4: Machine operators, hospitality staff, assistants, labourersNot in paid work: Not in paid work in the previous 12 monthsNot stated: No data was provided for parental occupation at the time of student enrolment. The higher the percentage of missing data, the less informative are the results for the other categories.
Refer to the introduction for explanatory notes.

56
NAPLAN Year 3 Numeracy
Table 3.N9 (cont.): Achievement of Year 3 Students in Numeracy, by Parental Occupation, by State and Territory, 2014.
State/ Territory
Parental occupation
Mean scale score
Below national minimum standard
(%)
At national
minimum standard
(%)
Above national minimum standard (%)
At or above
national minimum standard
(%)Exempt Band 1 Band 2 Band 3 Band 4 Band 5 Band 6 and above
Tas
Group 1 438.0 0.7 0.7 4.4 12.1 26.0 28.6 27.5 98.6Group 2 408.5 1.3 1.9 7.6 21.9 29.2 22.9 15.4 96.9Group 3 392.5 1.3 2.5 10.7 26.6 29.7 19.0 10.3 96.3Group 4 370.0 1.7 5.2 17.6 30.4 25.8 14.3 5.1 93.1Not in paid work 356.8 3.0 8.7 21.4 30.4 21.6 10.6 4.3 88.3Not stated (14%) 388.2 4.6 5.5 12.8 22.9 24.7 17.5 11.9 89.9
ACT
Group 1 435.2 1.5 0.8 3.9 13.1 25.7 28.8 26.2 97.7Group 2 412.1 1.0 1.3 7.0 19.7 30.2 24.9 15.7 97.6Group 3 396.6 1.6 2.4 9.7 24.8 29.7 20.9 10.9 96.0Group 4 370.8 2.3 4.7 16.5 30.5 28.4 12.6 4.9 93.0Not in paid work 369.7 5.0 5.2 16.8 29.9 25.6 12.9 4.7 89.9Not stated (13%) 398.6 2.8 2.7 10.1 22.6 29.4 19.8 12.8 94.6
NT
Group 1 401.6 1.2 2.9 8.6 21.4 30.7 22.8 12.4 95.9Group 2 380.4 1.0 6.7 12.5 24.0 30.6 17.2 8.2 92.3Group 3 370.7 2.5 7.6 15.8 26.6 26.5 15.4 5.7 90.0Group 4 314.1 2.1 31.6 21.9 19.7 15.0 7.6 2.1 66.3Not in paid work 275.3 3.4 49.0 22.9 14.3 7.7 2.0 0.6 47.6Not stated (23%) 266.3 4.4 53.5 16.3 11.1 8.9 4.0 1.9 42.1
Aust
Group 1 436.0 1.0 0.7 3.9 13.4 25.9 28.5 26.6 98.4Group 2 414.7 1.1 1.4 6.5 19.1 29.3 25.7 16.9 97.5Group 3 393.8 1.4 2.7 10.6 24.7 30.2 20.6 9.8 95.9Group 4 376.3 2.5 5.2 15.4 27.5 27.3 15.5 6.6 92.3Not in paid work 361.1 5.5 9.1 18.8 27.3 22.8 11.3 5.3 85.5Not stated (12%) 374.2 3.3 8.2 15.8 24.6 24.1 15.4 8.7 88.5
KeyGroup 1: Senior management and qualified professionalsGroup 2: Other business managers and associate professionalsGroup 3: Tradespeople, clerks, skilled office, sales and service staffGroup 4: Machine operators, hospitality staff, assistants, labourersNot in paid work: Not in paid work in the previous 12 monthsNot stated: No data was provided for parental occupation at the time of student enrolment. The higher the percentage of missing data, the less informative are the results for the other categories.
Refer to the introduction for explanatory notes.
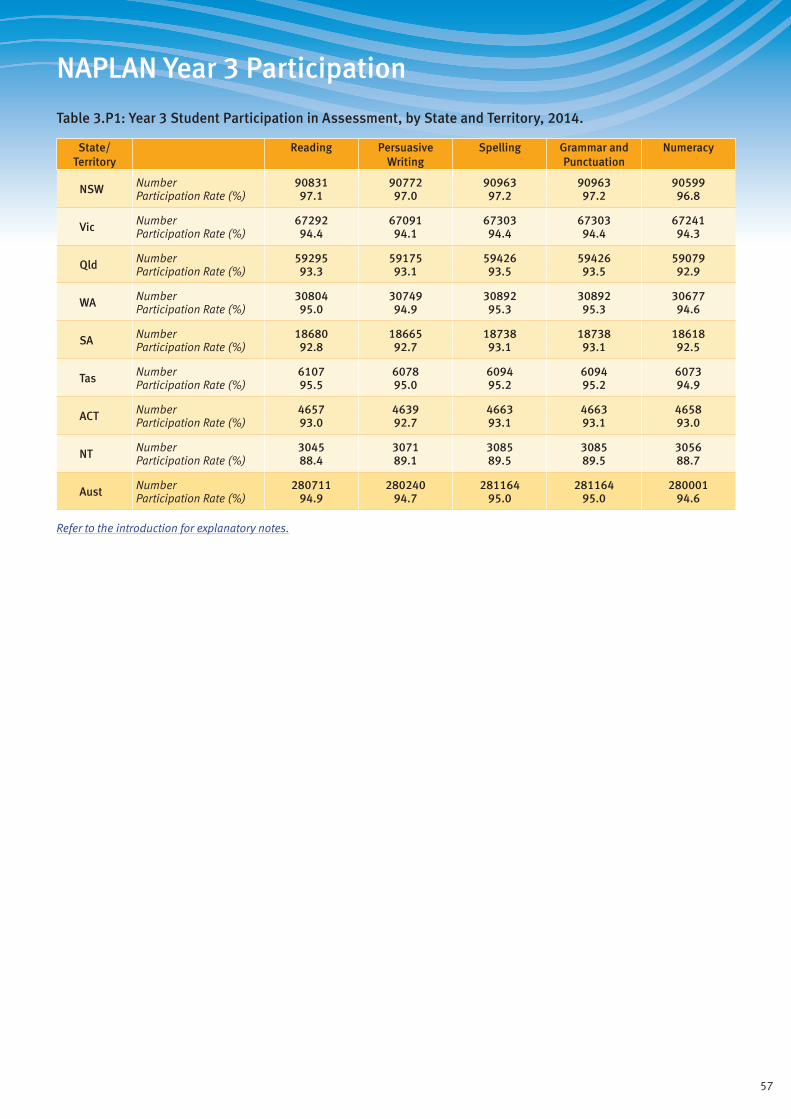
57
NAPLAN Year 3 Participation
Table 3.P1: Year 3 Student Participation in Assessment, by State and Territory, 2014.
State/ Territory
Reading Persuasive Writing
Spelling Grammar and Punctuation
Numeracy
NSW Number 90831 90772 90963 90963 90599Participation Rate (%) 97.1 97.0 97.2 97.2 96.8
Vic Number 67292 67091 67303 67303 67241Participation Rate (%) 94.4 94.1 94.4 94.4 94.3
Qld Number 59295 59175 59426 59426 59079Participation Rate (%) 93.3 93.1 93.5 93.5 92.9
WA Number 30804 30749 30892 30892 30677Participation Rate (%) 95.0 94.9 95.3 95.3 94.6
SA Number 18680 18665 18738 18738 18618Participation Rate (%) 92.8 92.7 93.1 93.1 92.5
Tas Number 6107 6078 6094 6094 6073Participation Rate (%) 95.5 95.0 95.2 95.2 94.9
ACT Number 4657 4639 4663 4663 4658Participation Rate (%) 93.0 92.7 93.1 93.1 93.0
NT Number 3045 3071 3085 3085 3056Participation Rate (%) 88.4 89.1 89.5 89.5 88.7
Aust Number 280711 280240 281164 281164 280001Participation Rate (%) 94.9 94.7 95.0 95.0 94.6
Refer to the introduction for explanatory notes.
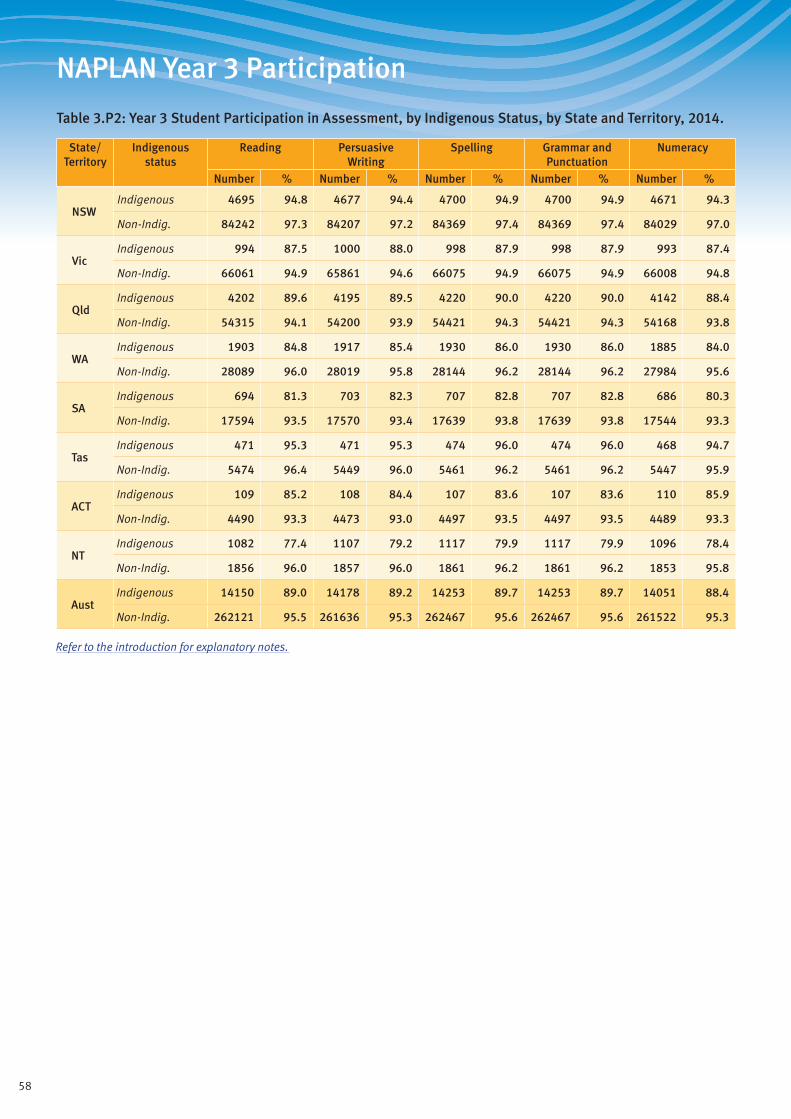
58
NAPLAN Year 3 Participation
Table 3.P2: Year 3 Student Participation in Assessment, by Indigenous Status, by State and Territory, 2014.
State/ Territory
Indigenous status
Reading Persuasive Writing
Spelling Grammar and Punctuation
Numeracy
Number % Number % Number % Number % Number %
NSWIndigenous 4695 94.8 4677 94.4 4700 94.9 4700 94.9 4671 94.3
Non-Indig. 84242 97.3 84207 97.2 84369 97.4 84369 97.4 84029 97.0
VicIndigenous 994 87.5 1000 88.0 998 87.9 998 87.9 993 87.4
Non-Indig. 66061 94.9 65861 94.6 66075 94.9 66075 94.9 66008 94.8
QldIndigenous 4202 89.6 4195 89.5 4220 90.0 4220 90.0 4142 88.4
Non-Indig. 54315 94.1 54200 93.9 54421 94.3 54421 94.3 54168 93.8
WAIndigenous 1903 84.8 1917 85.4 1930 86.0 1930 86.0 1885 84.0
Non-Indig. 28089 96.0 28019 95.8 28144 96.2 28144 96.2 27984 95.6
SAIndigenous 694 81.3 703 82.3 707 82.8 707 82.8 686 80.3
Non-Indig. 17594 93.5 17570 93.4 17639 93.8 17639 93.8 17544 93.3
TasIndigenous 471 95.3 471 95.3 474 96.0 474 96.0 468 94.7
Non-Indig. 5474 96.4 5449 96.0 5461 96.2 5461 96.2 5447 95.9
ACTIndigenous 109 85.2 108 84.4 107 83.6 107 83.6 110 85.9
Non-Indig. 4490 93.3 4473 93.0 4497 93.5 4497 93.5 4489 93.3
NTIndigenous 1082 77.4 1107 79.2 1117 79.9 1117 79.9 1096 78.4
Non-Indig. 1856 96.0 1857 96.0 1861 96.2 1861 96.2 1853 95.8
AustIndigenous 14150 89.0 14178 89.2 14253 89.7 14253 89.7 14051 88.4
Non-Indig. 262121 95.5 261636 95.3 262467 95.6 262467 95.6 261522 95.3
Refer to the introduction for explanatory notes.

59
NAPLAN Year 3 Participation
Table 3.P3: Percentage of Year 3 Student Exemptions, Absences and Withdrawals by State and Territory, 2014.
State/ Territory
Reading (%)
Persuasive Writing
(%)
Spelling (%)
Grammar and Punctuation
(%)
Numeracy (%)
E A W E A W E A W E A W E A W
NSW 1.6 1.6 1.3 1.6 1.7 1.3 1.6 1.5 1.3 1.6 1.5 1.3 1.6 1.9 1.2
Vic 3.1 2.7 2.9 3.1 3.0 2.9 3.1 2.8 2.8 3.1 2.8 2.8 3.0 3.0 2.7
Qld 1.5 2.4 4.4 1.5 2.5 4.4 1.5 2.2 4.3 1.5 2.2 4.3 1.4 2.9 4.2
WA 1.3 3.0 1.9 1.3 3.2 2.0 1.3 2.8 1.9 1.3 2.8 1.9 1.2 3.5 1.9
SA 2.3 3.1 4.1 2.3 3.2 4.1 2.3 2.9 4.0 2.3 2.9 4.0 2.3 3.6 3.9
Tas 1.9 2.7 1.8 1.9 3.2 1.8 1.9 2.9 1.8 1.9 2.9 1.8 1.9 3.3 1.8
ACT 1.8 2.1 4.9 1.8 2.4 5.0 1.8 2.1 4.8 1.8 2.1 4.8 1.7 2.2 4.7
NT 2.5 8.2 3.4 2.5 7.5 3.4 2.5 7.1 3.4 2.5 7.1 3.4 2.5 9.3 2.1
Aust 2.0 2.4 2.7 2.0 2.6 2.7 2.0 2.3 2.7 2.0 2.3 2.7 1.9 2.8 2.5
Refer to the introduction for explanatory notes.
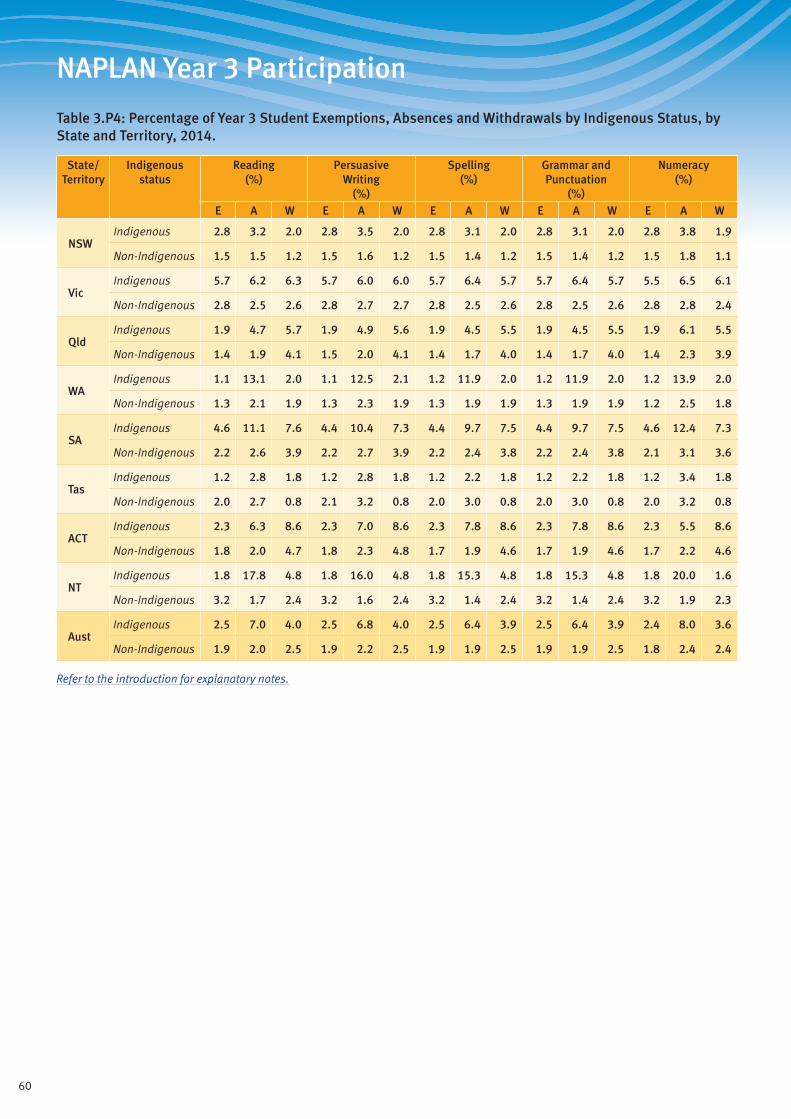
60
NAPLAN Year 3 Participation
Table 3.P4: Percentage of Year 3 Student Exemptions, Absences and Withdrawals by Indigenous Status, by State and Territory, 2014.
State/ Territory
Indigenous status
Reading (%)
Persuasive Writing
(%)
Spelling (%)
Grammar and Punctuation
(%)
Numeracy (%)
E A W E A W E A W E A W E A W
NSWIndigenous 2.8 3.2 2.0 2.8 3.5 2.0 2.8 3.1 2.0 2.8 3.1 2.0 2.8 3.8 1.9
Non-Indigenous 1.5 1.5 1.2 1.5 1.6 1.2 1.5 1.4 1.2 1.5 1.4 1.2 1.5 1.8 1.1
VicIndigenous 5.7 6.2 6.3 5.7 6.0 6.0 5.7 6.4 5.7 5.7 6.4 5.7 5.5 6.5 6.1
Non-Indigenous 2.8 2.5 2.6 2.8 2.7 2.7 2.8 2.5 2.6 2.8 2.5 2.6 2.8 2.8 2.4
QldIndigenous 1.9 4.7 5.7 1.9 4.9 5.6 1.9 4.5 5.5 1.9 4.5 5.5 1.9 6.1 5.5
Non-Indigenous 1.4 1.9 4.1 1.5 2.0 4.1 1.4 1.7 4.0 1.4 1.7 4.0 1.4 2.3 3.9
WAIndigenous 1.1 13.1 2.0 1.1 12.5 2.1 1.2 11.9 2.0 1.2 11.9 2.0 1.2 13.9 2.0
Non-Indigenous 1.3 2.1 1.9 1.3 2.3 1.9 1.3 1.9 1.9 1.3 1.9 1.9 1.2 2.5 1.8
SAIndigenous 4.6 11.1 7.6 4.4 10.4 7.3 4.4 9.7 7.5 4.4 9.7 7.5 4.6 12.4 7.3
Non-Indigenous 2.2 2.6 3.9 2.2 2.7 3.9 2.2 2.4 3.8 2.2 2.4 3.8 2.1 3.1 3.6
TasIndigenous 1.2 2.8 1.8 1.2 2.8 1.8 1.2 2.2 1.8 1.2 2.2 1.8 1.2 3.4 1.8
Non-Indigenous 2.0 2.7 0.8 2.1 3.2 0.8 2.0 3.0 0.8 2.0 3.0 0.8 2.0 3.2 0.8
ACTIndigenous 2.3 6.3 8.6 2.3 7.0 8.6 2.3 7.8 8.6 2.3 7.8 8.6 2.3 5.5 8.6
Non-Indigenous 1.8 2.0 4.7 1.8 2.3 4.8 1.7 1.9 4.6 1.7 1.9 4.6 1.7 2.2 4.6
NTIndigenous 1.8 17.8 4.8 1.8 16.0 4.8 1.8 15.3 4.8 1.8 15.3 4.8 1.8 20.0 1.6
Non-Indigenous 3.2 1.7 2.4 3.2 1.6 2.4 3.2 1.4 2.4 3.2 1.4 2.4 3.2 1.9 2.3
AustIndigenous 2.5 7.0 4.0 2.5 6.8 4.0 2.5 6.4 3.9 2.5 6.4 3.9 2.4 8.0 3.6
Non-Indigenous 1.9 2.0 2.5 1.9 2.2 2.5 1.9 1.9 2.5 1.9 1.9 2.5 1.8 2.4 2.4
Refer to the introduction for explanatory notes.
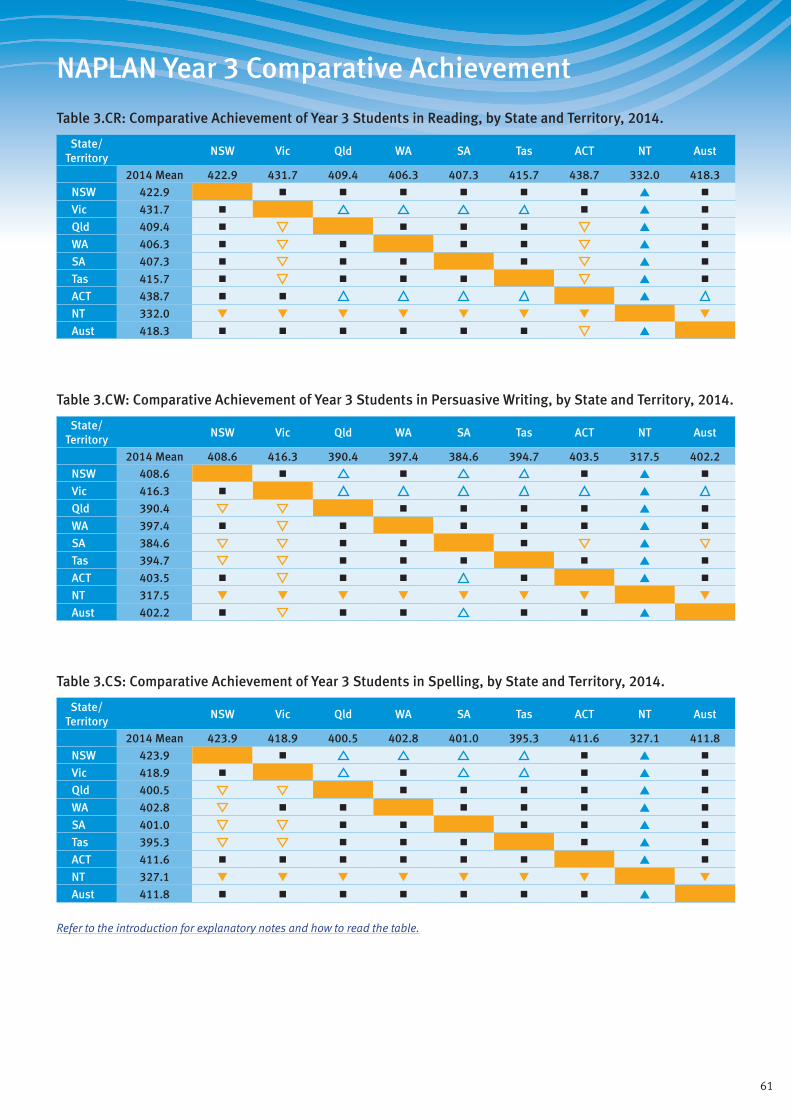
61
NAPLAN Year 3 Comparative Achievement
Table 3.CR: Comparative Achievement of Year 3 Students in Reading, by State and Territory, 2014.
State/ Territory
NSW Vic Qld WA SA Tas ACT NT Aust
2014 Mean 422.9 431.7 409.4 406.3 407.3 415.7 438.7 332.0 418.3
NSW 422.9 ■ ■ ■ ■ ■ ■ ▲ ■
Vic 431.7 ■ ■ ▲ ■
Qld 409.4 ■ ■ ■ ■ ▲ ■
WA 406.3 ■ ■ ■ ■ ▲ ■
SA 407.3 ■ ■ ■ ■ ▲ ■
Tas 415.7 ■ ■ ■ ■ ▲ ■
ACT 438.7 ■ ■ ▲
NT 332.0 ▼ ▼ ▼ ▼ ▼ ▼ ▼ ▼
Aust 418.3 ■ ■ ■ ■ ■ ■ ▲
Table 3.CW: Comparative Achievement of Year 3 Students in Persuasive Writing, by State and Territory, 2014.
State/ Territory
NSW Vic Qld WA SA Tas ACT NT Aust
2014 Mean 408.6 416.3 390.4 397.4 384.6 394.7 403.5 317.5 402.2
NSW 408.6 ■ ■ ■ ▲ ■
Vic 416.3 ■ ▲
Qld 390.4 ■ ■ ■ ■ ▲ ■
WA 397.4 ■ ■ ■ ■ ■ ▲ ■
SA 384.6 ■ ■ ■ ▲
Tas 394.7 ■ ■ ■ ■ ▲ ■
ACT 403.5 ■ ■ ■ ■ ▲ ■
NT 317.5 ▼ ▼ ▼ ▼ ▼ ▼ ▼ ▼
Aust 402.2 ■ ■ ■ ■ ■ ▲
Table 3.CS: Comparative Achievement of Year 3 Students in Spelling, by State and Territory, 2014.
State/ Territory
NSW Vic Qld WA SA Tas ACT NT Aust
2014 Mean 423.9 418.9 400.5 402.8 401.0 395.3 411.6 327.1 411.8
NSW 423.9 ■ ■ ▲ ■
Vic 418.9 ■ ■ ■ ▲ ■
Qld 400.5 ■ ■ ■ ■ ▲ ■
WA 402.8 ■ ■ ■ ■ ■ ▲ ■
SA 401.0 ■ ■ ■ ■ ▲ ■
Tas 395.3 ■ ■ ■ ■ ▲ ■
ACT 411.6 ■ ■ ■ ■ ■ ■ ▲ ■
NT 327.1 ▼ ▼ ▼ ▼ ▼ ▼ ▼ ▼
Aust 411.8 ■ ■ ■ ■ ■ ■ ■ ▲
Refer to the introduction for explanatory notes and how to read the table.

62
NAPLAN Year 3 Comparative Achievement
Table 3.CG: Comparative Achievement of Year 3 Students in Grammar and Punctuation, by State and Territory, 2014.
State/ Territory
NSW Vic Qld WA SA Tas ACT NT Aust
2014 Mean 435.3 435.2 421.2 413.0 407.3 405.4 439.7 326.2 426.0
NSW 435.3 ■ ■ ■ ▲ ■
Vic 435.2 ■ ■ ■ ▲ ■
Qld 421.2 ■ ■ ■ ■ ■ ▲ ■
WA 413.0 ■ ■ ■ ▲ ■
SA 407.3 ■ ■ ■ ▲
Tas 405.4 ■ ■ ■ ▲
ACT 439.7 ■ ■ ▲ ■
NT 326.2 ▼ ▼ ▼ ▼ ▼ ▼ ▼ ▼
Aust 426.0 ■ ■ ■ ■ ■ ▲
Table 3.CN: Comparative Achievement of Year 3 Students in Numeracy, by State and Territory, 2014.
State/ Territory
NSW Vic Qld WA SA Tas ACT NT Aust
2014 Mean 407.3 413.9 393.4 392.5 385.4 396.3 413.9 338.1 401.8
NSW 407.3 ■ ■ ■ ■ ▲ ■
Vic 413.9 ■ ■ ▲ ■
Qld 393.4 ■ ■ ■ ■ ▲ ■
WA 392.5 ■ ■ ■ ▲ ■
SA 385.4 ■ ■ ■ ▲
Tas 396.3 ■ ■ ■ ■ ▲ ■
ACT 413.9 ■ ■ ▲ ■
NT 338.1 ▼ ▼ ▼ ▼ ▼ ▼ ▼ ▼
Aust 401.8 ■ ■ ■ ■ ■ ■ ▲
Refer to the introduction for explanatory notes and how to read the table.
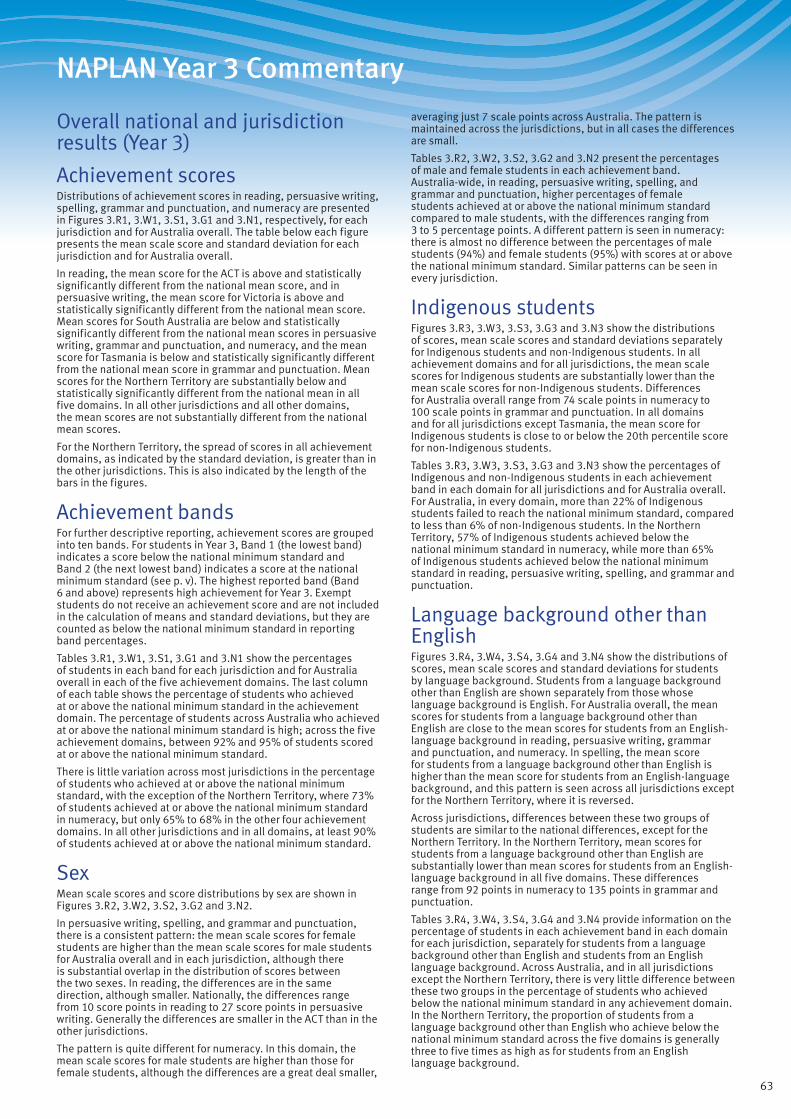
63
NAPLAN Year 3 Commentary
Overall national and jurisdiction results (Year 3)
Achievement scores Distributions of achievement scores in reading, persuasive writing, spelling, grammar and punctuation, and numeracy are presented in Figures 3.R1, 3.W1, 3.S1, 3.G1 and 3.N1, respectively, for each jurisdiction and for Australia overall. The table below each figure presents the mean scale score and standard deviation for each jurisdiction and for Australia overall.
In reading, the mean score for the ACT is above and statistically significantly different from the national mean score, and in persuasive writing, the mean score for Victoria is above and statistically significantly different from the national mean score. Mean scores for South Australia are below and statistically significantly different from the national mean scores in persuasive writing, grammar and punctuation, and numeracy, and the mean score for Tasmania is below and statistically significantly different from the national mean score in grammar and punctuation. Mean scores for the Northern Territory are substantially below and statistically significantly different from the national mean in all five domains. In all other jurisdictions and all other domains, the mean scores are not substantially different from the national mean scores.
For the Northern Territory, the spread of scores in all achievement domains, as indicated by the standard deviation, is greater than in the other jurisdictions. This is also indicated by the length of the bars in the figures.
Achievement bands For further descriptive reporting, achievement scores are grouped into ten bands. For students in Year 3, Band 1 (the lowest band) indicates a score below the national minimum standard and Band 2 (the next lowest band) indicates a score at the national minimum standard (see p. v). The highest reported band (Band 6 and above) represents high achievement for Year 3. Exempt students do not receive an achievement score and are not included in the calculation of means and standard deviations, but they are counted as below the national minimum standard in reporting band percentages.
Tables 3.R1, 3.W1, 3.S1, 3.G1 and 3.N1 show the percentages of students in each band for each jurisdiction and for Australia overall in each of the five achievement domains. The last column of each table shows the percentage of students who achieved at or above the national minimum standard in the achievement domain. The percentage of students across Australia who achieved at or above the national minimum standard is high; across the five achievement domains, between 92% and 95% of students scored at or above the national minimum standard.
There is little variation across most jurisdictions in the percentage of students who achieved at or above the national minimum standard, with the exception of the Northern Territory, where 73% of students achieved at or above the national minimum standard in numeracy, but only 65% to 68% in the other four achievement domains. In all other jurisdictions and in all domains, at least 90% of students achieved at or above the national minimum standard.
Sex Mean scale scores and score distributions by sex are shown in Figures 3.R2, 3.W2, 3.S2, 3.G2 and 3.N2.
In persuasive writing, spelling, and grammar and punctuation, there is a consistent pattern: the mean scale scores for female students are higher than the mean scale scores for male students for Australia overall and in each jurisdiction, although there is substantial overlap in the distribution of scores between the two sexes. In reading, the differences are in the same direction, although smaller. Nationally, the differences range from 10 score points in reading to 27 score points in persuasive writing. Generally the differences are smaller in the ACT than in the other jurisdictions.
The pattern is quite different for numeracy. In this domain, the mean scale scores for male students are higher than those for female students, although the differences are a great deal smaller,
averaging just 7 scale points across Australia. The pattern is maintained across the jurisdictions, but in all cases the differences are small.
Tables 3.R2, 3.W2, 3.S2, 3.G2 and 3.N2 present the percentages of male and female students in each achievement band. Australia-wide, in reading, persuasive writing, spelling, and grammar and punctuation, higher percentages of female students achieved at or above the national minimum standard compared to male students, with the differences ranging from 3 to 5 percentage points. A different pattern is seen in numeracy: there is almost no difference between the percentages of male students (94%) and female students (95%) with scores at or above the national minimum standard. Similar patterns can be seen in every jurisdiction.
Indigenous studentsFigures 3.R3, 3.W3, 3.S3, 3.G3 and 3.N3 show the distributions of scores, mean scale scores and standard deviations separately for Indigenous students and non-Indigenous students. In all achievement domains and for all jurisdictions, the mean scale scores for Indigenous students are substantially lower than the mean scale scores for non-Indigenous students. Differences for Australia overall range from 74 scale points in numeracy to 100 scale points in grammar and punctuation. In all domains and for all jurisdictions except Tasmania, the mean score for Indigenous students is close to or below the 20th percentile score for non-Indigenous students.
Tables 3.R3, 3.W3, 3.S3, 3.G3 and 3.N3 show the percentages of Indigenous and non-Indigenous students in each achievement band in each domain for all jurisdictions and for Australia overall. For Australia, in every domain, more than 22% of Indigenous students failed to reach the national minimum standard, compared to less than 6% of non-Indigenous students. In the Northern Territory, 57% of Indigenous students achieved below the national minimum standard in numeracy, while more than 65% of Indigenous students achieved below the national minimum standard in reading, persuasive writing, spelling, and grammar and punctuation.
Language background other than English Figures 3.R4, 3.W4, 3.S4, 3.G4 and 3.N4 show the distributions of scores, mean scale scores and standard deviations for students by language background. Students from a language background other than English are shown separately from those whose language background is English. For Australia overall, the mean scores for students from a language background other than English are close to the mean scores for students from an English-language background in reading, persuasive writing, grammar and punctuation, and numeracy. In spelling, the mean score for students from a language background other than English is higher than the mean score for students from an English-language background, and this pattern is seen across all jurisdictions except for the Northern Territory, where it is reversed.
Across jurisdictions, differences between these two groups of students are similar to the national differences, except for the Northern Territory. In the Northern Territory, mean scores for students from a language background other than English are substantially lower than mean scores for students from an English-language background in all five domains. These differences range from 92 points in numeracy to 135 points in grammar and punctuation.
Tables 3.R4, 3.W4, 3.S4, 3.G4 and 3.N4 provide information on the percentage of students in each achievement band in each domain for each jurisdiction, separately for students from a language background other than English and students from an English language background. Across Australia, and in all jurisdictions except the Northern Territory, there is very little difference between these two groups in the percentage of students who achieved below the national minimum standard in any achievement domain. In the Northern Territory, the proportion of students from a language background other than English who achieve below the national minimum standard across the five domains is generally three to five times as high as for students from an English language background.
64
NAPLAN Year 3 Commentary
Geolocation Tables 3.R5, 3.W5, 3.S5, 3.G5 and 3.N5 present summary results for students from schools in metropolitan, provincial, remote and very remote locations for each jurisdiction and for Australia overall. These tables include the mean scale score, as well as the percentage of students in each achievement band. In Victoria, there is no very remote geolocation; in the ACT there is no remote or very remote geolocation; and in the Northern Territory there is no geolocation categorised as metropolitan. In addition, some geolocations have too few students to report: very remote locations in Tasmania and provincial locations in the ACT. This is indicated by ‘n.p.’ in the tables.
Across all five achievement domains, there is a consistent pattern in the results for Australia overall. Students from metropolitan geolocations have the highest mean score, followed by students from provincial geolocations, then students from remote locations, then students from very remote locations. This pattern is not always replicated within each jurisdiction. For New South Wales, there is little difference between mean scores for students from remote and very remote locations, and for South Australia there is little difference between mean scores for students from provincial and remote locations.
The distributions of students in achievement bands are similar. Nationally, the highest percentage of students achieving at or above the national minimum standard attend schools in metropolitan locations and the lowest percentage attend schools in very remote locations. This pattern is similar across jurisdictions, with some exceptions. In Victoria and South Australia, there is no consistent pattern of differences between the percentage of students in metropolitan, provincial and remote locations scoring at or above the national minimum standard. Higher percentages of students attending schools in metropolitan geolocations across Australia and within each jurisdiction achieved at Band 5 and above than did students attending schools in other geolocations.
Results by geolocation are also reported by Indigenous status. Results for Indigenous students by geolocation are provided in Tables 3.R6, 3.W6, 3.S6, 3.G6 and 3.N6, and results for non- Indigenous students in Tables 3.R7, 3.W7, 3.S7, 3.G7 and 3.N7. For Indigenous students, the patterns of mean scores and percentage of students who achieved at or above the national minimum standard by geolocation are similar to the patterns for non-Indigenous students, across Australia and within each jurisdiction, with the exception of South Australia, where no consistent pattern occurs. For Australia overall, at least 78% of Indigenous students from metropolitan and provincial locations achieved at or above the national minimum standard in reading, persuasive writing, spelling, grammar and punctuation, and numeracy.
Parental education Tables 3.R8, 3.W8, 3.S8, 3.G8 and 3.N8 provide results for each jurisdiction and for Australia overall by parental education. Parental education refers to the highest level of education completed by the parent/guardian. It includes primary and secondary school and post-school qualifications, such as certificates, diplomas and degrees. The percentage of parents who did not report this information on their child’s school enrolment form varies across jurisdictions, from 3% in Victoria to 24% in the Northern Territory. For Australia overall, there is no information on parental education for 7% of students, so these results should be treated with caution.
In all domains, mean scores are higher for students whose parents have higher levels of education. Students whose parents hold a bachelor degree or higher have the highest mean scores for each jurisdiction and for Australia overall and, in nearly all jurisdictions, the greatest percentage of students who achieved at or above the national minimum standard. Nationally, there is little difference in the mean scores between students with parents whose highest level of education is a certificate and those with parents whose highest level of education is Year 12 completion. For Australia overall, in each domain, higher percentages of students whose parents completed Year 12 or higher achieved at or above the national minimum standard, compared to students whose parents had not completed Year 12.
Parental occupation Tables 3.R9, 3.W9, 3.S9, 3.G9 and 3.N9 show results for each jurisdiction and Australia overall by parental occupation. Parental occupation group includes the main work undertaken by the parent/guardian. If a parent/guardian has more than one job, the occupation group reflecting the main job is reported. If both parents/guardians are working, the higher of the two occupation groups is used. Occupations are classified into four groups; a fifth group represents those not in paid work. The percentage of parents who did not report this information on their child’s school enrolment form varies across jurisdictions, from 3% in Victoria to 23% in Western Australia and the Northern Territory. For Australia overall, there is no information on parental occupation for 12% of students, so these results should be treated with caution.
Students with parents in Occupation Group 1, which includes senior managers and qualified professionals, have the highest mean scale scores in all domains for all jurisdictions and for Australia overall. The next highest mean scores were achieved by students with parents in Occupation Group 2, which includes other business managers and associate professionals, followed by Occupation Group 3 (tradespeople; clerks; and skilled office, sales and service staff) and Occupation Group 4 (machine operators, hospitality staff, assistants and labourers). Students whose parents are not in paid work have the lowest mean scores in all domains across Australia and for all jurisdictions except the ACT, where the difference between these students and those with parents in Occupation Group 4 is small and inconsistent across domains.
Parental occupation is also related to the percentage of students who scored at or above the national minimum standard. Across Australia, students with parents in Occupation Groups 1 and 2 most frequently achieved at or above the national minimum standard (ranging from 96% to 98% across the five domains), with little difference between Group 1 and Group 2. Among students whose parents are not in paid work, the percentage who achieved at or above the national minimum standard is lowest in spelling (82%) and highest in numeracy (86%).
Participation Tables 3.P1, 3.P2, 3.P3 and 3.P4 provide data on participation in the tests in each domain for each jurisdiction and for Australia overall. Table 3.P1 provides the overall rates and Table 3.P2 provides rates separately for Indigenous and non-Indigenous students. Table 3.P3 provides data on exemptions, absences and withdrawals for the tests in each domain, with Table 3.P4 showing these rates separately for Indigenous and non-Indigenous students. Students who are absent or withdrawn are considered non-participating. Students who are exempt do not receive a scale score but are considered to have achieved below the national minimum standard.
Nationally, the overall participation rate is quite uniform across domains, ranging from 94.6% in numeracy to 95.0% in spelling, and grammar and punctuation. Among the eight jurisdictions, New South Wales has the highest participation rate (96.8% to 97.2% across domains) and the Northern Territory the lowest (88.4% to 89.5% across domains). Participation rates are lower among Indigenous students, ranging nationally from 88.4% to 89.7% across domains.
Across Australia, exemptions were granted to 2.5% of Indigenous students and 1.9% of non-Indigenous students, with the highest proportions recorded in Victoria (5.7% and 2.8%, respectively). There was no consistent pattern across jurisdictions. In New South Wales, Victoria and South Australia, the proportion of Indigenous students granted exemptions was approximately twice as high as that for non-Indigenous students. In the Northern Territory and Tasmania, this pattern was reversed.
Absence rates are considerably higher than rates of exemption or withdrawal, particularly among Indigenous students, where they range from 6.4% to 8.0% nationally across domains. Among Indigenous students, absence rates are highest in the Northern Territory (15.3% to 20.0%), Western Australia (11.9% to 13.9%) and South Australia (9.7% to 12.4%). Withdrawal rates are generally lower, with the highest figures recorded for Indigenous students in Victoria (5.7% to 6.3%), South Australia (7.3% to 7.6%) and the ACT (8.6%).
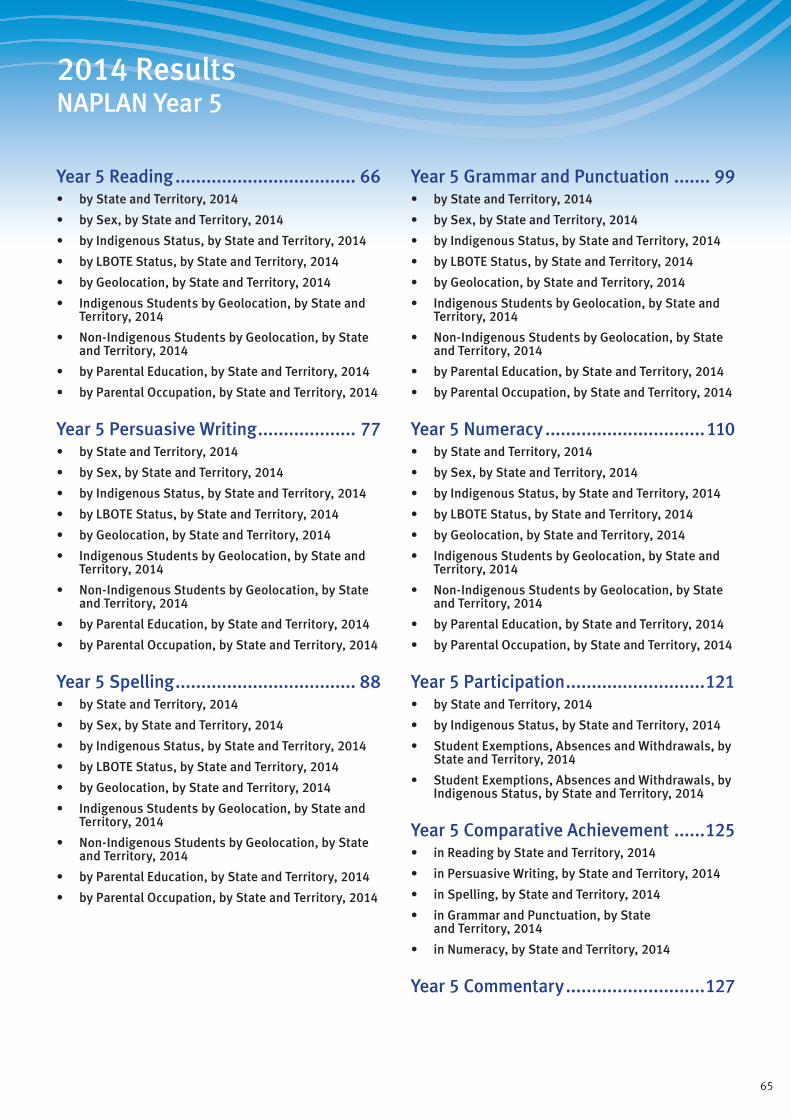
65
2014 Results NAPLAN Year 5
Year 5 Reading ................................... 66• by State and Territory, 2014
• by Sex, by State and Territory, 2014
• by Indigenous Status, by State and Territory, 2014
• by LBOTE Status, by State and Territory, 2014
• by Geolocation, by State and Territory, 2014
• Indigenous Students by Geolocation, by State and Territory, 2014
• Non-Indigenous Students by Geolocation, by State and Territory, 2014
• by Parental Education, by State and Territory, 2014
• by Parental Occupation, by State and Territory, 2014
Year 5 Persuasive Writing ................... 77• by State and Territory, 2014
• by Sex, by State and Territory, 2014
• by Indigenous Status, by State and Territory, 2014
• by LBOTE Status, by State and Territory, 2014
• by Geolocation, by State and Territory, 2014
• Indigenous Students by Geolocation, by State and Territory, 2014
• Non-Indigenous Students by Geolocation, by State and Territory, 2014
• by Parental Education, by State and Territory, 2014
• by Parental Occupation, by State and Territory, 2014
Year 5 Spelling ................................... 88• by State and Territory, 2014
• by Sex, by State and Territory, 2014
• by Indigenous Status, by State and Territory, 2014
• by LBOTE Status, by State and Territory, 2014
• by Geolocation, by State and Territory, 2014
• Indigenous Students by Geolocation, by State and Territory, 2014
• Non-Indigenous Students by Geolocation, by State and Territory, 2014
• by Parental Education, by State and Territory, 2014
• by Parental Occupation, by State and Territory, 2014
Year 5 Grammar and Punctuation ....... 99• by State and Territory, 2014
• by Sex, by State and Territory, 2014
• by Indigenous Status, by State and Territory, 2014
• by LBOTE Status, by State and Territory, 2014
• by Geolocation, by State and Territory, 2014
• Indigenous Students by Geolocation, by State and Territory, 2014
• Non-Indigenous Students by Geolocation, by State and Territory, 2014
• by Parental Education, by State and Territory, 2014
• by Parental Occupation, by State and Territory, 2014
Year 5 Numeracy ...............................110• by State and Territory, 2014
• by Sex, by State and Territory, 2014
• by Indigenous Status, by State and Territory, 2014
• by LBOTE Status, by State and Territory, 2014
• by Geolocation, by State and Territory, 2014
• Indigenous Students by Geolocation, by State and Territory, 2014
• Non-Indigenous Students by Geolocation, by State and Territory, 2014
• by Parental Education, by State and Territory, 2014
• by Parental Occupation, by State and Territory, 2014
Year 5 Participation ...........................121• by State and Territory, 2014
• by Indigenous Status, by State and Territory, 2014
• Student Exemptions, Absences and Withdrawals, by State and Territory, 2014
• Student Exemptions, Absences and Withdrawals, by Indigenous Status, by State and Territory, 2014
Year 5 Comparative Achievement ......125• in Reading by State and Territory, 2014
• in Persuasive Writing, by State and Territory, 2014
• in Spelling, by State and Territory, 2014
• in Grammar and Punctuation, by State and Territory, 2014
• in Numeracy, by State and Territory, 2014
Year 5 Commentary ...........................127

66
NAPLAN Year 5 Reading
Figure 5.R1: Achievement of Year 5 Students in Reading, by State and Territory, 2014.
Band 3andbelow
Band 4
Band 5
Band 6
Band 7
Band 8andabove
700
600
400
500
300
200
100
Ach
ieve
men
t sco
res
ACTQld SAWA TasVicNSW NT Aust
NSW Vic Qld WA SA Tas ACT NT Aust
Mean scale score / (S.D.)
504.0 (77.8)
509.8 (73.1)
496.1 (76.6)
491.7 (80.5)
489.6 (75.6)
497.9 (83.9)
522.0 (76.9)
425.5 (112.8)
500.6 (78.0)
Table 5.R1: Achievement of Year 5 Students in Reading, by State and Territory, 2014.
State/ Territory
Average age/
Years of schooling
Part
icip
atio
nra
te (%
)
Abs
ent (
%)
Wit
hdra
wn
(%) Below national
minimum standard (%)
At national
minimum standard
(%)
Above national minimum standard (%)
At or above
national minimum standard
(%)Exempt Band 3 and below
Band 4 Band 5 Band 6 Band 7 Band 8 and above
NSW10yrs 7mths 5yrs 4mths
97.5 1.6 0.9 1.7 4.6 11.0 20.9 25.8 20.3 15.8 93.7
Vic10yrs 9mths 5yrs 4mths
95.2 2.6 2.2 3.1 2.7 9.5 20.6 26.8 21.3 16.0 94.2
Qld10yrs 5mths 5yrs 4mths
94.0 2.4 3.6 1.6 5.6 12.0 22.3 26.4 19.2 13.0 92.8
WA10yrs 5mths 5yrs 4mths
95.8 2.9 1.3 1.3 7.5 12.4 21.9 25.4 18.7 12.9 91.2
SA10yrs 7mths 5yrs 4mths
94.1 2.9 3.0 2.2 6.2 13.2 23.4 26.2 18.0 10.8 91.6
Tas10yrs 11mths 5yrs 4mths
95.6 2.7 1.7 1.7 7.0 12.4 20.7 24.0 18.6 15.6 91.3
ACT10yrs 8mths 5yrs 4mths
93.7 2.5 3.8 1.7 2.7 7.7 17.8 25.6 22.7 21.8 95.6
NT10yrs 6mths 5yrs 4mths
89.6 8.7 1.6 2.7 30.9 13.6 18.0 17.1 11.5 6.2 66.4
Aust10yrs 7mths 5yrs 4mths
95.6 2.3 2.1 2.0 5.1 11.2 21.3 26.0 19.9 14.6 92.9
Refer to the introduction for explanatory notes and how to read the graph.

67
NAPLAN Year 5 Reading
Figure 5.R2: Achievement of Year 5 Students in Reading, by Sex, by State and Territory, 2014.
Band 3andbelow
Band 4
Band 5
Band 6
Band 7
Band 8andabove
ACTQld SAWA TasVicNSW NT Aust
M F M F M F M F M F M F M F M F M F
700
600
400
500
300
200
100
Ach
ieve
men
t sco
res
NSW Vic Qld WA SA Tas ACT NT Aust
Male Mean scale score / (S.D.)
498.4 (79.6)
505.1 (74.0)
490.2 (78.2)
486.2 (82.6)
483.3 (76.3)
487.8 (85.2)
516.4 (77.6)
419.6 (112.6)
495.1 (79.4)
Female Mean scale score / (S.D.)
509.8 (75.3)
514.6 (71.8)
502.2 (74.5)
497.5 (77.9)
496.2 (74.2)
508.6 (81.1)
527.9 (75.8)
431.4 (112.8)
506.4 (76.0)
Table 5.R2: Achievement of Year 5 Students in Reading, by Sex, by State and Territory, 2014.
State/ Territory
Sex Below national minimum standard
(%)
At national minimum standard
(%)
Above national minimum standard (%)
At or above
national minimum standard
(%)Exempt Band 3
and belowBand 4 Band 5 Band 6 Band 7 Band 8
and above
NSW Male 2.2 5.7 12.2 21.3 24.8 19.0 14.7 92.0Female 1.1 3.4 9.7 20.4 26.8 21.7 16.9 95.5
Vic Male 4.1 3.3 10.4 21.1 26.1 20.2 14.7 92.5Female 2.0 2.1 8.5 20.1 27.5 22.5 17.4 96.0
Qld Male 2.0 6.8 13.3 22.7 25.5 17.6 12.0 91.2Female 1.2 4.3 10.6 21.8 27.3 20.8 14.0 94.5
WA Male 1.6 9.1 13.4 21.9 24.1 17.9 12.0 89.4Female 1.0 5.9 11.4 21.8 26.7 19.5 13.8 93.1
SA Male 2.7 7.4 14.6 23.8 25.2 16.7 9.5 89.8Female 1.5 4.9 11.6 23.0 27.3 19.4 12.2 93.6
Tas Male 2.1 9.0 14.2 22.1 22.2 16.9 13.4 88.8Female 1.3 4.9 10.4 19.2 25.9 20.3 18.0 93.9
ACT Male 2.1 3.1 9.1 18.6 25.2 21.7 20.1 94.8Female 1.3 2.2 6.2 16.9 25.9 23.9 23.6 96.6
NT Male 3.8 32.8 13.8 17.2 16.2 10.9 5.4 63.4Female 1.7 29.0 13.3 18.9 18.1 12.1 7.0 69.4
Aust Male 2.6 6.2 12.3 21.7 25.1 18.6 13.4 91.2Female 1.4 4.0 9.9 20.8 26.9 21.2 15.8 94.7
Refer to the introduction for explanatory notes and how to read the graph.
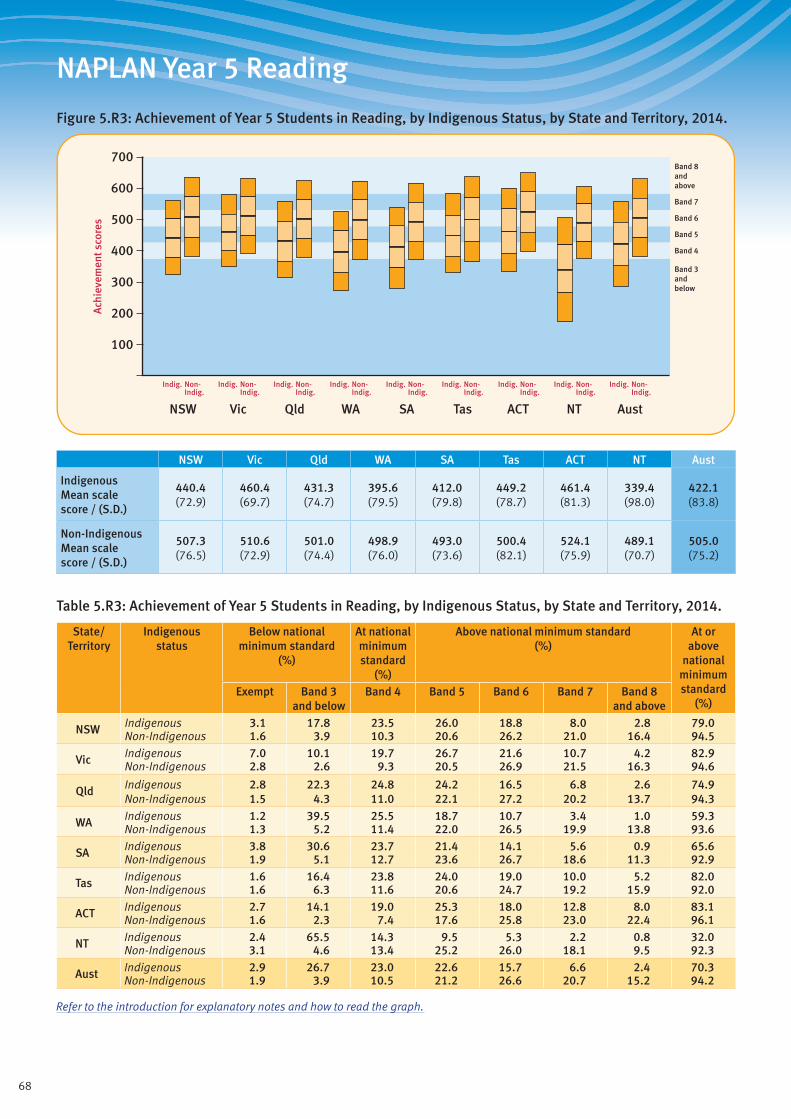
68
NAPLAN Year 5 Reading
Figure 5.R3: Achievement of Year 5 Students in Reading, by Indigenous Status, by State and Territory, 2014.
Band 3andbelow
Band 4
Band 5
Band 6
Band 7
Band 8andabove
ACTQld SAWA TasVicNSW NT Aust
700
600
400
500
300
200
100
Ach
ieve
men
t sco
res
Indig. Non-Indig.
Indig. Non-Indig.
Indig. Non-Indig.
Indig. Non-Indig.
Indig. Non-Indig.
Indig. Non-Indig.
Indig. Non-Indig.
Indig. Non-Indig.
Indig. Non-Indig.
NSW Vic Qld WA SA Tas ACT NT Aust
Indigenous Mean scale score / (S.D.)
440.4 (72.9)
460.4 (69.7)
431.3 (74.7)
395.6 (79.5)
412.0 (79.8)
449.2 (78.7)
461.4 (81.3)
339.4 (98.0)
422.1 (83.8)
Non-Indigenous Mean scale score / (S.D.)
507.3 (76.5)
510.6 (72.9)
501.0 (74.4)
498.9 (76.0)
493.0 (73.6)
500.4 (82.1)
524.1 (75.9)
489.1 (70.7)
505.0 (75.2)
Table 5.R3: Achievement of Year 5 Students in Reading, by Indigenous Status, by State and Territory, 2014.
State/ Territory
Indigenous status
Below national minimum standard
(%)
At national minimum standard
(%)
Above national minimum standard (%)
At or above
national minimum standard
(%)Exempt Band 3
and belowBand 4 Band 5 Band 6 Band 7 Band 8
and above
NSW Indigenous 3.1 17.8 23.5 26.0 18.8 8.0 2.8 79.0Non-Indigenous 1.6 3.9 10.3 20.6 26.2 21.0 16.4 94.5
Vic Indigenous 7.0 10.1 19.7 26.7 21.6 10.7 4.2 82.9Non-Indigenous 2.8 2.6 9.3 20.5 26.9 21.5 16.3 94.6
Qld Indigenous 2.8 22.3 24.8 24.2 16.5 6.8 2.6 74.9Non-Indigenous 1.5 4.3 11.0 22.1 27.2 20.2 13.7 94.3
WA Indigenous 1.2 39.5 25.5 18.7 10.7 3.4 1.0 59.3Non-Indigenous 1.3 5.2 11.4 22.0 26.5 19.9 13.8 93.6
SA Indigenous 3.8 30.6 23.7 21.4 14.1 5.6 0.9 65.6Non-Indigenous 1.9 5.1 12.7 23.6 26.7 18.6 11.3 92.9
Tas Indigenous 1.6 16.4 23.8 24.0 19.0 10.0 5.2 82.0Non-Indigenous 1.6 6.3 11.6 20.6 24.7 19.2 15.9 92.0
ACT Indigenous 2.7 14.1 19.0 25.3 18.0 12.8 8.0 83.1Non-Indigenous 1.6 2.3 7.4 17.6 25.8 23.0 22.4 96.1
NT Indigenous 2.4 65.5 14.3 9.5 5.3 2.2 0.8 32.0Non-Indigenous 3.1 4.6 13.4 25.2 26.0 18.1 9.5 92.3
Aust Indigenous 2.9 26.7 23.0 22.6 15.7 6.6 2.4 70.3Non-Indigenous 1.9 3.9 10.5 21.2 26.6 20.7 15.2 94.2
Refer to the introduction for explanatory notes and how to read the graph.
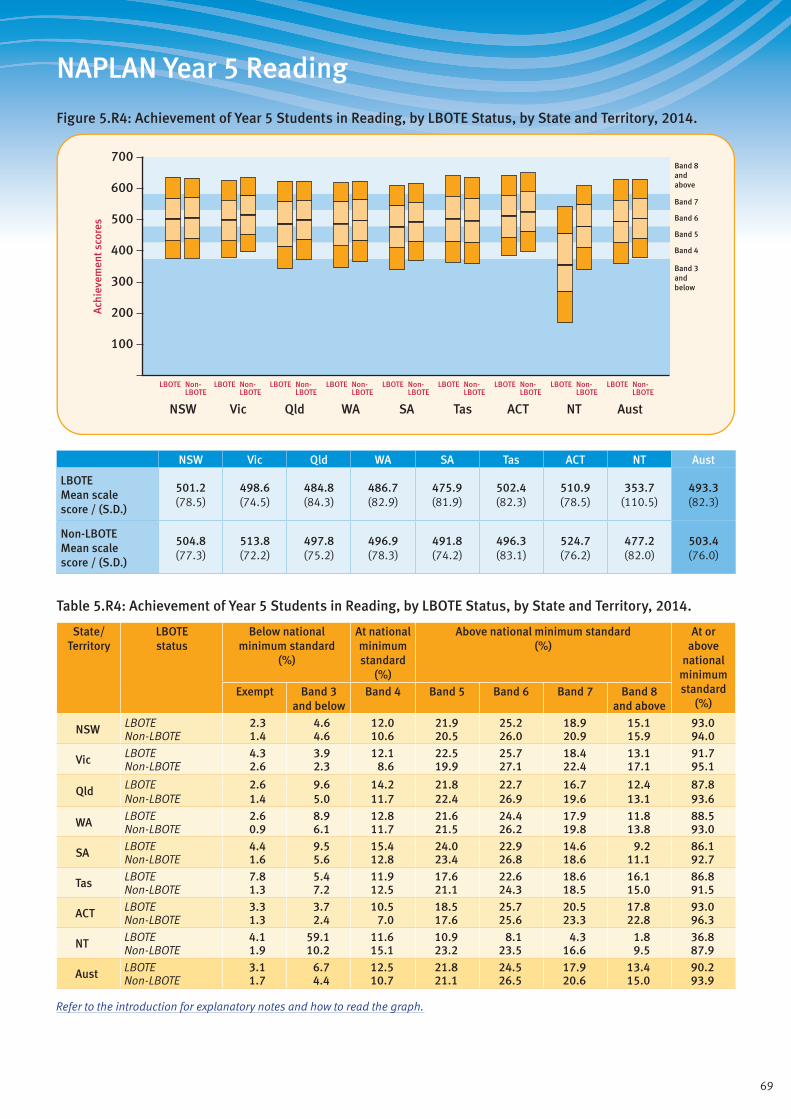
69
NAPLAN Year 5 Reading
Figure 5.R4: Achievement of Year 5 Students in Reading, by LBOTE Status, by State and Territory, 2014.
Band 3andbelow
Band 4
Band 5
Band 6
Band 7
Band 8and above
ACTQld SAWA TasVicNSW NT Aust
700
600
400
500
300
200
100
Ach
ieve
men
t sco
res
LBOTE Non-LBOTE
LBOTE Non-LBOTE
LBOTE Non-LBOTE
LBOTE Non-LBOTE
LBOTE Non-LBOTE
LBOTE Non-LBOTE
LBOTE Non-LBOTE
LBOTE Non-LBOTE
LBOTE Non-LBOTE
NSW Vic Qld WA SA Tas ACT NT Aust
LBOTE Mean scale score / (S.D.)
501.2 (78.5)
498.6 (74.5)
484.8 (84.3)
486.7 (82.9)
475.9 (81.9)
502.4 (82.3)
510.9 (78.5)
353.7 (110.5)
493.3 (82.3)
Non-LBOTE Mean scale score / (S.D.)
504.8 (77.3)
513.8 (72.2)
497.8 (75.2)
496.9 (78.3)
491.8 (74.2)
496.3 (83.1)
524.7 (76.2)
477.2 (82.0)
503.4 (76.0)
Table 5.R4: Achievement of Year 5 Students in Reading, by LBOTE Status, by State and Territory, 2014.
State/ Territory
LBOTE status
Below national minimum standard
(%)
At national minimum standard
(%)
Above national minimum standard (%)
At or above
national minimum standard
(%)Exempt Band 3
and belowBand 4 Band 5 Band 6 Band 7 Band 8
and above
NSW LBOTE 2.3 4.6 12.0 21.9 25.2 18.9 15.1 93.0Non-LBOTE 1.4 4.6 10.6 20.5 26.0 20.9 15.9 94.0
Vic LBOTE 4.3 3.9 12.1 22.5 25.7 18.4 13.1 91.7Non-LBOTE 2.6 2.3 8.6 19.9 27.1 22.4 17.1 95.1
Qld LBOTE 2.6 9.6 14.2 21.8 22.7 16.7 12.4 87.8Non-LBOTE 1.4 5.0 11.7 22.4 26.9 19.6 13.1 93.6
WA LBOTE 2.6 8.9 12.8 21.6 24.4 17.9 11.8 88.5Non-LBOTE 0.9 6.1 11.7 21.5 26.2 19.8 13.8 93.0
SA LBOTE 4.4 9.5 15.4 24.0 22.9 14.6 9.2 86.1Non-LBOTE 1.6 5.6 12.8 23.4 26.8 18.6 11.1 92.7
Tas LBOTE 7.8 5.4 11.9 17.6 22.6 18.6 16.1 86.8Non-LBOTE 1.3 7.2 12.5 21.1 24.3 18.5 15.0 91.5
ACT LBOTE 3.3 3.7 10.5 18.5 25.7 20.5 17.8 93.0Non-LBOTE 1.3 2.4 7.0 17.6 25.6 23.3 22.8 96.3
NT LBOTE 4.1 59.1 11.6 10.9 8.1 4.3 1.8 36.8Non-LBOTE 1.9 10.2 15.1 23.2 23.5 16.6 9.5 87.9
Aust LBOTE 3.1 6.7 12.5 21.8 24.5 17.9 13.4 90.2Non-LBOTE 1.7 4.4 10.7 21.1 26.5 20.6 15.0 93.9
Refer to the introduction for explanatory notes and how to read the graph.
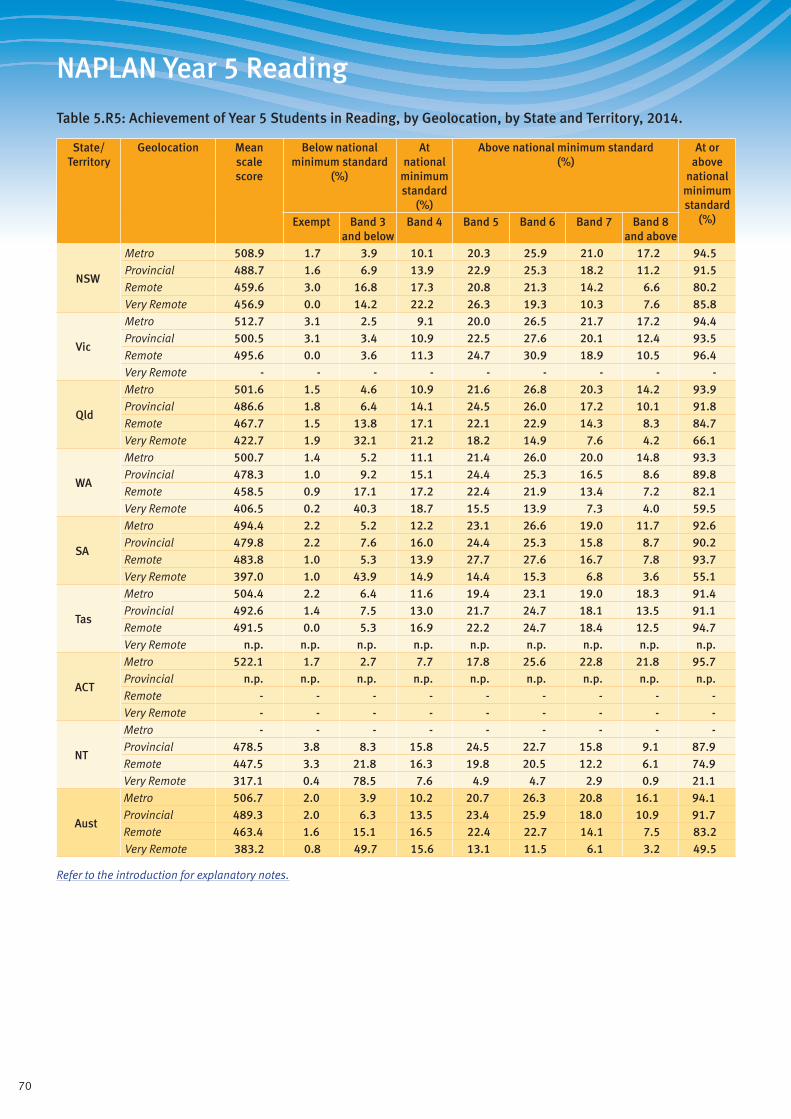
70
NAPLAN Year 5 Reading
Table 5.R5: Achievement of Year 5 Students in Reading, by Geolocation, by State and Territory, 2014.
State/ Territory
Geolocation Mean scale score
Below national minimum standard
(%)
At national
minimum standard
(%)
Above national minimum standard (%)
At or above
national minimum standard
(%)Exempt Band 3 and below
Band 4 Band 5 Band 6 Band 7 Band 8 and above
NSW
Metro 508.9 1.7 3.9 10.1 20.3 25.9 21.0 17.2 94.5Provincial 488.7 1.6 6.9 13.9 22.9 25.3 18.2 11.2 91.5Remote 459.6 3.0 16.8 17.3 20.8 21.3 14.2 6.6 80.2Very Remote 456.9 0.0 14.2 22.2 26.3 19.3 10.3 7.6 85.8
Vic
Metro 512.7 3.1 2.5 9.1 20.0 26.5 21.7 17.2 94.4Provincial 500.5 3.1 3.4 10.9 22.5 27.6 20.1 12.4 93.5Remote 495.6 0.0 3.6 11.3 24.7 30.9 18.9 10.5 96.4Very Remote - - - - - - - - -
Qld
Metro 501.6 1.5 4.6 10.9 21.6 26.8 20.3 14.2 93.9Provincial 486.6 1.8 6.4 14.1 24.5 26.0 17.2 10.1 91.8Remote 467.7 1.5 13.8 17.1 22.1 22.9 14.3 8.3 84.7Very Remote 422.7 1.9 32.1 21.2 18.2 14.9 7.6 4.2 66.1
WA
Metro 500.7 1.4 5.2 11.1 21.4 26.0 20.0 14.8 93.3Provincial 478.3 1.0 9.2 15.1 24.4 25.3 16.5 8.6 89.8Remote 458.5 0.9 17.1 17.2 22.4 21.9 13.4 7.2 82.1Very Remote 406.5 0.2 40.3 18.7 15.5 13.9 7.3 4.0 59.5
SA
Metro 494.4 2.2 5.2 12.2 23.1 26.6 19.0 11.7 92.6Provincial 479.8 2.2 7.6 16.0 24.4 25.3 15.8 8.7 90.2Remote 483.8 1.0 5.3 13.9 27.7 27.6 16.7 7.8 93.7Very Remote 397.0 1.0 43.9 14.9 14.4 15.3 6.8 3.6 55.1
Tas
Metro 504.4 2.2 6.4 11.6 19.4 23.1 19.0 18.3 91.4Provincial 492.6 1.4 7.5 13.0 21.7 24.7 18.1 13.5 91.1Remote 491.5 0.0 5.3 16.9 22.2 24.7 18.4 12.5 94.7Very Remote n.p. n.p. n.p. n.p. n.p. n.p. n.p. n.p. n.p.
ACT
Metro 522.1 1.7 2.7 7.7 17.8 25.6 22.8 21.8 95.7Provincial n.p. n.p. n.p. n.p. n.p. n.p. n.p. n.p. n.p.Remote - - - - - - - - -Very Remote - - - - - - - - -
NT
Metro - - - - - - - - -Provincial 478.5 3.8 8.3 15.8 24.5 22.7 15.8 9.1 87.9Remote 447.5 3.3 21.8 16.3 19.8 20.5 12.2 6.1 74.9Very Remote 317.1 0.4 78.5 7.6 4.9 4.7 2.9 0.9 21.1
Aust
Metro 506.7 2.0 3.9 10.2 20.7 26.3 20.8 16.1 94.1Provincial 489.3 2.0 6.3 13.5 23.4 25.9 18.0 10.9 91.7Remote 463.4 1.6 15.1 16.5 22.4 22.7 14.1 7.5 83.2Very Remote 383.2 0.8 49.7 15.6 13.1 11.5 6.1 3.2 49.5
Refer to the introduction for explanatory notes.
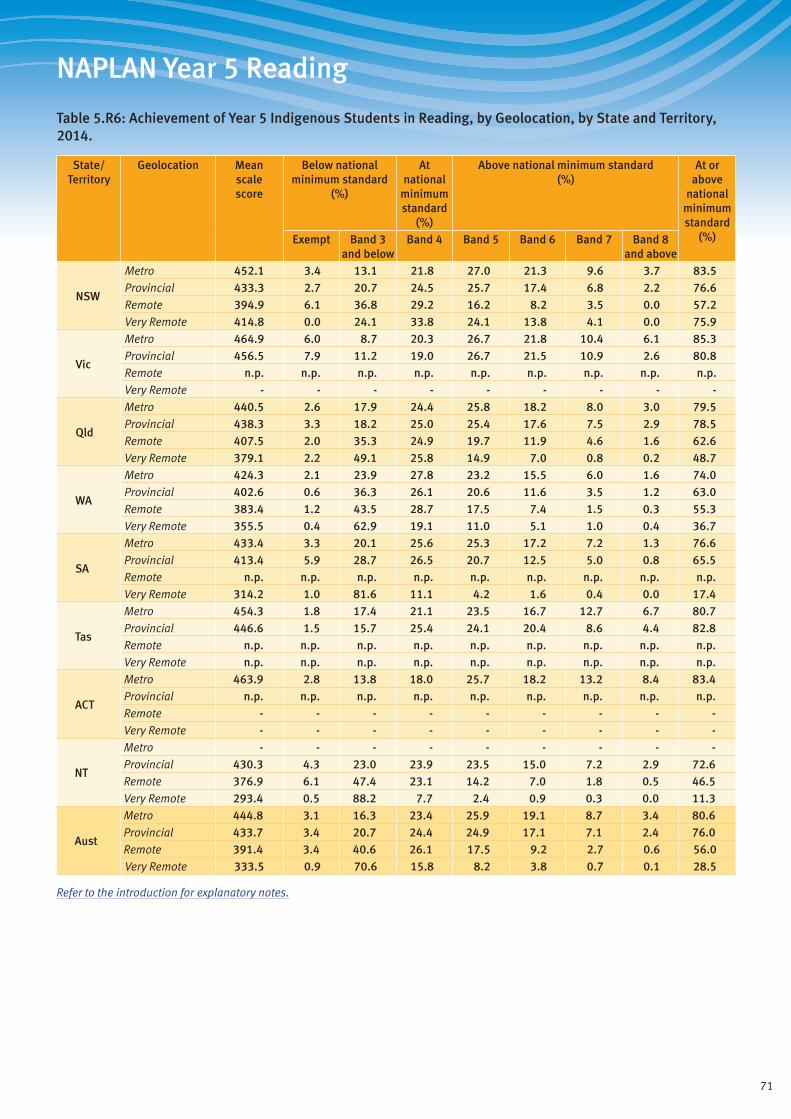
71
NAPLAN Year 5 Reading
Table 5.R6: Achievement of Year 5 Indigenous Students in Reading, by Geolocation, by State and Territory, 2014.
State/ Territory
Geolocation Mean scale score
Below national minimum standard
(%)
At national
minimum standard
(%)
Above national minimum standard (%)
At or above
national minimum standard
(%)Exempt Band 3 and below
Band 4 Band 5 Band 6 Band 7 Band 8 and above
NSW
Metro 452.1 3.4 13.1 21.8 27.0 21.3 9.6 3.7 83.5Provincial 433.3 2.7 20.7 24.5 25.7 17.4 6.8 2.2 76.6Remote 394.9 6.1 36.8 29.2 16.2 8.2 3.5 0.0 57.2Very Remote 414.8 0.0 24.1 33.8 24.1 13.8 4.1 0.0 75.9
Vic
Metro 464.9 6.0 8.7 20.3 26.7 21.8 10.4 6.1 85.3Provincial 456.5 7.9 11.2 19.0 26.7 21.5 10.9 2.6 80.8Remote n.p. n.p. n.p. n.p. n.p. n.p. n.p. n.p. n.p.Very Remote - - - - - - - - -
Qld
Metro 440.5 2.6 17.9 24.4 25.8 18.2 8.0 3.0 79.5Provincial 438.3 3.3 18.2 25.0 25.4 17.6 7.5 2.9 78.5Remote 407.5 2.0 35.3 24.9 19.7 11.9 4.6 1.6 62.6Very Remote 379.1 2.2 49.1 25.8 14.9 7.0 0.8 0.2 48.7
WA
Metro 424.3 2.1 23.9 27.8 23.2 15.5 6.0 1.6 74.0Provincial 402.6 0.6 36.3 26.1 20.6 11.6 3.5 1.2 63.0Remote 383.4 1.2 43.5 28.7 17.5 7.4 1.5 0.3 55.3Very Remote 355.5 0.4 62.9 19.1 11.0 5.1 1.0 0.4 36.7
SA
Metro 433.4 3.3 20.1 25.6 25.3 17.2 7.2 1.3 76.6Provincial 413.4 5.9 28.7 26.5 20.7 12.5 5.0 0.8 65.5Remote n.p. n.p. n.p. n.p. n.p. n.p. n.p. n.p. n.p.Very Remote 314.2 1.0 81.6 11.1 4.2 1.6 0.4 0.0 17.4
Tas
Metro 454.3 1.8 17.4 21.1 23.5 16.7 12.7 6.7 80.7Provincial 446.6 1.5 15.7 25.4 24.1 20.4 8.6 4.4 82.8Remote n.p. n.p. n.p. n.p. n.p. n.p. n.p. n.p. n.p.Very Remote n.p. n.p. n.p. n.p. n.p. n.p. n.p. n.p. n.p.
ACT
Metro 463.9 2.8 13.8 18.0 25.7 18.2 13.2 8.4 83.4Provincial n.p. n.p. n.p. n.p. n.p. n.p. n.p. n.p. n.p.Remote - - - - - - - - -Very Remote - - - - - - - - -
NT
Metro - - - - - - - - -Provincial 430.3 4.3 23.0 23.9 23.5 15.0 7.2 2.9 72.6Remote 376.9 6.1 47.4 23.1 14.2 7.0 1.8 0.5 46.5Very Remote 293.4 0.5 88.2 7.7 2.4 0.9 0.3 0.0 11.3
Aust
Metro 444.8 3.1 16.3 23.4 25.9 19.1 8.7 3.4 80.6Provincial 433.7 3.4 20.7 24.4 24.9 17.1 7.1 2.4 76.0Remote 391.4 3.4 40.6 26.1 17.5 9.2 2.7 0.6 56.0Very Remote 333.5 0.9 70.6 15.8 8.2 3.8 0.7 0.1 28.5
Refer to the introduction for explanatory notes.
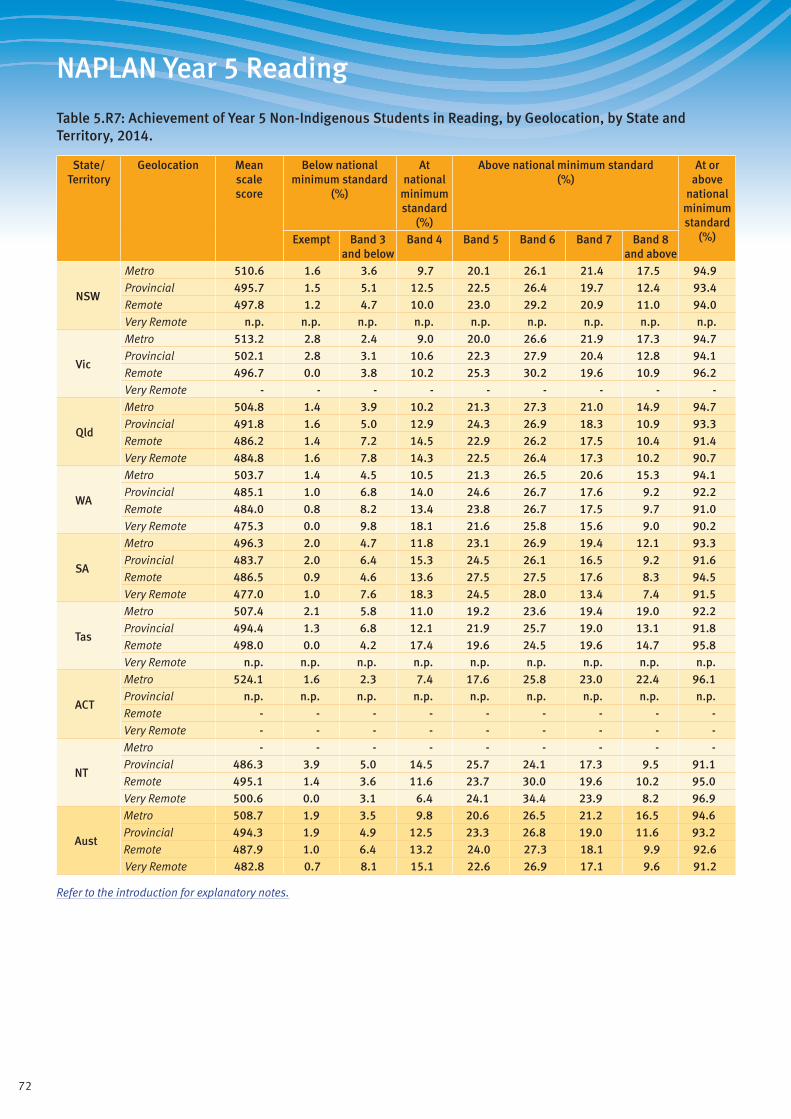
72
NAPLAN Year 5 Reading
Table 5.R7: Achievement of Year 5 Non-Indigenous Students in Reading, by Geolocation, by State and Territory, 2014.
State/ Territory
Geolocation Mean scale score
Below national minimum standard
(%)
At national
minimum standard
(%)
Above national minimum standard (%)
At or above
national minimum standard
(%)Exempt Band 3 and below
Band 4 Band 5 Band 6 Band 7 Band 8 and above
NSW
Metro 510.6 1.6 3.6 9.7 20.1 26.1 21.4 17.5 94.9Provincial 495.7 1.5 5.1 12.5 22.5 26.4 19.7 12.4 93.4Remote 497.8 1.2 4.7 10.0 23.0 29.2 20.9 11.0 94.0Very Remote n.p. n.p. n.p. n.p. n.p. n.p. n.p. n.p. n.p.
Vic
Metro 513.2 2.8 2.4 9.0 20.0 26.6 21.9 17.3 94.7Provincial 502.1 2.8 3.1 10.6 22.3 27.9 20.4 12.8 94.1Remote 496.7 0.0 3.8 10.2 25.3 30.2 19.6 10.9 96.2Very Remote - - - - - - - - -
Qld
Metro 504.8 1.4 3.9 10.2 21.3 27.3 21.0 14.9 94.7Provincial 491.8 1.6 5.0 12.9 24.3 26.9 18.3 10.9 93.3Remote 486.2 1.4 7.2 14.5 22.9 26.2 17.5 10.4 91.4Very Remote 484.8 1.6 7.8 14.3 22.5 26.4 17.3 10.2 90.7
WA
Metro 503.7 1.4 4.5 10.5 21.3 26.5 20.6 15.3 94.1Provincial 485.1 1.0 6.8 14.0 24.6 26.7 17.6 9.2 92.2Remote 484.0 0.8 8.2 13.4 23.8 26.7 17.5 9.7 91.0Very Remote 475.3 0.0 9.8 18.1 21.6 25.8 15.6 9.0 90.2
SA
Metro 496.3 2.0 4.7 11.8 23.1 26.9 19.4 12.1 93.3Provincial 483.7 2.0 6.4 15.3 24.5 26.1 16.5 9.2 91.6Remote 486.5 0.9 4.6 13.6 27.5 27.5 17.6 8.3 94.5Very Remote 477.0 1.0 7.6 18.3 24.5 28.0 13.4 7.4 91.5
Tas
Metro 507.4 2.1 5.8 11.0 19.2 23.6 19.4 19.0 92.2Provincial 494.4 1.3 6.8 12.1 21.9 25.7 19.0 13.1 91.8Remote 498.0 0.0 4.2 17.4 19.6 24.5 19.6 14.7 95.8Very Remote n.p. n.p. n.p. n.p. n.p. n.p. n.p. n.p. n.p.
ACT
Metro 524.1 1.6 2.3 7.4 17.6 25.8 23.0 22.4 96.1Provincial n.p. n.p. n.p. n.p. n.p. n.p. n.p. n.p. n.p.Remote - - - - - - - - -Very Remote - - - - - - - - -
NT
Metro - - - - - - - - -Provincial 486.3 3.9 5.0 14.5 25.7 24.1 17.3 9.5 91.1Remote 495.1 1.4 3.6 11.6 23.7 30.0 19.6 10.2 95.0Very Remote 500.6 0.0 3.1 6.4 24.1 34.4 23.9 8.2 96.9
Aust
Metro 508.7 1.9 3.5 9.8 20.6 26.5 21.2 16.5 94.6Provincial 494.3 1.9 4.9 12.5 23.3 26.8 19.0 11.6 93.2Remote 487.9 1.0 6.4 13.2 24.0 27.3 18.1 9.9 92.6Very Remote 482.8 0.7 8.1 15.1 22.6 26.9 17.1 9.6 91.2
Refer to the introduction for explanatory notes.
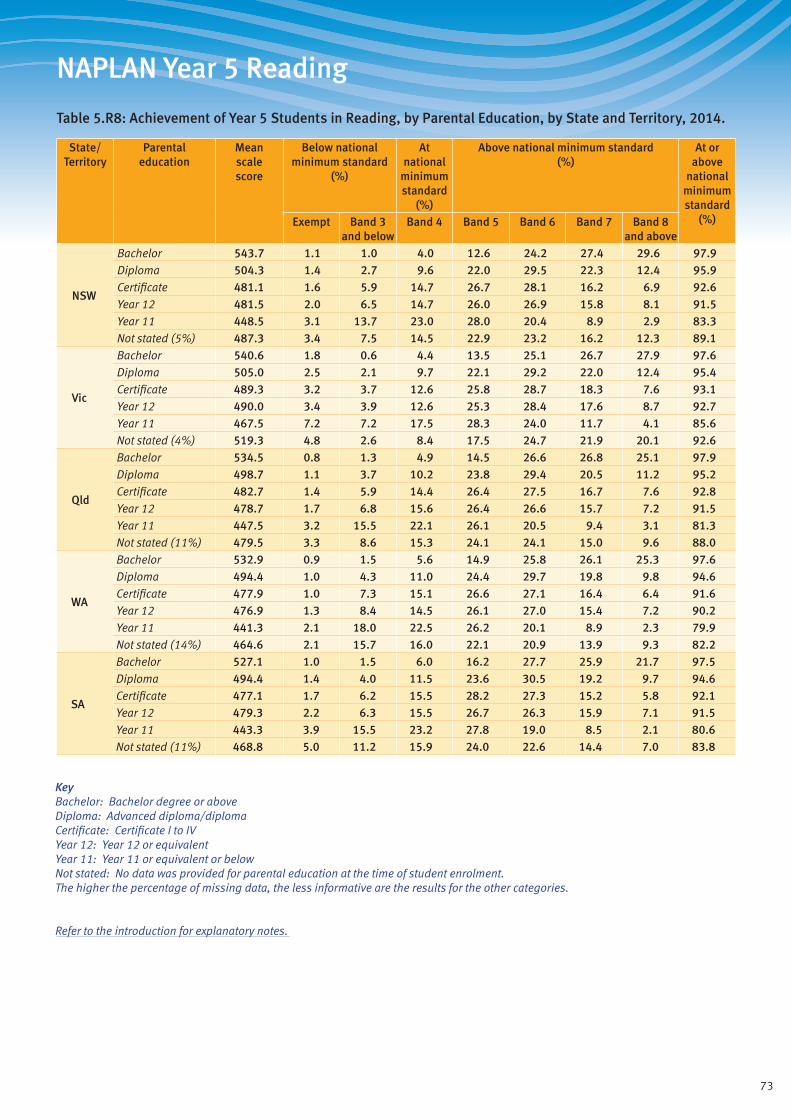
73
NAPLAN Year 5 Reading
Table 5.R8: Achievement of Year 5 Students in Reading, by Parental Education, by State and Territory, 2014.
State/ Territory
Parental education
Mean scale score
Below national minimum standard
(%)
At national
minimum standard
(%)
Above national minimum standard (%)
At or above
national minimum standard
(%)Exempt Band 3 and below
Band 4 Band 5 Band 6 Band 7 Band 8 and above
NSW
Bachelor 543.7 1.1 1.0 4.0 12.6 24.2 27.4 29.6 97.9Diploma 504.3 1.4 2.7 9.6 22.0 29.5 22.3 12.4 95.9Certificate 481.1 1.6 5.9 14.7 26.7 28.1 16.2 6.9 92.6Year 12 481.5 2.0 6.5 14.7 26.0 26.9 15.8 8.1 91.5Year 11 448.5 3.1 13.7 23.0 28.0 20.4 8.9 2.9 83.3Not stated (5%) 487.3 3.4 7.5 14.5 22.9 23.2 16.2 12.3 89.1
Vic
Bachelor 540.6 1.8 0.6 4.4 13.5 25.1 26.7 27.9 97.6Diploma 505.0 2.5 2.1 9.7 22.1 29.2 22.0 12.4 95.4Certificate 489.3 3.2 3.7 12.6 25.8 28.7 18.3 7.6 93.1Year 12 490.0 3.4 3.9 12.6 25.3 28.4 17.6 8.7 92.7Year 11 467.5 7.2 7.2 17.5 28.3 24.0 11.7 4.1 85.6Not stated (4%) 519.3 4.8 2.6 8.4 17.5 24.7 21.9 20.1 92.6
Qld
Bachelor 534.5 0.8 1.3 4.9 14.5 26.6 26.8 25.1 97.9Diploma 498.7 1.1 3.7 10.2 23.8 29.4 20.5 11.2 95.2Certificate 482.7 1.4 5.9 14.4 26.4 27.5 16.7 7.6 92.8Year 12 478.7 1.7 6.8 15.6 26.4 26.6 15.7 7.2 91.5Year 11 447.5 3.2 15.5 22.1 26.1 20.5 9.4 3.1 81.3Not stated (11%) 479.5 3.3 8.6 15.3 24.1 24.1 15.0 9.6 88.0
WA
Bachelor 532.9 0.9 1.5 5.6 14.9 25.8 26.1 25.3 97.6Diploma 494.4 1.0 4.3 11.0 24.4 29.7 19.8 9.8 94.6Certificate 477.9 1.0 7.3 15.1 26.6 27.1 16.4 6.4 91.6Year 12 476.9 1.3 8.4 14.5 26.1 27.0 15.4 7.2 90.2Year 11 441.3 2.1 18.0 22.5 26.2 20.1 8.9 2.3 79.9Not stated (14%) 464.6 2.1 15.7 16.0 22.1 20.9 13.9 9.3 82.2
SA
Bachelor 527.1 1.0 1.5 6.0 16.2 27.7 25.9 21.7 97.5Diploma 494.4 1.4 4.0 11.5 23.6 30.5 19.2 9.7 94.6Certificate 477.1 1.7 6.2 15.5 28.2 27.3 15.2 5.8 92.1Year 12 479.3 2.2 6.3 15.5 26.7 26.3 15.9 7.1 91.5Year 11 443.3 3.9 15.5 23.2 27.8 19.0 8.5 2.1 80.6Not stated (11%) 468.8 5.0 11.2 15.9 24.0 22.6 14.4 7.0 83.8
KeyBachelor: Bachelor degree or aboveDiploma: Advanced diploma/diplomaCertificate: Certificate I to IVYear 12: Year 12 or equivalentYear 11: Year 11 or equivalent or belowNot stated: No data was provided for parental education at the time of student enrolment. The higher the percentage of missing data, the less informative are the results for the other categories.
Refer to the introduction for explanatory notes.

74
NAPLAN Year 5 Reading
Table 5.R8 (cont.): Achievement of Year 5 Students in Reading, by Parental Education, by State and Territory, 2014.
State/ Territory
Parental education
Mean scale score
Below national minimum standard
(%)
At national
minimum standard
(%)
Above national minimum standard (%)
At or above
national minimum standard
(%)Exempt Band 3 and below
Band 4 Band 5 Band 6 Band 7 Band 8 and above
Tas
Bachelor 550.6 1.1 1.4 3.5 11.5 22.2 26.8 33.5 97.5Diploma 511.7 1.3 3.5 7.7 19.0 28.5 24.8 15.2 95.2Certificate 484.3 1.3 6.6 14.6 24.3 26.8 17.7 8.8 92.1Year 12 479.8 2.5 9.2 14.7 24.9 25.0 13.4 10.4 88.3Year 11 445.4 1.9 16.8 22.5 26.7 20.2 8.2 3.7 81.3Not stated (9%) 504.6 4.5 7.2 12.3 19.5 20.1 16.6 19.8 88.3
ACT
Bachelor 547.0 1.4 0.9 4.3 11.8 24.0 25.8 31.8 97.7Diploma 499.6 2.3 2.9 11.6 22.9 27.9 19.8 12.5 94.7Certificate 489.7 1.3 4.2 11.5 27.8 29.0 17.5 8.8 94.5Year 12 492.3 2.5 4.1 11.5 26.2 27.7 19.5 8.5 93.4Year 11 469.7 1.6 13.5 14.5 26.1 21.7 13.5 9.1 84.9Not stated (9%) 513.5 2.4 3.9 9.4 16.3 25.7 25.0 17.2 93.7
NT
Bachelor 513.9 1.3 1.9 8.7 19.9 27.5 23.9 16.8 96.8Diploma 486.2 1.7 4.1 13.9 27.0 27.3 18.9 7.2 94.2Certificate 452.4 2.4 15.2 18.0 26.5 21.4 12.2 4.3 82.3Year 12 454.9 4.4 12.9 21.3 24.8 21.5 10.7 4.4 82.7Year 11 368.0 2.5 53.6 17.5 13.1 9.2 3.0 1.2 43.9Not stated (29%) 355.3 4.0 60.1 9.7 9.1 7.8 5.6 3.7 35.9
Aust
Bachelor 539.1 1.2 1.1 4.6 13.7 25.2 26.8 27.4 97.7Diploma 501.6 1.6 3.0 10.0 22.7 29.5 21.4 11.8 95.4Certificate 482.7 1.9 5.6 14.2 26.5 27.9 16.8 7.2 92.5Year 12 482.2 2.3 6.2 14.4 26.0 27.1 16.2 7.9 91.5Year 11 450.4 4.1 13.8 21.2 27.2 21.0 9.6 3.2 82.2Not stated (8%) 477.5 3.5 11.5 14.1 21.8 22.4 15.6 11.1 85.1
KeyBachelor: Bachelor degree or aboveDiploma: Advanced diploma/diplomaCertificate: Certificate I to IVYear 12: Year 12 or equivalentYear 11: Year 11 or equivalent or belowNot stated: No data was provided for parental education at the time of student enrolment. The higher the percentage of missing data, the less informative are the results for the other categories.
Refer to the introduction for explanatory notes.

75
NAPLAN Year 5 Reading
Table 5.R9: Achievement of Year 5 Students in Reading, by Parental Occupation, by State and Territory, 2014.
State/ Territory
Parental occupation
Mean scale score
Below national minimum standard
(%)
At national
minimum standard
(%)
Above national minimum standard (%)
At or above
national minimum standard
(%)Exempt Band 3 and below
Band 4 Band 5 Band 6 Band 7 Band 8 and above
NSW
Group 1 544.3 0.9 1.0 4.1 12.7 23.9 27.5 30.0 98.1Group 2 517.0 1.0 2.2 7.6 19.0 28.3 24.3 17.7 96.8Group 3 491.1 1.4 4.3 12.4 25.1 29.2 18.4 9.2 94.3Group 4 471.1 2.0 7.9 17.7 27.7 25.7 13.3 5.8 90.1Not in paid work 455.5 3.9 12.7 21.5 26.5 20.1 10.2 5.0 83.4Not stated (10%) 476.4 3.6 9.3 16.7 24.2 22.5 14.1 9.7 87.2
Vic
Group 1 545.0 1.2 0.5 3.8 12.8 24.3 27.5 30.0 98.3Group 2 519.4 1.9 1.2 7.2 18.8 28.9 23.9 18.1 96.9Group 3 498.9 2.2 2.5 10.6 24.4 29.5 20.5 10.4 95.4Group 4 482.0 4.2 5.0 14.8 26.6 26.8 15.9 6.8 90.8Not in paid work 470.1 9.0 7.6 16.9 25.9 23.0 12.2 5.4 83.4Not stated (3%) 520.4 5.2 2.3 8.5 17.5 24.0 22.0 20.5 92.5
Qld
Group 1 534.1 0.7 1.5 4.9 14.6 26.6 26.4 25.2 97.8Group 2 509.1 0.8 2.7 8.5 21.3 29.2 23.1 14.5 96.5Group 3 487.4 1.3 5.0 13.4 25.9 28.1 17.7 8.6 93.7Group 4 466.6 1.9 9.3 18.9 27.1 24.5 12.7 5.4 88.8Not in paid work 449.2 4.1 16.4 21.3 24.5 18.9 9.9 4.9 79.4Not stated (16%) 475.6 3.3 9.1 16.1 24.8 23.9 14.3 8.5 87.6
WA
Group 1 531.3 0.7 1.7 5.7 15.6 25.9 25.9 24.6 97.5Group 2 504.9 0.7 3.6 9.9 20.8 28.7 22.4 14.0 95.7Group 3 482.6 0.9 6.2 14.5 26.0 27.5 17.2 7.7 92.9Group 4 463.3 1.4 11.2 18.0 27.9 23.7 12.8 4.9 87.4Not in paid work 447.2 2.9 19.1 19.2 24.2 20.3 9.1 5.3 78.0Not stated (23%) 468.0 2.2 13.5 16.1 23.1 22.5 13.9 8.7 84.3
SA
Group 1 528.3 1.0 1.6 5.5 16.2 27.8 25.5 22.4 97.4Group 2 503.0 1.0 2.9 9.9 22.3 29.7 21.8 12.3 96.0Group 3 484.8 1.1 4.8 13.6 27.0 29.2 16.7 7.6 94.0Group 4 466.2 2.3 8.8 19.1 28.0 24.4 12.5 4.8 88.9Not in paid work 454.3 3.9 13.7 21.1 25.9 19.7 11.7 3.9 82.3Not stated (19%) 462.1 4.9 12.1 18.1 25.3 21.1 12.8 5.7 83.0
KeyGroup 1: Senior management and qualified professionalsGroup 2: Other business managers and associate professionalsGroup 3: Tradespeople, clerks, skilled office, sales and service staffGroup 4: Machine operators, hospitality staff, assistants, labourersNot in paid work: Not in paid work in the previous 12 monthsNot stated: No data was provided for parental occupation at the time of student enrolment. The higher the percentage of missing data, the less informative are the results for the other categories.
Refer to the introduction for explanatory notes.
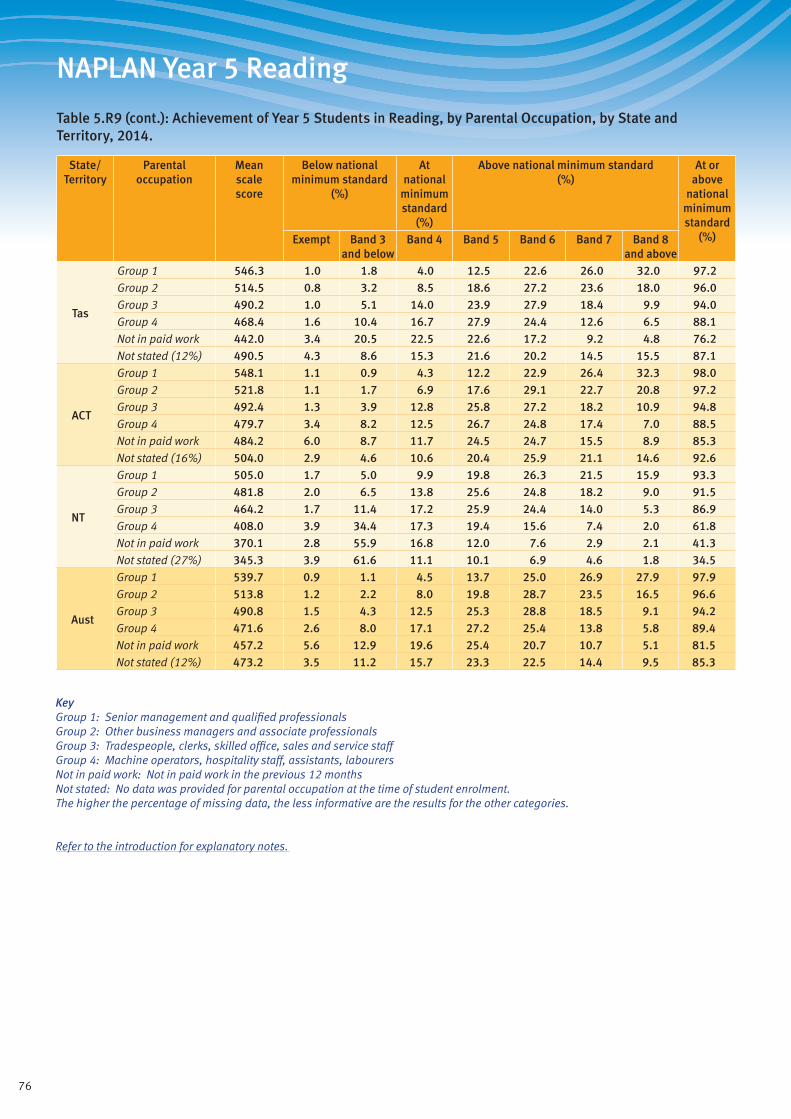
76
NAPLAN Year 5 Reading
Table 5.R9 (cont.): Achievement of Year 5 Students in Reading, by Parental Occupation, by State and Territory, 2014.
State/ Territory
Parental occupation
Mean scale score
Below national minimum standard
(%)
At national
minimum standard
(%)
Above national minimum standard (%)
At or above
national minimum standard
(%)Exempt Band 3 and below
Band 4 Band 5 Band 6 Band 7 Band 8 and above
Tas
Group 1 546.3 1.0 1.8 4.0 12.5 22.6 26.0 32.0 97.2Group 2 514.5 0.8 3.2 8.5 18.6 27.2 23.6 18.0 96.0Group 3 490.2 1.0 5.1 14.0 23.9 27.9 18.4 9.9 94.0Group 4 468.4 1.6 10.4 16.7 27.9 24.4 12.6 6.5 88.1Not in paid work 442.0 3.4 20.5 22.5 22.6 17.2 9.2 4.8 76.2Not stated (12%) 490.5 4.3 8.6 15.3 21.6 20.2 14.5 15.5 87.1
ACT
Group 1 548.1 1.1 0.9 4.3 12.2 22.9 26.4 32.3 98.0Group 2 521.8 1.1 1.7 6.9 17.6 29.1 22.7 20.8 97.2Group 3 492.4 1.3 3.9 12.8 25.8 27.2 18.2 10.9 94.8Group 4 479.7 3.4 8.2 12.5 26.7 24.8 17.4 7.0 88.5Not in paid work 484.2 6.0 8.7 11.7 24.5 24.7 15.5 8.9 85.3Not stated (16%) 504.0 2.9 4.6 10.6 20.4 25.9 21.1 14.6 92.6
NT
Group 1 505.0 1.7 5.0 9.9 19.8 26.3 21.5 15.9 93.3Group 2 481.8 2.0 6.5 13.8 25.6 24.8 18.2 9.0 91.5Group 3 464.2 1.7 11.4 17.2 25.9 24.4 14.0 5.3 86.9Group 4 408.0 3.9 34.4 17.3 19.4 15.6 7.4 2.0 61.8Not in paid work 370.1 2.8 55.9 16.8 12.0 7.6 2.9 2.1 41.3Not stated (27%) 345.3 3.9 61.6 11.1 10.1 6.9 4.6 1.8 34.5
Aust
Group 1 539.7 0.9 1.1 4.5 13.7 25.0 26.9 27.9 97.9Group 2 513.8 1.2 2.2 8.0 19.8 28.7 23.5 16.5 96.6Group 3 490.8 1.5 4.3 12.5 25.3 28.8 18.5 9.1 94.2Group 4 471.6 2.6 8.0 17.1 27.2 25.4 13.8 5.8 89.4Not in paid work 457.2 5.6 12.9 19.6 25.4 20.7 10.7 5.1 81.5Not stated (12%) 473.2 3.5 11.2 15.7 23.3 22.5 14.4 9.5 85.3
KeyGroup 1: Senior management and qualified professionalsGroup 2: Other business managers and associate professionalsGroup 3: Tradespeople, clerks, skilled office, sales and service staffGroup 4: Machine operators, hospitality staff, assistants, labourersNot in paid work: Not in paid work in the previous 12 monthsNot stated: No data was provided for parental occupation at the time of student enrolment. The higher the percentage of missing data, the less informative are the results for the other categories.
Refer to the introduction for explanatory notes.
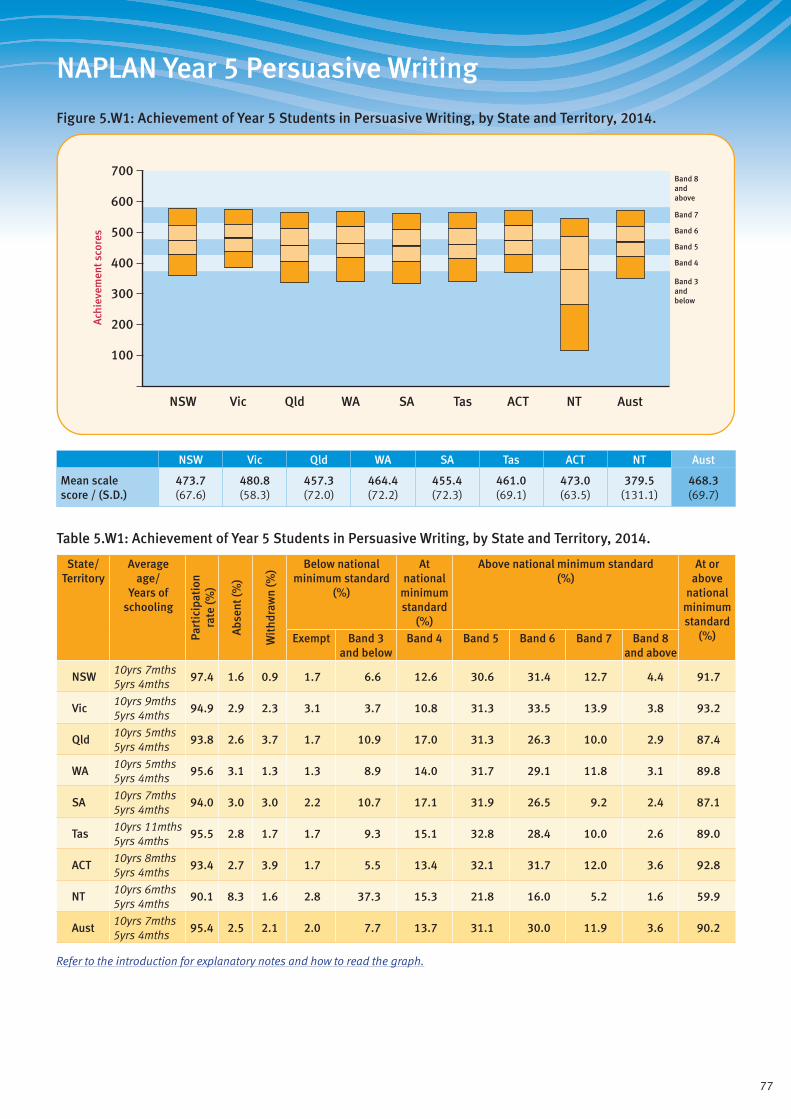
77
NAPLAN Year 5 Persuasive Writing
Figure 5.W1: Achievement of Year 5 Students in Persuasive Writing, by State and Territory, 2014.
Band 3andbelow
Band 4
Band 5
Band 6
Band 7
Band 8andabove
700
600
400
500
300
200
100
Ach
ieve
men
t sco
res
ACTQld SAWA TasVicNSW NT Aust
NSW Vic Qld WA SA Tas ACT NT Aust
Mean scale score / (S.D.)
473.7 (67.6)
480.8 (58.3)
457.3 (72.0)
464.4 (72.2)
455.4 (72.3)
461.0 (69.1)
473.0 (63.5)
379.5 (131.1)
468.3 (69.7)
Table 5.W1: Achievement of Year 5 Students in Persuasive Writing, by State and Territory, 2014.
State/ Territory
Average age/
Years of schooling
Part
icip
atio
nra
te (%
)
Abs
ent (
%)
Wit
hdra
wn
(%) Below national
minimum standard (%)
At national
minimum standard
(%)
Above national minimum standard (%)
At or above
national minimum standard
(%)Exempt Band 3 and below
Band 4 Band 5 Band 6 Band 7 Band 8 and above
NSW10yrs 7mths 5yrs 4mths
97.4 1.6 0.9 1.7 6.6 12.6 30.6 31.4 12.7 4.4 91.7
Vic10yrs 9mths 5yrs 4mths
94.9 2.9 2.3 3.1 3.7 10.8 31.3 33.5 13.9 3.8 93.2
Qld10yrs 5mths 5yrs 4mths
93.8 2.6 3.7 1.7 10.9 17.0 31.3 26.3 10.0 2.9 87.4
WA10yrs 5mths 5yrs 4mths
95.6 3.1 1.3 1.3 8.9 14.0 31.7 29.1 11.8 3.1 89.8
SA10yrs 7mths 5yrs 4mths
94.0 3.0 3.0 2.2 10.7 17.1 31.9 26.5 9.2 2.4 87.1
Tas10yrs 11mths 5yrs 4mths
95.5 2.8 1.7 1.7 9.3 15.1 32.8 28.4 10.0 2.6 89.0
ACT10yrs 8mths 5yrs 4mths
93.4 2.7 3.9 1.7 5.5 13.4 32.1 31.7 12.0 3.6 92.8
NT10yrs 6mths 5yrs 4mths
90.1 8.3 1.6 2.8 37.3 15.3 21.8 16.0 5.2 1.6 59.9
Aust10yrs 7mths 5yrs 4mths
95.4 2.5 2.1 2.0 7.7 13.7 31.1 30.0 11.9 3.6 90.2
Refer to the introduction for explanatory notes and how to read the graph.
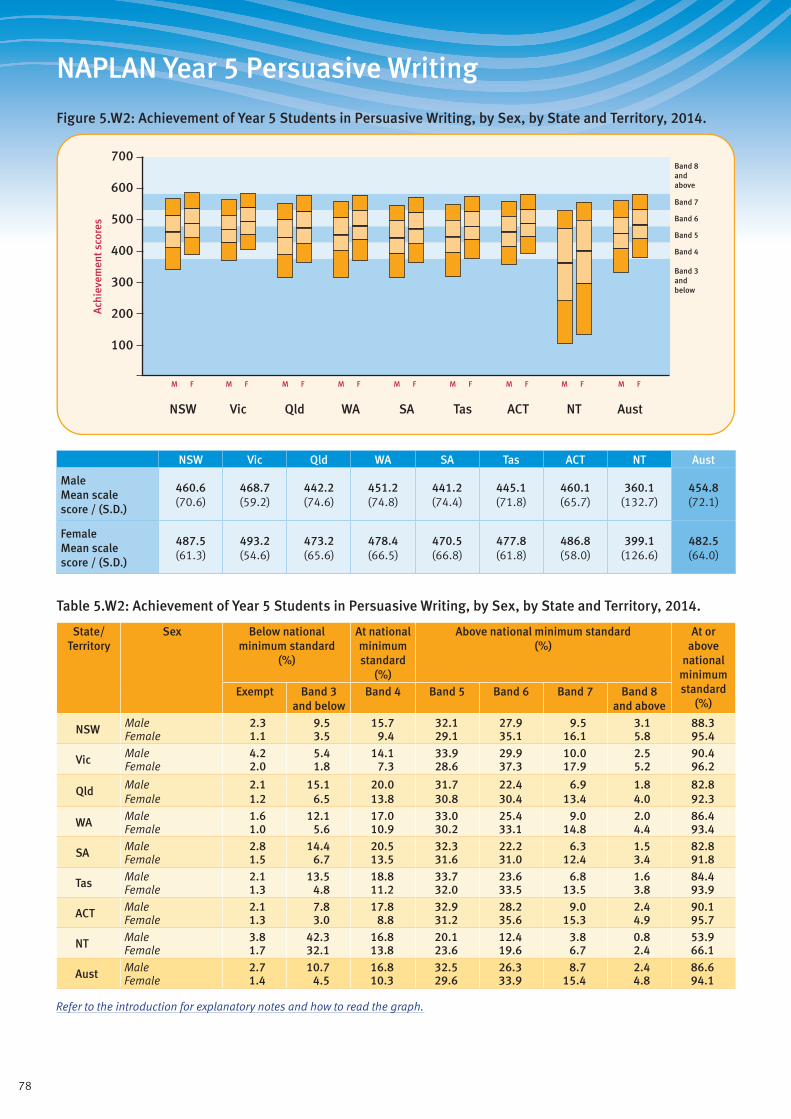
78
NAPLAN Year 5 Persuasive Writing
Figure 5.W2: Achievement of Year 5 Students in Persuasive Writing, by Sex, by State and Territory, 2014.
Band 3andbelow
Band 4
Band 5
Band 6
Band 7
Band 8andabove
ACTQld SAWA TasVicNSW NT Aust
M F M F M F M F M F M F M F M F M F
700
600
400
500
300
200
100
Ach
ieve
men
t sco
res
NSW Vic Qld WA SA Tas ACT NT Aust
Male Mean scale score / (S.D.)
460.6 (70.6)
468.7 (59.2)
442.2 (74.6)
451.2 (74.8)
441.2 (74.4)
445.1 (71.8)
460.1 (65.7)
360.1 (132.7)
454.8 (72.1)
Female Mean scale score / (S.D.)
487.5 (61.3)
493.2 (54.6)
473.2 (65.6)
478.4 (66.5)
470.5 (66.8)
477.8 (61.8)
486.8 (58.0)
399.1 (126.6)
482.5 (64.0)
Table 5.W2: Achievement of Year 5 Students in Persuasive Writing, by Sex, by State and Territory, 2014.
State/ Territory
Sex Below national minimum standard
(%)
At national minimum standard
(%)
Above national minimum standard (%)
At or above
national minimum standard
(%)Exempt Band 3
and belowBand 4 Band 5 Band 6 Band 7 Band 8
and above
NSW Male 2.3 9.5 15.7 32.1 27.9 9.5 3.1 88.3Female 1.1 3.5 9.4 29.1 35.1 16.1 5.8 95.4
Vic Male 4.2 5.4 14.1 33.9 29.9 10.0 2.5 90.4Female 2.0 1.8 7.3 28.6 37.3 17.9 5.2 96.2
Qld Male 2.1 15.1 20.0 31.7 22.4 6.9 1.8 82.8Female 1.2 6.5 13.8 30.8 30.4 13.4 4.0 92.3
WA Male 1.6 12.1 17.0 33.0 25.4 9.0 2.0 86.4Female 1.0 5.6 10.9 30.2 33.1 14.8 4.4 93.4
SA Male 2.8 14.4 20.5 32.3 22.2 6.3 1.5 82.8Female 1.5 6.7 13.5 31.6 31.0 12.4 3.4 91.8
Tas Male 2.1 13.5 18.8 33.7 23.6 6.8 1.6 84.4Female 1.3 4.8 11.2 32.0 33.5 13.5 3.8 93.9
ACT Male 2.1 7.8 17.8 32.9 28.2 9.0 2.4 90.1Female 1.3 3.0 8.8 31.2 35.6 15.3 4.9 95.7
NT Male 3.8 42.3 16.8 20.1 12.4 3.8 0.8 53.9Female 1.7 32.1 13.8 23.6 19.6 6.7 2.4 66.1
Aust Male 2.7 10.7 16.8 32.5 26.3 8.7 2.4 86.6Female 1.4 4.5 10.3 29.6 33.9 15.4 4.8 94.1
Refer to the introduction for explanatory notes and how to read the graph.
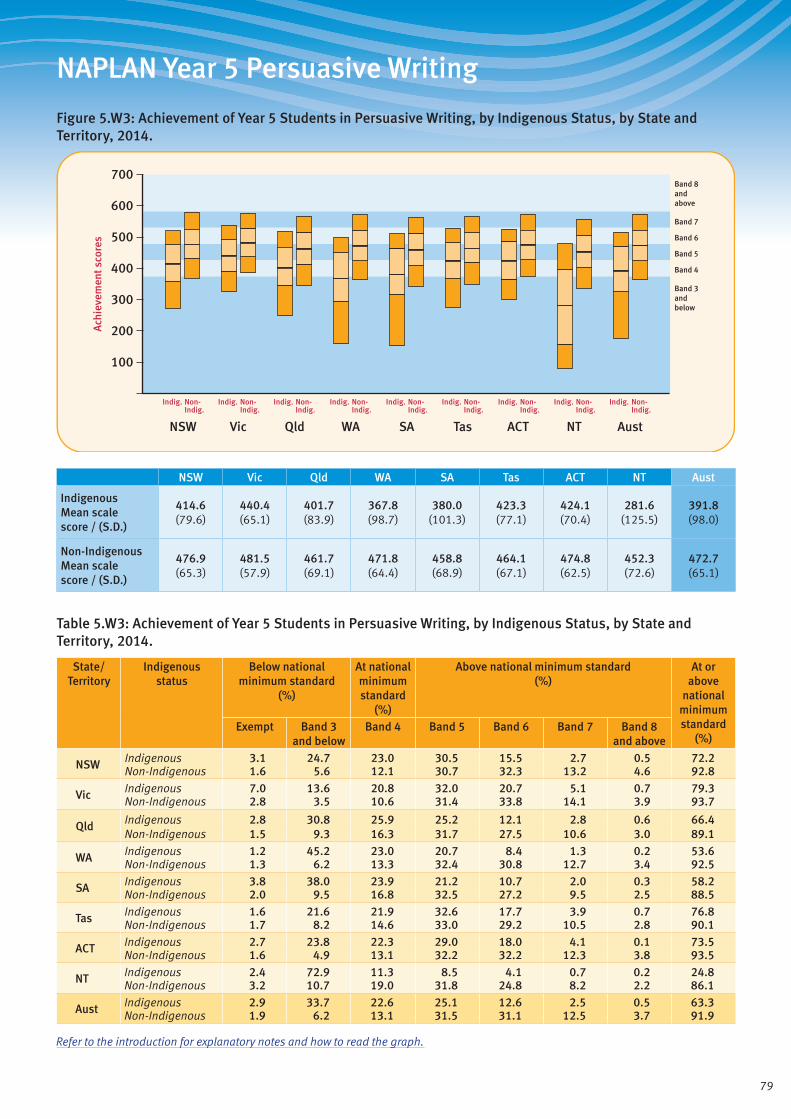
79
NAPLAN Year 5 Persuasive Writing
Figure 5.W3: Achievement of Year 5 Students in Persuasive Writing, by Indigenous Status, by State and Territory, 2014.
Band 3andbelow
Band 4
Band 5
Band 6
Band 7
Band 8andabove
ACTQld SAWA TasVicNSW NT Aust
700
600
400
500
300
200
100
Ach
ieve
men
t sco
res
Indig. Non-Indig.
Indig. Non-Indig.
Indig. Non-Indig.
Indig. Non-Indig.
Indig. Non-Indig.
Indig. Non-Indig.
Indig. Non-Indig.
Indig. Non-Indig.
Indig. Non-Indig.
NSW Vic Qld WA SA Tas ACT NT Aust
Indigenous Mean scale score / (S.D.)
414.6 (79.6)
440.4 (65.1)
401.7 (83.9)
367.8 (98.7)
380.0 (101.3)
423.3 (77.1)
424.1 (70.4)
281.6 (125.5)
391.8 (98.0)
Non-Indigenous Mean scale score / (S.D.)
476.9 (65.3)
481.5 (57.9)
461.7 (69.1)
471.8 (64.4)
458.8 (68.9)
464.1 (67.1)
474.8 (62.5)
452.3 (72.6)
472.7 (65.1)
Table 5.W3: Achievement of Year 5 Students in Persuasive Writing, by Indigenous Status, by State and Territory, 2014.
State/ Territory
Indigenous status
Below national minimum standard
(%)
At national minimum standard
(%)
Above national minimum standard (%)
At or above
national minimum standard
(%)Exempt Band 3
and belowBand 4 Band 5 Band 6 Band 7 Band 8
and above
NSW Indigenous 3.1 24.7 23.0 30.5 15.5 2.7 0.5 72.2Non-Indigenous 1.6 5.6 12.1 30.7 32.3 13.2 4.6 92.8
Vic Indigenous 7.0 13.6 20.8 32.0 20.7 5.1 0.7 79.3Non-Indigenous 2.8 3.5 10.6 31.4 33.8 14.1 3.9 93.7
Qld Indigenous 2.8 30.8 25.9 25.2 12.1 2.8 0.6 66.4Non-Indigenous 1.5 9.3 16.3 31.7 27.5 10.6 3.0 89.1
WA Indigenous 1.2 45.2 23.0 20.7 8.4 1.3 0.2 53.6Non-Indigenous 1.3 6.2 13.3 32.4 30.8 12.7 3.4 92.5
SA Indigenous 3.8 38.0 23.9 21.2 10.7 2.0 0.3 58.2Non-Indigenous 2.0 9.5 16.8 32.5 27.2 9.5 2.5 88.5
Tas Indigenous 1.6 21.6 21.9 32.6 17.7 3.9 0.7 76.8Non-Indigenous 1.7 8.2 14.6 33.0 29.2 10.5 2.8 90.1
ACT Indigenous 2.7 23.8 22.3 29.0 18.0 4.1 0.1 73.5Non-Indigenous 1.6 4.9 13.1 32.2 32.2 12.3 3.8 93.5
NT Indigenous 2.4 72.9 11.3 8.5 4.1 0.7 0.2 24.8Non-Indigenous 3.2 10.7 19.0 31.8 24.8 8.2 2.2 86.1
Aust Indigenous 2.9 33.7 22.6 25.1 12.6 2.5 0.5 63.3Non-Indigenous 1.9 6.2 13.1 31.5 31.1 12.5 3.7 91.9
Refer to the introduction for explanatory notes and how to read the graph.
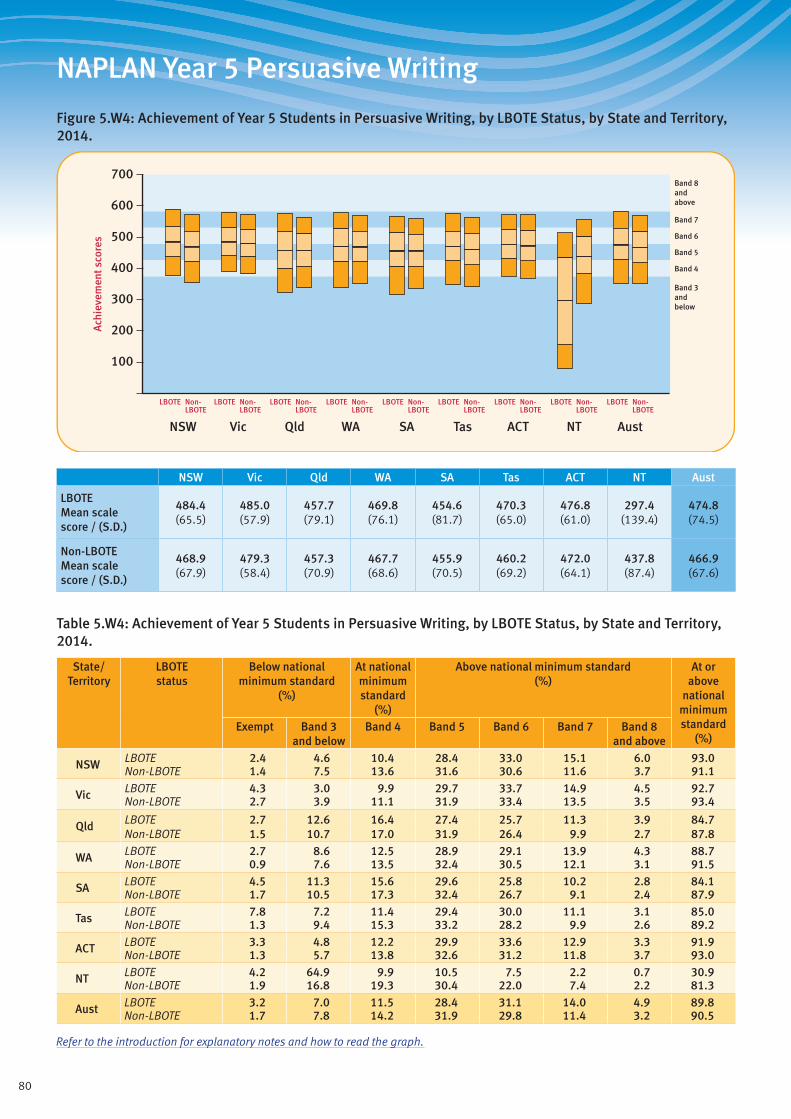
80
NAPLAN Year 5 Persuasive Writing
Figure 5.W4: Achievement of Year 5 Students in Persuasive Writing, by LBOTE Status, by State and Territory, 2014.
Band 3andbelow
Band 4
Band 5
Band 6
Band 7
Band 8andabove
ACTQld SAWA TasVicNSW NT Aust
700
600
400
500
300
200
100
Ach
ieve
men
t sco
res
LBOTE Non-LBOTE
LBOTE Non-LBOTE
LBOTE Non-LBOTE
LBOTE Non-LBOTE
LBOTE Non-LBOTE
LBOTE Non-LBOTE
LBOTE Non-LBOTE
LBOTE Non-LBOTE
LBOTE Non-LBOTE
NSW Vic Qld WA SA Tas ACT NT Aust
LBOTE Mean scale score / (S.D.)
484.4 (65.5)
485.0 (57.9)
457.7 (79.1)
469.8 (76.1)
454.6 (81.7)
470.3 (65.0)
476.8 (61.0)
297.4 (139.4)
474.8 (74.5)
Non-LBOTE Mean scale score / (S.D.)
468.9 (67.9)
479.3 (58.4)
457.3 (70.9)
467.7 (68.6)
455.9 (70.5)
460.2 (69.2)
472.0 (64.1)
437.8 (87.4)
466.9 (67.6)
Table 5.W4: Achievement of Year 5 Students in Persuasive Writing, by LBOTE Status, by State and Territory, 2014.
State/ Territory
LBOTE status
Below national minimum standard
(%)
At national minimum standard
(%)
Above national minimum standard (%)
At or above
national minimum standard
(%)Exempt Band 3
and belowBand 4 Band 5 Band 6 Band 7 Band 8
and above
NSW LBOTE 2.4 4.6 10.4 28.4 33.0 15.1 6.0 93.0Non-LBOTE 1.4 7.5 13.6 31.6 30.6 11.6 3.7 91.1
Vic LBOTE 4.3 3.0 9.9 29.7 33.7 14.9 4.5 92.7Non-LBOTE 2.7 3.9 11.1 31.9 33.4 13.5 3.5 93.4
Qld LBOTE 2.7 12.6 16.4 27.4 25.7 11.3 3.9 84.7Non-LBOTE 1.5 10.7 17.0 31.9 26.4 9.9 2.7 87.8
WA LBOTE 2.7 8.6 12.5 28.9 29.1 13.9 4.3 88.7Non-LBOTE 0.9 7.6 13.5 32.4 30.5 12.1 3.1 91.5
SA LBOTE 4.5 11.3 15.6 29.6 25.8 10.2 2.8 84.1Non-LBOTE 1.7 10.5 17.3 32.4 26.7 9.1 2.4 87.9
Tas LBOTE 7.8 7.2 11.4 29.4 30.0 11.1 3.1 85.0Non-LBOTE 1.3 9.4 15.3 33.2 28.2 9.9 2.6 89.2
ACT LBOTE 3.3 4.8 12.2 29.9 33.6 12.9 3.3 91.9Non-LBOTE 1.3 5.7 13.8 32.6 31.2 11.8 3.7 93.0
NT LBOTE 4.2 64.9 9.9 10.5 7.5 2.2 0.7 30.9Non-LBOTE 1.9 16.8 19.3 30.4 22.0 7.4 2.2 81.3
Aust LBOTE 3.2 7.0 11.5 28.4 31.1 14.0 4.9 89.8Non-LBOTE 1.7 7.8 14.2 31.9 29.8 11.4 3.2 90.5
Refer to the introduction for explanatory notes and how to read the graph.

81
NAPLAN Year 5 Persuasive Writing
Table 5.W5: Achievement of Year 5 Students in Persuasive Writing, by Geolocation, by State and Territory, 2014.
State/ Territory
Geolocation Mean scale score
Below national minimum standard
(%)
At national
minimum standard
(%)
Above national minimum standard (%)
At or above
national minimum standard
(%)Exempt Band 3 and below
Band 4 Band 5 Band 6 Band 7 Band 8 and above
NSW
Metro 480.6 1.7 5.1 11.1 29.6 33.0 14.3 5.2 93.2Provincial 452.0 1.6 11.1 17.7 34.1 26.2 7.5 1.8 87.3Remote 431.1 3.0 18.0 21.3 31.9 20.0 5.1 0.7 79.0Very Remote 409.1 0.0 29.2 21.8 29.0 16.6 3.1 0.2 70.8
Vic
Metro 485.5 3.1 3.0 9.5 30.0 34.8 15.2 4.4 93.9Provincial 465.5 3.1 5.7 14.9 35.6 29.5 9.4 1.8 91.2Remote 453.8 0.0 5.8 24.4 38.9 20.7 9.1 1.1 94.2Very Remote - - - - - - - - -
Qld
Metro 463.4 1.6 9.4 15.6 30.8 27.8 11.3 3.4 89.0Provincial 446.8 1.8 12.9 20.0 32.8 23.4 7.4 1.7 85.3Remote 428.5 1.7 20.2 20.0 29.3 20.6 6.8 1.3 78.0Very Remote 396.6 1.9 35.1 22.1 23.7 13.3 3.2 0.6 63.0
WA
Metro 474.2 1.5 6.1 12.5 31.3 31.2 13.6 3.8 92.4Provincial 450.1 1.0 11.6 17.7 35.0 25.4 7.7 1.4 87.3Remote 427.9 0.9 21.6 18.0 30.1 22.3 6.3 1.0 77.6Very Remote 374.0 0.2 42.9 20.4 19.8 12.2 4.0 0.5 56.9
SA
Metro 461.8 2.2 9.0 15.8 31.7 28.1 10.3 2.8 88.8Provincial 441.9 2.2 14.1 20.6 32.6 22.6 6.4 1.5 83.6Remote 444.6 1.0 12.2 21.1 37.1 21.4 6.0 1.2 86.8Very Remote 354.0 1.0 46.9 15.4 20.1 12.1 4.0 0.6 52.2
Tas
Metro 464.9 2.2 8.6 14.3 31.4 29.0 11.1 3.5 89.3Provincial 458.1 1.4 9.9 15.6 33.9 27.9 9.3 2.0 88.7Remote 449.4 0.0 7.5 22.2 37.8 26.9 5.3 0.3 92.5Very Remote n.p. n.p. n.p. n.p. n.p. n.p. n.p. n.p. n.p.
ACT
Metro 473.0 1.7 5.5 13.4 32.0 31.7 12.0 3.6 92.8Provincial n.p. n.p. n.p. n.p. n.p. n.p. n.p. n.p. n.p.Remote - - - - - - - - -Very Remote - - - - - - - - -
NT
Metro - - - - - - - - -Provincial 442.9 3.8 14.7 18.6 30.0 22.9 7.7 2.3 81.5Remote 406.3 3.3 31.0 19.4 22.4 17.0 5.5 1.5 65.7Very Remote 249.7 0.4 83.1 6.5 6.4 2.7 0.7 0.2 16.4
Aust
Metro 476.0 2.1 5.9 12.2 30.3 31.8 13.5 4.3 92.1Provincial 453.1 2.1 10.5 17.7 34.0 26.0 8.0 1.7 87.4Remote 427.8 1.7 20.8 19.6 30.0 20.7 6.2 1.1 77.6Very Remote 339.9 0.8 53.4 16.1 16.9 9.6 2.7 0.4 45.8
Refer to the introduction for explanatory notes.

82
NAPLAN Year 5 Persuasive Writing
Table 5.W6: Achievement of Year 5 Indigenous Students in Persuasive Writing, by Geolocation, by State and Territory, 2014.
State/ Territory
Geolocation Mean scale score
Below national minimum standard
(%)
At national
minimum standard
(%)
Above national minimum standard (%)
At or above
national minimum standard
(%)Exempt Band 3 and below
Band 4 Band 5 Band 6 Band 7 Band 8 and above
NSW
Metro 429.5 3.4 18.4 21.0 33.1 19.4 3.9 0.8 78.1Provincial 404.4 2.7 28.9 24.5 29.3 12.6 1.8 0.3 68.4Remote 380.2 6.1 38.6 29.1 17.4 8.0 0.8 0.0 55.3Very Remote 362.3 0.0 51.3 23.1 18.5 7.2 0.0 0.0 48.7
Vic
Metro 447.1 6.0 12.5 18.7 31.8 23.0 6.9 1.1 81.5Provincial 434.6 7.9 14.6 22.6 32.2 18.7 3.5 0.4 77.4Remote n.p. n.p. n.p. n.p. n.p. n.p. n.p. n.p. n.p.Very Remote - - - - - - - - -
Qld
Metro 410.7 2.7 26.8 25.8 27.6 13.2 3.2 0.7 70.5Provincial 409.1 3.2 27.2 27.2 25.9 13.0 2.9 0.6 69.6Remote 363.1 2.0 47.7 19.3 18.9 10.0 1.7 0.3 50.3Very Remote 357.5 2.2 52.0 25.0 15.1 4.9 0.8 0.0 45.8
WA
Metro 401.9 2.1 29.0 24.4 27.9 13.8 2.3 0.3 68.8Provincial 379.2 0.6 40.8 26.3 23.9 7.2 0.9 0.3 58.6Remote 351.5 1.2 53.9 22.5 15.4 5.8 1.2 0.0 44.9Very Remote 318.3 0.4 67.3 18.1 10.5 3.2 0.4 0.0 32.3
SA
Metro 411.6 3.3 27.8 23.6 26.8 14.8 3.4 0.3 68.9Provincial 376.8 5.9 37.3 28.6 19.2 7.9 0.7 0.5 56.9Remote n.p. n.p. n.p. n.p. n.p. n.p. n.p. n.p. n.p.Very Remote 260.3 1.0 82.0 11.7 3.6 1.4 0.2 0.0 17.0
Tas
Metro 421.5 1.8 21.7 21.2 29.5 20.9 4.3 0.6 76.5Provincial 425.3 1.5 21.6 21.5 34.9 15.9 3.9 0.7 76.9Remote n.p. n.p. n.p. n.p. n.p. n.p. n.p. n.p. n.p.Very Remote n.p. n.p. n.p. n.p. n.p. n.p. n.p. n.p. n.p.
ACT
Metro 424.7 2.8 23.5 22.4 28.2 18.6 4.3 0.1 73.6Provincial n.p. n.p. n.p. n.p. n.p. n.p. n.p. n.p. n.p.Remote - - - - - - - - -Very Remote - - - - - - - - -
NT
Metro - - - - - - - - -Provincial 391.8 4.0 32.4 23.4 24.2 13.1 2.1 0.7 63.5Remote 333.3 6.1 60.9 16.9 10.6 4.6 0.9 0.0 33.0Very Remote 223.9 0.5 92.7 4.7 1.6 0.3 0.1 0.0 6.8
Aust
Metro 419.5 3.2 22.9 23.1 29.8 16.6 3.7 0.7 73.9Provincial 405.4 3.3 28.3 25.2 27.7 12.8 2.2 0.5 68.4Remote 355.3 3.4 51.2 21.6 15.6 7.0 1.2 0.1 45.4Very Remote 284.9 0.9 74.9 13.9 7.6 2.4 0.3 0.0 24.2
Refer to the introduction for explanatory notes.
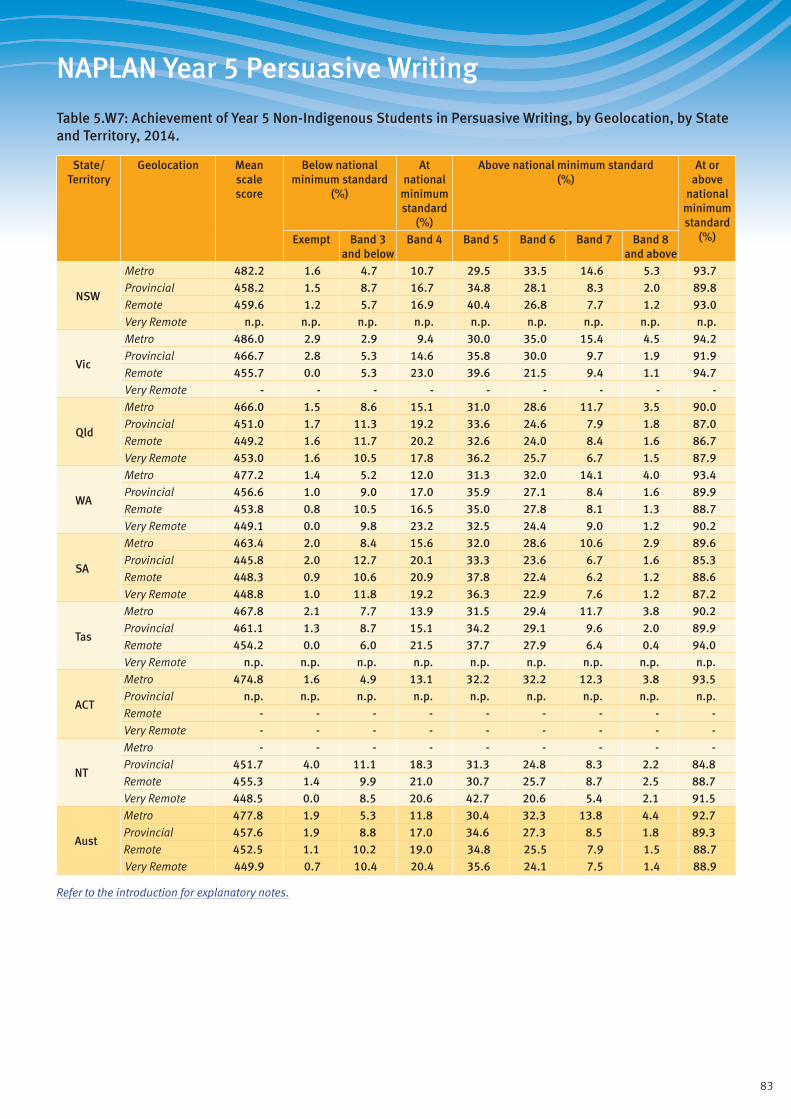
83
NAPLAN Year 5 Persuasive Writing
Table 5.W7: Achievement of Year 5 Non-Indigenous Students in Persuasive Writing, by Geolocation, by State and Territory, 2014.
State/ Territory
Geolocation Mean scale score
Below national minimum standard
(%)
At national
minimum standard
(%)
Above national minimum standard (%)
At or above
national minimum standard
(%)Exempt Band 3 and below
Band 4 Band 5 Band 6 Band 7 Band 8 and above
NSW
Metro 482.2 1.6 4.7 10.7 29.5 33.5 14.6 5.3 93.7Provincial 458.2 1.5 8.7 16.7 34.8 28.1 8.3 2.0 89.8Remote 459.6 1.2 5.7 16.9 40.4 26.8 7.7 1.2 93.0Very Remote n.p. n.p. n.p. n.p. n.p. n.p. n.p. n.p. n.p.
Vic
Metro 486.0 2.9 2.9 9.4 30.0 35.0 15.4 4.5 94.2Provincial 466.7 2.8 5.3 14.6 35.8 30.0 9.7 1.9 91.9Remote 455.7 0.0 5.3 23.0 39.6 21.5 9.4 1.1 94.7Very Remote - - - - - - - - -
Qld
Metro 466.0 1.5 8.6 15.1 31.0 28.6 11.7 3.5 90.0Provincial 451.0 1.7 11.3 19.2 33.6 24.6 7.9 1.8 87.0Remote 449.2 1.6 11.7 20.2 32.6 24.0 8.4 1.6 86.7Very Remote 453.0 1.6 10.5 17.8 36.2 25.7 6.7 1.5 87.9
WA
Metro 477.2 1.4 5.2 12.0 31.3 32.0 14.1 4.0 93.4Provincial 456.6 1.0 9.0 17.0 35.9 27.1 8.4 1.6 89.9Remote 453.8 0.8 10.5 16.5 35.0 27.8 8.1 1.3 88.7Very Remote 449.1 0.0 9.8 23.2 32.5 24.4 9.0 1.2 90.2
SA
Metro 463.4 2.0 8.4 15.6 32.0 28.6 10.6 2.9 89.6Provincial 445.8 2.0 12.7 20.1 33.3 23.6 6.7 1.6 85.3Remote 448.3 0.9 10.6 20.9 37.8 22.4 6.2 1.2 88.6Very Remote 448.8 1.0 11.8 19.2 36.3 22.9 7.6 1.2 87.2
Tas
Metro 467.8 2.1 7.7 13.9 31.5 29.4 11.7 3.8 90.2Provincial 461.1 1.3 8.7 15.1 34.2 29.1 9.6 2.0 89.9Remote 454.2 0.0 6.0 21.5 37.7 27.9 6.4 0.4 94.0Very Remote n.p. n.p. n.p. n.p. n.p. n.p. n.p. n.p. n.p.
ACT
Metro 474.8 1.6 4.9 13.1 32.2 32.2 12.3 3.8 93.5Provincial n.p. n.p. n.p. n.p. n.p. n.p. n.p. n.p. n.p.Remote - - - - - - - - -Very Remote - - - - - - - - -
NT
Metro - - - - - - - - -Provincial 451.7 4.0 11.1 18.3 31.3 24.8 8.3 2.2 84.8Remote 455.3 1.4 9.9 21.0 30.7 25.7 8.7 2.5 88.7Very Remote 448.5 0.0 8.5 20.6 42.7 20.6 5.4 2.1 91.5
Aust
Metro 477.8 1.9 5.3 11.8 30.4 32.3 13.8 4.4 92.7Provincial 457.6 1.9 8.8 17.0 34.6 27.3 8.5 1.8 89.3Remote 452.5 1.1 10.2 19.0 34.8 25.5 7.9 1.5 88.7Very Remote 449.9 0.7 10.4 20.4 35.6 24.1 7.5 1.4 88.9
Refer to the introduction for explanatory notes.
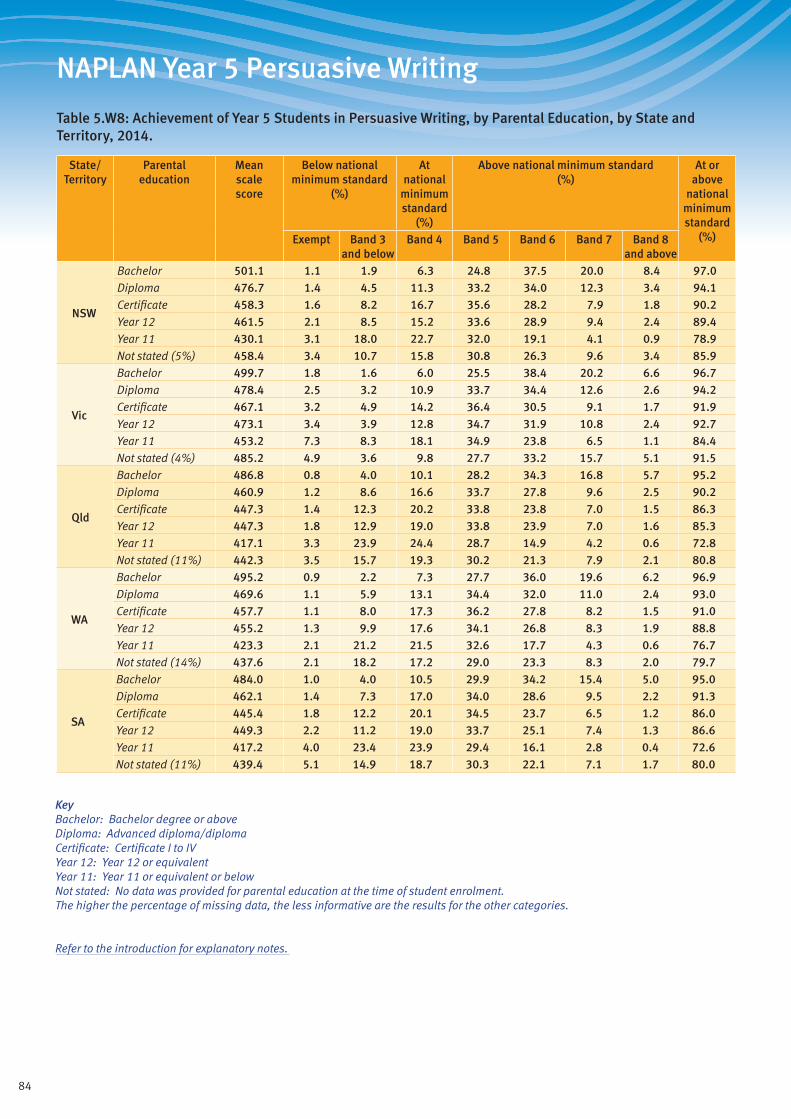
84
NAPLAN Year 5 Persuasive Writing
Table 5.W8: Achievement of Year 5 Students in Persuasive Writing, by Parental Education, by State and Territory, 2014.
State/ Territory
Parental education
Mean scale score
Below national minimum standard
(%)
At national
minimum standard
(%)
Above national minimum standard (%)
At or above
national minimum standard
(%)Exempt Band 3 and below
Band 4 Band 5 Band 6 Band 7 Band 8 and above
NSW
Bachelor 501.1 1.1 1.9 6.3 24.8 37.5 20.0 8.4 97.0Diploma 476.7 1.4 4.5 11.3 33.2 34.0 12.3 3.4 94.1Certificate 458.3 1.6 8.2 16.7 35.6 28.2 7.9 1.8 90.2Year 12 461.5 2.1 8.5 15.2 33.6 28.9 9.4 2.4 89.4Year 11 430.1 3.1 18.0 22.7 32.0 19.1 4.1 0.9 78.9Not stated (5%) 458.4 3.4 10.7 15.8 30.8 26.3 9.6 3.4 85.9
Vic
Bachelor 499.7 1.8 1.6 6.0 25.5 38.4 20.2 6.6 96.7Diploma 478.4 2.5 3.2 10.9 33.7 34.4 12.6 2.6 94.2Certificate 467.1 3.2 4.9 14.2 36.4 30.5 9.1 1.7 91.9Year 12 473.1 3.4 3.9 12.8 34.7 31.9 10.8 2.4 92.7Year 11 453.2 7.3 8.3 18.1 34.9 23.8 6.5 1.1 84.4Not stated (4%) 485.2 4.9 3.6 9.8 27.7 33.2 15.7 5.1 91.5
Qld
Bachelor 486.8 0.8 4.0 10.1 28.2 34.3 16.8 5.7 95.2Diploma 460.9 1.2 8.6 16.6 33.7 27.8 9.6 2.5 90.2Certificate 447.3 1.4 12.3 20.2 33.8 23.8 7.0 1.5 86.3Year 12 447.3 1.8 12.9 19.0 33.8 23.9 7.0 1.6 85.3Year 11 417.1 3.3 23.9 24.4 28.7 14.9 4.2 0.6 72.8Not stated (11%) 442.3 3.5 15.7 19.3 30.2 21.3 7.9 2.1 80.8
WA
Bachelor 495.2 0.9 2.2 7.3 27.7 36.0 19.6 6.2 96.9Diploma 469.6 1.1 5.9 13.1 34.4 32.0 11.0 2.4 93.0Certificate 457.7 1.1 8.0 17.3 36.2 27.8 8.2 1.5 91.0Year 12 455.2 1.3 9.9 17.6 34.1 26.8 8.3 1.9 88.8Year 11 423.3 2.1 21.2 21.5 32.6 17.7 4.3 0.6 76.7Not stated (14%) 437.6 2.1 18.2 17.2 29.0 23.3 8.3 2.0 79.7
SA
Bachelor 484.0 1.0 4.0 10.5 29.9 34.2 15.4 5.0 95.0Diploma 462.1 1.4 7.3 17.0 34.0 28.6 9.5 2.2 91.3Certificate 445.4 1.8 12.2 20.1 34.5 23.7 6.5 1.2 86.0Year 12 449.3 2.2 11.2 19.0 33.7 25.1 7.4 1.3 86.6Year 11 417.2 4.0 23.4 23.9 29.4 16.1 2.8 0.4 72.6Not stated (11%) 439.4 5.1 14.9 18.7 30.3 22.1 7.1 1.7 80.0
KeyBachelor: Bachelor degree or aboveDiploma: Advanced diploma/diplomaCertificate: Certificate I to IVYear 12: Year 12 or equivalentYear 11: Year 11 or equivalent or belowNot stated: No data was provided for parental education at the time of student enrolment. The higher the percentage of missing data, the less informative are the results for the other categories.
Refer to the introduction for explanatory notes.
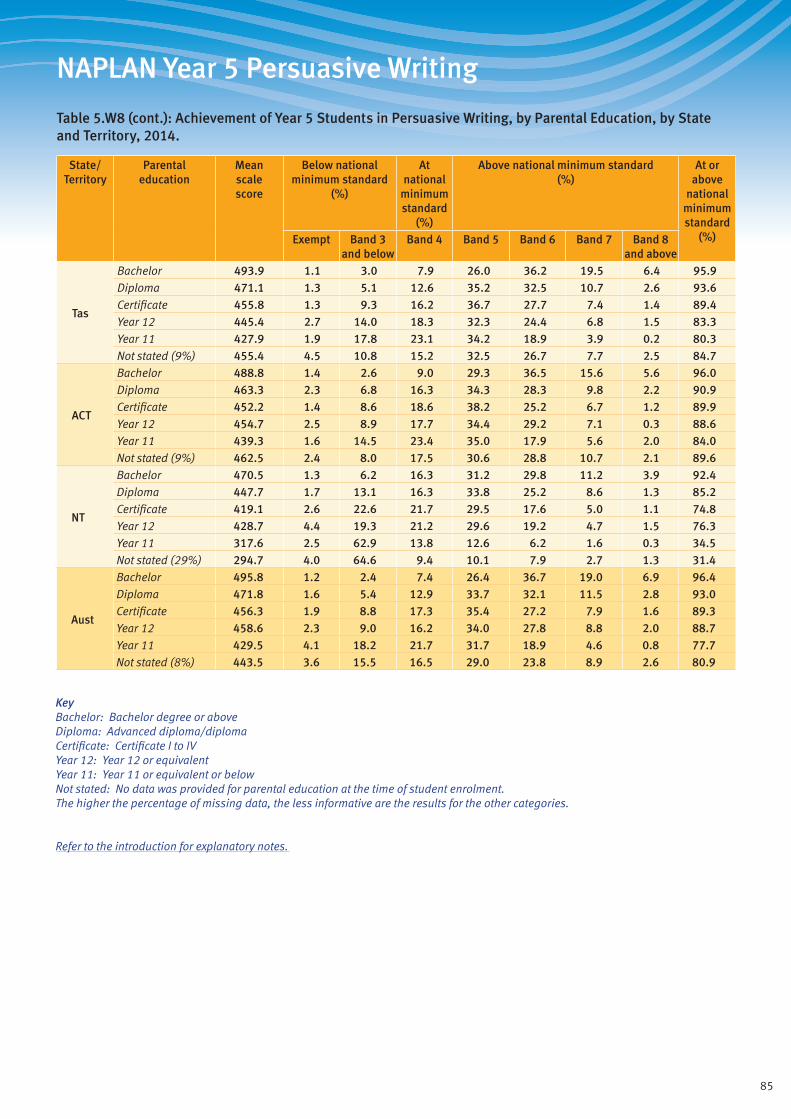
85
NAPLAN Year 5 Persuasive Writing
Table 5.W8 (cont.): Achievement of Year 5 Students in Persuasive Writing, by Parental Education, by State and Territory, 2014.
State/ Territory
Parental education
Mean scale score
Below national minimum standard
(%)
At national
minimum standard
(%)
Above national minimum standard (%)
At or above
national minimum standard
(%)Exempt Band 3 and below
Band 4 Band 5 Band 6 Band 7 Band 8 and above
Tas
Bachelor 493.9 1.1 3.0 7.9 26.0 36.2 19.5 6.4 95.9Diploma 471.1 1.3 5.1 12.6 35.2 32.5 10.7 2.6 93.6Certificate 455.8 1.3 9.3 16.2 36.7 27.7 7.4 1.4 89.4Year 12 445.4 2.7 14.0 18.3 32.3 24.4 6.8 1.5 83.3Year 11 427.9 1.9 17.8 23.1 34.2 18.9 3.9 0.2 80.3Not stated (9%) 455.4 4.5 10.8 15.2 32.5 26.7 7.7 2.5 84.7
ACT
Bachelor 488.8 1.4 2.6 9.0 29.3 36.5 15.6 5.6 96.0Diploma 463.3 2.3 6.8 16.3 34.3 28.3 9.8 2.2 90.9Certificate 452.2 1.4 8.6 18.6 38.2 25.2 6.7 1.2 89.9Year 12 454.7 2.5 8.9 17.7 34.4 29.2 7.1 0.3 88.6Year 11 439.3 1.6 14.5 23.4 35.0 17.9 5.6 2.0 84.0Not stated (9%) 462.5 2.4 8.0 17.5 30.6 28.8 10.7 2.1 89.6
NT
Bachelor 470.5 1.3 6.2 16.3 31.2 29.8 11.2 3.9 92.4Diploma 447.7 1.7 13.1 16.3 33.8 25.2 8.6 1.3 85.2Certificate 419.1 2.6 22.6 21.7 29.5 17.6 5.0 1.1 74.8Year 12 428.7 4.4 19.3 21.2 29.6 19.2 4.7 1.5 76.3Year 11 317.6 2.5 62.9 13.8 12.6 6.2 1.6 0.3 34.5Not stated (29%) 294.7 4.0 64.6 9.4 10.1 7.9 2.7 1.3 31.4
Aust
Bachelor 495.8 1.2 2.4 7.4 26.4 36.7 19.0 6.9 96.4Diploma 471.8 1.6 5.4 12.9 33.7 32.1 11.5 2.8 93.0Certificate 456.3 1.9 8.8 17.3 35.4 27.2 7.9 1.6 89.3Year 12 458.6 2.3 9.0 16.2 34.0 27.8 8.8 2.0 88.7Year 11 429.5 4.1 18.2 21.7 31.7 18.9 4.6 0.8 77.7Not stated (8%) 443.5 3.6 15.5 16.5 29.0 23.8 8.9 2.6 80.9
KeyBachelor: Bachelor degree or aboveDiploma: Advanced diploma/diplomaCertificate: Certificate I to IVYear 12: Year 12 or equivalentYear 11: Year 11 or equivalent or belowNot stated: No data was provided for parental education at the time of student enrolment. The higher the percentage of missing data, the less informative are the results for the other categories.
Refer to the introduction for explanatory notes.
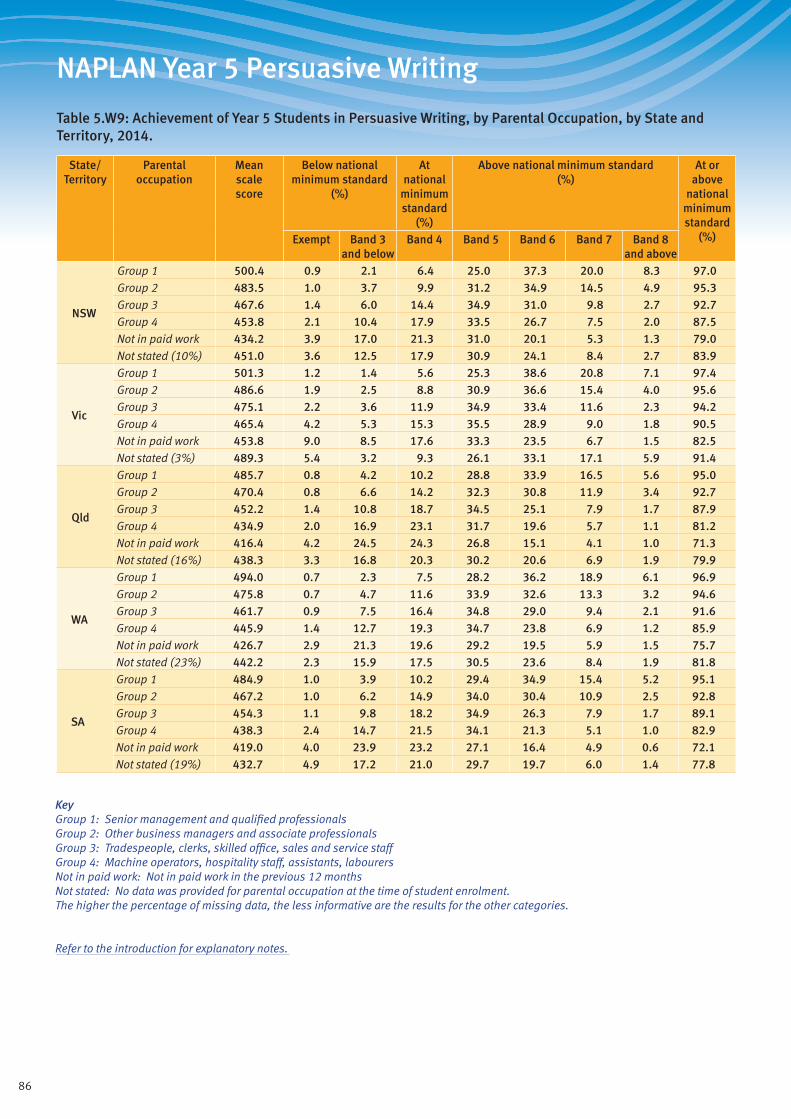
86
NAPLAN Year 5 Persuasive Writing
Table 5.W9: Achievement of Year 5 Students in Persuasive Writing, by Parental Occupation, by State and Territory, 2014.
State/ Territory
Parental occupation
Mean scale score
Below national minimum standard
(%)
At national
minimum standard
(%)
Above national minimum standard (%)
At or above
national minimum standard
(%)Exempt Band 3 and below
Band 4 Band 5 Band 6 Band 7 Band 8 and above
NSW
Group 1 500.4 0.9 2.1 6.4 25.0 37.3 20.0 8.3 97.0Group 2 483.5 1.0 3.7 9.9 31.2 34.9 14.5 4.9 95.3Group 3 467.6 1.4 6.0 14.4 34.9 31.0 9.8 2.7 92.7Group 4 453.8 2.1 10.4 17.9 33.5 26.7 7.5 2.0 87.5Not in paid work 434.2 3.9 17.0 21.3 31.0 20.1 5.3 1.3 79.0Not stated (10%) 451.0 3.6 12.5 17.9 30.9 24.1 8.4 2.7 83.9
Vic
Group 1 501.3 1.2 1.4 5.6 25.3 38.6 20.8 7.1 97.4Group 2 486.6 1.9 2.5 8.8 30.9 36.6 15.4 4.0 95.6Group 3 475.1 2.2 3.6 11.9 34.9 33.4 11.6 2.3 94.2Group 4 465.4 4.2 5.3 15.3 35.5 28.9 9.0 1.8 90.5Not in paid work 453.8 9.0 8.5 17.6 33.3 23.5 6.7 1.5 82.5Not stated (3%) 489.3 5.4 3.2 9.3 26.1 33.1 17.1 5.9 91.4
Qld
Group 1 485.7 0.8 4.2 10.2 28.8 33.9 16.5 5.6 95.0Group 2 470.4 0.8 6.6 14.2 32.3 30.8 11.9 3.4 92.7Group 3 452.2 1.4 10.8 18.7 34.5 25.1 7.9 1.7 87.9Group 4 434.9 2.0 16.9 23.1 31.7 19.6 5.7 1.1 81.2Not in paid work 416.4 4.2 24.5 24.3 26.8 15.1 4.1 1.0 71.3Not stated (16%) 438.3 3.3 16.8 20.3 30.2 20.6 6.9 1.9 79.9
WA
Group 1 494.0 0.7 2.3 7.5 28.2 36.2 18.9 6.1 96.9Group 2 475.8 0.7 4.7 11.6 33.9 32.6 13.3 3.2 94.6Group 3 461.7 0.9 7.5 16.4 34.8 29.0 9.4 2.1 91.6Group 4 445.9 1.4 12.7 19.3 34.7 23.8 6.9 1.2 85.9Not in paid work 426.7 2.9 21.3 19.6 29.2 19.5 5.9 1.5 75.7Not stated (23%) 442.2 2.3 15.9 17.5 30.5 23.6 8.4 1.9 81.8
SA
Group 1 484.9 1.0 3.9 10.2 29.4 34.9 15.4 5.2 95.1Group 2 467.2 1.0 6.2 14.9 34.0 30.4 10.9 2.5 92.8Group 3 454.3 1.1 9.8 18.2 34.9 26.3 7.9 1.7 89.1Group 4 438.3 2.4 14.7 21.5 34.1 21.3 5.1 1.0 82.9Not in paid work 419.0 4.0 23.9 23.2 27.1 16.4 4.9 0.6 72.1Not stated (19%) 432.7 4.9 17.2 21.0 29.7 19.7 6.0 1.4 77.8
KeyGroup 1: Senior management and qualified professionalsGroup 2: Other business managers and associate professionalsGroup 3: Tradespeople, clerks, skilled office, sales and service staffGroup 4: Machine operators, hospitality staff, assistants, labourersNot in paid work: Not in paid work in the previous 12 monthsNot stated: No data was provided for parental occupation at the time of student enrolment. The higher the percentage of missing data, the less informative are the results for the other categories.
Refer to the introduction for explanatory notes.

87
NAPLAN Year 5 Persuasive Writing
Table 5.W9 (cont.): Achievement of Year 5 Students in Persuasive Writing, by Parental Occupation, by State and Territory, 2014.
State/ Territory
Parental occupation
Mean scale score
Below national minimum standard
(%)
At national
minimum standard
(%)
Above national minimum standard (%)
At or above
national minimum standard
(%)Exempt Band 3 and below
Band 4 Band 5 Band 6 Band 7 Band 8 and above
Tas
Group 1 490.8 1.0 3.5 8.3 27.1 35.4 18.8 5.9 95.5Group 2 474.9 0.8 5.1 12.0 33.0 33.6 12.2 3.3 94.1Group 3 459.9 1.0 7.8 15.6 37.5 27.6 8.8 1.8 91.3Group 4 442.2 1.6 12.8 19.9 36.6 23.5 5.1 0.5 85.6Not in paid work 421.1 3.4 22.5 22.7 29.1 18.2 3.2 0.9 74.2Not stated (12%) 450.2 4.5 11.7 17.4 32.8 24.8 6.7 2.2 83.8
ACT
Group 1 489.0 1.1 2.4 9.8 29.8 34.9 16.2 5.8 96.5Group 2 474.4 1.0 4.5 12.0 34.3 32.8 12.3 3.2 94.5Group 3 456.6 1.3 8.8 16.8 34.8 28.8 7.8 1.7 89.9Group 4 444.5 3.8 11.3 25.5 29.4 21.8 6.3 1.7 84.8Not in paid work 442.2 6.0 13.9 19.6 34.0 21.3 4.7 0.5 80.1Not stated (16%) 460.5 2.9 8.2 16.8 32.1 30.0 8.2 1.9 88.9
NT
Group 1 461.4 1.5 9.9 16.2 29.1 28.5 10.6 4.2 88.5Group 2 447.1 2.0 12.2 18.9 32.3 23.1 8.6 2.9 85.7Group 3 431.8 1.9 18.5 22.7 30.6 18.9 6.1 1.3 79.5Group 4 369.9 3.9 43.6 14.3 21.2 13.9 2.7 0.5 52.5Not in paid work 306.3 3.1 66.2 11.7 12.5 4.9 1.6 0.2 30.8Not stated (27%) 287.4 3.9 66.1 10.6 10.2 7.0 1.8 0.3 30.0
Aust
Group 1 495.2 0.9 2.6 7.5 26.7 36.5 18.9 6.9 96.5Group 2 479.4 1.2 4.3 11.1 31.9 33.9 13.7 3.9 94.5Group 3 463.9 1.5 7.1 15.3 34.8 29.5 9.6 2.2 91.4Group 4 450.4 2.6 11.1 18.6 33.8 25.0 7.3 1.6 86.3Not in paid work 434.4 5.7 16.7 20.3 30.5 20.1 5.5 1.3 77.6Not stated (12%) 442.0 3.5 15.6 18.0 29.7 22.8 8.1 2.3 80.8
KeyGroup 1: Senior management and qualified professionalsGroup 2: Other business managers and associate professionalsGroup 3: Tradespeople, clerks, skilled office, sales and service staffGroup 4: Machine operators, hospitality staff, assistants, labourersNot in paid work: Not in paid work in the previous 12 monthsNot stated: No data was provided for parental occupation at the time of student enrolment. The higher the percentage of missing data, the less informative are the results for the other categories.
Refer to the introduction for explanatory notes.
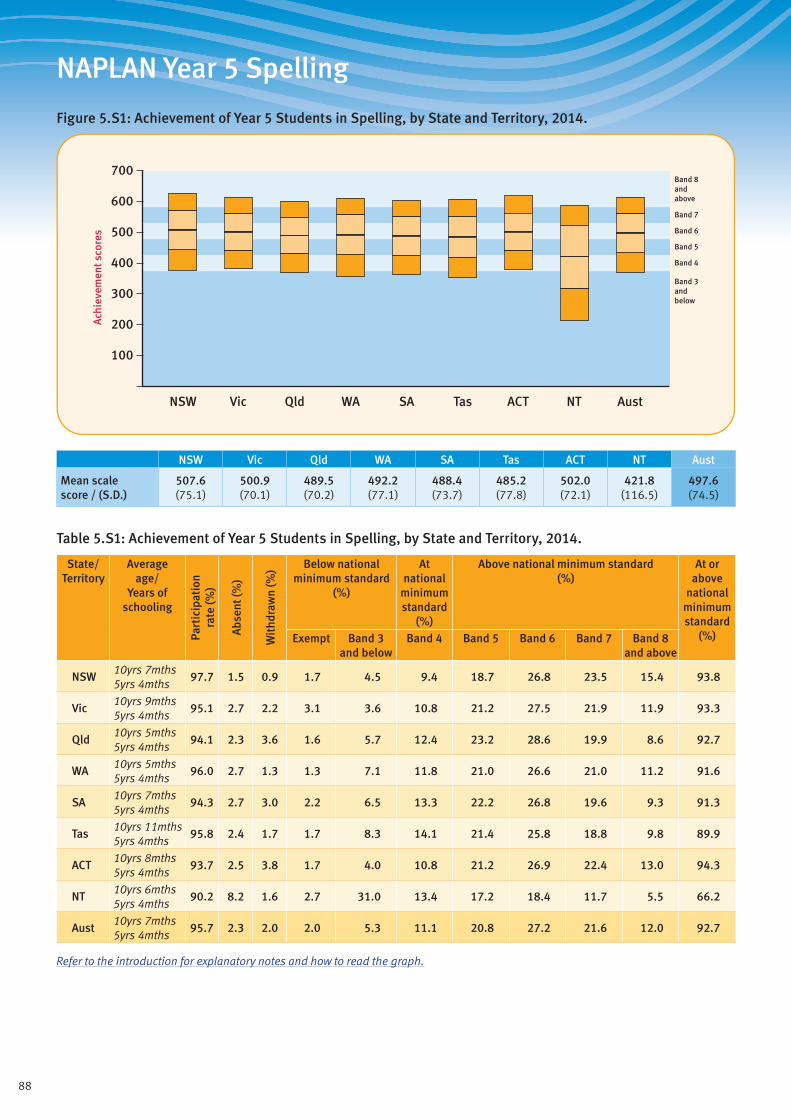
88
NAPLAN Year 5 Spelling
Figure 5.S1: Achievement of Year 5 Students in Spelling, by State and Territory, 2014.
Band 3andbelow
Band 4
Band 5
Band 6
Band 7
Band 8andabove
700
600
400
500
300
200
100
Ach
ieve
men
t sco
res
ACTQld SAWA TasVicNSW NT Aust
NSW Vic Qld WA SA Tas ACT NT Aust
Mean scale score / (S.D.)
507.6 (75.1)
500.9 (70.1)
489.5 (70.2)
492.2 (77.1)
488.4 (73.7)
485.2 (77.8)
502.0 (72.1)
421.8 (116.5)
497.6 (74.5)
Table 5.S1: Achievement of Year 5 Students in Spelling, by State and Territory, 2014.
State/ Territory
Average age/
Years of schooling
Part
icip
atio
nra
te (%
)
Abs
ent (
%)
Wit
hdra
wn
(%) Below national
minimum standard (%)
At national
minimum standard
(%)
Above national minimum standard (%)
At or above
national minimum standard
(%)Exempt Band 3 and below
Band 4 Band 5 Band 6 Band 7 Band 8 and above
NSW10yrs 7mths 5yrs 4mths
97.7 1.5 0.9 1.7 4.5 9.4 18.7 26.8 23.5 15.4 93.8
Vic10yrs 9mths 5yrs 4mths
95.1 2.7 2.2 3.1 3.6 10.8 21.2 27.5 21.9 11.9 93.3
Qld10yrs 5mths 5yrs 4mths
94.1 2.3 3.6 1.6 5.7 12.4 23.2 28.6 19.9 8.6 92.7
WA10yrs 5mths 5yrs 4mths
96.0 2.7 1.3 1.3 7.1 11.8 21.0 26.6 21.0 11.2 91.6
SA10yrs 7mths 5yrs 4mths
94.3 2.7 3.0 2.2 6.5 13.3 22.2 26.8 19.6 9.3 91.3
Tas10yrs 11mths 5yrs 4mths
95.8 2.4 1.7 1.7 8.3 14.1 21.4 25.8 18.8 9.8 89.9
ACT10yrs 8mths 5yrs 4mths
93.7 2.5 3.8 1.7 4.0 10.8 21.2 26.9 22.4 13.0 94.3
NT10yrs 6mths 5yrs 4mths
90.2 8.2 1.6 2.7 31.0 13.4 17.2 18.4 11.7 5.5 66.2
Aust10yrs 7mths 5yrs 4mths
95.7 2.3 2.0 2.0 5.3 11.1 20.8 27.2 21.6 12.0 92.7
Refer to the introduction for explanatory notes and how to read the graph.
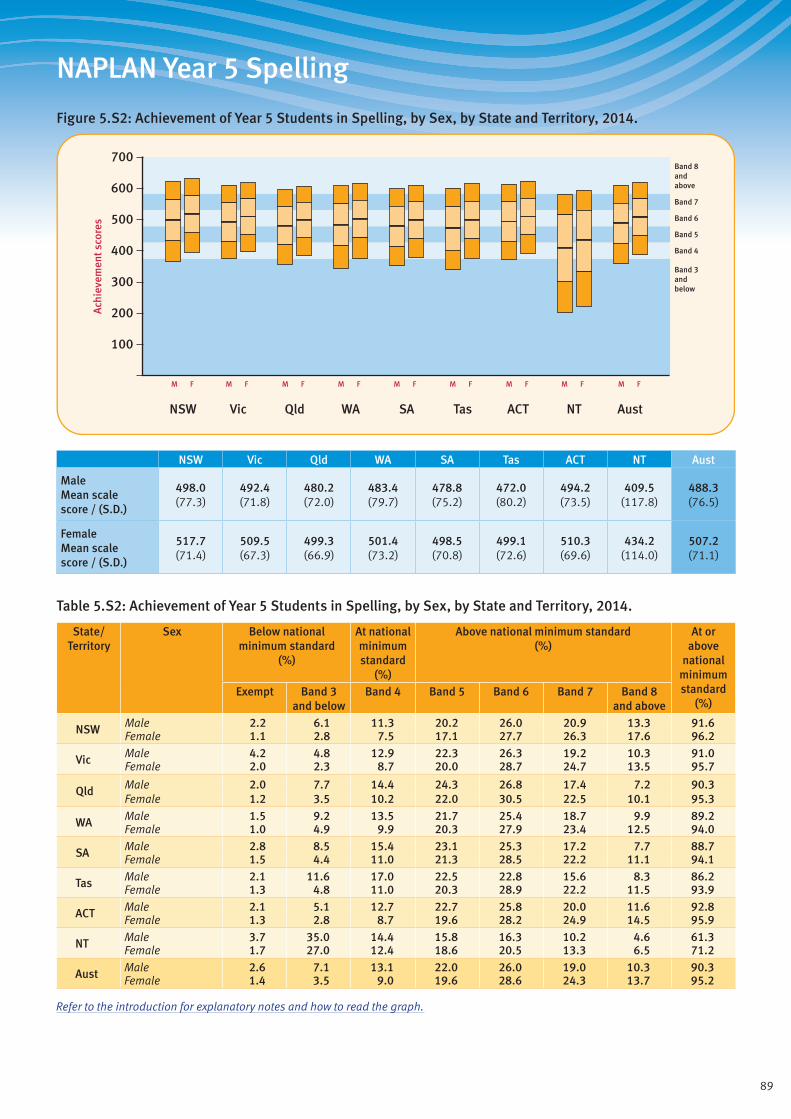
89
NAPLAN Year 5 Spelling
Figure 5.S2: Achievement of Year 5 Students in Spelling, by Sex, by State and Territory, 2014.
Band 3andbelow
Band 4
Band 5
Band 6
Band 7
Band 8andabove
ACTQld SAWA TasVicNSW NT Aust
M F M F M F M F M F M F M F M F M F
700
600
400
500
300
200
100
Ach
ieve
men
t sco
res
NSW Vic Qld WA SA Tas ACT NT Aust
Male Mean scale score / (S.D.)
498.0 (77.3)
492.4 (71.8)
480.2 (72.0)
483.4 (79.7)
478.8 (75.2)
472.0 (80.2)
494.2 (73.5)
409.5 (117.8)
488.3 (76.5)
Female Mean scale score / (S.D.)
517.7 (71.4)
509.5 (67.3)
499.3 (66.9)
501.4 (73.2)
498.5 (70.8)
499.1 (72.6)
510.3 (69.6)
434.2 (114.0)
507.2 (71.1)
Table 5.S2: Achievement of Year 5 Students in Spelling, by Sex, by State and Territory, 2014.
State/ Territory
Sex Below national minimum standard
(%)
At national minimum standard
(%)
Above national minimum standard (%)
At or above
national minimum standard
(%)Exempt Band 3
and belowBand 4 Band 5 Band 6 Band 7 Band 8
and above
NSW Male 2.2 6.1 11.3 20.2 26.0 20.9 13.3 91.6Female 1.1 2.8 7.5 17.1 27.7 26.3 17.6 96.2
Vic Male 4.2 4.8 12.9 22.3 26.3 19.2 10.3 91.0Female 2.0 2.3 8.7 20.0 28.7 24.7 13.5 95.7
Qld Male 2.0 7.7 14.4 24.3 26.8 17.4 7.2 90.3Female 1.2 3.5 10.2 22.0 30.5 22.5 10.1 95.3
WA Male 1.5 9.2 13.5 21.7 25.4 18.7 9.9 89.2Female 1.0 4.9 9.9 20.3 27.9 23.4 12.5 94.0
SA Male 2.8 8.5 15.4 23.1 25.3 17.2 7.7 88.7Female 1.5 4.4 11.0 21.3 28.5 22.2 11.1 94.1
Tas Male 2.1 11.6 17.0 22.5 22.8 15.6 8.3 86.2Female 1.3 4.8 11.0 20.3 28.9 22.2 11.5 93.9
ACT Male 2.1 5.1 12.7 22.7 25.8 20.0 11.6 92.8Female 1.3 2.8 8.7 19.6 28.2 24.9 14.5 95.9
NT Male 3.7 35.0 14.4 15.8 16.3 10.2 4.6 61.3Female 1.7 27.0 12.4 18.6 20.5 13.3 6.5 71.2
Aust Male 2.6 7.1 13.1 22.0 26.0 19.0 10.3 90.3Female 1.4 3.5 9.0 19.6 28.6 24.3 13.7 95.2
Refer to the introduction for explanatory notes and how to read the graph.

90
NAPLAN Year 5 Spelling
Figure 5.S3: Achievement of Year 5 Students in Spelling, by Indigenous Status, by State and Territory, 2014.
Band 3andbelow
Band 4
Band 5
Band 6
Band 7
Band 8andabove
ACTQld SAWA TasVicNSW NT Aust
700
600
400
500
300
200
100
Ach
ieve
men
t sco
res
Indig. Non-Indig.
Indig. Non-Indig.
Indig. Non-Indig.
Indig. Non-Indig.
Indig. Non-Indig.
Indig. Non-Indig.
Indig. Non-Indig.
Indig. Non-Indig.
Indig. Non-Indig.
NSW Vic Qld WA SA Tas ACT NT Aust
Indigenous Mean scale score / (S.D.)
450.7 (76.4)
461.8 (71.3)
448.3 (73.3)
413.0 (83.5)
429.4 (80.1)
444.4 (78.9)
448.6 (81.5)
341.3 (110.6)
433.7 (86.9)
Non-Indigenous Mean scale score / (S.D.)
510.6 (73.8)
501.6 (69.9)
492.5 (68.9)
498.2 (73.3)
490.9 (72.4)
487.2 (75.7)
503.7 (71.2)
481.5 (76.4)
501.1 (72.1)
Table 5.S3: Achievement of Year 5 Students in Spelling, by Indigenous Status, by State and Territory, 2014.
State/ Territory
Indigenous status
Below national minimum standard
(%)
At national minimum standard
(%)
Above national minimum standard (%)
At or above
national minimum standard
(%)Exempt Band 3
and belowBand 4 Band 5 Band 6 Band 7 Band 8
and above
NSW Indigenous 3.1 16.4 19.3 24.6 21.5 11.8 3.4 80.6Non-Indigenous 1.6 3.9 8.9 18.4 27.1 24.1 16.0 94.6
Vic Indigenous 7.0 10.7 17.6 24.7 23.8 12.4 3.8 82.2Non-Indigenous 2.8 3.5 10.7 21.2 27.6 22.1 12.1 93.7
Qld Indigenous 2.7 17.0 18.7 25.5 22.9 10.9 2.2 80.2Non-Indigenous 1.5 4.8 11.9 23.1 29.1 20.6 9.0 93.7
WA Indigenous 1.2 33.4 21.8 20.0 15.5 6.5 1.7 65.4Non-Indigenous 1.3 5.2 10.9 21.0 27.5 22.1 11.9 93.5
SA Indigenous 3.7 24.1 22.6 22.2 17.2 7.7 2.5 72.1Non-Indigenous 2.0 5.8 12.9 22.2 27.3 20.2 9.7 92.3
Tas Indigenous 1.6 19.9 21.0 24.2 19.3 10.0 4.0 78.5Non-Indigenous 1.7 7.5 13.7 21.4 26.5 19.5 9.7 90.9
ACT Indigenous 2.7 17.7 24.2 21.1 16.6 11.0 6.7 79.6Non-Indigenous 1.7 3.5 10.4 21.2 27.2 22.7 13.3 94.8
NT Indigenous 2.4 60.7 13.2 11.3 8.0 3.2 1.2 36.9Non-Indigenous 3.2 8.8 13.9 22.0 26.0 17.8 8.4 88.0
Aust Indigenous 2.9 23.2 19.0 22.8 19.6 9.7 2.6 73.8Non-Indigenous 1.9 4.3 10.6 20.8 27.7 22.2 12.5 93.8
Refer to the introduction for explanatory notes and how to read the graph.

91
NAPLAN Year 5 Spelling
Figure 5.S4: Achievement of Year 5 Students in Spelling, by LBOTE Status, by State and Territory, 2014.
Band 3andbelow
Band 4
Band 5
Band 6
Band 7
Band 8andabove
ACTQld SAWA TasVicNSW NT Aust
700
600
400
500
300
200
100
Ach
ieve
men
t sco
res
LBOTE Non-LBOTE
LBOTE Non-LBOTE
LBOTE Non-LBOTE
LBOTE Non-LBOTE
LBOTE Non-LBOTE
LBOTE Non-LBOTE
LBOTE Non-LBOTE
LBOTE Non-LBOTE
LBOTE Non-LBOTE
NSW Vic Qld WA SA Tas ACT NT Aust
LBOTE Mean scale score / (S.D.)
527.0 (75.7)
514.4 (71.9)
505.4 (76.4)
510.9 (80.4)
498.0 (79.9)
499.1 (77.1)
518.6 (72.3)
361.5 (127.7)
514.6 (80.2)
Non-LBOTE Mean scale score / (S.D.)
499.0 (73.2)
496.0 (68.8)
487.0 (68.9)
491.1 (74.0)
487.1 (72.6)
483.1 (76.7)
497.7 (71.4)
465.4 (83.9)
493.0 (71.6)
Table 5.S4: Achievement of Year 5 Students in Spelling, by LBOTE Status, by State and Territory, 2014.
State/ Territory
LBOTE status
Below national minimum standard
(%)
At national minimum standard
(%)
Above national minimum standard (%)
At or above
national minimum standard
(%)Exempt Band 3
and belowBand 4 Band 5 Band 6 Band 7 Band 8
and above
NSW LBOTE 2.3 2.8 6.7 14.9 24.7 25.7 22.9 94.9Non-LBOTE 1.4 5.3 10.7 20.4 27.7 22.5 12.1 93.3
Vic LBOTE 4.3 2.7 8.3 18.4 25.6 23.9 16.8 93.0Non-LBOTE 2.6 3.9 11.8 22.2 28.2 21.1 10.1 93.4
Qld LBOTE 2.6 5.3 9.3 18.4 26.0 23.6 14.8 92.1Non-LBOTE 1.5 5.7 12.8 24.0 29.0 19.3 7.6 92.8
WA LBOTE 2.7 5.6 8.5 16.6 24.2 24.8 17.6 91.8Non-LBOTE 0.9 6.6 11.9 22.0 27.7 20.9 10.0 92.5
SA LBOTE 4.4 6.9 10.0 19.0 25.0 21.5 13.1 88.7Non-LBOTE 1.7 6.4 13.8 22.8 27.2 19.4 8.8 91.9
Tas LBOTE 7.8 5.8 11.8 15.6 25.3 21.9 11.8 86.4Non-LBOTE 1.3 8.6 14.4 22.0 26.0 18.5 9.2 90.1
ACT LBOTE 3.4 2.9 7.7 16.0 25.6 26.5 17.9 93.7Non-LBOTE 1.3 4.3 11.6 22.6 27.3 21.3 11.7 94.5
NT LBOTE 4.2 54.1 10.4 10.2 10.2 6.9 4.0 41.7Non-LBOTE 1.9 13.8 15.7 22.4 24.1 15.3 6.6 84.3
Aust LBOTE 3.1 4.5 7.9 16.6 24.8 24.3 18.8 92.3Non-LBOTE 1.7 5.4 12.0 22.2 28.0 20.8 9.9 92.9
Refer to the introduction for explanatory notes and how to read the graph.

92
NAPLAN Year 5 Spelling
Table 5.S5: Achievement of Year 5 Students in Spelling, by Geolocation, by State and Territory, 2014.
State/ Territory
Geolocation Mean scale score
Below national minimum standard
(%)
At national
minimum standard
(%)
Above national minimum standard (%)
At or above
national minimum standard
(%)Exempt Band 3 and below
Band 4 Band 5 Band 6 Band 7 Band 8 and above
NSW
Metro 515.3 1.7 3.4 8.0 17.4 27.0 25.0 17.6 94.9Provincial 483.2 1.6 8.0 14.0 22.9 26.3 18.8 8.4 90.4Remote 461.9 2.5 14.5 16.4 23.2 23.7 14.7 5.0 83.0Very Remote 464.3 0.0 14.6 15.5 24.0 24.3 16.9 4.7 85.4
Vic
Metro 506.3 3.1 3.0 9.6 20.4 27.4 23.2 13.4 93.9Provincial 483.4 3.1 5.6 14.8 23.9 27.8 17.6 7.1 91.3Remote 474.1 0.0 6.2 13.5 31.6 30.5 12.7 5.5 93.8Very Remote - - - - - - - - -
Qld
Metro 495.3 1.6 4.6 11.1 22.3 29.4 21.4 9.7 93.8Provincial 478.1 1.8 7.1 15.1 25.7 27.3 16.9 6.1 91.1Remote 464.8 1.6 14.0 15.5 23.3 25.1 15.0 5.6 84.4Very Remote 442.3 1.8 19.2 21.6 23.7 21.8 9.5 2.3 79.0
WA
Metro 502.4 1.4 4.8 10.1 20.2 27.2 23.2 13.1 93.8Provincial 474.5 1.0 9.8 15.5 23.9 26.5 16.4 6.9 89.2Remote 456.4 0.9 16.8 16.7 23.5 23.2 13.3 5.7 82.3Very Remote 415.2 0.2 34.6 19.2 18.0 17.1 8.2 2.6 65.1
SA
Metro 493.6 2.2 5.6 12.2 21.5 27.3 21.0 10.3 92.2Provincial 477.4 2.2 8.1 16.0 24.3 26.0 16.5 7.0 89.7Remote 476.7 1.0 6.5 17.3 26.5 25.8 17.1 5.9 92.5Very Remote 409.0 1.0 38.4 16.7 17.2 18.4 5.6 2.8 60.7
Tas
Metro 487.2 2.2 8.1 13.6 20.6 26.0 19.0 10.5 89.7Provincial 483.6 1.4 8.4 14.4 22.1 25.6 18.6 9.4 90.1Remote 479.8 0.0 8.1 15.6 23.4 25.9 20.0 6.9 91.9Very Remote n.p. n.p. n.p. n.p. n.p. n.p. n.p. n.p. n.p.
ACT
Metro 502.0 1.7 4.0 10.7 21.2 27.0 22.4 13.0 94.3Provincial n.p. n.p. n.p. n.p. n.p. n.p. n.p. n.p. n.p.Remote - - - - - - - - -Very Remote - - - - - - - - -
NT
Metro - - - - - - - - -Provincial 475.0 3.8 11.5 14.7 21.2 23.8 16.6 8.4 84.7Remote 442.4 3.3 23.0 15.0 20.2 21.7 11.6 5.2 73.6Very Remote 314.0 0.4 72.4 10.0 7.8 6.1 2.8 0.5 27.2
Aust
Metro 505.4 2.0 3.9 9.7 19.8 27.6 23.2 13.7 94.1Provincial 480.7 2.0 7.5 14.8 23.9 26.8 17.6 7.4 90.5Remote 460.0 1.6 15.3 16.1 23.3 24.0 14.2 5.6 83.1Very Remote 391.1 0.8 42.1 16.6 16.4 15.2 7.0 1.9 57.1
Refer to the introduction for explanatory notes.
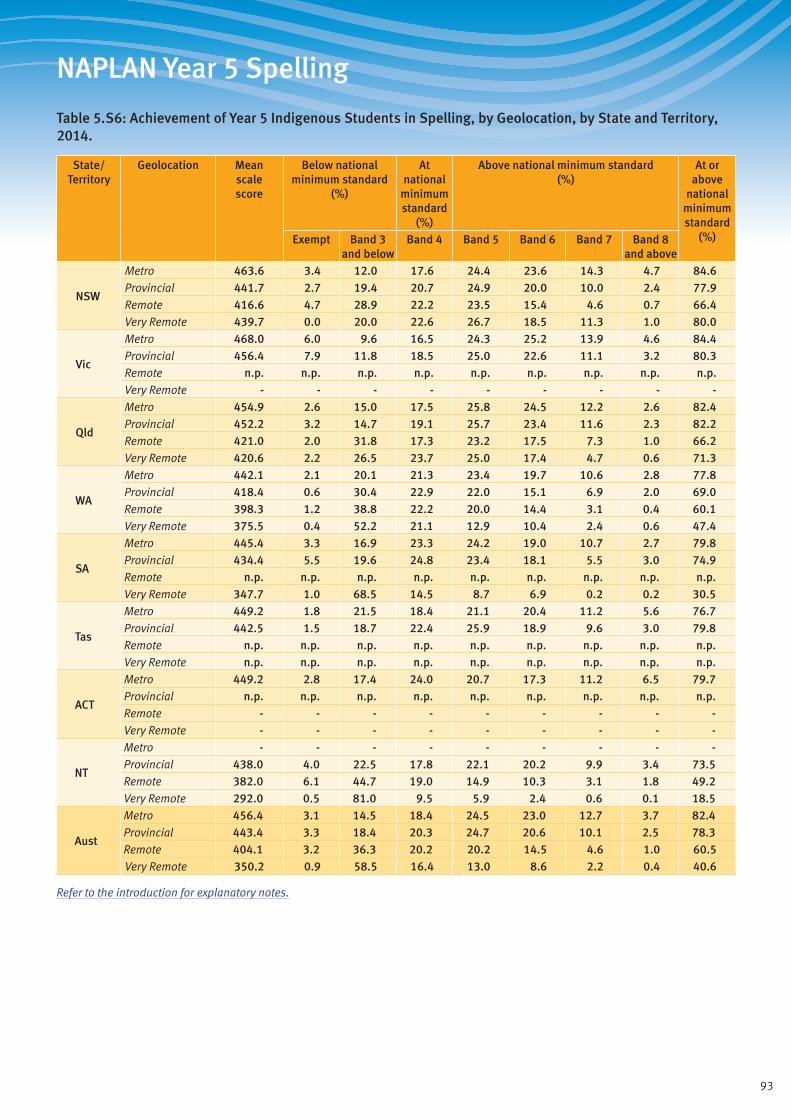
93
NAPLAN Year 5 Spelling
Table 5.S6: Achievement of Year 5 Indigenous Students in Spelling, by Geolocation, by State and Territory, 2014.
State/ Territory
Geolocation Mean scale score
Below national minimum standard
(%)
At national
minimum standard
(%)
Above national minimum standard (%)
At or above
national minimum standard
(%)Exempt Band 3 and below
Band 4 Band 5 Band 6 Band 7 Band 8 and above
NSW
Metro 463.6 3.4 12.0 17.6 24.4 23.6 14.3 4.7 84.6Provincial 441.7 2.7 19.4 20.7 24.9 20.0 10.0 2.4 77.9Remote 416.6 4.7 28.9 22.2 23.5 15.4 4.6 0.7 66.4Very Remote 439.7 0.0 20.0 22.6 26.7 18.5 11.3 1.0 80.0
Vic
Metro 468.0 6.0 9.6 16.5 24.3 25.2 13.9 4.6 84.4Provincial 456.4 7.9 11.8 18.5 25.0 22.6 11.1 3.2 80.3Remote n.p. n.p. n.p. n.p. n.p. n.p. n.p. n.p. n.p.Very Remote - - - - - - - - -
Qld
Metro 454.9 2.6 15.0 17.5 25.8 24.5 12.2 2.6 82.4Provincial 452.2 3.2 14.7 19.1 25.7 23.4 11.6 2.3 82.2Remote 421.0 2.0 31.8 17.3 23.2 17.5 7.3 1.0 66.2Very Remote 420.6 2.2 26.5 23.7 25.0 17.4 4.7 0.6 71.3
WA
Metro 442.1 2.1 20.1 21.3 23.4 19.7 10.6 2.8 77.8Provincial 418.4 0.6 30.4 22.9 22.0 15.1 6.9 2.0 69.0Remote 398.3 1.2 38.8 22.2 20.0 14.4 3.1 0.4 60.1Very Remote 375.5 0.4 52.2 21.1 12.9 10.4 2.4 0.6 47.4
SA
Metro 445.4 3.3 16.9 23.3 24.2 19.0 10.7 2.7 79.8Provincial 434.4 5.5 19.6 24.8 23.4 18.1 5.5 3.0 74.9Remote n.p. n.p. n.p. n.p. n.p. n.p. n.p. n.p. n.p.Very Remote 347.7 1.0 68.5 14.5 8.7 6.9 0.2 0.2 30.5
Tas
Metro 449.2 1.8 21.5 18.4 21.1 20.4 11.2 5.6 76.7Provincial 442.5 1.5 18.7 22.4 25.9 18.9 9.6 3.0 79.8Remote n.p. n.p. n.p. n.p. n.p. n.p. n.p. n.p. n.p.Very Remote n.p. n.p. n.p. n.p. n.p. n.p. n.p. n.p. n.p.
ACT
Metro 449.2 2.8 17.4 24.0 20.7 17.3 11.2 6.5 79.7Provincial n.p. n.p. n.p. n.p. n.p. n.p. n.p. n.p. n.p.Remote - - - - - - - - -Very Remote - - - - - - - - -
NT
Metro - - - - - - - - -Provincial 438.0 4.0 22.5 17.8 22.1 20.2 9.9 3.4 73.5Remote 382.0 6.1 44.7 19.0 14.9 10.3 3.1 1.8 49.2Very Remote 292.0 0.5 81.0 9.5 5.9 2.4 0.6 0.1 18.5
Aust
Metro 456.4 3.1 14.5 18.4 24.5 23.0 12.7 3.7 82.4Provincial 443.4 3.3 18.4 20.3 24.7 20.6 10.1 2.5 78.3Remote 404.1 3.2 36.3 20.2 20.2 14.5 4.6 1.0 60.5Very Remote 350.2 0.9 58.5 16.4 13.0 8.6 2.2 0.4 40.6
Refer to the introduction for explanatory notes.
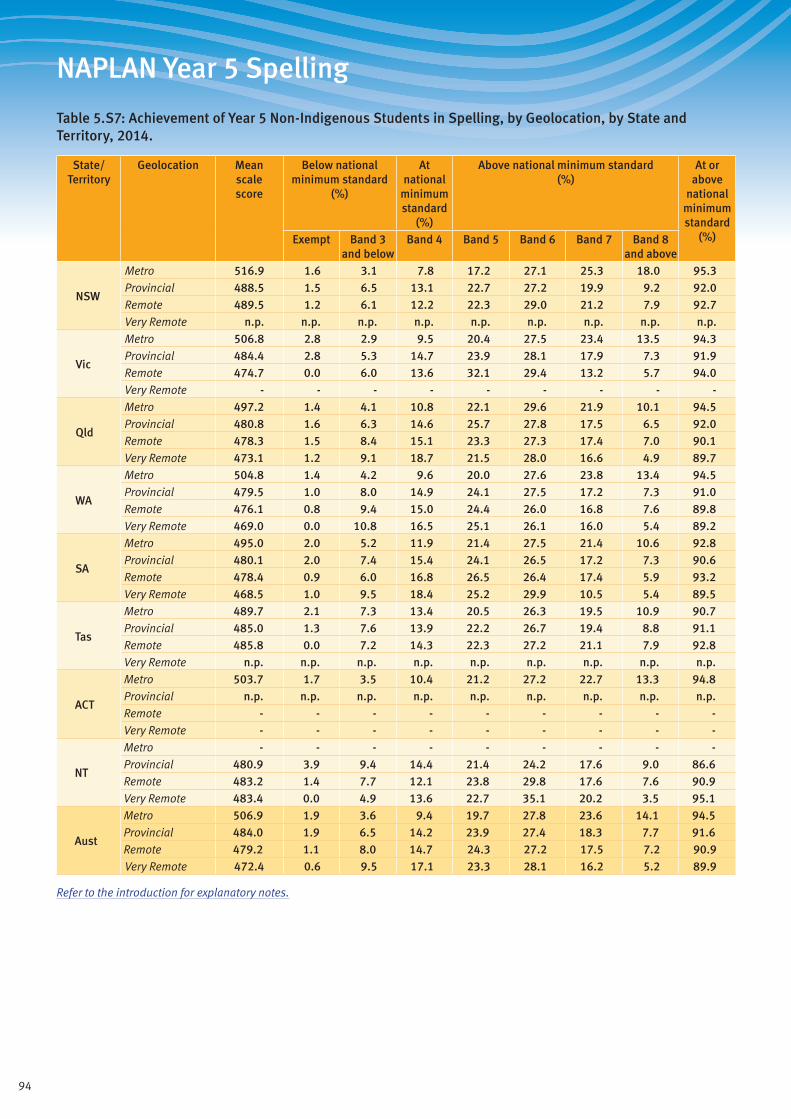
94
NAPLAN Year 5 Spelling
Table 5.S7: Achievement of Year 5 Non-Indigenous Students in Spelling, by Geolocation, by State and Territory, 2014.
State/ Territory
Geolocation Mean scale score
Below national minimum standard
(%)
At national
minimum standard
(%)
Above national minimum standard (%)
At or above
national minimum standard
(%)Exempt Band 3 and below
Band 4 Band 5 Band 6 Band 7 Band 8 and above
NSW
Metro 516.9 1.6 3.1 7.8 17.2 27.1 25.3 18.0 95.3Provincial 488.5 1.5 6.5 13.1 22.7 27.2 19.9 9.2 92.0Remote 489.5 1.2 6.1 12.2 22.3 29.0 21.2 7.9 92.7Very Remote n.p. n.p. n.p. n.p. n.p. n.p. n.p. n.p. n.p.
Vic
Metro 506.8 2.8 2.9 9.5 20.4 27.5 23.4 13.5 94.3Provincial 484.4 2.8 5.3 14.7 23.9 28.1 17.9 7.3 91.9Remote 474.7 0.0 6.0 13.6 32.1 29.4 13.2 5.7 94.0Very Remote - - - - - - - - -
Qld
Metro 497.2 1.4 4.1 10.8 22.1 29.6 21.9 10.1 94.5Provincial 480.8 1.6 6.3 14.6 25.7 27.8 17.5 6.5 92.0Remote 478.3 1.5 8.4 15.1 23.3 27.3 17.4 7.0 90.1Very Remote 473.1 1.2 9.1 18.7 21.5 28.0 16.6 4.9 89.7
WA
Metro 504.8 1.4 4.2 9.6 20.0 27.6 23.8 13.4 94.5Provincial 479.5 1.0 8.0 14.9 24.1 27.5 17.2 7.3 91.0Remote 476.1 0.8 9.4 15.0 24.4 26.0 16.8 7.6 89.8Very Remote 469.0 0.0 10.8 16.5 25.1 26.1 16.0 5.4 89.2
SA
Metro 495.0 2.0 5.2 11.9 21.4 27.5 21.4 10.6 92.8Provincial 480.1 2.0 7.4 15.4 24.1 26.5 17.2 7.3 90.6Remote 478.4 0.9 6.0 16.8 26.5 26.4 17.4 5.9 93.2Very Remote 468.5 1.0 9.5 18.4 25.2 29.9 10.5 5.4 89.5
Tas
Metro 489.7 2.1 7.3 13.4 20.5 26.3 19.5 10.9 90.7Provincial 485.0 1.3 7.6 13.9 22.2 26.7 19.4 8.8 91.1Remote 485.8 0.0 7.2 14.3 22.3 27.2 21.1 7.9 92.8Very Remote n.p. n.p. n.p. n.p. n.p. n.p. n.p. n.p. n.p.
ACT
Metro 503.7 1.7 3.5 10.4 21.2 27.2 22.7 13.3 94.8Provincial n.p. n.p. n.p. n.p. n.p. n.p. n.p. n.p. n.p.Remote - - - - - - - - -Very Remote - - - - - - - - -
NT
Metro - - - - - - - - -Provincial 480.9 3.9 9.4 14.4 21.4 24.2 17.6 9.0 86.6Remote 483.2 1.4 7.7 12.1 23.8 29.8 17.6 7.6 90.9Very Remote 483.4 0.0 4.9 13.6 22.7 35.1 20.2 3.5 95.1
Aust
Metro 506.9 1.9 3.6 9.4 19.7 27.8 23.6 14.1 94.5Provincial 484.0 1.9 6.5 14.2 23.9 27.4 18.3 7.7 91.6Remote 479.2 1.1 8.0 14.7 24.3 27.2 17.5 7.2 90.9Very Remote 472.4 0.6 9.5 17.1 23.3 28.1 16.2 5.2 89.9
Refer to the introduction for explanatory notes.

95
NAPLAN Year 5 Spelling
Table 5.S8: Achievement of Year 5 Students in Spelling, by Parental Education, by State and Territory, 2014.
State/ Territory
Parental education
Mean scale score
Below national minimum standard
(%)
At national
minimum standard
(%)
Above national minimum standard (%)
At or above
national minimum standard
(%)Exempt Band 3 and below
Band 4 Band 5 Band 6 Band 7 Band 8 and above
NSW
Bachelor 537.8 1.1 1.2 4.5 12.8 25.4 29.2 25.7 97.7Diploma 508.8 1.4 3.2 8.4 19.2 29.4 24.8 13.6 95.4Certificate 489.3 1.6 5.8 12.6 22.9 28.4 20.2 8.5 92.7Year 12 496.2 2.0 5.7 10.7 21.2 27.6 21.9 10.9 92.3Year 11 462.8 3.1 12.3 17.8 24.6 23.6 13.7 4.9 84.6Not stated (5%) 493.6 3.4 7.0 11.4 20.5 26.0 19.6 12.1 89.6
Vic
Bachelor 523.2 1.8 1.5 6.4 16.9 26.6 27.8 18.9 96.7Diploma 496.6 2.5 3.1 11.4 22.8 29.5 21.2 9.4 94.4Certificate 482.8 3.2 5.3 14.5 24.7 28.6 17.4 6.3 91.5Year 12 493.0 3.4 4.0 12.1 23.3 28.2 20.0 9.0 92.7Year 11 471.5 7.3 7.5 16.8 24.8 25.0 13.7 5.0 85.3Not stated (4%) 511.8 4.9 2.8 8.2 19.1 26.1 24.1 14.8 92.3
Qld
Bachelor 516.6 0.8 1.6 6.8 18.3 30.2 26.6 15.6 97.6Diploma 491.1 1.1 4.2 11.9 24.4 30.4 20.3 7.6 94.6Certificate 478.8 1.4 6.4 14.8 26.1 28.8 17.3 5.3 92.3Year 12 479.9 1.8 6.5 14.2 25.6 28.9 17.5 5.6 91.7Year 11 454.6 3.3 14.4 19.2 24.9 23.1 12.4 2.8 82.3Not stated (11%) 479.6 3.4 7.8 14.2 24.2 26.5 16.9 7.0 88.9
WA
Bachelor 524.0 0.9 1.9 5.9 16.7 26.8 28.6 19.3 97.2Diploma 494.7 1.1 4.3 10.9 23.4 29.6 21.4 9.3 94.6Certificate 481.5 1.0 7.1 14.3 24.3 28.3 18.1 6.9 91.9Year 12 484.2 1.3 7.3 14.2 22.6 26.9 19.3 8.4 91.4Year 11 452.1 2.1 16.3 18.9 24.2 23.3 11.6 3.5 81.6Not stated (14%) 469.7 2.1 14.4 15.0 20.2 23.3 16.1 8.9 83.5
SA
Bachelor 516.1 1.0 2.2 7.6 18.0 28.7 26.2 16.3 96.9Diploma 490.7 1.4 5.1 13.1 22.4 28.6 20.5 8.8 93.5Certificate 477.2 1.7 7.3 15.8 25.5 27.3 16.3 6.0 91.0Year 12 482.7 2.3 6.5 15.0 23.4 26.9 18.8 7.2 91.3Year 11 456.2 3.9 13.9 19.0 24.6 22.7 12.3 3.6 82.1Not stated (11%) 475.0 5.1 10.2 14.8 22.1 23.5 17.4 6.9 84.7
KeyBachelor: Bachelor degree or aboveDiploma: Advanced diploma/diplomaCertificate: Certificate I to IVYear 12: Year 12 or equivalentYear 11: Year 11 or equivalent or belowNot stated: No data was provided for parental education at the time of student enrolment. The higher the percentage of missing data, the less informative are the results for the other categories.
Refer to the introduction for explanatory notes.

96
NAPLAN Year 5 Spelling
Table 5.S8 (cont.): Achievement of Year 5 Students in Spelling, by Parental Education, by State and Territory, 2014.
State/ Territory
Parental education
Mean scale score
Below national minimum standard
(%)
At national
minimum standard
(%)
Above national minimum standard (%)
At or above
national minimum standard
(%)Exempt Band 3 and below
Band 4 Band 5 Band 6 Band 7 Band 8 and above
Tas
Bachelor 516.2 1.1 2.3 8.9 16.4 27.5 27.0 16.7 96.6Diploma 496.4 1.3 4.1 12.5 21.3 28.6 22.2 10.0 94.6Certificate 477.0 1.3 8.9 15.0 23.9 27.3 16.9 6.8 89.8Year 12 471.9 2.7 12.0 14.7 23.6 24.0 15.6 7.4 85.3Year 11 450.4 1.9 16.5 21.1 23.9 22.2 10.5 3.9 81.6Not stated (9%) 495.8 4.5 8.5 12.3 19.9 20.8 18.2 15.8 87.0
ACT
Bachelor 520.2 1.4 1.8 7.0 17.9 27.1 26.5 18.2 96.8Diploma 487.7 2.3 5.4 13.8 22.2 29.1 18.5 8.7 92.3Certificate 478.6 1.3 6.7 15.2 26.5 27.5 16.3 6.5 92.0Year 12 483.6 2.5 4.9 14.5 26.1 27.3 18.5 6.2 92.6Year 11 468.6 1.6 10.7 19.1 24.9 21.5 13.8 8.5 87.7Not stated (9%) 488.1 2.7 6.0 13.3 23.4 24.3 21.9 8.4 91.3
NT
Bachelor 503.5 1.5 4.2 10.1 18.9 28.8 22.8 13.7 94.2Diploma 478.5 1.3 8.6 15.0 23.7 27.8 16.7 6.8 90.0Certificate 451.1 2.4 17.7 17.8 22.5 21.2 13.6 4.7 79.8Year 12 453.6 4.4 16.3 15.6 25.2 23.4 11.1 4.1 79.3Year 11 372.1 2.5 50.6 15.2 14.8 10.5 4.3 2.0 46.9Not stated (29%) 350.7 4.0 56.7 10.4 10.1 10.1 6.0 2.7 39.3
Aust
Bachelor 526.3 1.2 1.6 6.0 15.9 27.1 27.9 20.4 97.2Diploma 498.8 1.6 3.7 10.6 21.9 29.6 22.2 10.4 94.7Certificate 483.1 1.9 6.2 14.1 24.4 28.3 18.2 6.8 91.9Year 12 488.1 2.3 5.9 12.8 23.3 27.8 19.6 8.4 91.8Year 11 459.7 4.1 12.8 18.1 24.4 23.5 12.9 4.2 83.1Not stated (8%) 478.7 3.5 10.7 13.0 21.1 24.6 17.8 9.3 85.8
KeyBachelor: Bachelor degree or aboveDiploma: Advanced diploma/diplomaCertificate: Certificate I to IVYear 12: Year 12 or equivalentYear 11: Year 11 or equivalent or belowNot stated: No data was provided for parental education at the time of student enrolment. The higher the percentage of missing data, the less informative are the results for the other categories.
Refer to the introduction for explanatory notes.
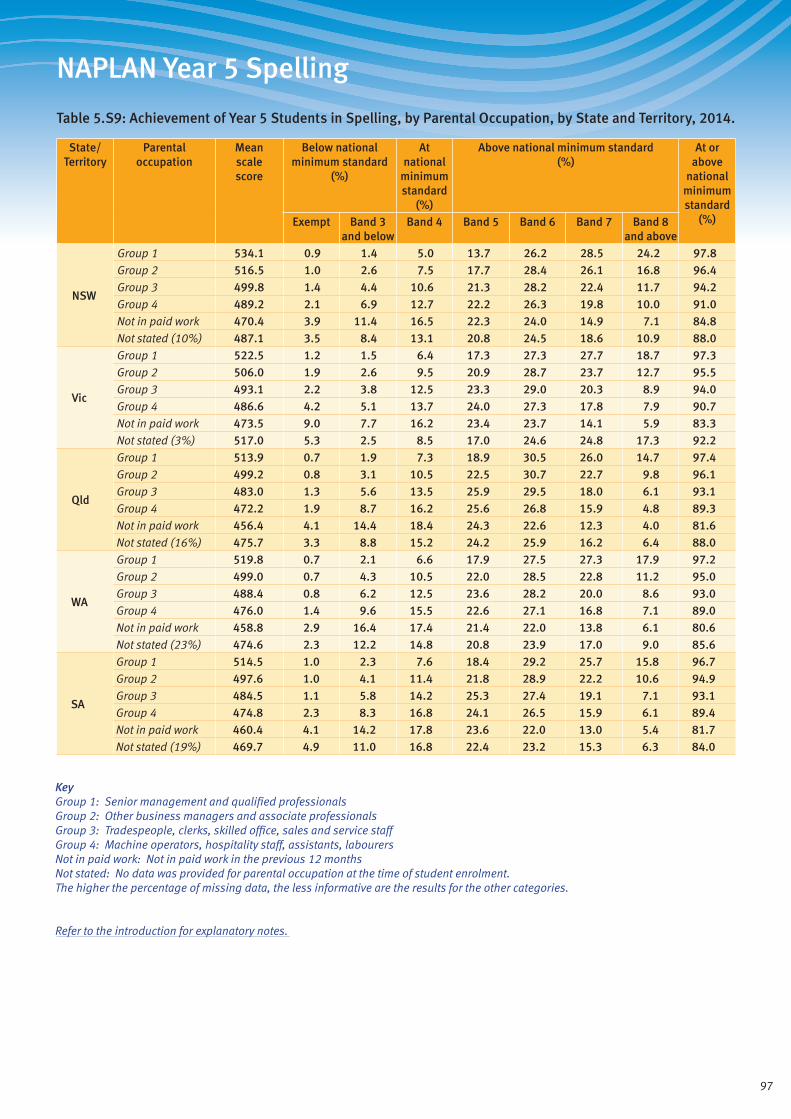
97
NAPLAN Year 5 Spelling
Table 5.S9: Achievement of Year 5 Students in Spelling, by Parental Occupation, by State and Territory, 2014.
State/ Territory
Parental occupation
Mean scale score
Below national minimum standard
(%)
At national
minimum standard
(%)
Above national minimum standard (%)
At or above
national minimum standard
(%)Exempt Band 3 and below
Band 4 Band 5 Band 6 Band 7 Band 8 and above
NSW
Group 1 534.1 0.9 1.4 5.0 13.7 26.2 28.5 24.2 97.8Group 2 516.5 1.0 2.6 7.5 17.7 28.4 26.1 16.8 96.4Group 3 499.8 1.4 4.4 10.6 21.3 28.2 22.4 11.7 94.2Group 4 489.2 2.1 6.9 12.7 22.2 26.3 19.8 10.0 91.0Not in paid work 470.4 3.9 11.4 16.5 22.3 24.0 14.9 7.1 84.8Not stated (10%) 487.1 3.5 8.4 13.1 20.8 24.5 18.6 10.9 88.0
Vic
Group 1 522.5 1.2 1.5 6.4 17.3 27.3 27.7 18.7 97.3Group 2 506.0 1.9 2.6 9.5 20.9 28.7 23.7 12.7 95.5Group 3 493.1 2.2 3.8 12.5 23.3 29.0 20.3 8.9 94.0Group 4 486.6 4.2 5.1 13.7 24.0 27.3 17.8 7.9 90.7Not in paid work 473.5 9.0 7.7 16.2 23.4 23.7 14.1 5.9 83.3Not stated (3%) 517.0 5.3 2.5 8.5 17.0 24.6 24.8 17.3 92.2
Qld
Group 1 513.9 0.7 1.9 7.3 18.9 30.5 26.0 14.7 97.4Group 2 499.2 0.8 3.1 10.5 22.5 30.7 22.7 9.8 96.1Group 3 483.0 1.3 5.6 13.5 25.9 29.5 18.0 6.1 93.1Group 4 472.2 1.9 8.7 16.2 25.6 26.8 15.9 4.8 89.3Not in paid work 456.4 4.1 14.4 18.4 24.3 22.6 12.3 4.0 81.6Not stated (16%) 475.7 3.3 8.8 15.2 24.2 25.9 16.2 6.4 88.0
WA
Group 1 519.8 0.7 2.1 6.6 17.9 27.5 27.3 17.9 97.2Group 2 499.0 0.7 4.3 10.5 22.0 28.5 22.8 11.2 95.0Group 3 488.4 0.8 6.2 12.5 23.6 28.2 20.0 8.6 93.0Group 4 476.0 1.4 9.6 15.5 22.6 27.1 16.8 7.1 89.0Not in paid work 458.8 2.9 16.4 17.4 21.4 22.0 13.8 6.1 80.6Not stated (23%) 474.6 2.3 12.2 14.8 20.8 23.9 17.0 9.0 85.6
SA
Group 1 514.5 1.0 2.3 7.6 18.4 29.2 25.7 15.8 96.7Group 2 497.6 1.0 4.1 11.4 21.8 28.9 22.2 10.6 94.9Group 3 484.5 1.1 5.8 14.2 25.3 27.4 19.1 7.1 93.1Group 4 474.8 2.3 8.3 16.8 24.1 26.5 15.9 6.1 89.4Not in paid work 460.4 4.1 14.2 17.8 23.6 22.0 13.0 5.4 81.7Not stated (19%) 469.7 4.9 11.0 16.8 22.4 23.2 15.3 6.3 84.0
KeyGroup 1: Senior management and qualified professionalsGroup 2: Other business managers and associate professionalsGroup 3: Tradespeople, clerks, skilled office, sales and service staffGroup 4: Machine operators, hospitality staff, assistants, labourersNot in paid work: Not in paid work in the previous 12 monthsNot stated: No data was provided for parental occupation at the time of student enrolment. The higher the percentage of missing data, the less informative are the results for the other categories.
Refer to the introduction for explanatory notes.
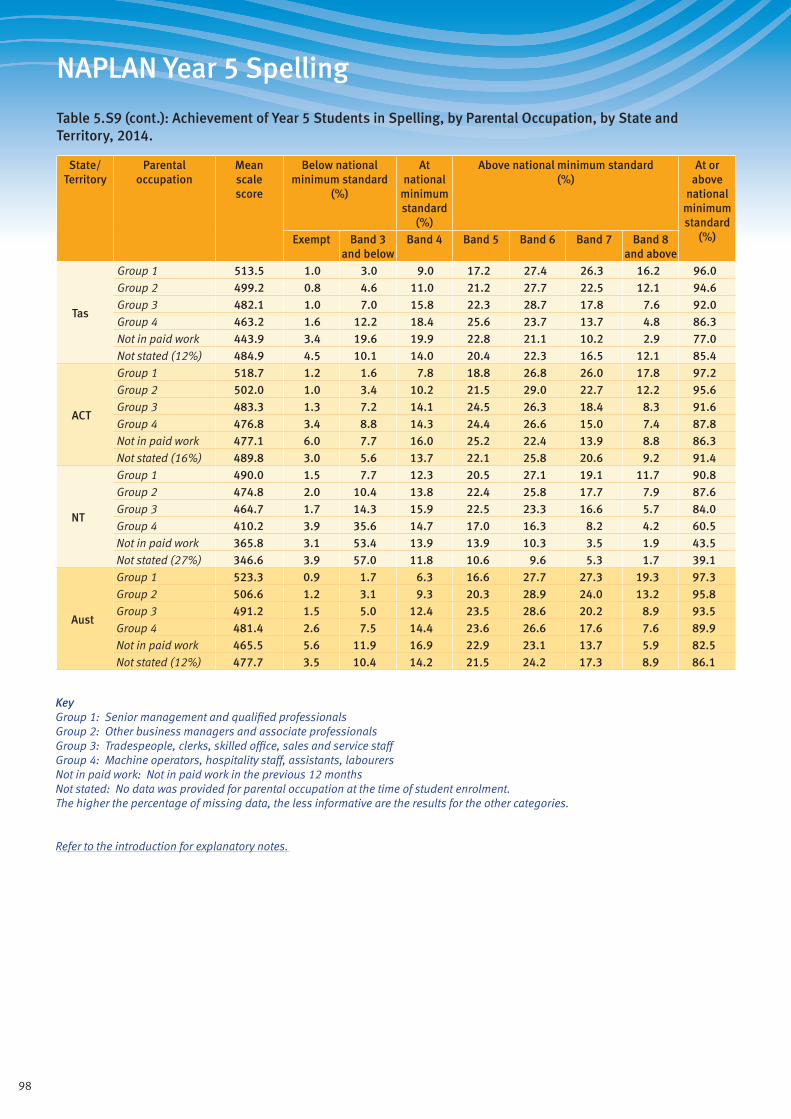
98
NAPLAN Year 5 Spelling
Table 5.S9 (cont.): Achievement of Year 5 Students in Spelling, by Parental Occupation, by State and Territory, 2014.
State/ Territory
Parental occupation
Mean scale score
Below national minimum standard
(%)
At national
minimum standard
(%)
Above national minimum standard (%)
At or above
national minimum standard
(%)Exempt Band 3 and below
Band 4 Band 5 Band 6 Band 7 Band 8 and above
Tas
Group 1 513.5 1.0 3.0 9.0 17.2 27.4 26.3 16.2 96.0Group 2 499.2 0.8 4.6 11.0 21.2 27.7 22.5 12.1 94.6Group 3 482.1 1.0 7.0 15.8 22.3 28.7 17.8 7.6 92.0Group 4 463.2 1.6 12.2 18.4 25.6 23.7 13.7 4.8 86.3Not in paid work 443.9 3.4 19.6 19.9 22.8 21.1 10.2 2.9 77.0Not stated (12%) 484.9 4.5 10.1 14.0 20.4 22.3 16.5 12.1 85.4
ACT
Group 1 518.7 1.2 1.6 7.8 18.8 26.8 26.0 17.8 97.2Group 2 502.0 1.0 3.4 10.2 21.5 29.0 22.7 12.2 95.6Group 3 483.3 1.3 7.2 14.1 24.5 26.3 18.4 8.3 91.6Group 4 476.8 3.4 8.8 14.3 24.4 26.6 15.0 7.4 87.8Not in paid work 477.1 6.0 7.7 16.0 25.2 22.4 13.9 8.8 86.3Not stated (16%) 489.8 3.0 5.6 13.7 22.1 25.8 20.6 9.2 91.4
NT
Group 1 490.0 1.5 7.7 12.3 20.5 27.1 19.1 11.7 90.8Group 2 474.8 2.0 10.4 13.8 22.4 25.8 17.7 7.9 87.6Group 3 464.7 1.7 14.3 15.9 22.5 23.3 16.6 5.7 84.0Group 4 410.2 3.9 35.6 14.7 17.0 16.3 8.2 4.2 60.5Not in paid work 365.8 3.1 53.4 13.9 13.9 10.3 3.5 1.9 43.5Not stated (27%) 346.6 3.9 57.0 11.8 10.6 9.6 5.3 1.7 39.1
Aust
Group 1 523.3 0.9 1.7 6.3 16.6 27.7 27.3 19.3 97.3Group 2 506.6 1.2 3.1 9.3 20.3 28.9 24.0 13.2 95.8Group 3 491.2 1.5 5.0 12.4 23.5 28.6 20.2 8.9 93.5Group 4 481.4 2.6 7.5 14.4 23.6 26.6 17.6 7.6 89.9Not in paid work 465.5 5.6 11.9 16.9 22.9 23.1 13.7 5.9 82.5Not stated (12%) 477.7 3.5 10.4 14.2 21.5 24.2 17.3 8.9 86.1
KeyGroup 1: Senior management and qualified professionalsGroup 2: Other business managers and associate professionalsGroup 3: Tradespeople, clerks, skilled office, sales and service staffGroup 4: Machine operators, hospitality staff, assistants, labourersNot in paid work: Not in paid work in the previous 12 monthsNot stated: No data was provided for parental occupation at the time of student enrolment. The higher the percentage of missing data, the less informative are the results for the other categories.
Refer to the introduction for explanatory notes.
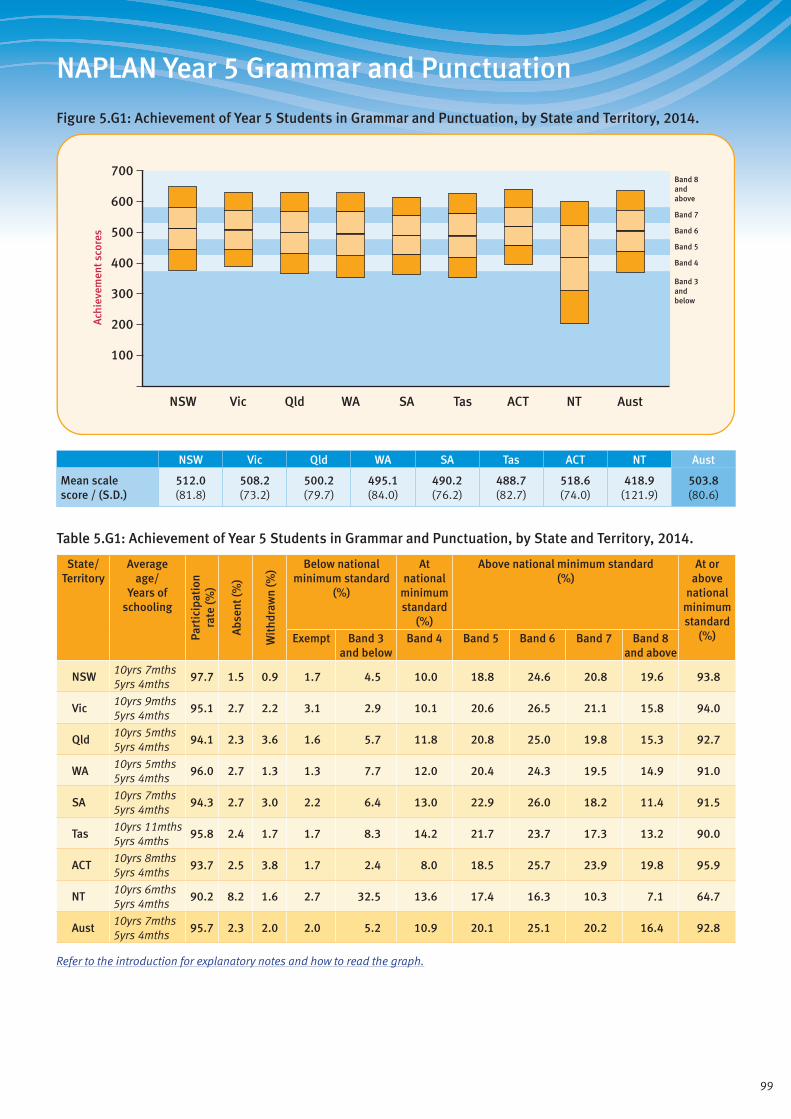
99
NAPLAN Year 5 Grammar and Punctuation
Figure 5.G1: Achievement of Year 5 Students in Grammar and Punctuation, by State and Territory, 2014.
Band 3andbelow
Band 4
Band 5
Band 6
Band 7
Band 8andabove
700
600
400
500
300
200
100
Ach
ieve
men
t sco
res
ACTQld SAWA TasVicNSW NT Aust
NSW Vic Qld WA SA Tas ACT NT Aust
Mean scale score / (S.D.)
512.0 (81.8)
508.2 (73.2)
500.2 (79.7)
495.1 (84.0)
490.2 (76.2)
488.7 (82.7)
518.6 (74.0)
418.9 (121.9)
503.8 (80.6)
Table 5.G1: Achievement of Year 5 Students in Grammar and Punctuation, by State and Territory, 2014.
State/ Territory
Average age/
Years of schooling
Part
icip
atio
nra
te (%
)
Abs
ent (
%)
Wit
hdra
wn
(%) Below national
minimum standard (%)
At national
minimum standard
(%)
Above national minimum standard (%)
At or above
national minimum standard
(%)Exempt Band 3 and below
Band 4 Band 5 Band 6 Band 7 Band 8 and above
NSW10yrs 7mths 5yrs 4mths
97.7 1.5 0.9 1.7 4.5 10.0 18.8 24.6 20.8 19.6 93.8
Vic10yrs 9mths 5yrs 4mths
95.1 2.7 2.2 3.1 2.9 10.1 20.6 26.5 21.1 15.8 94.0
Qld10yrs 5mths 5yrs 4mths
94.1 2.3 3.6 1.6 5.7 11.8 20.8 25.0 19.8 15.3 92.7
WA10yrs 5mths 5yrs 4mths
96.0 2.7 1.3 1.3 7.7 12.0 20.4 24.3 19.5 14.9 91.0
SA10yrs 7mths 5yrs 4mths
94.3 2.7 3.0 2.2 6.4 13.0 22.9 26.0 18.2 11.4 91.5
Tas10yrs 11mths 5yrs 4mths
95.8 2.4 1.7 1.7 8.3 14.2 21.7 23.7 17.3 13.2 90.0
ACT10yrs 8mths 5yrs 4mths
93.7 2.5 3.8 1.7 2.4 8.0 18.5 25.7 23.9 19.8 95.9
NT10yrs 6mths 5yrs 4mths
90.2 8.2 1.6 2.7 32.5 13.6 17.4 16.3 10.3 7.1 64.7
Aust10yrs 7mths 5yrs 4mths
95.7 2.3 2.0 2.0 5.2 10.9 20.1 25.1 20.2 16.4 92.8
Refer to the introduction for explanatory notes and how to read the graph.
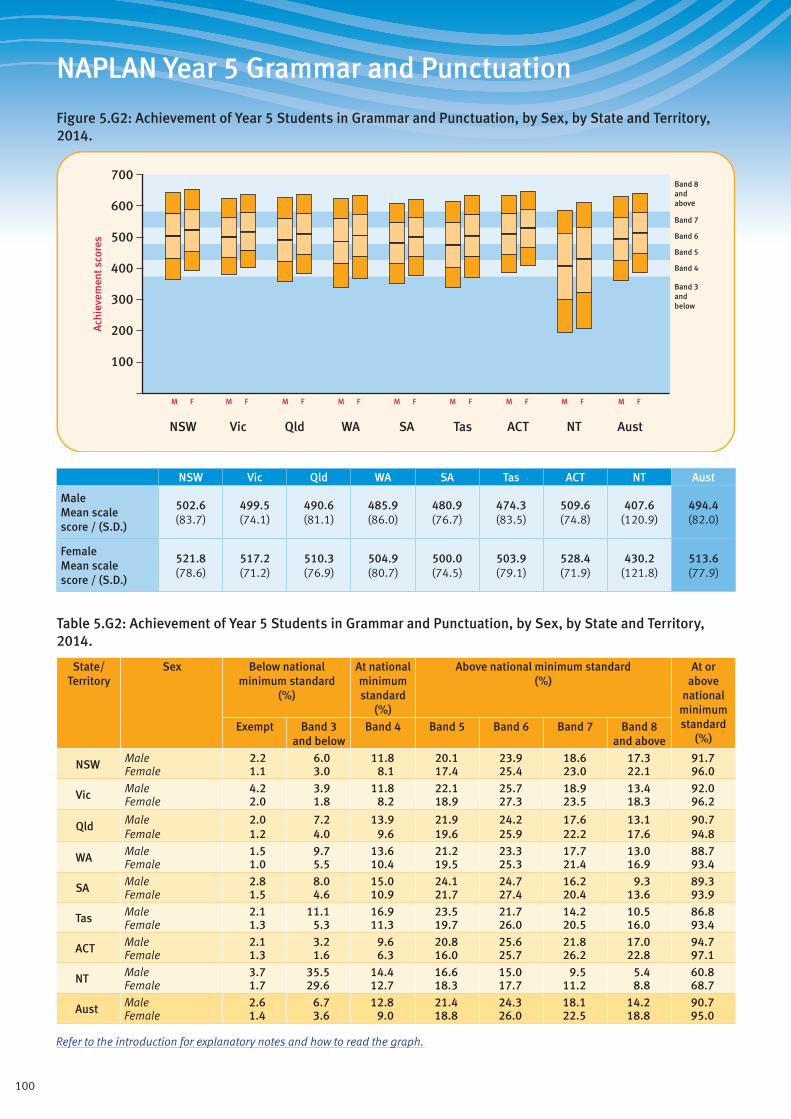
100
NAPLAN Year 5 Grammar and Punctuation
Figure 5.G2: Achievement of Year 5 Students in Grammar and Punctuation, by Sex, by State and Territory, 2014.
Band 3andbelow
Band 4
Band 5
Band 6
Band 7
Band 8andabove
ACTQld SAWA TasVicNSW NT Aust
M F M F M F M F M F M F M F M F M F
700
600
400
500
300
200
100
Ach
ieve
men
t sco
res
NSW Vic Qld WA SA Tas ACT NT Aust
Male Mean scale score / (S.D.)
502.6 (83.7)
499.5 (74.1)
490.6 (81.1)
485.9 (86.0)
480.9 (76.7)
474.3 (83.5)
509.6 (74.8)
407.6 (120.9)
494.4 (82.0)
Female Mean scale score / (S.D.)
521.8 (78.6)
517.2 (71.2)
510.3 (76.9)
504.9 (80.7)
500.0 (74.5)
503.9 (79.1)
528.4 (71.9)
430.2 (121.8)
513.6 (77.9)
Table 5.G2: Achievement of Year 5 Students in Grammar and Punctuation, by Sex, by State and Territory, 2014.
State/ Territory
Sex Below national minimum standard
(%)
At national minimum standard
(%)
Above national minimum standard (%)
At or above
national minimum standard
(%)Exempt Band 3
and belowBand 4 Band 5 Band 6 Band 7 Band 8
and above
NSW Male 2.2 6.0 11.8 20.1 23.9 18.6 17.3 91.7Female 1.1 3.0 8.1 17.4 25.4 23.0 22.1 96.0
Vic Male 4.2 3.9 11.8 22.1 25.7 18.9 13.4 92.0Female 2.0 1.8 8.2 18.9 27.3 23.5 18.3 96.2
Qld Male 2.0 7.2 13.9 21.9 24.2 17.6 13.1 90.7Female 1.2 4.0 9.6 19.6 25.9 22.2 17.6 94.8
WA Male 1.5 9.7 13.6 21.2 23.3 17.7 13.0 88.7Female 1.0 5.5 10.4 19.5 25.3 21.4 16.9 93.4
SA Male 2.8 8.0 15.0 24.1 24.7 16.2 9.3 89.3Female 1.5 4.6 10.9 21.7 27.4 20.4 13.6 93.9
Tas Male 2.1 11.1 16.9 23.5 21.7 14.2 10.5 86.8Female 1.3 5.3 11.3 19.7 26.0 20.5 16.0 93.4
ACT Male 2.1 3.2 9.6 20.8 25.6 21.8 17.0 94.7Female 1.3 1.6 6.3 16.0 25.7 26.2 22.8 97.1
NT Male 3.7 35.5 14.4 16.6 15.0 9.5 5.4 60.8Female 1.7 29.6 12.7 18.3 17.7 11.2 8.8 68.7
Aust Male 2.6 6.7 12.8 21.4 24.3 18.1 14.2 90.7Female 1.4 3.6 9.0 18.8 26.0 22.5 18.8 95.0
Refer to the introduction for explanatory notes and how to read the graph.
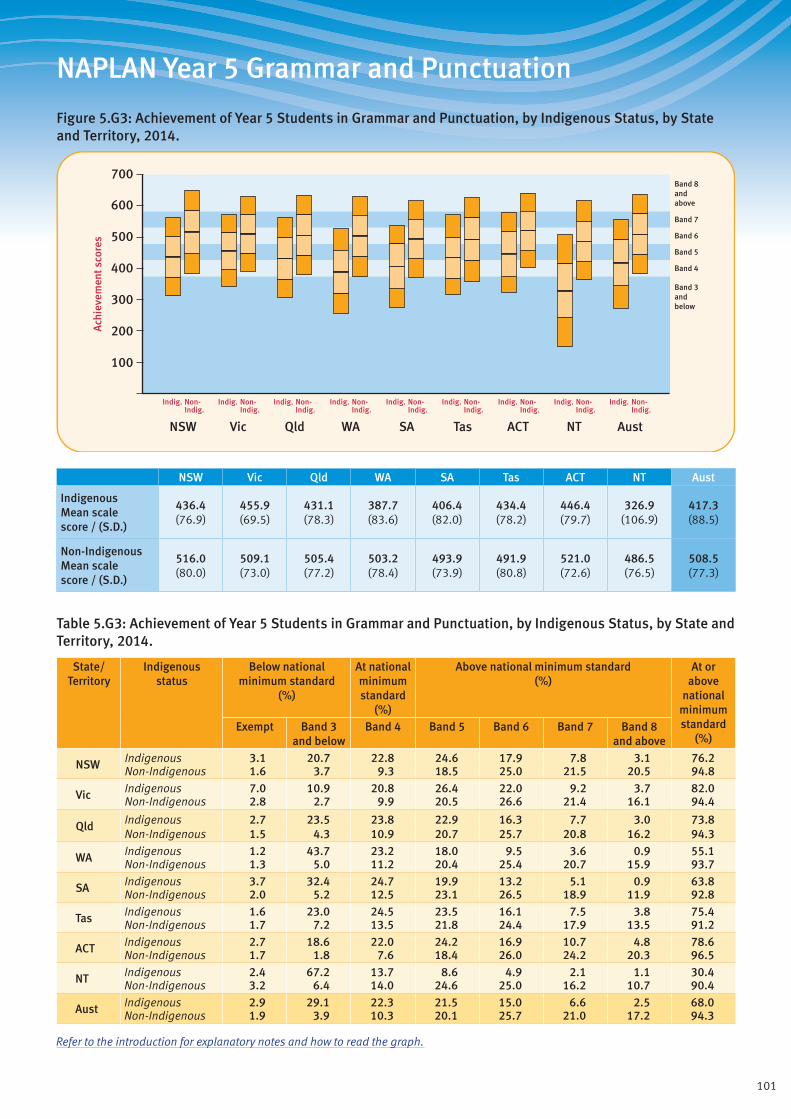
101
NAPLAN Year 5 Grammar and Punctuation
Figure 5.G3: Achievement of Year 5 Students in Grammar and Punctuation, by Indigenous Status, by State and Territory, 2014.
Band 3andbelow
Band 4
Band 5
Band 6
Band 7
Band 8andabove
ACTQld SAWA TasVicNSW NT Aust
700
600
400
500
300
200
100
Ach
ieve
men
t sco
res
Indig. Non-Indig.
Indig. Non-Indig.
Indig. Non-Indig.
Indig. Non-Indig.
Indig. Non-Indig.
Indig. Non-Indig.
Indig. Non-Indig.
Indig. Non-Indig.
Indig. Non-Indig.
NSW Vic Qld WA SA Tas ACT NT Aust
Indigenous Mean scale score / (S.D.)
436.4 (76.9)
455.9 (69.5)
431.1 (78.3)
387.7 (83.6)
406.4 (82.0)
434.4 (78.2)
446.4 (79.7)
326.9 (106.9)
417.3 (88.5)
Non-Indigenous Mean scale score / (S.D.)
516.0 (80.0)
509.1 (73.0)
505.4 (77.2)
503.2 (78.4)
493.9 (73.9)
491.9 (80.8)
521.0 (72.6)
486.5 (76.5)
508.5 (77.3)
Table 5.G3: Achievement of Year 5 Students in Grammar and Punctuation, by Indigenous Status, by State and Territory, 2014.
State/ Territory
Indigenous status
Below national minimum standard
(%)
At national minimum standard
(%)
Above national minimum standard (%)
At or above
national minimum standard
(%)Exempt Band 3
and belowBand 4 Band 5 Band 6 Band 7 Band 8
and above
NSW Indigenous 3.1 20.7 22.8 24.6 17.9 7.8 3.1 76.2Non-Indigenous 1.6 3.7 9.3 18.5 25.0 21.5 20.5 94.8
Vic Indigenous 7.0 10.9 20.8 26.4 22.0 9.2 3.7 82.0Non-Indigenous 2.8 2.7 9.9 20.5 26.6 21.4 16.1 94.4
Qld Indigenous 2.7 23.5 23.8 22.9 16.3 7.7 3.0 73.8Non-Indigenous 1.5 4.3 10.9 20.7 25.7 20.8 16.2 94.3
WA Indigenous 1.2 43.7 23.2 18.0 9.5 3.6 0.9 55.1Non-Indigenous 1.3 5.0 11.2 20.4 25.4 20.7 15.9 93.7
SA Indigenous 3.7 32.4 24.7 19.9 13.2 5.1 0.9 63.8Non-Indigenous 2.0 5.2 12.5 23.1 26.5 18.9 11.9 92.8
Tas Indigenous 1.6 23.0 24.5 23.5 16.1 7.5 3.8 75.4Non-Indigenous 1.7 7.2 13.5 21.8 24.4 17.9 13.5 91.2
ACT Indigenous 2.7 18.6 22.0 24.2 16.9 10.7 4.8 78.6Non-Indigenous 1.7 1.8 7.6 18.4 26.0 24.2 20.3 96.5
NT Indigenous 2.4 67.2 13.7 8.6 4.9 2.1 1.1 30.4Non-Indigenous 3.2 6.4 14.0 24.6 25.0 16.2 10.7 90.4
Aust Indigenous 2.9 29.1 22.3 21.5 15.0 6.6 2.5 68.0Non-Indigenous 1.9 3.9 10.3 20.1 25.7 21.0 17.2 94.3
Refer to the introduction for explanatory notes and how to read the graph.
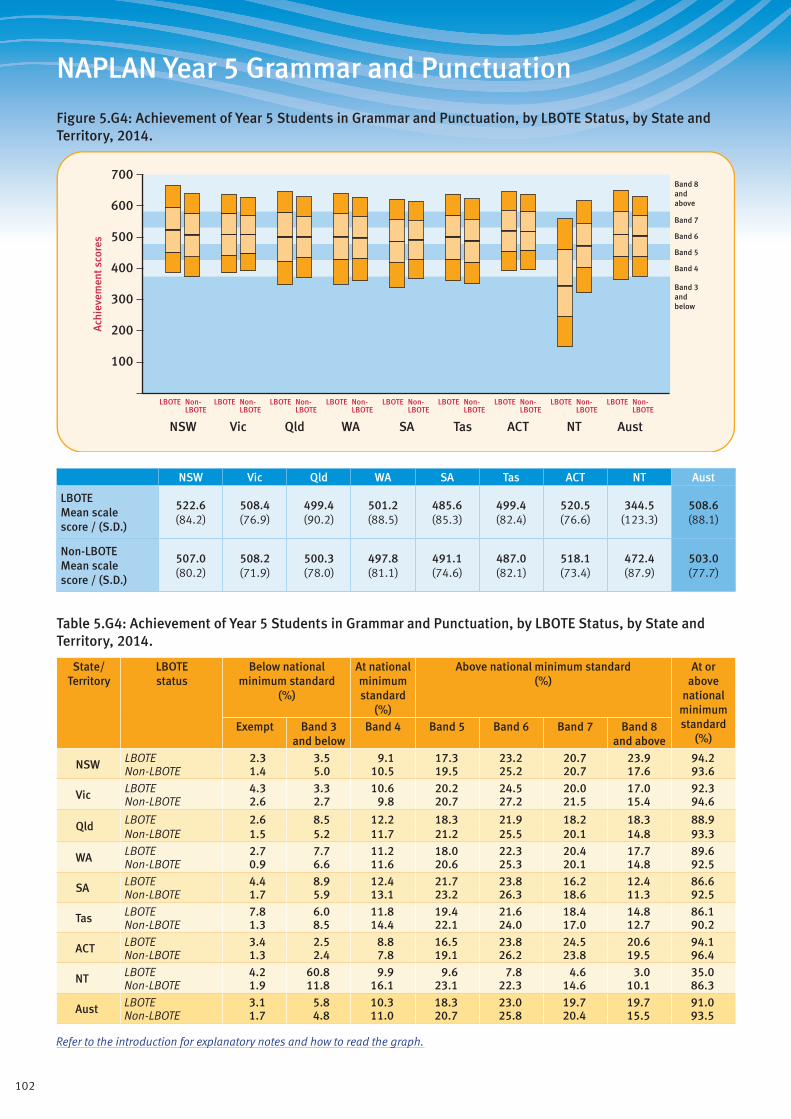
102
NAPLAN Year 5 Grammar and Punctuation
Figure 5.G4: Achievement of Year 5 Students in Grammar and Punctuation, by LBOTE Status, by State and Territory, 2014.
Band 3andbelow
Band 4
Band 5
Band 6
Band 7
Band 8andabove
ACTQld SAWA TasVicNSW NT Aust
700
600
400
500
300
200
100
Ach
ieve
men
t sco
res
LBOTE Non-LBOTE
LBOTE Non-LBOTE
LBOTE Non-LBOTE
LBOTE Non-LBOTE
LBOTE Non-LBOTE
LBOTE Non-LBOTE
LBOTE Non-LBOTE
LBOTE Non-LBOTE
LBOTE Non-LBOTE
NSW Vic Qld WA SA Tas ACT NT Aust
LBOTE Mean scale score / (S.D.)
522.6 (84.2)
508.4 (76.9)
499.4 (90.2)
501.2 (88.5)
485.6 (85.3)
499.4 (82.4)
520.5 (76.6)
344.5 (123.3)
508.6 (88.1)
Non-LBOTE Mean scale score / (S.D.)
507.0 (80.2)
508.2 (71.9)
500.3 (78.0)
497.8 (81.1)
491.1 (74.6)
487.0 (82.1)
518.1 (73.4)
472.4 (87.9)
503.0 (77.7)
Table 5.G4: Achievement of Year 5 Students in Grammar and Punctuation, by LBOTE Status, by State and Territory, 2014.
State/ Territory
LBOTE status
Below national minimum standard
(%)
At national minimum standard
(%)
Above national minimum standard (%)
At or above
national minimum standard
(%)Exempt Band 3
and belowBand 4 Band 5 Band 6 Band 7 Band 8
and above
NSW LBOTE 2.3 3.5 9.1 17.3 23.2 20.7 23.9 94.2Non-LBOTE 1.4 5.0 10.5 19.5 25.2 20.7 17.6 93.6
Vic LBOTE 4.3 3.3 10.6 20.2 24.5 20.0 17.0 92.3Non-LBOTE 2.6 2.7 9.8 20.7 27.2 21.5 15.4 94.6
Qld LBOTE 2.6 8.5 12.2 18.3 21.9 18.2 18.3 88.9Non-LBOTE 1.5 5.2 11.7 21.2 25.5 20.1 14.8 93.3
WA LBOTE 2.7 7.7 11.2 18.0 22.3 20.4 17.7 89.6Non-LBOTE 0.9 6.6 11.6 20.6 25.3 20.1 14.8 92.5
SA LBOTE 4.4 8.9 12.4 21.7 23.8 16.2 12.4 86.6Non-LBOTE 1.7 5.9 13.1 23.2 26.3 18.6 11.3 92.5
Tas LBOTE 7.8 6.0 11.8 19.4 21.6 18.4 14.8 86.1Non-LBOTE 1.3 8.5 14.4 22.1 24.0 17.0 12.7 90.2
ACT LBOTE 3.4 2.5 8.8 16.5 23.8 24.5 20.6 94.1Non-LBOTE 1.3 2.4 7.8 19.1 26.2 23.8 19.5 96.4
NT LBOTE 4.2 60.8 9.9 9.6 7.8 4.6 3.0 35.0Non-LBOTE 1.9 11.8 16.1 23.1 22.3 14.6 10.1 86.3
Aust LBOTE 3.1 5.8 10.3 18.3 23.0 19.7 19.7 91.0Non-LBOTE 1.7 4.8 11.0 20.7 25.8 20.4 15.5 93.5
Refer to the introduction for explanatory notes and how to read the graph.
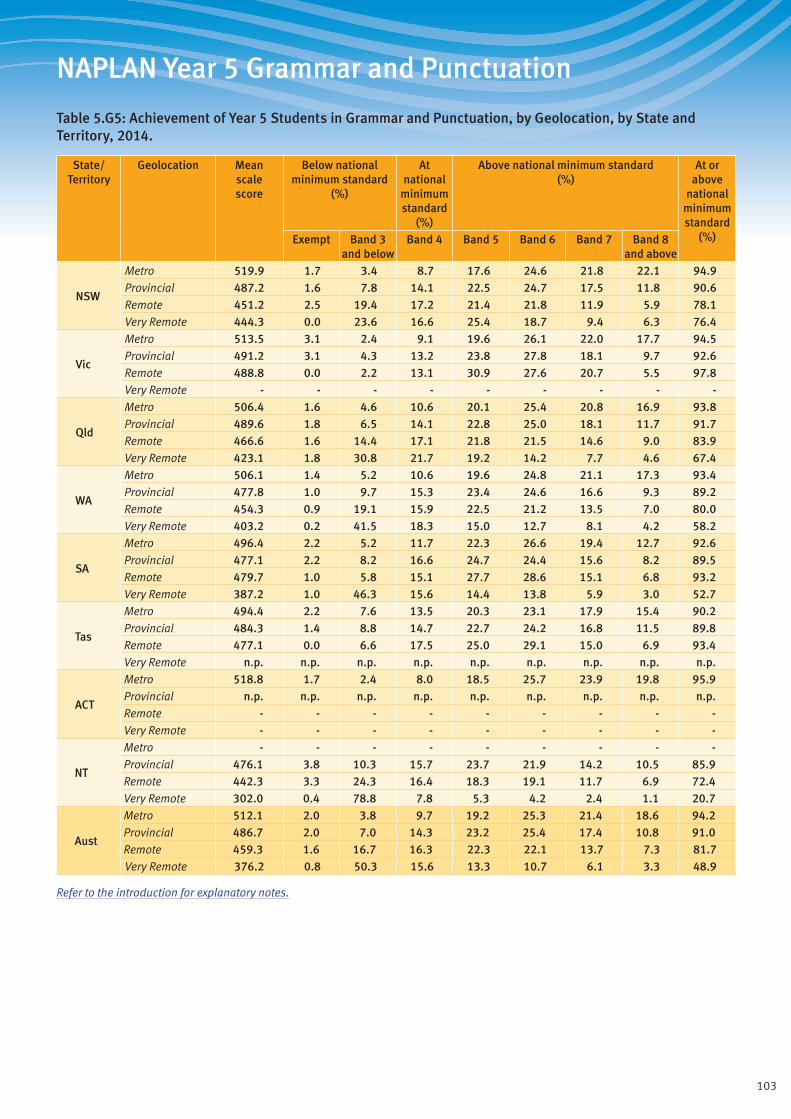
103
NAPLAN Year 5 Grammar and Punctuation
Table 5.G5: Achievement of Year 5 Students in Grammar and Punctuation, by Geolocation, by State and Territory, 2014.
State/ Territory
Geolocation Mean scale score
Below national minimum standard
(%)
At national
minimum standard
(%)
Above national minimum standard (%)
At or above
national minimum standard
(%)Exempt Band 3 and below
Band 4 Band 5 Band 6 Band 7 Band 8 and above
NSW
Metro 519.9 1.7 3.4 8.7 17.6 24.6 21.8 22.1 94.9Provincial 487.2 1.6 7.8 14.1 22.5 24.7 17.5 11.8 90.6Remote 451.2 2.5 19.4 17.2 21.4 21.8 11.9 5.9 78.1Very Remote 444.3 0.0 23.6 16.6 25.4 18.7 9.4 6.3 76.4
Vic
Metro 513.5 3.1 2.4 9.1 19.6 26.1 22.0 17.7 94.5Provincial 491.2 3.1 4.3 13.2 23.8 27.8 18.1 9.7 92.6Remote 488.8 0.0 2.2 13.1 30.9 27.6 20.7 5.5 97.8Very Remote - - - - - - - - -
Qld
Metro 506.4 1.6 4.6 10.6 20.1 25.4 20.8 16.9 93.8Provincial 489.6 1.8 6.5 14.1 22.8 25.0 18.1 11.7 91.7Remote 466.6 1.6 14.4 17.1 21.8 21.5 14.6 9.0 83.9Very Remote 423.1 1.8 30.8 21.7 19.2 14.2 7.7 4.6 67.4
WA
Metro 506.1 1.4 5.2 10.6 19.6 24.8 21.1 17.3 93.4Provincial 477.8 1.0 9.7 15.3 23.4 24.6 16.6 9.3 89.2Remote 454.3 0.9 19.1 15.9 22.5 21.2 13.5 7.0 80.0Very Remote 403.2 0.2 41.5 18.3 15.0 12.7 8.1 4.2 58.2
SA
Metro 496.4 2.2 5.2 11.7 22.3 26.6 19.4 12.7 92.6Provincial 477.1 2.2 8.2 16.6 24.7 24.4 15.6 8.2 89.5Remote 479.7 1.0 5.8 15.1 27.7 28.6 15.1 6.8 93.2Very Remote 387.2 1.0 46.3 15.6 14.4 13.8 5.9 3.0 52.7
Tas
Metro 494.4 2.2 7.6 13.5 20.3 23.1 17.9 15.4 90.2Provincial 484.3 1.4 8.8 14.7 22.7 24.2 16.8 11.5 89.8Remote 477.1 0.0 6.6 17.5 25.0 29.1 15.0 6.9 93.4Very Remote n.p. n.p. n.p. n.p. n.p. n.p. n.p. n.p. n.p.
ACT
Metro 518.8 1.7 2.4 8.0 18.5 25.7 23.9 19.8 95.9Provincial n.p. n.p. n.p. n.p. n.p. n.p. n.p. n.p. n.p.Remote - - - - - - - - -Very Remote - - - - - - - - -
NT
Metro - - - - - - - - -Provincial 476.1 3.8 10.3 15.7 23.7 21.9 14.2 10.5 85.9Remote 442.3 3.3 24.3 16.4 18.3 19.1 11.7 6.9 72.4Very Remote 302.0 0.4 78.8 7.8 5.3 4.2 2.4 1.1 20.7
Aust
Metro 512.1 2.0 3.8 9.7 19.2 25.3 21.4 18.6 94.2Provincial 486.7 2.0 7.0 14.3 23.2 25.4 17.4 10.8 91.0Remote 459.3 1.6 16.7 16.3 22.3 22.1 13.7 7.3 81.7Very Remote 376.2 0.8 50.3 15.6 13.3 10.7 6.1 3.3 48.9
Refer to the introduction for explanatory notes.
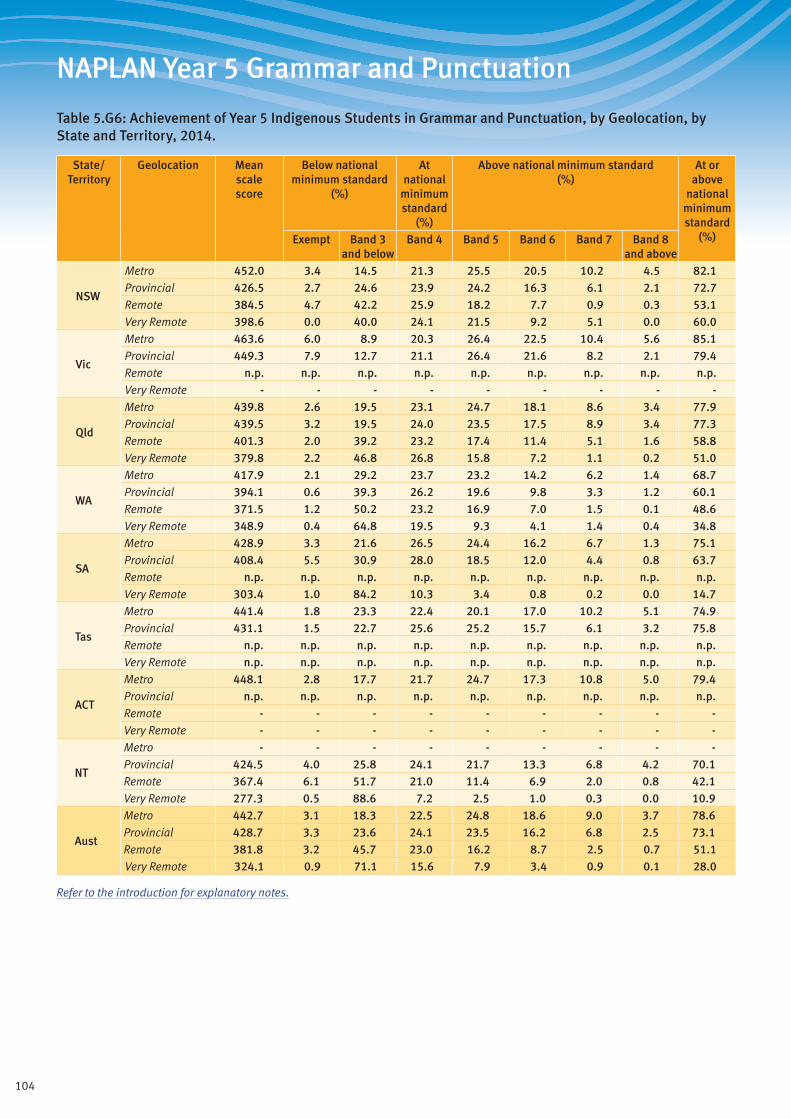
104
NAPLAN Year 5 Grammar and Punctuation
Table 5.G6: Achievement of Year 5 Indigenous Students in Grammar and Punctuation, by Geolocation, by State and Territory, 2014.
State/ Territory
Geolocation Mean scale score
Below national minimum standard
(%)
At national
minimum standard
(%)
Above national minimum standard (%)
At or above
national minimum standard
(%)Exempt Band 3 and below
Band 4 Band 5 Band 6 Band 7 Band 8 and above
NSW
Metro 452.0 3.4 14.5 21.3 25.5 20.5 10.2 4.5 82.1Provincial 426.5 2.7 24.6 23.9 24.2 16.3 6.1 2.1 72.7Remote 384.5 4.7 42.2 25.9 18.2 7.7 0.9 0.3 53.1Very Remote 398.6 0.0 40.0 24.1 21.5 9.2 5.1 0.0 60.0
Vic
Metro 463.6 6.0 8.9 20.3 26.4 22.5 10.4 5.6 85.1Provincial 449.3 7.9 12.7 21.1 26.4 21.6 8.2 2.1 79.4Remote n.p. n.p. n.p. n.p. n.p. n.p. n.p. n.p. n.p.Very Remote - - - - - - - - -
Qld
Metro 439.8 2.6 19.5 23.1 24.7 18.1 8.6 3.4 77.9Provincial 439.5 3.2 19.5 24.0 23.5 17.5 8.9 3.4 77.3Remote 401.3 2.0 39.2 23.2 17.4 11.4 5.1 1.6 58.8Very Remote 379.8 2.2 46.8 26.8 15.8 7.2 1.1 0.2 51.0
WA
Metro 417.9 2.1 29.2 23.7 23.2 14.2 6.2 1.4 68.7Provincial 394.1 0.6 39.3 26.2 19.6 9.8 3.3 1.2 60.1Remote 371.5 1.2 50.2 23.2 16.9 7.0 1.5 0.1 48.6Very Remote 348.9 0.4 64.8 19.5 9.3 4.1 1.4 0.4 34.8
SA
Metro 428.9 3.3 21.6 26.5 24.4 16.2 6.7 1.3 75.1Provincial 408.4 5.5 30.9 28.0 18.5 12.0 4.4 0.8 63.7Remote n.p. n.p. n.p. n.p. n.p. n.p. n.p. n.p. n.p.Very Remote 303.4 1.0 84.2 10.3 3.4 0.8 0.2 0.0 14.7
Tas
Metro 441.4 1.8 23.3 22.4 20.1 17.0 10.2 5.1 74.9Provincial 431.1 1.5 22.7 25.6 25.2 15.7 6.1 3.2 75.8Remote n.p. n.p. n.p. n.p. n.p. n.p. n.p. n.p. n.p.Very Remote n.p. n.p. n.p. n.p. n.p. n.p. n.p. n.p. n.p.
ACT
Metro 448.1 2.8 17.7 21.7 24.7 17.3 10.8 5.0 79.4Provincial n.p. n.p. n.p. n.p. n.p. n.p. n.p. n.p. n.p.Remote - - - - - - - - -Very Remote - - - - - - - - -
NT
Metro - - - - - - - - -Provincial 424.5 4.0 25.8 24.1 21.7 13.3 6.8 4.2 70.1Remote 367.4 6.1 51.7 21.0 11.4 6.9 2.0 0.8 42.1Very Remote 277.3 0.5 88.6 7.2 2.5 1.0 0.3 0.0 10.9
Aust
Metro 442.7 3.1 18.3 22.5 24.8 18.6 9.0 3.7 78.6Provincial 428.7 3.3 23.6 24.1 23.5 16.2 6.8 2.5 73.1Remote 381.8 3.2 45.7 23.0 16.2 8.7 2.5 0.7 51.1Very Remote 324.1 0.9 71.1 15.6 7.9 3.4 0.9 0.1 28.0
Refer to the introduction for explanatory notes.

105
NAPLAN Year 5 Grammar and Punctuation
Table 5.G7: Achievement of Year 5 Non-Indigenous Students in Grammar and Punctuation, by Geolocation, by State and Territory, 2014.
State/ Territory
Geolocation Mean scale score
Below national minimum standard
(%)
At national
minimum standard
(%)
Above national minimum standard (%)
At or above
national minimum standard
(%)Exempt Band 3 and below
Band 4 Band 5 Band 6 Band 7 Band 8 and above
NSW
Metro 521.9 1.6 3.1 8.4 17.4 24.8 22.2 22.6 95.3Provincial 494.9 1.5 5.7 12.8 22.3 25.7 18.9 13.1 92.8Remote 491.2 1.2 5.7 11.5 22.6 30.5 18.9 9.6 93.0Very Remote n.p. n.p. n.p. n.p. n.p. n.p. n.p. n.p. n.p.
Vic
Metro 514.0 2.8 2.4 9.0 19.5 26.1 22.2 17.9 94.8Provincial 492.7 2.8 4.0 12.9 23.8 28.0 18.5 10.0 93.2Remote 490.3 0.0 2.3 12.8 29.8 27.9 21.5 5.7 97.7Very Remote - - - - - - - - -
Qld
Metro 509.8 1.4 3.9 10.0 19.8 25.7 21.5 17.7 94.7Provincial 495.0 1.6 5.1 13.1 22.7 25.9 19.1 12.5 93.3Remote 486.6 1.5 6.8 15.2 23.2 24.6 17.5 11.3 91.7Very Remote 484.6 1.2 8.0 14.3 23.9 24.3 17.3 11.0 90.7
WA
Metro 509.5 1.4 4.2 10.1 19.3 25.3 21.7 17.9 94.4Provincial 485.3 1.0 7.2 14.4 23.7 26.0 17.8 10.0 91.8Remote 482.3 0.8 8.7 13.2 24.4 25.8 17.6 9.5 90.5Very Remote 476.6 0.0 10.0 16.5 22.8 24.3 16.9 9.5 90.0
SA
Metro 498.5 2.0 4.6 11.3 22.3 26.9 19.8 13.1 93.4Provincial 481.3 2.0 6.9 15.8 24.9 25.2 16.4 8.7 91.1Remote 482.7 0.9 5.0 14.5 27.9 28.6 16.0 7.2 94.2Very Remote 468.4 1.0 9.1 21.0 24.7 26.4 11.8 6.0 89.9
Tas
Metro 497.6 2.1 6.7 13.0 20.4 23.5 18.3 16.1 91.3Provincial 487.2 1.3 7.6 13.8 23.0 25.2 17.7 11.4 91.1Remote 483.4 0.0 5.7 15.1 25.3 29.8 16.2 7.9 94.3Very Remote n.p. n.p. n.p. n.p. n.p. n.p. n.p. n.p. n.p.
ACT
Metro 521.0 1.7 1.8 7.6 18.4 26.0 24.2 20.3 96.5Provincial n.p. n.p. n.p. n.p. n.p. n.p. n.p. n.p. n.p.Remote - - - - - - - - -Very Remote - - - - - - - - -
NT
Metro - - - - - - - - -Provincial 484.0 3.9 7.1 14.4 24.8 23.8 15.3 10.6 89.0Remote 492.7 1.4 4.9 13.1 23.0 27.8 18.5 11.2 93.7Very Remote 493.8 0.0 3.1 11.5 27.6 29.3 18.8 9.7 96.9
Aust
Metro 514.2 1.9 3.3 9.3 19.0 25.5 21.9 19.1 94.8Provincial 492.0 1.9 5.4 13.3 23.2 26.3 18.5 11.5 92.7Remote 485.7 1.1 6.7 13.8 24.4 26.6 17.6 9.7 92.2Very Remote 480.6 0.6 8.7 15.6 23.7 24.8 16.7 9.9 90.8
Refer to the introduction for explanatory notes.
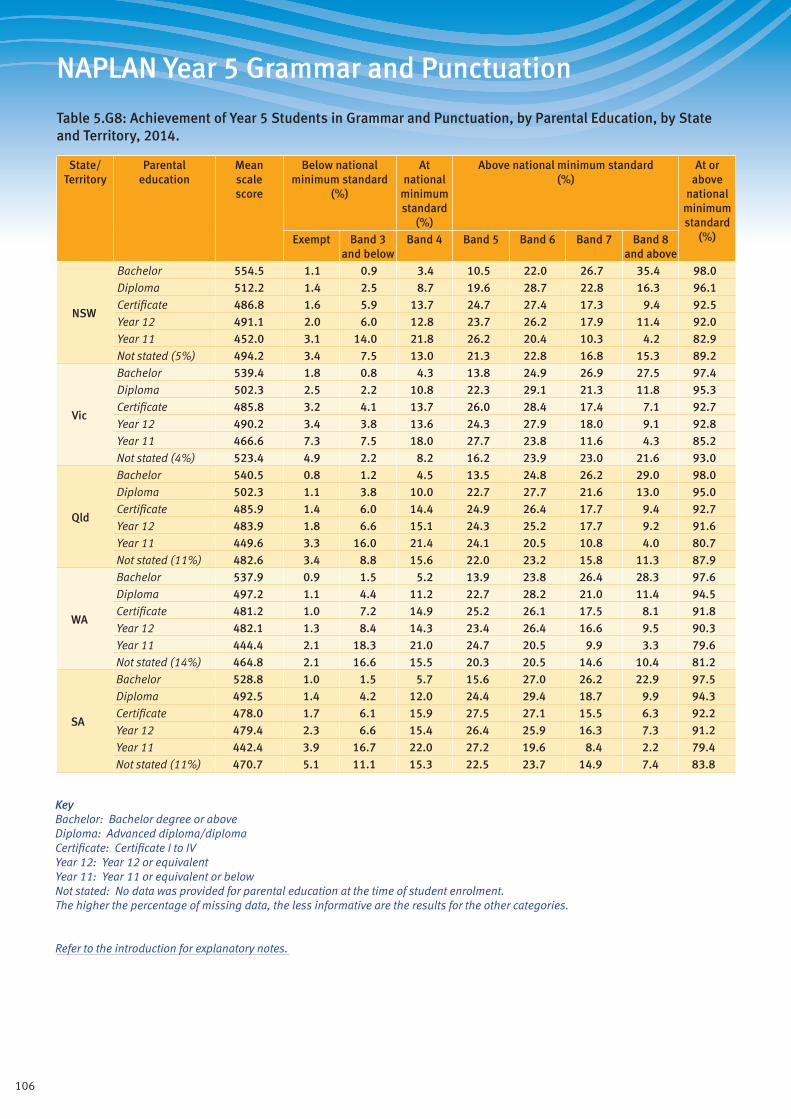
106
NAPLAN Year 5 Grammar and Punctuation
Table 5.G8: Achievement of Year 5 Students in Grammar and Punctuation, by Parental Education, by State and Territory, 2014.
State/ Territory
Parental education
Mean scale score
Below national minimum standard
(%)
At national
minimum standard
(%)
Above national minimum standard (%)
At or above
national minimum standard
(%)Exempt Band 3 and below
Band 4 Band 5 Band 6 Band 7 Band 8 and above
NSW
Bachelor 554.5 1.1 0.9 3.4 10.5 22.0 26.7 35.4 98.0Diploma 512.2 1.4 2.5 8.7 19.6 28.7 22.8 16.3 96.1Certificate 486.8 1.6 5.9 13.7 24.7 27.4 17.3 9.4 92.5Year 12 491.1 2.0 6.0 12.8 23.7 26.2 17.9 11.4 92.0Year 11 452.0 3.1 14.0 21.8 26.2 20.4 10.3 4.2 82.9Not stated (5%) 494.2 3.4 7.5 13.0 21.3 22.8 16.8 15.3 89.2
Vic
Bachelor 539.4 1.8 0.8 4.3 13.8 24.9 26.9 27.5 97.4Diploma 502.3 2.5 2.2 10.8 22.3 29.1 21.3 11.8 95.3Certificate 485.8 3.2 4.1 13.7 26.0 28.4 17.4 7.1 92.7Year 12 490.2 3.4 3.8 13.6 24.3 27.9 18.0 9.1 92.8Year 11 466.6 7.3 7.5 18.0 27.7 23.8 11.6 4.3 85.2Not stated (4%) 523.4 4.9 2.2 8.2 16.2 23.9 23.0 21.6 93.0
Qld
Bachelor 540.5 0.8 1.2 4.5 13.5 24.8 26.2 29.0 98.0Diploma 502.3 1.1 3.8 10.0 22.7 27.7 21.6 13.0 95.0Certificate 485.9 1.4 6.0 14.4 24.9 26.4 17.7 9.4 92.7Year 12 483.9 1.8 6.6 15.1 24.3 25.2 17.7 9.2 91.6Year 11 449.6 3.3 16.0 21.4 24.1 20.5 10.8 4.0 80.7Not stated (11%) 482.6 3.4 8.8 15.6 22.0 23.2 15.8 11.3 87.9
WA
Bachelor 537.9 0.9 1.5 5.2 13.9 23.8 26.4 28.3 97.6Diploma 497.2 1.1 4.4 11.2 22.7 28.2 21.0 11.4 94.5Certificate 481.2 1.0 7.2 14.9 25.2 26.1 17.5 8.1 91.8Year 12 482.1 1.3 8.4 14.3 23.4 26.4 16.6 9.5 90.3Year 11 444.4 2.1 18.3 21.0 24.7 20.5 9.9 3.3 79.6Not stated (14%) 464.8 2.1 16.6 15.5 20.3 20.5 14.6 10.4 81.2
SA
Bachelor 528.8 1.0 1.5 5.7 15.6 27.0 26.2 22.9 97.5Diploma 492.5 1.4 4.2 12.0 24.4 29.4 18.7 9.9 94.3Certificate 478.0 1.7 6.1 15.9 27.5 27.1 15.5 6.3 92.2Year 12 479.4 2.3 6.6 15.4 26.4 25.9 16.3 7.3 91.2Year 11 442.4 3.9 16.7 22.0 27.2 19.6 8.4 2.2 79.4Not stated (11%) 470.7 5.1 11.1 15.3 22.5 23.7 14.9 7.4 83.8
KeyBachelor: Bachelor degree or aboveDiploma: Advanced diploma/diplomaCertificate: Certificate I to IVYear 12: Year 12 or equivalentYear 11: Year 11 or equivalent or belowNot stated: No data was provided for parental education at the time of student enrolment. The higher the percentage of missing data, the less informative are the results for the other categories.
Refer to the introduction for explanatory notes.
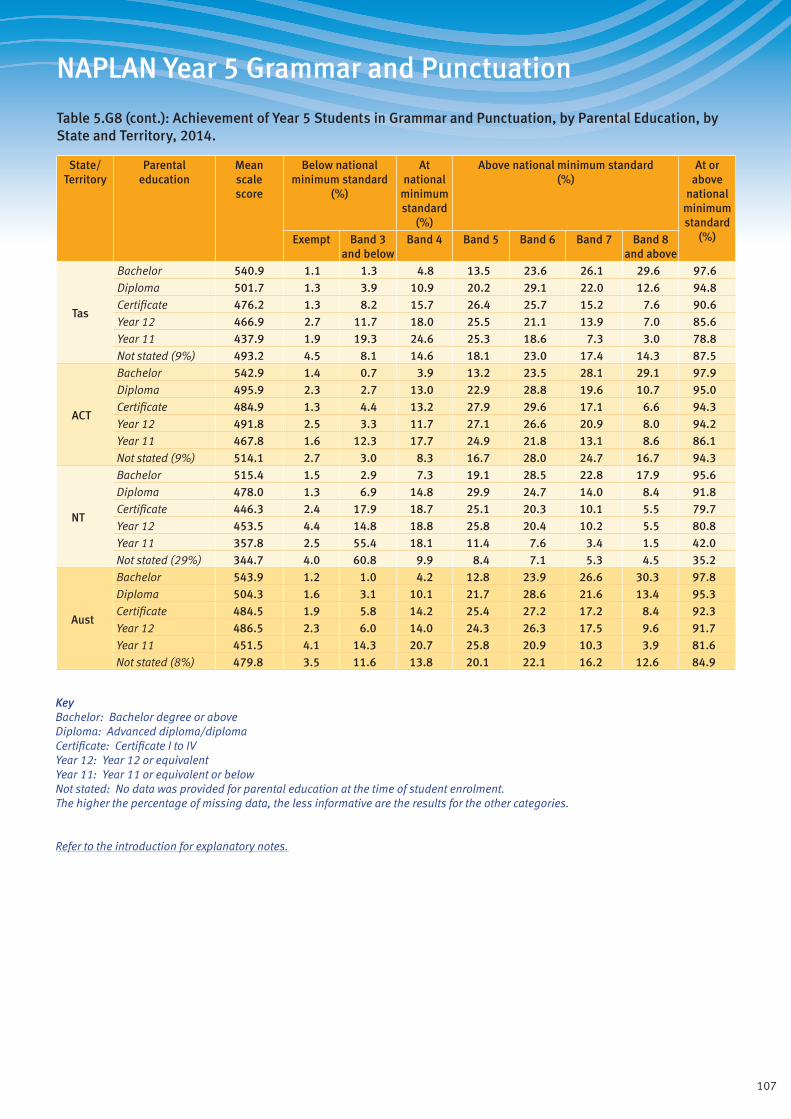
107
NAPLAN Year 5 Grammar and Punctuation
Table 5.G8 (cont.): Achievement of Year 5 Students in Grammar and Punctuation, by Parental Education, by State and Territory, 2014.
State/ Territory
Parental education
Mean scale score
Below national minimum standard
(%)
At national
minimum standard
(%)
Above national minimum standard (%)
At or above
national minimum standard
(%)Exempt Band 3 and below
Band 4 Band 5 Band 6 Band 7 Band 8 and above
Tas
Bachelor 540.9 1.1 1.3 4.8 13.5 23.6 26.1 29.6 97.6Diploma 501.7 1.3 3.9 10.9 20.2 29.1 22.0 12.6 94.8Certificate 476.2 1.3 8.2 15.7 26.4 25.7 15.2 7.6 90.6Year 12 466.9 2.7 11.7 18.0 25.5 21.1 13.9 7.0 85.6Year 11 437.9 1.9 19.3 24.6 25.3 18.6 7.3 3.0 78.8Not stated (9%) 493.2 4.5 8.1 14.6 18.1 23.0 17.4 14.3 87.5
ACT
Bachelor 542.9 1.4 0.7 3.9 13.2 23.5 28.1 29.1 97.9Diploma 495.9 2.3 2.7 13.0 22.9 28.8 19.6 10.7 95.0Certificate 484.9 1.3 4.4 13.2 27.9 29.6 17.1 6.6 94.3Year 12 491.8 2.5 3.3 11.7 27.1 26.6 20.9 8.0 94.2Year 11 467.8 1.6 12.3 17.7 24.9 21.8 13.1 8.6 86.1Not stated (9%) 514.1 2.7 3.0 8.3 16.7 28.0 24.7 16.7 94.3
NT
Bachelor 515.4 1.5 2.9 7.3 19.1 28.5 22.8 17.9 95.6Diploma 478.0 1.3 6.9 14.8 29.9 24.7 14.0 8.4 91.8Certificate 446.3 2.4 17.9 18.7 25.1 20.3 10.1 5.5 79.7Year 12 453.5 4.4 14.8 18.8 25.8 20.4 10.2 5.5 80.8Year 11 357.8 2.5 55.4 18.1 11.4 7.6 3.4 1.5 42.0Not stated (29%) 344.7 4.0 60.8 9.9 8.4 7.1 5.3 4.5 35.2
Aust
Bachelor 543.9 1.2 1.0 4.2 12.8 23.9 26.6 30.3 97.8Diploma 504.3 1.6 3.1 10.1 21.7 28.6 21.6 13.4 95.3Certificate 484.5 1.9 5.8 14.2 25.4 27.2 17.2 8.4 92.3Year 12 486.5 2.3 6.0 14.0 24.3 26.3 17.5 9.6 91.7Year 11 451.5 4.1 14.3 20.7 25.8 20.9 10.3 3.9 81.6Not stated (8%) 479.8 3.5 11.6 13.8 20.1 22.1 16.2 12.6 84.9
KeyBachelor: Bachelor degree or aboveDiploma: Advanced diploma/diplomaCertificate: Certificate I to IVYear 12: Year 12 or equivalentYear 11: Year 11 or equivalent or belowNot stated: No data was provided for parental education at the time of student enrolment. The higher the percentage of missing data, the less informative are the results for the other categories.
Refer to the introduction for explanatory notes.
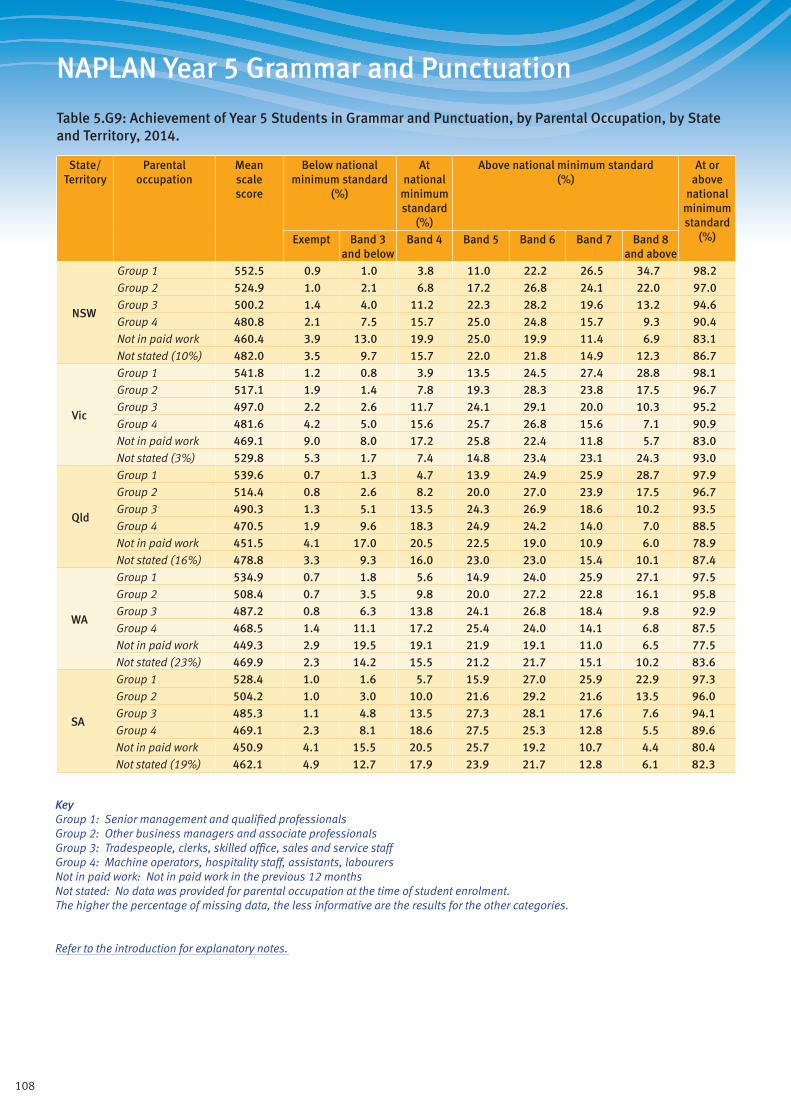
108
NAPLAN Year 5 Grammar and Punctuation
Table 5.G9: Achievement of Year 5 Students in Grammar and Punctuation, by Parental Occupation, by State and Territory, 2014.
State/ Territory
Parental occupation
Mean scale score
Below national minimum standard
(%)
At national
minimum standard
(%)
Above national minimum standard (%)
At or above
national minimum standard
(%)Exempt Band 3 and below
Band 4 Band 5 Band 6 Band 7 Band 8 and above
NSW
Group 1 552.5 0.9 1.0 3.8 11.0 22.2 26.5 34.7 98.2Group 2 524.9 1.0 2.1 6.8 17.2 26.8 24.1 22.0 97.0Group 3 500.2 1.4 4.0 11.2 22.3 28.2 19.6 13.2 94.6Group 4 480.8 2.1 7.5 15.7 25.0 24.8 15.7 9.3 90.4Not in paid work 460.4 3.9 13.0 19.9 25.0 19.9 11.4 6.9 83.1Not stated (10%) 482.0 3.5 9.7 15.7 22.0 21.8 14.9 12.3 86.7
Vic
Group 1 541.8 1.2 0.8 3.9 13.5 24.5 27.4 28.8 98.1Group 2 517.1 1.9 1.4 7.8 19.3 28.3 23.8 17.5 96.7Group 3 497.0 2.2 2.6 11.7 24.1 29.1 20.0 10.3 95.2Group 4 481.6 4.2 5.0 15.6 25.7 26.8 15.6 7.1 90.9Not in paid work 469.1 9.0 8.0 17.2 25.8 22.4 11.8 5.7 83.0Not stated (3%) 529.8 5.3 1.7 7.4 14.8 23.4 23.1 24.3 93.0
Qld
Group 1 539.6 0.7 1.3 4.7 13.9 24.9 25.9 28.7 97.9Group 2 514.4 0.8 2.6 8.2 20.0 27.0 23.9 17.5 96.7Group 3 490.3 1.3 5.1 13.5 24.3 26.9 18.6 10.2 93.5Group 4 470.5 1.9 9.6 18.3 24.9 24.2 14.0 7.0 88.5Not in paid work 451.5 4.1 17.0 20.5 22.5 19.0 10.9 6.0 78.9Not stated (16%) 478.8 3.3 9.3 16.0 23.0 23.0 15.4 10.1 87.4
WA
Group 1 534.9 0.7 1.8 5.6 14.9 24.0 25.9 27.1 97.5Group 2 508.4 0.7 3.5 9.8 20.0 27.2 22.8 16.1 95.8Group 3 487.2 0.8 6.3 13.8 24.1 26.8 18.4 9.8 92.9Group 4 468.5 1.4 11.1 17.2 25.4 24.0 14.1 6.8 87.5Not in paid work 449.3 2.9 19.5 19.1 21.9 19.1 11.0 6.5 77.5Not stated (23%) 469.9 2.3 14.2 15.5 21.2 21.7 15.1 10.2 83.6
SA
Group 1 528.4 1.0 1.6 5.7 15.9 27.0 25.9 22.9 97.3Group 2 504.2 1.0 3.0 10.0 21.6 29.2 21.6 13.5 96.0Group 3 485.3 1.1 4.8 13.5 27.3 28.1 17.6 7.6 94.1Group 4 469.1 2.3 8.1 18.6 27.5 25.3 12.8 5.5 89.6Not in paid work 450.9 4.1 15.5 20.5 25.7 19.2 10.7 4.4 80.4Not stated (19%) 462.1 4.9 12.7 17.9 23.9 21.7 12.8 6.1 82.3
KeyGroup 1: Senior management and qualified professionalsGroup 2: Other business managers and associate professionalsGroup 3: Tradespeople, clerks, skilled office, sales and service staffGroup 4: Machine operators, hospitality staff, assistants, labourersNot in paid work: Not in paid work in the previous 12 monthsNot stated: No data was provided for parental occupation at the time of student enrolment. The higher the percentage of missing data, the less informative are the results for the other categories.
Refer to the introduction for explanatory notes.
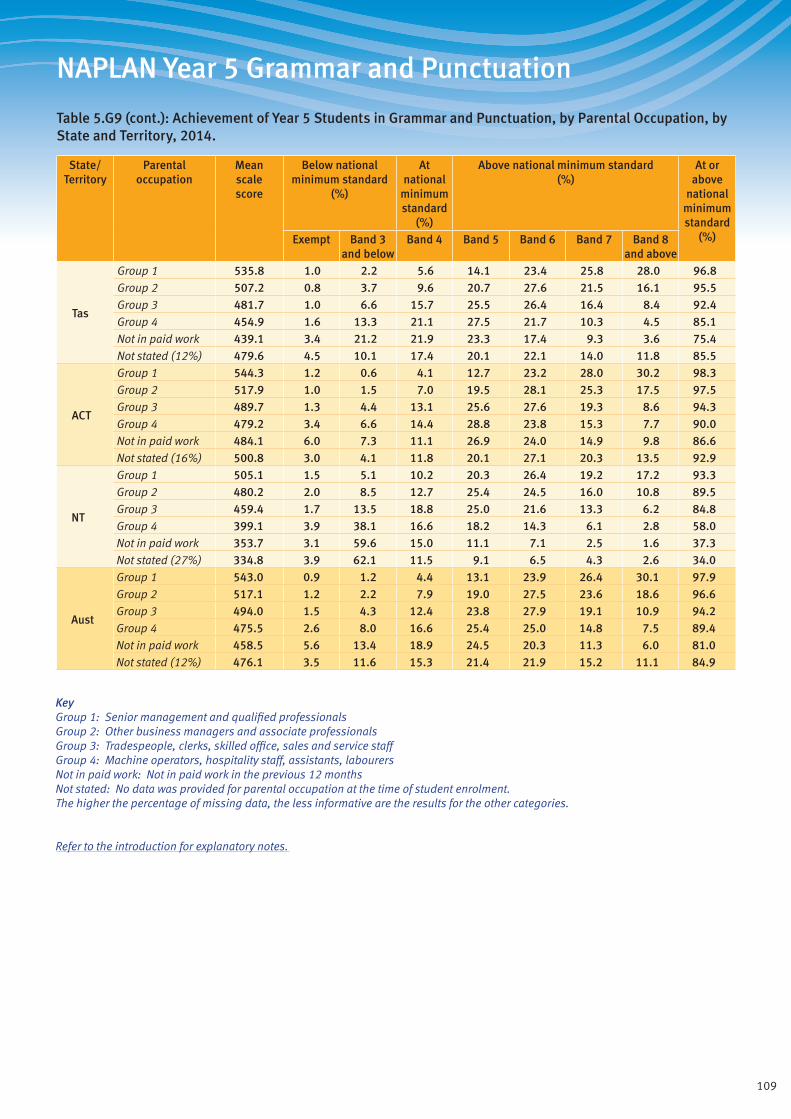
109
NAPLAN Year 5 Grammar and Punctuation
Table 5.G9 (cont.): Achievement of Year 5 Students in Grammar and Punctuation, by Parental Occupation, by State and Territory, 2014.
State/ Territory
Parental occupation
Mean scale score
Below national minimum standard
(%)
At national
minimum standard
(%)
Above national minimum standard (%)
At or above
national minimum standard
(%)Exempt Band 3 and below
Band 4 Band 5 Band 6 Band 7 Band 8 and above
Tas
Group 1 535.8 1.0 2.2 5.6 14.1 23.4 25.8 28.0 96.8Group 2 507.2 0.8 3.7 9.6 20.7 27.6 21.5 16.1 95.5Group 3 481.7 1.0 6.6 15.7 25.5 26.4 16.4 8.4 92.4Group 4 454.9 1.6 13.3 21.1 27.5 21.7 10.3 4.5 85.1Not in paid work 439.1 3.4 21.2 21.9 23.3 17.4 9.3 3.6 75.4Not stated (12%) 479.6 4.5 10.1 17.4 20.1 22.1 14.0 11.8 85.5
ACT
Group 1 544.3 1.2 0.6 4.1 12.7 23.2 28.0 30.2 98.3Group 2 517.9 1.0 1.5 7.0 19.5 28.1 25.3 17.5 97.5Group 3 489.7 1.3 4.4 13.1 25.6 27.6 19.3 8.6 94.3Group 4 479.2 3.4 6.6 14.4 28.8 23.8 15.3 7.7 90.0Not in paid work 484.1 6.0 7.3 11.1 26.9 24.0 14.9 9.8 86.6Not stated (16%) 500.8 3.0 4.1 11.8 20.1 27.1 20.3 13.5 92.9
NT
Group 1 505.1 1.5 5.1 10.2 20.3 26.4 19.2 17.2 93.3Group 2 480.2 2.0 8.5 12.7 25.4 24.5 16.0 10.8 89.5Group 3 459.4 1.7 13.5 18.8 25.0 21.6 13.3 6.2 84.8Group 4 399.1 3.9 38.1 16.6 18.2 14.3 6.1 2.8 58.0Not in paid work 353.7 3.1 59.6 15.0 11.1 7.1 2.5 1.6 37.3Not stated (27%) 334.8 3.9 62.1 11.5 9.1 6.5 4.3 2.6 34.0
Aust
Group 1 543.0 0.9 1.2 4.4 13.1 23.9 26.4 30.1 97.9Group 2 517.1 1.2 2.2 7.9 19.0 27.5 23.6 18.6 96.6Group 3 494.0 1.5 4.3 12.4 23.8 27.9 19.1 10.9 94.2Group 4 475.5 2.6 8.0 16.6 25.4 25.0 14.8 7.5 89.4Not in paid work 458.5 5.6 13.4 18.9 24.5 20.3 11.3 6.0 81.0Not stated (12%) 476.1 3.5 11.6 15.3 21.4 21.9 15.2 11.1 84.9
KeyGroup 1: Senior management and qualified professionalsGroup 2: Other business managers and associate professionalsGroup 3: Tradespeople, clerks, skilled office, sales and service staffGroup 4: Machine operators, hospitality staff, assistants, labourersNot in paid work: Not in paid work in the previous 12 monthsNot stated: No data was provided for parental occupation at the time of student enrolment. The higher the percentage of missing data, the less informative are the results for the other categories.
Refer to the introduction for explanatory notes.
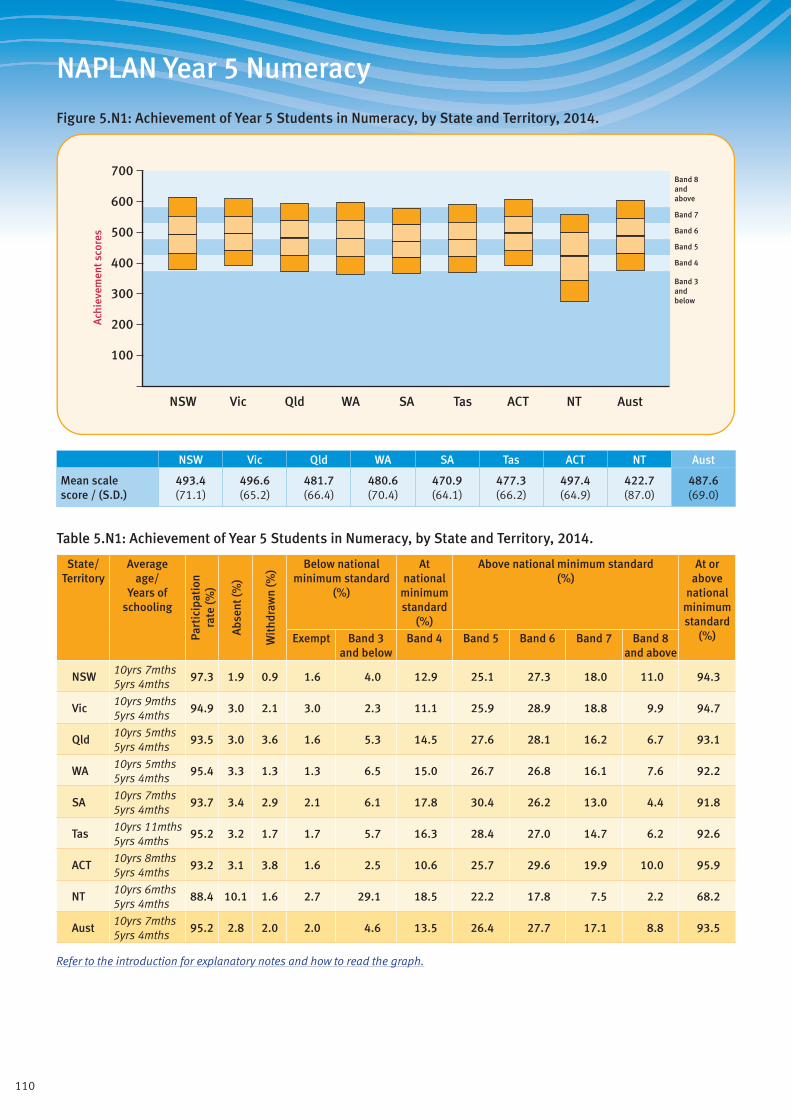
110
NAPLAN Year 5 Numeracy
Figure 5.N1: Achievement of Year 5 Students in Numeracy, by State and Territory, 2014.
Band 3andbelow
Band 4
Band 5
Band 6
Band 7
Band 8andabove
700
600
400
500
300
200
100
Ach
ieve
men
t sco
res
ACTQld SAWA TasVicNSW NT Aust
NSW Vic Qld WA SA Tas ACT NT Aust
Mean scale score / (S.D.)
493.4 (71.1)
496.6 (65.2)
481.7 (66.4)
480.6 (70.4)
470.9 (64.1)
477.3 (66.2)
497.4 (64.9)
422.7 (87.0)
487.6 (69.0)
Table 5.N1: Achievement of Year 5 Students in Numeracy, by State and Territory, 2014.
State/ Territory
Average age/
Years of schooling
Part
icip
atio
nra
te (%
)
Abs
ent (
%)
Wit
hdra
wn
(%) Below national
minimum standard (%)
At national
minimum standard
(%)
Above national minimum standard (%)
At or above
national minimum standard
(%)Exempt Band 3 and below
Band 4 Band 5 Band 6 Band 7 Band 8 and above
NSW10yrs 7mths 5yrs 4mths
97.3 1.9 0.9 1.6 4.0 12.9 25.1 27.3 18.0 11.0 94.3
Vic10yrs 9mths 5yrs 4mths
94.9 3.0 2.1 3.0 2.3 11.1 25.9 28.9 18.8 9.9 94.7
Qld10yrs 5mths 5yrs 4mths
93.5 3.0 3.6 1.6 5.3 14.5 27.6 28.1 16.2 6.7 93.1
WA10yrs 5mths 5yrs 4mths
95.4 3.3 1.3 1.3 6.5 15.0 26.7 26.8 16.1 7.6 92.2
SA10yrs 7mths 5yrs 4mths
93.7 3.4 2.9 2.1 6.1 17.8 30.4 26.2 13.0 4.4 91.8
Tas10yrs 11mths 5yrs 4mths
95.2 3.2 1.7 1.7 5.7 16.3 28.4 27.0 14.7 6.2 92.6
ACT10yrs 8mths 5yrs 4mths
93.2 3.1 3.8 1.6 2.5 10.6 25.7 29.6 19.9 10.0 95.9
NT10yrs 6mths 5yrs 4mths
88.4 10.1 1.6 2.7 29.1 18.5 22.2 17.8 7.5 2.2 68.2
Aust10yrs 7mths 5yrs 4mths
95.2 2.8 2.0 2.0 4.6 13.5 26.4 27.7 17.1 8.8 93.5
Refer to the introduction for explanatory notes and how to read the graph.
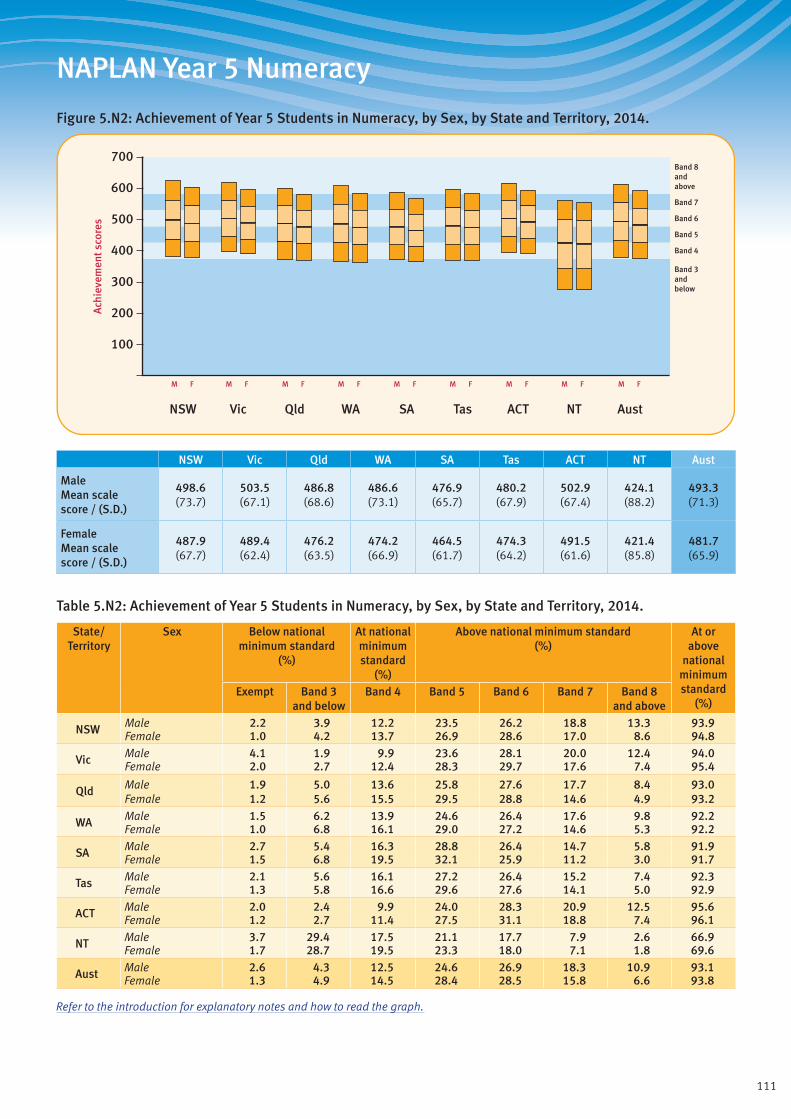
111
NAPLAN Year 5 Numeracy
Figure 5.N2: Achievement of Year 5 Students in Numeracy, by Sex, by State and Territory, 2014.
Band 3andbelow
Band 4
Band 5
Band 6
Band 7
Band 8andabove
ACTQld SAWA TasVicNSW NT Aust
M F M F M F M F M F M F M F M F M F
700
600
400
500
300
200
100
Ach
ieve
men
t sco
res
NSW Vic Qld WA SA Tas ACT NT Aust
Male Mean scale score / (S.D.)
498.6 (73.7)
503.5 (67.1)
486.8 (68.6)
486.6 (73.1)
476.9 (65.7)
480.2 (67.9)
502.9 (67.4)
424.1 (88.2)
493.3 (71.3)
Female Mean scale score / (S.D.)
487.9 (67.7)
489.4 (62.4)
476.2 (63.5)
474.2 (66.9)
464.5 (61.7)
474.3 (64.2)
491.5 (61.6)
421.4 (85.8)
481.7 (65.9)
Table 5.N2: Achievement of Year 5 Students in Numeracy, by Sex, by State and Territory, 2014.
State/ Territory
Sex Below national minimum standard
(%)
At national minimum standard
(%)
Above national minimum standard (%)
At or above
national minimum standard
(%)Exempt Band 3
and belowBand 4 Band 5 Band 6 Band 7 Band 8
and above
NSW Male 2.2 3.9 12.2 23.5 26.2 18.8 13.3 93.9Female 1.0 4.2 13.7 26.9 28.6 17.0 8.6 94.8
Vic Male 4.1 1.9 9.9 23.6 28.1 20.0 12.4 94.0Female 2.0 2.7 12.4 28.3 29.7 17.6 7.4 95.4
Qld Male 1.9 5.0 13.6 25.8 27.6 17.7 8.4 93.0Female 1.2 5.6 15.5 29.5 28.8 14.6 4.9 93.2
WA Male 1.5 6.2 13.9 24.6 26.4 17.6 9.8 92.2Female 1.0 6.8 16.1 29.0 27.2 14.6 5.3 92.2
SA Male 2.7 5.4 16.3 28.8 26.4 14.7 5.8 91.9Female 1.5 6.8 19.5 32.1 25.9 11.2 3.0 91.7
Tas Male 2.1 5.6 16.1 27.2 26.4 15.2 7.4 92.3Female 1.3 5.8 16.6 29.6 27.6 14.1 5.0 92.9
ACT Male 2.0 2.4 9.9 24.0 28.3 20.9 12.5 95.6Female 1.2 2.7 11.4 27.5 31.1 18.8 7.4 96.1
NT Male 3.7 29.4 17.5 21.1 17.7 7.9 2.6 66.9Female 1.7 28.7 19.5 23.3 18.0 7.1 1.8 69.6
Aust Male 2.6 4.3 12.5 24.6 26.9 18.3 10.9 93.1Female 1.3 4.9 14.5 28.4 28.5 15.8 6.6 93.8
Refer to the introduction for explanatory notes and how to read the graph.
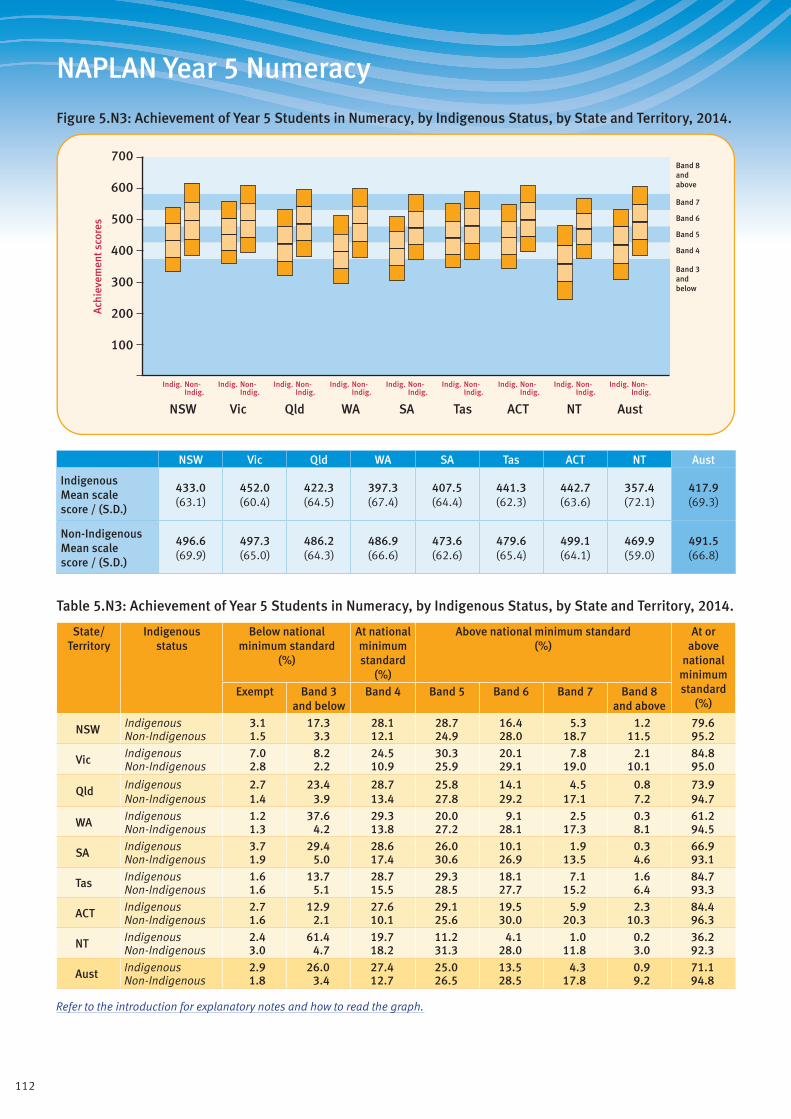
112
NAPLAN Year 5 Numeracy
Figure 5.N3: Achievement of Year 5 Students in Numeracy, by Indigenous Status, by State and Territory, 2014.
Band 3andbelow
Band 4
Band 5
Band 6
Band 7
Band 8andabove
ACTQld SAWA TasVicNSW NT Aust
700
600
400
500
300
200
100
Ach
ieve
men
t sco
res
Indig. Non-Indig.
Indig. Non-Indig.
Indig. Non-Indig.
Indig. Non-Indig.
Indig. Non-Indig.
Indig. Non-Indig.
Indig. Non-Indig.
Indig. Non-Indig.
Indig. Non-Indig.
NSW Vic Qld WA SA Tas ACT NT Aust
Indigenous Mean scale score / (S.D.)
433.0 (63.1)
452.0 (60.4)
422.3 (64.5)
397.3 (67.4)
407.5 (64.4)
441.3 (62.3)
442.7 (63.6)
357.4 (72.1)
417.9 (69.3)
Non-Indigenous Mean scale score / (S.D.)
496.6 (69.9)
497.3 (65.0)
486.2 (64.3)
486.9 (66.6)
473.6 (62.6)
479.6 (65.4)
499.1 (64.1)
469.9 (59.0)
491.5 (66.8)
Table 5.N3: Achievement of Year 5 Students in Numeracy, by Indigenous Status, by State and Territory, 2014.
State/ Territory
Indigenous status
Below national minimum standard
(%)
At national minimum standard
(%)
Above national minimum standard (%)
At or above
national minimum standard
(%)Exempt Band 3
and belowBand 4 Band 5 Band 6 Band 7 Band 8
and above
NSW Indigenous 3.1 17.3 28.1 28.7 16.4 5.3 1.2 79.6Non-Indigenous 1.5 3.3 12.1 24.9 28.0 18.7 11.5 95.2
Vic Indigenous 7.0 8.2 24.5 30.3 20.1 7.8 2.1 84.8Non-Indigenous 2.8 2.2 10.9 25.9 29.1 19.0 10.1 95.0
Qld Indigenous 2.7 23.4 28.7 25.8 14.1 4.5 0.8 73.9Non-Indigenous 1.4 3.9 13.4 27.8 29.2 17.1 7.2 94.7
WA Indigenous 1.2 37.6 29.3 20.0 9.1 2.5 0.3 61.2Non-Indigenous 1.3 4.2 13.8 27.2 28.1 17.3 8.1 94.5
SA Indigenous 3.7 29.4 28.6 26.0 10.1 1.9 0.3 66.9Non-Indigenous 1.9 5.0 17.4 30.6 26.9 13.5 4.6 93.1
Tas Indigenous 1.6 13.7 28.7 29.3 18.1 7.1 1.6 84.7Non-Indigenous 1.6 5.1 15.5 28.5 27.7 15.2 6.4 93.3
ACT Indigenous 2.7 12.9 27.6 29.1 19.5 5.9 2.3 84.4Non-Indigenous 1.6 2.1 10.1 25.6 30.0 20.3 10.3 96.3
NT Indigenous 2.4 61.4 19.7 11.2 4.1 1.0 0.2 36.2Non-Indigenous 3.0 4.7 18.2 31.3 28.0 11.8 3.0 92.3
Aust Indigenous 2.9 26.0 27.4 25.0 13.5 4.3 0.9 71.1Non-Indigenous 1.8 3.4 12.7 26.5 28.5 17.8 9.2 94.8
Refer to the introduction for explanatory notes and how to read the graph.
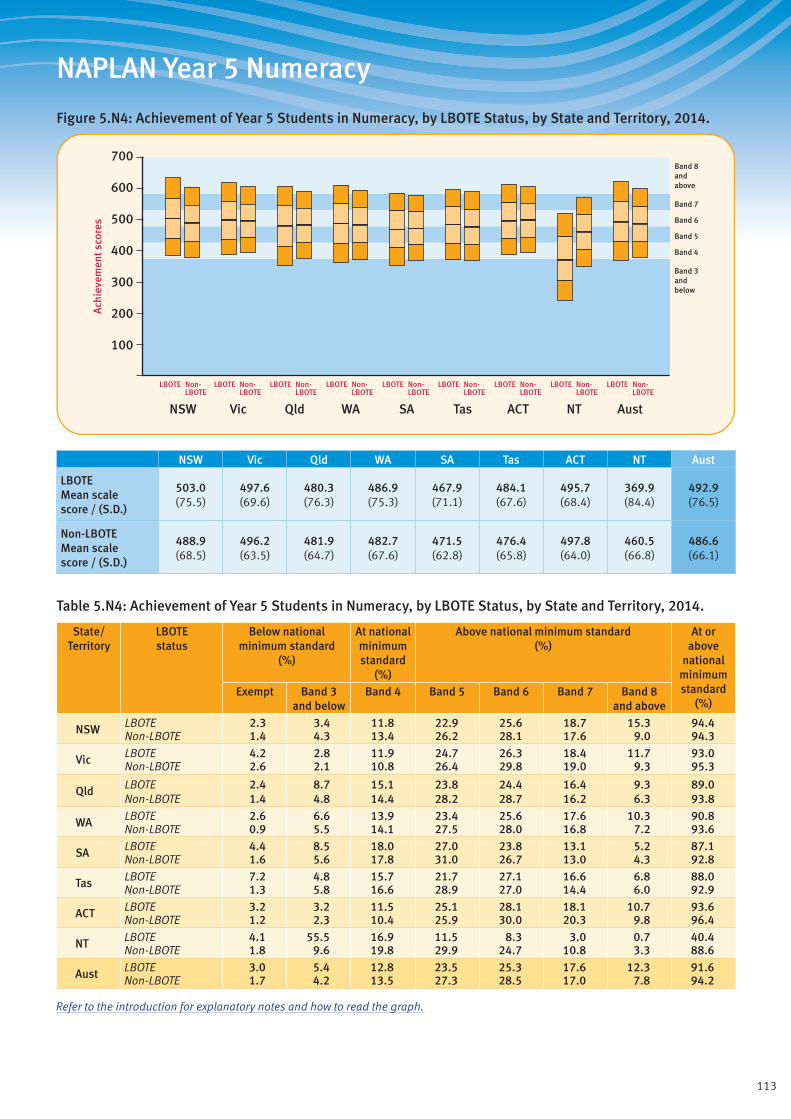
113
NAPLAN Year 5 Numeracy
Figure 5.N4: Achievement of Year 5 Students in Numeracy, by LBOTE Status, by State and Territory, 2014.
Band 3andbelow
Band 4
Band 5
Band 6
Band 7
Band 8andabove
ACTQld SAWA TasVicNSW NT Aust
700
600
400
500
300
200
100
Ach
ieve
men
t sco
res
LBOTE Non-LBOTE
LBOTE Non-LBOTE
LBOTE Non-LBOTE
LBOTE Non-LBOTE
LBOTE Non-LBOTE
LBOTE Non-LBOTE
LBOTE Non-LBOTE
LBOTE Non-LBOTE
LBOTE Non-LBOTE
NSW Vic Qld WA SA Tas ACT NT Aust
LBOTE Mean scale score / (S.D.)
503.0 (75.5)
497.6 (69.6)
480.3 (76.3)
486.9 (75.3)
467.9 (71.1)
484.1 (67.6)
495.7 (68.4)
369.9 (84.4)
492.9 (76.5)
Non-LBOTE Mean scale score / (S.D.)
488.9 (68.5)
496.2 (63.5)
481.9 (64.7)
482.7 (67.6)
471.5 (62.8)
476.4 (65.8)
497.8 (64.0)
460.5 (66.8)
486.6 (66.1)
Table 5.N4: Achievement of Year 5 Students in Numeracy, by LBOTE Status, by State and Territory, 2014.
State/ Territory
LBOTE status
Below national minimum standard
(%)
At national minimum standard
(%)
Above national minimum standard (%)
At or above
national minimum standard
(%)Exempt Band 3
and belowBand 4 Band 5 Band 6 Band 7 Band 8
and above
NSW LBOTE 2.3 3.4 11.8 22.9 25.6 18.7 15.3 94.4Non-LBOTE 1.4 4.3 13.4 26.2 28.1 17.6 9.0 94.3
Vic LBOTE 4.2 2.8 11.9 24.7 26.3 18.4 11.7 93.0Non-LBOTE 2.6 2.1 10.8 26.4 29.8 19.0 9.3 95.3
Qld LBOTE 2.4 8.7 15.1 23.8 24.4 16.4 9.3 89.0Non-LBOTE 1.4 4.8 14.4 28.2 28.7 16.2 6.3 93.8
WA LBOTE 2.6 6.6 13.9 23.4 25.6 17.6 10.3 90.8Non-LBOTE 0.9 5.5 14.1 27.5 28.0 16.8 7.2 93.6
SA LBOTE 4.4 8.5 18.0 27.0 23.8 13.1 5.2 87.1Non-LBOTE 1.6 5.6 17.8 31.0 26.7 13.0 4.3 92.8
Tas LBOTE 7.2 4.8 15.7 21.7 27.1 16.6 6.8 88.0Non-LBOTE 1.3 5.8 16.6 28.9 27.0 14.4 6.0 92.9
ACT LBOTE 3.2 3.2 11.5 25.1 28.1 18.1 10.7 93.6Non-LBOTE 1.2 2.3 10.4 25.9 30.0 20.3 9.8 96.4
NT LBOTE 4.1 55.5 16.9 11.5 8.3 3.0 0.7 40.4Non-LBOTE 1.8 9.6 19.8 29.9 24.7 10.8 3.3 88.6
Aust LBOTE 3.0 5.4 12.8 23.5 25.3 17.6 12.3 91.6Non-LBOTE 1.7 4.2 13.5 27.3 28.5 17.0 7.8 94.2
Refer to the introduction for explanatory notes and how to read the graph.
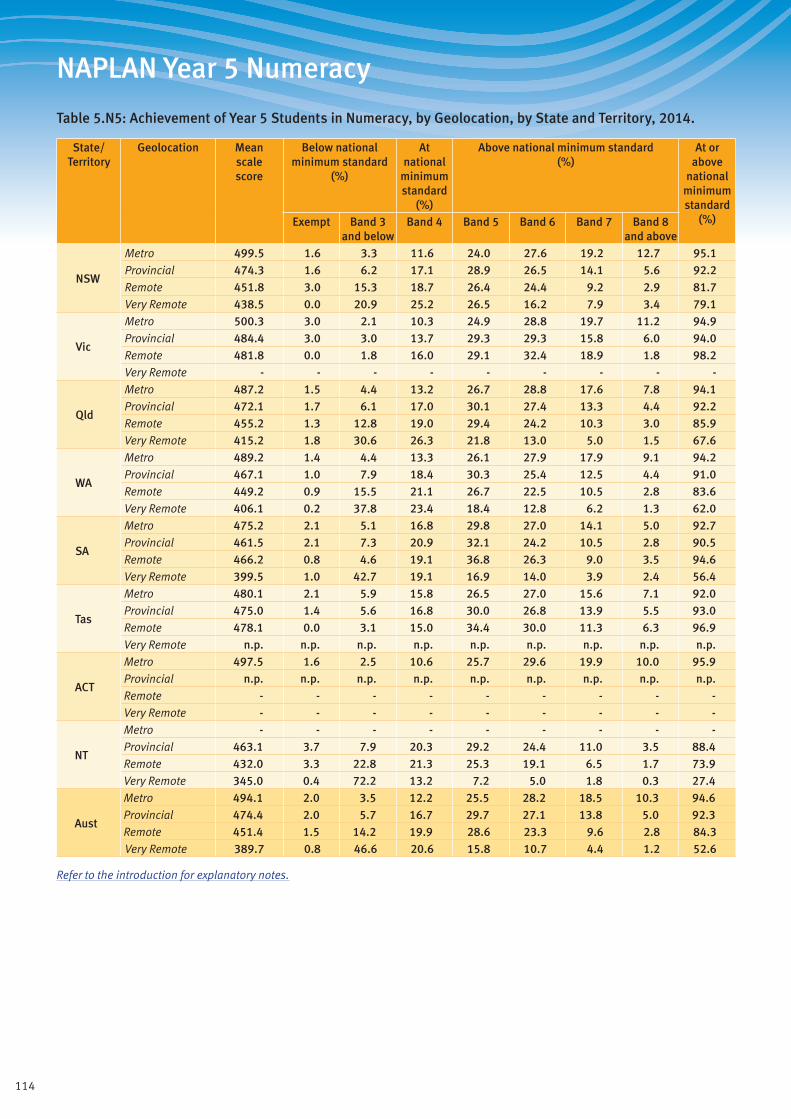
114
NAPLAN Year 5 Numeracy
Table 5.N5: Achievement of Year 5 Students in Numeracy, by Geolocation, by State and Territory, 2014.
State/ Territory
Geolocation Mean scale score
Below national minimum standard
(%)
At national
minimum standard
(%)
Above national minimum standard (%)
At or above
national minimum standard
(%)Exempt Band 3 and below
Band 4 Band 5 Band 6 Band 7 Band 8 and above
NSW
Metro 499.5 1.6 3.3 11.6 24.0 27.6 19.2 12.7 95.1Provincial 474.3 1.6 6.2 17.1 28.9 26.5 14.1 5.6 92.2Remote 451.8 3.0 15.3 18.7 26.4 24.4 9.2 2.9 81.7Very Remote 438.5 0.0 20.9 25.2 26.5 16.2 7.9 3.4 79.1
Vic
Metro 500.3 3.0 2.1 10.3 24.9 28.8 19.7 11.2 94.9Provincial 484.4 3.0 3.0 13.7 29.3 29.3 15.8 6.0 94.0Remote 481.8 0.0 1.8 16.0 29.1 32.4 18.9 1.8 98.2Very Remote - - - - - - - - -
Qld
Metro 487.2 1.5 4.4 13.2 26.7 28.8 17.6 7.8 94.1Provincial 472.1 1.7 6.1 17.0 30.1 27.4 13.3 4.4 92.2Remote 455.2 1.3 12.8 19.0 29.4 24.2 10.3 3.0 85.9Very Remote 415.2 1.8 30.6 26.3 21.8 13.0 5.0 1.5 67.6
WA
Metro 489.2 1.4 4.4 13.3 26.1 27.9 17.9 9.1 94.2Provincial 467.1 1.0 7.9 18.4 30.3 25.4 12.5 4.4 91.0Remote 449.2 0.9 15.5 21.1 26.7 22.5 10.5 2.8 83.6Very Remote 406.1 0.2 37.8 23.4 18.4 12.8 6.2 1.3 62.0
SA
Metro 475.2 2.1 5.1 16.8 29.8 27.0 14.1 5.0 92.7Provincial 461.5 2.1 7.3 20.9 32.1 24.2 10.5 2.8 90.5Remote 466.2 0.8 4.6 19.1 36.8 26.3 9.0 3.5 94.6Very Remote 399.5 1.0 42.7 19.1 16.9 14.0 3.9 2.4 56.4
Tas
Metro 480.1 2.1 5.9 15.8 26.5 27.0 15.6 7.1 92.0Provincial 475.0 1.4 5.6 16.8 30.0 26.8 13.9 5.5 93.0Remote 478.1 0.0 3.1 15.0 34.4 30.0 11.3 6.3 96.9Very Remote n.p. n.p. n.p. n.p. n.p. n.p. n.p. n.p. n.p.
ACT
Metro 497.5 1.6 2.5 10.6 25.7 29.6 19.9 10.0 95.9Provincial n.p. n.p. n.p. n.p. n.p. n.p. n.p. n.p. n.p.Remote - - - - - - - - -Very Remote - - - - - - - - -
NT
Metro - - - - - - - - -Provincial 463.1 3.7 7.9 20.3 29.2 24.4 11.0 3.5 88.4Remote 432.0 3.3 22.8 21.3 25.3 19.1 6.5 1.7 73.9Very Remote 345.0 0.4 72.2 13.2 7.2 5.0 1.8 0.3 27.4
Aust
Metro 494.1 2.0 3.5 12.2 25.5 28.2 18.5 10.3 94.6Provincial 474.4 2.0 5.7 16.7 29.7 27.1 13.8 5.0 92.3Remote 451.4 1.5 14.2 19.9 28.6 23.3 9.6 2.8 84.3Very Remote 389.7 0.8 46.6 20.6 15.8 10.7 4.4 1.2 52.6
Refer to the introduction for explanatory notes.
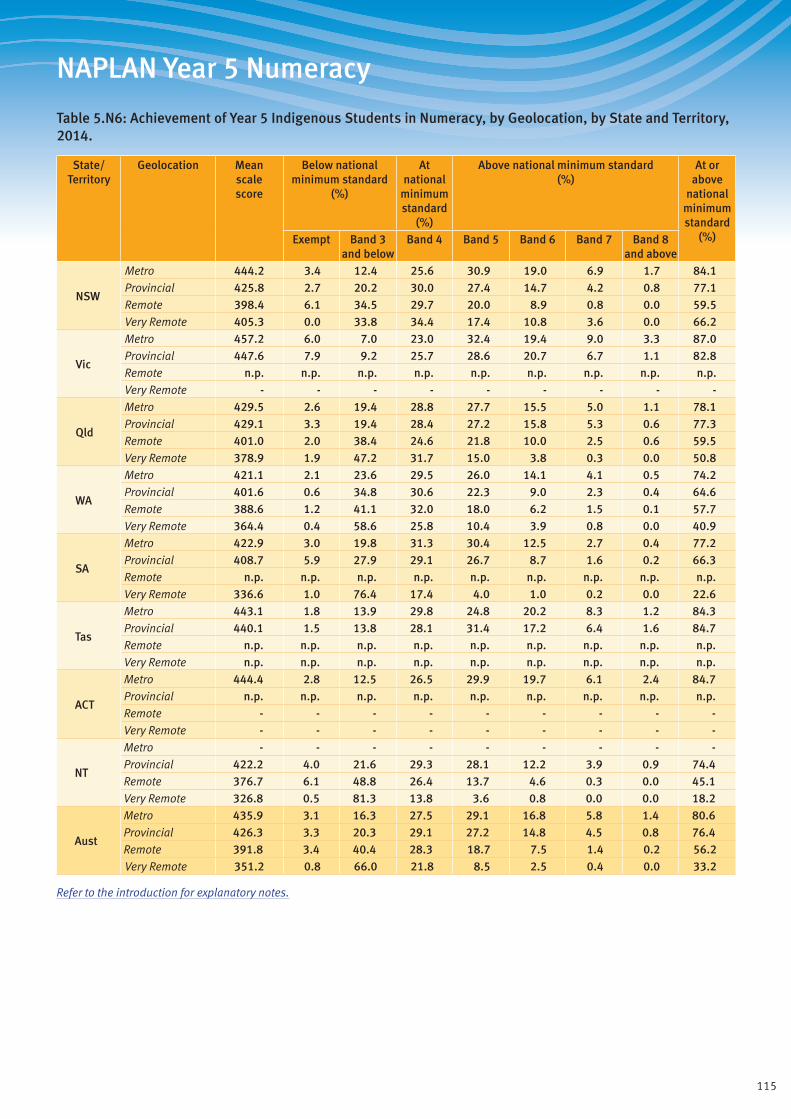
115
NAPLAN Year 5 Numeracy
Table 5.N6: Achievement of Year 5 Indigenous Students in Numeracy, by Geolocation, by State and Territory, 2014.
State/ Territory
Geolocation Mean scale score
Below national minimum standard
(%)
At national
minimum standard
(%)
Above national minimum standard (%)
At or above
national minimum standard
(%)Exempt Band 3 and below
Band 4 Band 5 Band 6 Band 7 Band 8 and above
NSW
Metro 444.2 3.4 12.4 25.6 30.9 19.0 6.9 1.7 84.1Provincial 425.8 2.7 20.2 30.0 27.4 14.7 4.2 0.8 77.1Remote 398.4 6.1 34.5 29.7 20.0 8.9 0.8 0.0 59.5Very Remote 405.3 0.0 33.8 34.4 17.4 10.8 3.6 0.0 66.2
Vic
Metro 457.2 6.0 7.0 23.0 32.4 19.4 9.0 3.3 87.0Provincial 447.6 7.9 9.2 25.7 28.6 20.7 6.7 1.1 82.8Remote n.p. n.p. n.p. n.p. n.p. n.p. n.p. n.p. n.p.Very Remote - - - - - - - - -
Qld
Metro 429.5 2.6 19.4 28.8 27.7 15.5 5.0 1.1 78.1Provincial 429.1 3.3 19.4 28.4 27.2 15.8 5.3 0.6 77.3Remote 401.0 2.0 38.4 24.6 21.8 10.0 2.5 0.6 59.5Very Remote 378.9 1.9 47.2 31.7 15.0 3.8 0.3 0.0 50.8
WA
Metro 421.1 2.1 23.6 29.5 26.0 14.1 4.1 0.5 74.2Provincial 401.6 0.6 34.8 30.6 22.3 9.0 2.3 0.4 64.6Remote 388.6 1.2 41.1 32.0 18.0 6.2 1.5 0.1 57.7Very Remote 364.4 0.4 58.6 25.8 10.4 3.9 0.8 0.0 40.9
SA
Metro 422.9 3.0 19.8 31.3 30.4 12.5 2.7 0.4 77.2Provincial 408.7 5.9 27.9 29.1 26.7 8.7 1.6 0.2 66.3Remote n.p. n.p. n.p. n.p. n.p. n.p. n.p. n.p. n.p.Very Remote 336.6 1.0 76.4 17.4 4.0 1.0 0.2 0.0 22.6
Tas
Metro 443.1 1.8 13.9 29.8 24.8 20.2 8.3 1.2 84.3Provincial 440.1 1.5 13.8 28.1 31.4 17.2 6.4 1.6 84.7Remote n.p. n.p. n.p. n.p. n.p. n.p. n.p. n.p. n.p.Very Remote n.p. n.p. n.p. n.p. n.p. n.p. n.p. n.p. n.p.
ACT
Metro 444.4 2.8 12.5 26.5 29.9 19.7 6.1 2.4 84.7Provincial n.p. n.p. n.p. n.p. n.p. n.p. n.p. n.p. n.p.Remote - - - - - - - - -Very Remote - - - - - - - - -
NT
Metro - - - - - - - - -Provincial 422.2 4.0 21.6 29.3 28.1 12.2 3.9 0.9 74.4Remote 376.7 6.1 48.8 26.4 13.7 4.6 0.3 0.0 45.1Very Remote 326.8 0.5 81.3 13.8 3.6 0.8 0.0 0.0 18.2
Aust
Metro 435.9 3.1 16.3 27.5 29.1 16.8 5.8 1.4 80.6Provincial 426.3 3.3 20.3 29.1 27.2 14.8 4.5 0.8 76.4Remote 391.8 3.4 40.4 28.3 18.7 7.5 1.4 0.2 56.2Very Remote 351.2 0.8 66.0 21.8 8.5 2.5 0.4 0.0 33.2
Refer to the introduction for explanatory notes.

116
NAPLAN Year 5 Numeracy
Table 5.N7: Achievement of Year 5 Non-Indigenous Students in Numeracy, by Geolocation, by State and Territory, 2014.
State/ Territory
Geolocation Mean scale score
Below national minimum standard
(%)
At national
minimum standard
(%)
Above national minimum standard (%)
At or above
national minimum standard
(%)Exempt Band 3 and below
Band 4 Band 5 Band 6 Band 7 Band 8 and above
NSW
Metro 501.1 1.6 3.0 11.1 23.8 27.9 19.6 13.0 95.5Provincial 480.4 1.4 4.4 15.5 29.1 28.0 15.3 6.2 94.1Remote 483.5 1.2 3.7 11.6 29.7 34.1 14.8 4.8 95.0Very Remote n.p. n.p. n.p. n.p. n.p. n.p. n.p. n.p. n.p.
Vic
Metro 500.8 2.8 2.0 10.2 24.9 28.9 19.9 11.3 95.2Provincial 485.6 2.7 2.7 13.3 29.4 29.6 16.2 6.2 94.6Remote 482.8 0.0 1.9 15.1 29.8 31.7 19.6 1.9 98.1Very Remote - - - - - - - - -
Qld
Metro 490.1 1.4 3.6 12.4 26.7 29.5 18.3 8.1 95.0Provincial 476.8 1.6 4.6 15.7 30.5 28.7 14.1 4.8 93.8Remote 471.8 1.1 4.8 17.2 32.0 28.5 12.6 3.8 94.0Very Remote 467.0 1.6 6.5 18.7 31.4 26.2 11.8 3.7 91.9
WA
Metro 491.9 1.4 3.6 12.6 26.1 28.6 18.5 9.3 95.0Provincial 473.0 1.0 5.6 17.3 31.0 26.8 13.6 4.7 93.4Remote 469.6 0.8 6.8 17.5 29.6 28.0 13.6 3.7 92.5Very Remote 462.1 0.0 9.8 20.2 28.8 24.9 13.3 3.0 90.2
SA
Metro 476.7 1.9 4.7 16.4 29.9 27.5 14.4 5.2 93.4Provincial 464.6 1.9 6.1 20.4 32.5 25.2 11.0 3.0 92.0Remote 468.6 0.7 3.9 18.4 37.1 26.8 9.4 3.7 95.5Very Remote 461.6 1.0 9.7 20.6 29.1 27.2 7.6 4.9 89.3
Tas
Metro 482.4 2.0 5.3 15.0 26.7 27.4 16.1 7.4 92.7Provincial 477.2 1.3 4.9 16.0 30.1 27.7 14.4 5.5 93.8Remote 480.7 0.0 2.6 13.2 32.8 34.3 11.7 5.3 97.4Very Remote n.p. n.p. n.p. n.p. n.p. n.p. n.p. n.p. n.p.
ACT
Metro 499.1 1.6 2.1 10.1 25.6 30.0 20.3 10.3 96.3Provincial n.p. n.p. n.p. n.p. n.p. n.p. n.p. n.p. n.p.Remote - - - - - - - - -Very Remote - - - - - - - - -
NT
Metro - - - - - - - - -Provincial 468.9 3.8 5.0 19.2 30.4 26.7 11.8 3.0 91.2Remote 469.2 1.4 4.4 17.7 33.4 29.4 10.9 2.9 94.2Very Remote 484.6 0.0 1.4 8.2 35.0 38.3 14.8 2.5 98.6
Aust
Metro 495.9 1.9 3.0 11.7 25.4 28.6 18.9 10.5 95.1Provincial 478.7 1.8 4.3 15.6 30.0 28.2 14.7 5.4 93.9Remote 471.6 0.9 5.1 17.0 31.9 28.8 12.5 3.7 93.9Very Remote 466.8 0.7 8.0 18.1 30.0 27.1 12.5 3.7 91.4
Refer to the introduction for explanatory notes.
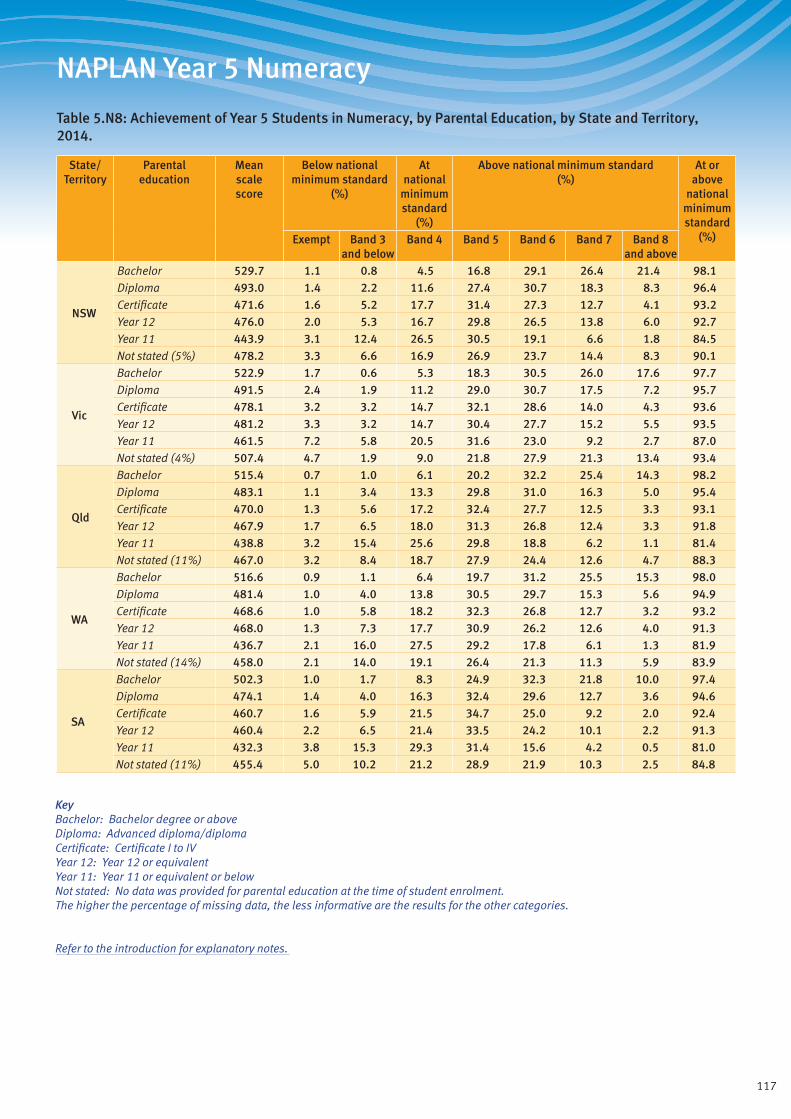
117
NAPLAN Year 5 Numeracy
Table 5.N8: Achievement of Year 5 Students in Numeracy, by Parental Education, by State and Territory, 2014.
State/ Territory
Parental education
Mean scale score
Below national minimum standard
(%)
At national
minimum standard
(%)
Above national minimum standard (%)
At or above
national minimum standard
(%)Exempt Band 3 and below
Band 4 Band 5 Band 6 Band 7 Band 8 and above
NSW
Bachelor 529.7 1.1 0.8 4.5 16.8 29.1 26.4 21.4 98.1Diploma 493.0 1.4 2.2 11.6 27.4 30.7 18.3 8.3 96.4Certificate 471.6 1.6 5.2 17.7 31.4 27.3 12.7 4.1 93.2Year 12 476.0 2.0 5.3 16.7 29.8 26.5 13.8 6.0 92.7Year 11 443.9 3.1 12.4 26.5 30.5 19.1 6.6 1.8 84.5Not stated (5%) 478.2 3.3 6.6 16.9 26.9 23.7 14.4 8.3 90.1
Vic
Bachelor 522.9 1.7 0.6 5.3 18.3 30.5 26.0 17.6 97.7Diploma 491.5 2.4 1.9 11.2 29.0 30.7 17.5 7.2 95.7Certificate 478.1 3.2 3.2 14.7 32.1 28.6 14.0 4.3 93.6Year 12 481.2 3.3 3.2 14.7 30.4 27.7 15.2 5.5 93.5Year 11 461.5 7.2 5.8 20.5 31.6 23.0 9.2 2.7 87.0Not stated (4%) 507.4 4.7 1.9 9.0 21.8 27.9 21.3 13.4 93.4
Qld
Bachelor 515.4 0.7 1.0 6.1 20.2 32.2 25.4 14.3 98.2Diploma 483.1 1.1 3.4 13.3 29.8 31.0 16.3 5.0 95.4Certificate 470.0 1.3 5.6 17.2 32.4 27.7 12.5 3.3 93.1Year 12 467.9 1.7 6.5 18.0 31.3 26.8 12.4 3.3 91.8Year 11 438.8 3.2 15.4 25.6 29.8 18.8 6.2 1.1 81.4Not stated (11%) 467.0 3.2 8.4 18.7 27.9 24.4 12.6 4.7 88.3
WA
Bachelor 516.6 0.9 1.1 6.4 19.7 31.2 25.5 15.3 98.0Diploma 481.4 1.0 4.0 13.8 30.5 29.7 15.3 5.6 94.9Certificate 468.6 1.0 5.8 18.2 32.3 26.8 12.7 3.2 93.2Year 12 468.0 1.3 7.3 17.7 30.9 26.2 12.6 4.0 91.3Year 11 436.7 2.1 16.0 27.5 29.2 17.8 6.1 1.3 81.9Not stated (14%) 458.0 2.1 14.0 19.1 26.4 21.3 11.3 5.9 83.9
SA
Bachelor 502.3 1.0 1.7 8.3 24.9 32.3 21.8 10.0 97.4Diploma 474.1 1.4 4.0 16.3 32.4 29.6 12.7 3.6 94.6Certificate 460.7 1.6 5.9 21.5 34.7 25.0 9.2 2.0 92.4Year 12 460.4 2.2 6.5 21.4 33.5 24.2 10.1 2.2 91.3Year 11 432.3 3.8 15.3 29.3 31.4 15.6 4.2 0.5 81.0Not stated (11%) 455.4 5.0 10.2 21.2 28.9 21.9 10.3 2.5 84.8
KeyBachelor: Bachelor degree or aboveDiploma: Advanced diploma/diplomaCertificate: Certificate I to IVYear 12: Year 12 or equivalentYear 11: Year 11 or equivalent or belowNot stated: No data was provided for parental education at the time of student enrolment. The higher the percentage of missing data, the less informative are the results for the other categories.
Refer to the introduction for explanatory notes.

118
NAPLAN Year 5 Numeracy
Table 5.N8 (cont.): Achievement of Year 5 Students in Numeracy, by Parental Education, by State and Territory, 2014.
State/ Territory
Parental education
Mean scale score
Below national minimum standard
(%)
At national
minimum standard
(%)
Above national minimum standard (%)
At or above
national minimum standard
(%)Exempt Band 3 and below
Band 4 Band 5 Band 6 Band 7 Band 8 and above
Tas
Bachelor 520.3 1.0 0.8 5.3 18.2 31.3 27.3 16.0 98.2Diploma 484.5 1.3 2.6 13.0 28.1 34.8 15.7 4.5 96.1Certificate 468.7 1.3 5.1 18.1 33.3 27.9 11.5 2.8 93.6Year 12 459.7 2.5 8.8 21.2 30.5 23.3 10.1 3.6 88.7Year 11 438.1 1.9 13.3 29.1 32.2 17.3 5.3 0.9 84.7Not stated (9%) 473.8 4.3 7.5 14.9 29.7 24.7 12.6 6.3 88.2
ACT
Bachelor 517.3 1.4 1.0 5.8 19.5 31.8 25.5 15.1 97.7Diploma 480.9 2.1 3.4 13.7 32.1 27.9 15.3 5.4 94.5Certificate 467.8 1.3 4.0 18.2 36.3 27.3 10.0 2.8 94.6Year 12 479.0 2.5 4.0 13.7 32.6 28.0 14.2 5.1 93.6Year 11 453.5 1.6 9.1 25.9 30.9 18.0 11.4 3.1 89.4Not stated (9%) 492.8 2.4 3.3 11.2 25.6 30.2 19.7 7.5 94.3
NT
Bachelor 491.5 1.3 2.2 10.4 27.2 34.6 18.9 5.3 96.5Diploma 464.2 1.0 4.3 20.7 35.0 26.9 9.8 2.3 94.7Certificate 441.6 2.4 14.4 24.1 31.7 19.6 6.0 1.7 83.1Year 12 447.1 4.4 11.2 22.7 31.9 22.6 5.4 1.8 84.4Year 11 373.8 2.5 52.5 22.1 14.0 7.1 1.7 0.0 45.0Not stated (29%) 373.5 4.0 55.1 15.9 10.7 8.1 4.3 1.9 40.9
Aust
Bachelor 521.5 1.2 0.9 5.5 18.8 30.6 25.7 17.4 98.0Diploma 487.7 1.6 2.7 12.5 29.1 30.6 16.9 6.7 95.7Certificate 471.3 1.8 5.0 17.3 32.2 27.4 12.6 3.7 93.2Year 12 472.7 2.2 5.5 17.1 30.8 26.6 13.3 4.6 92.3Year 11 444.2 4.0 12.6 25.1 30.4 19.3 6.9 1.7 83.4Not stated (8%) 467.5 3.4 10.5 17.2 26.0 23.2 13.3 6.4 86.1
KeyBachelor: Bachelor degree or aboveDiploma: Advanced diploma/diplomaCertificate: Certificate I to IVYear 12: Year 12 or equivalentYear 11: Year 11 or equivalent or belowNot stated: No data was provided for parental education at the time of student enrolment. The higher the percentage of missing data, the less informative are the results for the other categories.
Refer to the introduction for explanatory notes.
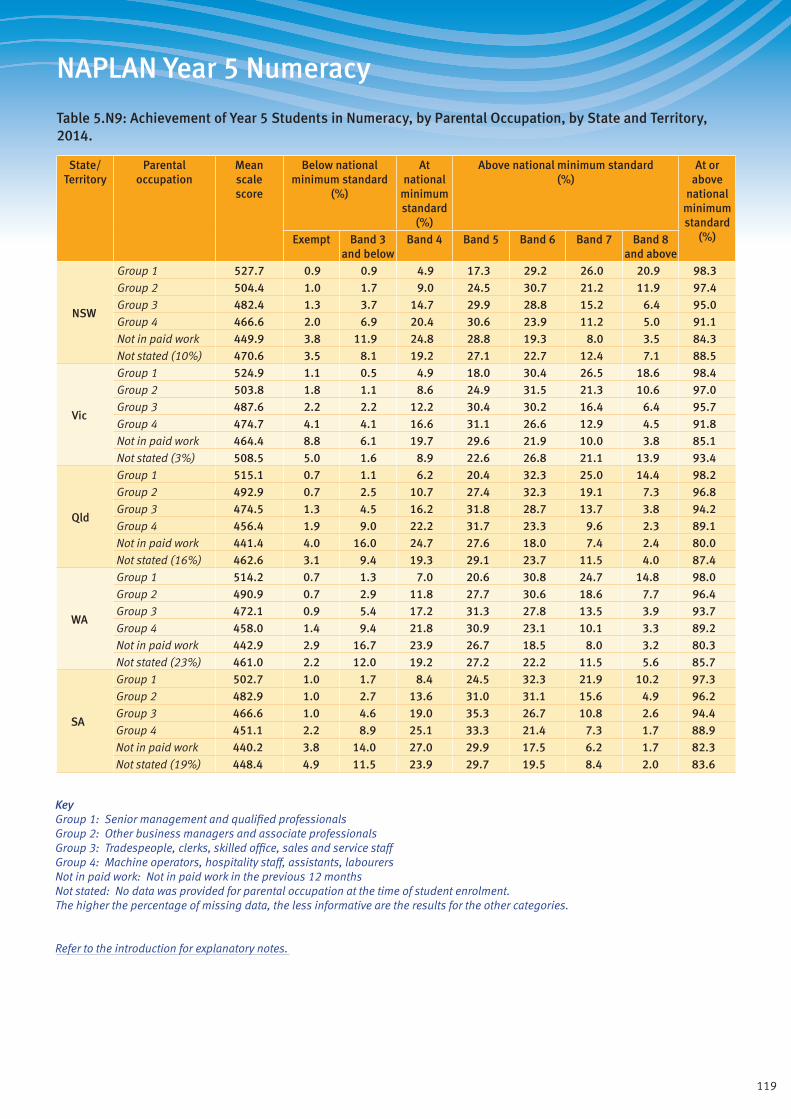
119
NAPLAN Year 5 Numeracy
Table 5.N9: Achievement of Year 5 Students in Numeracy, by Parental Occupation, by State and Territory, 2014.
State/ Territory
Parental occupation
Mean scale score
Below national minimum standard
(%)
At national
minimum standard
(%)
Above national minimum standard (%)
At or above
national minimum standard
(%)Exempt Band 3 and below
Band 4 Band 5 Band 6 Band 7 Band 8 and above
NSW
Group 1 527.7 0.9 0.9 4.9 17.3 29.2 26.0 20.9 98.3Group 2 504.4 1.0 1.7 9.0 24.5 30.7 21.2 11.9 97.4Group 3 482.4 1.3 3.7 14.7 29.9 28.8 15.2 6.4 95.0Group 4 466.6 2.0 6.9 20.4 30.6 23.9 11.2 5.0 91.1Not in paid work 449.9 3.8 11.9 24.8 28.8 19.3 8.0 3.5 84.3Not stated (10%) 470.6 3.5 8.1 19.2 27.1 22.7 12.4 7.1 88.5
Vic
Group 1 524.9 1.1 0.5 4.9 18.0 30.4 26.5 18.6 98.4Group 2 503.8 1.8 1.1 8.6 24.9 31.5 21.3 10.6 97.0Group 3 487.6 2.2 2.2 12.2 30.4 30.2 16.4 6.4 95.7Group 4 474.7 4.1 4.1 16.6 31.1 26.6 12.9 4.5 91.8Not in paid work 464.4 8.8 6.1 19.7 29.6 21.9 10.0 3.8 85.1Not stated (3%) 508.5 5.0 1.6 8.9 22.6 26.8 21.1 13.9 93.4
Qld
Group 1 515.1 0.7 1.1 6.2 20.4 32.3 25.0 14.4 98.2Group 2 492.9 0.7 2.5 10.7 27.4 32.3 19.1 7.3 96.8Group 3 474.5 1.3 4.5 16.2 31.8 28.7 13.7 3.8 94.2Group 4 456.4 1.9 9.0 22.2 31.7 23.3 9.6 2.3 89.1Not in paid work 441.4 4.0 16.0 24.7 27.6 18.0 7.4 2.4 80.0Not stated (16%) 462.6 3.1 9.4 19.3 29.1 23.7 11.5 4.0 87.4
WA
Group 1 514.2 0.7 1.3 7.0 20.6 30.8 24.7 14.8 98.0Group 2 490.9 0.7 2.9 11.8 27.7 30.6 18.6 7.7 96.4Group 3 472.1 0.9 5.4 17.2 31.3 27.8 13.5 3.9 93.7Group 4 458.0 1.4 9.4 21.8 30.9 23.1 10.1 3.3 89.2Not in paid work 442.9 2.9 16.7 23.9 26.7 18.5 8.0 3.2 80.3Not stated (23%) 461.0 2.2 12.0 19.2 27.2 22.2 11.5 5.6 85.7
SA
Group 1 502.7 1.0 1.7 8.4 24.5 32.3 21.9 10.2 97.3Group 2 482.9 1.0 2.7 13.6 31.0 31.1 15.6 4.9 96.2Group 3 466.6 1.0 4.6 19.0 35.3 26.7 10.8 2.6 94.4Group 4 451.1 2.2 8.9 25.1 33.3 21.4 7.3 1.7 88.9Not in paid work 440.2 3.8 14.0 27.0 29.9 17.5 6.2 1.7 82.3Not stated (19%) 448.4 4.9 11.5 23.9 29.7 19.5 8.4 2.0 83.6
KeyGroup 1: Senior management and qualified professionalsGroup 2: Other business managers and associate professionalsGroup 3: Tradespeople, clerks, skilled office, sales and service staffGroup 4: Machine operators, hospitality staff, assistants, labourersNot in paid work: Not in paid work in the previous 12 monthsNot stated: No data was provided for parental occupation at the time of student enrolment. The higher the percentage of missing data, the less informative are the results for the other categories.
Refer to the introduction for explanatory notes.

120
NAPLAN Year 5 Numeracy
Table 5.N9 (cont.): Achievement of Year 5 Students in Numeracy, by Parental Occupation, by State and Territory, 2014.
State/ Territory
Parental occupation
Mean scale score
Below national minimum standard
(%)
At national
minimum standard
(%)
Above national minimum standard (%)
At or above
national minimum standard
(%)Exempt Band 3 and below
Band 4 Band 5 Band 6 Band 7 Band 8 and above
Tas
Group 1 516.2 1.0 1.3 6.2 18.9 31.1 27.0 14.5 97.7Group 2 489.2 0.8 2.6 12.7 27.1 32.2 17.9 6.7 96.6Group 3 473.8 1.0 4.2 16.8 33.0 28.2 12.9 4.0 94.8Group 4 454.6 1.6 8.3 22.7 34.8 23.4 6.9 2.4 90.1Not in paid work 433.6 3.4 16.1 29.1 29.2 16.2 5.3 0.7 80.5Not stated (12%) 467.5 4.1 7.8 18.6 29.6 23.8 10.7 5.5 88.1
ACT
Group 1 518.6 1.1 1.0 5.9 18.6 31.8 25.6 16.0 97.9Group 2 497.5 1.0 1.7 8.7 28.1 32.4 20.2 7.9 97.3Group 3 470.8 1.3 4.5 17.6 34.3 26.8 12.1 3.4 94.2Group 4 471.5 2.9 3.8 19.1 31.8 26.3 11.3 4.7 93.3Not in paid work 465.9 6.0 6.5 18.4 33.3 18.7 10.7 6.4 87.5Not stated (16%) 483.2 2.9 4.4 14.6 28.4 26.0 16.7 7.0 92.8
NT
Group 1 486.2 1.4 3.4 13.1 28.2 31.4 15.9 6.7 95.2Group 2 467.1 2.0 7.3 17.3 30.2 27.5 11.8 3.8 90.7Group 3 450.0 1.7 10.5 21.9 34.5 22.4 7.7 1.2 87.8Group 4 404.5 3.9 36.0 21.7 20.1 14.9 2.8 0.6 60.2Not in paid work 371.0 2.8 55.1 22.5 12.2 5.0 2.4 0.1 42.1Not stated (27%) 365.9 3.9 55.9 18.0 11.7 7.0 3.2 0.3 40.2
Aust
Group 1 520.6 0.9 1.0 5.8 19.1 30.6 25.4 17.3 98.1Group 2 498.6 1.1 1.9 9.9 26.1 31.3 20.1 9.6 96.9Group 3 479.3 1.5 3.8 15.0 31.1 28.8 14.6 5.2 94.7Group 4 464.1 2.6 7.2 20.2 31.2 24.2 10.8 3.8 90.2Not in paid work 450.9 5.5 11.7 23.0 28.6 19.6 8.4 3.2 82.8Not stated (12%) 463.9 3.4 10.4 18.9 27.3 22.5 11.9 5.6 86.2
KeyGroup 1: Senior management and qualified professionalsGroup 2: Other business managers and associate professionalsGroup 3: Tradespeople, clerks, skilled office, sales and service staffGroup 4: Machine operators, hospitality staff, assistants, labourersNot in paid work: Not in paid work in the previous 12 monthsNot stated: No data was provided for parental occupation at the time of student enrolment. The higher the percentage of missing data, the less informative are the results for the other categories.
Refer to the introduction for explanatory notes.
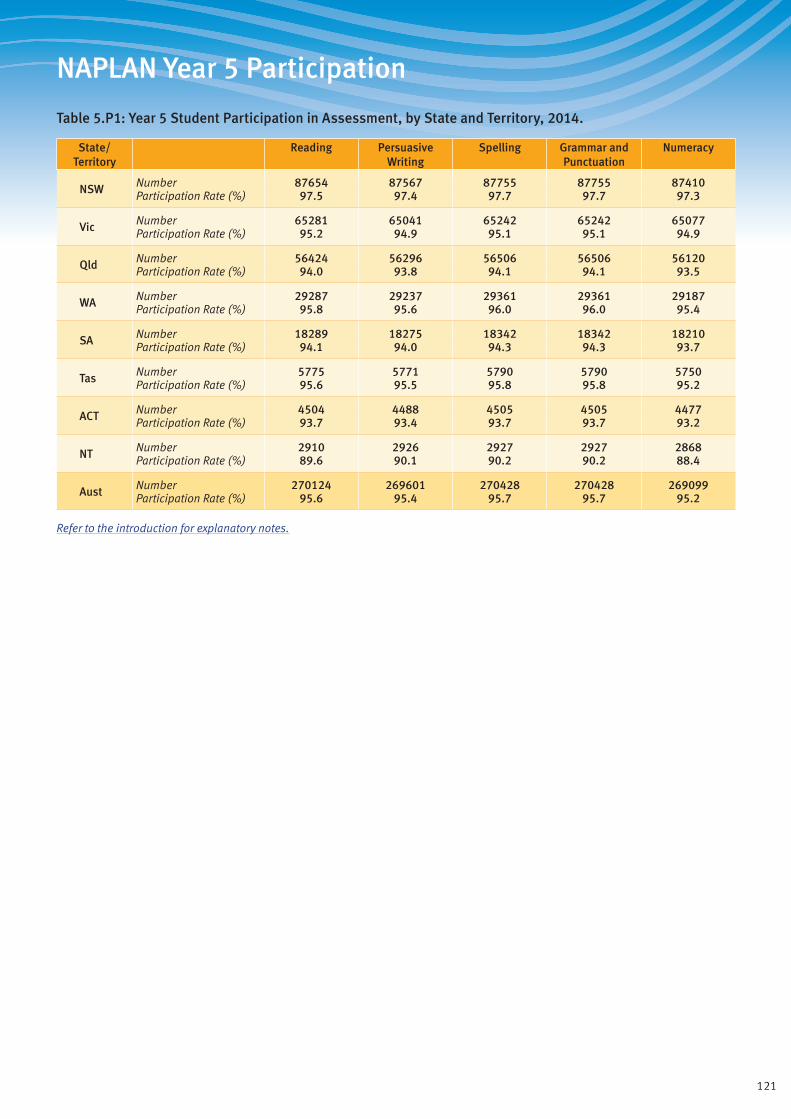
121
NAPLAN Year 5 Participation
Table 5.P1: Year 5 Student Participation in Assessment, by State and Territory, 2014.
State/ Territory
Reading Persuasive Writing
Spelling Grammar and Punctuation
Numeracy
NSW Number 87654 87567 87755 87755 87410Participation Rate (%) 97.5 97.4 97.7 97.7 97.3
Vic Number 65281 65041 65242 65242 65077Participation Rate (%) 95.2 94.9 95.1 95.1 94.9
Qld Number 56424 56296 56506 56506 56120Participation Rate (%) 94.0 93.8 94.1 94.1 93.5
WA Number 29287 29237 29361 29361 29187Participation Rate (%) 95.8 95.6 96.0 96.0 95.4
SA Number 18289 18275 18342 18342 18210Participation Rate (%) 94.1 94.0 94.3 94.3 93.7
Tas Number 5775 5771 5790 5790 5750Participation Rate (%) 95.6 95.5 95.8 95.8 95.2
ACT Number 4504 4488 4505 4505 4477Participation Rate (%) 93.7 93.4 93.7 93.7 93.2
NT Number 2910 2926 2927 2927 2868Participation Rate (%) 89.6 90.1 90.2 90.2 88.4
Aust Number 270124 269601 270428 270428 269099Participation Rate (%) 95.6 95.4 95.7 95.7 95.2
Refer to the introduction for explanatory notes.
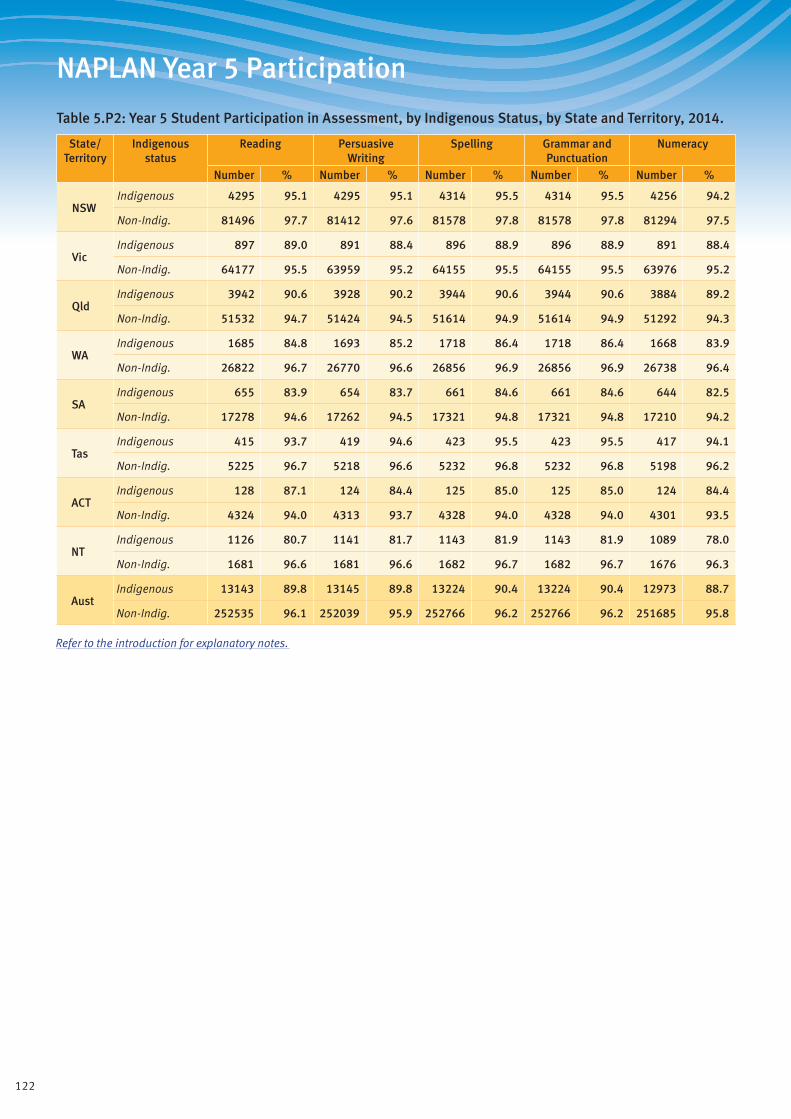
122
NAPLAN Year 5 Participation
Table 5.P2: Year 5 Student Participation in Assessment, by Indigenous Status, by State and Territory, 2014.
State/ Territory
Indigenous status
Reading Persuasive Writing
Spelling Grammar and Punctuation
Numeracy
Number % Number % Number % Number % Number %
NSWIndigenous 4295 95.1 4295 95.1 4314 95.5 4314 95.5 4256 94.2
Non-Indig. 81496 97.7 81412 97.6 81578 97.8 81578 97.8 81294 97.5
VicIndigenous 897 89.0 891 88.4 896 88.9 896 88.9 891 88.4
Non-Indig. 64177 95.5 63959 95.2 64155 95.5 64155 95.5 63976 95.2
QldIndigenous 3942 90.6 3928 90.2 3944 90.6 3944 90.6 3884 89.2
Non-Indig. 51532 94.7 51424 94.5 51614 94.9 51614 94.9 51292 94.3
WAIndigenous 1685 84.8 1693 85.2 1718 86.4 1718 86.4 1668 83.9
Non-Indig. 26822 96.7 26770 96.6 26856 96.9 26856 96.9 26738 96.4
SAIndigenous 655 83.9 654 83.7 661 84.6 661 84.6 644 82.5
Non-Indig. 17278 94.6 17262 94.5 17321 94.8 17321 94.8 17210 94.2
TasIndigenous 415 93.7 419 94.6 423 95.5 423 95.5 417 94.1
Non-Indig. 5225 96.7 5218 96.6 5232 96.8 5232 96.8 5198 96.2
ACTIndigenous 128 87.1 124 84.4 125 85.0 125 85.0 124 84.4
Non-Indig. 4324 94.0 4313 93.7 4328 94.0 4328 94.0 4301 93.5
NTIndigenous 1126 80.7 1141 81.7 1143 81.9 1143 81.9 1089 78.0
Non-Indig. 1681 96.6 1681 96.6 1682 96.7 1682 96.7 1676 96.3
AustIndigenous 13143 89.8 13145 89.8 13224 90.4 13224 90.4 12973 88.7
Non-Indig. 252535 96.1 252039 95.9 252766 96.2 252766 96.2 251685 95.8
Refer to the introduction for explanatory notes.
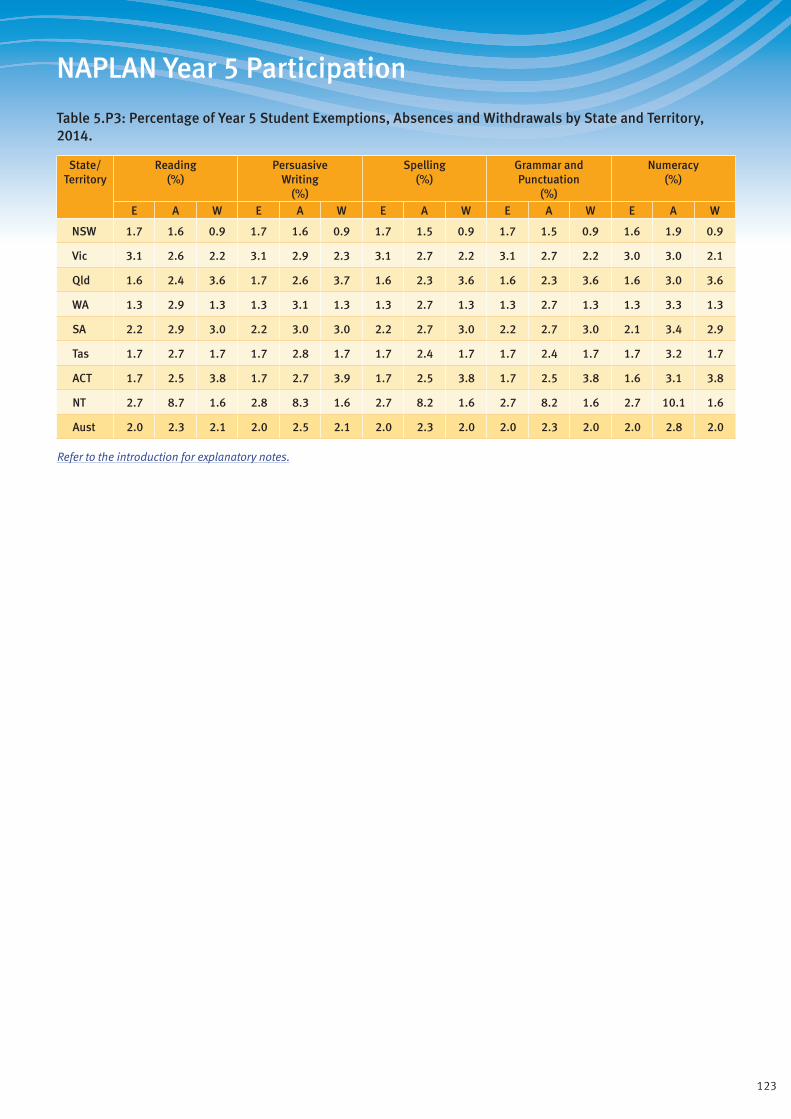
123
NAPLAN Year 5 Participation
Table 5.P3: Percentage of Year 5 Student Exemptions, Absences and Withdrawals by State and Territory, 2014.
State/ Territory
Reading (%)
Persuasive Writing
(%)
Spelling (%)
Grammar and Punctuation
(%)
Numeracy (%)
E A W E A W E A W E A W E A W
NSW 1.7 1.6 0.9 1.7 1.6 0.9 1.7 1.5 0.9 1.7 1.5 0.9 1.6 1.9 0.9
Vic 3.1 2.6 2.2 3.1 2.9 2.3 3.1 2.7 2.2 3.1 2.7 2.2 3.0 3.0 2.1
Qld 1.6 2.4 3.6 1.7 2.6 3.7 1.6 2.3 3.6 1.6 2.3 3.6 1.6 3.0 3.6
WA 1.3 2.9 1.3 1.3 3.1 1.3 1.3 2.7 1.3 1.3 2.7 1.3 1.3 3.3 1.3
SA 2.2 2.9 3.0 2.2 3.0 3.0 2.2 2.7 3.0 2.2 2.7 3.0 2.1 3.4 2.9
Tas 1.7 2.7 1.7 1.7 2.8 1.7 1.7 2.4 1.7 1.7 2.4 1.7 1.7 3.2 1.7
ACT 1.7 2.5 3.8 1.7 2.7 3.9 1.7 2.5 3.8 1.7 2.5 3.8 1.6 3.1 3.8
NT 2.7 8.7 1.6 2.8 8.3 1.6 2.7 8.2 1.6 2.7 8.2 1.6 2.7 10.1 1.6
Aust 2.0 2.3 2.1 2.0 2.5 2.1 2.0 2.3 2.0 2.0 2.3 2.0 2.0 2.8 2.0
Refer to the introduction for explanatory notes.
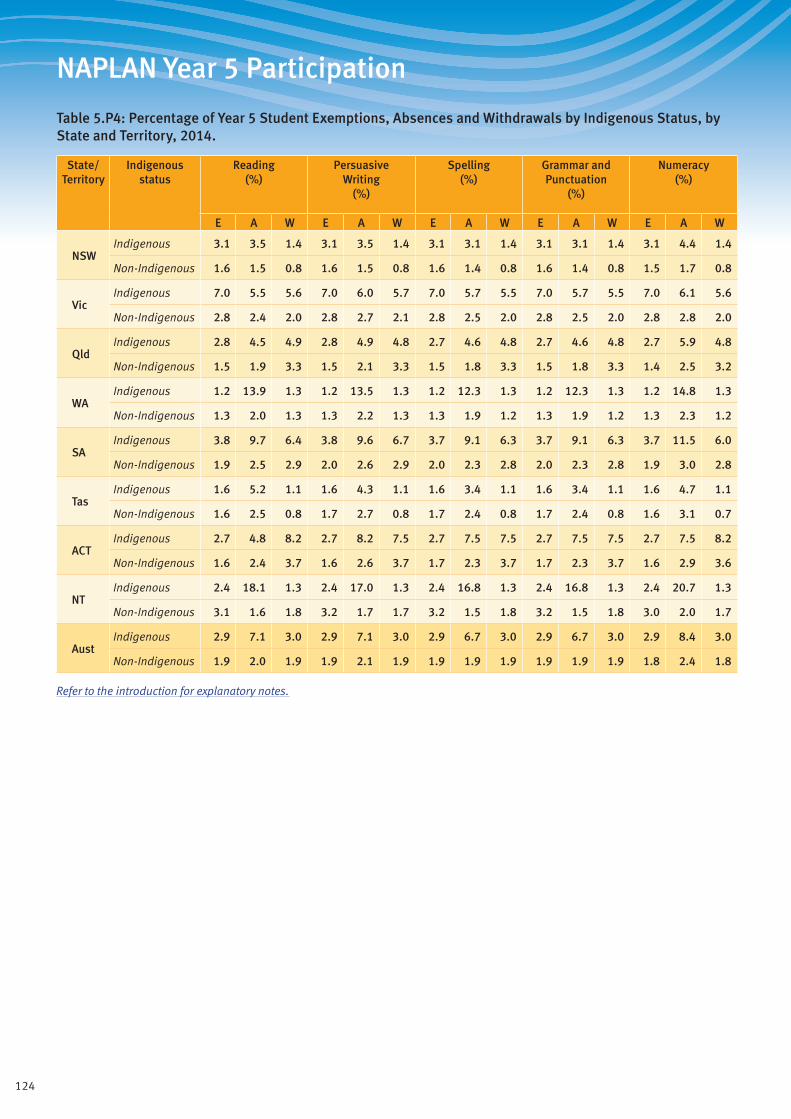
124
NAPLAN Year 5 Participation
Table 5.P4: Percentage of Year 5 Student Exemptions, Absences and Withdrawals by Indigenous Status, by State and Territory, 2014.
State/ Territory
Indigenous status
Reading (%)
Persuasive Writing
(%)
Spelling (%)
Grammar and Punctuation
(%)
Numeracy (%)
E A W E A W E A W E A W E A W
NSWIndigenous 3.1 3.5 1.4 3.1 3.5 1.4 3.1 3.1 1.4 3.1 3.1 1.4 3.1 4.4 1.4
Non-Indigenous 1.6 1.5 0.8 1.6 1.5 0.8 1.6 1.4 0.8 1.6 1.4 0.8 1.5 1.7 0.8
VicIndigenous 7.0 5.5 5.6 7.0 6.0 5.7 7.0 5.7 5.5 7.0 5.7 5.5 7.0 6.1 5.6
Non-Indigenous 2.8 2.4 2.0 2.8 2.7 2.1 2.8 2.5 2.0 2.8 2.5 2.0 2.8 2.8 2.0
QldIndigenous 2.8 4.5 4.9 2.8 4.9 4.8 2.7 4.6 4.8 2.7 4.6 4.8 2.7 5.9 4.8
Non-Indigenous 1.5 1.9 3.3 1.5 2.1 3.3 1.5 1.8 3.3 1.5 1.8 3.3 1.4 2.5 3.2
WAIndigenous 1.2 13.9 1.3 1.2 13.5 1.3 1.2 12.3 1.3 1.2 12.3 1.3 1.2 14.8 1.3
Non-Indigenous 1.3 2.0 1.3 1.3 2.2 1.3 1.3 1.9 1.2 1.3 1.9 1.2 1.3 2.3 1.2
SAIndigenous 3.8 9.7 6.4 3.8 9.6 6.7 3.7 9.1 6.3 3.7 9.1 6.3 3.7 11.5 6.0
Non-Indigenous 1.9 2.5 2.9 2.0 2.6 2.9 2.0 2.3 2.8 2.0 2.3 2.8 1.9 3.0 2.8
TasIndigenous 1.6 5.2 1.1 1.6 4.3 1.1 1.6 3.4 1.1 1.6 3.4 1.1 1.6 4.7 1.1
Non-Indigenous 1.6 2.5 0.8 1.7 2.7 0.8 1.7 2.4 0.8 1.7 2.4 0.8 1.6 3.1 0.7
ACTIndigenous 2.7 4.8 8.2 2.7 8.2 7.5 2.7 7.5 7.5 2.7 7.5 7.5 2.7 7.5 8.2
Non-Indigenous 1.6 2.4 3.7 1.6 2.6 3.7 1.7 2.3 3.7 1.7 2.3 3.7 1.6 2.9 3.6
NTIndigenous 2.4 18.1 1.3 2.4 17.0 1.3 2.4 16.8 1.3 2.4 16.8 1.3 2.4 20.7 1.3
Non-Indigenous 3.1 1.6 1.8 3.2 1.7 1.7 3.2 1.5 1.8 3.2 1.5 1.8 3.0 2.0 1.7
AustIndigenous 2.9 7.1 3.0 2.9 7.1 3.0 2.9 6.7 3.0 2.9 6.7 3.0 2.9 8.4 3.0
Non-Indigenous 1.9 2.0 1.9 1.9 2.1 1.9 1.9 1.9 1.9 1.9 1.9 1.9 1.8 2.4 1.8
Refer to the introduction for explanatory notes.
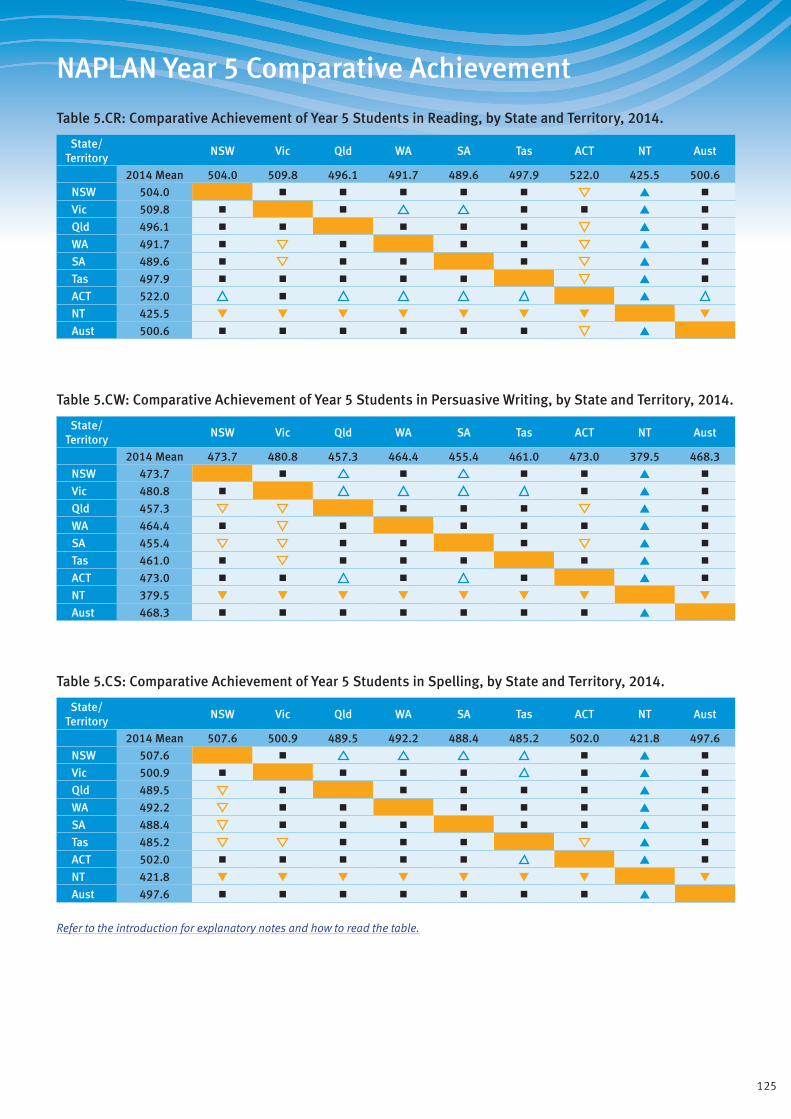
125
NAPLAN Year 5 Comparative Achievement
Table 5.CR: Comparative Achievement of Year 5 Students in Reading, by State and Territory, 2014.
State/ Territory
NSW Vic Qld WA SA Tas ACT NT Aust
2014 Mean 504.0 509.8 496.1 491.7 489.6 497.9 522.0 425.5 500.6
NSW 504.0 ■ ■ ■ ■ ■ ▲ ■
Vic 509.8 ■ ■ ■ ■ ▲ ■
Qld 496.1 ■ ■ ■ ■ ■ ▲ ■
WA 491.7 ■ ■ ■ ■ ▲ ■
SA 489.6 ■ ■ ■ ■ ▲ ■
Tas 497.9 ■ ■ ■ ■ ■ ▲ ■
ACT 522.0 ■ ▲
NT 425.5 ▼ ▼ ▼ ▼ ▼ ▼ ▼ ▼
Aust 500.6 ■ ■ ■ ■ ■ ■ ▲
Table 5.CW: Comparative Achievement of Year 5 Students in Persuasive Writing, by State and Territory, 2014.
State/ Territory
NSW Vic Qld WA SA Tas ACT NT Aust
2014 Mean 473.7 480.8 457.3 464.4 455.4 461.0 473.0 379.5 468.3
NSW 473.7 ■ ■ ■ ■ ▲ ■
Vic 480.8 ■ ■ ▲ ■
Qld 457.3 ■ ■ ■ ▲ ■
WA 464.4 ■ ■ ■ ■ ■ ▲ ■
SA 455.4 ■ ■ ■ ▲ ■
Tas 461.0 ■ ■ ■ ■ ■ ▲ ■
ACT 473.0 ■ ■ ■ ■ ▲ ■
NT 379.5 ▼ ▼ ▼ ▼ ▼ ▼ ▼ ▼
Aust 468.3 ■ ■ ■ ■ ■ ■ ■ ▲
Table 5.CS: Comparative Achievement of Year 5 Students in Spelling, by State and Territory, 2014.
State/ Territory
NSW Vic Qld WA SA Tas ACT NT Aust
2014 Mean 507.6 500.9 489.5 492.2 488.4 485.2 502.0 421.8 497.6
NSW 507.6 ■ ■ ▲ ■
Vic 500.9 ■ ■ ■ ■ ■ ▲ ■
Qld 489.5 ■ ■ ■ ■ ■ ▲ ■
WA 492.2 ■ ■ ■ ■ ■ ▲ ■
SA 488.4 ■ ■ ■ ■ ■ ▲ ■
Tas 485.2 ■ ■ ■ ▲ ■
ACT 502.0 ■ ■ ■ ■ ■ ▲ ■
NT 421.8 ▼ ▼ ▼ ▼ ▼ ▼ ▼ ▼
Aust 497.6 ■ ■ ■ ■ ■ ■ ■ ▲
Refer to the introduction for explanatory notes and how to read the table.
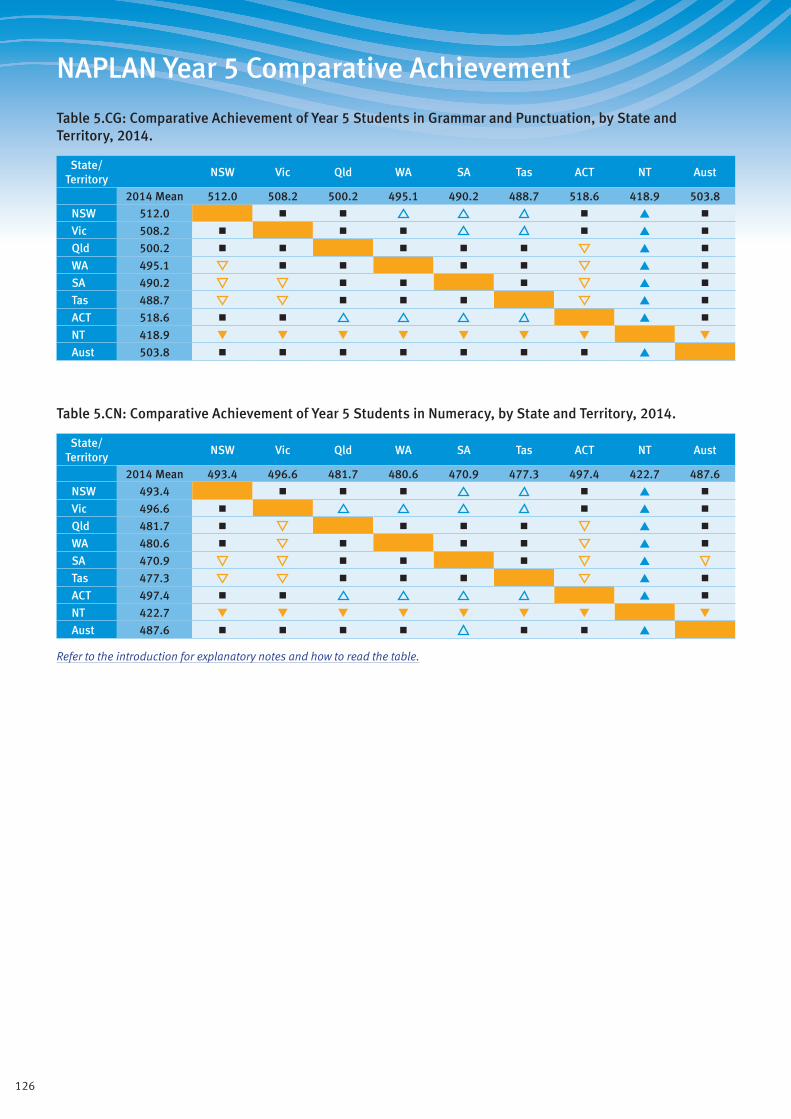
126
NAPLAN Year 5 Comparative Achievement
Table 5.CG: Comparative Achievement of Year 5 Students in Grammar and Punctuation, by State and Territory, 2014.
State/ Territory
NSW Vic Qld WA SA Tas ACT NT Aust
2014 Mean 512.0 508.2 500.2 495.1 490.2 488.7 518.6 418.9 503.8
NSW 512.0 ■ ■ ■ ▲ ■
Vic 508.2 ■ ■ ■ ■ ▲ ■
Qld 500.2 ■ ■ ■ ■ ■ ▲ ■
WA 495.1 ■ ■ ■ ■ ▲ ■
SA 490.2 ■ ■ ■ ▲ ■
Tas 488.7 ■ ■ ■ ▲ ■
ACT 518.6 ■ ■ ▲ ■
NT 418.9 ▼ ▼ ▼ ▼ ▼ ▼ ▼ ▼
Aust 503.8 ■ ■ ■ ■ ■ ■ ■ ▲
Table 5.CN: Comparative Achievement of Year 5 Students in Numeracy, by State and Territory, 2014.
State/ Territory
NSW Vic Qld WA SA Tas ACT NT Aust
2014 Mean 493.4 496.6 481.7 480.6 470.9 477.3 497.4 422.7 487.6
NSW 493.4 ■ ■ ■ ■ ▲ ■
Vic 496.6 ■ ■ ▲ ■
Qld 481.7 ■ ■ ■ ■ ▲ ■
WA 480.6 ■ ■ ■ ■ ▲ ■
SA 470.9 ■ ■ ■ ▲
Tas 477.3 ■ ■ ■ ▲ ■
ACT 497.4 ■ ■ ▲ ■
NT 422.7 ▼ ▼ ▼ ▼ ▼ ▼ ▼ ▼
Aust 487.6 ■ ■ ■ ■ ■ ■ ▲
Refer to the introduction for explanatory notes and how to read the table.
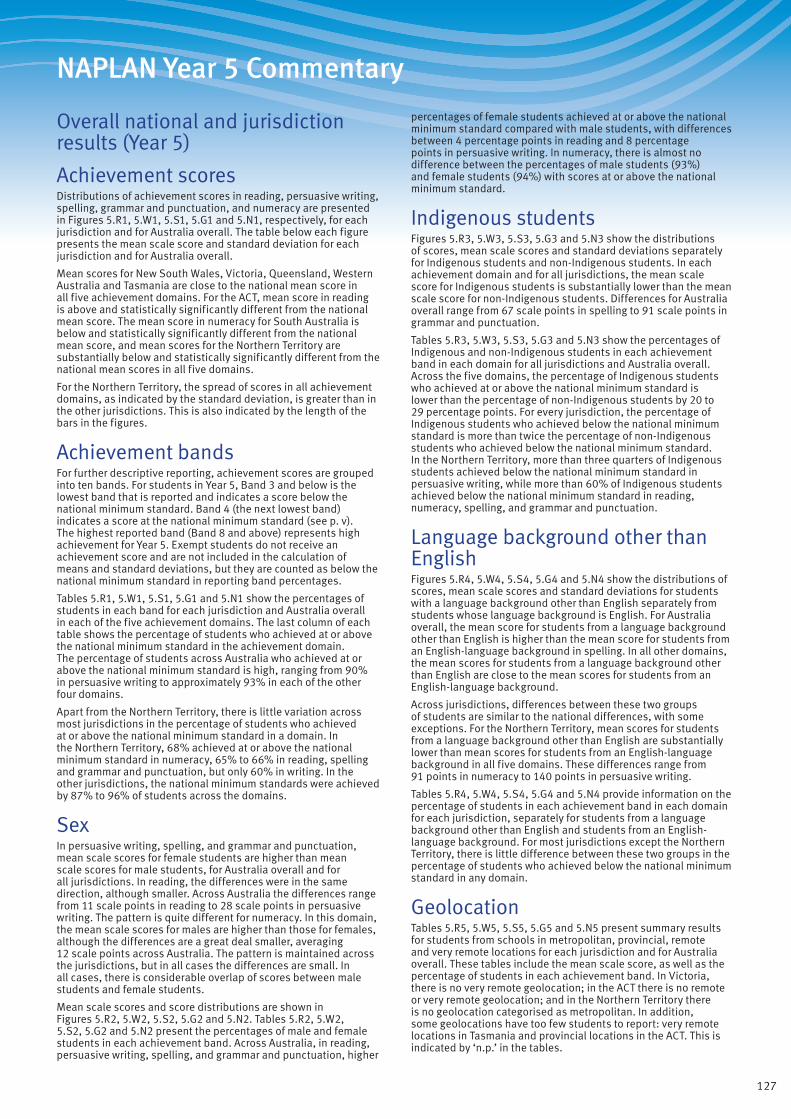
127
NAPLAN Year 5 Commentary
Overall national and jurisdiction results (Year 5)
Achievement scoresDistributions of achievement scores in reading, persuasive writing, spelling, grammar and punctuation, and numeracy are presented in Figures 5.R1, 5.W1, 5.S1, 5.G1 and 5.N1, respectively, for each jurisdiction and for Australia overall. The table below each figure presents the mean scale score and standard deviation for each jurisdiction and for Australia overall.
Mean scores for New South Wales, Victoria, Queensland, Western Australia and Tasmania are close to the national mean score in all five achievement domains. For the ACT, mean score in reading is above and statistically significantly different from the national mean score. The mean score in numeracy for South Australia is below and statistically significantly different from the national mean score, and mean scores for the Northern Territory are substantially below and statistically significantly different from the national mean scores in all five domains.
For the Northern Territory, the spread of scores in all achievement domains, as indicated by the standard deviation, is greater than in the other jurisdictions. This is also indicated by the length of the bars in the figures.
Achievement bandsFor further descriptive reporting, achievement scores are grouped into ten bands. For students in Year 5, Band 3 and below is the lowest band that is reported and indicates a score below the national minimum standard. Band 4 (the next lowest band) indicates a score at the national minimum standard (see p. v). The highest reported band (Band 8 and above) represents high achievement for Year 5. Exempt students do not receive an achievement score and are not included in the calculation of means and standard deviations, but they are counted as below the national minimum standard in reporting band percentages.
Tables 5.R1, 5.W1, 5.S1, 5.G1 and 5.N1 show the percentages of students in each band for each jurisdiction and Australia overall in each of the five achievement domains. The last column of each table shows the percentage of students who achieved at or above the national minimum standard in the achievement domain. The percentage of students across Australia who achieved at or above the national minimum standard is high, ranging from 90% in persuasive writing to approximately 93% in each of the other four domains.
Apart from the Northern Territory, there is little variation across most jurisdictions in the percentage of students who achieved at or above the national minimum standard in a domain. In the Northern Territory, 68% achieved at or above the national minimum standard in numeracy, 65% to 66% in reading, spelling and grammar and punctuation, but only 60% in writing. In the other jurisdictions, the national minimum standards were achieved by 87% to 96% of students across the domains.
Sex In persuasive writing, spelling, and grammar and punctuation, mean scale scores for female students are higher than mean scale scores for male students, for Australia overall and for all jurisdictions. In reading, the differences were in the same direction, although smaller. Across Australia the differences range from 11 scale points in reading to 28 scale points in persuasive writing. The pattern is quite different for numeracy. In this domain, the mean scale scores for males are higher than those for females, although the differences are a great deal smaller, averaging 12 scale points across Australia. The pattern is maintained across the jurisdictions, but in all cases the differences are small. In all cases, there is considerable overlap of scores between male students and female students.
Mean scale scores and score distributions are shown in Figures 5.R2, 5.W2, 5.S2, 5.G2 and 5.N2. Tables 5.R2, 5.W2, 5.S2, 5.G2 and 5.N2 present the percentages of male and female students in each achievement band. Across Australia, in reading, persuasive writing, spelling, and grammar and punctuation, higher
percentages of female students achieved at or above the national minimum standard compared with male students, with differences between 4 percentage points in reading and 8 percentage points in persuasive writing. In numeracy, there is almost no difference between the percentages of male students (93%) and female students (94%) with scores at or above the national minimum standard.
Indigenous students Figures 5.R3, 5.W3, 5.S3, 5.G3 and 5.N3 show the distributions of scores, mean scale scores and standard deviations separately for Indigenous students and non-Indigenous students. In each achievement domain and for all jurisdictions, the mean scale score for Indigenous students is substantially lower than the mean scale score for non-Indigenous students. Differences for Australia overall range from 67 scale points in spelling to 91 scale points in grammar and punctuation.
Tables 5.R3, 5.W3, 5.S3, 5.G3 and 5.N3 show the percentages of Indigenous and non-Indigenous students in each achievement band in each domain for all jurisdictions and Australia overall. Across the five domains, the percentage of Indigenous students who achieved at or above the national minimum standard is lower than the percentage of non-Indigenous students by 20 to 29 percentage points. For every jurisdiction, the percentage of Indigenous students who achieved below the national minimum standard is more than twice the percentage of non-Indigenous students who achieved below the national minimum standard. In the Northern Territory, more than three quarters of Indigenous students achieved below the national minimum standard in persuasive writing, while more than 60% of Indigenous students achieved below the national minimum standard in reading, numeracy, spelling, and grammar and punctuation.
Language background other than English Figures 5.R4, 5.W4, 5.S4, 5.G4 and 5.N4 show the distributions of scores, mean scale scores and standard deviations for students with a language background other than English separately from students whose language background is English. For Australia overall, the mean score for students from a language background other than English is higher than the mean score for students from an English-language background in spelling. In all other domains, the mean scores for students from a language background other than English are close to the mean scores for students from an English-language background.
Across jurisdictions, differences between these two groups of students are similar to the national differences, with some exceptions. For the Northern Territory, mean scores for students from a language background other than English are substantially lower than mean scores for students from an English-language background in all five domains. These differences range from 91 points in numeracy to 140 points in persuasive writing.
Tables 5.R4, 5.W4, 5.S4, 5.G4 and 5.N4 provide information on the percentage of students in each achievement band in each domain for each jurisdiction, separately for students from a language background other than English and students from an English-language background. For most jurisdictions except the Northern Territory, there is little difference between these two groups in the percentage of students who achieved below the national minimum standard in any domain.
Geolocation Tables 5.R5, 5.W5, 5.S5, 5.G5 and 5.N5 present summary results for students from schools in metropolitan, provincial, remote and very remote locations for each jurisdiction and for Australia overall. These tables include the mean scale score, as well as the percentage of students in each achievement band. In Victoria, there is no very remote geolocation; in the ACT there is no remote or very remote geolocation; and in the Northern Territory there is no geolocation categorised as metropolitan. In addition, some geolocations have too few students to report: very remote locations in Tasmania and provincial locations in the ACT. This is indicated by ‘n.p.’ in the tables.
128
NAPLAN Year 5 Commentary
Across all five achievement domains, there is a consistent pattern in the results for Australia overall. Students from metropolitan geolocations have the highest mean score, followed by students from provincial geolocations, then students from remote locations, then students from very remote locations. This pattern can also be seen in the percentage of students who achieved at or above the national minimum standard. This pattern is not always replicated within each jurisdiction. For Tasmania, there is little difference in mean scores and in the percentage of students who achieved at or above the national minimum standard by geolocation in any assessment domain. For South Australia, there is little difference among metropolitan, provincial and remote locations.
The distributions of students in achievement bands show similar results for Australia overall. Schools in metropolitan locations have the highest percentages of students achieving at or above the national minimum standard and schools in very remote locations have the lowest percentages. This pattern is similar across jurisdictions, except that in Victoria there is very little difference between the percentage of students in metropolitan, provincial and remote locations scoring at or above the national minimum standard.
Results by geolocation are also reported by Indigenous status. Results for Indigenous students by geolocation are provided in Tables 5.R6, 5.W6, 5.S6, 5.G6 and 5.N6, and results for non- Indigenous students in Tables 5.R7, 5.W7, 5.S7, 5.G7 and 5.N7. For both groups, the patterns of mean scores by geolocation hold, across Australia and within most jurisdictions. For Australia overall, more than 75% of Indigenous students from metropolitan and provincial locations combined achieved at or above the national minimum standard in reading, spelling, grammar and punctuation, and numeracy, and more than 70% in persuasive writing.
Parental education Tables 5.R8, 5.W8, 5.S8, 5.G8 and 5.N8 present results for each jurisdiction and for Australia overall by parental education. Parental education refers to the highest level of education completed by either parent or guardian. It includes primary and secondary school and post-school qualifications, such as certificates, diplomas and degrees. The percentage of parents who did not report this information on their child’s school enrolment form varies across jurisdictions, from 4% in Victoria to 29% in Northern Territory. For Australia overall, there is no information on parental education for 8% of Year 5 students, so these results should be treated with caution.
In all domains, mean scores are higher for students whose parents have higher levels of education. Students whose parents hold a bachelor degree or higher have the highest mean scores for each jurisdiction and for Australia overall, and the greatest percentage of students who achieved at or above the national minimum standard. For Australia overall, in each domain, higher percentages of students whose parents completed Year 12 or higher achieved at or above the national minimum standard, compared to students whose parents had not completed Year 12.
Parental occupation Tables 5.R9, 5.W9, 5.S9, 5.G9 and 5.N9 present results for each jurisdiction and Australia overall by parental occupation. Parental occupation group includes the main work undertaken by the parent or guardian. If a parent/guardian has more than one job, the occupation group reflecting the main job is reported. If both parents/guardians are working, the higher of the two occupation groups is used. Occupations are classified into four groups; a fifth group represents those not in paid work. The percentage of parents who did not report this information on their child’s school enrolment form varies across jurisdictions, from 3% in Victoria to 27% in the Northern Territory. For Australia overall, there is no information on parental occupation for 12% of students, so these results should be treated with caution.
Students with parents in Occupation Group 1, which includes senior managers and qualified professionals, have the highest mean scale scores in all domains for all jurisdictions and for Australia overall. The next highest mean scores were achieved by students with parents in Occupation Group 2, which includes other business managers and associate professionals, followed by
Occupation Group 3 (tradespeople; clerks; and skilled office, sales and service staff) and Occupation Group 4 (machine operators, hospitality staff, assistants and labourers). Students whose parents were not in paid work have the lowest mean scores in all domains across Australia, and in all jurisdictions except the ACT, where the differences are very small.
Parental occupation is also related to the percentage of students who scored at or above the national minimum standard. Nationally, students with parents in Occupation Groups 1 and 2 most frequently achieved at or above the national minimum standard (between 95% and 98%), with little difference between Group 1 and Group 2. Nationally, for students whose parents are not in paid work, the percentage who achieved at or above the national minimum standard is lowest in persuasive writing (78%) and highest in numeracy (83%).
Participation Tables 5.P1, 5.P2, 5.P3 and 5.P4 provide data on participation in the tests in each domain for each jurisdiction and for Australia overall. Table 5.P1 provides the overall rates and Table 5.P2 provides rates separately for Indigenous and non-Indigenous students. Tables 5.P3 and 5.P4 provide data on exemptions, absences and withdrawals for the tests in each domain, with Table 5.P4 showing these rates separately for Indigenous and non-Indigenous students. Students who are absent or withdrawn are considered non-participating. Students who are exempt do not receive a scale score but are considered to have achieved below the national minimum standard.
Nationally, the overall participation rate is quite uniform across domains, ranging between 95.2% and 95.7% across domains. These rates are approximately one-half of a percentage point higher than the rates for Year 3. Among the eight jurisdictions, New South Wales has the highest participation rate (97.3% to 97.7% across domains) and Northern Territory the lowest (88.4% to 90.2% across domains). Participation rates are lower among Indigenous students, ranging nationally from 88.7% to 90.4% across domains.
Across Australia, exemptions were granted to 2.9% of Indigenous students and 1.9% of non-Indigenous students, with the highest proportions recorded in Victoria (7.0% and 2.8% respectively). There is no consistent pattern across jurisdictions. In addition to the figures reported above for Victoria, the proportion of Indigenous students granted exemptions in New South Wales, Queensland and South Australia is approximately twice as high as that for non-Indigenous students. Differences are much smaller in the remaining jurisdictions.
Absence rates are considerably higher than rates of exemption or withdrawal among Indigenous students, where they range from 6.7% to 8.4% nationally across domains. Among Indigenous students, rates of absence are highest in the Northern Territory (16.8% to 20.7%), Western Australia (12.3% to 14.8%) and South Australia (9.1% to 11.5%). Withdrawal rates are generally lower, with the highest figures recorded for Indigenous students in Victoria (5.5% to 5.7%), Queensland (4.8% to 4.9%), South Australia (6.0% to 6.7%) and the ACT (7.5% to 8.2%).
129
2014 Results NAPLAN Year 7
Year 7 Reading ................................ 130• by State and Territory, 2014
• by Sex, by State and Territory, 2014
• by Indigenous Status, by State and Territory, 2014
• by LBOTE Status, by State and Territory, 2014
• by Geolocation, by State and Territory, 2014
• Indigenous Students by Geolocation, by State and Territory, 2014
• Non-Indigenous Students by Geolocation, by State and Territory, 2014
• by Parental Education, by State and Territory, 2014
• by Parental Occupation, by State and Territory, 2014
Year 7 Persuasive Writing ................ 141• by State and Territory, 2014
• by Sex, by State and Territory, 2014
• by Indigenous Status, by State and Territory, 2014
• by LBOTE Status, by State and Territory, 2014
• by Geolocation, by State and Territory, 2014
• Indigenous Students by Geolocation, by State and Territory, 2014
• Non-Indigenous Students by Geolocation, by State and Territory, 2014
• by Parental Education, by State and Territory, 2014
• by Parental Occupation, by State and Territory, 2014
Year 7 Spelling ................................ 152• by State and Territory, 2014
• by Sex, by State and Territory, 2014
• by Indigenous Status, by State and Territory, 2014
• by LBOTE Status, by State and Territory, 2014
• by Geolocation, by State and Territory, 2014
• Indigenous Students by Geolocation, by State and Territory, 2014
• Non-Indigenous Students by Geolocation, by State and Territory, 2014
• by Parental Education, by State and Territory, 2014
• by Parental Occupation, by State and Territory, 2014
Year 7 Grammar and Punctuation ..... 163• by State and Territory, 2014
• by Sex, by State and Territory, 2014
• by Indigenous Status, by State and Territory, 2014
• by LBOTE Status, by State and Territory, 2014
• by Geolocation, by State and Territory, 2014
• Indigenous Students by Geolocation, by State and Territory, 2014
• Non-Indigenous Students by Geolocation, by State and Territory, 2014
• by Parental Education, by State and Territory, 2014
• by Parental Occupation, by State and Territory, 2014
Year 7 Numeracy ............................. 174• by State and Territory, 2014
• by Sex, by State and Territory, 2014
• by Indigenous Status, by State and Territory, 2014
• by LBOTE Status, by State and Territory, 2014
• by Geolocation, by State and Territory, 2014
• Indigenous Students by Geolocation, by State and Territory, 2014
• Non-Indigenous Students by Geolocation, by State and Territory, 2014
• by Parental Education, by State and Territory, 2014
• by Parental Occupation, by State and Territory, 2014
Year 7 Participation ......................... 185• by State and Territory, 2014
• by Indigenous Status, by State and Territory, 2014
• Student Exemptions, Absences and Withdrawals, by State and Territory, 2014
• Student Exemptions, Absences and Withdrawals, by Indigenous Status, by State and Territory, 2014
Year 7 Comparative Achievement ..... 189• in Reading by State and Territory, 2014
• in Persuasive Writing, by State and Territory, 2014
• in Spelling, by State and Territory, 2014
• in Grammar and Punctuation, by State and Territory, 2014
• in Numeracy, by State and Territory, 2014
Year 7 Commentary ......................... 191
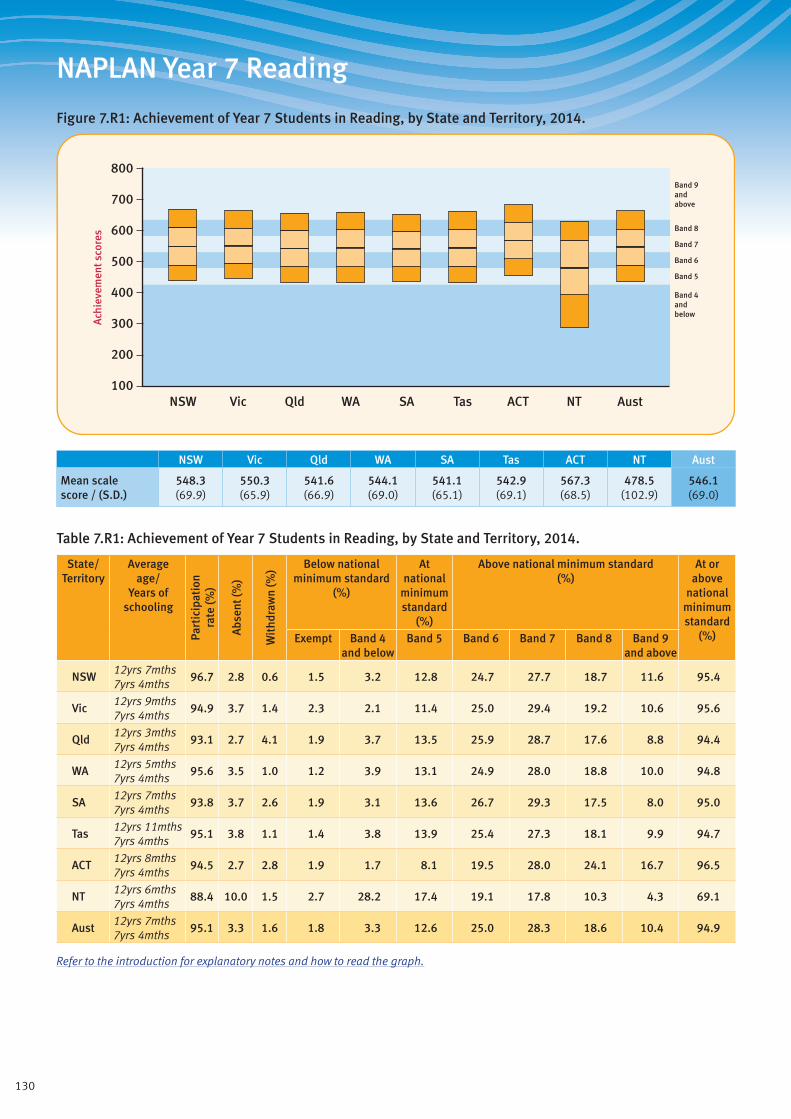
130
NAPLAN Year 7 Reading
Figure 7.R1: Achievement of Year 7 Students in Reading, by State and Territory, 2014.
Band 4andbelow
Band 5
Band 6
Band 7
Band 8
Band 9andabove
800
700
500
600
400
300
200
100
Ach
ieve
men
t sco
res
ACTQld SAWA TasVicNSW NT Aust
NSW Vic Qld WA SA Tas ACT NT Aust
Mean scale score / (S.D.)
548.3 (69.9)
550.3 (65.9)
541.6 (66.9)
544.1 (69.0)
541.1 (65.1)
542.9 (69.1)
567.3 (68.5)
478.5 (102.9)
546.1 (69.0)
Table 7.R1: Achievement of Year 7 Students in Reading, by State and Territory, 2014.
State/ Territory
Average age/
Years of schooling
Part
icip
atio
nra
te (%
)
Abs
ent (
%)
Wit
hdra
wn
(%) Below national
minimum standard (%)
At national
minimum standard
(%)
Above national minimum standard (%)
At or above
national minimum standard
(%)Exempt Band 4 and below
Band 5 Band 6 Band 7 Band 8 Band 9 and above
NSW12yrs 7mths 7yrs 4mths
96.7 2.8 0.6 1.5 3.2 12.8 24.7 27.7 18.7 11.6 95.4
Vic12yrs 9mths 7yrs 4mths
94.9 3.7 1.4 2.3 2.1 11.4 25.0 29.4 19.2 10.6 95.6
Qld12yrs 3mths 7yrs 4mths
93.1 2.7 4.1 1.9 3.7 13.5 25.9 28.7 17.6 8.8 94.4
WA12yrs 5mths 7yrs 4mths
95.6 3.5 1.0 1.2 3.9 13.1 24.9 28.0 18.8 10.0 94.8
SA12yrs 7mths 7yrs 4mths
93.8 3.7 2.6 1.9 3.1 13.6 26.7 29.3 17.5 8.0 95.0
Tas12yrs 11mths 7yrs 4mths
95.1 3.8 1.1 1.4 3.8 13.9 25.4 27.3 18.1 9.9 94.7
ACT12yrs 8mths 7yrs 4mths
94.5 2.7 2.8 1.9 1.7 8.1 19.5 28.0 24.1 16.7 96.5
NT12yrs 6mths 7yrs 4mths
88.4 10.0 1.5 2.7 28.2 17.4 19.1 17.8 10.3 4.3 69.1
Aust12yrs 7mths 7yrs 4mths
95.1 3.3 1.6 1.8 3.3 12.6 25.0 28.3 18.6 10.4 94.9
Refer to the introduction for explanatory notes and how to read the graph.

131
NAPLAN Year 7 Reading
Figure 7.R2: Achievement of Year 7 Students in Reading, by Sex, by State and Territory, 2014.
Band 4andbelow
Band 5
Band 6
Band 7
Band 8
Band 9andabove
ACTQld SAWA TasVicNSW NT Aust
M F M F M F M F M F M F M F M F M F
800
700
500
600
400
300
100
200
Ach
ieve
men
t sco
res
NSW Vic Qld WA SA Tas ACT NT Aust
Male Mean scale score / (S.D.)
543.4 (71.6)
544.6 (67.0)
536.2 (67.5)
539.2 (70.2)
535.2 (66.7)
536.3 (70.5)
565.5 (70.0)
471.2 (105.1)
540.8 (70.3)
Female Mean scale score / (S.D.)
553.3 (67.7)
556.2 (64.3)
547.8 (65.7)
549.1 (67.4)
547.2 (62.9)
549.6 (67.1)
569.2 (67.0)
486.2 (100.0)
551.7 (67.1)
Table 7.R2: Achievement of Year 7 Students in Reading, by Sex, by State and Territory, 2014.
State/ Territory
Sex Below national minimum standard
(%)
At national minimum standard
(%)
Above national minimum standard (%)
At or above
national minimum standard
(%)Exempt Band 4
and belowBand 5 Band 6 Band 7 Band 8 Band 9
and above
NSW Male 1.9 4.1 14.4 24.7 26.4 17.5 11.0 94.0Female 1.0 2.1 11.0 24.7 29.1 19.9 12.3 96.9
Vic Male 3.0 2.8 13.2 25.7 28.2 17.5 9.6 94.2Female 1.6 1.3 9.5 24.2 30.6 21.0 11.7 97.0
Qld Male 2.3 4.5 15.3 26.3 27.5 16.4 7.8 93.2Female 1.5 2.7 11.4 25.5 30.0 19.0 10.0 95.8
WA Male 1.6 4.8 14.6 25.4 26.5 17.7 9.3 93.6Female 0.9 3.0 11.4 24.4 29.6 20.0 10.7 96.1
SA Male 2.4 4.2 15.4 27.1 27.8 15.8 7.3 93.4Female 1.4 1.9 11.7 26.2 30.8 19.2 8.8 96.7
Tas Male 1.7 5.2 15.9 25.7 26.1 16.6 8.7 93.1Female 1.1 2.5 11.9 25.1 28.5 19.7 11.2 96.4
ACT Male 2.5 2.1 8.9 19.4 26.8 23.8 16.5 95.4Female 1.2 1.2 7.4 19.7 29.1 24.5 16.9 97.6
NT Male 3.6 30.7 18.0 18.0 16.4 9.0 4.2 65.7Female 1.7 25.6 16.9 20.3 19.3 11.8 4.5 72.8
Aust Male 2.3 4.2 14.3 25.3 27.0 17.2 9.6 93.5Female 1.3 2.4 10.8 24.6 29.7 20.0 11.3 96.3
Refer to the introduction for explanatory notes and how to read the graph.
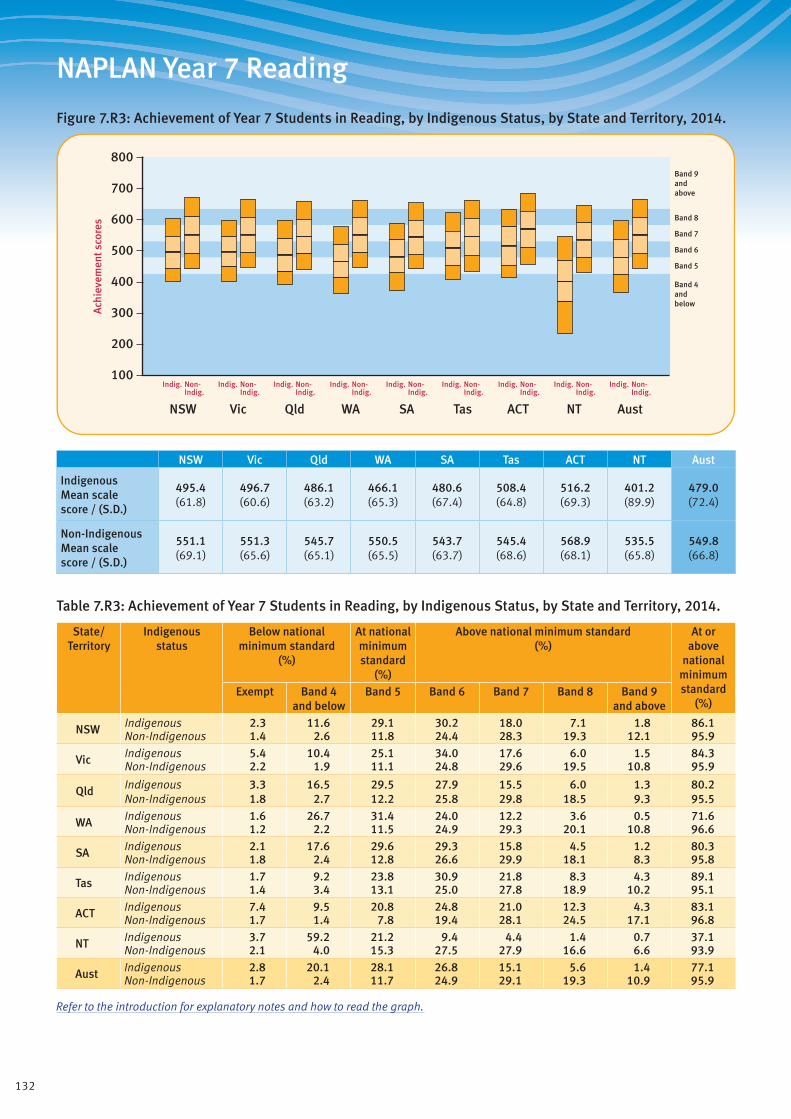
132
NAPLAN Year 7 Reading
Figure 7.R3: Achievement of Year 7 Students in Reading, by Indigenous Status, by State and Territory, 2014.
Band 4andbelow
Band 5
Band 6
Band 7
Band 8
Band 9andabove
ACTQld SAWA TasVicNSW NT Aust
800
700
500
600
400
300
100
200
Ach
ieve
men
t sco
res
Indig. Non-Indig.
Indig. Non-Indig.
Indig. Non-Indig.
Indig. Non-Indig.
Indig. Non-Indig.
Indig. Non-Indig.
Indig. Non-Indig.
Indig. Non-Indig.
Indig. Non-Indig.
NSW Vic Qld WA SA Tas ACT NT Aust
Indigenous Mean scale score / (S.D.)
495.4 (61.8)
496.7 (60.6)
486.1 (63.2)
466.1 (65.3)
480.6 (67.4)
508.4 (64.8)
516.2 (69.3)
401.2 (89.9)
479.0 (72.4)
Non-Indigenous Mean scale score / (S.D.)
551.1 (69.1)
551.3 (65.6)
545.7 (65.1)
550.5 (65.5)
543.7 (63.7)
545.4 (68.6)
568.9 (68.1)
535.5 (65.8)
549.8 (66.8)
Table 7.R3: Achievement of Year 7 Students in Reading, by Indigenous Status, by State and Territory, 2014.
State/ Territory
Indigenous status
Below national minimum standard
(%)
At national minimum standard
(%)
Above national minimum standard (%)
At or above
national minimum standard
(%)Exempt Band 4
and belowBand 5 Band 6 Band 7 Band 8 Band 9
and above
NSW Indigenous 2.3 11.6 29.1 30.2 18.0 7.1 1.8 86.1Non-Indigenous 1.4 2.6 11.8 24.4 28.3 19.3 12.1 95.9
Vic Indigenous 5.4 10.4 25.1 34.0 17.6 6.0 1.5 84.3Non-Indigenous 2.2 1.9 11.1 24.8 29.6 19.5 10.8 95.9
Qld Indigenous 3.3 16.5 29.5 27.9 15.5 6.0 1.3 80.2Non-Indigenous 1.8 2.7 12.2 25.8 29.8 18.5 9.3 95.5
WA Indigenous 1.6 26.7 31.4 24.0 12.2 3.6 0.5 71.6Non-Indigenous 1.2 2.2 11.5 24.9 29.3 20.1 10.8 96.6
SA Indigenous 2.1 17.6 29.6 29.3 15.8 4.5 1.2 80.3Non-Indigenous 1.8 2.4 12.8 26.6 29.9 18.1 8.3 95.8
Tas Indigenous 1.7 9.2 23.8 30.9 21.8 8.3 4.3 89.1Non-Indigenous 1.4 3.4 13.1 25.0 27.8 18.9 10.2 95.1
ACT Indigenous 7.4 9.5 20.8 24.8 21.0 12.3 4.3 83.1Non-Indigenous 1.7 1.4 7.8 19.4 28.1 24.5 17.1 96.8
NT Indigenous 3.7 59.2 21.2 9.4 4.4 1.4 0.7 37.1Non-Indigenous 2.1 4.0 15.3 27.5 27.9 16.6 6.6 93.9
Aust Indigenous 2.8 20.1 28.1 26.8 15.1 5.6 1.4 77.1Non-Indigenous 1.7 2.4 11.7 24.9 29.1 19.3 10.9 95.9
Refer to the introduction for explanatory notes and how to read the graph.
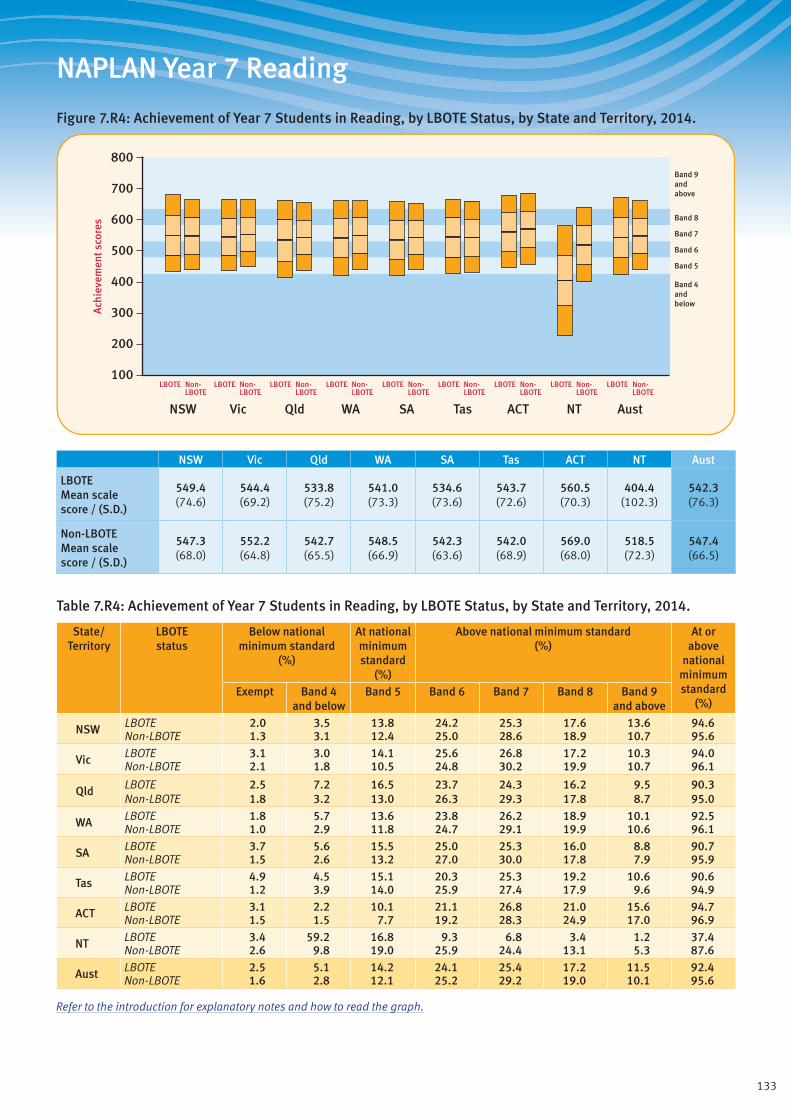
133
NAPLAN Year 7 Reading
Figure 7.R4: Achievement of Year 7 Students in Reading, by LBOTE Status, by State and Territory, 2014.
Band 4andbelow
Band 5
Band 6
Band 7
Band 8
Band 9andabove
ACTQld SAWA TasVicNSW NT Aust
800
700
500
600
400
300
100
200
Ach
ieve
men
t sco
res
LBOTE Non-LBOTE
LBOTE Non-LBOTE
LBOTE Non-LBOTE
LBOTE Non-LBOTE
LBOTE Non-LBOTE
LBOTE Non-LBOTE
LBOTE Non-LBOTE
LBOTE Non-LBOTE
LBOTE Non-LBOTE
NSW Vic Qld WA SA Tas ACT NT Aust
LBOTE Mean scale score / (S.D.)
549.4 (74.6)
544.4 (69.2)
533.8 (75.2)
541.0 (73.3)
534.6 (73.6)
543.7 (72.6)
560.5 (70.3)
404.4 (102.3)
542.3 (76.3)
Non-LBOTE Mean scale score / (S.D.)
547.3 (68.0)
552.2 (64.8)
542.7 (65.5)
548.5 (66.9)
542.3 (63.6)
542.0 (68.9)
569.0 (68.0)
518.5 (72.3)
547.4 (66.5)
Table 7.R4: Achievement of Year 7 Students in Reading, by LBOTE Status, by State and Territory, 2014.
State/ Territory
LBOTE status
Below national minimum standard
(%)
At national minimum standard
(%)
Above national minimum standard (%)
At or above
national minimum standard
(%)Exempt Band 4
and belowBand 5 Band 6 Band 7 Band 8 Band 9
and above
NSW LBOTE 2.0 3.5 13.8 24.2 25.3 17.6 13.6 94.6Non-LBOTE 1.3 3.1 12.4 25.0 28.6 18.9 10.7 95.6
Vic LBOTE 3.1 3.0 14.1 25.6 26.8 17.2 10.3 94.0Non-LBOTE 2.1 1.8 10.5 24.8 30.2 19.9 10.7 96.1
Qld LBOTE 2.5 7.2 16.5 23.7 24.3 16.2 9.5 90.3Non-LBOTE 1.8 3.2 13.0 26.3 29.3 17.8 8.7 95.0
WA LBOTE 1.8 5.7 13.6 23.8 26.2 18.9 10.1 92.5Non-LBOTE 1.0 2.9 11.8 24.7 29.1 19.9 10.6 96.1
SA LBOTE 3.7 5.6 15.5 25.0 25.3 16.0 8.8 90.7Non-LBOTE 1.5 2.6 13.2 27.0 30.0 17.8 7.9 95.9
Tas LBOTE 4.9 4.5 15.1 20.3 25.3 19.2 10.6 90.6Non-LBOTE 1.2 3.9 14.0 25.9 27.4 17.9 9.6 94.9
ACT LBOTE 3.1 2.2 10.1 21.1 26.8 21.0 15.6 94.7Non-LBOTE 1.5 1.5 7.7 19.2 28.3 24.9 17.0 96.9
NT LBOTE 3.4 59.2 16.8 9.3 6.8 3.4 1.2 37.4Non-LBOTE 2.6 9.8 19.0 25.9 24.4 13.1 5.3 87.6
Aust LBOTE 2.5 5.1 14.2 24.1 25.4 17.2 11.5 92.4Non-LBOTE 1.6 2.8 12.1 25.2 29.2 19.0 10.1 95.6
Refer to the introduction for explanatory notes and how to read the graph.

134
NAPLAN Year 7 Reading
Table 7.R5: Achievement of Year 7 Students in Reading, by Geolocation, by State and Territory, 2014.
State/ Territory
Geolocation Mean scale score
Below national minimum standard
(%)
At national
minimum standard
(%)
Above national minimum standard (%)
At or above
national minimum standard
(%)Exempt Band 4 and below
Band 5 Band 6 Band 7 Band 8 Band 9 and above
NSW
Metro 553.2 1.5 2.7 11.7 23.6 27.9 19.6 13.1 95.8Provincial 533.6 1.4 4.5 15.9 28.0 27.3 15.8 7.0 94.1Remote 491.0 1.5 15.5 30.3 27.3 16.0 6.3 3.2 83.1Very Remote 479.2 0.0 23.2 31.6 20.9 13.9 7.2 3.2 76.8
Vic
Metro 553.9 2.4 1.9 10.6 24.0 29.3 20.2 11.7 95.8Provincial 538.7 2.2 2.8 13.9 28.2 29.6 16.2 7.1 95.0Remote 541.8 0.0 1.7 12.2 31.1 31.7 13.9 9.4 98.3Very Remote - - - - - - - - -
Qld
Metro 546.8 1.8 2.9 12.2 25.0 29.4 18.8 9.9 95.3Provincial 533.0 2.2 4.2 15.4 28.4 28.0 15.5 6.2 93.6Remote 505.2 2.1 12.6 24.3 25.9 20.7 10.8 3.6 85.3Very Remote 472.6 1.8 25.3 30.2 22.9 13.4 5.0 1.4 72.9
WA
Metro 551.6 1.3 2.5 11.5 24.1 28.6 20.4 11.6 96.2Provincial 534.8 1.1 3.8 15.4 28.1 28.4 16.4 6.7 95.1Remote 515.0 1.2 10.2 19.8 27.0 24.7 13.0 4.2 88.6Very Remote 462.8 0.3 34.8 25.8 18.0 13.5 5.7 1.9 64.9
SA
Metro 545.5 2.1 2.6 12.5 25.7 29.6 18.5 9.1 95.3Provincial 532.6 1.5 3.4 15.9 29.5 28.7 15.5 5.5 95.1Remote 527.3 0.5 5.2 17.8 27.2 30.7 14.4 4.2 94.3Very Remote 465.2 0.7 30.7 20.8 22.8 14.1 6.0 4.8 68.6
Tas
Metro 548.0 1.5 3.7 12.6 24.3 26.9 19.5 11.5 94.8Provincial 538.7 1.3 3.9 15.0 26.4 27.6 17.0 8.6 94.7Remote n.p. n.p. n.p. n.p. n.p. n.p. n.p. n.p. n.p.Very Remote n.p. n.p. n.p. n.p. n.p. n.p. n.p. n.p. n.p.
ACT
Metro 567.3 1.9 1.7 8.1 19.5 28.0 24.1 16.7 96.5Provincial - - - - - - - - -Remote - - - - - - - - -Very Remote - - - - - - - - -
NT
Metro - - - - - - - - -Provincial 522.0 2.9 7.9 19.0 26.2 25.2 13.6 5.3 89.2Remote 503.7 2.8 19.6 19.4 20.5 17.9 13.2 6.6 77.6Very Remote 373.5 2.2 75.3 12.9 4.1 2.9 1.8 0.8 22.5
Aust
Metro 551.9 1.8 2.5 11.4 24.0 28.7 19.7 11.9 95.7Provincial 534.7 1.8 3.9 15.3 28.1 28.2 15.9 6.8 94.3Remote 511.6 1.6 11.8 21.0 25.8 23.1 12.3 4.5 86.6Very Remote 434.2 1.3 46.5 21.9 14.4 9.8 4.4 1.7 52.2
Refer to the introduction for explanatory notes.

135
NAPLAN Year 7 Reading
Table 7.R6: Achievement of Year 7 Indigenous Students in Reading, by Geolocation, by State and Territory, 2014.
State/ Territory
Geolocation Mean scale score
Below national minimum standard
(%)
At national
minimum standard
(%)
Above national minimum standard (%)
At or above
national minimum standard
(%)Exempt Band 4 and below
Band 5 Band 6 Band 7 Band 8 Band 9 and above
NSW
Metro 504.5 2.5 9.4 25.2 30.6 21.3 8.4 2.6 88.1Provincial 489.5 2.2 12.4 32.0 30.3 15.6 6.3 1.1 85.3Remote 461.1 1.5 24.8 39.7 24.4 8.0 1.4 0.3 73.7Very Remote n.p. n.p. n.p. n.p. n.p. n.p. n.p. n.p. n.p.
Vic
Metro 500.7 5.7 11.0 24.1 30.0 19.3 7.8 2.1 83.3Provincial 492.6 5.0 9.8 26.2 38.0 15.9 4.2 0.9 85.2Remote n.p. n.p. n.p. n.p. n.p. n.p. n.p. n.p. n.p.Very Remote - - - - - - - - -
Qld
Metro 493.7 3.3 12.5 28.3 30.8 17.0 6.6 1.5 84.2Provincial 494.3 3.7 12.4 28.2 29.6 17.0 7.4 1.7 83.9Remote 452.8 3.0 35.7 34.1 14.0 10.4 2.7 0.0 61.2Very Remote 441.7 2.6 38.1 36.4 16.2 6.3 0.4 0.0 59.4
WA
Metro 486.1 1.9 14.9 32.9 28.1 15.3 5.8 1.1 83.2Provincial 478.4 2.4 18.1 30.8 30.3 14.7 3.7 0.0 79.5Remote 465.0 1.9 27.5 30.7 24.4 12.3 3.0 0.2 70.6Very Remote 424.2 0.2 53.4 30.0 11.1 4.7 0.5 0.2 46.4
SA
Metro 491.7 2.3 13.3 27.7 30.9 19.0 5.7 1.1 84.4Provincial 486.5 2.8 13.0 32.7 31.9 14.4 3.5 1.8 84.2Remote 474.0 0.0 21.2 38.2 24.2 10.3 5.5 0.6 78.8Very Remote 405.9 0.0 54.5 24.9 13.7 5.8 0.8 0.3 45.5
Tas
Metro 506.8 1.5 8.8 24.0 33.2 21.9 5.8 4.8 89.7Provincial 508.9 1.8 9.7 24.0 29.1 21.4 10.0 4.0 88.5Remote n.p. n.p. n.p. n.p. n.p. n.p. n.p. n.p. n.p.Very Remote n.p. n.p. n.p. n.p. n.p. n.p. n.p. n.p. n.p.
ACT
Metro 516.2 7.4 9.5 20.8 24.8 21.0 12.3 4.3 83.1Provincial - - - - - - - - -Remote - - - - - - - - -Very Remote - - - - - - - - -
NT
Metro - - - - - - - - -Provincial 473.1 6.5 22.1 32.2 21.8 11.9 3.6 1.8 71.3Remote 441.6 4.8 40.2 30.4 15.4 5.4 2.6 1.2 55.0Very Remote 357.0 2.0 82.3 13.0 1.9 0.7 0.1 0.0 15.6
Aust
Metro 498.4 3.0 11.3 26.9 30.3 19.1 7.4 2.1 85.7Provincial 489.6 3.1 13.2 30.1 30.4 15.8 5.9 1.3 83.7Remote 456.4 2.8 31.9 32.5 20.0 9.4 2.8 0.5 65.3Very Remote 396.1 1.5 63.7 23.2 8.0 3.2 0.3 0.1 34.9
Refer to the introduction for explanatory notes.
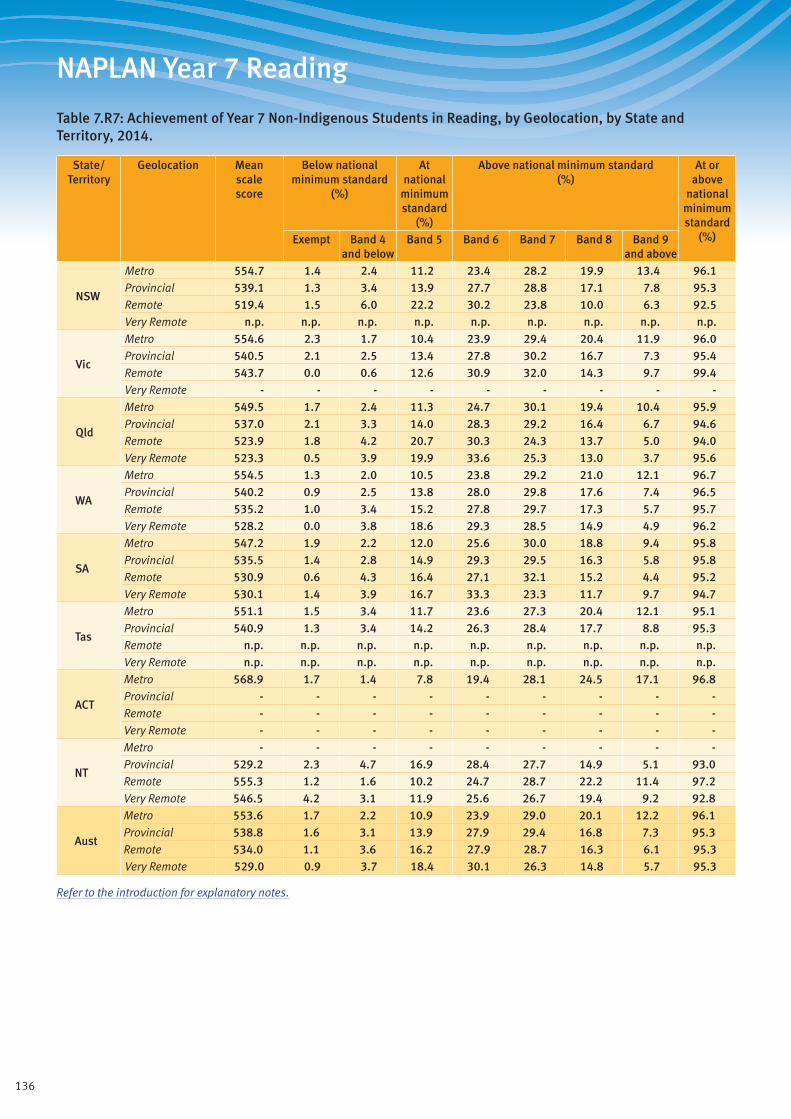
136
NAPLAN Year 7 Reading
Table 7.R7: Achievement of Year 7 Non-Indigenous Students in Reading, by Geolocation, by State and Territory, 2014.
State/ Territory
Geolocation Mean scale score
Below national minimum standard
(%)
At national
minimum standard
(%)
Above national minimum standard (%)
At or above
national minimum standard
(%)Exempt Band 4 and below
Band 5 Band 6 Band 7 Band 8 Band 9 and above
NSW
Metro 554.7 1.4 2.4 11.2 23.4 28.2 19.9 13.4 96.1Provincial 539.1 1.3 3.4 13.9 27.7 28.8 17.1 7.8 95.3Remote 519.4 1.5 6.0 22.2 30.2 23.8 10.0 6.3 92.5Very Remote n.p. n.p. n.p. n.p. n.p. n.p. n.p. n.p. n.p.
Vic
Metro 554.6 2.3 1.7 10.4 23.9 29.4 20.4 11.9 96.0Provincial 540.5 2.1 2.5 13.4 27.8 30.2 16.7 7.3 95.4Remote 543.7 0.0 0.6 12.6 30.9 32.0 14.3 9.7 99.4Very Remote - - - - - - - - -
Qld
Metro 549.5 1.7 2.4 11.3 24.7 30.1 19.4 10.4 95.9Provincial 537.0 2.1 3.3 14.0 28.3 29.2 16.4 6.7 94.6Remote 523.9 1.8 4.2 20.7 30.3 24.3 13.7 5.0 94.0Very Remote 523.3 0.5 3.9 19.9 33.6 25.3 13.0 3.7 95.6
WA
Metro 554.5 1.3 2.0 10.5 23.8 29.2 21.0 12.1 96.7Provincial 540.2 0.9 2.5 13.8 28.0 29.8 17.6 7.4 96.5Remote 535.2 1.0 3.4 15.2 27.8 29.7 17.3 5.7 95.7Very Remote 528.2 0.0 3.8 18.6 29.3 28.5 14.9 4.9 96.2
SA
Metro 547.2 1.9 2.2 12.0 25.6 30.0 18.8 9.4 95.8Provincial 535.5 1.4 2.8 14.9 29.3 29.5 16.3 5.8 95.8Remote 530.9 0.6 4.3 16.4 27.1 32.1 15.2 4.4 95.2Very Remote 530.1 1.4 3.9 16.7 33.3 23.3 11.7 9.7 94.7
Tas
Metro 551.1 1.5 3.4 11.7 23.6 27.3 20.4 12.1 95.1Provincial 540.9 1.3 3.4 14.2 26.3 28.4 17.7 8.8 95.3Remote n.p. n.p. n.p. n.p. n.p. n.p. n.p. n.p. n.p.Very Remote n.p. n.p. n.p. n.p. n.p. n.p. n.p. n.p. n.p.
ACT
Metro 568.9 1.7 1.4 7.8 19.4 28.1 24.5 17.1 96.8Provincial - - - - - - - - -Remote - - - - - - - - -Very Remote - - - - - - - - -
NT
Metro - - - - - - - - -Provincial 529.2 2.3 4.7 16.9 28.4 27.7 14.9 5.1 93.0Remote 555.3 1.2 1.6 10.2 24.7 28.7 22.2 11.4 97.2Very Remote 546.5 4.2 3.1 11.9 25.6 26.7 19.4 9.2 92.8
Aust
Metro 553.6 1.7 2.2 10.9 23.9 29.0 20.1 12.2 96.1Provincial 538.8 1.6 3.1 13.9 27.9 29.4 16.8 7.3 95.3Remote 534.0 1.1 3.6 16.2 27.9 28.7 16.3 6.1 95.3Very Remote 529.0 0.9 3.7 18.4 30.1 26.3 14.8 5.7 95.3
Refer to the introduction for explanatory notes.

137
NAPLAN Year 7 Reading
Table 7.R8: Achievement of Year 7 Students in Reading, by Parental Education, by State and Territory, 2014.
State/ Territory
Parental education
Mean scale score
Below national minimum standard
(%)
At national
minimum standard
(%)
Above national minimum standard (%)
At or above
national minimum standard
(%)Exempt Band 4 and below
Band 5 Band 6 Band 7 Band 8 Band 9 and above
NSW
Bachelor 585.3 1.0 0.6 4.8 14.7 28.1 27.3 23.5 98.4Diploma 548.0 1.1 2.1 10.7 26.0 32.3 19.1 8.7 96.8Certificate 528.3 1.3 3.9 16.3 31.5 28.8 13.9 4.4 94.8Year 12 531.9 1.8 3.7 16.1 30.0 27.5 14.7 6.2 94.5Year 11 500.2 3.2 9.0 27.1 32.6 19.1 7.0 2.0 87.8Not stated (6%) 539.1 2.3 5.2 15.3 24.7 25.6 16.9 10.0 92.5
Vic
Bachelor 580.0 1.3 0.5 4.4 16.8 29.8 27.7 19.6 98.2Diploma 546.3 1.9 1.4 11.1 26.9 32.6 18.8 7.3 96.7Certificate 530.5 2.2 2.8 15.7 31.5 29.9 13.6 4.4 95.0Year 12 537.3 2.6 2.5 14.9 28.0 29.8 15.4 6.7 94.9Year 11 511.6 6.0 5.9 21.6 32.4 23.2 8.4 2.6 88.1Not stated (5%) 569.1 2.4 1.7 8.3 18.9 27.3 23.6 17.8 95.8
Qld
Bachelor 577.1 0.9 0.8 5.3 16.4 30.4 27.6 18.5 98.3Diploma 544.5 1.4 2.1 11.0 27.1 32.9 18.4 7.1 96.5Certificate 528.0 1.6 3.9 16.0 31.5 29.2 13.5 4.3 94.5Year 12 526.9 2.4 4.3 17.1 30.5 27.6 13.6 4.5 93.3Year 11 501.0 3.7 10.0 24.8 31.6 20.9 7.6 1.4 86.3Not stated (12%) 532.2 3.3 5.7 16.3 25.8 26.5 14.5 7.9 91.0
WA
Bachelor 581.2 0.9 0.6 4.6 16.1 28.4 28.7 20.6 98.5Diploma 548.5 0.8 1.9 10.4 26.0 32.1 20.7 8.1 97.3Certificate 532.2 1.1 3.3 14.8 30.5 30.7 15.0 4.7 95.7Year 12 529.9 1.4 3.4 16.4 30.3 29.7 13.8 5.0 95.2Year 11 501.8 1.7 9.8 26.0 31.8 21.2 7.9 1.8 88.5Not stated (16%) 523.6 2.2 9.0 18.0 25.3 24.0 14.2 7.4 88.8
SA
Bachelor 575.9 0.8 0.6 4.7 17.9 31.1 27.6 17.4 98.6Diploma 543.3 1.1 1.8 11.5 27.4 33.6 18.5 6.1 97.1Certificate 531.2 1.3 2.7 16.2 30.9 30.1 14.2 4.7 96.0Year 12 532.0 2.2 3.1 15.4 30.4 29.1 14.6 5.2 94.7Year 11 505.6 3.9 7.4 24.0 33.2 22.1 7.6 1.8 88.7Not stated (13%) 528.1 3.8 5.8 16.7 26.1 27.0 14.8 5.9 90.5
KeyBachelor: Bachelor degree or aboveDiploma: Advanced diploma/diplomaCertificate: Certificate I to IVYear 12: Year 12 or equivalentYear 11: Year 11 or equivalent or belowNot stated: No data was provided for parental education at the time of student enrolment. The higher the percentage of missing data, the less informative are the results for the other categories.
Refer to the introduction for explanatory notes.
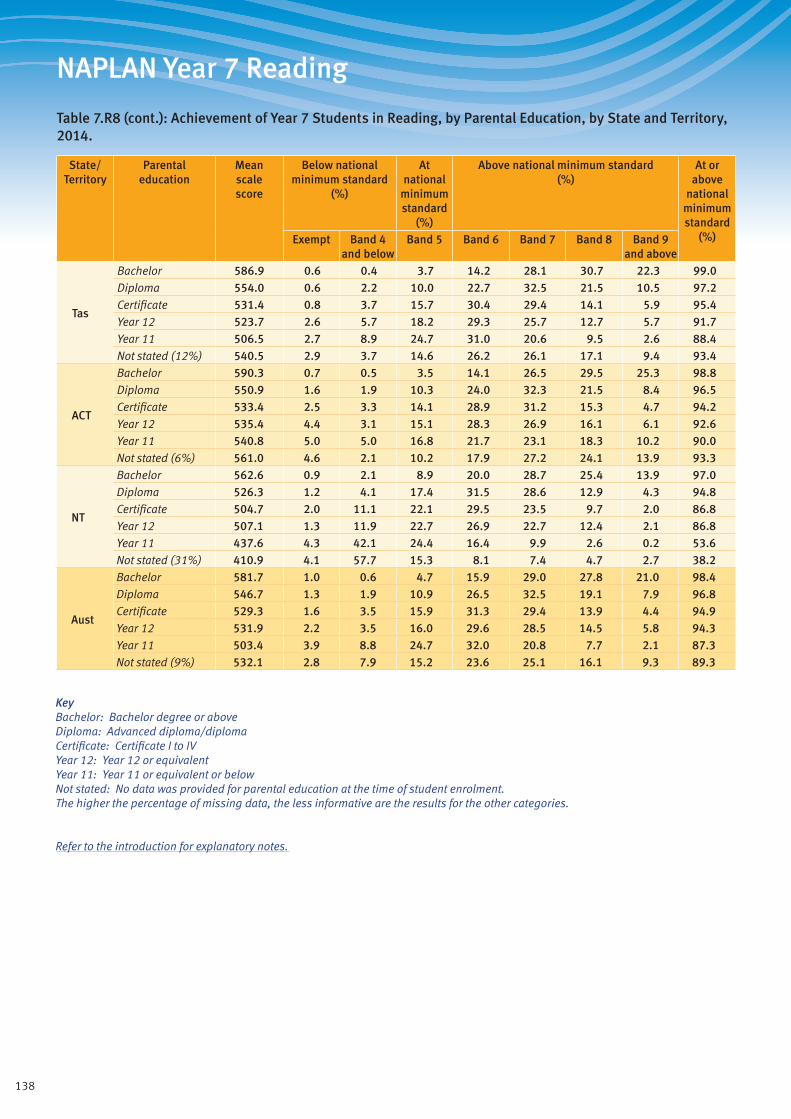
138
NAPLAN Year 7 Reading
Table 7.R8 (cont.): Achievement of Year 7 Students in Reading, by Parental Education, by State and Territory, 2014.
State/ Territory
Parental education
Mean scale score
Below national minimum standard
(%)
At national
minimum standard
(%)
Above national minimum standard (%)
At or above
national minimum standard
(%)Exempt Band 4 and below
Band 5 Band 6 Band 7 Band 8 Band 9 and above
Tas
Bachelor 586.9 0.6 0.4 3.7 14.2 28.1 30.7 22.3 99.0Diploma 554.0 0.6 2.2 10.0 22.7 32.5 21.5 10.5 97.2Certificate 531.4 0.8 3.7 15.7 30.4 29.4 14.1 5.9 95.4Year 12 523.7 2.6 5.7 18.2 29.3 25.7 12.7 5.7 91.7Year 11 506.5 2.7 8.9 24.7 31.0 20.6 9.5 2.6 88.4Not stated (12%) 540.5 2.9 3.7 14.6 26.2 26.1 17.1 9.4 93.4
ACT
Bachelor 590.3 0.7 0.5 3.5 14.1 26.5 29.5 25.3 98.8Diploma 550.9 1.6 1.9 10.3 24.0 32.3 21.5 8.4 96.5Certificate 533.4 2.5 3.3 14.1 28.9 31.2 15.3 4.7 94.2Year 12 535.4 4.4 3.1 15.1 28.3 26.9 16.1 6.1 92.6Year 11 540.8 5.0 5.0 16.8 21.7 23.1 18.3 10.2 90.0Not stated (6%) 561.0 4.6 2.1 10.2 17.9 27.2 24.1 13.9 93.3
NT
Bachelor 562.6 0.9 2.1 8.9 20.0 28.7 25.4 13.9 97.0Diploma 526.3 1.2 4.1 17.4 31.5 28.6 12.9 4.3 94.8Certificate 504.7 2.0 11.1 22.1 29.5 23.5 9.7 2.0 86.8Year 12 507.1 1.3 11.9 22.7 26.9 22.7 12.4 2.1 86.8Year 11 437.6 4.3 42.1 24.4 16.4 9.9 2.6 0.2 53.6Not stated (31%) 410.9 4.1 57.7 15.3 8.1 7.4 4.7 2.7 38.2
Aust
Bachelor 581.7 1.0 0.6 4.7 15.9 29.0 27.8 21.0 98.4Diploma 546.7 1.3 1.9 10.9 26.5 32.5 19.1 7.9 96.8Certificate 529.3 1.6 3.5 15.9 31.3 29.4 13.9 4.4 94.9Year 12 531.9 2.2 3.5 16.0 29.6 28.5 14.5 5.8 94.3Year 11 503.4 3.9 8.8 24.7 32.0 20.8 7.7 2.1 87.3Not stated (9%) 532.1 2.8 7.9 15.2 23.6 25.1 16.1 9.3 89.3
KeyBachelor: Bachelor degree or aboveDiploma: Advanced diploma/diplomaCertificate: Certificate I to IVYear 12: Year 12 or equivalentYear 11: Year 11 or equivalent or belowNot stated: No data was provided for parental education at the time of student enrolment. The higher the percentage of missing data, the less informative are the results for the other categories.
Refer to the introduction for explanatory notes.
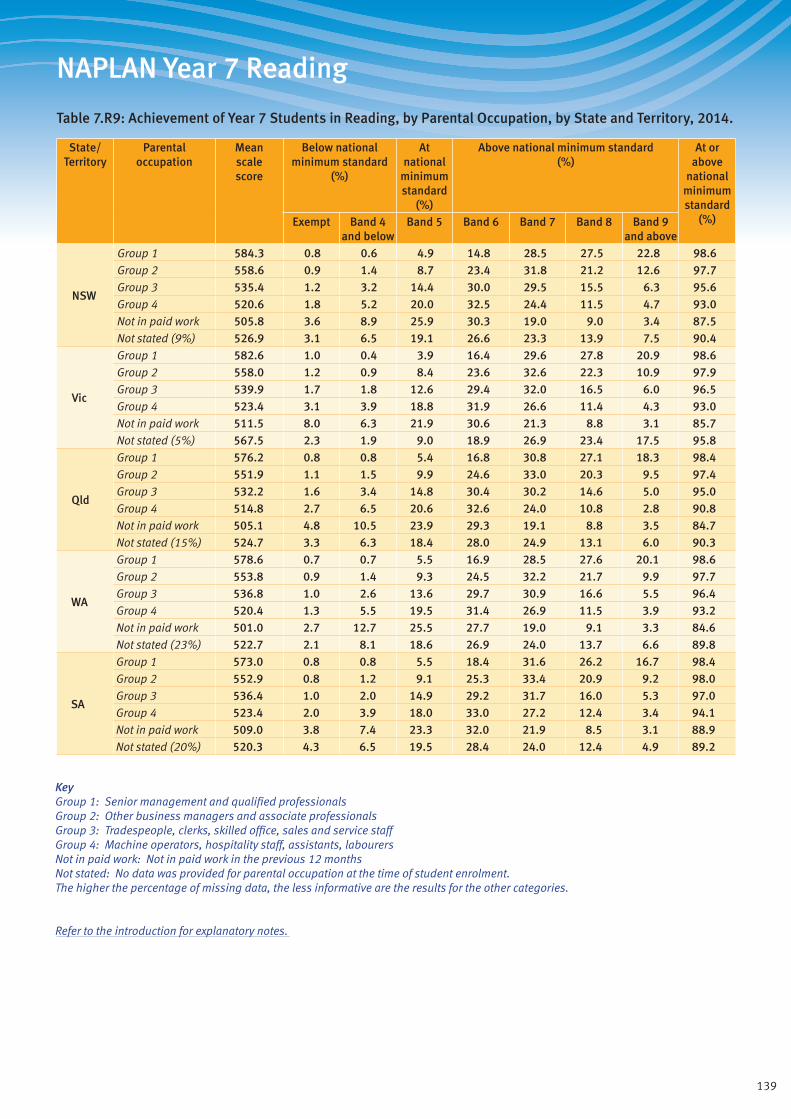
139
NAPLAN Year 7 Reading
Table 7.R9: Achievement of Year 7 Students in Reading, by Parental Occupation, by State and Territory, 2014.
State/ Territory
Parental occupation
Mean scale score
Below national minimum standard
(%)
At national
minimum standard
(%)
Above national minimum standard (%)
At or above
national minimum standard
(%)Exempt Band 4 and below
Band 5 Band 6 Band 7 Band 8 Band 9 and above
NSW
Group 1 584.3 0.8 0.6 4.9 14.8 28.5 27.5 22.8 98.6Group 2 558.6 0.9 1.4 8.7 23.4 31.8 21.2 12.6 97.7Group 3 535.4 1.2 3.2 14.4 30.0 29.5 15.5 6.3 95.6Group 4 520.6 1.8 5.2 20.0 32.5 24.4 11.5 4.7 93.0Not in paid work 505.8 3.6 8.9 25.9 30.3 19.0 9.0 3.4 87.5Not stated (9%) 526.9 3.1 6.5 19.1 26.6 23.3 13.9 7.5 90.4
Vic
Group 1 582.6 1.0 0.4 3.9 16.4 29.6 27.8 20.9 98.6Group 2 558.0 1.2 0.9 8.4 23.6 32.6 22.3 10.9 97.9Group 3 539.9 1.7 1.8 12.6 29.4 32.0 16.5 6.0 96.5Group 4 523.4 3.1 3.9 18.8 31.9 26.6 11.4 4.3 93.0Not in paid work 511.5 8.0 6.3 21.9 30.6 21.3 8.8 3.1 85.7Not stated (5%) 567.5 2.3 1.9 9.0 18.9 26.9 23.4 17.5 95.8
Qld
Group 1 576.2 0.8 0.8 5.4 16.8 30.8 27.1 18.3 98.4Group 2 551.9 1.1 1.5 9.9 24.6 33.0 20.3 9.5 97.4Group 3 532.2 1.6 3.4 14.8 30.4 30.2 14.6 5.0 95.0Group 4 514.8 2.7 6.5 20.6 32.6 24.0 10.8 2.8 90.8Not in paid work 505.1 4.8 10.5 23.9 29.3 19.1 8.8 3.5 84.7Not stated (15%) 524.7 3.3 6.3 18.4 28.0 24.9 13.1 6.0 90.3
WA
Group 1 578.6 0.7 0.7 5.5 16.9 28.5 27.6 20.1 98.6Group 2 553.8 0.9 1.4 9.3 24.5 32.2 21.7 9.9 97.7Group 3 536.8 1.0 2.6 13.6 29.7 30.9 16.6 5.5 96.4Group 4 520.4 1.3 5.5 19.5 31.4 26.9 11.5 3.9 93.2Not in paid work 501.0 2.7 12.7 25.5 27.7 19.0 9.1 3.3 84.6Not stated (23%) 522.7 2.1 8.1 18.6 26.9 24.0 13.7 6.6 89.8
SA
Group 1 573.0 0.8 0.8 5.5 18.4 31.6 26.2 16.7 98.4Group 2 552.9 0.8 1.2 9.1 25.3 33.4 20.9 9.2 98.0Group 3 536.4 1.0 2.0 14.9 29.2 31.7 16.0 5.3 97.0Group 4 523.4 2.0 3.9 18.0 33.0 27.2 12.4 3.4 94.1Not in paid work 509.0 3.8 7.4 23.3 32.0 21.9 8.5 3.1 88.9Not stated (20%) 520.3 4.3 6.5 19.5 28.4 24.0 12.4 4.9 89.2
KeyGroup 1: Senior management and qualified professionalsGroup 2: Other business managers and associate professionalsGroup 3: Tradespeople, clerks, skilled office, sales and service staffGroup 4: Machine operators, hospitality staff, assistants, labourersNot in paid work: Not in paid work in the previous 12 monthsNot stated: No data was provided for parental occupation at the time of student enrolment. The higher the percentage of missing data, the less informative are the results for the other categories.
Refer to the introduction for explanatory notes.
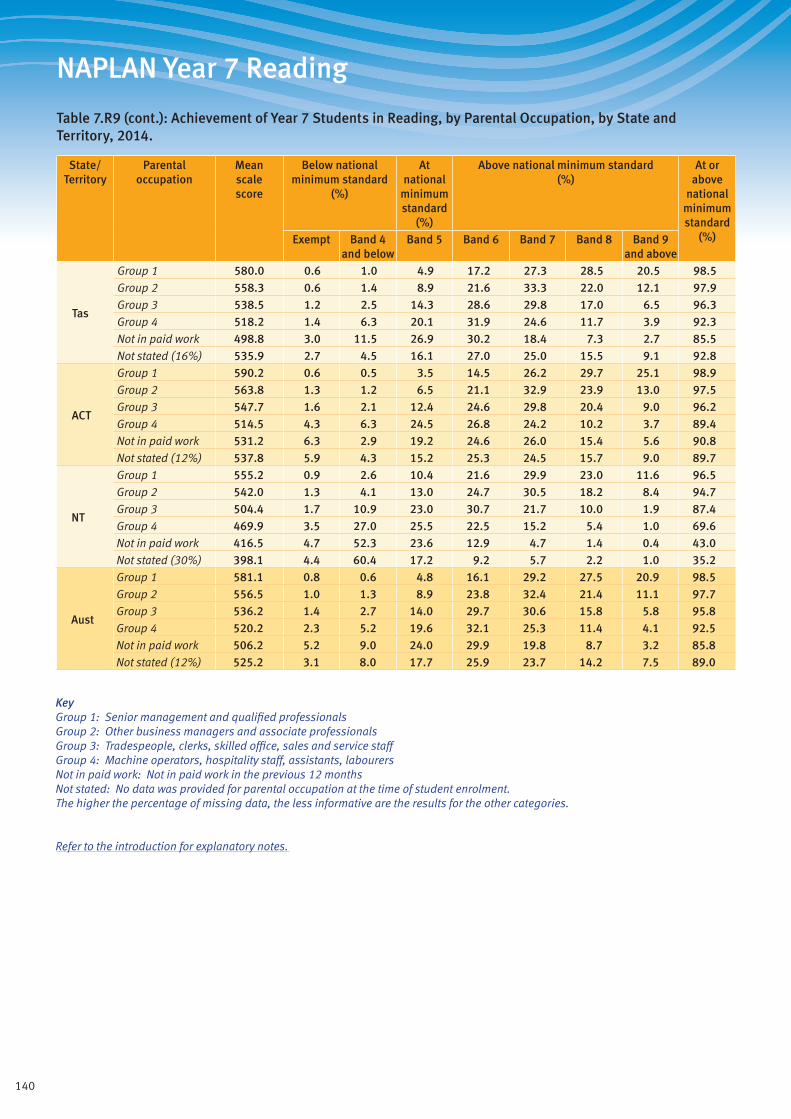
140
NAPLAN Year 7 Reading
Table 7.R9 (cont.): Achievement of Year 7 Students in Reading, by Parental Occupation, by State and Territory, 2014.
State/ Territory
Parental occupation
Mean scale score
Below national minimum standard
(%)
At national
minimum standard
(%)
Above national minimum standard (%)
At or above
national minimum standard
(%)Exempt Band 4 and below
Band 5 Band 6 Band 7 Band 8 Band 9 and above
Tas
Group 1 580.0 0.6 1.0 4.9 17.2 27.3 28.5 20.5 98.5Group 2 558.3 0.6 1.4 8.9 21.6 33.3 22.0 12.1 97.9Group 3 538.5 1.2 2.5 14.3 28.6 29.8 17.0 6.5 96.3Group 4 518.2 1.4 6.3 20.1 31.9 24.6 11.7 3.9 92.3Not in paid work 498.8 3.0 11.5 26.9 30.2 18.4 7.3 2.7 85.5Not stated (16%) 535.9 2.7 4.5 16.1 27.0 25.0 15.5 9.1 92.8
ACT
Group 1 590.2 0.6 0.5 3.5 14.5 26.2 29.7 25.1 98.9Group 2 563.8 1.3 1.2 6.5 21.1 32.9 23.9 13.0 97.5Group 3 547.7 1.6 2.1 12.4 24.6 29.8 20.4 9.0 96.2Group 4 514.5 4.3 6.3 24.5 26.8 24.2 10.2 3.7 89.4Not in paid work 531.2 6.3 2.9 19.2 24.6 26.0 15.4 5.6 90.8Not stated (12%) 537.8 5.9 4.3 15.2 25.3 24.5 15.7 9.0 89.7
NT
Group 1 555.2 0.9 2.6 10.4 21.6 29.9 23.0 11.6 96.5Group 2 542.0 1.3 4.1 13.0 24.7 30.5 18.2 8.4 94.7Group 3 504.4 1.7 10.9 23.0 30.7 21.7 10.0 1.9 87.4Group 4 469.9 3.5 27.0 25.5 22.5 15.2 5.4 1.0 69.6Not in paid work 416.5 4.7 52.3 23.6 12.9 4.7 1.4 0.4 43.0Not stated (30%) 398.1 4.4 60.4 17.2 9.2 5.7 2.2 1.0 35.2
Aust
Group 1 581.1 0.8 0.6 4.8 16.1 29.2 27.5 20.9 98.5Group 2 556.5 1.0 1.3 8.9 23.8 32.4 21.4 11.1 97.7Group 3 536.2 1.4 2.7 14.0 29.7 30.6 15.8 5.8 95.8Group 4 520.2 2.3 5.2 19.6 32.1 25.3 11.4 4.1 92.5Not in paid work 506.2 5.2 9.0 24.0 29.9 19.8 8.7 3.2 85.8Not stated (12%) 525.2 3.1 8.0 17.7 25.9 23.7 14.2 7.5 89.0
KeyGroup 1: Senior management and qualified professionalsGroup 2: Other business managers and associate professionalsGroup 3: Tradespeople, clerks, skilled office, sales and service staffGroup 4: Machine operators, hospitality staff, assistants, labourersNot in paid work: Not in paid work in the previous 12 monthsNot stated: No data was provided for parental occupation at the time of student enrolment. The higher the percentage of missing data, the less informative are the results for the other categories.
Refer to the introduction for explanatory notes.
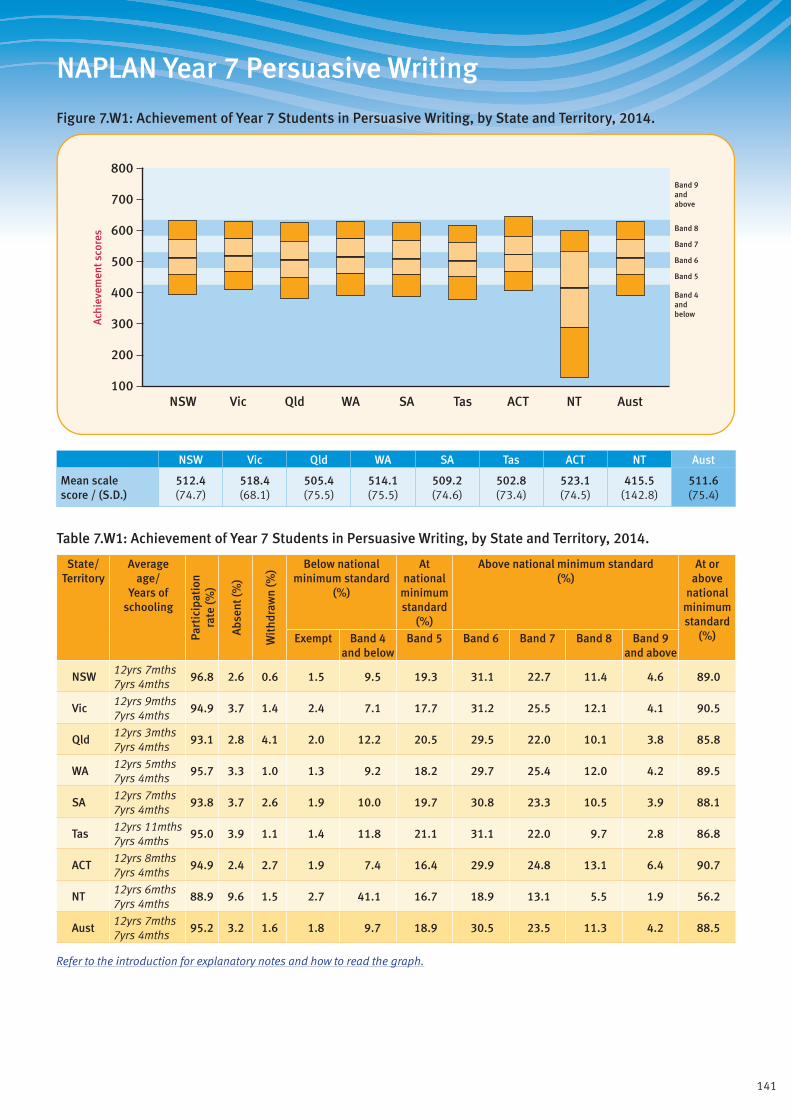
141
NAPLAN Year 7 Persuasive Writing
Figure 7.W1: Achievement of Year 7 Students in Persuasive Writing, by State and Territory, 2014.
Band 4andbelow
Band 5
Band 6
Band 7
Band 8
Band 9andabove
800
700
500
600
400
300
100
200
Ach
ieve
men
t sco
res
ACTQld SAWA TasVicNSW NT Aust
NSW Vic Qld WA SA Tas ACT NT Aust
Mean scale score / (S.D.)
512.4 (74.7)
518.4 (68.1)
505.4 (75.5)
514.1 (75.5)
509.2 (74.6)
502.8 (73.4)
523.1 (74.5)
415.5 (142.8)
511.6 (75.4)
Table 7.W1: Achievement of Year 7 Students in Persuasive Writing, by State and Territory, 2014.
State/ Territory
Average age/
Years of schooling
Part
icip
atio
nra
te (%
)
Abs
ent (
%)
Wit
hdra
wn
(%) Below national
minimum standard (%)
At national
minimum standard
(%)
Above national minimum standard (%)
At or above
national minimum standard
(%)Exempt Band 4 and below
Band 5 Band 6 Band 7 Band 8 Band 9 and above
NSW12yrs 7mths 7yrs 4mths
96.8 2.6 0.6 1.5 9.5 19.3 31.1 22.7 11.4 4.6 89.0
Vic12yrs 9mths 7yrs 4mths
94.9 3.7 1.4 2.4 7.1 17.7 31.2 25.5 12.1 4.1 90.5
Qld12yrs 3mths 7yrs 4mths
93.1 2.8 4.1 2.0 12.2 20.5 29.5 22.0 10.1 3.8 85.8
WA12yrs 5mths 7yrs 4mths
95.7 3.3 1.0 1.3 9.2 18.2 29.7 25.4 12.0 4.2 89.5
SA12yrs 7mths 7yrs 4mths
93.8 3.7 2.6 1.9 10.0 19.7 30.8 23.3 10.5 3.9 88.1
Tas12yrs 11mths 7yrs 4mths
95.0 3.9 1.1 1.4 11.8 21.1 31.1 22.0 9.7 2.8 86.8
ACT12yrs 8mths 7yrs 4mths
94.9 2.4 2.7 1.9 7.4 16.4 29.9 24.8 13.1 6.4 90.7
NT12yrs 6mths 7yrs 4mths
88.9 9.6 1.5 2.7 41.1 16.7 18.9 13.1 5.5 1.9 56.2
Aust12yrs 7mths 7yrs 4mths
95.2 3.2 1.6 1.8 9.7 18.9 30.5 23.5 11.3 4.2 88.5
Refer to the introduction for explanatory notes and how to read the graph.
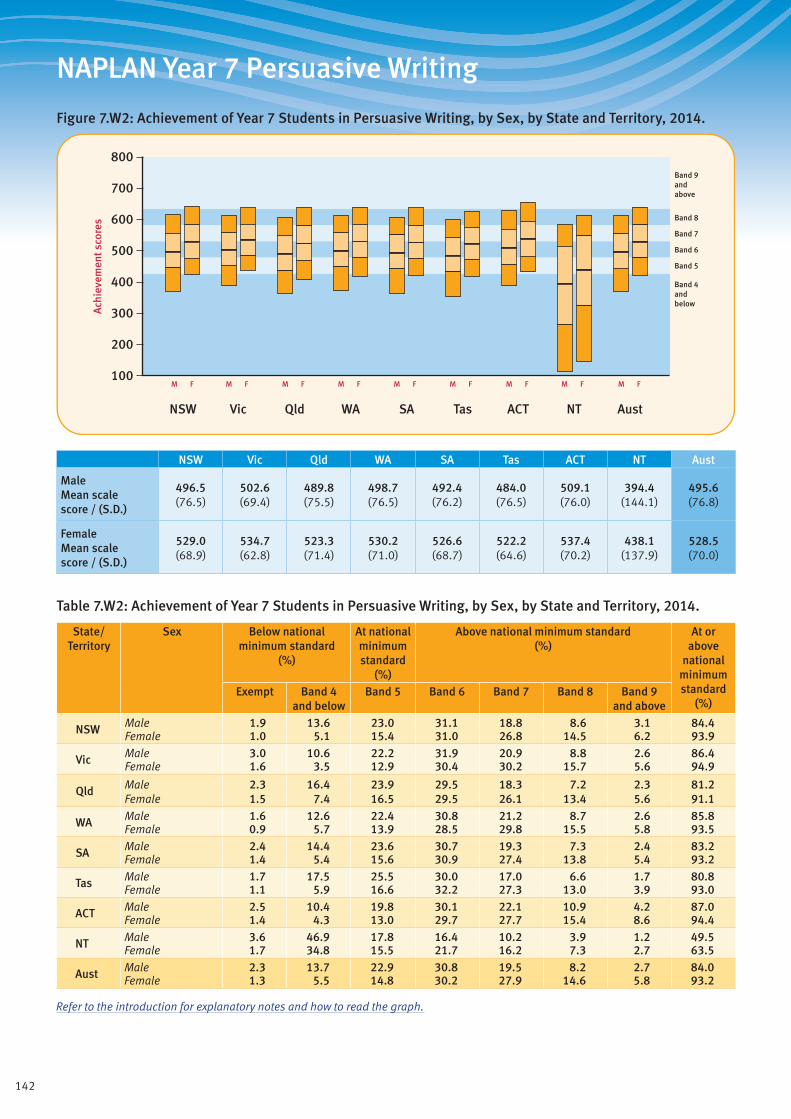
142
NAPLAN Year 7 Persuasive Writing
Figure 7.W2: Achievement of Year 7 Students in Persuasive Writing, by Sex, by State and Territory, 2014.
Band 4andbelow
Band 5
Band 6
Band 7
Band 8
Band 9andabove
ACTQld SAWA TasVicNSW NT Aust
M F M F M F M F M F M F M F M F M F
800
700
500
600
400
300
100
200
Ach
ieve
men
t sco
res
NSW Vic Qld WA SA Tas ACT NT Aust
Male Mean scale score / (S.D.)
496.5 (76.5)
502.6 (69.4)
489.8 (75.5)
498.7 (76.5)
492.4 (76.2)
484.0 (76.5)
509.1 (76.0)
394.4 (144.1)
495.6 (76.8)
Female Mean scale score / (S.D.)
529.0 (68.9)
534.7 (62.8)
523.3 (71.4)
530.2 (71.0)
526.6 (68.7)
522.2 (64.6)
537.4 (70.2)
438.1 (137.9)
528.5 (70.0)
Table 7.W2: Achievement of Year 7 Students in Persuasive Writing, by Sex, by State and Territory, 2014.
State/ Territory
Sex Below national minimum standard
(%)
At national minimum standard
(%)
Above national minimum standard (%)
At or above
national minimum standard
(%)Exempt Band 4
and belowBand 5 Band 6 Band 7 Band 8 Band 9
and above
NSW Male 1.9 13.6 23.0 31.1 18.8 8.6 3.1 84.4Female 1.0 5.1 15.4 31.0 26.8 14.5 6.2 93.9
Vic Male 3.0 10.6 22.2 31.9 20.9 8.8 2.6 86.4Female 1.6 3.5 12.9 30.4 30.2 15.7 5.6 94.9
Qld Male 2.3 16.4 23.9 29.5 18.3 7.2 2.3 81.2Female 1.5 7.4 16.5 29.5 26.1 13.4 5.6 91.1
WA Male 1.6 12.6 22.4 30.8 21.2 8.7 2.6 85.8Female 0.9 5.7 13.9 28.5 29.8 15.5 5.8 93.5
SA Male 2.4 14.4 23.6 30.7 19.3 7.3 2.4 83.2Female 1.4 5.4 15.6 30.9 27.4 13.8 5.4 93.2
Tas Male 1.7 17.5 25.5 30.0 17.0 6.6 1.7 80.8Female 1.1 5.9 16.6 32.2 27.3 13.0 3.9 93.0
ACT Male 2.5 10.4 19.8 30.1 22.1 10.9 4.2 87.0Female 1.4 4.3 13.0 29.7 27.7 15.4 8.6 94.4
NT Male 3.6 46.9 17.8 16.4 10.2 3.9 1.2 49.5Female 1.7 34.8 15.5 21.7 16.2 7.3 2.7 63.5
Aust Male 2.3 13.7 22.9 30.8 19.5 8.2 2.7 84.0Female 1.3 5.5 14.8 30.2 27.9 14.6 5.8 93.2
Refer to the introduction for explanatory notes and how to read the graph.
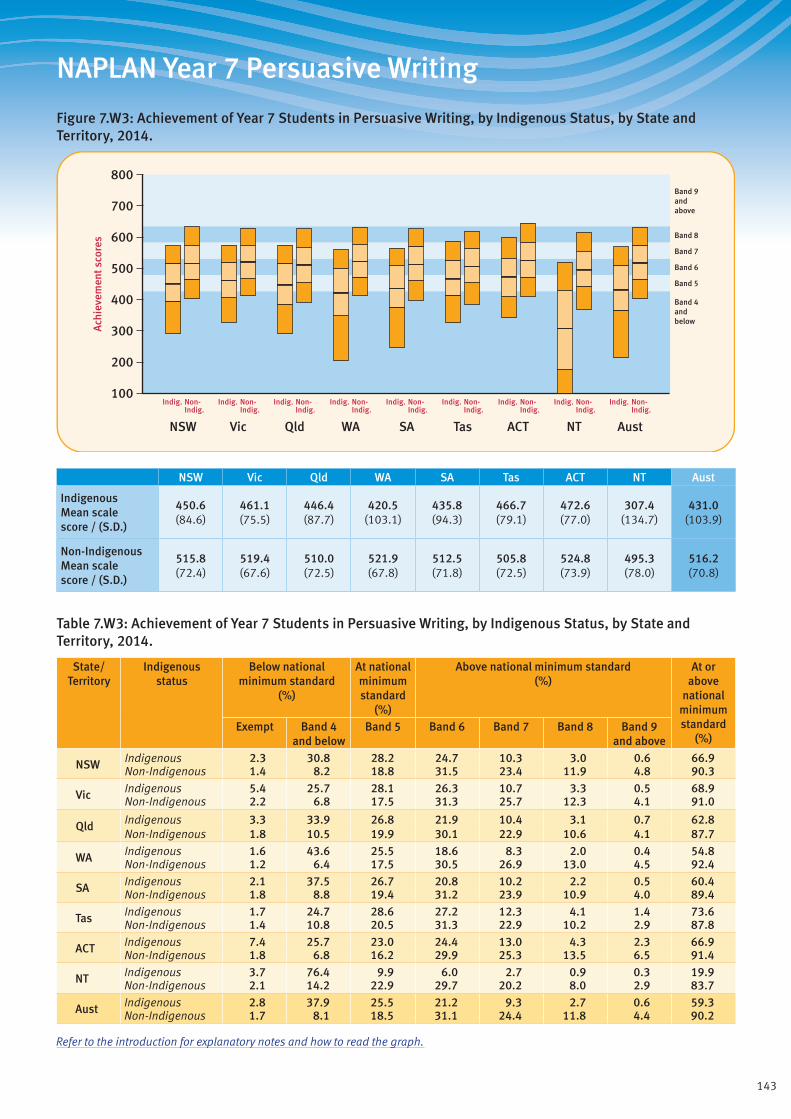
143
NAPLAN Year 7 Persuasive Writing
Figure 7.W3: Achievement of Year 7 Students in Persuasive Writing, by Indigenous Status, by State and Territory, 2014.
Band 4andbelow
Band 5
Band 6
Band 7
Band 8
Band 9andabove
ACTQld SAWA TasVicNSW NT Aust
800
700
500
600
400
300
100
200
Ach
ieve
men
t sco
res
Indig. Non-Indig.
Indig. Non-Indig.
Indig. Non-Indig.
Indig. Non-Indig.
Indig. Non-Indig.
Indig. Non-Indig.
Indig. Non-Indig.
Indig. Non-Indig.
Indig. Non-Indig.
NSW Vic Qld WA SA Tas ACT NT Aust
Indigenous Mean scale score / (S.D.)
450.6 (84.6)
461.1 (75.5)
446.4 (87.7)
420.5 (103.1)
435.8 (94.3)
466.7 (79.1)
472.6 (77.0)
307.4 (134.7)
431.0 (103.9)
Non-Indigenous Mean scale score / (S.D.)
515.8 (72.4)
519.4 (67.6)
510.0 (72.5)
521.9 (67.8)
512.5 (71.8)
505.8 (72.5)
524.8 (73.9)
495.3 (78.0)
516.2 (70.8)
Table 7.W3: Achievement of Year 7 Students in Persuasive Writing, by Indigenous Status, by State and Territory, 2014.
State/ Territory
Indigenous status
Below national minimum standard
(%)
At national minimum standard
(%)
Above national minimum standard (%)
At or above
national minimum standard
(%)Exempt Band 4
and belowBand 5 Band 6 Band 7 Band 8 Band 9
and above
NSW Indigenous 2.3 30.8 28.2 24.7 10.3 3.0 0.6 66.9Non-Indigenous 1.4 8.2 18.8 31.5 23.4 11.9 4.8 90.3
Vic Indigenous 5.4 25.7 28.1 26.3 10.7 3.3 0.5 68.9Non-Indigenous 2.2 6.8 17.5 31.3 25.7 12.3 4.1 91.0
Qld Indigenous 3.3 33.9 26.8 21.9 10.4 3.1 0.7 62.8Non-Indigenous 1.8 10.5 19.9 30.1 22.9 10.6 4.1 87.7
WA Indigenous 1.6 43.6 25.5 18.6 8.3 2.0 0.4 54.8Non-Indigenous 1.2 6.4 17.5 30.5 26.9 13.0 4.5 92.4
SA Indigenous 2.1 37.5 26.7 20.8 10.2 2.2 0.5 60.4Non-Indigenous 1.8 8.8 19.4 31.2 23.9 10.9 4.0 89.4
Tas Indigenous 1.7 24.7 28.6 27.2 12.3 4.1 1.4 73.6Non-Indigenous 1.4 10.8 20.5 31.3 22.9 10.2 2.9 87.8
ACT Indigenous 7.4 25.7 23.0 24.4 13.0 4.3 2.3 66.9Non-Indigenous 1.8 6.8 16.2 29.9 25.3 13.5 6.5 91.4
NT Indigenous 3.7 76.4 9.9 6.0 2.7 0.9 0.3 19.9Non-Indigenous 2.1 14.2 22.9 29.7 20.2 8.0 2.9 83.7
Aust Indigenous 2.8 37.9 25.5 21.2 9.3 2.7 0.6 59.3Non-Indigenous 1.7 8.1 18.5 31.1 24.4 11.8 4.4 90.2
Refer to the introduction for explanatory notes and how to read the graph.
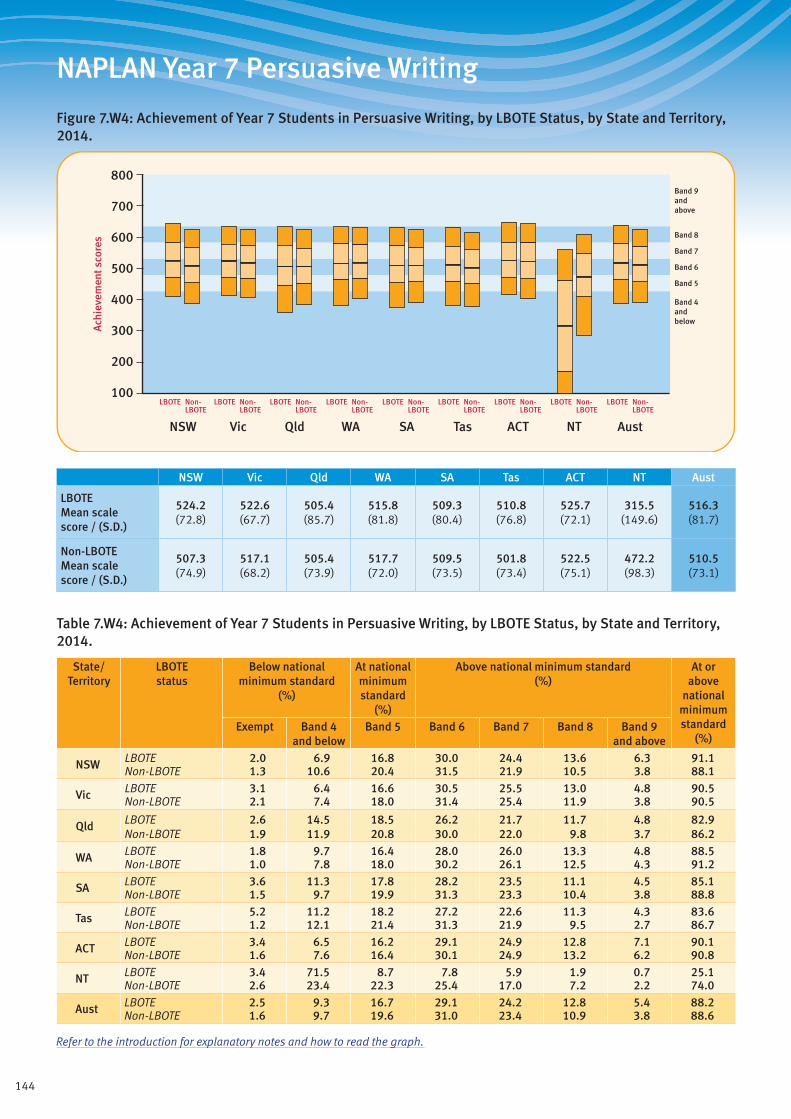
144
NAPLAN Year 7 Persuasive Writing
Figure 7.W4: Achievement of Year 7 Students in Persuasive Writing, by LBOTE Status, by State and Territory, 2014.
Band 4andbelow
Band 5
Band 6
Band 7
Band 8
Band 9andabove
ACTQld SAWA TasVicNSW NT Aust
800
700
500
600
400
300
100
200
Ach
ieve
men
t sco
res
LBOTE Non-LBOTE
LBOTE Non-LBOTE
LBOTE Non-LBOTE
LBOTE Non-LBOTE
LBOTE Non-LBOTE
LBOTE Non-LBOTE
LBOTE Non-LBOTE
LBOTE Non-LBOTE
LBOTE Non-LBOTE
NSW Vic Qld WA SA Tas ACT NT Aust
LBOTE Mean scale score / (S.D.)
524.2 (72.8)
522.6 (67.7)
505.4 (85.7)
515.8 (81.8)
509.3 (80.4)
510.8 (76.8)
525.7 (72.1)
315.5 (149.6)
516.3 (81.7)
Non-LBOTE Mean scale score / (S.D.)
507.3 (74.9)
517.1 (68.2)
505.4 (73.9)
517.7 (72.0)
509.5 (73.5)
501.8 (73.4)
522.5 (75.1)
472.2 (98.3)
510.5 (73.1)
Table 7.W4: Achievement of Year 7 Students in Persuasive Writing, by LBOTE Status, by State and Territory, 2014.
State/ Territory
LBOTE status
Below national minimum standard
(%)
At national minimum standard
(%)
Above national minimum standard (%)
At or above
national minimum standard
(%)Exempt Band 4
and belowBand 5 Band 6 Band 7 Band 8 Band 9
and above
NSW LBOTE 2.0 6.9 16.8 30.0 24.4 13.6 6.3 91.1Non-LBOTE 1.3 10.6 20.4 31.5 21.9 10.5 3.8 88.1
Vic LBOTE 3.1 6.4 16.6 30.5 25.5 13.0 4.8 90.5Non-LBOTE 2.1 7.4 18.0 31.4 25.4 11.9 3.8 90.5
Qld LBOTE 2.6 14.5 18.5 26.2 21.7 11.7 4.8 82.9Non-LBOTE 1.9 11.9 20.8 30.0 22.0 9.8 3.7 86.2
WA LBOTE 1.8 9.7 16.4 28.0 26.0 13.3 4.8 88.5Non-LBOTE 1.0 7.8 18.0 30.2 26.1 12.5 4.3 91.2
SA LBOTE 3.6 11.3 17.8 28.2 23.5 11.1 4.5 85.1Non-LBOTE 1.5 9.7 19.9 31.3 23.3 10.4 3.8 88.8
Tas LBOTE 5.2 11.2 18.2 27.2 22.6 11.3 4.3 83.6Non-LBOTE 1.2 12.1 21.4 31.3 21.9 9.5 2.7 86.7
ACT LBOTE 3.4 6.5 16.2 29.1 24.9 12.8 7.1 90.1Non-LBOTE 1.6 7.6 16.4 30.1 24.9 13.2 6.2 90.8
NT LBOTE 3.4 71.5 8.7 7.8 5.9 1.9 0.7 25.1Non-LBOTE 2.6 23.4 22.3 25.4 17.0 7.2 2.2 74.0
Aust LBOTE 2.5 9.3 16.7 29.1 24.2 12.8 5.4 88.2Non-LBOTE 1.6 9.7 19.6 31.0 23.4 10.9 3.8 88.6
Refer to the introduction for explanatory notes and how to read the graph.

145
NAPLAN Year 7 Persuasive Writing
Table 7.W5: Achievement of Year 7 Students in Persuasive Writing, by Geolocation, by State and Territory, 2014.
State/ Territory
Geolocation Mean scale score
Below national minimum standard
(%)
At national
minimum standard
(%)
Above national minimum standard (%)
At or above
national minimum standard
(%)Exempt Band 4 and below
Band 5 Band 6 Band 7 Band 8 Band 9 and above
NSW
Metro 520.3 1.5 7.6 17.5 30.8 24.3 13.0 5.4 90.9Provincial 488.8 1.4 15.0 25.0 32.0 17.7 6.8 2.0 83.5Remote 438.1 1.5 36.3 28.9 24.4 6.9 2.1 0.0 62.2Very Remote 403.5 0.0 52.2 20.3 15.9 6.7 3.5 1.4 47.8
Vic
Metro 524.7 2.4 5.8 15.8 30.7 27.0 13.6 4.8 91.8Provincial 498.2 2.3 11.3 23.6 32.9 20.6 7.5 1.9 86.5Remote 505.2 0.0 6.1 27.8 39.4 14.4 10.6 1.7 93.9Very Remote - - - - - - - - -
Qld
Metro 512.5 1.8 10.4 19.0 29.5 23.4 11.4 4.5 87.8Provincial 492.8 2.3 15.0 23.9 30.1 19.1 7.2 2.4 82.7Remote 469.7 2.2 25.4 23.4 25.4 16.3 6.3 0.9 72.4Very Remote 427.0 1.8 40.7 24.6 20.6 9.6 2.5 0.2 57.6
WA
Metro 523.7 1.3 6.6 16.7 29.6 27.1 13.7 5.0 92.1Provincial 502.5 1.1 10.8 22.4 31.9 23.0 8.5 2.3 88.1Remote 476.6 1.2 20.3 23.1 27.2 19.5 6.9 1.7 78.5Very Remote 407.2 0.1 50.9 17.4 18.0 9.2 3.5 0.9 49.0
SA
Metro 515.7 2.1 8.5 18.1 30.3 24.7 11.8 4.6 89.4Provincial 495.2 1.5 12.9 23.8 32.5 19.8 7.3 2.1 85.6Remote 498.1 0.5 12.6 23.8 30.2 22.2 8.1 2.6 86.9Very Remote 417.5 0.7 44.7 15.7 21.3 11.8 4.3 1.5 54.6
Tas
Metro 505.2 1.5 11.2 20.3 30.4 23.0 10.7 2.9 87.3Provincial 501.2 1.3 12.2 21.8 31.7 21.3 9.0 2.7 86.4Remote n.p. n.p. n.p. n.p. n.p. n.p. n.p. n.p. n.p.Very Remote n.p. n.p. n.p. n.p. n.p. n.p. n.p. n.p. n.p.
ACT
Metro 523.1 1.9 7.4 16.4 29.9 24.8 13.1 6.4 90.7Provincial - - - - - - - - -Remote - - - - - - - - -Very Remote - - - - - - - - -
NT
Metro - - - - - - - - -Provincial 484.7 2.9 19.6 21.1 26.6 19.1 8.2 2.5 77.5Remote 430.0 2.8 38.5 21.1 19.1 11.4 4.7 2.5 58.7Very Remote 267.6 2.2 86.1 4.7 3.6 2.3 0.8 0.3 11.7
Aust
Metro 520.2 1.8 7.5 17.2 30.4 25.2 12.8 5.0 90.6Provincial 494.2 1.8 13.5 23.8 31.8 19.6 7.4 2.1 84.7Remote 467.7 1.6 24.4 23.4 25.9 16.8 6.2 1.7 74.0Very Remote 362.7 1.3 60.7 14.4 13.6 6.9 2.4 0.6 38.0
Refer to the introduction for explanatory notes.
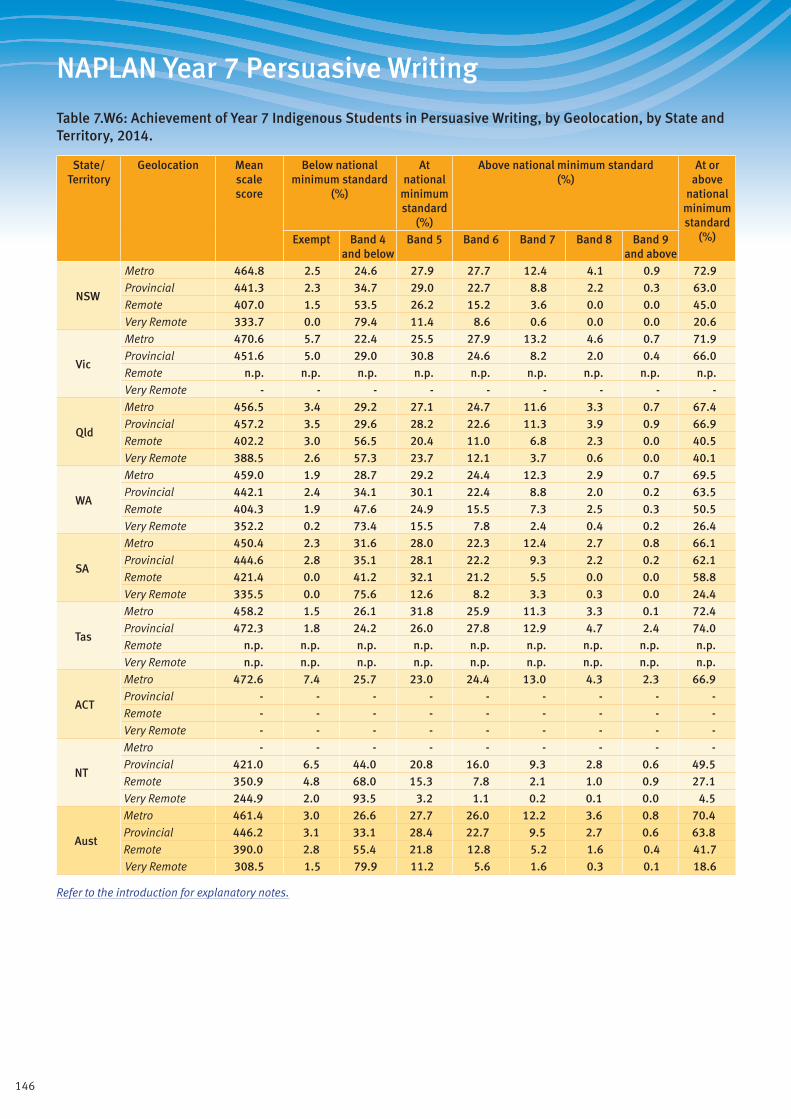
146
NAPLAN Year 7 Persuasive Writing
Table 7.W6: Achievement of Year 7 Indigenous Students in Persuasive Writing, by Geolocation, by State and Territory, 2014.
State/ Territory
Geolocation Mean scale score
Below national minimum standard
(%)
At national
minimum standard
(%)
Above national minimum standard (%)
At or above
national minimum standard
(%)Exempt Band 4 and below
Band 5 Band 6 Band 7 Band 8 Band 9 and above
NSW
Metro 464.8 2.5 24.6 27.9 27.7 12.4 4.1 0.9 72.9Provincial 441.3 2.3 34.7 29.0 22.7 8.8 2.2 0.3 63.0Remote 407.0 1.5 53.5 26.2 15.2 3.6 0.0 0.0 45.0Very Remote 333.7 0.0 79.4 11.4 8.6 0.6 0.0 0.0 20.6
Vic
Metro 470.6 5.7 22.4 25.5 27.9 13.2 4.6 0.7 71.9Provincial 451.6 5.0 29.0 30.8 24.6 8.2 2.0 0.4 66.0Remote n.p. n.p. n.p. n.p. n.p. n.p. n.p. n.p. n.p.Very Remote - - - - - - - - -
Qld
Metro 456.5 3.4 29.2 27.1 24.7 11.6 3.3 0.7 67.4Provincial 457.2 3.5 29.6 28.2 22.6 11.3 3.9 0.9 66.9Remote 402.2 3.0 56.5 20.4 11.0 6.8 2.3 0.0 40.5Very Remote 388.5 2.6 57.3 23.7 12.1 3.7 0.6 0.0 40.1
WA
Metro 459.0 1.9 28.7 29.2 24.4 12.3 2.9 0.7 69.5Provincial 442.1 2.4 34.1 30.1 22.4 8.8 2.0 0.2 63.5Remote 404.3 1.9 47.6 24.9 15.5 7.3 2.5 0.3 50.5Very Remote 352.2 0.2 73.4 15.5 7.8 2.4 0.4 0.2 26.4
SA
Metro 450.4 2.3 31.6 28.0 22.3 12.4 2.7 0.8 66.1Provincial 444.6 2.8 35.1 28.1 22.2 9.3 2.2 0.2 62.1Remote 421.4 0.0 41.2 32.1 21.2 5.5 0.0 0.0 58.8Very Remote 335.5 0.0 75.6 12.6 8.2 3.3 0.3 0.0 24.4
Tas
Metro 458.2 1.5 26.1 31.8 25.9 11.3 3.3 0.1 72.4Provincial 472.3 1.8 24.2 26.0 27.8 12.9 4.7 2.4 74.0Remote n.p. n.p. n.p. n.p. n.p. n.p. n.p. n.p. n.p.Very Remote n.p. n.p. n.p. n.p. n.p. n.p. n.p. n.p. n.p.
ACT
Metro 472.6 7.4 25.7 23.0 24.4 13.0 4.3 2.3 66.9Provincial - - - - - - - - -Remote - - - - - - - - -Very Remote - - - - - - - - -
NT
Metro - - - - - - - - -Provincial 421.0 6.5 44.0 20.8 16.0 9.3 2.8 0.6 49.5Remote 350.9 4.8 68.0 15.3 7.8 2.1 1.0 0.9 27.1Very Remote 244.9 2.0 93.5 3.2 1.1 0.2 0.1 0.0 4.5
Aust
Metro 461.4 3.0 26.6 27.7 26.0 12.2 3.6 0.8 70.4Provincial 446.2 3.1 33.1 28.4 22.7 9.5 2.7 0.6 63.8Remote 390.0 2.8 55.4 21.8 12.8 5.2 1.6 0.4 41.7Very Remote 308.5 1.5 79.9 11.2 5.6 1.6 0.3 0.1 18.6
Refer to the introduction for explanatory notes.

147
NAPLAN Year 7 Persuasive Writing
Table 7.W7: Achievement of Year 7 Non-Indigenous Students in Persuasive Writing, by Geolocation, by State and Territory, 2014.
State/ Territory
Geolocation Mean scale score
Below national minimum standard
(%)
At national
minimum standard
(%)
Above national minimum standard (%)
At or above
national minimum standard
(%)Exempt Band 4 and below
Band 5 Band 6 Band 7 Band 8 Band 9 and above
NSW
Metro 522.1 1.4 7.0 17.1 31.0 24.7 13.2 5.5 91.6Provincial 494.7 1.3 12.5 24.6 33.3 18.9 7.3 2.2 86.2Remote 468.0 1.5 20.3 29.8 33.7 10.3 4.3 0.0 78.2Very Remote n.p. n.p. n.p. n.p. n.p. n.p. n.p. n.p. n.p.
Vic
Metro 525.4 2.3 5.6 15.7 30.7 27.1 13.7 4.8 92.1Provincial 500.0 2.1 10.6 23.3 33.2 21.1 7.7 1.9 87.3Remote 505.0 0.0 6.3 27.4 40.0 13.7 10.9 1.7 93.7Very Remote - - - - - - - - -
Qld
Metro 515.4 1.7 9.4 18.5 29.8 24.1 11.8 4.7 88.9Provincial 497.0 2.2 13.3 23.4 31.0 20.0 7.6 2.6 84.5Remote 493.6 2.0 14.2 24.6 30.5 19.8 7.7 1.2 83.8Very Remote 491.9 0.5 12.1 26.2 35.1 19.7 5.8 0.6 87.4
WA
Metro 526.8 1.3 5.6 16.2 29.7 27.7 14.3 5.2 93.1Provincial 508.3 0.9 8.5 21.6 32.8 24.5 9.2 2.5 90.6Remote 505.1 1.0 9.7 22.0 31.7 24.5 8.8 2.3 89.4Very Remote 500.3 0.0 12.5 20.6 35.1 20.7 8.9 2.2 87.5
SA
Metro 517.8 2.0 7.7 17.8 30.6 25.1 12.1 4.7 90.3Provincial 498.3 1.4 11.6 23.5 33.1 20.5 7.6 2.2 87.0Remote 503.1 0.6 11.0 23.1 30.0 23.7 8.8 2.8 88.4Very Remote 505.9 1.4 10.3 19.7 35.8 21.1 8.6 3.1 88.3
Tas
Metro 509.0 1.5 10.2 19.4 30.4 24.0 11.4 3.2 88.4Provincial 503.6 1.3 11.2 21.3 32.1 22.1 9.3 2.8 87.5Remote n.p. n.p. n.p. n.p. n.p. n.p. n.p. n.p. n.p.Very Remote n.p. n.p. n.p. n.p. n.p. n.p. n.p. n.p. n.p.
ACT
Metro 524.8 1.8 6.8 16.2 29.9 25.3 13.5 6.5 91.4Provincial - - - - - - - - -Remote - - - - - - - - -Very Remote - - - - - - - - -
NT
Metro - - - - - - - - -Provincial 494.4 2.3 14.9 22.2 29.9 20.1 8.0 2.6 82.9Remote 495.8 1.2 13.0 25.6 28.9 19.6 7.9 3.9 85.9Very Remote 508.3 4.2 8.3 20.8 30.8 23.9 8.3 3.6 87.5
Aust
Metro 522.1 1.8 6.9 16.9 30.5 25.7 13.2 5.1 91.4Provincial 498.6 1.6 11.7 23.4 32.7 20.5 7.8 2.3 86.7Remote 498.9 1.2 11.9 23.8 31.0 21.7 8.2 2.3 86.9Very Remote 497.7 0.9 12.4 22.5 34.3 20.2 7.7 1.9 86.6
Refer to the introduction for explanatory notes.
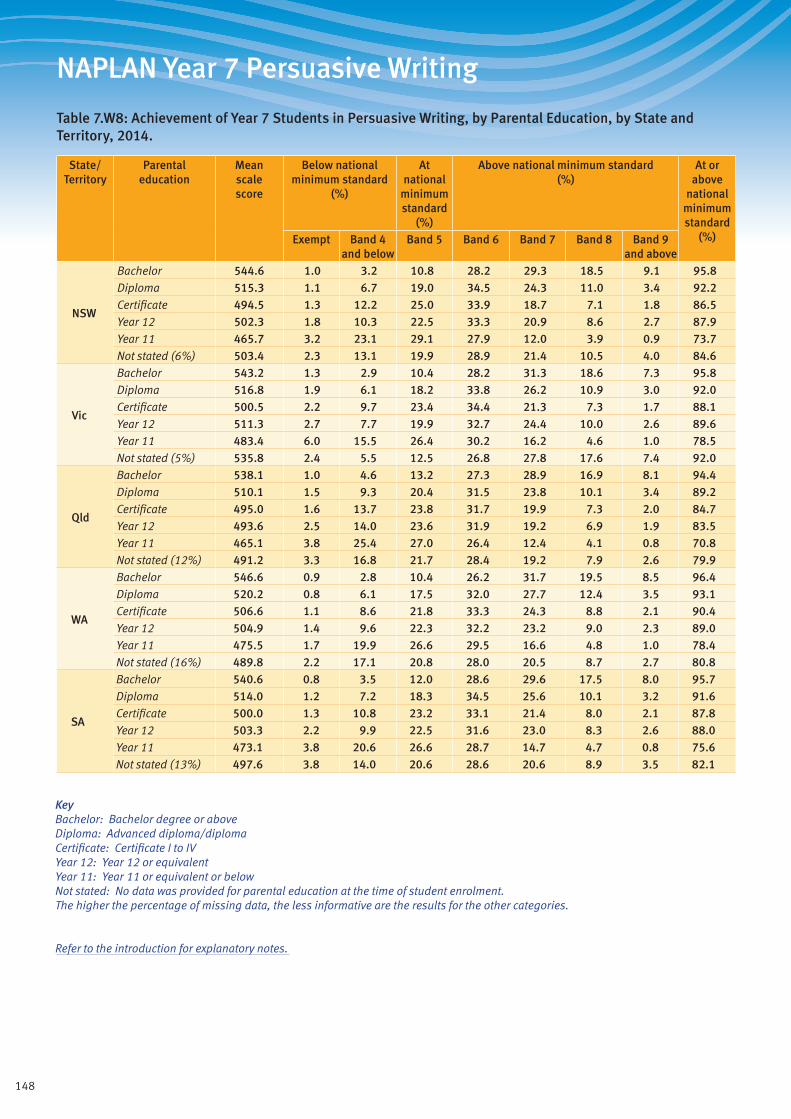
148
NAPLAN Year 7 Persuasive Writing
Table 7.W8: Achievement of Year 7 Students in Persuasive Writing, by Parental Education, by State and Territory, 2014.
State/ Territory
Parental education
Mean scale score
Below national minimum standard
(%)
At national
minimum standard
(%)
Above national minimum standard (%)
At or above
national minimum standard
(%)Exempt Band 4 and below
Band 5 Band 6 Band 7 Band 8 Band 9 and above
NSW
Bachelor 544.6 1.0 3.2 10.8 28.2 29.3 18.5 9.1 95.8Diploma 515.3 1.1 6.7 19.0 34.5 24.3 11.0 3.4 92.2Certificate 494.5 1.3 12.2 25.0 33.9 18.7 7.1 1.8 86.5Year 12 502.3 1.8 10.3 22.5 33.3 20.9 8.6 2.7 87.9Year 11 465.7 3.2 23.1 29.1 27.9 12.0 3.9 0.9 73.7Not stated (6%) 503.4 2.3 13.1 19.9 28.9 21.4 10.5 4.0 84.6
Vic
Bachelor 543.2 1.3 2.9 10.4 28.2 31.3 18.6 7.3 95.8Diploma 516.8 1.9 6.1 18.2 33.8 26.2 10.9 3.0 92.0Certificate 500.5 2.2 9.7 23.4 34.4 21.3 7.3 1.7 88.1Year 12 511.3 2.7 7.7 19.9 32.7 24.4 10.0 2.6 89.6Year 11 483.4 6.0 15.5 26.4 30.2 16.2 4.6 1.0 78.5Not stated (5%) 535.8 2.4 5.5 12.5 26.8 27.8 17.6 7.4 92.0
Qld
Bachelor 538.1 1.0 4.6 13.2 27.3 28.9 16.9 8.1 94.4Diploma 510.1 1.5 9.3 20.4 31.5 23.8 10.1 3.4 89.2Certificate 495.0 1.6 13.7 23.8 31.7 19.9 7.3 2.0 84.7Year 12 493.6 2.5 14.0 23.6 31.9 19.2 6.9 1.9 83.5Year 11 465.1 3.8 25.4 27.0 26.4 12.4 4.1 0.8 70.8Not stated (12%) 491.2 3.3 16.8 21.7 28.4 19.2 7.9 2.6 79.9
WA
Bachelor 546.6 0.9 2.8 10.4 26.2 31.7 19.5 8.5 96.4Diploma 520.2 0.8 6.1 17.5 32.0 27.7 12.4 3.5 93.1Certificate 506.6 1.1 8.6 21.8 33.3 24.3 8.8 2.1 90.4Year 12 504.9 1.4 9.6 22.3 32.2 23.2 9.0 2.3 89.0Year 11 475.5 1.7 19.9 26.6 29.5 16.6 4.8 1.0 78.4Not stated (16%) 489.8 2.2 17.1 20.8 28.0 20.5 8.7 2.7 80.8
SA
Bachelor 540.6 0.8 3.5 12.0 28.6 29.6 17.5 8.0 95.7Diploma 514.0 1.2 7.2 18.3 34.5 25.6 10.1 3.2 91.6Certificate 500.0 1.3 10.8 23.2 33.1 21.4 8.0 2.1 87.8Year 12 503.3 2.2 9.9 22.5 31.6 23.0 8.3 2.6 88.0Year 11 473.1 3.8 20.6 26.6 28.7 14.7 4.7 0.8 75.6Not stated (13%) 497.6 3.8 14.0 20.6 28.6 20.6 8.9 3.5 82.1
KeyBachelor: Bachelor degree or aboveDiploma: Advanced diploma/diplomaCertificate: Certificate I to IVYear 12: Year 12 or equivalentYear 11: Year 11 or equivalent or belowNot stated: No data was provided for parental education at the time of student enrolment. The higher the percentage of missing data, the less informative are the results for the other categories.
Refer to the introduction for explanatory notes.
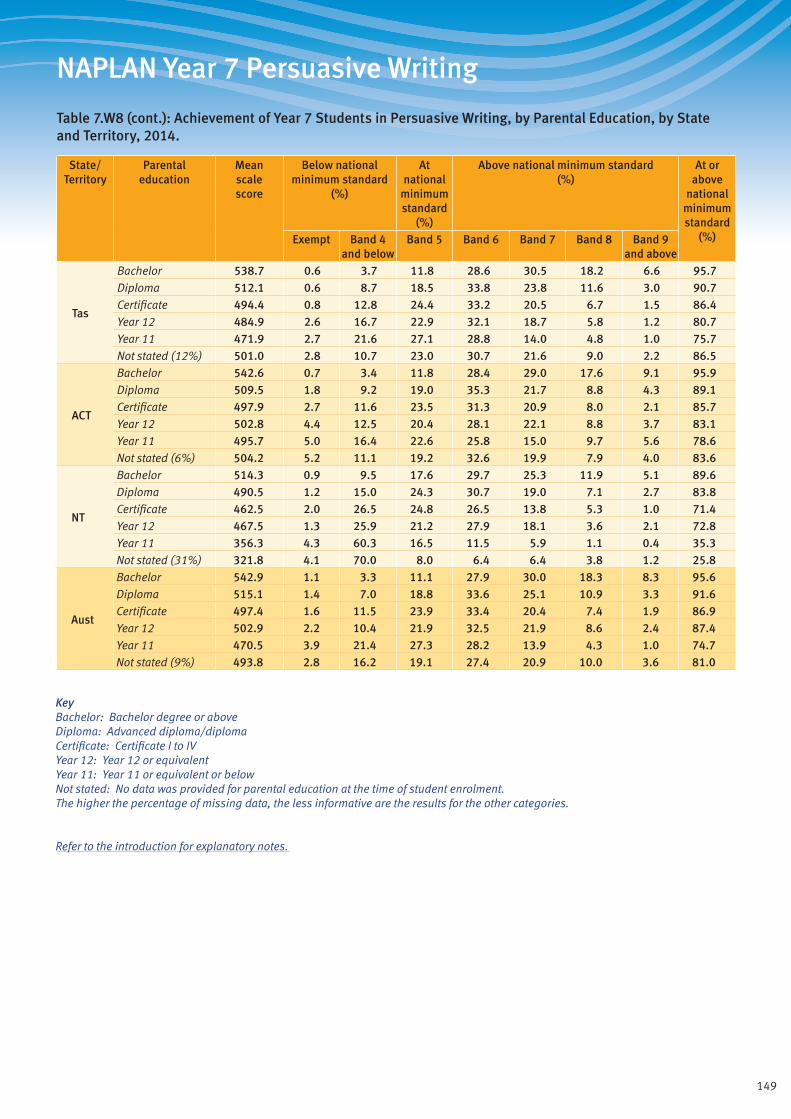
149
NAPLAN Year 7 Persuasive Writing
Table 7.W8 (cont.): Achievement of Year 7 Students in Persuasive Writing, by Parental Education, by State and Territory, 2014.
State/ Territory
Parental education
Mean scale score
Below national minimum standard
(%)
At national
minimum standard
(%)
Above national minimum standard (%)
At or above
national minimum standard
(%)Exempt Band 4 and below
Band 5 Band 6 Band 7 Band 8 Band 9 and above
Tas
Bachelor 538.7 0.6 3.7 11.8 28.6 30.5 18.2 6.6 95.7Diploma 512.1 0.6 8.7 18.5 33.8 23.8 11.6 3.0 90.7Certificate 494.4 0.8 12.8 24.4 33.2 20.5 6.7 1.5 86.4Year 12 484.9 2.6 16.7 22.9 32.1 18.7 5.8 1.2 80.7Year 11 471.9 2.7 21.6 27.1 28.8 14.0 4.8 1.0 75.7Not stated (12%) 501.0 2.8 10.7 23.0 30.7 21.6 9.0 2.2 86.5
ACT
Bachelor 542.6 0.7 3.4 11.8 28.4 29.0 17.6 9.1 95.9Diploma 509.5 1.8 9.2 19.0 35.3 21.7 8.8 4.3 89.1Certificate 497.9 2.7 11.6 23.5 31.3 20.9 8.0 2.1 85.7Year 12 502.8 4.4 12.5 20.4 28.1 22.1 8.8 3.7 83.1Year 11 495.7 5.0 16.4 22.6 25.8 15.0 9.7 5.6 78.6Not stated (6%) 504.2 5.2 11.1 19.2 32.6 19.9 7.9 4.0 83.6
NT
Bachelor 514.3 0.9 9.5 17.6 29.7 25.3 11.9 5.1 89.6Diploma 490.5 1.2 15.0 24.3 30.7 19.0 7.1 2.7 83.8Certificate 462.5 2.0 26.5 24.8 26.5 13.8 5.3 1.0 71.4Year 12 467.5 1.3 25.9 21.2 27.9 18.1 3.6 2.1 72.8Year 11 356.3 4.3 60.3 16.5 11.5 5.9 1.1 0.4 35.3Not stated (31%) 321.8 4.1 70.0 8.0 6.4 6.4 3.8 1.2 25.8
Aust
Bachelor 542.9 1.1 3.3 11.1 27.9 30.0 18.3 8.3 95.6Diploma 515.1 1.4 7.0 18.8 33.6 25.1 10.9 3.3 91.6Certificate 497.4 1.6 11.5 23.9 33.4 20.4 7.4 1.9 86.9Year 12 502.9 2.2 10.4 21.9 32.5 21.9 8.6 2.4 87.4Year 11 470.5 3.9 21.4 27.3 28.2 13.9 4.3 1.0 74.7Not stated (9%) 493.8 2.8 16.2 19.1 27.4 20.9 10.0 3.6 81.0
KeyBachelor: Bachelor degree or aboveDiploma: Advanced diploma/diplomaCertificate: Certificate I to IVYear 12: Year 12 or equivalentYear 11: Year 11 or equivalent or belowNot stated: No data was provided for parental education at the time of student enrolment. The higher the percentage of missing data, the less informative are the results for the other categories.
Refer to the introduction for explanatory notes.

150
NAPLAN Year 7 Persuasive Writing
Table 7.W9: Achievement of Year 7 Students in Persuasive Writing, by Parental Occupation, by State and Territory, 2014.
State/ Territory
Parental occupation
Mean scale score
Below national minimum standard
(%)
At national
minimum standard
(%)
Above national minimum standard (%)
At or above
national minimum standard
(%)Exempt Band 4 and below
Band 5 Band 6 Band 7 Band 8 Band 9 and above
NSW
Group 1 543.1 0.8 3.2 11.3 28.7 29.1 18.1 8.8 96.0Group 2 523.2 0.9 5.6 16.9 33.0 25.7 13.0 4.9 93.5Group 3 503.0 1.3 9.7 22.8 34.2 20.9 8.5 2.6 89.0Group 4 489.6 1.8 14.4 26.1 32.2 16.6 6.7 2.1 83.8Not in paid work 466.9 3.6 23.7 27.8 26.4 12.8 4.5 1.2 72.7Not stated (9%) 492.1 3.0 16.4 22.3 28.1 18.4 8.6 3.1 80.5
Vic
Group 1 545.3 1.0 2.5 10.2 27.7 31.7 19.3 7.7 96.5Group 2 526.2 1.3 4.6 15.5 32.4 28.4 13.8 4.1 94.2Group 3 510.3 1.7 7.3 20.3 34.8 24.2 9.1 2.5 91.0Group 4 496.2 3.1 11.5 24.2 32.9 19.6 6.7 1.8 85.4Not in paid work 480.8 7.9 16.7 26.0 28.3 15.2 4.6 1.1 75.3Not stated (5%) 534.5 2.3 5.6 13.0 27.0 27.9 16.9 7.3 92.0
Qld
Group 1 537.5 0.8 4.5 13.7 27.3 29.1 16.7 7.9 94.7Group 2 517.2 1.2 7.8 18.7 31.3 25.0 11.6 4.5 91.0Group 3 499.6 1.6 12.0 22.8 32.1 21.1 8.1 2.3 86.4Group 4 479.4 2.7 19.6 26.2 29.4 15.4 5.4 1.2 77.7Not in paid work 464.8 5.0 26.4 25.2 25.0 12.7 4.4 1.4 68.6Not stated (15%) 485.8 3.4 18.4 23.0 28.6 17.6 7.0 2.1 78.2
WA
Group 1 543.8 0.7 3.3 11.2 26.5 31.5 19.0 7.9 96.1Group 2 525.9 0.9 4.8 16.2 31.7 28.6 13.2 4.6 94.3Group 3 511.4 1.0 7.2 20.4 34.0 24.9 10.2 2.4 91.8Group 4 494.2 1.3 13.5 24.2 31.0 21.3 6.7 2.0 85.2Not in paid work 470.4 2.7 23.1 26.0 26.5 14.9 5.4 1.5 74.2Not stated (23%) 491.1 2.1 16.2 21.8 28.3 20.5 8.6 2.6 81.8
SA
Group 1 539.0 0.8 3.9 12.5 28.6 29.2 17.0 8.0 95.3Group 2 521.9 0.9 5.9 17.1 32.6 26.7 12.4 4.4 93.3Group 3 507.6 1.0 7.8 22.8 33.6 23.4 8.9 2.5 91.2Group 4 490.6 2.0 13.7 24.6 32.5 19.7 6.0 1.6 84.3Not in paid work 473.4 3.8 21.3 24.2 29.4 14.4 5.4 1.4 74.9Not stated (20%) 488.6 4.3 16.9 22.4 27.9 18.4 7.6 2.5 78.8
KeyGroup 1: Senior management and qualified professionalsGroup 2: Other business managers and associate professionalsGroup 3: Tradespeople, clerks, skilled office, sales and service staffGroup 4: Machine operators, hospitality staff, assistants, labourersNot in paid work: Not in paid work in the previous 12 monthsNot stated: No data was provided for parental occupation at the time of student enrolment. The higher the percentage of missing data, the less informative are the results for the other categories.
Refer to the introduction for explanatory notes.
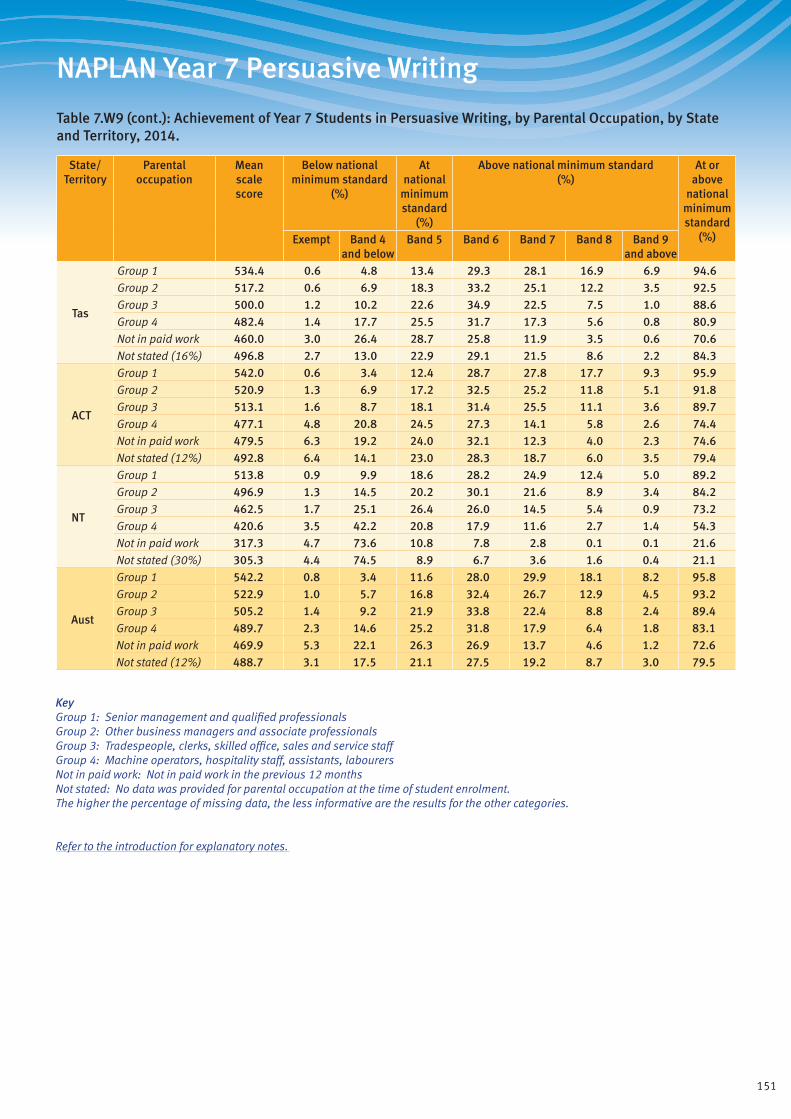
151
NAPLAN Year 7 Persuasive Writing
Table 7.W9 (cont.): Achievement of Year 7 Students in Persuasive Writing, by Parental Occupation, by State and Territory, 2014.
State/ Territory
Parental occupation
Mean scale score
Below national minimum standard
(%)
At national
minimum standard
(%)
Above national minimum standard (%)
At or above
national minimum standard
(%)Exempt Band 4 and below
Band 5 Band 6 Band 7 Band 8 Band 9 and above
Tas
Group 1 534.4 0.6 4.8 13.4 29.3 28.1 16.9 6.9 94.6Group 2 517.2 0.6 6.9 18.3 33.2 25.1 12.2 3.5 92.5Group 3 500.0 1.2 10.2 22.6 34.9 22.5 7.5 1.0 88.6Group 4 482.4 1.4 17.7 25.5 31.7 17.3 5.6 0.8 80.9Not in paid work 460.0 3.0 26.4 28.7 25.8 11.9 3.5 0.6 70.6Not stated (16%) 496.8 2.7 13.0 22.9 29.1 21.5 8.6 2.2 84.3
ACT
Group 1 542.0 0.6 3.4 12.4 28.7 27.8 17.7 9.3 95.9Group 2 520.9 1.3 6.9 17.2 32.5 25.2 11.8 5.1 91.8Group 3 513.1 1.6 8.7 18.1 31.4 25.5 11.1 3.6 89.7Group 4 477.1 4.8 20.8 24.5 27.3 14.1 5.8 2.6 74.4Not in paid work 479.5 6.3 19.2 24.0 32.1 12.3 4.0 2.3 74.6Not stated (12%) 492.8 6.4 14.1 23.0 28.3 18.7 6.0 3.5 79.4
NT
Group 1 513.8 0.9 9.9 18.6 28.2 24.9 12.4 5.0 89.2Group 2 496.9 1.3 14.5 20.2 30.1 21.6 8.9 3.4 84.2Group 3 462.5 1.7 25.1 26.4 26.0 14.5 5.4 0.9 73.2Group 4 420.6 3.5 42.2 20.8 17.9 11.6 2.7 1.4 54.3Not in paid work 317.3 4.7 73.6 10.8 7.8 2.8 0.1 0.1 21.6Not stated (30%) 305.3 4.4 74.5 8.9 6.7 3.6 1.6 0.4 21.1
Aust
Group 1 542.2 0.8 3.4 11.6 28.0 29.9 18.1 8.2 95.8Group 2 522.9 1.0 5.7 16.8 32.4 26.7 12.9 4.5 93.2Group 3 505.2 1.4 9.2 21.9 33.8 22.4 8.8 2.4 89.4Group 4 489.7 2.3 14.6 25.2 31.8 17.9 6.4 1.8 83.1Not in paid work 469.9 5.3 22.1 26.3 26.9 13.7 4.6 1.2 72.6Not stated (12%) 488.7 3.1 17.5 21.1 27.5 19.2 8.7 3.0 79.5
KeyGroup 1: Senior management and qualified professionalsGroup 2: Other business managers and associate professionalsGroup 3: Tradespeople, clerks, skilled office, sales and service staffGroup 4: Machine operators, hospitality staff, assistants, labourersNot in paid work: Not in paid work in the previous 12 monthsNot stated: No data was provided for parental occupation at the time of student enrolment. The higher the percentage of missing data, the less informative are the results for the other categories.
Refer to the introduction for explanatory notes.
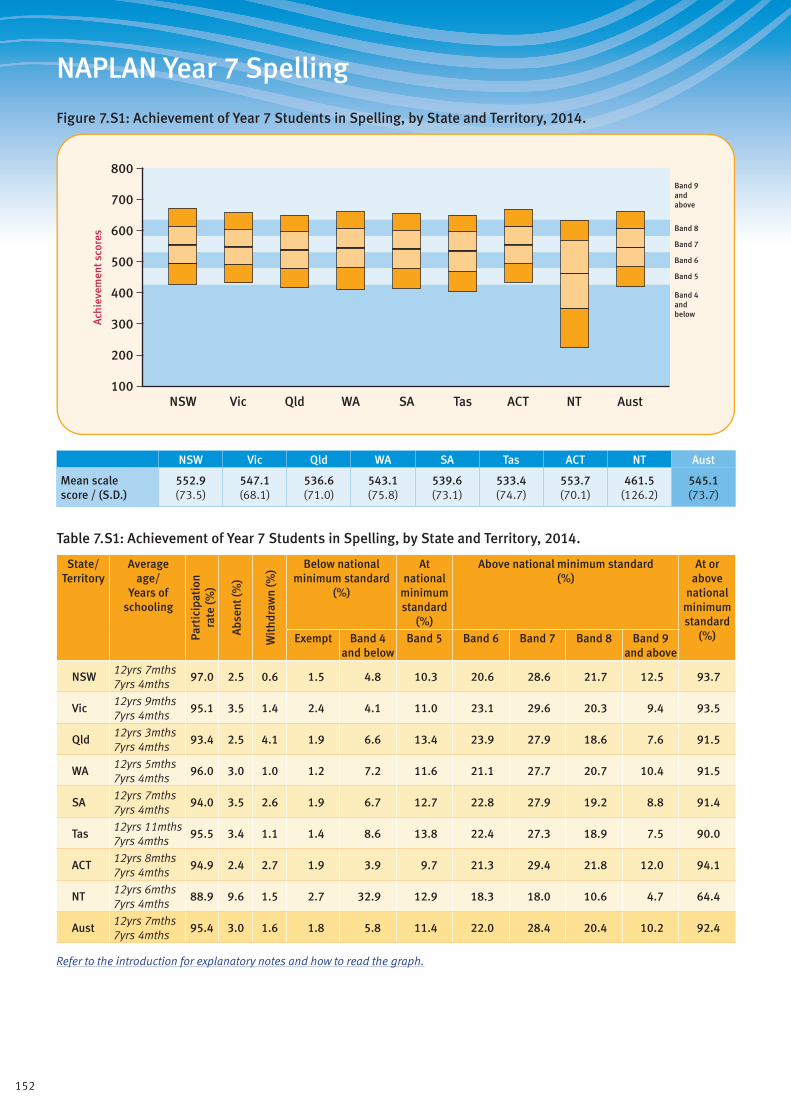
152
NAPLAN Year 7 Spelling
Figure 7.S1: Achievement of Year 7 Students in Spelling, by State and Territory, 2014.
Band 4andbelow
Band 5
Band 6
Band 7
Band 8
Band 9andabove
800
700
500
600
400
300
100
200
Ach
ieve
men
t sco
res
ACTQld SAWA TasVicNSW NT Aust
NSW Vic Qld WA SA Tas ACT NT Aust
Mean scale score / (S.D.)
552.9 (73.5)
547.1 (68.1)
536.6 (71.0)
543.1 (75.8)
539.6 (73.1)
533.4 (74.7)
553.7 (70.1)
461.5 (126.2)
545.1 (73.7)
Table 7.S1: Achievement of Year 7 Students in Spelling, by State and Territory, 2014.
State/ Territory
Average age/
Years of schooling
Part
icip
atio
nra
te (%
)
Abs
ent (
%)
Wit
hdra
wn
(%) Below national
minimum standard (%)
At national
minimum standard
(%)
Above national minimum standard (%)
At or above
national minimum standard
(%)Exempt Band 4 and below
Band 5 Band 6 Band 7 Band 8 Band 9 and above
NSW12yrs 7mths 7yrs 4mths
97.0 2.5 0.6 1.5 4.8 10.3 20.6 28.6 21.7 12.5 93.7
Vic12yrs 9mths 7yrs 4mths
95.1 3.5 1.4 2.4 4.1 11.0 23.1 29.6 20.3 9.4 93.5
Qld12yrs 3mths 7yrs 4mths
93.4 2.5 4.1 1.9 6.6 13.4 23.9 27.9 18.6 7.6 91.5
WA12yrs 5mths 7yrs 4mths
96.0 3.0 1.0 1.2 7.2 11.6 21.1 27.7 20.7 10.4 91.5
SA12yrs 7mths 7yrs 4mths
94.0 3.5 2.6 1.9 6.7 12.7 22.8 27.9 19.2 8.8 91.4
Tas12yrs 11mths 7yrs 4mths
95.5 3.4 1.1 1.4 8.6 13.8 22.4 27.3 18.9 7.5 90.0
ACT12yrs 8mths 7yrs 4mths
94.9 2.4 2.7 1.9 3.9 9.7 21.3 29.4 21.8 12.0 94.1
NT12yrs 6mths 7yrs 4mths
88.9 9.6 1.5 2.7 32.9 12.9 18.3 18.0 10.6 4.7 64.4
Aust12yrs 7mths 7yrs 4mths
95.4 3.0 1.6 1.8 5.8 11.4 22.0 28.4 20.4 10.2 92.4
Refer to the introduction for explanatory notes and how to read the graph.
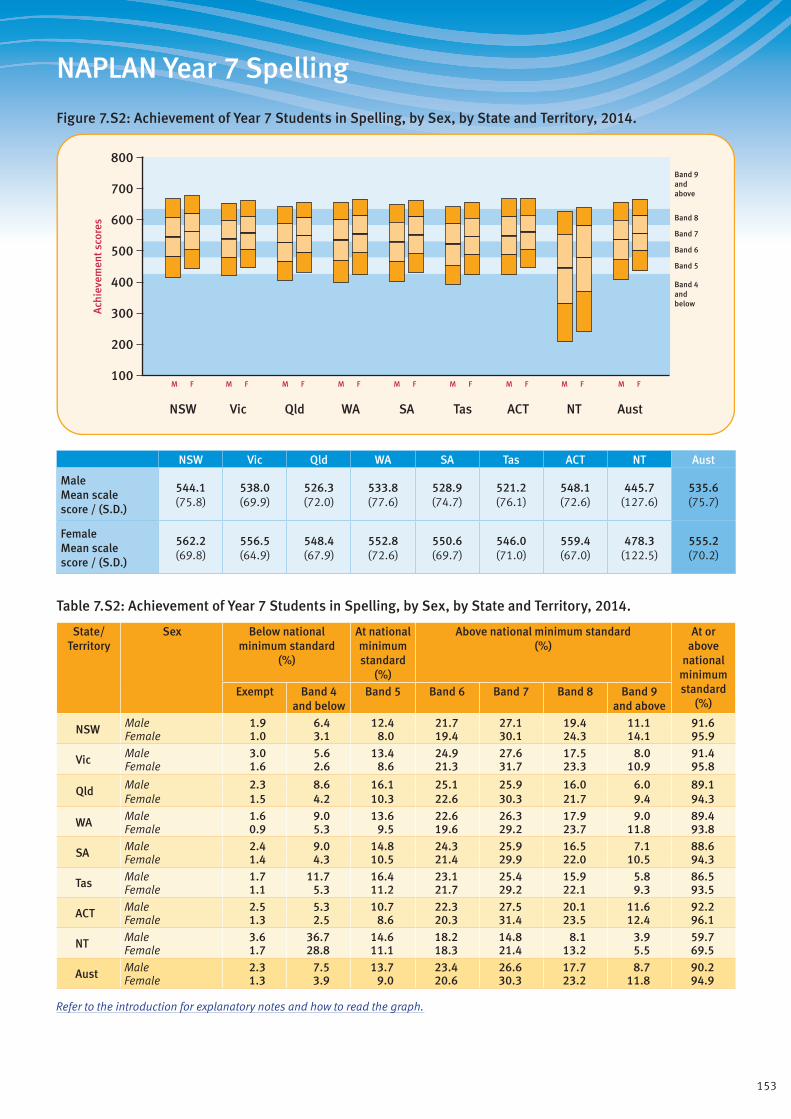
153
NAPLAN Year 7 Spelling
Figure 7.S2: Achievement of Year 7 Students in Spelling, by Sex, by State and Territory, 2014.
Band 4andbelow
Band 5
Band 6
Band 7
Band 8
Band 9andabove
ACTQld SAWA TasVicNSW NT Aust
M F M F M F M F M F M F M F M F M F
800
700
500
600
400
300
100
200
Ach
ieve
men
t sco
res
NSW Vic Qld WA SA Tas ACT NT Aust
Male Mean scale score / (S.D.)
544.1 (75.8)
538.0 (69.9)
526.3 (72.0)
533.8 (77.6)
528.9 (74.7)
521.2 (76.1)
548.1 (72.6)
445.7 (127.6)
535.6 (75.7)
Female Mean scale score / (S.D.)
562.2 (69.8)
556.5 (64.9)
548.4 (67.9)
552.8 (72.6)
550.6 (69.7)
546.0 (71.0)
559.4 (67.0)
478.3 (122.5)
555.2 (70.2)
Table 7.S2: Achievement of Year 7 Students in Spelling, by Sex, by State and Territory, 2014.
State/ Territory
Sex Below national minimum standard
(%)
At national minimum standard
(%)
Above national minimum standard (%)
At or above
national minimum standard
(%)Exempt Band 4
and belowBand 5 Band 6 Band 7 Band 8 Band 9
and above
NSW Male 1.9 6.4 12.4 21.7 27.1 19.4 11.1 91.6Female 1.0 3.1 8.0 19.4 30.1 24.3 14.1 95.9
Vic Male 3.0 5.6 13.4 24.9 27.6 17.5 8.0 91.4Female 1.6 2.6 8.6 21.3 31.7 23.3 10.9 95.8
Qld Male 2.3 8.6 16.1 25.1 25.9 16.0 6.0 89.1Female 1.5 4.2 10.3 22.6 30.3 21.7 9.4 94.3
WA Male 1.6 9.0 13.6 22.6 26.3 17.9 9.0 89.4Female 0.9 5.3 9.5 19.6 29.2 23.7 11.8 93.8
SA Male 2.4 9.0 14.8 24.3 25.9 16.5 7.1 88.6Female 1.4 4.3 10.5 21.4 29.9 22.0 10.5 94.3
Tas Male 1.7 11.7 16.4 23.1 25.4 15.9 5.8 86.5Female 1.1 5.3 11.2 21.7 29.2 22.1 9.3 93.5
ACT Male 2.5 5.3 10.7 22.3 27.5 20.1 11.6 92.2Female 1.3 2.5 8.6 20.3 31.4 23.5 12.4 96.1
NT Male 3.6 36.7 14.6 18.2 14.8 8.1 3.9 59.7Female 1.7 28.8 11.1 18.3 21.4 13.2 5.5 69.5
Aust Male 2.3 7.5 13.7 23.4 26.6 17.7 8.7 90.2Female 1.3 3.9 9.0 20.6 30.3 23.2 11.8 94.9
Refer to the introduction for explanatory notes and how to read the graph.
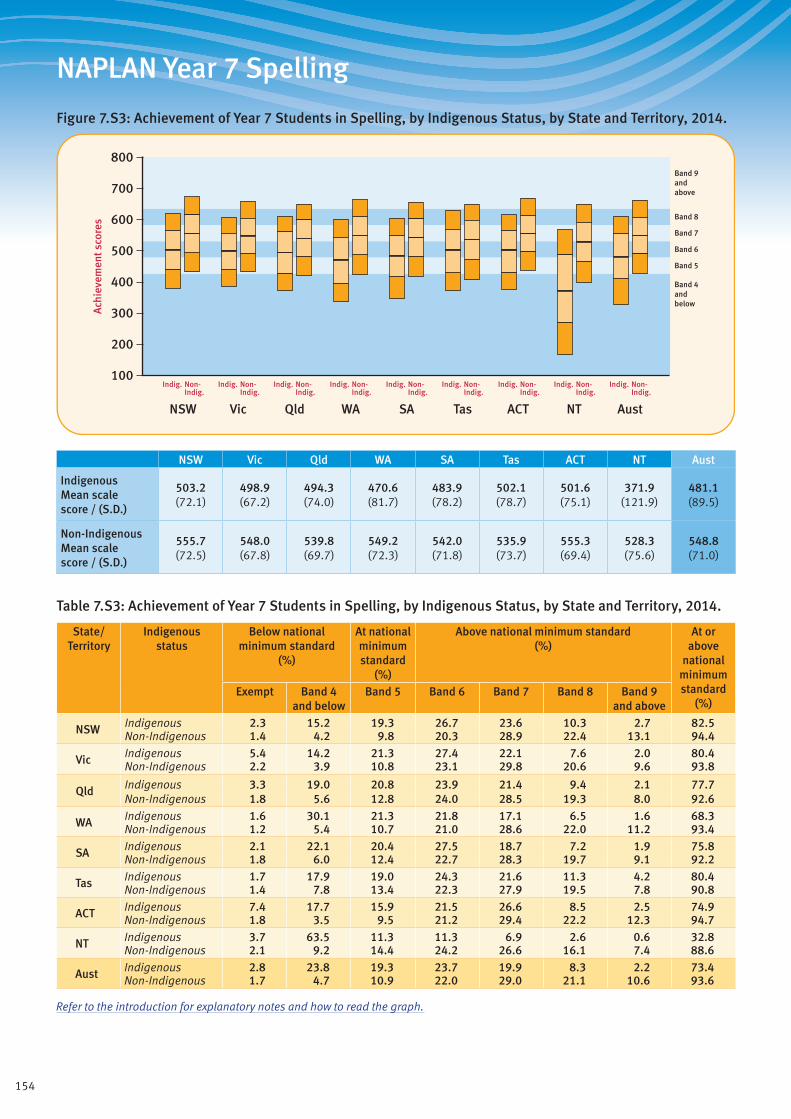
154
NAPLAN Year 7 Spelling
Figure 7.S3: Achievement of Year 7 Students in Spelling, by Indigenous Status, by State and Territory, 2014.
Band 4andbelow
Band 5
Band 6
Band 7
Band 8
Band 9andabove
ACTQld SAWA TasVicNSW NT Aust
800
700
500
600
400
300
100
200
Ach
ieve
men
t sco
res
Indig. Non-Indig.
Indig. Non-Indig.
Indig. Non-Indig.
Indig. Non-Indig.
Indig. Non-Indig.
Indig. Non-Indig.
Indig. Non-Indig.
Indig. Non-Indig.
Indig. Non-Indig.
NSW Vic Qld WA SA Tas ACT NT Aust
Indigenous Mean scale score / (S.D.)
503.2 (72.1)
498.9 (67.2)
494.3 (74.0)
470.6 (81.7)
483.9 (78.2)
502.1 (78.7)
501.6 (75.1)
371.9 (121.9)
481.1 (89.5)
Non-Indigenous Mean scale score / (S.D.)
555.7 (72.5)
548.0 (67.8)
539.8 (69.7)
549.2 (72.3)
542.0 (71.8)
535.9 (73.7)
555.3 (69.4)
528.3 (75.6)
548.8 (71.0)
Table 7.S3: Achievement of Year 7 Students in Spelling, by Indigenous Status, by State and Territory, 2014.
State/ Territory
Indigenous status
Below national minimum standard
(%)
At national minimum standard
(%)
Above national minimum standard (%)
At or above
national minimum standard
(%)Exempt Band 4
and belowBand 5 Band 6 Band 7 Band 8 Band 9
and above
NSW Indigenous 2.3 15.2 19.3 26.7 23.6 10.3 2.7 82.5Non-Indigenous 1.4 4.2 9.8 20.3 28.9 22.4 13.1 94.4
Vic Indigenous 5.4 14.2 21.3 27.4 22.1 7.6 2.0 80.4Non-Indigenous 2.2 3.9 10.8 23.1 29.8 20.6 9.6 93.8
Qld Indigenous 3.3 19.0 20.8 23.9 21.4 9.4 2.1 77.7Non-Indigenous 1.8 5.6 12.8 24.0 28.5 19.3 8.0 92.6
WA Indigenous 1.6 30.1 21.3 21.8 17.1 6.5 1.6 68.3Non-Indigenous 1.2 5.4 10.7 21.0 28.6 22.0 11.2 93.4
SA Indigenous 2.1 22.1 20.4 27.5 18.7 7.2 1.9 75.8Non-Indigenous 1.8 6.0 12.4 22.7 28.3 19.7 9.1 92.2
Tas Indigenous 1.7 17.9 19.0 24.3 21.6 11.3 4.2 80.4Non-Indigenous 1.4 7.8 13.4 22.3 27.9 19.5 7.8 90.8
ACT Indigenous 7.4 17.7 15.9 21.5 26.6 8.5 2.5 74.9Non-Indigenous 1.8 3.5 9.5 21.2 29.4 22.2 12.3 94.7
NT Indigenous 3.7 63.5 11.3 11.3 6.9 2.6 0.6 32.8Non-Indigenous 2.1 9.2 14.4 24.2 26.6 16.1 7.4 88.6
Aust Indigenous 2.8 23.8 19.3 23.7 19.9 8.3 2.2 73.4Non-Indigenous 1.7 4.7 10.9 22.0 29.0 21.1 10.6 93.6
Refer to the introduction for explanatory notes and how to read the graph.
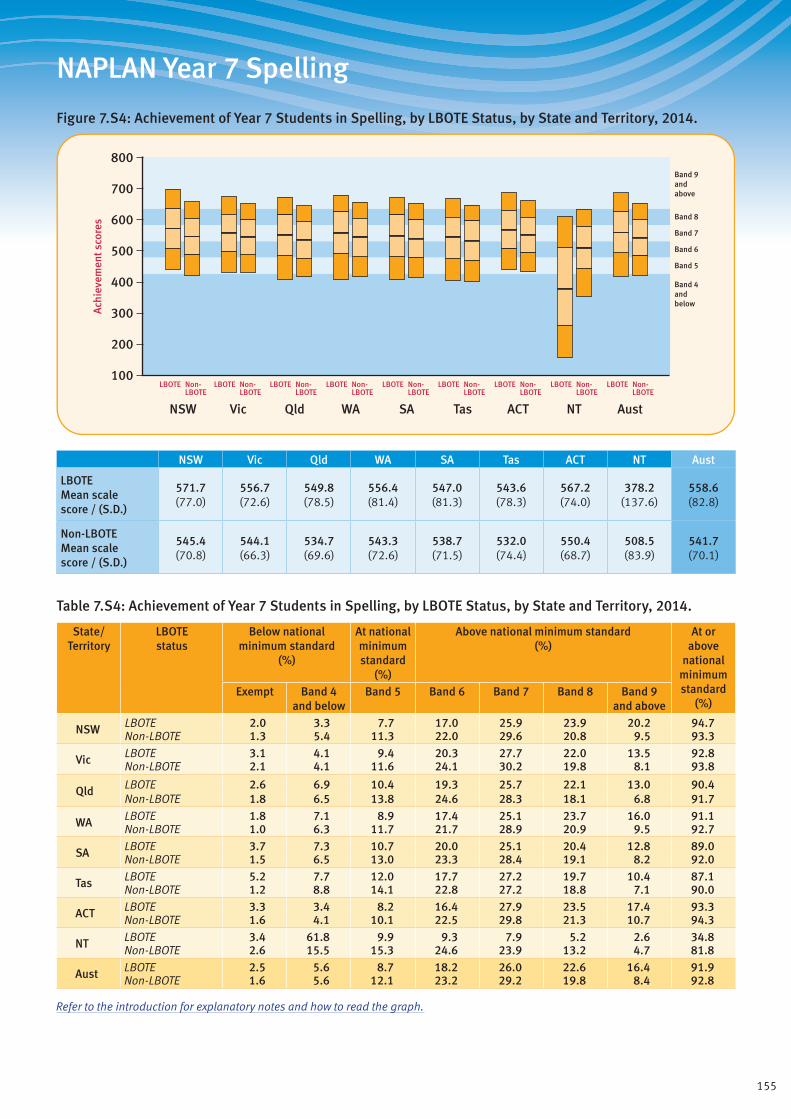
155
NAPLAN Year 7 Spelling
Figure 7.S4: Achievement of Year 7 Students in Spelling, by LBOTE Status, by State and Territory, 2014.
Band 4andbelow
Band 5
Band 6
Band 7
Band 8
Band 9andabove
ACTQld SAWA TasVicNSW NT Aust
800
700
500
600
400
300
100
200
Ach
ieve
men
t sco
res
LBOTE Non-LBOTE
LBOTE Non-LBOTE
LBOTE Non-LBOTE
LBOTE Non-LBOTE
LBOTE Non-LBOTE
LBOTE Non-LBOTE
LBOTE Non-LBOTE
LBOTE Non-LBOTE
LBOTE Non-LBOTE
NSW Vic Qld WA SA Tas ACT NT Aust
LBOTE Mean scale score / (S.D.)
571.7 (77.0)
556.7 (72.6)
549.8 (78.5)
556.4 (81.4)
547.0 (81.3)
543.6 (78.3)
567.2 (74.0)
378.2 (137.6)
558.6 (82.8)
Non-LBOTE Mean scale score / (S.D.)
545.4 (70.8)
544.1 (66.3)
534.7 (69.6)
543.3 (72.6)
538.7 (71.5)
532.0 (74.4)
550.4 (68.7)
508.5 (83.9)
541.7 (70.1)
Table 7.S4: Achievement of Year 7 Students in Spelling, by LBOTE Status, by State and Territory, 2014.
State/ Territory
LBOTE status
Below national minimum standard
(%)
At national minimum standard
(%)
Above national minimum standard (%)
At or above
national minimum standard
(%)Exempt Band 4
and belowBand 5 Band 6 Band 7 Band 8 Band 9
and above
NSW LBOTE 2.0 3.3 7.7 17.0 25.9 23.9 20.2 94.7Non-LBOTE 1.3 5.4 11.3 22.0 29.6 20.8 9.5 93.3
Vic LBOTE 3.1 4.1 9.4 20.3 27.7 22.0 13.5 92.8Non-LBOTE 2.1 4.1 11.6 24.1 30.2 19.8 8.1 93.8
Qld LBOTE 2.6 6.9 10.4 19.3 25.7 22.1 13.0 90.4Non-LBOTE 1.8 6.5 13.8 24.6 28.3 18.1 6.8 91.7
WA LBOTE 1.8 7.1 8.9 17.4 25.1 23.7 16.0 91.1Non-LBOTE 1.0 6.3 11.7 21.7 28.9 20.9 9.5 92.7
SA LBOTE 3.7 7.3 10.7 20.0 25.1 20.4 12.8 89.0Non-LBOTE 1.5 6.5 13.0 23.3 28.4 19.1 8.2 92.0
Tas LBOTE 5.2 7.7 12.0 17.7 27.2 19.7 10.4 87.1Non-LBOTE 1.2 8.8 14.1 22.8 27.2 18.8 7.1 90.0
ACT LBOTE 3.3 3.4 8.2 16.4 27.9 23.5 17.4 93.3Non-LBOTE 1.6 4.1 10.1 22.5 29.8 21.3 10.7 94.3
NT LBOTE 3.4 61.8 9.9 9.3 7.9 5.2 2.6 34.8Non-LBOTE 2.6 15.5 15.3 24.6 23.9 13.2 4.7 81.8
Aust LBOTE 2.5 5.6 8.7 18.2 26.0 22.6 16.4 91.9Non-LBOTE 1.6 5.6 12.1 23.2 29.2 19.8 8.4 92.8
Refer to the introduction for explanatory notes and how to read the graph.
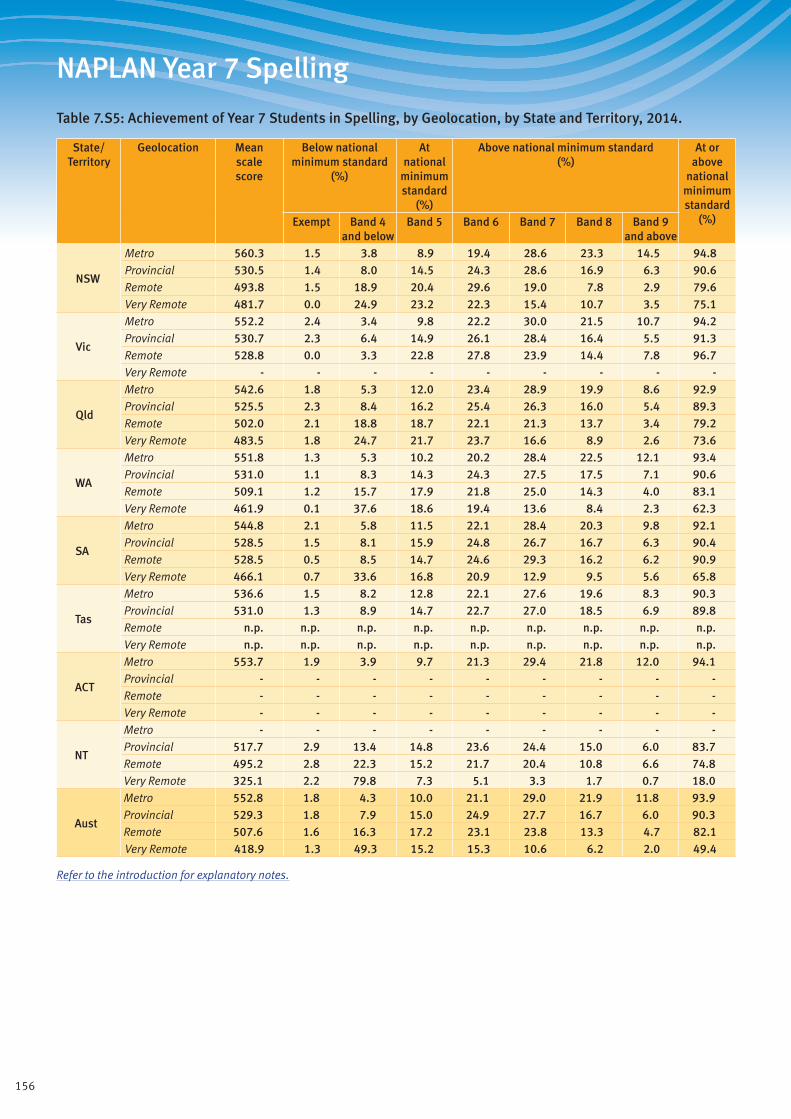
156
NAPLAN Year 7 Spelling
Table 7.S5: Achievement of Year 7 Students in Spelling, by Geolocation, by State and Territory, 2014.
State/ Territory
Geolocation Mean scale score
Below national minimum standard
(%)
At national
minimum standard
(%)
Above national minimum standard (%)
At or above
national minimum standard
(%)Exempt Band 4 and below
Band 5 Band 6 Band 7 Band 8 Band 9 and above
NSW
Metro 560.3 1.5 3.8 8.9 19.4 28.6 23.3 14.5 94.8Provincial 530.5 1.4 8.0 14.5 24.3 28.6 16.9 6.3 90.6Remote 493.8 1.5 18.9 20.4 29.6 19.0 7.8 2.9 79.6Very Remote 481.7 0.0 24.9 23.2 22.3 15.4 10.7 3.5 75.1
Vic
Metro 552.2 2.4 3.4 9.8 22.2 30.0 21.5 10.7 94.2Provincial 530.7 2.3 6.4 14.9 26.1 28.4 16.4 5.5 91.3Remote 528.8 0.0 3.3 22.8 27.8 23.9 14.4 7.8 96.7Very Remote - - - - - - - - -
Qld
Metro 542.6 1.8 5.3 12.0 23.4 28.9 19.9 8.6 92.9Provincial 525.5 2.3 8.4 16.2 25.4 26.3 16.0 5.4 89.3Remote 502.0 2.1 18.8 18.7 22.1 21.3 13.7 3.4 79.2Very Remote 483.5 1.8 24.7 21.7 23.7 16.6 8.9 2.6 73.6
WA
Metro 551.8 1.3 5.3 10.2 20.2 28.4 22.5 12.1 93.4Provincial 531.0 1.1 8.3 14.3 24.3 27.5 17.5 7.1 90.6Remote 509.1 1.2 15.7 17.9 21.8 25.0 14.3 4.0 83.1Very Remote 461.9 0.1 37.6 18.6 19.4 13.6 8.4 2.3 62.3
SA
Metro 544.8 2.1 5.8 11.5 22.1 28.4 20.3 9.8 92.1Provincial 528.5 1.5 8.1 15.9 24.8 26.7 16.7 6.3 90.4Remote 528.5 0.5 8.5 14.7 24.6 29.3 16.2 6.2 90.9Very Remote 466.1 0.7 33.6 16.8 20.9 12.9 9.5 5.6 65.8
Tas
Metro 536.6 1.5 8.2 12.8 22.1 27.6 19.6 8.3 90.3Provincial 531.0 1.3 8.9 14.7 22.7 27.0 18.5 6.9 89.8Remote n.p. n.p. n.p. n.p. n.p. n.p. n.p. n.p. n.p.Very Remote n.p. n.p. n.p. n.p. n.p. n.p. n.p. n.p. n.p.
ACT
Metro 553.7 1.9 3.9 9.7 21.3 29.4 21.8 12.0 94.1Provincial - - - - - - - - -Remote - - - - - - - - -Very Remote - - - - - - - - -
NT
Metro - - - - - - - - -Provincial 517.7 2.9 13.4 14.8 23.6 24.4 15.0 6.0 83.7Remote 495.2 2.8 22.3 15.2 21.7 20.4 10.8 6.6 74.8Very Remote 325.1 2.2 79.8 7.3 5.1 3.3 1.7 0.7 18.0
Aust
Metro 552.8 1.8 4.3 10.0 21.1 29.0 21.9 11.8 93.9Provincial 529.3 1.8 7.9 15.0 24.9 27.7 16.7 6.0 90.3Remote 507.6 1.6 16.3 17.2 23.1 23.8 13.3 4.7 82.1Very Remote 418.9 1.3 49.3 15.2 15.3 10.6 6.2 2.0 49.4
Refer to the introduction for explanatory notes.

157
NAPLAN Year 7 Spelling
Table 7.S6: Achievement of Year 7 Indigenous Students in Spelling, by Geolocation, by State and Territory, 2014.
State/ Territory
Geolocation Mean scale score
Below national minimum standard
(%)
At national
minimum standard
(%)
Above national minimum standard (%)
At or above
national minimum standard
(%)Exempt Band 4 and below
Band 5 Band 6 Band 7 Band 8 Band 9 and above
NSW
Metro 514.2 2.5 11.8 16.7 26.5 26.3 12.4 3.8 85.7Provincial 495.4 2.3 17.5 21.1 26.7 21.9 8.6 1.9 80.2Remote 471.9 1.5 25.1 27.1 30.7 9.9 5.0 0.8 73.4Very Remote 444.9 0.0 37.1 28.6 21.7 9.7 2.9 0.0 62.9
Vic
Metro 505.2 5.7 13.0 18.5 27.0 24.0 9.2 2.5 81.3Provincial 492.7 5.0 15.4 24.1 27.7 20.2 5.9 1.6 79.6Remote n.p. n.p. n.p. n.p. n.p. n.p. n.p. n.p. n.p.Very Remote - - - - - - - - -
Qld
Metro 501.5 3.4 15.3 20.4 25.3 23.4 10.2 2.0 81.3Provincial 500.1 3.5 16.2 20.8 24.6 22.2 9.9 2.9 80.3Remote 450.2 3.0 41.2 22.8 15.0 11.0 6.6 0.4 55.7Very Remote 465.4 2.6 33.4 21.3 20.3 15.4 5.9 1.1 64.0
WA
Metro 494.6 1.9 19.1 21.3 23.9 21.9 9.0 2.9 79.1Provincial 483.9 2.4 21.6 21.4 26.2 20.1 7.0 1.2 75.9Remote 465.3 1.9 32.8 23.0 18.9 15.9 6.1 1.3 65.2Very Remote 424.5 0.2 53.8 20.0 16.3 7.4 2.3 0.0 46.0
SA
Metro 492.6 2.3 18.5 18.7 29.7 21.8 7.2 1.7 79.2Provincial 491.5 2.8 17.5 25.7 26.2 16.6 8.4 2.8 79.7Remote 494.1 0.0 13.9 18.8 38.8 21.8 6.1 0.6 86.1Very Remote 408.8 0.0 60.3 12.1 15.3 8.2 3.3 0.8 39.7
Tas
Metro 495.4 1.5 18.3 21.3 26.6 19.8 9.5 3.0 80.2Provincial 506.0 1.8 18.1 17.6 22.6 22.4 12.4 5.1 80.1Remote n.p. n.p. n.p. n.p. n.p. n.p. n.p. n.p. n.p.Very Remote n.p. n.p. n.p. n.p. n.p. n.p. n.p. n.p. n.p.
ACT
Metro 501.6 7.4 17.7 15.9 21.5 26.6 8.5 2.5 74.9Provincial - - - - - - - - -Remote - - - - - - - - -Very Remote - - - - - - - - -
NT
Metro - - - - - - - - -Provincial 474.7 6.5 28.4 15.7 22.4 17.6 8.0 1.4 65.0Remote 436.4 4.8 42.0 19.7 19.5 10.0 2.7 1.3 53.2Very Remote 306.2 2.0 86.7 6.3 3.5 1.2 0.3 0.1 11.3
Aust
Metro 505.1 3.0 14.6 18.7 26.0 24.2 10.6 2.9 82.4Provincial 494.1 3.1 18.2 21.1 25.8 21.1 8.6 2.2 78.7Remote 456.8 2.8 35.1 22.3 20.7 12.9 5.1 1.1 62.1Very Remote 377.4 1.5 65.1 13.7 11.2 6.1 2.1 0.3 33.4
Refer to the introduction for explanatory notes.
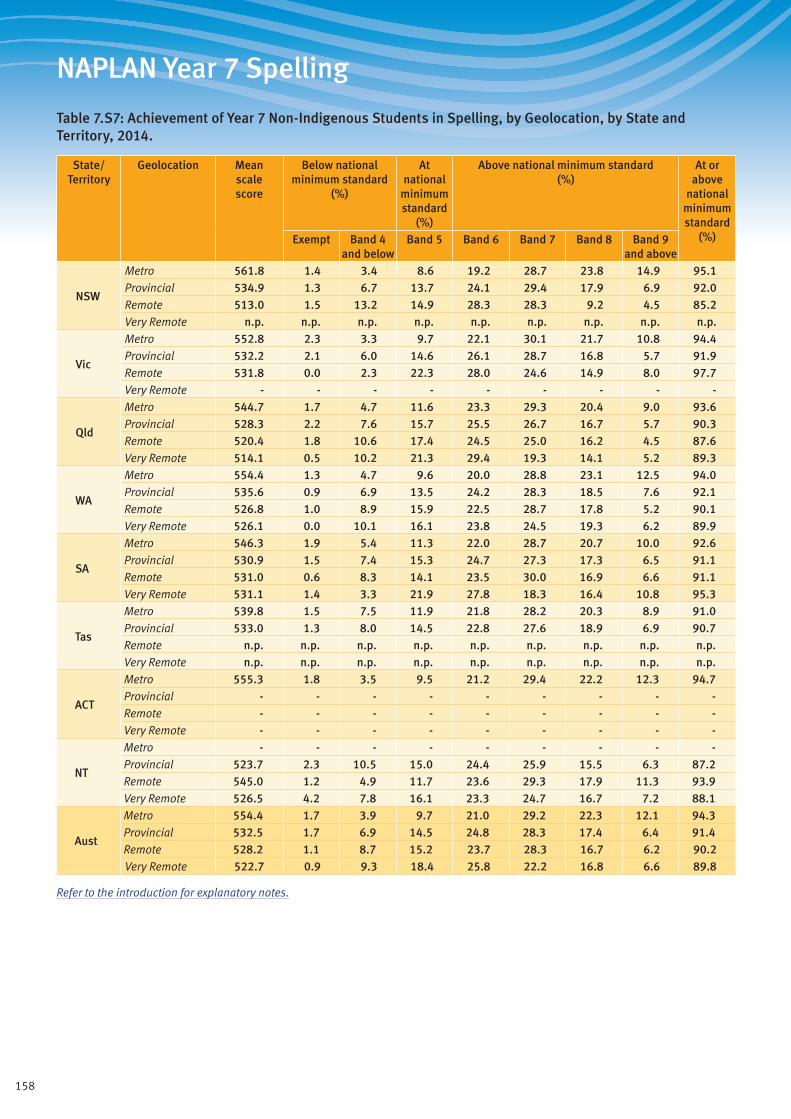
158
NAPLAN Year 7 Spelling
Table 7.S7: Achievement of Year 7 Non-Indigenous Students in Spelling, by Geolocation, by State and Territory, 2014.
State/ Territory
Geolocation Mean scale score
Below national minimum standard
(%)
At national
minimum standard
(%)
Above national minimum standard (%)
At or above
national minimum standard
(%)Exempt Band 4 and below
Band 5 Band 6 Band 7 Band 8 Band 9 and above
NSW
Metro 561.8 1.4 3.4 8.6 19.2 28.7 23.8 14.9 95.1Provincial 534.9 1.3 6.7 13.7 24.1 29.4 17.9 6.9 92.0Remote 513.0 1.5 13.2 14.9 28.3 28.3 9.2 4.5 85.2Very Remote n.p. n.p. n.p. n.p. n.p. n.p. n.p. n.p. n.p.
Vic
Metro 552.8 2.3 3.3 9.7 22.1 30.1 21.7 10.8 94.4Provincial 532.2 2.1 6.0 14.6 26.1 28.7 16.8 5.7 91.9Remote 531.8 0.0 2.3 22.3 28.0 24.6 14.9 8.0 97.7Very Remote - - - - - - - - -
Qld
Metro 544.7 1.7 4.7 11.6 23.3 29.3 20.4 9.0 93.6Provincial 528.3 2.2 7.6 15.7 25.5 26.7 16.7 5.7 90.3Remote 520.4 1.8 10.6 17.4 24.5 25.0 16.2 4.5 87.6Very Remote 514.1 0.5 10.2 21.3 29.4 19.3 14.1 5.2 89.3
WA
Metro 554.4 1.3 4.7 9.6 20.0 28.8 23.1 12.5 94.0Provincial 535.6 0.9 6.9 13.5 24.2 28.3 18.5 7.6 92.1Remote 526.8 1.0 8.9 15.9 22.5 28.7 17.8 5.2 90.1Very Remote 526.1 0.0 10.1 16.1 23.8 24.5 19.3 6.2 89.9
SA
Metro 546.3 1.9 5.4 11.3 22.0 28.7 20.7 10.0 92.6Provincial 530.9 1.5 7.4 15.3 24.7 27.3 17.3 6.5 91.1Remote 531.0 0.6 8.3 14.1 23.5 30.0 16.9 6.6 91.1Very Remote 531.1 1.4 3.3 21.9 27.8 18.3 16.4 10.8 95.3
Tas
Metro 539.8 1.5 7.5 11.9 21.8 28.2 20.3 8.9 91.0Provincial 533.0 1.3 8.0 14.5 22.8 27.6 18.9 6.9 90.7Remote n.p. n.p. n.p. n.p. n.p. n.p. n.p. n.p. n.p.Very Remote n.p. n.p. n.p. n.p. n.p. n.p. n.p. n.p. n.p.
ACT
Metro 555.3 1.8 3.5 9.5 21.2 29.4 22.2 12.3 94.7Provincial - - - - - - - - -Remote - - - - - - - - -Very Remote - - - - - - - - -
NT
Metro - - - - - - - - -Provincial 523.7 2.3 10.5 15.0 24.4 25.9 15.5 6.3 87.2Remote 545.0 1.2 4.9 11.7 23.6 29.3 17.9 11.3 93.9Very Remote 526.5 4.2 7.8 16.1 23.3 24.7 16.7 7.2 88.1
Aust
Metro 554.4 1.7 3.9 9.7 21.0 29.2 22.3 12.1 94.3Provincial 532.5 1.7 6.9 14.5 24.8 28.3 17.4 6.4 91.4Remote 528.2 1.1 8.7 15.2 23.7 28.3 16.7 6.2 90.2Very Remote 522.7 0.9 9.3 18.4 25.8 22.2 16.8 6.6 89.8
Refer to the introduction for explanatory notes.

159
NAPLAN Year 7 Spelling
Table 7.S8: Achievement of Year 7 Students in Spelling, by Parental Education, by State and Territory, 2014.
State/ Territory
Parental education
Mean scale score
Below national minimum standard
(%)
At national
minimum standard
(%)
Above national minimum standard (%)
At or above
national minimum standard
(%)Exempt Band 4 and below
Band 5 Band 6 Band 7 Band 8 Band 9 and above
NSW
Bachelor 583.3 1.0 1.5 5.1 14.7 26.8 28.6 22.3 97.5Diploma 554.2 1.1 3.5 9.1 21.4 31.4 22.7 10.9 95.5Certificate 535.8 1.3 6.0 13.4 24.5 30.6 17.9 6.4 92.7Year 12 544.8 1.8 4.9 11.5 23.0 29.6 20.1 9.0 93.3Year 11 511.8 3.2 12.2 18.3 25.9 24.9 11.7 3.8 84.6Not stated (6%) 541.7 2.3 7.7 11.7 21.0 27.8 19.4 10.1 90.0
Vic
Bachelor 569.8 1.3 1.5 6.6 17.8 30.5 26.7 15.6 97.2Diploma 543.6 1.9 3.5 11.5 24.8 31.4 19.8 7.1 94.6Certificate 531.1 2.2 5.5 14.3 27.6 29.3 16.2 4.8 92.3Year 12 541.3 2.7 4.6 11.9 24.7 30.4 18.3 7.5 92.7Year 11 516.9 6.0 9.4 16.8 27.0 25.3 12.1 3.4 84.7Not stated (5%) 561.4 2.4 3.7 8.3 19.4 28.5 21.9 15.7 93.9
Qld
Bachelor 564.1 1.0 2.1 8.1 19.3 29.8 25.3 14.4 97.0Diploma 540.6 1.4 4.6 12.1 25.2 30.1 19.5 7.1 94.0Certificate 526.6 1.6 7.3 15.6 26.8 27.9 16.5 4.4 91.1Year 12 528.3 2.5 7.4 14.9 26.1 27.6 16.3 5.2 90.1Year 11 501.9 3.9 15.2 19.9 25.9 22.6 10.4 2.1 81.0Not stated (12%) 527.0 3.3 9.2 15.2 23.6 26.3 16.2 6.3 87.5
WA
Bachelor 574.1 0.9 2.2 6.4 16.0 28.1 27.8 18.6 97.0Diploma 548.6 0.8 4.8 10.9 21.3 29.7 22.6 9.9 94.4Certificate 534.0 1.1 7.1 12.9 24.5 29.9 18.3 6.2 91.9Year 12 533.0 1.4 8.2 13.8 22.7 28.4 18.8 6.7 90.4Year 11 506.0 1.7 15.5 18.1 25.7 24.0 11.4 3.7 82.9Not stated (16%) 523.8 2.2 12.7 14.3 21.9 24.5 16.6 7.8 85.1
SA
Bachelor 568.2 0.8 2.1 7.7 17.4 30.2 25.8 16.0 97.1Diploma 542.0 1.1 5.1 11.6 24.1 30.7 19.5 7.9 93.8Certificate 530.9 1.3 7.2 14.6 25.5 28.0 17.3 5.9 91.4Year 12 536.0 2.2 6.3 13.9 24.4 27.2 18.5 7.5 91.5Year 11 506.5 3.9 13.4 19.3 26.6 22.8 10.7 3.3 82.7Not stated (13%) 530.1 3.8 10.0 12.9 22.5 25.6 18.1 7.2 86.2
KeyBachelor: Bachelor degree or aboveDiploma: Advanced diploma/diplomaCertificate: Certificate I to IVYear 12: Year 12 or equivalentYear 11: Year 11 or equivalent or belowNot stated: No data was provided for parental education at the time of student enrolment. The higher the percentage of missing data, the less informative are the results for the other categories.
Refer to the introduction for explanatory notes.
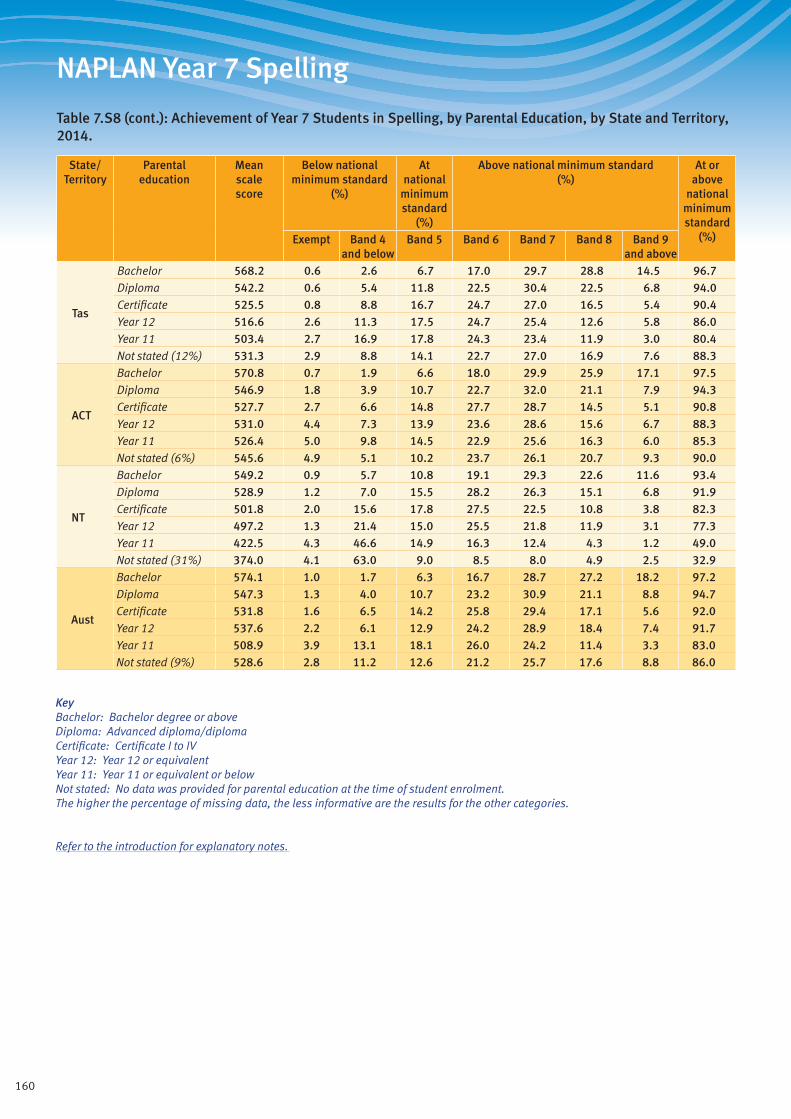
160
NAPLAN Year 7 Spelling
Table 7.S8 (cont.): Achievement of Year 7 Students in Spelling, by Parental Education, by State and Territory, 2014.
State/ Territory
Parental education
Mean scale score
Below national minimum standard
(%)
At national
minimum standard
(%)
Above national minimum standard (%)
At or above
national minimum standard
(%)Exempt Band 4 and below
Band 5 Band 6 Band 7 Band 8 Band 9 and above
Tas
Bachelor 568.2 0.6 2.6 6.7 17.0 29.7 28.8 14.5 96.7Diploma 542.2 0.6 5.4 11.8 22.5 30.4 22.5 6.8 94.0Certificate 525.5 0.8 8.8 16.7 24.7 27.0 16.5 5.4 90.4Year 12 516.6 2.6 11.3 17.5 24.7 25.4 12.6 5.8 86.0Year 11 503.4 2.7 16.9 17.8 24.3 23.4 11.9 3.0 80.4Not stated (12%) 531.3 2.9 8.8 14.1 22.7 27.0 16.9 7.6 88.3
ACT
Bachelor 570.8 0.7 1.9 6.6 18.0 29.9 25.9 17.1 97.5Diploma 546.9 1.8 3.9 10.7 22.7 32.0 21.1 7.9 94.3Certificate 527.7 2.7 6.6 14.8 27.7 28.7 14.5 5.1 90.8Year 12 531.0 4.4 7.3 13.9 23.6 28.6 15.6 6.7 88.3Year 11 526.4 5.0 9.8 14.5 22.9 25.6 16.3 6.0 85.3Not stated (6%) 545.6 4.9 5.1 10.2 23.7 26.1 20.7 9.3 90.0
NT
Bachelor 549.2 0.9 5.7 10.8 19.1 29.3 22.6 11.6 93.4Diploma 528.9 1.2 7.0 15.5 28.2 26.3 15.1 6.8 91.9Certificate 501.8 2.0 15.6 17.8 27.5 22.5 10.8 3.8 82.3Year 12 497.2 1.3 21.4 15.0 25.5 21.8 11.9 3.1 77.3Year 11 422.5 4.3 46.6 14.9 16.3 12.4 4.3 1.2 49.0Not stated (31%) 374.0 4.1 63.0 9.0 8.5 8.0 4.9 2.5 32.9
Aust
Bachelor 574.1 1.0 1.7 6.3 16.7 28.7 27.2 18.2 97.2Diploma 547.3 1.3 4.0 10.7 23.2 30.9 21.1 8.8 94.7Certificate 531.8 1.6 6.5 14.2 25.8 29.4 17.1 5.6 92.0Year 12 537.6 2.2 6.1 12.9 24.2 28.9 18.4 7.4 91.7Year 11 508.9 3.9 13.1 18.1 26.0 24.2 11.4 3.3 83.0Not stated (9%) 528.6 2.8 11.2 12.6 21.2 25.7 17.6 8.8 86.0
KeyBachelor: Bachelor degree or aboveDiploma: Advanced diploma/diplomaCertificate: Certificate I to IVYear 12: Year 12 or equivalentYear 11: Year 11 or equivalent or belowNot stated: No data was provided for parental education at the time of student enrolment. The higher the percentage of missing data, the less informative are the results for the other categories.
Refer to the introduction for explanatory notes.

161
NAPLAN Year 7 Spelling
Table 7.S9: Achievement of Year 7 Students in Spelling, by Parental Occupation, by State and Territory, 2014.
State/ Territory
Parental occupation
Mean scale score
Below national minimum standard
(%)
At national
minimum standard
(%)
Above national minimum standard (%)
At or above
national minimum standard
(%)Exempt Band 4 and below
Band 5 Band 6 Band 7 Band 8 Band 9 and above
NSW
Group 1 579.3 0.8 1.6 5.4 15.5 28.0 28.3 20.4 97.5Group 2 561.6 0.9 2.6 8.4 20.2 30.1 24.0 13.7 96.5Group 3 544.3 1.2 5.0 11.6 23.1 30.4 19.7 9.0 93.8Group 4 535.6 1.8 7.3 13.7 23.8 27.9 17.2 8.2 90.9Not in paid work 515.7 3.6 12.1 17.6 24.5 24.4 12.6 5.2 84.3Not stated (9%) 533.6 3.0 8.8 13.7 22.1 26.8 17.1 8.4 88.1
Vic
Group 1 569.5 1.0 1.5 6.6 18.1 31.0 26.5 15.4 97.6Group 2 552.0 1.3 2.7 9.9 22.8 31.6 22.2 9.5 96.0Group 3 540.2 1.7 4.1 12.4 25.7 30.7 18.7 6.7 94.2Group 4 530.8 3.1 6.5 14.4 26.6 27.7 15.8 5.9 90.4Not in paid work 515.9 8.0 9.9 16.7 26.2 23.5 11.8 3.9 82.1Not stated (5%) 562.0 2.3 3.7 8.3 19.7 28.2 21.4 16.4 94.0
Qld
Group 1 562.4 0.8 2.3 8.2 19.7 30.5 24.9 13.7 96.9Group 2 545.7 1.1 3.8 11.2 24.6 29.9 20.8 8.5 95.1Group 3 530.9 1.6 6.6 14.6 25.8 29.1 16.9 5.4 91.8Group 4 516.5 2.6 10.2 18.2 26.8 24.4 13.9 3.9 87.2Not in paid work 505.9 5.0 15.4 18.8 23.6 21.7 12.0 3.6 79.6Not stated (15%) 521.7 3.4 10.2 16.3 24.4 25.2 15.4 5.1 86.4
WA
Group 1 570.5 0.6 2.6 6.9 16.9 28.7 26.8 17.4 96.8Group 2 551.5 0.9 4.3 10.1 21.2 29.9 23.1 10.6 94.8Group 3 540.0 1.0 6.0 12.1 23.2 30.0 20.1 7.6 92.9Group 4 526.1 1.3 10.1 14.7 24.7 26.2 16.6 6.5 88.6Not in paid work 503.6 2.7 17.6 19.4 22.8 20.8 11.7 5.1 79.7Not stated (23%) 523.9 2.1 12.2 14.6 22.3 25.0 16.2 7.6 85.7
SA
Group 1 564.0 0.8 2.8 8.0 18.7 30.0 24.8 14.9 96.4Group 2 549.4 0.8 3.7 11.0 22.7 30.2 22.0 9.5 95.5Group 3 539.8 1.0 5.8 12.8 23.7 29.4 19.6 7.8 93.2Group 4 525.5 2.0 7.9 16.7 25.7 26.7 15.5 5.4 90.1Not in paid work 508.4 3.8 13.6 18.5 26.4 22.7 10.9 4.3 82.7Not stated (20%) 521.7 4.3 11.8 14.9 23.4 24.2 15.2 6.3 83.9
KeyGroup 1: Senior management and qualified professionalsGroup 2: Other business managers and associate professionalsGroup 3: Tradespeople, clerks, skilled office, sales and service staffGroup 4: Machine operators, hospitality staff, assistants, labourersNot in paid work: Not in paid work in the previous 12 monthsNot stated: No data was provided for parental occupation at the time of student enrolment. The higher the percentage of missing data, the less informative are the results for the other categories.
Refer to the introduction for explanatory notes.
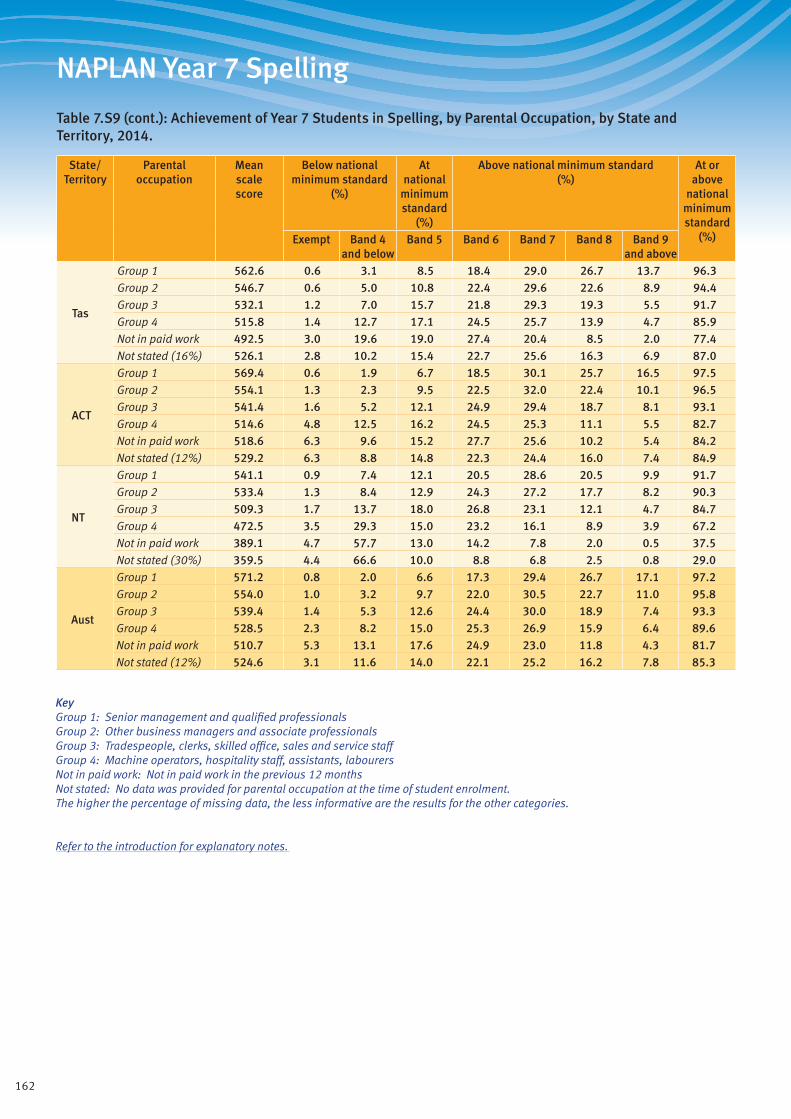
162
NAPLAN Year 7 Spelling
Table 7.S9 (cont.): Achievement of Year 7 Students in Spelling, by Parental Occupation, by State and Territory, 2014.
State/ Territory
Parental occupation
Mean scale score
Below national minimum standard
(%)
At national
minimum standard
(%)
Above national minimum standard (%)
At or above
national minimum standard
(%)Exempt Band 4 and below
Band 5 Band 6 Band 7 Band 8 Band 9 and above
Tas
Group 1 562.6 0.6 3.1 8.5 18.4 29.0 26.7 13.7 96.3Group 2 546.7 0.6 5.0 10.8 22.4 29.6 22.6 8.9 94.4Group 3 532.1 1.2 7.0 15.7 21.8 29.3 19.3 5.5 91.7Group 4 515.8 1.4 12.7 17.1 24.5 25.7 13.9 4.7 85.9Not in paid work 492.5 3.0 19.6 19.0 27.4 20.4 8.5 2.0 77.4Not stated (16%) 526.1 2.8 10.2 15.4 22.7 25.6 16.3 6.9 87.0
ACT
Group 1 569.4 0.6 1.9 6.7 18.5 30.1 25.7 16.5 97.5Group 2 554.1 1.3 2.3 9.5 22.5 32.0 22.4 10.1 96.5Group 3 541.4 1.6 5.2 12.1 24.9 29.4 18.7 8.1 93.1Group 4 514.6 4.8 12.5 16.2 24.5 25.3 11.1 5.5 82.7Not in paid work 518.6 6.3 9.6 15.2 27.7 25.6 10.2 5.4 84.2Not stated (12%) 529.2 6.3 8.8 14.8 22.3 24.4 16.0 7.4 84.9
NT
Group 1 541.1 0.9 7.4 12.1 20.5 28.6 20.5 9.9 91.7Group 2 533.4 1.3 8.4 12.9 24.3 27.2 17.7 8.2 90.3Group 3 509.3 1.7 13.7 18.0 26.8 23.1 12.1 4.7 84.7Group 4 472.5 3.5 29.3 15.0 23.2 16.1 8.9 3.9 67.2Not in paid work 389.1 4.7 57.7 13.0 14.2 7.8 2.0 0.5 37.5Not stated (30%) 359.5 4.4 66.6 10.0 8.8 6.8 2.5 0.8 29.0
Aust
Group 1 571.2 0.8 2.0 6.6 17.3 29.4 26.7 17.1 97.2Group 2 554.0 1.0 3.2 9.7 22.0 30.5 22.7 11.0 95.8Group 3 539.4 1.4 5.3 12.6 24.4 30.0 18.9 7.4 93.3Group 4 528.5 2.3 8.2 15.0 25.3 26.9 15.9 6.4 89.6Not in paid work 510.7 5.3 13.1 17.6 24.9 23.0 11.8 4.3 81.7Not stated (12%) 524.6 3.1 11.6 14.0 22.1 25.2 16.2 7.8 85.3
KeyGroup 1: Senior management and qualified professionalsGroup 2: Other business managers and associate professionalsGroup 3: Tradespeople, clerks, skilled office, sales and service staffGroup 4: Machine operators, hospitality staff, assistants, labourersNot in paid work: Not in paid work in the previous 12 monthsNot stated: No data was provided for parental occupation at the time of student enrolment. The higher the percentage of missing data, the less informative are the results for the other categories.
Refer to the introduction for explanatory notes.
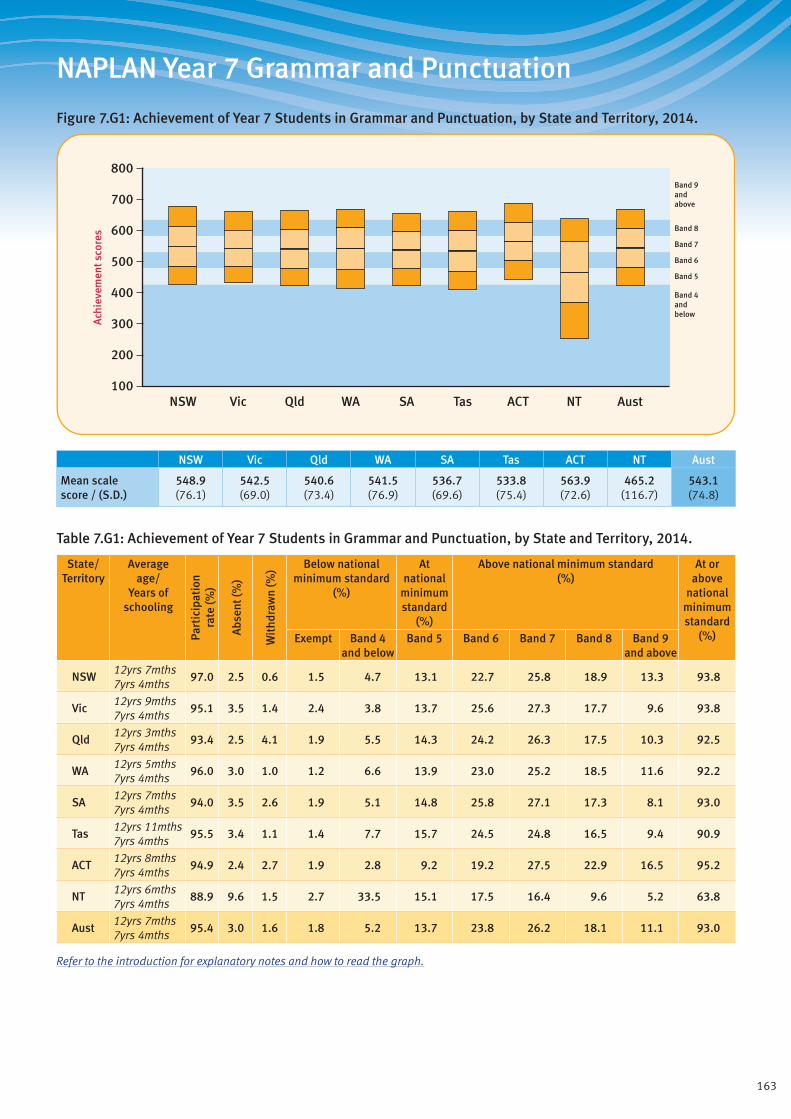
163
NAPLAN Year 7 Grammar and Punctuation
Figure 7.G1: Achievement of Year 7 Students in Grammar and Punctuation, by State and Territory, 2014.
Band 4andbelow
Band 5
Band 6
Band 7
Band 8
Band 9andabove
800
700
500
600
400
300
100
200
Ach
ieve
men
t sco
res
ACTQld SAWA TasVicNSW NT Aust
NSW Vic Qld WA SA Tas ACT NT Aust
Mean scale score / (S.D.)
548.9 (76.1)
542.5 (69.0)
540.6 (73.4)
541.5 (76.9)
536.7 (69.6)
533.8 (75.4)
563.9 (72.6)
465.2 (116.7)
543.1 (74.8)
Table 7.G1: Achievement of Year 7 Students in Grammar and Punctuation, by State and Territory, 2014.
State/ Territory
Average age/
Years of schooling
Part
icip
atio
nra
te (%
)
Abs
ent (
%)
Wit
hdra
wn
(%) Below national
minimum standard (%)
At national
minimum standard
(%)
Above national minimum standard (%)
At or above
national minimum standard
(%)Exempt Band 4 and below
Band 5 Band 6 Band 7 Band 8 Band 9 and above
NSW12yrs 7mths 7yrs 4mths
97.0 2.5 0.6 1.5 4.7 13.1 22.7 25.8 18.9 13.3 93.8
Vic12yrs 9mths 7yrs 4mths
95.1 3.5 1.4 2.4 3.8 13.7 25.6 27.3 17.7 9.6 93.8
Qld12yrs 3mths 7yrs 4mths
93.4 2.5 4.1 1.9 5.5 14.3 24.2 26.3 17.5 10.3 92.5
WA12yrs 5mths 7yrs 4mths
96.0 3.0 1.0 1.2 6.6 13.9 23.0 25.2 18.5 11.6 92.2
SA12yrs 7mths 7yrs 4mths
94.0 3.5 2.6 1.9 5.1 14.8 25.8 27.1 17.3 8.1 93.0
Tas12yrs 11mths 7yrs 4mths
95.5 3.4 1.1 1.4 7.7 15.7 24.5 24.8 16.5 9.4 90.9
ACT12yrs 8mths 7yrs 4mths
94.9 2.4 2.7 1.9 2.8 9.2 19.2 27.5 22.9 16.5 95.2
NT12yrs 6mths 7yrs 4mths
88.9 9.6 1.5 2.7 33.5 15.1 17.5 16.4 9.6 5.2 63.8
Aust12yrs 7mths 7yrs 4mths
95.4 3.0 1.6 1.8 5.2 13.7 23.8 26.2 18.1 11.1 93.0
Refer to the introduction for explanatory notes and how to read the graph.
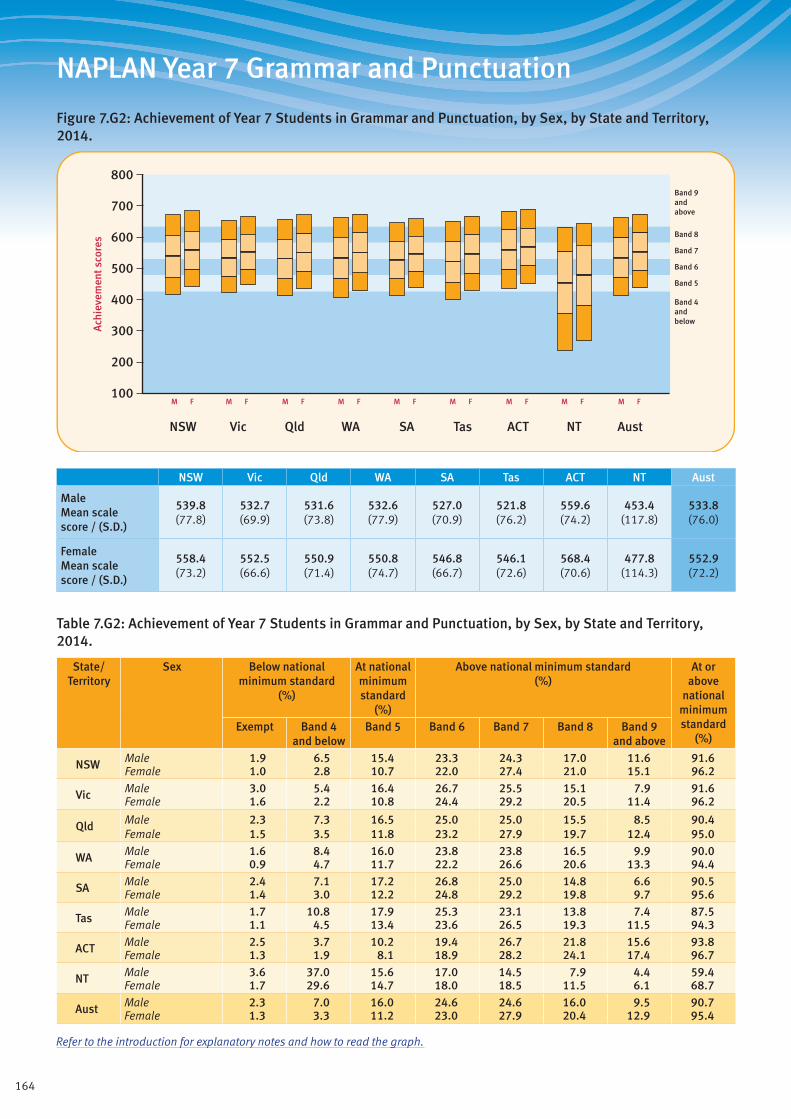
164
NAPLAN Year 7 Grammar and Punctuation
Figure 7.G2: Achievement of Year 7 Students in Grammar and Punctuation, by Sex, by State and Territory, 2014.
Band 4andbelow
Band 5
Band 6
Band 7
Band 8
Band 9andabove
ACTQld SAWA TasVicNSW NT Aust
M F M F M F M F M F M F M F M F M F
800
700
500
600
400
300
100
200
Ach
ieve
men
t sco
res
NSW Vic Qld WA SA Tas ACT NT Aust
Male Mean scale score / (S.D.)
539.8 (77.8)
532.7 (69.9)
531.6 (73.8)
532.6 (77.9)
527.0 (70.9)
521.8 (76.2)
559.6 (74.2)
453.4 (117.8)
533.8 (76.0)
Female Mean scale score / (S.D.)
558.4 (73.2)
552.5 (66.6)
550.9 (71.4)
550.8 (74.7)
546.8 (66.7)
546.1 (72.6)
568.4 (70.6)
477.8 (114.3)
552.9 (72.2)
Table 7.G2: Achievement of Year 7 Students in Grammar and Punctuation, by Sex, by State and Territory, 2014.
State/ Territory
Sex Below national minimum standard
(%)
At national minimum standard
(%)
Above national minimum standard (%)
At or above
national minimum standard
(%)Exempt Band 4
and belowBand 5 Band 6 Band 7 Band 8 Band 9
and above
NSW Male 1.9 6.5 15.4 23.3 24.3 17.0 11.6 91.6Female 1.0 2.8 10.7 22.0 27.4 21.0 15.1 96.2
Vic Male 3.0 5.4 16.4 26.7 25.5 15.1 7.9 91.6Female 1.6 2.2 10.8 24.4 29.2 20.5 11.4 96.2
Qld Male 2.3 7.3 16.5 25.0 25.0 15.5 8.5 90.4Female 1.5 3.5 11.8 23.2 27.9 19.7 12.4 95.0
WA Male 1.6 8.4 16.0 23.8 23.8 16.5 9.9 90.0Female 0.9 4.7 11.7 22.2 26.6 20.6 13.3 94.4
SA Male 2.4 7.1 17.2 26.8 25.0 14.8 6.6 90.5Female 1.4 3.0 12.2 24.8 29.2 19.8 9.7 95.6
Tas Male 1.7 10.8 17.9 25.3 23.1 13.8 7.4 87.5Female 1.1 4.5 13.4 23.6 26.5 19.3 11.5 94.3
ACT Male 2.5 3.7 10.2 19.4 26.7 21.8 15.6 93.8Female 1.3 1.9 8.1 18.9 28.2 24.1 17.4 96.7
NT Male 3.6 37.0 15.6 17.0 14.5 7.9 4.4 59.4Female 1.7 29.6 14.7 18.0 18.5 11.5 6.1 68.7
Aust Male 2.3 7.0 16.0 24.6 24.6 16.0 9.5 90.7Female 1.3 3.3 11.2 23.0 27.9 20.4 12.9 95.4
Refer to the introduction for explanatory notes and how to read the graph.
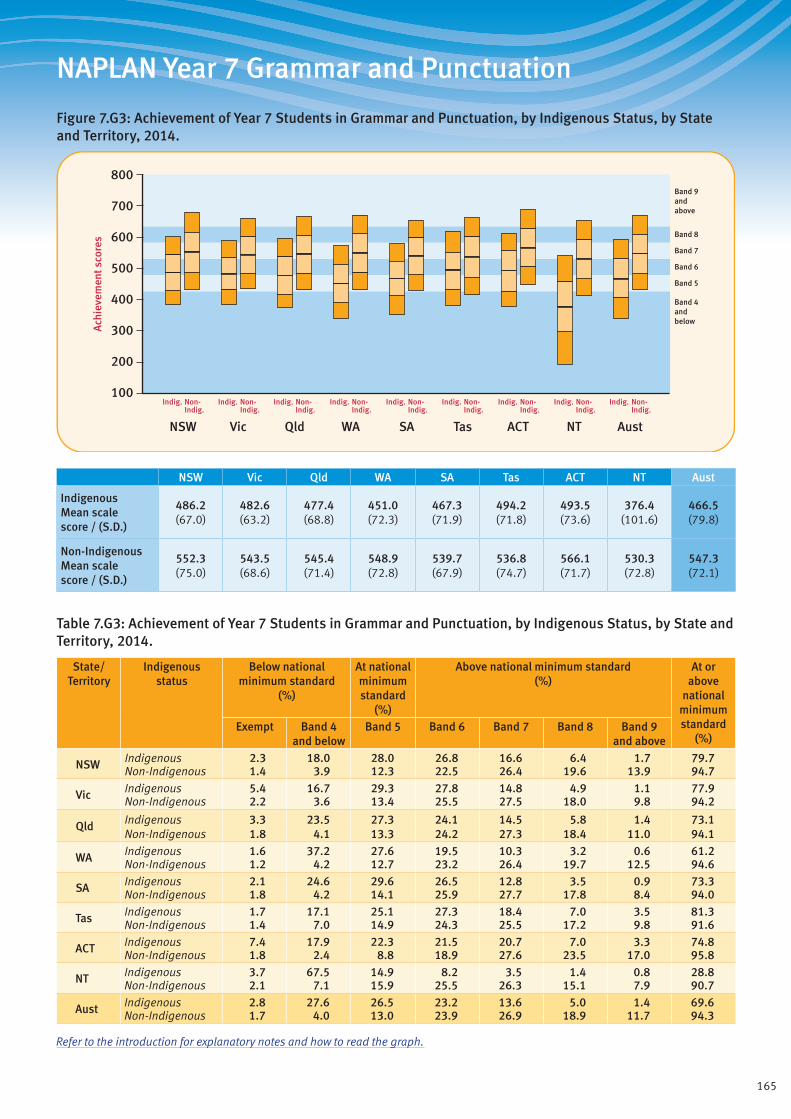
165
NAPLAN Year 7 Grammar and Punctuation
Figure 7.G3: Achievement of Year 7 Students in Grammar and Punctuation, by Indigenous Status, by State and Territory, 2014.
Band 4andbelow
Band 5
Band 6
Band 7
Band 8
Band 9andabove
ACTQld SAWA TasVicNSW NT Aust
800
700
500
600
400
300
100
200
Ach
ieve
men
t sco
res
Indig. Non-Indig.
Indig. Non-Indig.
Indig. Non-Indig.
Indig. Non-Indig.
Indig. Non-Indig.
Indig. Non-Indig.
Indig. Non-Indig.
Indig. Non-Indig.
Indig. Non-Indig.
NSW Vic Qld WA SA Tas ACT NT Aust
Indigenous Mean scale score / (S.D.)
486.2 (67.0)
482.6 (63.2)
477.4 (68.8)
451.0 (72.3)
467.3 (71.9)
494.2 (71.8)
493.5 (73.6)
376.4 (101.6)
466.5 (79.8)
Non-Indigenous Mean scale score / (S.D.)
552.3 (75.0)
543.5 (68.6)
545.4 (71.4)
548.9 (72.8)
539.7 (67.9)
536.8 (74.7)
566.1 (71.7)
530.3 (72.8)
547.3 (72.1)
Table 7.G3: Achievement of Year 7 Students in Grammar and Punctuation, by Indigenous Status, by State and Territory, 2014.
State/ Territory
Indigenous status
Below national minimum standard
(%)
At national minimum standard
(%)
Above national minimum standard (%)
At or above
national minimum standard
(%)Exempt Band 4
and belowBand 5 Band 6 Band 7 Band 8 Band 9
and above
NSW Indigenous 2.3 18.0 28.0 26.8 16.6 6.4 1.7 79.7Non-Indigenous 1.4 3.9 12.3 22.5 26.4 19.6 13.9 94.7
Vic Indigenous 5.4 16.7 29.3 27.8 14.8 4.9 1.1 77.9Non-Indigenous 2.2 3.6 13.4 25.5 27.5 18.0 9.8 94.2
Qld Indigenous 3.3 23.5 27.3 24.1 14.5 5.8 1.4 73.1Non-Indigenous 1.8 4.1 13.3 24.2 27.3 18.4 11.0 94.1
WA Indigenous 1.6 37.2 27.6 19.5 10.3 3.2 0.6 61.2Non-Indigenous 1.2 4.2 12.7 23.2 26.4 19.7 12.5 94.6
SA Indigenous 2.1 24.6 29.6 26.5 12.8 3.5 0.9 73.3Non-Indigenous 1.8 4.2 14.1 25.9 27.7 17.8 8.4 94.0
Tas Indigenous 1.7 17.1 25.1 27.3 18.4 7.0 3.5 81.3Non-Indigenous 1.4 7.0 14.9 24.3 25.5 17.2 9.8 91.6
ACT Indigenous 7.4 17.9 22.3 21.5 20.7 7.0 3.3 74.8Non-Indigenous 1.8 2.4 8.8 18.9 27.6 23.5 17.0 95.8
NT Indigenous 3.7 67.5 14.9 8.2 3.5 1.4 0.8 28.8Non-Indigenous 2.1 7.1 15.9 25.5 26.3 15.1 7.9 90.7
Aust Indigenous 2.8 27.6 26.5 23.2 13.6 5.0 1.4 69.6Non-Indigenous 1.7 4.0 13.0 23.9 26.9 18.9 11.7 94.3
Refer to the introduction for explanatory notes and how to read the graph.
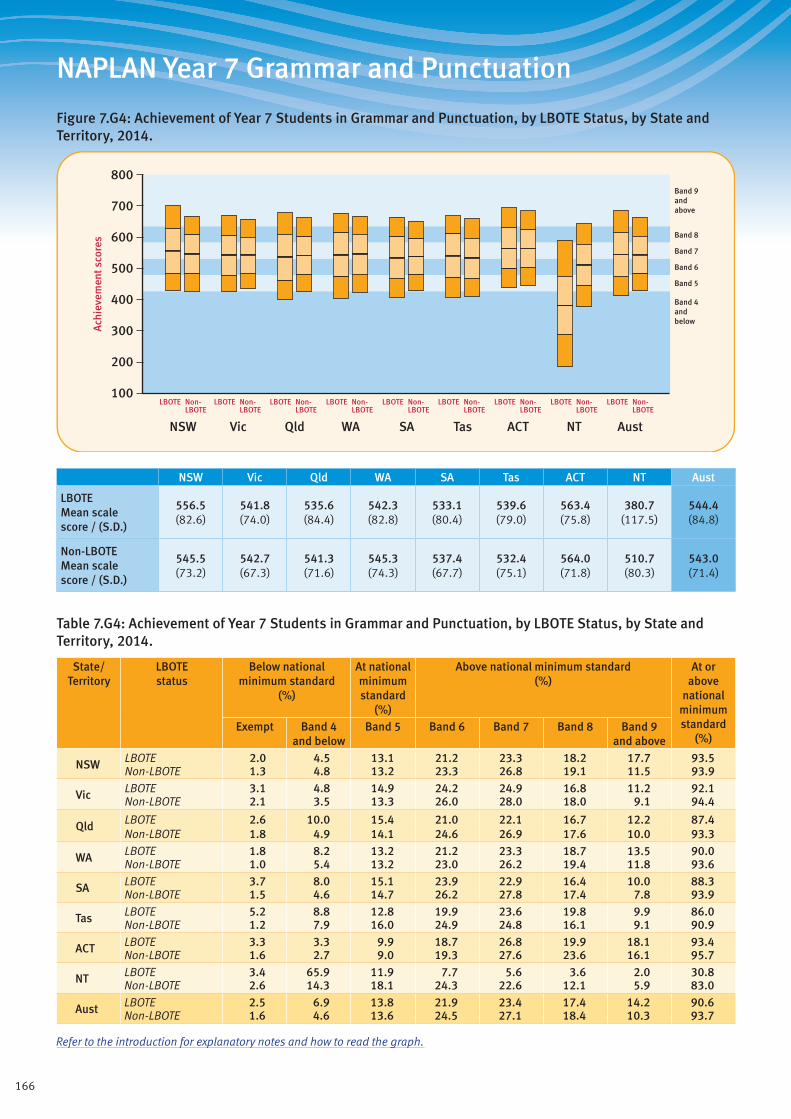
166
NAPLAN Year 7 Grammar and Punctuation
Figure 7.G4: Achievement of Year 7 Students in Grammar and Punctuation, by LBOTE Status, by State and Territory, 2014.
Band 4andbelow
Band 5
Band 6
Band 7
Band 8
Band 9andabove
ACTQld SAWA TasVicNSW NT Aust
800
700
500
600
400
300
100
200
Ach
ieve
men
t sco
res
LBOTE Non-LBOTE
LBOTE Non-LBOTE
LBOTE Non-LBOTE
LBOTE Non-LBOTE
LBOTE Non-LBOTE
LBOTE Non-LBOTE
LBOTE Non-LBOTE
LBOTE Non-LBOTE
LBOTE Non-LBOTE
NSW Vic Qld WA SA Tas ACT NT Aust
LBOTE Mean scale score / (S.D.)
556.5 (82.6)
541.8 (74.0)
535.6 (84.4)
542.3 (82.8)
533.1 (80.4)
539.6 (79.0)
563.4 (75.8)
380.7 (117.5)
544.4 (84.8)
Non-LBOTE Mean scale score / (S.D.)
545.5 (73.2)
542.7 (67.3)
541.3 (71.6)
545.3 (74.3)
537.4 (67.7)
532.4 (75.1)
564.0 (71.8)
510.7 (80.3)
543.0 (71.4)
Table 7.G4: Achievement of Year 7 Students in Grammar and Punctuation, by LBOTE Status, by State and Territory, 2014.
State/ Territory
LBOTE status
Below national minimum standard
(%)
At national minimum standard
(%)
Above national minimum standard (%)
At or above
national minimum standard
(%)Exempt Band 4
and belowBand 5 Band 6 Band 7 Band 8 Band 9
and above
NSW LBOTE 2.0 4.5 13.1 21.2 23.3 18.2 17.7 93.5Non-LBOTE 1.3 4.8 13.2 23.3 26.8 19.1 11.5 93.9
Vic LBOTE 3.1 4.8 14.9 24.2 24.9 16.8 11.2 92.1Non-LBOTE 2.1 3.5 13.3 26.0 28.0 18.0 9.1 94.4
Qld LBOTE 2.6 10.0 15.4 21.0 22.1 16.7 12.2 87.4Non-LBOTE 1.8 4.9 14.1 24.6 26.9 17.6 10.0 93.3
WA LBOTE 1.8 8.2 13.2 21.2 23.3 18.7 13.5 90.0Non-LBOTE 1.0 5.4 13.2 23.0 26.2 19.4 11.8 93.6
SA LBOTE 3.7 8.0 15.1 23.9 22.9 16.4 10.0 88.3Non-LBOTE 1.5 4.6 14.7 26.2 27.8 17.4 7.8 93.9
Tas LBOTE 5.2 8.8 12.8 19.9 23.6 19.8 9.9 86.0Non-LBOTE 1.2 7.9 16.0 24.9 24.8 16.1 9.1 90.9
ACT LBOTE 3.3 3.3 9.9 18.7 26.8 19.9 18.1 93.4Non-LBOTE 1.6 2.7 9.0 19.3 27.6 23.6 16.1 95.7
NT LBOTE 3.4 65.9 11.9 7.7 5.6 3.6 2.0 30.8Non-LBOTE 2.6 14.3 18.1 24.3 22.6 12.1 5.9 83.0
Aust LBOTE 2.5 6.9 13.8 21.9 23.4 17.4 14.2 90.6Non-LBOTE 1.6 4.6 13.6 24.5 27.1 18.4 10.3 93.7
Refer to the introduction for explanatory notes and how to read the graph.
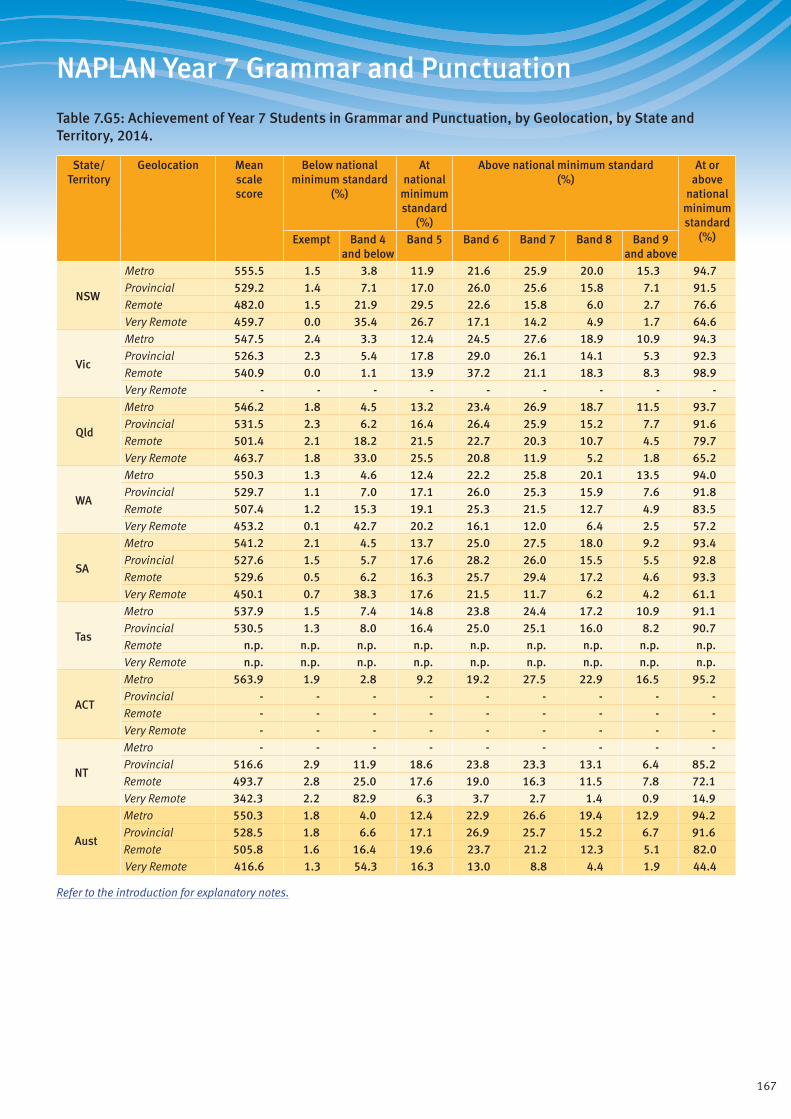
167
NAPLAN Year 7 Grammar and Punctuation
Table 7.G5: Achievement of Year 7 Students in Grammar and Punctuation, by Geolocation, by State and Territory, 2014.
State/ Territory
Geolocation Mean scale score
Below national minimum standard
(%)
At national
minimum standard
(%)
Above national minimum standard (%)
At or above
national minimum standard
(%)Exempt Band 4 and below
Band 5 Band 6 Band 7 Band 8 Band 9 and above
NSW
Metro 555.5 1.5 3.8 11.9 21.6 25.9 20.0 15.3 94.7Provincial 529.2 1.4 7.1 17.0 26.0 25.6 15.8 7.1 91.5Remote 482.0 1.5 21.9 29.5 22.6 15.8 6.0 2.7 76.6Very Remote 459.7 0.0 35.4 26.7 17.1 14.2 4.9 1.7 64.6
Vic
Metro 547.5 2.4 3.3 12.4 24.5 27.6 18.9 10.9 94.3Provincial 526.3 2.3 5.4 17.8 29.0 26.1 14.1 5.3 92.3Remote 540.9 0.0 1.1 13.9 37.2 21.1 18.3 8.3 98.9Very Remote - - - - - - - - -
Qld
Metro 546.2 1.8 4.5 13.2 23.4 26.9 18.7 11.5 93.7Provincial 531.5 2.3 6.2 16.4 26.4 25.9 15.2 7.7 91.6Remote 501.4 2.1 18.2 21.5 22.7 20.3 10.7 4.5 79.7Very Remote 463.7 1.8 33.0 25.5 20.8 11.9 5.2 1.8 65.2
WA
Metro 550.3 1.3 4.6 12.4 22.2 25.8 20.1 13.5 94.0Provincial 529.7 1.1 7.0 17.1 26.0 25.3 15.9 7.6 91.8Remote 507.4 1.2 15.3 19.1 25.3 21.5 12.7 4.9 83.5Very Remote 453.2 0.1 42.7 20.2 16.1 12.0 6.4 2.5 57.2
SA
Metro 541.2 2.1 4.5 13.7 25.0 27.5 18.0 9.2 93.4Provincial 527.6 1.5 5.7 17.6 28.2 26.0 15.5 5.5 92.8Remote 529.6 0.5 6.2 16.3 25.7 29.4 17.2 4.6 93.3Very Remote 450.1 0.7 38.3 17.6 21.5 11.7 6.2 4.2 61.1
Tas
Metro 537.9 1.5 7.4 14.8 23.8 24.4 17.2 10.9 91.1Provincial 530.5 1.3 8.0 16.4 25.0 25.1 16.0 8.2 90.7Remote n.p. n.p. n.p. n.p. n.p. n.p. n.p. n.p. n.p.Very Remote n.p. n.p. n.p. n.p. n.p. n.p. n.p. n.p. n.p.
ACT
Metro 563.9 1.9 2.8 9.2 19.2 27.5 22.9 16.5 95.2Provincial - - - - - - - - -Remote - - - - - - - - -Very Remote - - - - - - - - -
NT
Metro - - - - - - - - -Provincial 516.6 2.9 11.9 18.6 23.8 23.3 13.1 6.4 85.2Remote 493.7 2.8 25.0 17.6 19.0 16.3 11.5 7.8 72.1Very Remote 342.3 2.2 82.9 6.3 3.7 2.7 1.4 0.9 14.9
Aust
Metro 550.3 1.8 4.0 12.4 22.9 26.6 19.4 12.9 94.2Provincial 528.5 1.8 6.6 17.1 26.9 25.7 15.2 6.7 91.6Remote 505.8 1.6 16.4 19.6 23.7 21.2 12.3 5.1 82.0Very Remote 416.6 1.3 54.3 16.3 13.0 8.8 4.4 1.9 44.4
Refer to the introduction for explanatory notes.
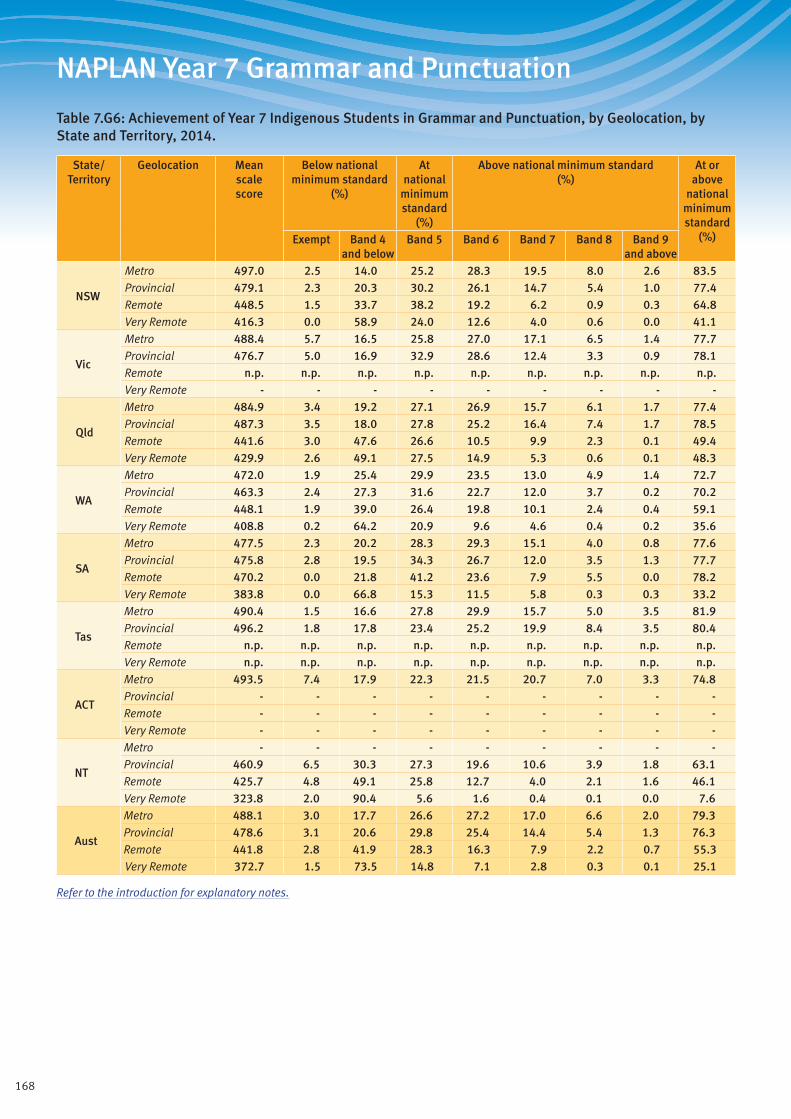
168
NAPLAN Year 7 Grammar and Punctuation
Table 7.G6: Achievement of Year 7 Indigenous Students in Grammar and Punctuation, by Geolocation, by State and Territory, 2014.
State/ Territory
Geolocation Mean scale score
Below national minimum standard
(%)
At national
minimum standard
(%)
Above national minimum standard (%)
At or above
national minimum standard
(%)Exempt Band 4 and below
Band 5 Band 6 Band 7 Band 8 Band 9 and above
NSW
Metro 497.0 2.5 14.0 25.2 28.3 19.5 8.0 2.6 83.5Provincial 479.1 2.3 20.3 30.2 26.1 14.7 5.4 1.0 77.4Remote 448.5 1.5 33.7 38.2 19.2 6.2 0.9 0.3 64.8Very Remote 416.3 0.0 58.9 24.0 12.6 4.0 0.6 0.0 41.1
Vic
Metro 488.4 5.7 16.5 25.8 27.0 17.1 6.5 1.4 77.7Provincial 476.7 5.0 16.9 32.9 28.6 12.4 3.3 0.9 78.1Remote n.p. n.p. n.p. n.p. n.p. n.p. n.p. n.p. n.p.Very Remote - - - - - - - - -
Qld
Metro 484.9 3.4 19.2 27.1 26.9 15.7 6.1 1.7 77.4Provincial 487.3 3.5 18.0 27.8 25.2 16.4 7.4 1.7 78.5Remote 441.6 3.0 47.6 26.6 10.5 9.9 2.3 0.1 49.4Very Remote 429.9 2.6 49.1 27.5 14.9 5.3 0.6 0.1 48.3
WA
Metro 472.0 1.9 25.4 29.9 23.5 13.0 4.9 1.4 72.7Provincial 463.3 2.4 27.3 31.6 22.7 12.0 3.7 0.2 70.2Remote 448.1 1.9 39.0 26.4 19.8 10.1 2.4 0.4 59.1Very Remote 408.8 0.2 64.2 20.9 9.6 4.6 0.4 0.2 35.6
SA
Metro 477.5 2.3 20.2 28.3 29.3 15.1 4.0 0.8 77.6Provincial 475.8 2.8 19.5 34.3 26.7 12.0 3.5 1.3 77.7Remote 470.2 0.0 21.8 41.2 23.6 7.9 5.5 0.0 78.2Very Remote 383.8 0.0 66.8 15.3 11.5 5.8 0.3 0.3 33.2
Tas
Metro 490.4 1.5 16.6 27.8 29.9 15.7 5.0 3.5 81.9Provincial 496.2 1.8 17.8 23.4 25.2 19.9 8.4 3.5 80.4Remote n.p. n.p. n.p. n.p. n.p. n.p. n.p. n.p. n.p.Very Remote n.p. n.p. n.p. n.p. n.p. n.p. n.p. n.p. n.p.
ACT
Metro 493.5 7.4 17.9 22.3 21.5 20.7 7.0 3.3 74.8Provincial - - - - - - - - -Remote - - - - - - - - -Very Remote - - - - - - - - -
NT
Metro - - - - - - - - -Provincial 460.9 6.5 30.3 27.3 19.6 10.6 3.9 1.8 63.1Remote 425.7 4.8 49.1 25.8 12.7 4.0 2.1 1.6 46.1Very Remote 323.8 2.0 90.4 5.6 1.6 0.4 0.1 0.0 7.6
Aust
Metro 488.1 3.0 17.7 26.6 27.2 17.0 6.6 2.0 79.3Provincial 478.6 3.1 20.6 29.8 25.4 14.4 5.4 1.3 76.3Remote 441.8 2.8 41.9 28.3 16.3 7.9 2.2 0.7 55.3Very Remote 372.7 1.5 73.5 14.8 7.1 2.8 0.3 0.1 25.1
Refer to the introduction for explanatory notes.
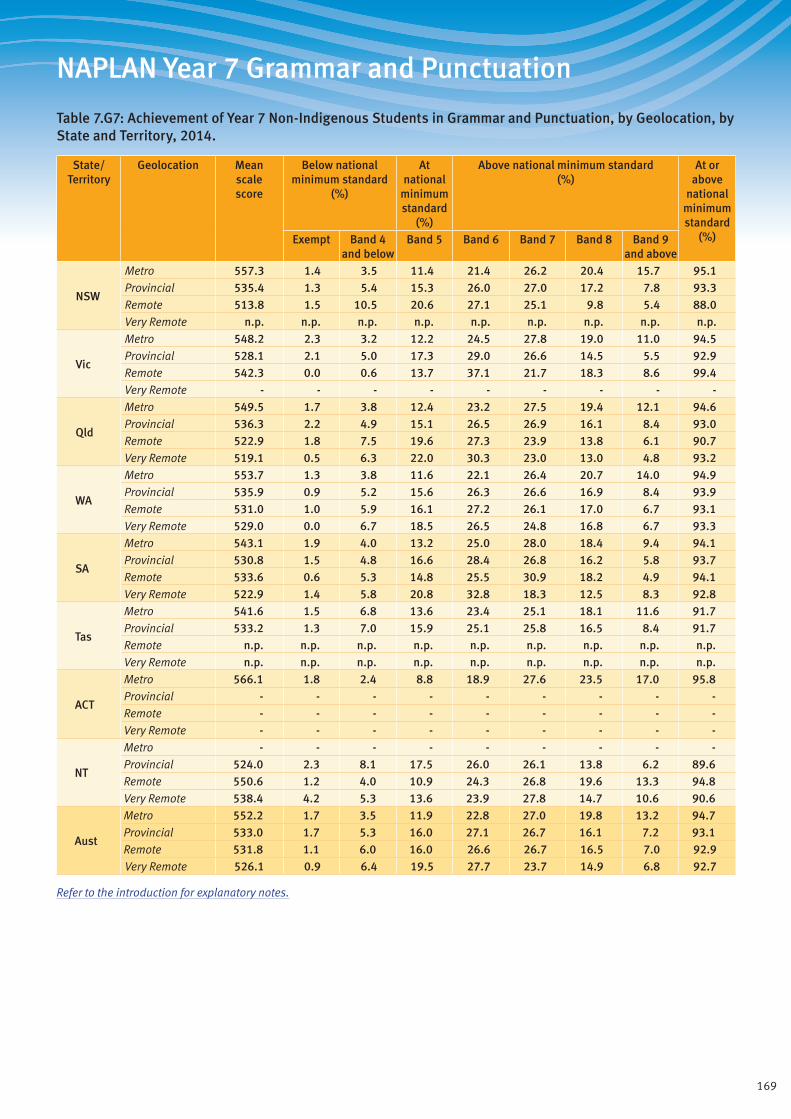
169
NAPLAN Year 7 Grammar and Punctuation
Table 7.G7: Achievement of Year 7 Non-Indigenous Students in Grammar and Punctuation, by Geolocation, by State and Territory, 2014.
State/ Territory
Geolocation Mean scale score
Below national minimum standard
(%)
At national
minimum standard
(%)
Above national minimum standard (%)
At or above
national minimum standard
(%)Exempt Band 4 and below
Band 5 Band 6 Band 7 Band 8 Band 9 and above
NSW
Metro 557.3 1.4 3.5 11.4 21.4 26.2 20.4 15.7 95.1Provincial 535.4 1.3 5.4 15.3 26.0 27.0 17.2 7.8 93.3Remote 513.8 1.5 10.5 20.6 27.1 25.1 9.8 5.4 88.0Very Remote n.p. n.p. n.p. n.p. n.p. n.p. n.p. n.p. n.p.
Vic
Metro 548.2 2.3 3.2 12.2 24.5 27.8 19.0 11.0 94.5Provincial 528.1 2.1 5.0 17.3 29.0 26.6 14.5 5.5 92.9Remote 542.3 0.0 0.6 13.7 37.1 21.7 18.3 8.6 99.4Very Remote - - - - - - - - -
Qld
Metro 549.5 1.7 3.8 12.4 23.2 27.5 19.4 12.1 94.6Provincial 536.3 2.2 4.9 15.1 26.5 26.9 16.1 8.4 93.0Remote 522.9 1.8 7.5 19.6 27.3 23.9 13.8 6.1 90.7Very Remote 519.1 0.5 6.3 22.0 30.3 23.0 13.0 4.8 93.2
WA
Metro 553.7 1.3 3.8 11.6 22.1 26.4 20.7 14.0 94.9Provincial 535.9 0.9 5.2 15.6 26.3 26.6 16.9 8.4 93.9Remote 531.0 1.0 5.9 16.1 27.2 26.1 17.0 6.7 93.1Very Remote 529.0 0.0 6.7 18.5 26.5 24.8 16.8 6.7 93.3
SA
Metro 543.1 1.9 4.0 13.2 25.0 28.0 18.4 9.4 94.1Provincial 530.8 1.5 4.8 16.6 28.4 26.8 16.2 5.8 93.7Remote 533.6 0.6 5.3 14.8 25.5 30.9 18.2 4.9 94.1Very Remote 522.9 1.4 5.8 20.8 32.8 18.3 12.5 8.3 92.8
Tas
Metro 541.6 1.5 6.8 13.6 23.4 25.1 18.1 11.6 91.7Provincial 533.2 1.3 7.0 15.9 25.1 25.8 16.5 8.4 91.7Remote n.p. n.p. n.p. n.p. n.p. n.p. n.p. n.p. n.p.Very Remote n.p. n.p. n.p. n.p. n.p. n.p. n.p. n.p. n.p.
ACT
Metro 566.1 1.8 2.4 8.8 18.9 27.6 23.5 17.0 95.8Provincial - - - - - - - - -Remote - - - - - - - - -Very Remote - - - - - - - - -
NT
Metro - - - - - - - - -Provincial 524.0 2.3 8.1 17.5 26.0 26.1 13.8 6.2 89.6Remote 550.6 1.2 4.0 10.9 24.3 26.8 19.6 13.3 94.8Very Remote 538.4 4.2 5.3 13.6 23.9 27.8 14.7 10.6 90.6
Aust
Metro 552.2 1.7 3.5 11.9 22.8 27.0 19.8 13.2 94.7Provincial 533.0 1.7 5.3 16.0 27.1 26.7 16.1 7.2 93.1Remote 531.8 1.1 6.0 16.0 26.6 26.7 16.5 7.0 92.9Very Remote 526.1 0.9 6.4 19.5 27.7 23.7 14.9 6.8 92.7
Refer to the introduction for explanatory notes.
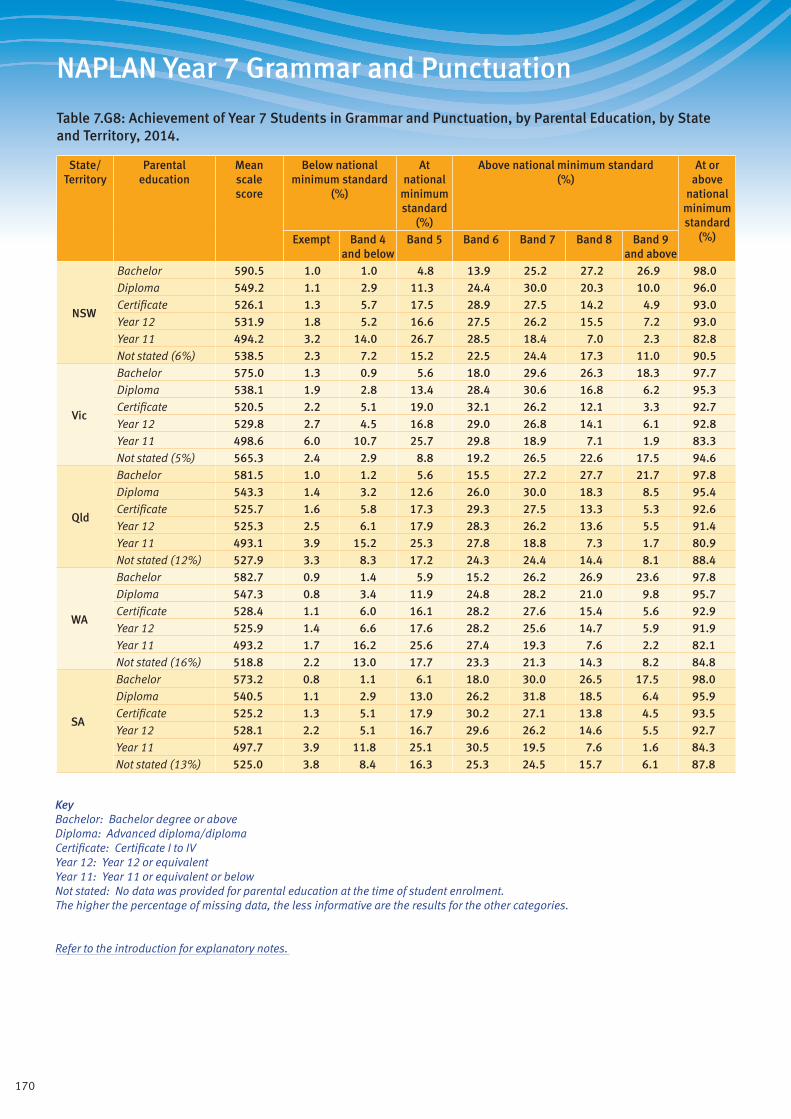
170
NAPLAN Year 7 Grammar and Punctuation
Table 7.G8: Achievement of Year 7 Students in Grammar and Punctuation, by Parental Education, by State and Territory, 2014.
State/ Territory
Parental education
Mean scale score
Below national minimum standard
(%)
At national
minimum standard
(%)
Above national minimum standard (%)
At or above
national minimum standard
(%)Exempt Band 4 and below
Band 5 Band 6 Band 7 Band 8 Band 9 and above
NSW
Bachelor 590.5 1.0 1.0 4.8 13.9 25.2 27.2 26.9 98.0Diploma 549.2 1.1 2.9 11.3 24.4 30.0 20.3 10.0 96.0Certificate 526.1 1.3 5.7 17.5 28.9 27.5 14.2 4.9 93.0Year 12 531.9 1.8 5.2 16.6 27.5 26.2 15.5 7.2 93.0Year 11 494.2 3.2 14.0 26.7 28.5 18.4 7.0 2.3 82.8Not stated (6%) 538.5 2.3 7.2 15.2 22.5 24.4 17.3 11.0 90.5
Vic
Bachelor 575.0 1.3 0.9 5.6 18.0 29.6 26.3 18.3 97.7Diploma 538.1 1.9 2.8 13.4 28.4 30.6 16.8 6.2 95.3Certificate 520.5 2.2 5.1 19.0 32.1 26.2 12.1 3.3 92.7Year 12 529.8 2.7 4.5 16.8 29.0 26.8 14.1 6.1 92.8Year 11 498.6 6.0 10.7 25.7 29.8 18.9 7.1 1.9 83.3Not stated (5%) 565.3 2.4 2.9 8.8 19.2 26.5 22.6 17.5 94.6
Qld
Bachelor 581.5 1.0 1.2 5.6 15.5 27.2 27.7 21.7 97.8Diploma 543.3 1.4 3.2 12.6 26.0 30.0 18.3 8.5 95.4Certificate 525.7 1.6 5.8 17.3 29.3 27.5 13.3 5.3 92.6Year 12 525.3 2.5 6.1 17.9 28.3 26.2 13.6 5.5 91.4Year 11 493.1 3.9 15.2 25.3 27.8 18.8 7.3 1.7 80.9Not stated (12%) 527.9 3.3 8.3 17.2 24.3 24.4 14.4 8.1 88.4
WA
Bachelor 582.7 0.9 1.4 5.9 15.2 26.2 26.9 23.6 97.8Diploma 547.3 0.8 3.4 11.9 24.8 28.2 21.0 9.8 95.7Certificate 528.4 1.1 6.0 16.1 28.2 27.6 15.4 5.6 92.9Year 12 525.9 1.4 6.6 17.6 28.2 25.6 14.7 5.9 91.9Year 11 493.2 1.7 16.2 25.6 27.4 19.3 7.6 2.2 82.1Not stated (16%) 518.8 2.2 13.0 17.7 23.3 21.3 14.3 8.2 84.8
SA
Bachelor 573.2 0.8 1.1 6.1 18.0 30.0 26.5 17.5 98.0Diploma 540.5 1.1 2.9 13.0 26.2 31.8 18.5 6.4 95.9Certificate 525.2 1.3 5.1 17.9 30.2 27.1 13.8 4.5 93.5Year 12 528.1 2.2 5.1 16.7 29.6 26.2 14.6 5.5 92.7Year 11 497.7 3.9 11.8 25.1 30.5 19.5 7.6 1.6 84.3Not stated (13%) 525.0 3.8 8.4 16.3 25.3 24.5 15.7 6.1 87.8
KeyBachelor: Bachelor degree or aboveDiploma: Advanced diploma/diplomaCertificate: Certificate I to IVYear 12: Year 12 or equivalentYear 11: Year 11 or equivalent or belowNot stated: No data was provided for parental education at the time of student enrolment. The higher the percentage of missing data, the less informative are the results for the other categories.
Refer to the introduction for explanatory notes.
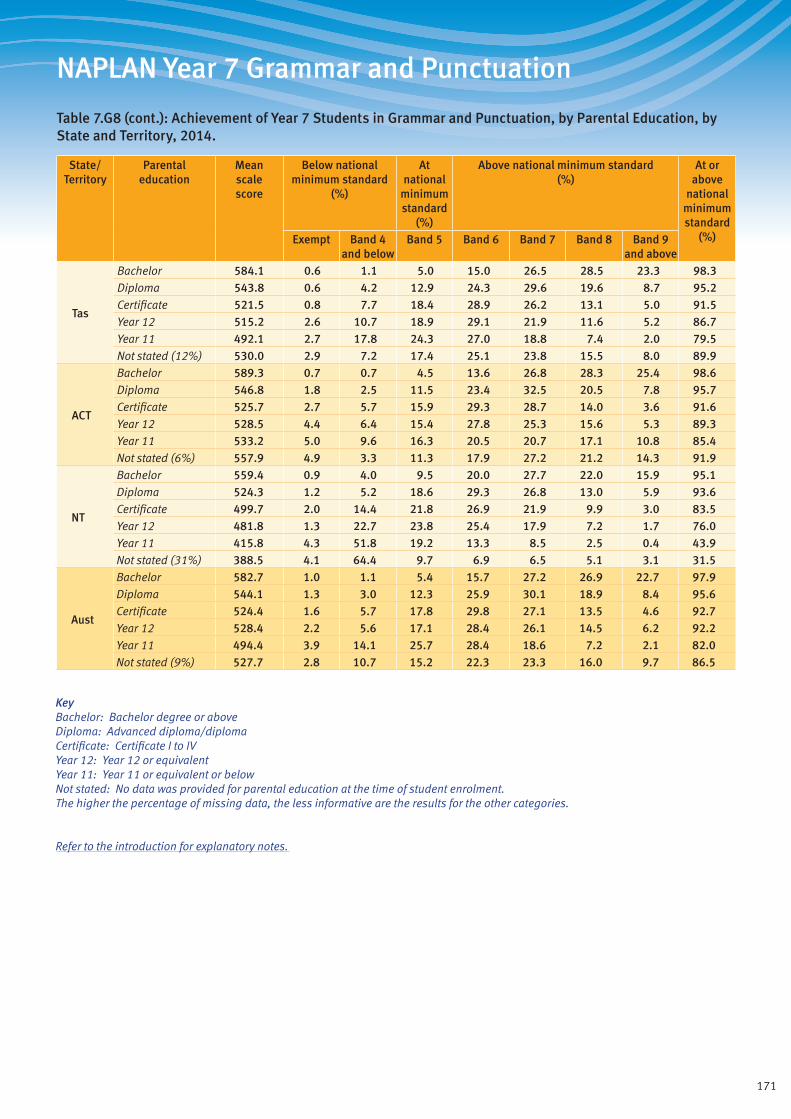
171
NAPLAN Year 7 Grammar and Punctuation
Table 7.G8 (cont.): Achievement of Year 7 Students in Grammar and Punctuation, by Parental Education, by State and Territory, 2014.
State/ Territory
Parental education
Mean scale score
Below national minimum standard
(%)
At national
minimum standard
(%)
Above national minimum standard (%)
At or above
national minimum standard
(%)Exempt Band 4 and below
Band 5 Band 6 Band 7 Band 8 Band 9 and above
Tas
Bachelor 584.1 0.6 1.1 5.0 15.0 26.5 28.5 23.3 98.3Diploma 543.8 0.6 4.2 12.9 24.3 29.6 19.6 8.7 95.2Certificate 521.5 0.8 7.7 18.4 28.9 26.2 13.1 5.0 91.5Year 12 515.2 2.6 10.7 18.9 29.1 21.9 11.6 5.2 86.7Year 11 492.1 2.7 17.8 24.3 27.0 18.8 7.4 2.0 79.5Not stated (12%) 530.0 2.9 7.2 17.4 25.1 23.8 15.5 8.0 89.9
ACT
Bachelor 589.3 0.7 0.7 4.5 13.6 26.8 28.3 25.4 98.6Diploma 546.8 1.8 2.5 11.5 23.4 32.5 20.5 7.8 95.7Certificate 525.7 2.7 5.7 15.9 29.3 28.7 14.0 3.6 91.6Year 12 528.5 4.4 6.4 15.4 27.8 25.3 15.6 5.3 89.3Year 11 533.2 5.0 9.6 16.3 20.5 20.7 17.1 10.8 85.4Not stated (6%) 557.9 4.9 3.3 11.3 17.9 27.2 21.2 14.3 91.9
NT
Bachelor 559.4 0.9 4.0 9.5 20.0 27.7 22.0 15.9 95.1Diploma 524.3 1.2 5.2 18.6 29.3 26.8 13.0 5.9 93.6Certificate 499.7 2.0 14.4 21.8 26.9 21.9 9.9 3.0 83.5Year 12 481.8 1.3 22.7 23.8 25.4 17.9 7.2 1.7 76.0Year 11 415.8 4.3 51.8 19.2 13.3 8.5 2.5 0.4 43.9Not stated (31%) 388.5 4.1 64.4 9.7 6.9 6.5 5.1 3.1 31.5
Aust
Bachelor 582.7 1.0 1.1 5.4 15.7 27.2 26.9 22.7 97.9Diploma 544.1 1.3 3.0 12.3 25.9 30.1 18.9 8.4 95.6Certificate 524.4 1.6 5.7 17.8 29.8 27.1 13.5 4.6 92.7Year 12 528.4 2.2 5.6 17.1 28.4 26.1 14.5 6.2 92.2Year 11 494.4 3.9 14.1 25.7 28.4 18.6 7.2 2.1 82.0Not stated (9%) 527.7 2.8 10.7 15.2 22.3 23.3 16.0 9.7 86.5
KeyBachelor: Bachelor degree or aboveDiploma: Advanced diploma/diplomaCertificate: Certificate I to IVYear 12: Year 12 or equivalentYear 11: Year 11 or equivalent or belowNot stated: No data was provided for parental education at the time of student enrolment. The higher the percentage of missing data, the less informative are the results for the other categories.
Refer to the introduction for explanatory notes.
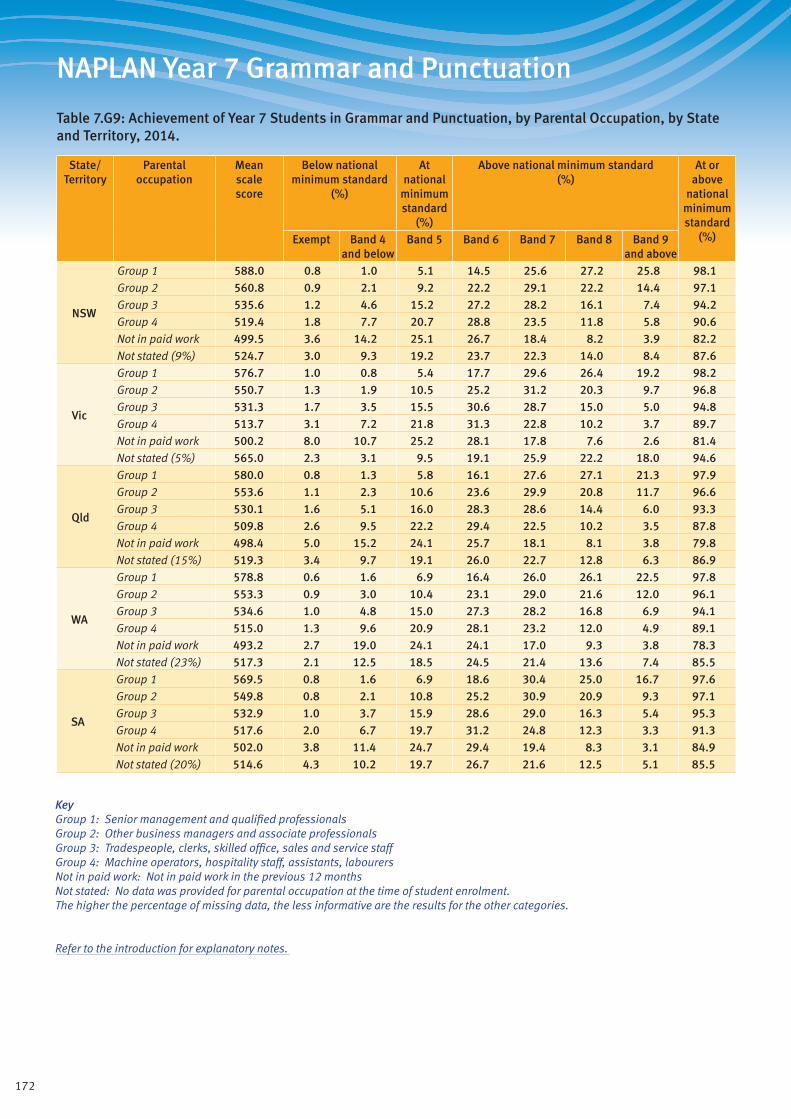
172
NAPLAN Year 7 Grammar and Punctuation
Table 7.G9: Achievement of Year 7 Students in Grammar and Punctuation, by Parental Occupation, by State and Territory, 2014.
State/ Territory
Parental occupation
Mean scale score
Below national minimum standard
(%)
At national
minimum standard
(%)
Above national minimum standard (%)
At or above
national minimum standard
(%)Exempt Band 4 and below
Band 5 Band 6 Band 7 Band 8 Band 9 and above
NSW
Group 1 588.0 0.8 1.0 5.1 14.5 25.6 27.2 25.8 98.1Group 2 560.8 0.9 2.1 9.2 22.2 29.1 22.2 14.4 97.1Group 3 535.6 1.2 4.6 15.2 27.2 28.2 16.1 7.4 94.2Group 4 519.4 1.8 7.7 20.7 28.8 23.5 11.8 5.8 90.6Not in paid work 499.5 3.6 14.2 25.1 26.7 18.4 8.2 3.9 82.2Not stated (9%) 524.7 3.0 9.3 19.2 23.7 22.3 14.0 8.4 87.6
Vic
Group 1 576.7 1.0 0.8 5.4 17.7 29.6 26.4 19.2 98.2Group 2 550.7 1.3 1.9 10.5 25.2 31.2 20.3 9.7 96.8Group 3 531.3 1.7 3.5 15.5 30.6 28.7 15.0 5.0 94.8Group 4 513.7 3.1 7.2 21.8 31.3 22.8 10.2 3.7 89.7Not in paid work 500.2 8.0 10.7 25.2 28.1 17.8 7.6 2.6 81.4Not stated (5%) 565.0 2.3 3.1 9.5 19.1 25.9 22.2 18.0 94.6
Qld
Group 1 580.0 0.8 1.3 5.8 16.1 27.6 27.1 21.3 97.9Group 2 553.6 1.1 2.3 10.6 23.6 29.9 20.8 11.7 96.6Group 3 530.1 1.6 5.1 16.0 28.3 28.6 14.4 6.0 93.3Group 4 509.8 2.6 9.5 22.2 29.4 22.5 10.2 3.5 87.8Not in paid work 498.4 5.0 15.2 24.1 25.7 18.1 8.1 3.8 79.8Not stated (15%) 519.3 3.4 9.7 19.1 26.0 22.7 12.8 6.3 86.9
WA
Group 1 578.8 0.6 1.6 6.9 16.4 26.0 26.1 22.5 97.8Group 2 553.3 0.9 3.0 10.4 23.1 29.0 21.6 12.0 96.1Group 3 534.6 1.0 4.8 15.0 27.3 28.2 16.8 6.9 94.1Group 4 515.0 1.3 9.6 20.9 28.1 23.2 12.0 4.9 89.1Not in paid work 493.2 2.7 19.0 24.1 24.1 17.0 9.3 3.8 78.3Not stated (23%) 517.3 2.1 12.5 18.5 24.5 21.4 13.6 7.4 85.5
SA
Group 1 569.5 0.8 1.6 6.9 18.6 30.4 25.0 16.7 97.6Group 2 549.8 0.8 2.1 10.8 25.2 30.9 20.9 9.3 97.1Group 3 532.9 1.0 3.7 15.9 28.6 29.0 16.3 5.4 95.3Group 4 517.6 2.0 6.7 19.7 31.2 24.8 12.3 3.3 91.3Not in paid work 502.0 3.8 11.4 24.7 29.4 19.4 8.3 3.1 84.9Not stated (20%) 514.6 4.3 10.2 19.7 26.7 21.6 12.5 5.1 85.5
KeyGroup 1: Senior management and qualified professionalsGroup 2: Other business managers and associate professionalsGroup 3: Tradespeople, clerks, skilled office, sales and service staffGroup 4: Machine operators, hospitality staff, assistants, labourersNot in paid work: Not in paid work in the previous 12 monthsNot stated: No data was provided for parental occupation at the time of student enrolment. The higher the percentage of missing data, the less informative are the results for the other categories.
Refer to the introduction for explanatory notes.
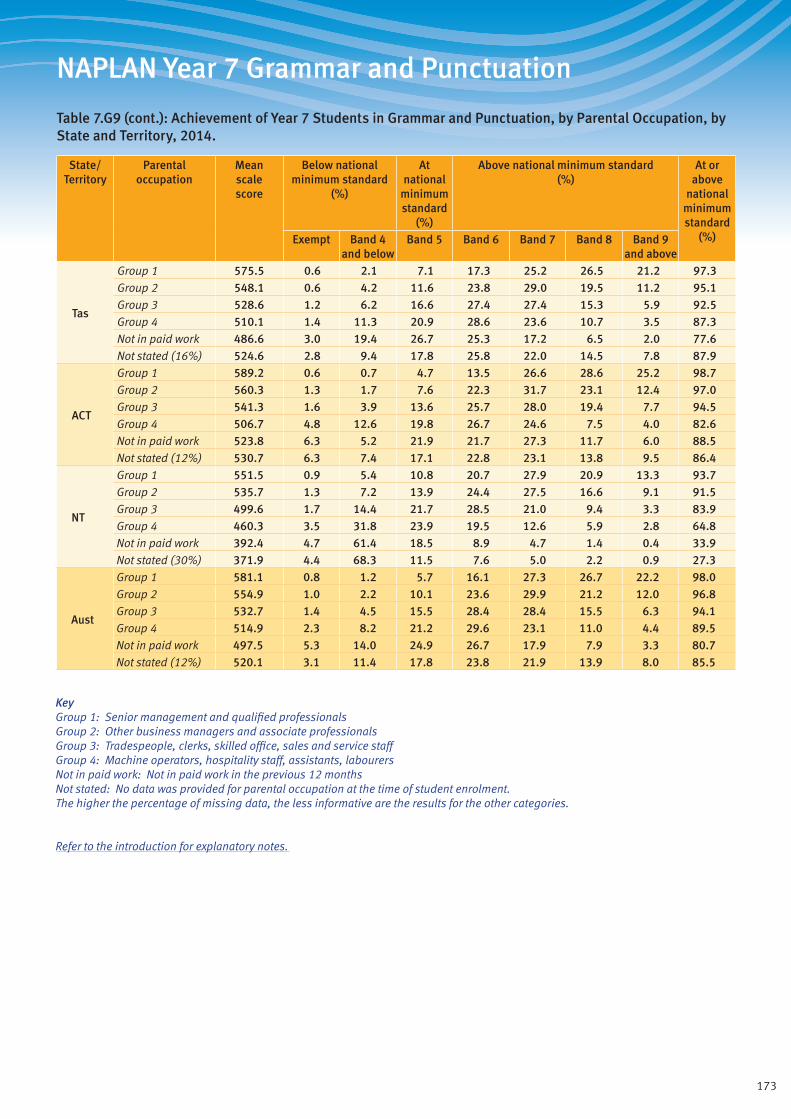
173
NAPLAN Year 7 Grammar and Punctuation
Table 7.G9 (cont.): Achievement of Year 7 Students in Grammar and Punctuation, by Parental Occupation, by State and Territory, 2014.
State/ Territory
Parental occupation
Mean scale score
Below national minimum standard
(%)
At national
minimum standard
(%)
Above national minimum standard (%)
At or above
national minimum standard
(%)Exempt Band 4 and below
Band 5 Band 6 Band 7 Band 8 Band 9 and above
Tas
Group 1 575.5 0.6 2.1 7.1 17.3 25.2 26.5 21.2 97.3Group 2 548.1 0.6 4.2 11.6 23.8 29.0 19.5 11.2 95.1Group 3 528.6 1.2 6.2 16.6 27.4 27.4 15.3 5.9 92.5Group 4 510.1 1.4 11.3 20.9 28.6 23.6 10.7 3.5 87.3Not in paid work 486.6 3.0 19.4 26.7 25.3 17.2 6.5 2.0 77.6Not stated (16%) 524.6 2.8 9.4 17.8 25.8 22.0 14.5 7.8 87.9
ACT
Group 1 589.2 0.6 0.7 4.7 13.5 26.6 28.6 25.2 98.7Group 2 560.3 1.3 1.7 7.6 22.3 31.7 23.1 12.4 97.0Group 3 541.3 1.6 3.9 13.6 25.7 28.0 19.4 7.7 94.5Group 4 506.7 4.8 12.6 19.8 26.7 24.6 7.5 4.0 82.6Not in paid work 523.8 6.3 5.2 21.9 21.7 27.3 11.7 6.0 88.5Not stated (12%) 530.7 6.3 7.4 17.1 22.8 23.1 13.8 9.5 86.4
NT
Group 1 551.5 0.9 5.4 10.8 20.7 27.9 20.9 13.3 93.7Group 2 535.7 1.3 7.2 13.9 24.4 27.5 16.6 9.1 91.5Group 3 499.6 1.7 14.4 21.7 28.5 21.0 9.4 3.3 83.9Group 4 460.3 3.5 31.8 23.9 19.5 12.6 5.9 2.8 64.8Not in paid work 392.4 4.7 61.4 18.5 8.9 4.7 1.4 0.4 33.9Not stated (30%) 371.9 4.4 68.3 11.5 7.6 5.0 2.2 0.9 27.3
Aust
Group 1 581.1 0.8 1.2 5.7 16.1 27.3 26.7 22.2 98.0Group 2 554.9 1.0 2.2 10.1 23.6 29.9 21.2 12.0 96.8Group 3 532.7 1.4 4.5 15.5 28.4 28.4 15.5 6.3 94.1Group 4 514.9 2.3 8.2 21.2 29.6 23.1 11.0 4.4 89.5Not in paid work 497.5 5.3 14.0 24.9 26.7 17.9 7.9 3.3 80.7Not stated (12%) 520.1 3.1 11.4 17.8 23.8 21.9 13.9 8.0 85.5
KeyGroup 1: Senior management and qualified professionalsGroup 2: Other business managers and associate professionalsGroup 3: Tradespeople, clerks, skilled office, sales and service staffGroup 4: Machine operators, hospitality staff, assistants, labourersNot in paid work: Not in paid work in the previous 12 monthsNot stated: No data was provided for parental occupation at the time of student enrolment. The higher the percentage of missing data, the less informative are the results for the other categories.
Refer to the introduction for explanatory notes.
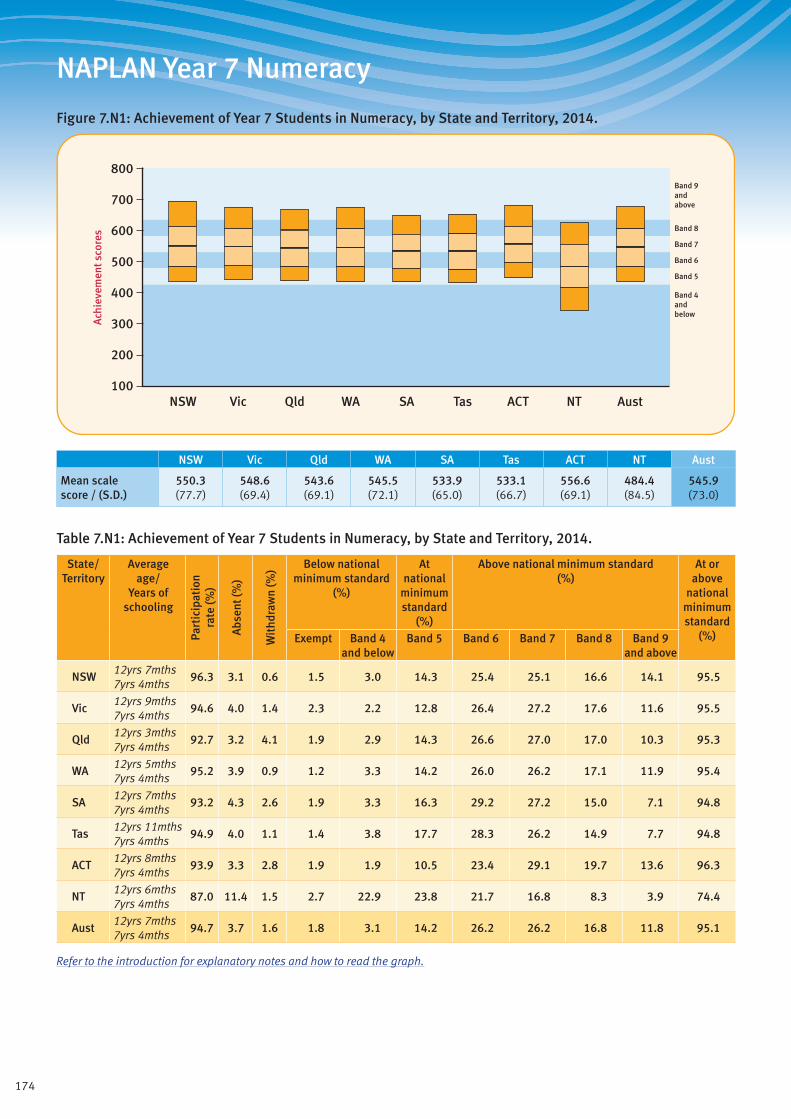
174
NAPLAN Year 7 Numeracy
Figure 7.N1: Achievement of Year 7 Students in Numeracy, by State and Territory, 2014.
Band 4andbelow
Band 5
Band 6
Band 7
Band 8
Band 9andabove
800
700
500
600
400
300
100
200
Ach
ieve
men
t sco
res
ACTQld SAWA TasVicNSW NT Aust
NSW Vic Qld WA SA Tas ACT NT Aust
Mean scale score / (S.D.)
550.3 (77.7)
548.6 (69.4)
543.6 (69.1)
545.5 (72.1)
533.9 (65.0)
533.1 (66.7)
556.6 (69.1)
484.4 (84.5)
545.9 (73.0)
Table 7.N1: Achievement of Year 7 Students in Numeracy, by State and Territory, 2014.
State/ Territory
Average age/
Years of schooling
Part
icip
atio
nra
te (%
)
Abs
ent (
%)
Wit
hdra
wn
(%) Below national
minimum standard (%)
At national
minimum standard
(%)
Above national minimum standard (%)
At or above
national minimum standard
(%)Exempt Band 4 and below
Band 5 Band 6 Band 7 Band 8 Band 9 and above
NSW12yrs 7mths 7yrs 4mths
96.3 3.1 0.6 1.5 3.0 14.3 25.4 25.1 16.6 14.1 95.5
Vic12yrs 9mths 7yrs 4mths
94.6 4.0 1.4 2.3 2.2 12.8 26.4 27.2 17.6 11.6 95.5
Qld12yrs 3mths 7yrs 4mths
92.7 3.2 4.1 1.9 2.9 14.3 26.6 27.0 17.0 10.3 95.3
WA12yrs 5mths 7yrs 4mths
95.2 3.9 0.9 1.2 3.3 14.2 26.0 26.2 17.1 11.9 95.4
SA12yrs 7mths 7yrs 4mths
93.2 4.3 2.6 1.9 3.3 16.3 29.2 27.2 15.0 7.1 94.8
Tas12yrs 11mths 7yrs 4mths
94.9 4.0 1.1 1.4 3.8 17.7 28.3 26.2 14.9 7.7 94.8
ACT12yrs 8mths 7yrs 4mths
93.9 3.3 2.8 1.9 1.9 10.5 23.4 29.1 19.7 13.6 96.3
NT12yrs 6mths 7yrs 4mths
87.0 11.4 1.5 2.7 22.9 23.8 21.7 16.8 8.3 3.9 74.4
Aust12yrs 7mths 7yrs 4mths
94.7 3.7 1.6 1.8 3.1 14.2 26.2 26.2 16.8 11.8 95.1
Refer to the introduction for explanatory notes and how to read the graph.
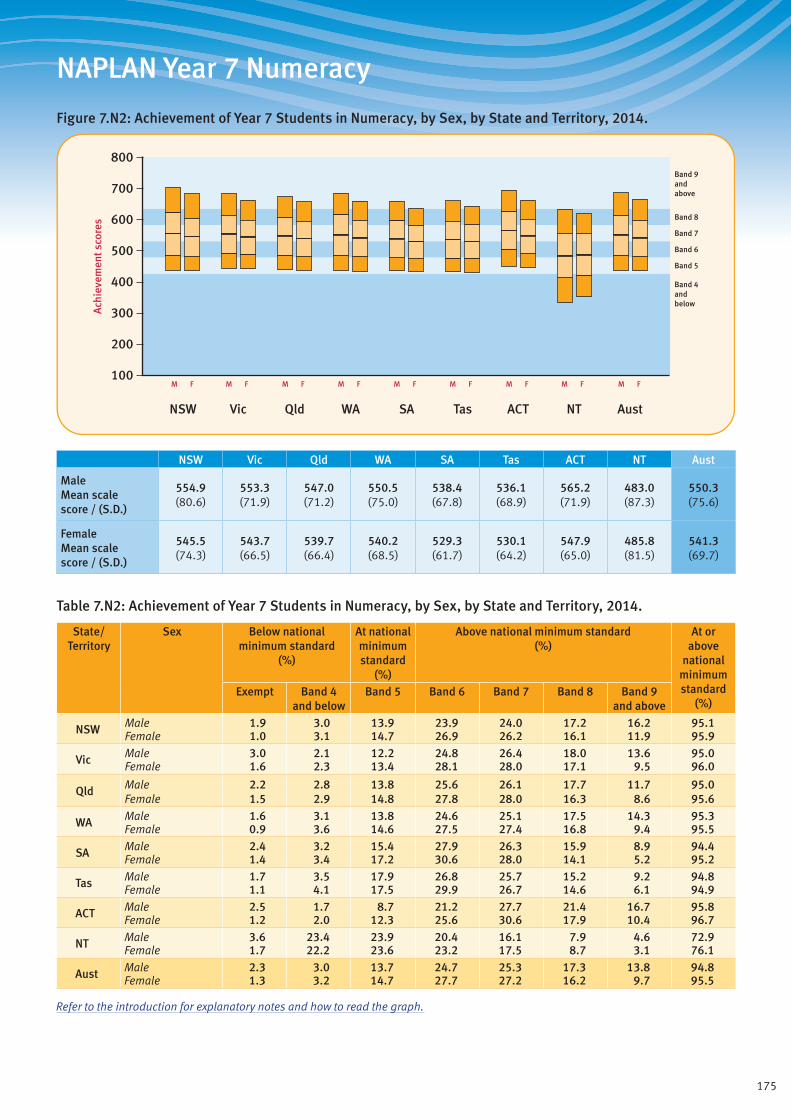
175
NAPLAN Year 7 Numeracy
Figure 7.N2: Achievement of Year 7 Students in Numeracy, by Sex, by State and Territory, 2014.
Band 4andbelow
Band 5
Band 6
Band 7
Band 8
Band 9andabove
ACTQld SAWA TasVicNSW NT Aust
M F M F M F M F M F M F M F M F M F
800
700
500
600
400
300
100
200
Ach
ieve
men
t sco
res
NSW Vic Qld WA SA Tas ACT NT Aust
Male Mean scale score / (S.D.)
554.9 (80.6)
553.3 (71.9)
547.0 (71.2)
550.5 (75.0)
538.4 (67.8)
536.1 (68.9)
565.2 (71.9)
483.0 (87.3)
550.3 (75.6)
Female Mean scale score / (S.D.)
545.5 (74.3)
543.7 (66.5)
539.7 (66.4)
540.2 (68.5)
529.3 (61.7)
530.1 (64.2)
547.9 (65.0)
485.8 (81.5)
541.3 (69.7)
Table 7.N2: Achievement of Year 7 Students in Numeracy, by Sex, by State and Territory, 2014.
State/ Territory
Sex Below national minimum standard
(%)
At national minimum standard
(%)
Above national minimum standard (%)
At or above
national minimum standard
(%)Exempt Band 4
and belowBand 5 Band 6 Band 7 Band 8 Band 9
and above
NSW Male 1.9 3.0 13.9 23.9 24.0 17.2 16.2 95.1Female 1.0 3.1 14.7 26.9 26.2 16.1 11.9 95.9
Vic Male 3.0 2.1 12.2 24.8 26.4 18.0 13.6 95.0Female 1.6 2.3 13.4 28.1 28.0 17.1 9.5 96.0
Qld Male 2.2 2.8 13.8 25.6 26.1 17.7 11.7 95.0Female 1.5 2.9 14.8 27.8 28.0 16.3 8.6 95.6
WA Male 1.6 3.1 13.8 24.6 25.1 17.5 14.3 95.3Female 0.9 3.6 14.6 27.5 27.4 16.8 9.4 95.5
SA Male 2.4 3.2 15.4 27.9 26.3 15.9 8.9 94.4Female 1.4 3.4 17.2 30.6 28.0 14.1 5.2 95.2
Tas Male 1.7 3.5 17.9 26.8 25.7 15.2 9.2 94.8Female 1.1 4.1 17.5 29.9 26.7 14.6 6.1 94.9
ACT Male 2.5 1.7 8.7 21.2 27.7 21.4 16.7 95.8Female 1.2 2.0 12.3 25.6 30.6 17.9 10.4 96.7
NT Male 3.6 23.4 23.9 20.4 16.1 7.9 4.6 72.9Female 1.7 22.2 23.6 23.2 17.5 8.7 3.1 76.1
Aust Male 2.3 3.0 13.7 24.7 25.3 17.3 13.8 94.8Female 1.3 3.2 14.7 27.7 27.2 16.2 9.7 95.5
Refer to the introduction for explanatory notes and how to read the graph.

176
NAPLAN Year 7 Numeracy
Figure 7.N3: Achievement of Year 7 Students in Numeracy, by Indigenous Status, by State and Territory, 2014.
Band 4andbelow
Band 5
Band 6
Band 7
Band 8
Band 9andabove
ACTQld SAWA TasVicNSW NT Aust
800
700
500
600
400
300
100
200
Ach
ieve
men
t sco
res
Indig. Non-Indig.
Indig. Non-Indig.
Indig. Non-Indig.
Indig. Non-Indig.
Indig. Non-Indig.
Indig. Non-Indig.
Indig. Non-Indig.
Indig. Non-Indig.
Indig. Non-Indig.
NSW Vic Qld WA SA Tas ACT NT Aust
Indigenous Mean scale score / (S.D.)
489.2 (60.4)
490.6 (59.3)
487.8 (60.0)
469.0 (60.0)
472.9 (60.3)
498.1 (61.7)
504.0 (64.9)
422.5 (67.2)
478.5 (64.4)
Non-Indigenous Mean scale score / (S.D.)
553.6 (77.1)
549.6 (69.2)
547.8 (67.8)
551.9 (69.5)
536.5 (63.9)
536.1 (66.4)
558.3 (68.6)
527.8 (60.8)
549.7 (71.5)
Table 7.N3: Achievement of Year 7 Students in Numeracy, by Indigenous Status, by State and Territory, 2014.
State/ Territory
Indigenous status
Below national minimum standard
(%)
At national minimum standard
(%)
Above national minimum standard (%)
At or above
national minimum standard
(%)Exempt Band 4
and belowBand 5 Band 6 Band 7 Band 8 Band 9
and above
NSW Indigenous 2.3 12.4 33.1 29.6 15.4 5.6 1.6 85.3Non-Indigenous 1.4 2.5 13.2 25.2 25.6 17.2 14.8 96.1
Vic Indigenous 5.4 11.1 30.0 31.4 15.7 5.0 1.5 83.6Non-Indigenous 2.2 2.0 12.5 26.3 27.4 17.8 11.8 95.8
Qld Indigenous 3.2 13.0 33.5 28.1 15.3 5.2 1.7 83.8Non-Indigenous 1.8 2.1 12.8 26.6 28.0 17.9 10.9 96.2
WA Indigenous 1.6 21.2 36.8 25.8 10.7 3.2 0.6 77.2Non-Indigenous 1.2 1.9 12.3 25.9 27.5 18.3 12.9 96.9
SA Indigenous 2.1 17.5 36.1 29.2 11.3 3.4 0.3 80.3Non-Indigenous 1.8 2.7 15.4 29.3 27.9 15.5 7.4 95.5
Tas Indigenous 1.7 9.4 30.8 32.5 15.7 6.6 3.3 88.9Non-Indigenous 1.4 3.4 16.6 27.9 27.0 15.7 8.1 95.3
ACT Indigenous 7.4 7.5 28.4 26.9 19.5 5.9 4.4 85.1Non-Indigenous 1.7 1.7 9.9 23.1 29.4 20.3 13.9 96.6
NT Indigenous 3.7 48.7 31.8 10.8 3.5 1.2 0.3 47.7Non-Indigenous 2.1 2.6 18.7 31.5 27.1 12.8 5.2 95.2
Aust Indigenous 2.8 17.7 33.4 26.9 13.3 4.6 1.3 79.5Non-Indigenous 1.7 2.3 13.0 26.2 27.0 17.5 12.4 96.1
Refer to the introduction for explanatory notes and how to read the graph.
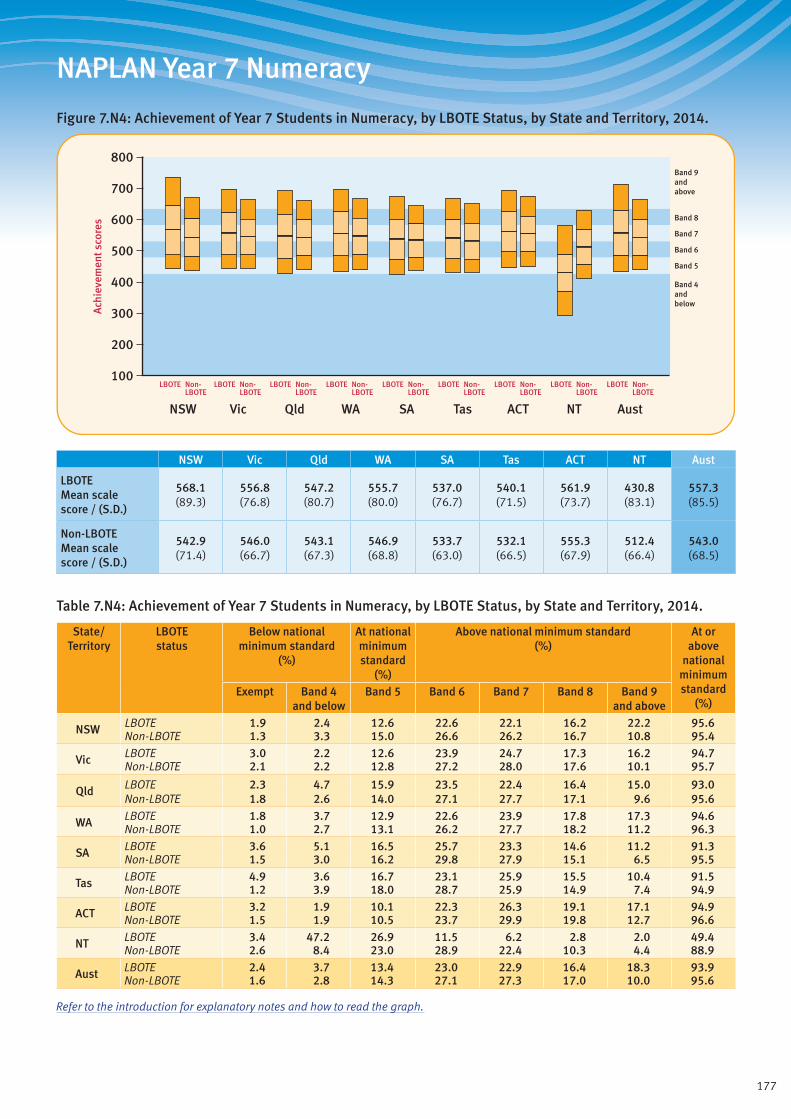
177
NAPLAN Year 7 Numeracy
Figure 7.N4: Achievement of Year 7 Students in Numeracy, by LBOTE Status, by State and Territory, 2014.
Band 4andbelow
Band 5
Band 6
Band 7
Band 8
Band 9andabove
ACTQld SAWA TasVicNSW NT Aust
800
700
500
600
400
300
100
200
Ach
ieve
men
t sco
res
LBOTE Non-LBOTE
LBOTE Non-LBOTE
LBOTE Non-LBOTE
LBOTE Non-LBOTE
LBOTE Non-LBOTE
LBOTE Non-LBOTE
LBOTE Non-LBOTE
LBOTE Non-LBOTE
LBOTE Non-LBOTE
NSW Vic Qld WA SA Tas ACT NT Aust
LBOTE Mean scale score / (S.D.)
568.1 (89.3)
556.8 (76.8)
547.2 (80.7)
555.7 (80.0)
537.0 (76.7)
540.1 (71.5)
561.9 (73.7)
430.8 (83.1)
557.3 (85.5)
Non-LBOTE Mean scale score / (S.D.)
542.9 (71.4)
546.0 (66.7)
543.1 (67.3)
546.9 (68.8)
533.7 (63.0)
532.1 (66.5)
555.3 (67.9)
512.4 (66.4)
543.0 (68.5)
Table 7.N4: Achievement of Year 7 Students in Numeracy, by LBOTE Status, by State and Territory, 2014.
State/ Territory
LBOTE status
Below national minimum standard
(%)
At national minimum standard
(%)
Above national minimum standard (%)
At or above
national minimum standard
(%)Exempt Band 4
and belowBand 5 Band 6 Band 7 Band 8 Band 9
and above
NSW LBOTE 1.9 2.4 12.6 22.6 22.1 16.2 22.2 95.6Non-LBOTE 1.3 3.3 15.0 26.6 26.2 16.7 10.8 95.4
Vic LBOTE 3.0 2.2 12.6 23.9 24.7 17.3 16.2 94.7Non-LBOTE 2.1 2.2 12.8 27.2 28.0 17.6 10.1 95.7
Qld LBOTE 2.3 4.7 15.9 23.5 22.4 16.4 15.0 93.0Non-LBOTE 1.8 2.6 14.0 27.1 27.7 17.1 9.6 95.6
WA LBOTE 1.8 3.7 12.9 22.6 23.9 17.8 17.3 94.6Non-LBOTE 1.0 2.7 13.1 26.2 27.7 18.2 11.2 96.3
SA LBOTE 3.6 5.1 16.5 25.7 23.3 14.6 11.2 91.3Non-LBOTE 1.5 3.0 16.2 29.8 27.9 15.1 6.5 95.5
Tas LBOTE 4.9 3.6 16.7 23.1 25.9 15.5 10.4 91.5Non-LBOTE 1.2 3.9 18.0 28.7 25.9 14.9 7.4 94.9
ACT LBOTE 3.2 1.9 10.1 22.3 26.3 19.1 17.1 94.9Non-LBOTE 1.5 1.9 10.5 23.7 29.9 19.8 12.7 96.6
NT LBOTE 3.4 47.2 26.9 11.5 6.2 2.8 2.0 49.4Non-LBOTE 2.6 8.4 23.0 28.9 22.4 10.3 4.4 88.9
Aust LBOTE 2.4 3.7 13.4 23.0 22.9 16.4 18.3 93.9Non-LBOTE 1.6 2.8 14.3 27.1 27.3 17.0 10.0 95.6
Refer to the introduction for explanatory notes and how to read the graph.
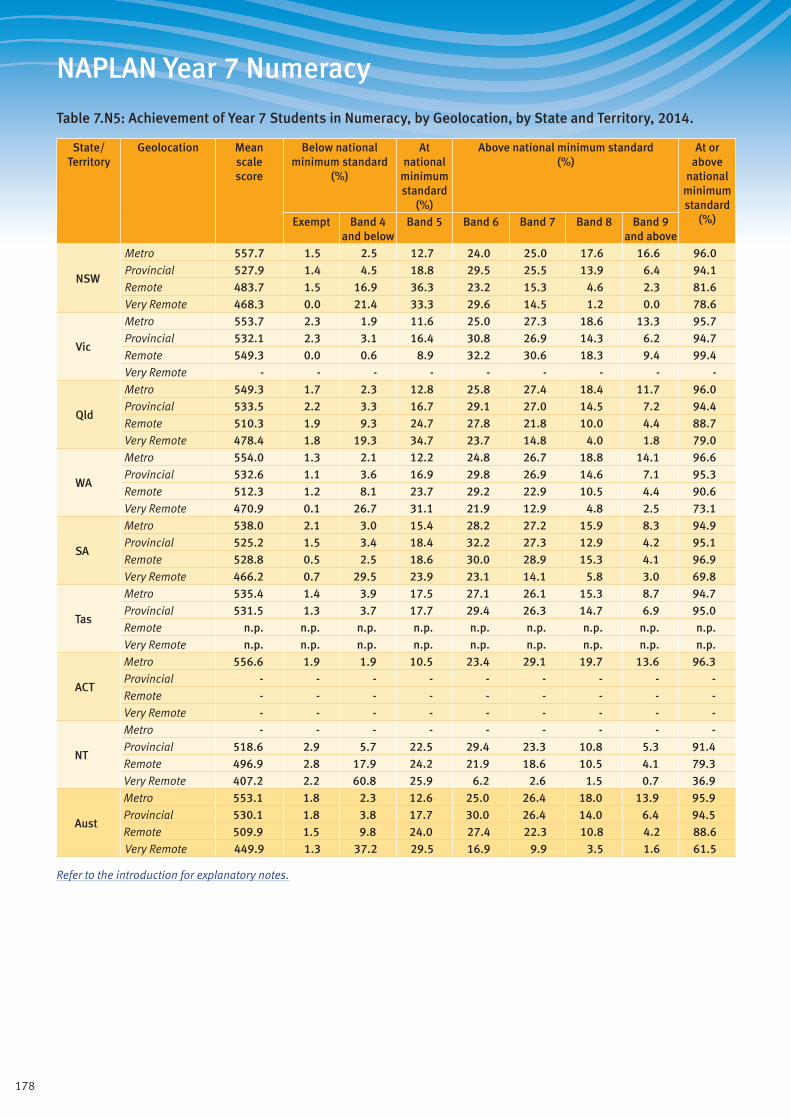
178
NAPLAN Year 7 Numeracy
Table 7.N5: Achievement of Year 7 Students in Numeracy, by Geolocation, by State and Territory, 2014.
State/ Territory
Geolocation Mean scale score
Below national minimum standard
(%)
At national
minimum standard
(%)
Above national minimum standard (%)
At or above
national minimum standard
(%)Exempt Band 4 and below
Band 5 Band 6 Band 7 Band 8 Band 9 and above
NSW
Metro 557.7 1.5 2.5 12.7 24.0 25.0 17.6 16.6 96.0Provincial 527.9 1.4 4.5 18.8 29.5 25.5 13.9 6.4 94.1Remote 483.7 1.5 16.9 36.3 23.2 15.3 4.6 2.3 81.6Very Remote 468.3 0.0 21.4 33.3 29.6 14.5 1.2 0.0 78.6
Vic
Metro 553.7 2.3 1.9 11.6 25.0 27.3 18.6 13.3 95.7Provincial 532.1 2.3 3.1 16.4 30.8 26.9 14.3 6.2 94.7Remote 549.3 0.0 0.6 8.9 32.2 30.6 18.3 9.4 99.4Very Remote - - - - - - - - -
Qld
Metro 549.3 1.7 2.3 12.8 25.8 27.4 18.4 11.7 96.0Provincial 533.5 2.2 3.3 16.7 29.1 27.0 14.5 7.2 94.4Remote 510.3 1.9 9.3 24.7 27.8 21.8 10.0 4.4 88.7Very Remote 478.4 1.8 19.3 34.7 23.7 14.8 4.0 1.8 79.0
WA
Metro 554.0 1.3 2.1 12.2 24.8 26.7 18.8 14.1 96.6Provincial 532.6 1.1 3.6 16.9 29.8 26.9 14.6 7.1 95.3Remote 512.3 1.2 8.1 23.7 29.2 22.9 10.5 4.4 90.6Very Remote 470.9 0.1 26.7 31.1 21.9 12.9 4.8 2.5 73.1
SA
Metro 538.0 2.1 3.0 15.4 28.2 27.2 15.9 8.3 94.9Provincial 525.2 1.5 3.4 18.4 32.2 27.3 12.9 4.2 95.1Remote 528.8 0.5 2.5 18.6 30.0 28.9 15.3 4.1 96.9Very Remote 466.2 0.7 29.5 23.9 23.1 14.1 5.8 3.0 69.8
Tas
Metro 535.4 1.4 3.9 17.5 27.1 26.1 15.3 8.7 94.7Provincial 531.5 1.3 3.7 17.7 29.4 26.3 14.7 6.9 95.0Remote n.p. n.p. n.p. n.p. n.p. n.p. n.p. n.p. n.p.Very Remote n.p. n.p. n.p. n.p. n.p. n.p. n.p. n.p. n.p.
ACT
Metro 556.6 1.9 1.9 10.5 23.4 29.1 19.7 13.6 96.3Provincial - - - - - - - - -Remote - - - - - - - - -Very Remote - - - - - - - - -
NT
Metro - - - - - - - - -Provincial 518.6 2.9 5.7 22.5 29.4 23.3 10.8 5.3 91.4Remote 496.9 2.8 17.9 24.2 21.9 18.6 10.5 4.1 79.3Very Remote 407.2 2.2 60.8 25.9 6.2 2.6 1.5 0.7 36.9
Aust
Metro 553.1 1.8 2.3 12.6 25.0 26.4 18.0 13.9 95.9Provincial 530.1 1.8 3.8 17.7 30.0 26.4 14.0 6.4 94.5Remote 509.9 1.5 9.8 24.0 27.4 22.3 10.8 4.2 88.6Very Remote 449.9 1.3 37.2 29.5 16.9 9.9 3.5 1.6 61.5
Refer to the introduction for explanatory notes.
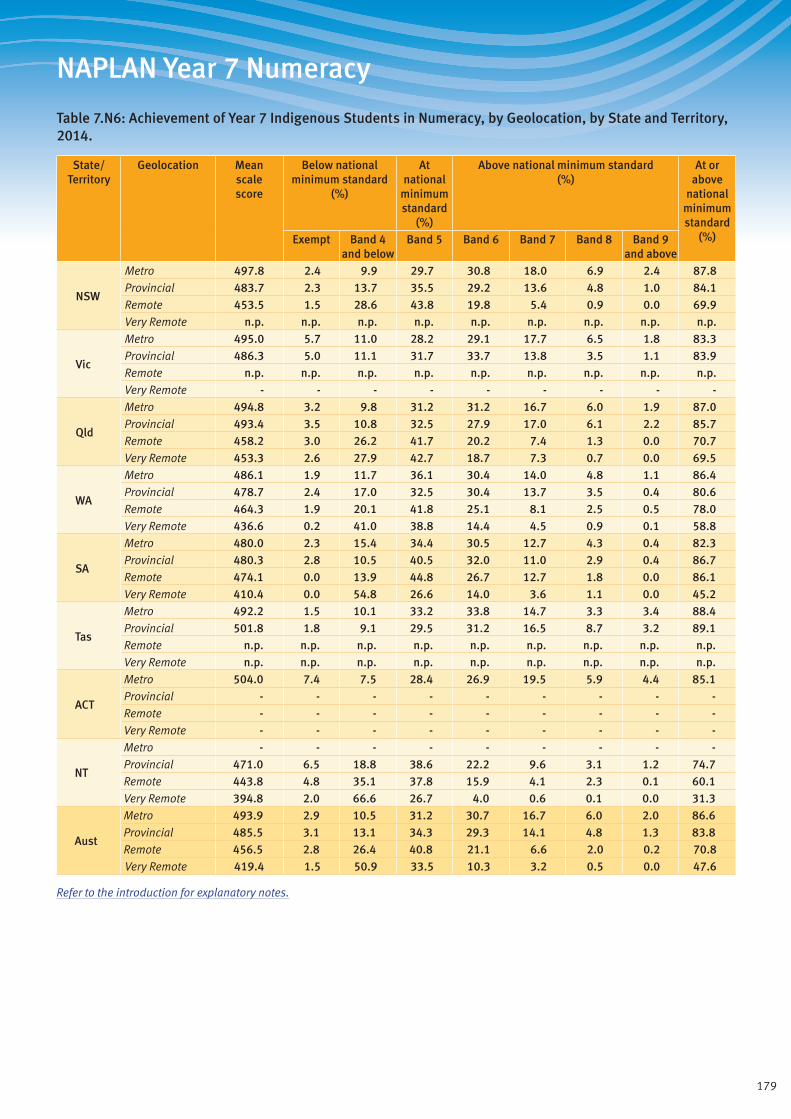
179
NAPLAN Year 7 Numeracy
Table 7.N6: Achievement of Year 7 Indigenous Students in Numeracy, by Geolocation, by State and Territory, 2014.
State/ Territory
Geolocation Mean scale score
Below national minimum standard
(%)
At national
minimum standard
(%)
Above national minimum standard (%)
At or above
national minimum standard
(%)Exempt Band 4 and below
Band 5 Band 6 Band 7 Band 8 Band 9 and above
NSW
Metro 497.8 2.4 9.9 29.7 30.8 18.0 6.9 2.4 87.8Provincial 483.7 2.3 13.7 35.5 29.2 13.6 4.8 1.0 84.1Remote 453.5 1.5 28.6 43.8 19.8 5.4 0.9 0.0 69.9Very Remote n.p. n.p. n.p. n.p. n.p. n.p. n.p. n.p. n.p.
Vic
Metro 495.0 5.7 11.0 28.2 29.1 17.7 6.5 1.8 83.3Provincial 486.3 5.0 11.1 31.7 33.7 13.8 3.5 1.1 83.9Remote n.p. n.p. n.p. n.p. n.p. n.p. n.p. n.p. n.p.Very Remote - - - - - - - - -
Qld
Metro 494.8 3.2 9.8 31.2 31.2 16.7 6.0 1.9 87.0Provincial 493.4 3.5 10.8 32.5 27.9 17.0 6.1 2.2 85.7Remote 458.2 3.0 26.2 41.7 20.2 7.4 1.3 0.0 70.7Very Remote 453.3 2.6 27.9 42.7 18.7 7.3 0.7 0.0 69.5
WA
Metro 486.1 1.9 11.7 36.1 30.4 14.0 4.8 1.1 86.4Provincial 478.7 2.4 17.0 32.5 30.4 13.7 3.5 0.4 80.6Remote 464.3 1.9 20.1 41.8 25.1 8.1 2.5 0.5 78.0Very Remote 436.6 0.2 41.0 38.8 14.4 4.5 0.9 0.1 58.8
SA
Metro 480.0 2.3 15.4 34.4 30.5 12.7 4.3 0.4 82.3Provincial 480.3 2.8 10.5 40.5 32.0 11.0 2.9 0.4 86.7Remote 474.1 0.0 13.9 44.8 26.7 12.7 1.8 0.0 86.1Very Remote 410.4 0.0 54.8 26.6 14.0 3.6 1.1 0.0 45.2
Tas
Metro 492.2 1.5 10.1 33.2 33.8 14.7 3.3 3.4 88.4Provincial 501.8 1.8 9.1 29.5 31.2 16.5 8.7 3.2 89.1Remote n.p. n.p. n.p. n.p. n.p. n.p. n.p. n.p. n.p.Very Remote n.p. n.p. n.p. n.p. n.p. n.p. n.p. n.p. n.p.
ACT
Metro 504.0 7.4 7.5 28.4 26.9 19.5 5.9 4.4 85.1Provincial - - - - - - - - -Remote - - - - - - - - -Very Remote - - - - - - - - -
NT
Metro - - - - - - - - -Provincial 471.0 6.5 18.8 38.6 22.2 9.6 3.1 1.2 74.7Remote 443.8 4.8 35.1 37.8 15.9 4.1 2.3 0.1 60.1Very Remote 394.8 2.0 66.6 26.7 4.0 0.6 0.1 0.0 31.3
Aust
Metro 493.9 2.9 10.5 31.2 30.7 16.7 6.0 2.0 86.6Provincial 485.5 3.1 13.1 34.3 29.3 14.1 4.8 1.3 83.8Remote 456.5 2.8 26.4 40.8 21.1 6.6 2.0 0.2 70.8Very Remote 419.4 1.5 50.9 33.5 10.3 3.2 0.5 0.0 47.6
Refer to the introduction for explanatory notes.

180
NAPLAN Year 7 Numeracy
Table 7.N7: Achievement of Year 7 Non-Indigenous Students in Numeracy, by Geolocation, by State and Territory, 2014.
State/ Territory
Geolocation Mean scale score
Below national minimum standard
(%)
At national
minimum standard
(%)
Above national minimum standard (%)
At or above
national minimum standard
(%)Exempt Band 4 and below
Band 5 Band 6 Band 7 Band 8 Band 9 and above
NSW
Metro 559.6 1.4 2.3 12.2 23.9 25.3 17.9 17.1 96.3Provincial 533.3 1.3 3.3 16.7 29.7 27.0 15.0 7.0 95.4Remote 513.3 1.5 5.8 28.8 26.2 24.6 8.3 4.8 92.6Very Remote n.p. n.p. n.p. n.p. n.p. n.p. n.p. n.p. n.p.
Vic
Metro 554.4 2.2 1.8 11.4 25.0 27.4 18.7 13.4 95.9Provincial 533.8 2.1 2.8 15.8 30.7 27.5 14.8 6.4 95.2Remote 549.8 0.0 0.6 8.6 32.6 30.3 18.9 9.1 99.4Very Remote - - - - - - - - -
Qld
Metro 552.1 1.6 1.9 11.8 25.5 28.0 19.0 12.2 96.5Provincial 537.9 2.1 2.5 15.0 29.1 28.1 15.4 7.8 95.4Remote 529.0 1.5 3.0 18.7 30.9 26.5 13.3 6.1 95.4Very Remote 519.3 0.5 4.5 21.9 31.7 27.0 9.5 4.9 95.0
WA
Metro 557.1 1.3 1.7 11.1 24.5 27.2 19.4 14.8 97.0Provincial 537.7 0.9 2.4 15.3 29.8 28.1 15.7 7.8 96.7Remote 531.7 1.0 3.1 16.4 30.7 28.8 13.8 6.1 95.9Very Remote 529.2 0.0 2.7 18.4 34.0 27.2 11.2 6.6 97.3
SA
Metro 539.7 2.0 2.6 14.8 28.2 27.7 16.2 8.5 95.4Provincial 527.9 1.4 3.0 17.0 32.3 28.3 13.5 4.5 95.6Remote 532.2 0.6 1.9 17.1 29.9 29.8 16.2 4.4 97.5Very Remote 526.8 1.4 1.9 20.6 33.6 25.6 10.8 6.1 96.7
Tas
Metro 538.9 1.5 3.5 16.4 26.3 26.6 16.4 9.3 95.0Provincial 534.0 1.3 3.2 16.7 29.2 27.2 15.3 7.2 95.6Remote n.p. n.p. n.p. n.p. n.p. n.p. n.p. n.p. n.p.Very Remote n.p. n.p. n.p. n.p. n.p. n.p. n.p. n.p. n.p.
ACT
Metro 558.3 1.7 1.7 9.9 23.1 29.4 20.3 13.9 96.6Provincial - - - - - - - - -Remote - - - - - - - - -Very Remote - - - - - - - - -
NT
Metro - - - - - - - - -Provincial 523.4 2.3 2.6 20.4 32.9 26.2 11.2 4.3 95.1Remote 541.3 1.2 2.8 12.9 26.9 31.1 17.5 7.6 96.1Very Remote 537.8 4.2 1.4 17.2 28.1 23.6 16.9 8.6 94.4
Aust
Metro 555.0 1.7 2.0 12.0 24.8 26.8 18.4 14.3 96.2Provincial 534.1 1.6 2.9 16.1 30.1 27.5 14.9 6.8 95.5Remote 531.6 1.1 3.0 17.2 29.8 28.6 14.4 5.9 96.0Very Remote 526.5 0.9 3.1 19.6 32.2 26.9 11.3 5.9 96.0
Refer to the introduction for explanatory notes.

181
NAPLAN Year 7 Numeracy
Table 7.N8: Achievement of Year 7 Students in Numeracy, by Parental Education, by State and Territory, 2014.
State/ Territory
Parental education
Mean scale score
Below national minimum standard
(%)
At national
minimum standard
(%)
Above national minimum standard (%)
At or above
national minimum standard
(%)Exempt Band 4 and below
Band 5 Band 6 Band 7 Band 8 Band 9 and above
NSW
Bachelor 593.0 1.0 0.5 4.9 15.9 25.6 24.0 28.1 98.5Diploma 548.7 1.1 1.9 12.2 27.3 29.2 17.3 10.9 97.0Certificate 525.2 1.3 3.8 19.2 32.4 25.7 12.3 5.3 94.9Year 12 535.2 1.8 3.5 16.7 30.1 25.3 13.9 8.7 94.8Year 11 498.7 3.2 9.0 30.0 31.5 16.9 6.5 2.9 87.8Not stated (6%) 541.2 2.3 4.6 17.4 24.0 24.1 15.4 12.3 93.1
Vic
Bachelor 579.8 1.3 0.6 5.0 18.4 28.7 25.0 21.0 98.1Diploma 542.4 1.8 1.8 12.4 29.1 30.5 16.4 7.9 96.4Certificate 526.3 2.2 2.9 17.9 33.1 26.9 12.6 4.4 94.9Year 12 537.7 2.7 2.3 15.5 29.8 26.7 14.7 8.2 95.0Year 11 509.9 6.0 5.9 24.4 32.0 20.0 8.5 3.3 88.1Not stated (5%) 572.7 2.4 1.7 8.7 19.0 25.5 21.8 21.0 96.0
Qld
Bachelor 580.7 0.9 0.6 5.2 17.3 28.6 26.3 21.0 98.5Diploma 544.8 1.3 1.6 12.0 28.9 30.0 18.0 8.3 97.2Certificate 530.2 1.5 2.9 16.5 31.7 28.2 13.6 5.4 95.5Year 12 530.3 2.5 3.3 16.9 31.1 26.3 14.1 5.9 94.2Year 11 500.9 3.8 8.1 28.4 31.4 19.3 6.8 2.2 88.1Not stated (12%) 533.1 3.2 4.4 18.2 26.7 24.8 13.7 8.9 92.4
WA
Bachelor 585.0 0.9 0.5 4.9 16.7 27.4 25.9 23.7 98.6Diploma 547.4 0.8 1.6 11.7 28.3 29.4 18.1 10.0 97.6Certificate 531.8 1.0 2.8 16.1 31.5 28.7 14.4 5.5 96.2Year 12 531.1 1.4 3.2 16.1 32.8 26.6 13.2 6.7 95.4Year 11 502.5 1.7 8.4 28.2 31.9 19.8 7.1 3.1 90.0Not stated (16%) 525.5 2.2 7.4 20.4 26.3 21.9 12.7 9.1 90.4
SA
Bachelor 569.6 0.8 0.7 6.0 21.0 30.6 24.5 16.3 98.5Diploma 536.1 1.1 1.9 13.6 31.4 30.7 16.2 5.1 96.9Certificate 522.8 1.3 3.1 19.2 33.6 27.8 11.5 3.4 95.6Year 12 524.5 2.2 3.4 19.4 31.5 26.5 12.5 4.5 94.4Year 11 497.2 3.9 7.9 29.1 33.5 18.9 5.5 1.2 88.2Not stated (13%) 522.7 3.8 5.7 19.1 28.9 24.3 12.7 5.6 90.5
KeyBachelor: Bachelor degree or aboveDiploma: Advanced diploma/diplomaCertificate: Certificate I to IVYear 12: Year 12 or equivalentYear 11: Year 11 or equivalent or belowNot stated: No data was provided for parental education at the time of student enrolment. The higher the percentage of missing data, the less informative are the results for the other categories.
Refer to the introduction for explanatory notes.
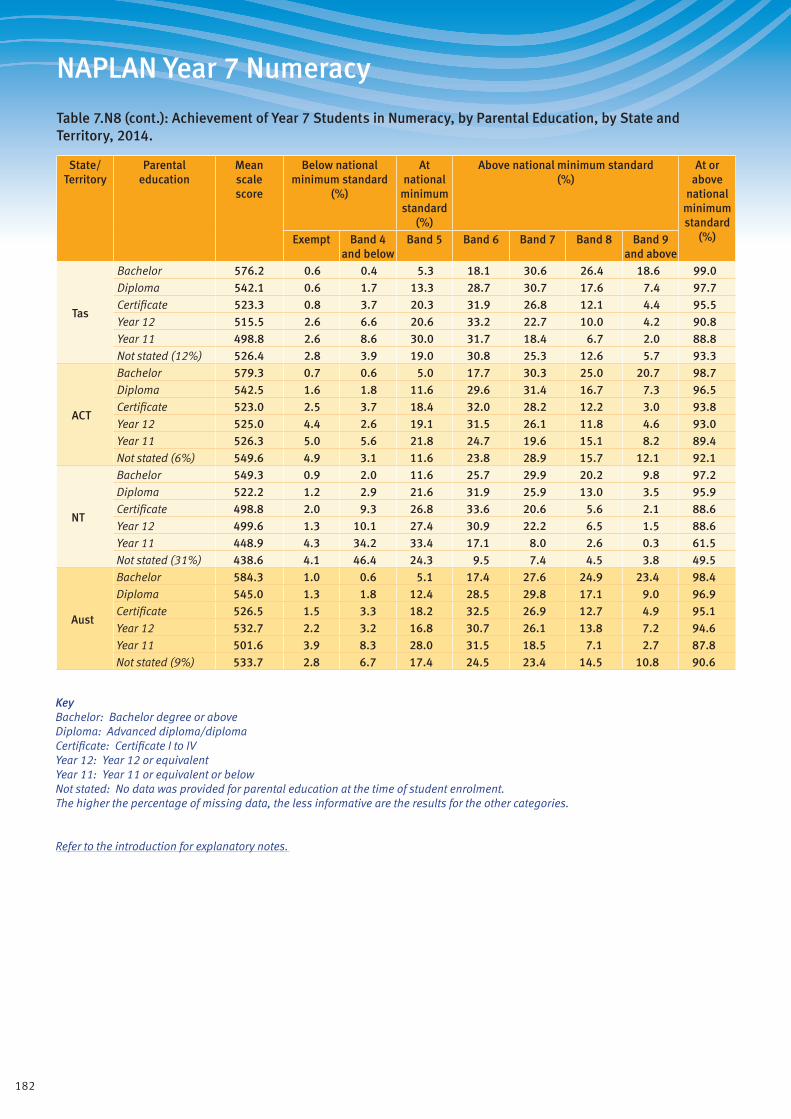
182
NAPLAN Year 7 Numeracy
Table 7.N8 (cont.): Achievement of Year 7 Students in Numeracy, by Parental Education, by State and Territory, 2014.
State/ Territory
Parental education
Mean scale score
Below national minimum standard
(%)
At national
minimum standard
(%)
Above national minimum standard (%)
At or above
national minimum standard
(%)Exempt Band 4 and below
Band 5 Band 6 Band 7 Band 8 Band 9 and above
Tas
Bachelor 576.2 0.6 0.4 5.3 18.1 30.6 26.4 18.6 99.0Diploma 542.1 0.6 1.7 13.3 28.7 30.7 17.6 7.4 97.7Certificate 523.3 0.8 3.7 20.3 31.9 26.8 12.1 4.4 95.5Year 12 515.5 2.6 6.6 20.6 33.2 22.7 10.0 4.2 90.8Year 11 498.8 2.6 8.6 30.0 31.7 18.4 6.7 2.0 88.8Not stated (12%) 526.4 2.8 3.9 19.0 30.8 25.3 12.6 5.7 93.3
ACT
Bachelor 579.3 0.7 0.6 5.0 17.7 30.3 25.0 20.7 98.7Diploma 542.5 1.6 1.8 11.6 29.6 31.4 16.7 7.3 96.5Certificate 523.0 2.5 3.7 18.4 32.0 28.2 12.2 3.0 93.8Year 12 525.0 4.4 2.6 19.1 31.5 26.1 11.8 4.6 93.0Year 11 526.3 5.0 5.6 21.8 24.7 19.6 15.1 8.2 89.4Not stated (6%) 549.6 4.9 3.1 11.6 23.8 28.9 15.7 12.1 92.1
NT
Bachelor 549.3 0.9 2.0 11.6 25.7 29.9 20.2 9.8 97.2Diploma 522.2 1.2 2.9 21.6 31.9 25.9 13.0 3.5 95.9Certificate 498.8 2.0 9.3 26.8 33.6 20.6 5.6 2.1 88.6Year 12 499.6 1.3 10.1 27.4 30.9 22.2 6.5 1.5 88.6Year 11 448.9 4.3 34.2 33.4 17.1 8.0 2.6 0.3 61.5Not stated (31%) 438.6 4.1 46.4 24.3 9.5 7.4 4.5 3.8 49.5
Aust
Bachelor 584.3 1.0 0.6 5.1 17.4 27.6 24.9 23.4 98.4Diploma 545.0 1.3 1.8 12.4 28.5 29.8 17.1 9.0 96.9Certificate 526.5 1.5 3.3 18.2 32.5 26.9 12.7 4.9 95.1Year 12 532.7 2.2 3.2 16.8 30.7 26.1 13.8 7.2 94.6Year 11 501.6 3.9 8.3 28.0 31.5 18.5 7.1 2.7 87.8Not stated (9%) 533.7 2.8 6.7 17.4 24.5 23.4 14.5 10.8 90.6
KeyBachelor: Bachelor degree or aboveDiploma: Advanced diploma/diplomaCertificate: Certificate I to IVYear 12: Year 12 or equivalentYear 11: Year 11 or equivalent or belowNot stated: No data was provided for parental education at the time of student enrolment. The higher the percentage of missing data, the less informative are the results for the other categories.
Refer to the introduction for explanatory notes.

183
NAPLAN Year 7 Numeracy
Table 7.N9: Achievement of Year 7 Students in Numeracy, by Parental Occupation, by State and Territory, 2014.
State/ Territory
Parental occupation
Mean scale score
Below national minimum standard
(%)
At national
minimum standard
(%)
Above national minimum standard (%)
At or above
national minimum standard
(%)Exempt Band 4 and below
Band 5 Band 6 Band 7 Band 8 Band 9 and above
NSW
Group 1 588.3 0.8 0.6 5.4 16.7 26.3 24.1 26.0 98.5Group 2 561.7 0.9 1.2 9.6 24.5 29.0 19.4 15.4 97.9Group 3 535.3 1.2 2.9 16.5 30.9 26.4 13.9 8.0 95.8Group 4 522.8 1.8 5.0 22.4 31.6 21.6 10.2 7.4 93.2Not in paid work 504.2 3.6 9.4 28.5 29.5 16.7 7.4 4.9 87.0Not stated (9%) 528.1 3.0 6.2 21.3 26.4 21.0 12.4 9.7 90.8
Vic
Group 1 580.4 1.0 0.5 5.0 18.4 28.7 25.2 21.3 98.5Group 2 555.1 1.2 1.1 9.5 25.7 31.0 19.8 11.6 97.7Group 3 537.7 1.7 2.1 14.4 30.7 28.7 15.6 6.9 96.2Group 4 523.2 3.1 3.7 20.3 32.7 23.6 10.9 5.7 93.2Not in paid work 509.2 7.9 6.4 24.3 30.7 18.7 8.1 3.8 85.7Not stated (5%) 573.7 2.1 1.7 9.0 18.8 25.2 20.9 22.2 96.2
Qld
Group 1 579.0 0.8 0.6 5.5 18.1 28.6 25.7 20.6 98.6Group 2 555.5 1.1 1.1 9.5 25.6 30.6 20.4 11.8 97.9Group 3 533.5 1.6 2.5 15.5 31.3 28.7 14.6 5.9 96.0Group 4 517.0 2.6 5.1 22.0 32.3 23.5 10.4 4.1 92.3Not in paid work 504.2 4.8 8.6 27.6 29.1 18.6 7.7 3.6 86.6Not stated (16%) 525.5 3.3 5.1 20.4 28.3 23.7 12.3 7.0 91.7
WA
Group 1 580.3 0.7 0.7 6.0 18.1 27.3 25.0 22.2 98.6Group 2 555.5 0.9 1.2 9.9 25.5 30.3 20.0 12.3 97.9Group 3 536.4 1.0 2.2 14.8 30.9 28.9 15.3 6.8 96.7Group 4 521.8 1.3 4.5 21.0 32.5 23.8 11.1 5.7 94.2Not in paid work 502.3 2.7 10.9 27.0 29.2 18.4 7.8 4.0 86.4Not stated (23%) 524.7 2.0 6.7 20.6 27.8 22.2 12.1 8.5 91.2
SA
Group 1 566.0 0.8 0.9 6.9 21.7 30.9 23.4 15.3 98.2Group 2 546.2 0.8 1.2 10.8 28.6 32.2 18.7 7.7 98.0Group 3 529.2 1.0 2.3 16.8 33.2 28.6 13.6 4.4 96.7Group 4 514.3 2.0 4.4 23.0 34.3 24.1 9.3 3.0 93.6Not in paid work 500.5 4.0 8.1 27.7 33.1 17.9 6.6 2.5 87.9Not stated (20%) 514.0 4.3 6.6 23.4 29.3 21.5 10.1 4.7 89.1
KeyGroup 1: Senior management and qualified professionalsGroup 2: Other business managers and associate professionalsGroup 3: Tradespeople, clerks, skilled office, sales and service staffGroup 4: Machine operators, hospitality staff, assistants, labourersNot in paid work: Not in paid work in the previous 12 monthsNot stated: No data was provided for parental occupation at the time of student enrolment. The higher the percentage of missing data, the less informative are the results for the other categories.
Refer to the introduction for explanatory notes.
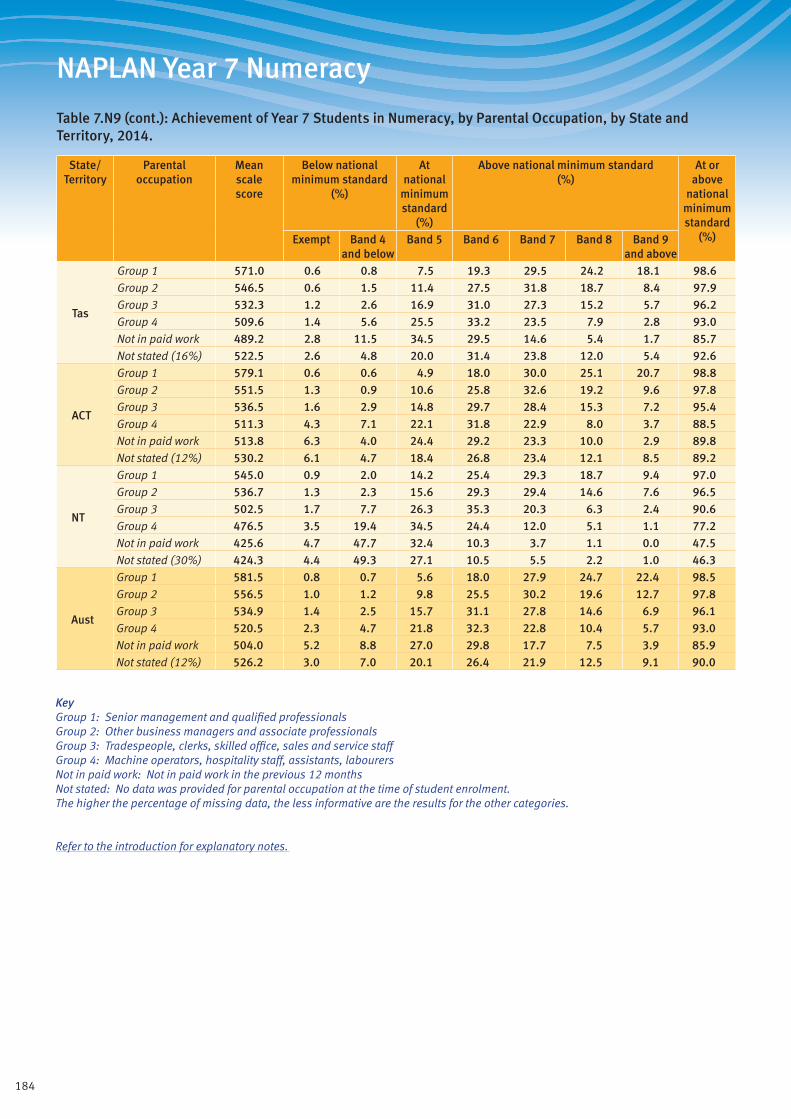
184
NAPLAN Year 7 Numeracy
Table 7.N9 (cont.): Achievement of Year 7 Students in Numeracy, by Parental Occupation, by State and Territory, 2014.
State/ Territory
Parental occupation
Mean scale score
Below national minimum standard
(%)
At national
minimum standard
(%)
Above national minimum standard (%)
At or above
national minimum standard
(%)Exempt Band 4 and below
Band 5 Band 6 Band 7 Band 8 Band 9 and above
Tas
Group 1 571.0 0.6 0.8 7.5 19.3 29.5 24.2 18.1 98.6Group 2 546.5 0.6 1.5 11.4 27.5 31.8 18.7 8.4 97.9Group 3 532.3 1.2 2.6 16.9 31.0 27.3 15.2 5.7 96.2Group 4 509.6 1.4 5.6 25.5 33.2 23.5 7.9 2.8 93.0Not in paid work 489.2 2.8 11.5 34.5 29.5 14.6 5.4 1.7 85.7Not stated (16%) 522.5 2.6 4.8 20.0 31.4 23.8 12.0 5.4 92.6
ACT
Group 1 579.1 0.6 0.6 4.9 18.0 30.0 25.1 20.7 98.8Group 2 551.5 1.3 0.9 10.6 25.8 32.6 19.2 9.6 97.8Group 3 536.5 1.6 2.9 14.8 29.7 28.4 15.3 7.2 95.4Group 4 511.3 4.3 7.1 22.1 31.8 22.9 8.0 3.7 88.5Not in paid work 513.8 6.3 4.0 24.4 29.2 23.3 10.0 2.9 89.8Not stated (12%) 530.2 6.1 4.7 18.4 26.8 23.4 12.1 8.5 89.2
NT
Group 1 545.0 0.9 2.0 14.2 25.4 29.3 18.7 9.4 97.0Group 2 536.7 1.3 2.3 15.6 29.3 29.4 14.6 7.6 96.5Group 3 502.5 1.7 7.7 26.3 35.3 20.3 6.3 2.4 90.6Group 4 476.5 3.5 19.4 34.5 24.4 12.0 5.1 1.1 77.2Not in paid work 425.6 4.7 47.7 32.4 10.3 3.7 1.1 0.0 47.5Not stated (30%) 424.3 4.4 49.3 27.1 10.5 5.5 2.2 1.0 46.3
Aust
Group 1 581.5 0.8 0.7 5.6 18.0 27.9 24.7 22.4 98.5Group 2 556.5 1.0 1.2 9.8 25.5 30.2 19.6 12.7 97.8Group 3 534.9 1.4 2.5 15.7 31.1 27.8 14.6 6.9 96.1Group 4 520.5 2.3 4.7 21.8 32.3 22.8 10.4 5.7 93.0Not in paid work 504.0 5.2 8.8 27.0 29.8 17.7 7.5 3.9 85.9Not stated (12%) 526.2 3.0 7.0 20.1 26.4 21.9 12.5 9.1 90.0
KeyGroup 1: Senior management and qualified professionalsGroup 2: Other business managers and associate professionalsGroup 3: Tradespeople, clerks, skilled office, sales and service staffGroup 4: Machine operators, hospitality staff, assistants, labourersNot in paid work: Not in paid work in the previous 12 monthsNot stated: No data was provided for parental occupation at the time of student enrolment. The higher the percentage of missing data, the less informative are the results for the other categories.
Refer to the introduction for explanatory notes.

185
NAPLAN Year 7 Participation
Table 7.P1: Year 7 Student Participation in Assessment, by State and Territory, 2014.
State/ Territory
Reading Persuasive Writing
Spelling Grammar and Punctuation
Numeracy
NSW Number 85123 85219 85387 85387 84812Participation Rate (%) 96.7 96.8 97.0 97.0 96.3
Vic Number 63092 63122 63243 63243 62901Participation Rate (%) 94.9 94.9 95.1 95.1 94.6
Qld Number 38321 38288 38435 38435 38152Participation Rate (%) 93.1 93.1 93.4 93.4 92.7
WA Number 28767 28823 28902 28902 28645Participation Rate (%) 95.6 95.7 96.0 96.0 95.2
SA Number 18098 18097 18131 18131 17979Participation Rate (%) 93.8 93.8 94.0 94.0 93.2
Tas Number 5875 5868 5904 5904 5861Participation Rate (%) 95.1 95.0 95.5 95.5 94.9
ACT Number 4510 4529 4528 4528 4482Participation Rate (%) 94.5 94.9 94.9 94.9 93.9
NT Number 2842 2858 2858 2858 2797Participation Rate (%) 88.4 88.9 88.9 88.9 87.0
Aust Number 246628 246804 247388 247388 245629Participation Rate (%) 95.1 95.2 95.4 95.4 94.7
Refer to the introduction for explanatory notes.
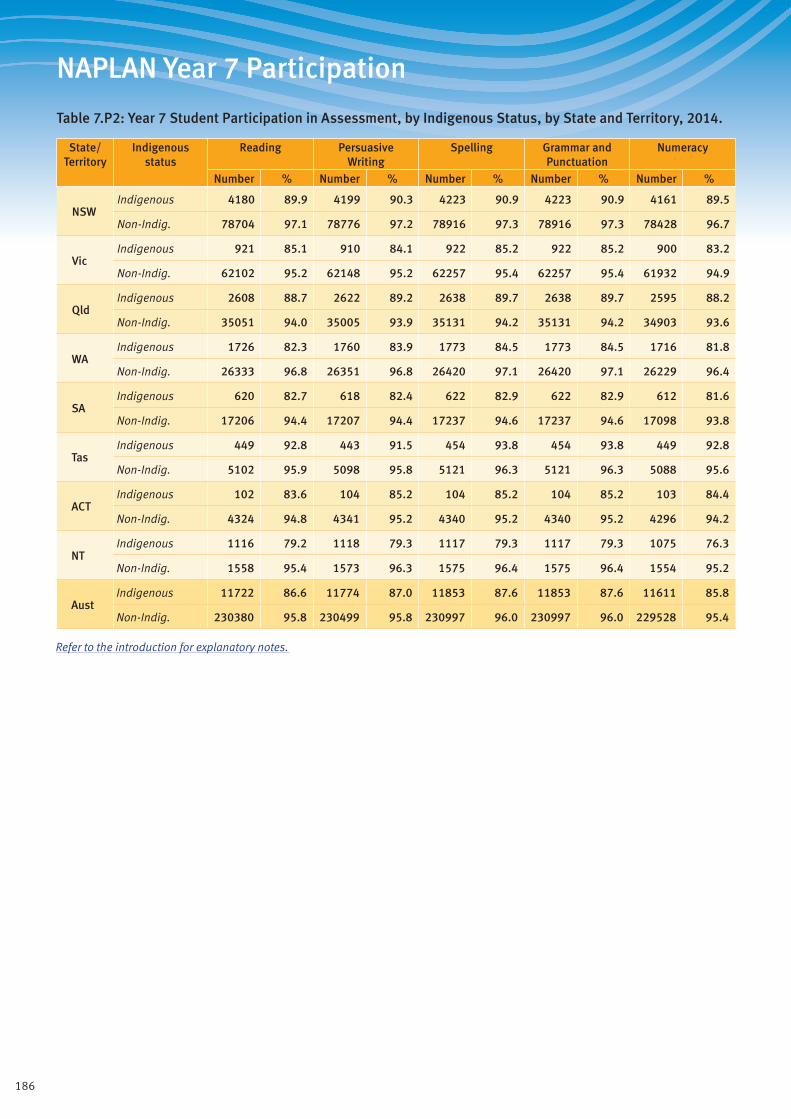
186
NAPLAN Year 7 Participation
Table 7.P2: Year 7 Student Participation in Assessment, by Indigenous Status, by State and Territory, 2014.
State/ Territory
Indigenous status
Reading Persuasive Writing
Spelling Grammar and Punctuation
Numeracy
Number % Number % Number % Number % Number %
NSWIndigenous 4180 89.9 4199 90.3 4223 90.9 4223 90.9 4161 89.5
Non-Indig. 78704 97.1 78776 97.2 78916 97.3 78916 97.3 78428 96.7
VicIndigenous 921 85.1 910 84.1 922 85.2 922 85.2 900 83.2
Non-Indig. 62102 95.2 62148 95.2 62257 95.4 62257 95.4 61932 94.9
QldIndigenous 2608 88.7 2622 89.2 2638 89.7 2638 89.7 2595 88.2
Non-Indig. 35051 94.0 35005 93.9 35131 94.2 35131 94.2 34903 93.6
WAIndigenous 1726 82.3 1760 83.9 1773 84.5 1773 84.5 1716 81.8
Non-Indig. 26333 96.8 26351 96.8 26420 97.1 26420 97.1 26229 96.4
SAIndigenous 620 82.7 618 82.4 622 82.9 622 82.9 612 81.6
Non-Indig. 17206 94.4 17207 94.4 17237 94.6 17237 94.6 17098 93.8
TasIndigenous 449 92.8 443 91.5 454 93.8 454 93.8 449 92.8
Non-Indig. 5102 95.9 5098 95.8 5121 96.3 5121 96.3 5088 95.6
ACTIndigenous 102 83.6 104 85.2 104 85.2 104 85.2 103 84.4
Non-Indig. 4324 94.8 4341 95.2 4340 95.2 4340 95.2 4296 94.2
NTIndigenous 1116 79.2 1118 79.3 1117 79.3 1117 79.3 1075 76.3
Non-Indig. 1558 95.4 1573 96.3 1575 96.4 1575 96.4 1554 95.2
AustIndigenous 11722 86.6 11774 87.0 11853 87.6 11853 87.6 11611 85.8
Non-Indig. 230380 95.8 230499 95.8 230997 96.0 230997 96.0 229528 95.4
Refer to the introduction for explanatory notes.

187
NAPLAN Year 7 Participation
Table 7.P3: Percentage of Year 7 Student Exemptions, Absences and Withdrawals by State and Territory, 2014.
State/ Territory
Reading (%)
Persuasive Writing
(%)
Spelling (%)
Grammar and Punctuation
(%)
Numeracy (%)
E A W E A W E A W E A W E A W
NSW 1.5 2.8 0.6 1.5 2.6 0.6 1.5 2.5 0.6 1.5 2.5 0.6 1.5 3.1 0.6
Vic 2.3 3.7 1.4 2.4 3.7 1.4 2.4 3.5 1.4 2.4 3.5 1.4 2.3 4.0 1.4
Qld 1.9 2.7 4.1 2.0 2.8 4.1 1.9 2.5 4.1 1.9 2.5 4.1 1.9 3.2 4.1
WA 1.2 3.5 1.0 1.3 3.3 1.0 1.2 3.0 1.0 1.2 3.0 1.0 1.2 3.9 0.9
SA 1.9 3.7 2.6 1.9 3.7 2.6 1.9 3.5 2.6 1.9 3.5 2.6 1.9 4.3 2.6
Tas 1.4 3.8 1.1 1.4 3.9 1.1 1.4 3.4 1.1 1.4 3.4 1.1 1.4 4.0 1.1
ACT 1.9 2.7 2.8 1.9 2.4 2.7 1.9 2.4 2.7 1.9 2.4 2.7 1.9 3.3 2.8
NT 2.7 10.0 1.5 2.7 9.6 1.5 2.7 9.6 1.5 2.7 9.6 1.5 2.7 11.4 1.5
Aust 1.8 3.3 1.6 1.8 3.2 1.6 1.8 3.0 1.6 1.8 3.0 1.6 1.8 3.7 1.6
Refer to the introduction for explanatory notes.
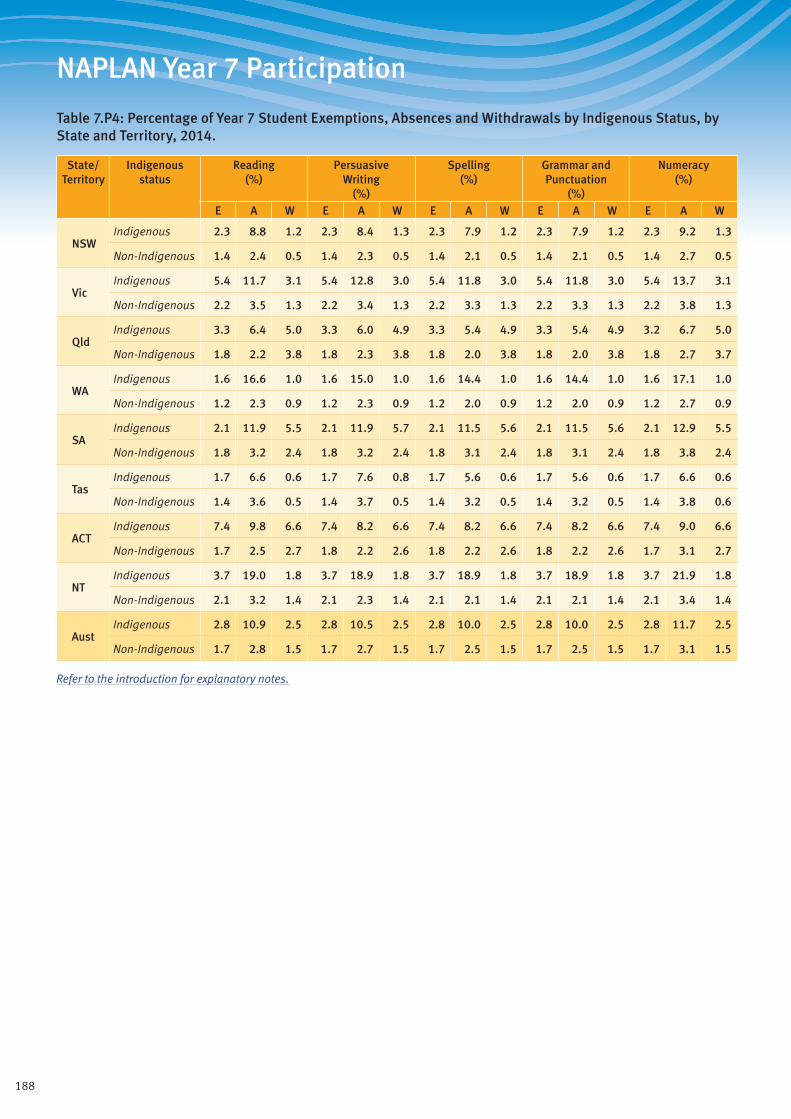
188
NAPLAN Year 7 Participation
Table 7.P4: Percentage of Year 7 Student Exemptions, Absences and Withdrawals by Indigenous Status, by State and Territory, 2014.
State/ Territory
Indigenous status
Reading (%)
Persuasive Writing
(%)
Spelling (%)
Grammar and Punctuation
(%)
Numeracy (%)
E A W E A W E A W E A W E A W
NSWIndigenous 2.3 8.8 1.2 2.3 8.4 1.3 2.3 7.9 1.2 2.3 7.9 1.2 2.3 9.2 1.3
Non-Indigenous 1.4 2.4 0.5 1.4 2.3 0.5 1.4 2.1 0.5 1.4 2.1 0.5 1.4 2.7 0.5
VicIndigenous 5.4 11.7 3.1 5.4 12.8 3.0 5.4 11.8 3.0 5.4 11.8 3.0 5.4 13.7 3.1
Non-Indigenous 2.2 3.5 1.3 2.2 3.4 1.3 2.2 3.3 1.3 2.2 3.3 1.3 2.2 3.8 1.3
QldIndigenous 3.3 6.4 5.0 3.3 6.0 4.9 3.3 5.4 4.9 3.3 5.4 4.9 3.2 6.7 5.0
Non-Indigenous 1.8 2.2 3.8 1.8 2.3 3.8 1.8 2.0 3.8 1.8 2.0 3.8 1.8 2.7 3.7
WAIndigenous 1.6 16.6 1.0 1.6 15.0 1.0 1.6 14.4 1.0 1.6 14.4 1.0 1.6 17.1 1.0
Non-Indigenous 1.2 2.3 0.9 1.2 2.3 0.9 1.2 2.0 0.9 1.2 2.0 0.9 1.2 2.7 0.9
SAIndigenous 2.1 11.9 5.5 2.1 11.9 5.7 2.1 11.5 5.6 2.1 11.5 5.6 2.1 12.9 5.5
Non-Indigenous 1.8 3.2 2.4 1.8 3.2 2.4 1.8 3.1 2.4 1.8 3.1 2.4 1.8 3.8 2.4
TasIndigenous 1.7 6.6 0.6 1.7 7.6 0.8 1.7 5.6 0.6 1.7 5.6 0.6 1.7 6.6 0.6
Non-Indigenous 1.4 3.6 0.5 1.4 3.7 0.5 1.4 3.2 0.5 1.4 3.2 0.5 1.4 3.8 0.6
ACTIndigenous 7.4 9.8 6.6 7.4 8.2 6.6 7.4 8.2 6.6 7.4 8.2 6.6 7.4 9.0 6.6
Non-Indigenous 1.7 2.5 2.7 1.8 2.2 2.6 1.8 2.2 2.6 1.8 2.2 2.6 1.7 3.1 2.7
NTIndigenous 3.7 19.0 1.8 3.7 18.9 1.8 3.7 18.9 1.8 3.7 18.9 1.8 3.7 21.9 1.8
Non-Indigenous 2.1 3.2 1.4 2.1 2.3 1.4 2.1 2.1 1.4 2.1 2.1 1.4 2.1 3.4 1.4
AustIndigenous 2.8 10.9 2.5 2.8 10.5 2.5 2.8 10.0 2.5 2.8 10.0 2.5 2.8 11.7 2.5
Non-Indigenous 1.7 2.8 1.5 1.7 2.7 1.5 1.7 2.5 1.5 1.7 2.5 1.5 1.7 3.1 1.5
Refer to the introduction for explanatory notes.
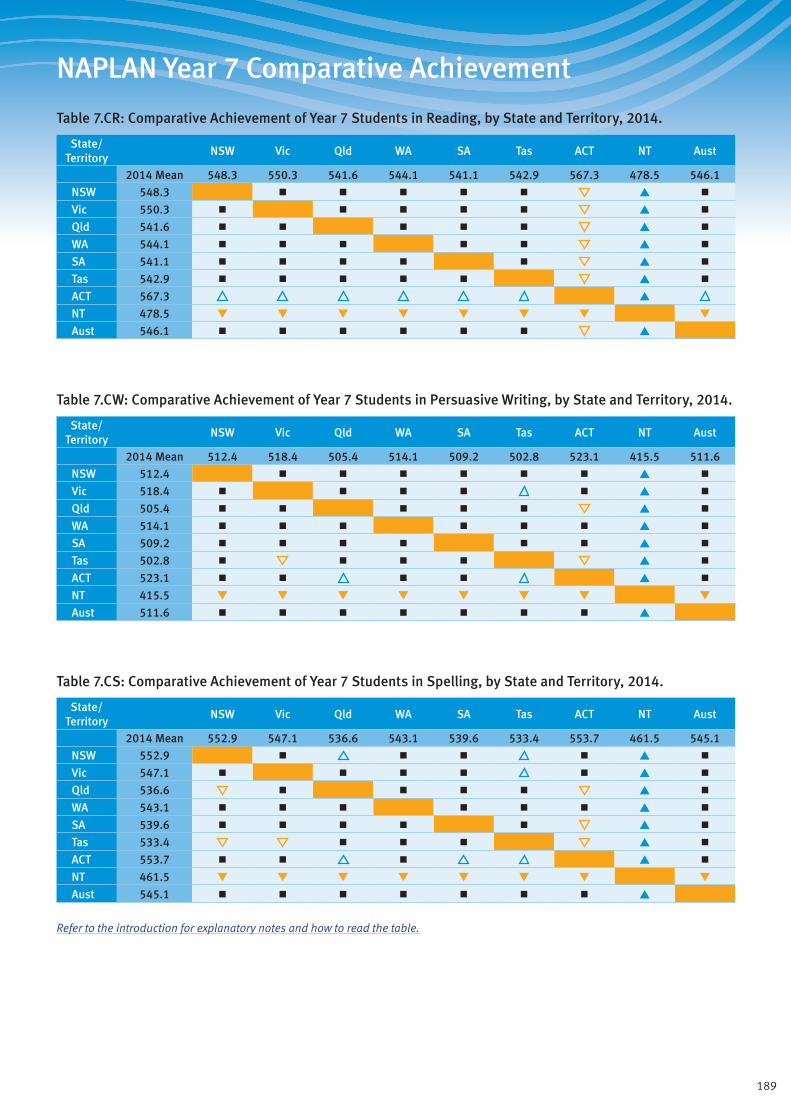
189
NAPLAN Year 7 Comparative Achievement
Table 7.CR: Comparative Achievement of Year 7 Students in Reading, by State and Territory, 2014.
State/ Territory
NSW Vic Qld WA SA Tas ACT NT Aust
2014 Mean 548.3 550.3 541.6 544.1 541.1 542.9 567.3 478.5 546.1
NSW 548.3 ■ ■ ■ ■ ■ ▲ ■
Vic 550.3 ■ ■ ■ ■ ■ ▲ ■
Qld 541.6 ■ ■ ■ ■ ■ ▲ ■
WA 544.1 ■ ■ ■ ■ ■ ▲ ■
SA 541.1 ■ ■ ■ ■ ■ ▲ ■
Tas 542.9 ■ ■ ■ ■ ■ ▲ ■
ACT 567.3 ▲
NT 478.5 ▼ ▼ ▼ ▼ ▼ ▼ ▼ ▼
Aust 546.1 ■ ■ ■ ■ ■ ■ ▲
Table 7.CW: Comparative Achievement of Year 7 Students in Persuasive Writing, by State and Territory, 2014.
State/ Territory
NSW Vic Qld WA SA Tas ACT NT Aust
2014 Mean 512.4 518.4 505.4 514.1 509.2 502.8 523.1 415.5 511.6
NSW 512.4 ■ ■ ■ ■ ■ ■ ▲ ■
Vic 518.4 ■ ■ ■ ■ ■ ▲ ■
Qld 505.4 ■ ■ ■ ■ ■ ▲ ■
WA 514.1 ■ ■ ■ ■ ■ ■ ▲ ■
SA 509.2 ■ ■ ■ ■ ■ ■ ▲ ■
Tas 502.8 ■ ■ ■ ■ ▲ ■
ACT 523.1 ■ ■ ■ ■ ▲ ■
NT 415.5 ▼ ▼ ▼ ▼ ▼ ▼ ▼ ▼
Aust 511.6 ■ ■ ■ ■ ■ ■ ■ ▲
Table 7.CS: Comparative Achievement of Year 7 Students in Spelling, by State and Territory, 2014.
State/ Territory
NSW Vic Qld WA SA Tas ACT NT Aust
2014 Mean 552.9 547.1 536.6 543.1 539.6 533.4 553.7 461.5 545.1
NSW 552.9 ■ ■ ■ ■ ▲ ■
Vic 547.1 ■ ■ ■ ■ ■ ▲ ■
Qld 536.6 ■ ■ ■ ■ ▲ ■
WA 543.1 ■ ■ ■ ■ ■ ■ ▲ ■
SA 539.6 ■ ■ ■ ■ ■ ▲ ■
Tas 533.4 ■ ■ ■ ▲ ■
ACT 553.7 ■ ■ ■ ▲ ■
NT 461.5 ▼ ▼ ▼ ▼ ▼ ▼ ▼ ▼
Aust 545.1 ■ ■ ■ ■ ■ ■ ■ ▲
Refer to the introduction for explanatory notes and how to read the table.

190
NAPLAN Year 7 Comparative Achievement
Table 7.CG: Comparative Achievement of Year 7 Students in Grammar and Punctuation, by State and Territory, 2014.
State/ Territory
NSW Vic Qld WA SA Tas ACT NT Aust
2014 Mean 548.9 542.5 540.6 541.5 536.7 533.8 563.9 465.2 543.1
NSW 548.9 ■ ■ ■ ■ ▲ ■
Vic 542.5 ■ ■ ■ ■ ■ ▲ ■
Qld 540.6 ■ ■ ■ ■ ■ ▲ ■
WA 541.5 ■ ■ ■ ■ ■ ▲ ■
SA 536.7 ■ ■ ■ ■ ■ ▲ ■
Tas 533.8 ■ ■ ■ ■ ▲ ■
ACT 563.9 ▲
NT 465.2 ▼ ▼ ▼ ▼ ▼ ▼ ▼ ▼
Aust 543.1 ■ ■ ■ ■ ■ ■ ▲
Table 7.CN: Comparative Achievement of Year 7 Students in Numeracy, by State and Territory, 2014.
State/ Territory
NSW Vic Qld WA SA Tas ACT NT Aust
2014 Mean 550.3 548.6 543.6 545.5 533.9 533.1 556.6 484.4 545.9
NSW 550.3 ■ ■ ■ ■ ▲ ■
Vic 548.6 ■ ■ ■ ■ ▲ ■
Qld 543.6 ■ ■ ■ ■ ■ ■ ▲ ■
WA 545.5 ■ ■ ■ ■ ■ ■ ▲ ■
SA 533.9 ■ ■ ■ ▲ ■
Tas 533.1 ■ ■ ■ ▲ ■
ACT 556.6 ■ ■ ■ ■ ▲ ■
NT 484.4 ▼ ▼ ▼ ▼ ▼ ▼ ▼ ▼
Aust 545.9 ■ ■ ■ ■ ■ ■ ■ ▲
Refer to the introduction for explanatory notes and how to read the table.
191
NAPLAN Year 7 Commentary
Overall national and jurisdiction results (Year 7)Year 7 marks the beginning of secondary education in most Australian jurisdictions. In Queensland, Western Australia and South Australia, Year 7 is the last year of primary education in most schools. Year 7 will be transferred to secondary education in Queensland and Western Australia by 2015.
Achievement scoresFigures 7.R1, 7.W1, 7.S1, 7.G1 and 7.N1 show the distributions of achievement scores in reading, persuasive writing, spelling, grammar and punctuation, and numeracy, respectively, for each jurisdiction and for Australia overall. The table below each figure presents the mean scale score and standard deviation for each jurisdiction and for Australia overall.
Mean scores for New South Wales, Victoria, Queensland, Western Australia, South Australia and Tasmania are close to the national mean scores in all five achievement domains. For the ACT, mean scores in reading and in grammar and punctuation are above and statistically significantly different from the national mean scores; in the other three domains, the ACT mean scores are close to the national mean score. In addition, the ACT mean scores are above and statistically significantly different from the mean scores for all other jurisdictions in reading and in grammar and punctuation. Mean scores for the Northern Territory are substantially below and statistically significantly different from the national mean scores in all five domains.
For the Northern Territory, the spread of scores, as indicated by the standard deviation, is much greater than in the other jurisdictions. This is also indicated by the length of the bars in the figures.
Achievement bandsFor further descriptive reporting, achievement scores are grouped into ten bands. For students in Year 7, Band 4 and below is the lowest band that is reported and indicates a score below the national minimum standard. Band 5 (the next lowest band) indicates a score at the national minimum standard (see p. v). The highest reported band (Band 9 and above) represents high achievement for Year 7. Exempt students do not receive an achievement score and are not included in the calculation of means and standard deviations, but they are counted as below the national minimum standard in reporting band percentages.
Tables 7.R1, 7.W1, 7.S1, 7.G1 and 7.N1 present the percentages of students in each band for each jurisdiction and Australia overall in each of the five achievement domains. The last column of each table shows the percentage of students who achieved at or above the national minimum standard in the achievement domain. The percentage of students across Australia who achieved at or above the national minimum standard is high, ranging from 89% in persuasive writing to 95% in numeracy. There is some variation across jurisdictions in the percentage of students who achieved at or above the national minimum standard. For the Northern Territory, this ranges from 56% in persuasive writing to 74% in numeracy. For all other jurisdictions, more than 94% of Year 7 students achieved at or above the national minimum standard in reading and in numeracy, and 90% or more students achieved at or above the national minimum standard in spelling and in grammar and punctuation.
SexMean scale scores and score distributions are shown separately for male and female students in Figures 7.R2, 7.W2, 7.S2, 7.G2 and 7.N2. In persuasive writing, spelling, and grammar and punctuation, the mean scale score for female students is higher than the mean scale score for male students, for Australia overall and for all jurisdictions. In reading, the mean scores for male students are close to the mean scores for female students for all jurisdictions and for Australia overall. For the ACT, the mean score in numeracy for male students is higher than the mean score for female students; in all other jurisdictions and for Australia overall, the mean score for female students is close to the mean score for male students.
Tables 7.R2, 7.W2, 7.S2, 7.G2 and 7.N2 present the percentages of male and female students in each achievement band. Nationally, in reading, persuasive writing, spelling, and grammar and punctuation, a higher percentage of female students achieved at or above the national minimum standard compared with male students, with differences between 3 percentage points in reading and 9 percentage points in persuasive writing. In numeracy, the difference between male students and female students in the percentage who achieved at or above the national minimum standard is less than 1 percentage point.
Indigenous studentsFigures 7.R3, 7.W3, 7.S3, 7.G3 and 7.N3 display the distributions of scores, mean scale scores and standard deviations separately for Indigenous students and non-Indigenous students. In all achievement domains and for all jurisdictions, the mean scale score for Indigenous students is substantially below the mean scale score for non-Indigenous students. Differences for Australia overall range from 68 scale points in spelling to 85 scale points in persuasive writing.
Tables 7.R3, 7.W3, 7.S3, 7.G3 and 7.N3 show the percentages of Indigenous and non-Indigenous students in each achievement band in each domain for all jurisdictions and Australia overall. Nationally, 77% of Indigenous students achieved at or above the national minimum standard in reading and 80% of Indigenous students achieved at or above the national minimum standard in numeracy.
Language background other than EnglishFigures 7.R4, 7.W4, 7.S4, 7.G4 and 7.N4 provide the distributions of scores, mean scale scores and standard deviations separately for students from a language background other than English and for students whose language background is English, for each jurisdiction and for Australia overall. For Australia, the mean score in spelling for students from a language background other than English is higher than the mean score for other students. In all other domains, the group mean scores are close to one another.
Across jurisdictions and domains, there are few differences between students from a language background other than English and students whose language background is English. For New South Wales, the mean scores for students from a language background other than English are higher than the mean scores for students from an English-language background in persuasive writing, spelling and numeracy. For the Northern Territory, mean scores for students from a language background other than English are substantially lower than mean scores for students from an English-language background in all five achievement domains.
Tables 7.R4, 7.W4, 7.S4, 7.G4 and 7.N4 provide information on the percentage of students in each achievement band in each domain for each jurisdiction, separately for students from a language background other than English and students with an English-language background. For Australia overall, there is little difference between the two groups in the percentage of students who scored at or above the national minimum standard in persuasive writing, spelling and numeracy. The greatest differences are in reading and in grammar and punctuation, at 3 percentage points.
GeolocationTables 7.R5, 7.W5, 7.S5, 7.G5 and 7.N5 present summary results for students from schools in metropolitan, provincial, remote and very remote locations for each jurisdiction and for Australia overall. These tables include the mean scale score, as well as the percentage of students in each achievement band. In Victoria, there is no very remote geolocation; in the Northern Territory there is no metropolitan geolocation; and in the ACT all secondary schools are in a metropolitan geolocation. In addition, there are too few students to report on remote and very remote locations in Tasmania.
Across all five achievement domains, there is a consistent pattern in the results for Australia overall. Students from metropolitan geolocations have the highest mean score, followed by students
192
NAPLAN Year 7 Commentary
from provincial geolocations, then students from remote locations, then students from very remote locations. This pattern is not always replicated within each jurisdiction. For Victoria and South Australia, mean scores for students from remote locations are close to mean scores for students from provincial locations, and for Tasmania, mean scores for students from provincial locations are close to mean scores for students from metropolitan locations.
The national distributions of achievement bands show similar results, with schools in metropolitan locations having the highest percentage of students achieving at or above the national minimum standard and schools in very remote locations having the lowest percentage. In reading and numeracy, at least 96% of students in metropolitan locations achieved at or above the national minimum standard. In all domains, greater percentages of students attending schools in metropolitan geolocations across Australia and in all jurisdictions achieved at both Band 8 and Band 9 and above than did students attending schools in other geolocations.
Results by geolocation are also reported by Indigenous status, in Tables 7.R6, 7.W6, 7.S6, 7.G6 and 7.N6 for Indigenous students and in Tables 7.R7, 7.W7, 7.S7, 7.G7 and 7.N7 for non-Indigenous students. For Indigenous students in Queensland, South Australia and Tasmania, mean scores and the percentage achieving at or above the national minimum standard for those attending schools in provincial locations are close to the mean scores for those attending schools in metropolitan locations in all domains. For non-Indigenous students nationally, mean scores for those attending schools in remote and very remote locations are close to the mean scores for those attending schools in provincial locations in all domains.
Parental educationTables 7.R8, 7.W8, 7.S8, 7.G8 and 7.N8 provide results for each jurisdiction and Australia overall by parental education. Parental education refers to the highest level of education completed by either parent or guardian. It includes primary and secondary school and post-school qualifications, such as certificates, diplomas and degrees. The percentage of parents who did not report this information on their child’s school enrolment form varies across jurisdictions, from 5% in Victoria to 31% in the Northern Territory. For Australia overall, there is no information on parental education for 9% of Year 7 students, so these results should be treated with caution.
In all domains, mean scores are higher for students whose parents have higher levels of education. Students whose parents hold a bachelor degree or higher have the highest mean scores for each jurisdiction and for Australia overall, and the greatest percentage of students who achieved at or above the national minimum standard. For most jurisdictions and in most domains, there is little difference in the mean scores between students with parents whose highest level of education is a certificate and those with parents whose highest level is Year 12 completion. Nationally in reading, grammar and punctuation, and numeracy, close to one-half of students whose parents completed a bachelor degree or higher achieved at Band 8 or Band 9 or above.
Parental occupationTables 7.R9, 7.W9, 7.S9, 7.G9 and 7.N9 present results for each jurisdiction and Australia overall by parental occupation. Parental occupation group includes the main work undertaken by the parent/guardian. If a parent/guardian has more than one job, the occupation group reflecting the main job is reported. If both parents/guardians are working, the higher of the two occupation groups is used. Occupations are classified into four groups; a fifth group represents those not in paid work. The percentage of parents who did not report this information on their child’s school enrolment form varies across jurisdictions, from 5% in Victoria to 30% in the Northern Territory. For Australia overall, there is no information on parental occupation for 12% of students, so these results should be treated with caution.
Students with parents in Occupation Group 1, which includes senior managers and qualified professionals, have the highest
mean scale scores in all domains for all jurisdictions and for Australia overall. The next highest mean scores were achieved by students with parents in Occupation Group 2, which includes other business managers and associate professionals, followed by Occupation Group 3 (tradespeople; clerks; and skilled office, sales and service staff) and Occupation Group 4 (machine operators, hospitality staff, assistants and labourers). Students whose parents are not in paid work have the lowest mean scores in all domains across Australia and for all jurisdictions except the ACT.
Parental occupation is also related to the percentage of students who scored at or above the national minimum standard. Students with parents in Occupation Group 1 most frequently achieved at or above the national minimum standard (between 95% and 99% nationally). In persuasive writing, more than 83% of students across Australia with at least one parent in paid work achieved at or above the national minimum standard; in all other domains, more than 89% of students with at least one parent in paid work achieved at or above the national minimum standard.
ParticipationTables 7.P1, 7.P2, 7.P3 and 7.P4 provide data on participation in the tests in each domain for each jurisdiction and for Australia overall. Table 7.P1 provides the overall rates and Table 7.P2 provides rates separately for Indigenous and non-Indigenous students. Tables 7.P3 and 7.P4 provide data on exemptions, absences and withdrawals for the tests in each domain, with Table 7.P4 showing these rates separately for Indigenous and non-Indigenous students. Students who are absent or withdrawn are considered non-participating. Students who are exempt do not receive a scale score but are considered to have achieved below the national minimum standard.
The national participation rate is lowest in numeracy at 94.7% and highest in spelling and in grammar and punctuation at 95.4%. Among the eight jurisdictions, New South Wales has the highest participation rate (97.0% in spelling and in grammar and punctuation) and Northern Territory the lowest (at 87.0% in numeracy). Participation rates are lower among Indigenous students, between 85.8% in numeracy and 87.6% in spelling and in grammar and punctuation across Australia.
Across Australia, 1.8% of students were granted exemptions from the assessment in each domain. Exemption rates for Indigenous students vary across jurisdictions, ranging from 1.6% in Western Australia and 1.7% in Tasmania to 7.4% in the ACT. Students were absent most frequently for the numeracy assessment (3.7%).
193
2014 Results NAPLAN Year 9
Year 9 Reading ................................ 194• by State and Territory, 2014
• by Sex, by State and Territory, 2014
• by Indigenous Status, by State and Territory, 2014
• by LBOTE Status, by State and Territory, 2014
• by Geolocation, by State and Territory, 2014
• Indigenous Students by Geolocation, by State and Territory, 2014
• Non-Indigenous Students by Geolocation, by State and Territory, 2014
• by Parental Education, by State and Territory, 2014
• by Parental Occupation, by State and Territory, 2014
Year 9 Persuasive Writing ................ 205• by State and Territory, 2014
• by Sex, by State and Territory, 2014
• by Indigenous Status, by State and Territory, 2014
• by LBOTE Status, by State and Territory, 2014
• by Geolocation, by State and Territory, 2014
• Indigenous Students by Geolocation, by State and Territory, 2014
• Non-Indigenous Students by Geolocation, by State and Territory, 2014
• by Parental Education, by State and Territory, 2014
• by Parental Occupation, by State and Territory, 2014
Year 9 Spelling ................................ 216• by State and Territory, 2014
• by Sex, by State and Territory, 2014
• by Indigenous Status, by State and Territory, 2014
• by LBOTE Status, by State and Territory, 2014
• by Geolocation, by State and Territory, 2014
• Indigenous Students by Geolocation, by State and Territory, 2014
• Non-Indigenous Students by Geolocation, by State and Territory, 2014
• by Parental Education, by State and Territory, 2014
• by Parental Occupation, by State and Territory, 2014
Year 9 Grammar and Punctuation ..... 227• by State and Territory, 2014
• by Sex, by State and Territory, 2014
• by Indigenous Status, by State and Territory, 2014
• by LBOTE Status, by State and Territory, 2014
• by Geolocation, by State and Territory, 2014
• Indigenous Students by Geolocation, by State and Territory, 2014
• Non-Indigenous Students by Geolocation, by State and Territory, 2014
• by Parental Education, by State and Territory, 2014
• by Parental Occupation, by State and Territory, 2014
Year 9 Numeracy ............................. 238• by State and Territory, 2014
• by Sex, by State and Territory, 2014
• by Indigenous Status, by State and Territory, 2014
• by LBOTE Status, by State and Territory, 2014
• by Geolocation, by State and Territory, 2014
• Indigenous Students by Geolocation, by State and Territory, 2014
• Non-Indigenous Students by Geolocation, by State and Territory, 2014
• by Parental Education, by State and Territory, 2014
• by Parental Occupation, by State and Territory, 2014
Year 9 Participation ......................... 249• by State and Territory, 2014
• by Indigenous Status, by State and Territory, 2014
• Student Exemptions, Absences and Withdrawals, by State and Territory, 2014
• Student Exemptions, Absences and Withdrawals, by Indigenous Status, by State and Territory, 2014
Year 9 Comparative Achievement ..... 253• in Reading by State and Territory, 2014
• in Persuasive Writing, by State and Territory, 2014
• in Spelling, by State and Territory, 2014
• in Grammar and Punctuation, by State and Territory, 2014
• in Numeracy, by State and Territory, 2014
Year 9 Commentary ......................... 255
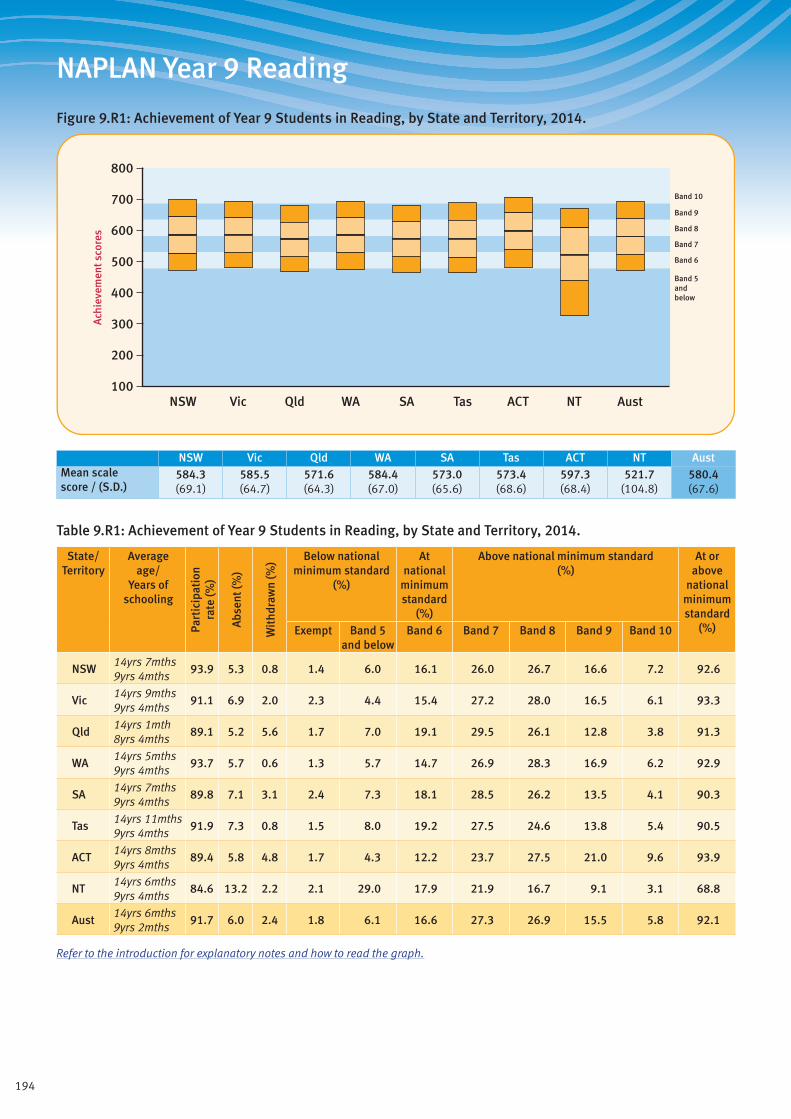
194
NAPLAN Year 9 Reading
Figure 9.R1: Achievement of Year 9 Students in Reading, by State and Territory, 2014.
Band 5andbelow
Band 6
Band 7
Band 8
Band 9
Band 10
800
700
500
600
400
300
100
200
Ach
ieve
men
t sco
res
ACTQld SAWA TasVicNSW NT Aust
NSW Vic Qld WA SA Tas ACT NT AustMean scale score / (S.D.)
584.3 (69.1)
585.5 (64.7)
571.6 (64.3)
584.4 (67.0)
573.0 (65.6)
573.4 (68.6)
597.3 (68.4)
521.7 (104.8)
580.4 (67.6)
Table 9.R1: Achievement of Year 9 Students in Reading, by State and Territory, 2014.
State/ Territory
Average age/
Years of schooling
Part
icip
atio
nra
te (%
)
Abs
ent (
%)
Wit
hdra
wn
(%) Below national
minimum standard (%)
At national
minimum standard
(%)
Above national minimum standard (%)
At or above
national minimum standard
(%)Exempt Band 5 and below
Band 6 Band 7 Band 8 Band 9 Band 10
NSW14yrs 7mths 9yrs 4mths
93.9 5.3 0.8 1.4 6.0 16.1 26.0 26.7 16.6 7.2 92.6
Vic14yrs 9mths 9yrs 4mths
91.1 6.9 2.0 2.3 4.4 15.4 27.2 28.0 16.5 6.1 93.3
Qld14yrs 1mth 8yrs 4mths
89.1 5.2 5.6 1.7 7.0 19.1 29.5 26.1 12.8 3.8 91.3
WA14yrs 5mths 9yrs 4mths
93.7 5.7 0.6 1.3 5.7 14.7 26.9 28.3 16.9 6.2 92.9
SA14yrs 7mths 9yrs 4mths
89.8 7.1 3.1 2.4 7.3 18.1 28.5 26.2 13.5 4.1 90.3
Tas14yrs 11mths 9yrs 4mths
91.9 7.3 0.8 1.5 8.0 19.2 27.5 24.6 13.8 5.4 90.5
ACT14yrs 8mths 9yrs 4mths
89.4 5.8 4.8 1.7 4.3 12.2 23.7 27.5 21.0 9.6 93.9
NT14yrs 6mths 9yrs 4mths
84.6 13.2 2.2 2.1 29.0 17.9 21.9 16.7 9.1 3.1 68.8
Aust14yrs 6mths 9yrs 2mths
91.7 6.0 2.4 1.8 6.1 16.6 27.3 26.9 15.5 5.8 92.1
Refer to the introduction for explanatory notes and how to read the graph.
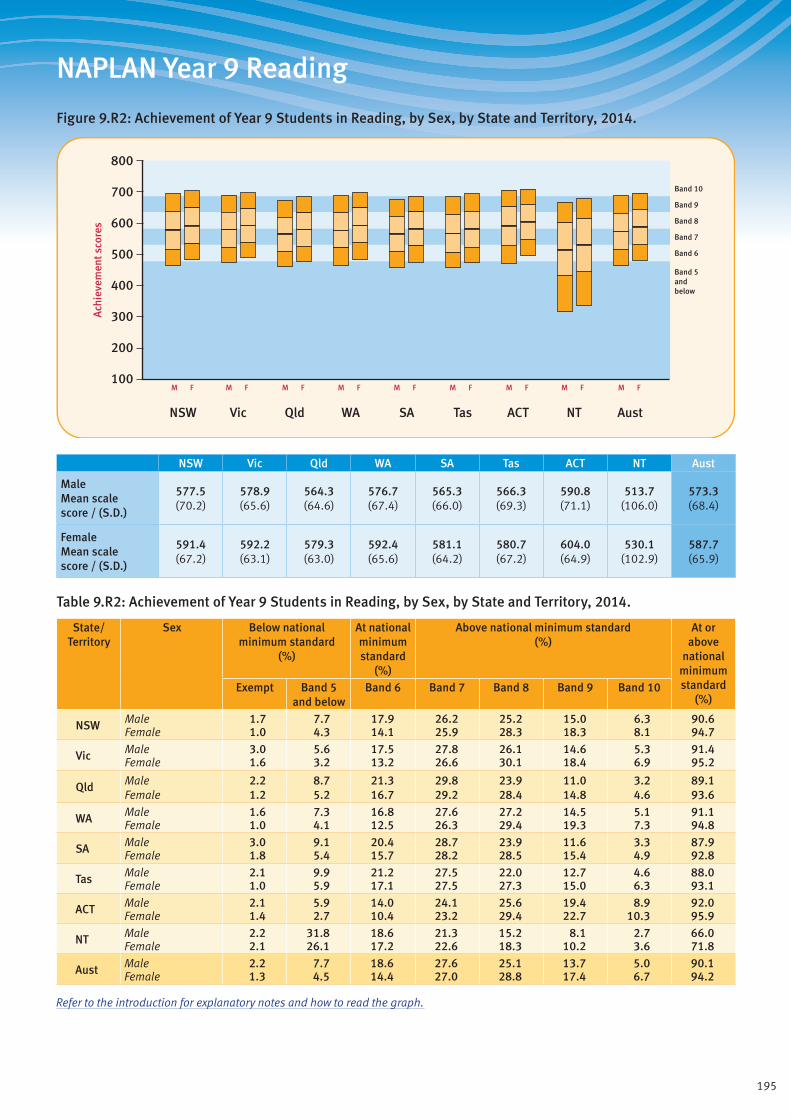
195
NAPLAN Year 9 Reading
Figure 9.R2: Achievement of Year 9 Students in Reading, by Sex, by State and Territory, 2014.
Band 5andbelow
Band 6
Band 7
Band 8
Band 9
Band 10
ACTQld SAWA TasVicNSW NT Aust
M F M F M F M F M F M F M F M F M F
800
700
500
600
400
300
100
200
Ach
ieve
men
t sco
res
NSW Vic Qld WA SA Tas ACT NT Aust
Male Mean scale score / (S.D.)
577.5 (70.2)
578.9 (65.6)
564.3 (64.6)
576.7 (67.4)
565.3 (66.0)
566.3 (69.3)
590.8 (71.1)
513.7 (106.0)
573.3 (68.4)
Female Mean scale score / (S.D.)
591.4 (67.2)
592.2 (63.1)
579.3 (63.0)
592.4 (65.6)
581.1 (64.2)
580.7 (67.2)
604.0 (64.9)
530.1 (102.9)
587.7 (65.9)
Table 9.R2: Achievement of Year 9 Students in Reading, by Sex, by State and Territory, 2014.
State/ Territory
Sex Below national minimum standard
(%)
At national minimum standard
(%)
Above national minimum standard (%)
At or above
national minimum standard
(%)Exempt Band 5
and belowBand 6 Band 7 Band 8 Band 9 Band 10
NSW Male 1.7 7.7 17.9 26.2 25.2 15.0 6.3 90.6Female 1.0 4.3 14.1 25.9 28.3 18.3 8.1 94.7
Vic Male 3.0 5.6 17.5 27.8 26.1 14.6 5.3 91.4Female 1.6 3.2 13.2 26.6 30.1 18.4 6.9 95.2
Qld Male 2.2 8.7 21.3 29.8 23.9 11.0 3.2 89.1Female 1.2 5.2 16.7 29.2 28.4 14.8 4.6 93.6
WA Male 1.6 7.3 16.8 27.6 27.2 14.5 5.1 91.1Female 1.0 4.1 12.5 26.3 29.4 19.3 7.3 94.8
SA Male 3.0 9.1 20.4 28.7 23.9 11.6 3.3 87.9Female 1.8 5.4 15.7 28.2 28.5 15.4 4.9 92.8
Tas Male 2.1 9.9 21.2 27.5 22.0 12.7 4.6 88.0Female 1.0 5.9 17.1 27.5 27.3 15.0 6.3 93.1
ACT Male 2.1 5.9 14.0 24.1 25.6 19.4 8.9 92.0Female 1.4 2.7 10.4 23.2 29.4 22.7 10.3 95.9
NT Male 2.2 31.8 18.6 21.3 15.2 8.1 2.7 66.0Female 2.1 26.1 17.2 22.6 18.3 10.2 3.6 71.8
Aust Male 2.2 7.7 18.6 27.6 25.1 13.7 5.0 90.1Female 1.3 4.5 14.4 27.0 28.8 17.4 6.7 94.2
Refer to the introduction for explanatory notes and how to read the graph.

196
NAPLAN Year 9 Reading
Figure 9.R3: Achievement of Year 9 Students in Reading, by Indigenous Status, by State and Territory, 2014.
Band 5andbelow
Band 6
Band 7
Band 8
Band 9
Band 10
ACTQld SAWA TasVicNSW NT Aust
800
700
500
600
400
300
100
200
Ach
ieve
men
t sco
res
Indig. Non-Indig.
Indig. Non-Indig.
Indig. Non-Indig.
Indig. Non-Indig.
Indig. Non-Indig.
Indig. Non-Indig.
Indig. Non-Indig.
Indig. Non-Indig.
Indig. Non-Indig.
NSW Vic Qld WA SA Tas ACT NT Aust
Indigenous Mean scale score / (S.D.)
529.2 (63.0)
540.3 (59.3)
521.3 (62.4)
508.4 (69.8)
516.7 (63.2)
539.7 (62.6)
540.3 (64.4)
437.8 (98.6)
517.4 (71.4)
Non-Indigenous Mean scale score / (S.D.)
587.5 (68.1)
586.3 (64.5)
575.4 (62.8)
590.0 (63.6)
575.5 (64.4)
575.8 (67.5)
599.1 (67.8)
572.4 (65.1)
583.9 (65.6)
Table 9.R3: Achievement of Year 9 Students in Reading, by Indigenous Status, by State and Territory, 2014.
State/ Territory
Indigenous status
Below national minimum standard
(%)
At national minimum standard
(%)
Above national minimum standard (%)
At or above
national minimum standard
(%)Exempt Band 5
and belowBand 6 Band 7 Band 8 Band 9 Band 10
NSW Indigenous 2.4 20.3 30.5 27.1 14.5 4.5 0.7 77.3Non-Indigenous 1.3 5.2 15.2 26.0 27.5 17.3 7.6 93.5
Vic Indigenous 4.7 13.5 27.8 31.2 16.9 5.2 0.7 81.8Non-Indigenous 2.3 4.2 15.2 27.2 28.3 16.7 6.2 93.5
Qld Indigenous 3.1 24.2 31.1 25.1 12.6 3.3 0.6 72.7Non-Indigenous 1.6 5.7 18.2 29.8 27.1 13.5 4.1 92.7
WA Indigenous 1.4 32.7 29.7 21.6 10.9 3.3 0.4 65.9Non-Indigenous 1.2 3.8 13.6 27.3 29.6 17.9 6.6 95.0
SA Indigenous 3.3 25.8 31.3 25.3 10.9 3.1 0.4 70.9Non-Indigenous 2.3 6.4 17.5 28.6 27.0 13.9 4.2 91.3
Tas Indigenous 2.4 15.1 30.0 27.8 18.0 5.0 1.7 82.5Non-Indigenous 1.4 7.3 18.2 27.9 25.5 14.4 5.4 91.4
ACT Indigenous 2.3 18.3 24.2 29.2 18.0 6.8 1.2 79.4Non-Indigenous 1.8 3.9 11.8 23.5 27.8 21.5 9.8 94.3
NT Indigenous 2.3 64.0 16.8 10.6 4.7 1.6 0.1 33.7Non-Indigenous 2.2 6.9 19.4 29.7 24.6 13.0 4.3 90.9
Aust Indigenous 2.7 26.2 29.3 24.7 12.8 3.8 0.6 71.2Non-Indigenous 1.7 5.0 15.9 27.4 27.7 16.2 6.1 93.3
Refer to the introduction for explanatory notes and how to read the graph.
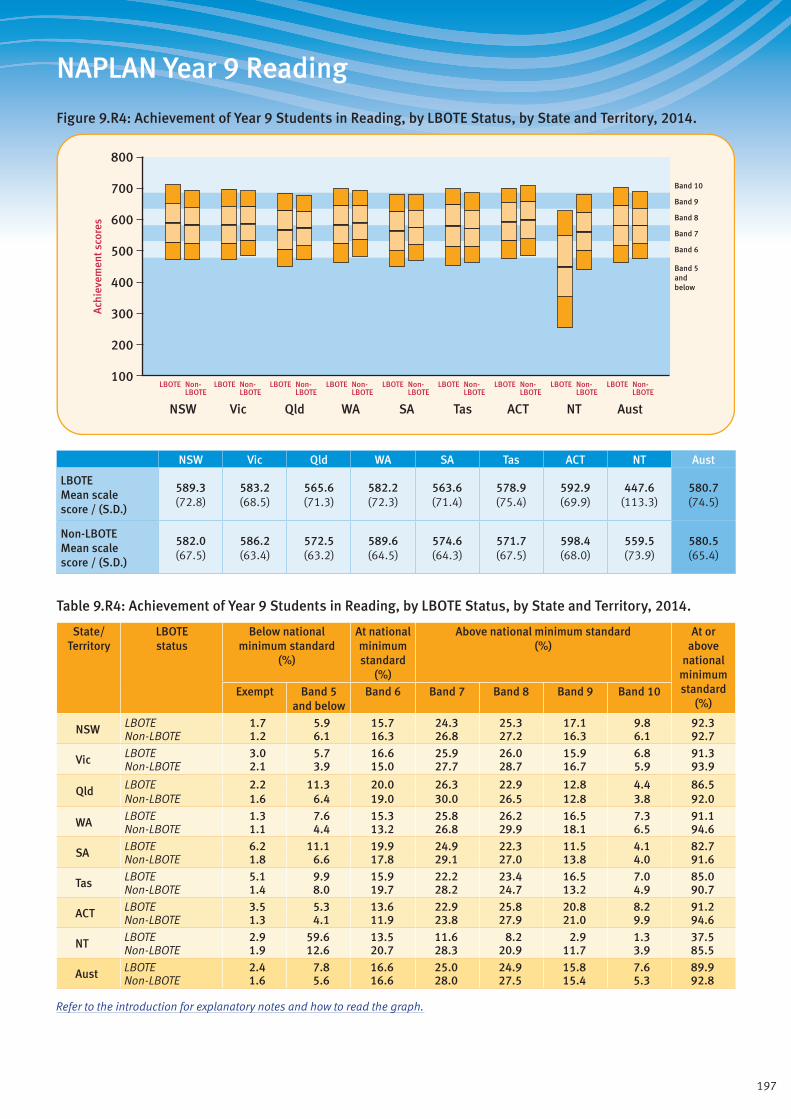
197
NAPLAN Year 9 Reading
Figure 9.R4: Achievement of Year 9 Students in Reading, by LBOTE Status, by State and Territory, 2014.
Band 5andbelow
Band 6
Band 7
Band 8
Band 9
Band 10
ACTQld SAWA TasVicNSW NT Aust
800
700
500
600
400
300
100
200
Ach
ieve
men
t sco
res
LBOTE Non-LBOTE
LBOTE Non-LBOTE
LBOTE Non-LBOTE
LBOTE Non-LBOTE
LBOTE Non-LBOTE
LBOTE Non-LBOTE
LBOTE Non-LBOTE
LBOTE Non-LBOTE
LBOTE Non-LBOTE
NSW Vic Qld WA SA Tas ACT NT Aust
LBOTE Mean scale score / (S.D.)
589.3 (72.8)
583.2 (68.5)
565.6 (71.3)
582.2 (72.3)
563.6 (71.4)
578.9 (75.4)
592.9 (69.9)
447.6 (113.3)
580.7 (74.5)
Non-LBOTE Mean scale score / (S.D.)
582.0 (67.5)
586.2 (63.4)
572.5 (63.2)
589.6 (64.5)
574.6 (64.3)
571.7 (67.5)
598.4 (68.0)
559.5 (73.9)
580.5 (65.4)
Table 9.R4: Achievement of Year 9 Students in Reading, by LBOTE Status, by State and Territory, 2014.
State/ Territory
LBOTE status
Below national minimum standard
(%)
At national minimum standard
(%)
Above national minimum standard (%)
At or above
national minimum standard
(%)Exempt Band 5
and belowBand 6 Band 7 Band 8 Band 9 Band 10
NSW LBOTE 1.7 5.9 15.7 24.3 25.3 17.1 9.8 92.3Non-LBOTE 1.2 6.1 16.3 26.8 27.2 16.3 6.1 92.7
Vic LBOTE 3.0 5.7 16.6 25.9 26.0 15.9 6.8 91.3Non-LBOTE 2.1 3.9 15.0 27.7 28.7 16.7 5.9 93.9
Qld LBOTE 2.2 11.3 20.0 26.3 22.9 12.8 4.4 86.5Non-LBOTE 1.6 6.4 19.0 30.0 26.5 12.8 3.8 92.0
WA LBOTE 1.3 7.6 15.3 25.8 26.2 16.5 7.3 91.1Non-LBOTE 1.1 4.4 13.2 26.8 29.9 18.1 6.5 94.6
SA LBOTE 6.2 11.1 19.9 24.9 22.3 11.5 4.1 82.7Non-LBOTE 1.8 6.6 17.8 29.1 27.0 13.8 4.0 91.6
Tas LBOTE 5.1 9.9 15.9 22.2 23.4 16.5 7.0 85.0Non-LBOTE 1.4 8.0 19.7 28.2 24.7 13.2 4.9 90.7
ACT LBOTE 3.5 5.3 13.6 22.9 25.8 20.8 8.2 91.2Non-LBOTE 1.3 4.1 11.9 23.8 27.9 21.0 9.9 94.6
NT LBOTE 2.9 59.6 13.5 11.6 8.2 2.9 1.3 37.5Non-LBOTE 1.9 12.6 20.7 28.3 20.9 11.7 3.9 85.5
Aust LBOTE 2.4 7.8 16.6 25.0 24.9 15.8 7.6 89.9Non-LBOTE 1.6 5.6 16.6 28.0 27.5 15.4 5.3 92.8
Refer to the introduction for explanatory notes and how to read the graph.
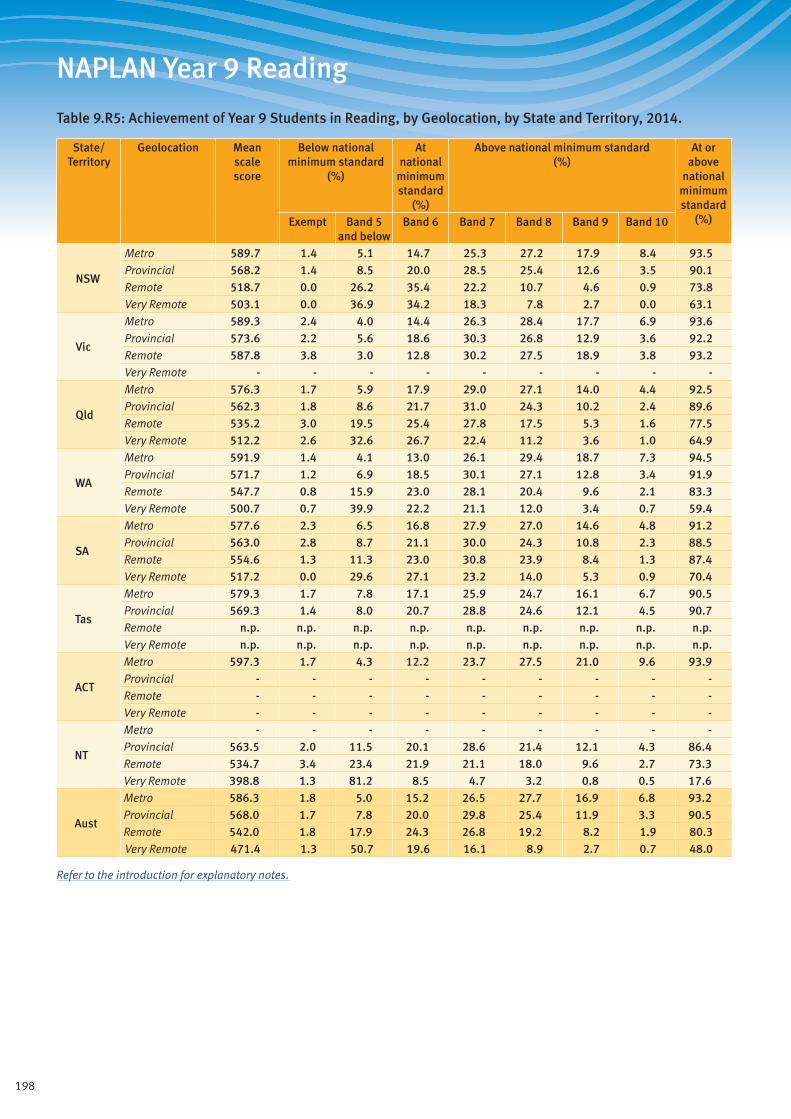
198
NAPLAN Year 9 Reading
Table 9.R5: Achievement of Year 9 Students in Reading, by Geolocation, by State and Territory, 2014.
State/ Territory
Geolocation Mean scale score
Below national minimum standard
(%)
At national
minimum standard
(%)
Above national minimum standard (%)
At or above
national minimum standard
(%)Exempt Band 5 and below
Band 6 Band 7 Band 8 Band 9 Band 10
NSW
Metro 589.7 1.4 5.1 14.7 25.3 27.2 17.9 8.4 93.5Provincial 568.2 1.4 8.5 20.0 28.5 25.4 12.6 3.5 90.1Remote 518.7 0.0 26.2 35.4 22.2 10.7 4.6 0.9 73.8Very Remote 503.1 0.0 36.9 34.2 18.3 7.8 2.7 0.0 63.1
Vic
Metro 589.3 2.4 4.0 14.4 26.3 28.4 17.7 6.9 93.6Provincial 573.6 2.2 5.6 18.6 30.3 26.8 12.9 3.6 92.2Remote 587.8 3.8 3.0 12.8 30.2 27.5 18.9 3.8 93.2Very Remote - - - - - - - - -
Qld
Metro 576.3 1.7 5.9 17.9 29.0 27.1 14.0 4.4 92.5Provincial 562.3 1.8 8.6 21.7 31.0 24.3 10.2 2.4 89.6Remote 535.2 3.0 19.5 25.4 27.8 17.5 5.3 1.6 77.5Very Remote 512.2 2.6 32.6 26.7 22.4 11.2 3.6 1.0 64.9
WA
Metro 591.9 1.4 4.1 13.0 26.1 29.4 18.7 7.3 94.5Provincial 571.7 1.2 6.9 18.5 30.1 27.1 12.8 3.4 91.9Remote 547.7 0.8 15.9 23.0 28.1 20.4 9.6 2.1 83.3Very Remote 500.7 0.7 39.9 22.2 21.1 12.0 3.4 0.7 59.4
SA
Metro 577.6 2.3 6.5 16.8 27.9 27.0 14.6 4.8 91.2Provincial 563.0 2.8 8.7 21.1 30.0 24.3 10.8 2.3 88.5Remote 554.6 1.3 11.3 23.0 30.8 23.9 8.4 1.3 87.4Very Remote 517.2 0.0 29.6 27.1 23.2 14.0 5.3 0.9 70.4
Tas
Metro 579.3 1.7 7.8 17.1 25.9 24.7 16.1 6.7 90.5Provincial 569.3 1.4 8.0 20.7 28.8 24.6 12.1 4.5 90.7Remote n.p. n.p. n.p. n.p. n.p. n.p. n.p. n.p. n.p.Very Remote n.p. n.p. n.p. n.p. n.p. n.p. n.p. n.p. n.p.
ACT
Metro 597.3 1.7 4.3 12.2 23.7 27.5 21.0 9.6 93.9Provincial - - - - - - - - -Remote - - - - - - - - -Very Remote - - - - - - - - -
NT
Metro - - - - - - - - -Provincial 563.5 2.0 11.5 20.1 28.6 21.4 12.1 4.3 86.4Remote 534.7 3.4 23.4 21.9 21.1 18.0 9.6 2.7 73.3Very Remote 398.8 1.3 81.2 8.5 4.7 3.2 0.8 0.5 17.6
Aust
Metro 586.3 1.8 5.0 15.2 26.5 27.7 16.9 6.8 93.2Provincial 568.0 1.7 7.8 20.0 29.8 25.4 11.9 3.3 90.5Remote 542.0 1.8 17.9 24.3 26.8 19.2 8.2 1.9 80.3Very Remote 471.4 1.3 50.7 19.6 16.1 8.9 2.7 0.7 48.0
Refer to the introduction for explanatory notes.

199
NAPLAN Year 9 Reading
Table 9.R6: Achievement of Year 9 Indigenous Students in Reading, by Geolocation, by State and Territory, 2014.
State/ Territory
Geolocation Mean scale score
Below national minimum standard
(%)
At national
minimum standard
(%)
Above national minimum standard (%)
At or above
national minimum standard
(%)Exempt Band 5 and below
Band 6 Band 7 Band 8 Band 9 Band 10
NSW
Metro 537.4 2.5 16.9 27.8 29.3 16.9 5.7 0.9 80.6Provincial 524.7 2.5 21.9 32.4 26.1 13.1 3.7 0.4 75.7Remote 491.0 0.0 39.5 39.7 15.9 3.2 1.7 0.0 60.5Very Remote n.p. n.p. n.p. n.p. n.p. n.p. n.p. n.p. n.p.
Vic
Metro 544.0 4.7 12.8 25.8 32.3 16.9 6.8 0.7 82.5Provincial 536.8 4.7 14.2 29.4 30.3 17.0 3.8 0.6 81.1Remote n.p. n.p. n.p. n.p. n.p. n.p. n.p. n.p. n.p.Very Remote - - - - - - - - -
Qld
Metro 530.8 3.6 18.8 30.7 27.2 14.7 4.3 0.6 77.6Provincial 519.5 2.3 24.9 32.2 25.6 11.8 2.7 0.6 72.8Remote 485.6 5.2 43.4 29.7 14.0 6.5 0.8 0.4 51.4Very Remote 479.5 3.1 50.8 28.0 12.8 4.2 1.0 0.1 46.1
WA
Metro 530.9 1.9 21.2 28.5 27.2 15.4 5.3 0.5 76.9Provincial 515.5 1.4 26.5 35.1 24.1 9.5 3.1 0.2 72.0Remote 495.0 0.9 38.7 31.3 17.4 9.1 2.0 0.6 60.3Very Remote 464.8 0.9 59.4 23.2 10.6 5.1 0.7 0.1 39.7
SA
Metro 521.9 3.2 23.2 30.0 28.1 11.6 3.7 0.1 73.6Provincial 519.9 4.6 22.6 33.4 24.7 11.4 2.8 0.5 72.8Remote n.p. n.p. n.p. n.p. n.p. n.p. n.p. n.p. n.p.Very Remote 478.5 0.0 51.1 26.5 15.1 4.6 1.6 1.1 48.9
Tas
Metro 538.3 2.5 16.8 28.2 31.3 13.2 4.9 3.1 80.7Provincial 541.2 2.0 13.8 31.4 25.2 21.5 5.2 0.9 84.3Remote n.p. n.p. n.p. n.p. n.p. n.p. n.p. n.p. n.p.Very Remote n.p. n.p. n.p. n.p. n.p. n.p. n.p. n.p. n.p.
ACT
Metro 540.3 2.3 18.3 24.2 29.2 18.0 6.8 1.2 79.4Provincial - - - - - - - - -Remote - - - - - - - - -Very Remote - - - - - - - - -
NT
Metro - - - - - - - - -Provincial 514.7 1.2 30.1 29.2 23.8 11.3 4.1 0.2 68.7Remote 469.2 6.1 49.5 25.0 13.4 4.5 1.3 0.1 44.4Very Remote 380.0 1.4 89.9 6.1 1.6 0.8 0.2 0.0 8.7
Aust
Metro 533.9 3.0 18.2 28.8 28.5 15.5 5.1 0.8 78.8Provincial 523.5 2.5 22.5 32.1 25.9 13.0 3.4 0.5 74.9Remote 486.8 3.1 42.1 31.0 15.6 6.5 1.4 0.3 54.8Very Remote 431.9 1.5 70.3 17.1 7.4 3.0 0.6 0.1 28.2
Refer to the introduction for explanatory notes.
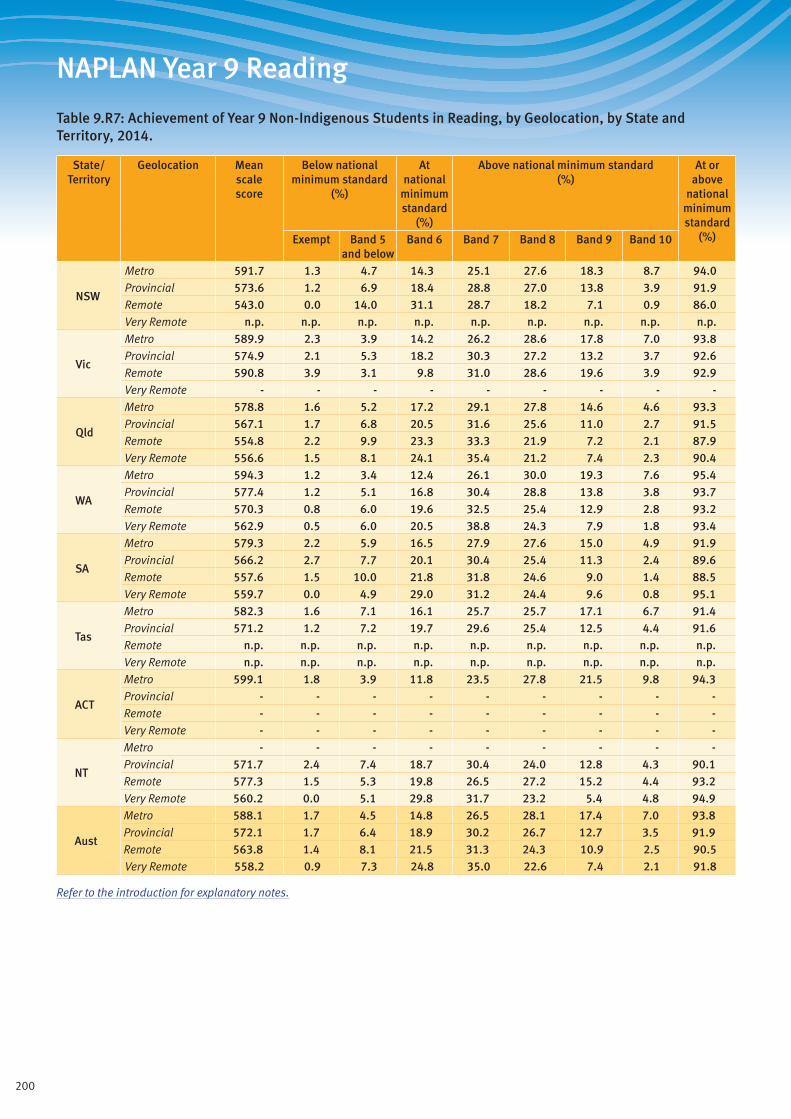
200
NAPLAN Year 9 Reading
Table 9.R7: Achievement of Year 9 Non-Indigenous Students in Reading, by Geolocation, by State and Territory, 2014.
State/ Territory
Geolocation Mean scale score
Below national minimum standard
(%)
At national
minimum standard
(%)
Above national minimum standard (%)
At or above
national minimum standard
(%)Exempt Band 5 and below
Band 6 Band 7 Band 8 Band 9 Band 10
NSW
Metro 591.7 1.3 4.7 14.3 25.1 27.6 18.3 8.7 94.0Provincial 573.6 1.2 6.9 18.4 28.8 27.0 13.8 3.9 91.9Remote 543.0 0.0 14.0 31.1 28.7 18.2 7.1 0.9 86.0Very Remote n.p. n.p. n.p. n.p. n.p. n.p. n.p. n.p. n.p.
Vic
Metro 589.9 2.3 3.9 14.2 26.2 28.6 17.8 7.0 93.8Provincial 574.9 2.1 5.3 18.2 30.3 27.2 13.2 3.7 92.6Remote 590.8 3.9 3.1 9.8 31.0 28.6 19.6 3.9 92.9Very Remote - - - - - - - - -
Qld
Metro 578.8 1.6 5.2 17.2 29.1 27.8 14.6 4.6 93.3Provincial 567.1 1.7 6.8 20.5 31.6 25.6 11.0 2.7 91.5Remote 554.8 2.2 9.9 23.3 33.3 21.9 7.2 2.1 87.9Very Remote 556.6 1.5 8.1 24.1 35.4 21.2 7.4 2.3 90.4
WA
Metro 594.3 1.2 3.4 12.4 26.1 30.0 19.3 7.6 95.4Provincial 577.4 1.2 5.1 16.8 30.4 28.8 13.8 3.8 93.7Remote 570.3 0.8 6.0 19.6 32.5 25.4 12.9 2.8 93.2Very Remote 562.9 0.5 6.0 20.5 38.8 24.3 7.9 1.8 93.4
SA
Metro 579.3 2.2 5.9 16.5 27.9 27.6 15.0 4.9 91.9Provincial 566.2 2.7 7.7 20.1 30.4 25.4 11.3 2.4 89.6Remote 557.6 1.5 10.0 21.8 31.8 24.6 9.0 1.4 88.5Very Remote 559.7 0.0 4.9 29.0 31.2 24.4 9.6 0.8 95.1
Tas
Metro 582.3 1.6 7.1 16.1 25.7 25.7 17.1 6.7 91.4Provincial 571.2 1.2 7.2 19.7 29.6 25.4 12.5 4.4 91.6Remote n.p. n.p. n.p. n.p. n.p. n.p. n.p. n.p. n.p.Very Remote n.p. n.p. n.p. n.p. n.p. n.p. n.p. n.p. n.p.
ACT
Metro 599.1 1.8 3.9 11.8 23.5 27.8 21.5 9.8 94.3Provincial - - - - - - - - -Remote - - - - - - - - -Very Remote - - - - - - - - -
NT
Metro - - - - - - - - -Provincial 571.7 2.4 7.4 18.7 30.4 24.0 12.8 4.3 90.1Remote 577.3 1.5 5.3 19.8 26.5 27.2 15.2 4.4 93.2Very Remote 560.2 0.0 5.1 29.8 31.7 23.2 5.4 4.8 94.9
Aust
Metro 588.1 1.7 4.5 14.8 26.5 28.1 17.4 7.0 93.8Provincial 572.1 1.7 6.4 18.9 30.2 26.7 12.7 3.5 91.9Remote 563.8 1.4 8.1 21.5 31.3 24.3 10.9 2.5 90.5Very Remote 558.2 0.9 7.3 24.8 35.0 22.6 7.4 2.1 91.8
Refer to the introduction for explanatory notes.

201
NAPLAN Year 9 Reading
Table 9.R8: Achievement of Year 9 Students in Reading, by Parental Education, by State and Territory, 2014.
State/ Territory
Parental education
Mean scale score
Below national minimum standard
(%)
At national
minimum standard
(%)
Above national minimum standard (%)
At or above
national minimum standard
(%)Exempt Band 5 and below
Band 6 Band 7 Band 8 Band 9 Band 10
NSW
Bachelor 622.5 0.7 1.4 6.2 17.7 30.7 27.5 15.8 97.9Diploma 588.0 0.9 3.7 13.4 28.6 30.8 17.0 5.6 95.4Certificate 565.7 1.1 7.0 21.2 31.9 25.8 10.6 2.4 91.9Year 12 571.8 1.7 7.1 19.1 29.5 25.8 13.1 3.8 91.3Year 11 538.3 3.0 15.9 29.2 29.0 16.5 5.3 1.2 81.2Not stated (8%) 570.5 2.5 9.3 19.6 26.4 23.4 13.7 5.2 88.2
Vic
Bachelor 617.0 1.3 1.2 6.6 19.9 31.8 26.4 12.8 97.5Diploma 583.6 1.6 3.4 15.1 29.4 30.7 15.8 4.1 95.0Certificate 567.9 2.2 5.6 20.3 32.4 26.6 10.7 2.1 92.2Year 12 575.4 2.6 4.8 18.2 30.6 27.4 12.8 3.7 92.6Year 11 549.0 5.3 10.4 26.2 31.3 19.0 6.5 1.2 84.3Not stated (4%) 596.1 3.6 4.2 11.8 23.3 28.7 19.8 8.5 92.1
Qld
Bachelor 606.3 0.9 1.7 8.8 23.4 32.7 23.0 9.4 97.3Diploma 575.3 1.1 4.8 17.1 32.1 29.2 12.9 2.9 94.2Certificate 559.9 1.5 7.6 22.8 33.4 24.7 8.5 1.5 90.9Year 12 559.9 1.9 8.5 23.1 31.3 23.8 9.6 1.8 89.6Year 11 536.5 3.1 15.1 30.3 30.6 16.0 4.4 0.6 81.8Not stated (14%) 559.7 2.8 10.5 22.0 28.9 22.6 10.4 2.8 86.7
WA
Bachelor 620.4 0.7 1.2 6.2 18.4 31.6 27.9 14.1 98.1Diploma 587.9 0.7 3.1 12.6 29.2 32.9 17.2 4.3 96.1Certificate 572.4 0.9 5.4 17.8 32.6 28.7 12.0 2.5 93.7Year 12 577.0 1.0 4.7 16.9 31.2 29.1 13.5 3.6 94.2Year 11 542.9 2.0 14.5 26.2 31.6 18.6 6.1 1.1 83.6Not stated (15%) 566.7 3.4 10.9 17.9 26.6 23.9 13.2 4.1 85.7
SA
Bachelor 607.6 0.8 2.2 8.9 21.5 32.4 24.2 10.0 97.0Diploma 576.2 1.7 5.2 16.3 30.6 30.1 13.0 3.1 93.1Certificate 562.9 1.7 7.4 21.3 33.0 25.0 9.9 1.7 90.9Year 12 563.2 2.3 7.6 20.4 32.7 26.2 9.2 1.7 90.1Year 11 538.0 4.4 15.9 28.1 29.2 16.0 5.5 0.9 79.7Not stated (12%) 564.3 5.6 10.3 19.3 26.5 23.0 11.6 3.7 84.1
KeyBachelor: Bachelor degree or aboveDiploma: Advanced diploma/diplomaCertificate: Certificate I to IVYear 12: Year 12 or equivalentYear 11: Year 11 or equivalent or belowNot stated: No data was provided for parental education at the time of student enrolment. The higher the percentage of missing data, the less informative are the results for the other categories.
Refer to the introduction for explanatory notes.
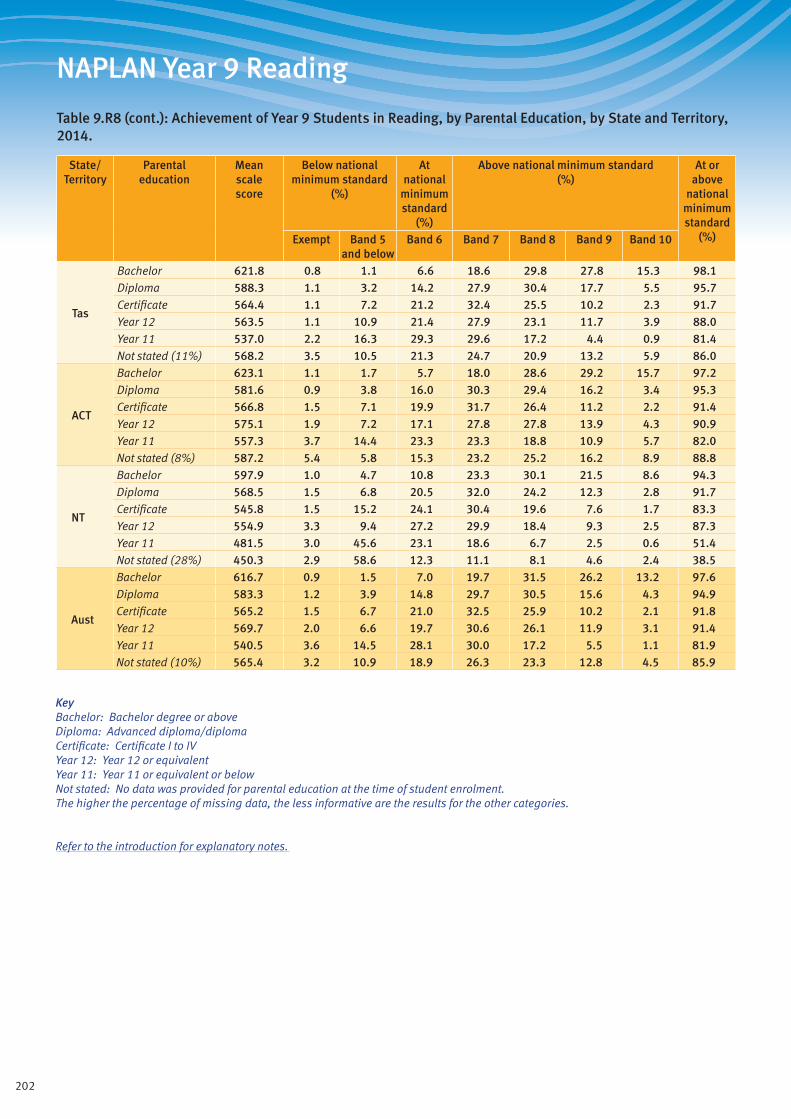
202
NAPLAN Year 9 Reading
Table 9.R8 (cont.): Achievement of Year 9 Students in Reading, by Parental Education, by State and Territory, 2014.
State/ Territory
Parental education
Mean scale score
Below national minimum standard
(%)
At national
minimum standard
(%)
Above national minimum standard (%)
At or above
national minimum standard
(%)Exempt Band 5 and below
Band 6 Band 7 Band 8 Band 9 Band 10
Tas
Bachelor 621.8 0.8 1.1 6.6 18.6 29.8 27.8 15.3 98.1Diploma 588.3 1.1 3.2 14.2 27.9 30.4 17.7 5.5 95.7Certificate 564.4 1.1 7.2 21.2 32.4 25.5 10.2 2.3 91.7Year 12 563.5 1.1 10.9 21.4 27.9 23.1 11.7 3.9 88.0Year 11 537.0 2.2 16.3 29.3 29.6 17.2 4.4 0.9 81.4Not stated (11%) 568.2 3.5 10.5 21.3 24.7 20.9 13.2 5.9 86.0
ACT
Bachelor 623.1 1.1 1.7 5.7 18.0 28.6 29.2 15.7 97.2Diploma 581.6 0.9 3.8 16.0 30.3 29.4 16.2 3.4 95.3Certificate 566.8 1.5 7.1 19.9 31.7 26.4 11.2 2.2 91.4Year 12 575.1 1.9 7.2 17.1 27.8 27.8 13.9 4.3 90.9Year 11 557.3 3.7 14.4 23.3 23.3 18.8 10.9 5.7 82.0Not stated (8%) 587.2 5.4 5.8 15.3 23.2 25.2 16.2 8.9 88.8
NT
Bachelor 597.9 1.0 4.7 10.8 23.3 30.1 21.5 8.6 94.3Diploma 568.5 1.5 6.8 20.5 32.0 24.2 12.3 2.8 91.7Certificate 545.8 1.5 15.2 24.1 30.4 19.6 7.6 1.7 83.3Year 12 554.9 3.3 9.4 27.2 29.9 18.4 9.3 2.5 87.3Year 11 481.5 3.0 45.6 23.1 18.6 6.7 2.5 0.6 51.4Not stated (28%) 450.3 2.9 58.6 12.3 11.1 8.1 4.6 2.4 38.5
Aust
Bachelor 616.7 0.9 1.5 7.0 19.7 31.5 26.2 13.2 97.6Diploma 583.3 1.2 3.9 14.8 29.7 30.5 15.6 4.3 94.9Certificate 565.2 1.5 6.7 21.0 32.5 25.9 10.2 2.1 91.8Year 12 569.7 2.0 6.6 19.7 30.6 26.1 11.9 3.1 91.4Year 11 540.5 3.6 14.5 28.1 30.0 17.2 5.5 1.1 81.9Not stated (10%) 565.4 3.2 10.9 18.9 26.3 23.3 12.8 4.5 85.9
KeyBachelor: Bachelor degree or aboveDiploma: Advanced diploma/diplomaCertificate: Certificate I to IVYear 12: Year 12 or equivalentYear 11: Year 11 or equivalent or belowNot stated: No data was provided for parental education at the time of student enrolment. The higher the percentage of missing data, the less informative are the results for the other categories.
Refer to the introduction for explanatory notes.
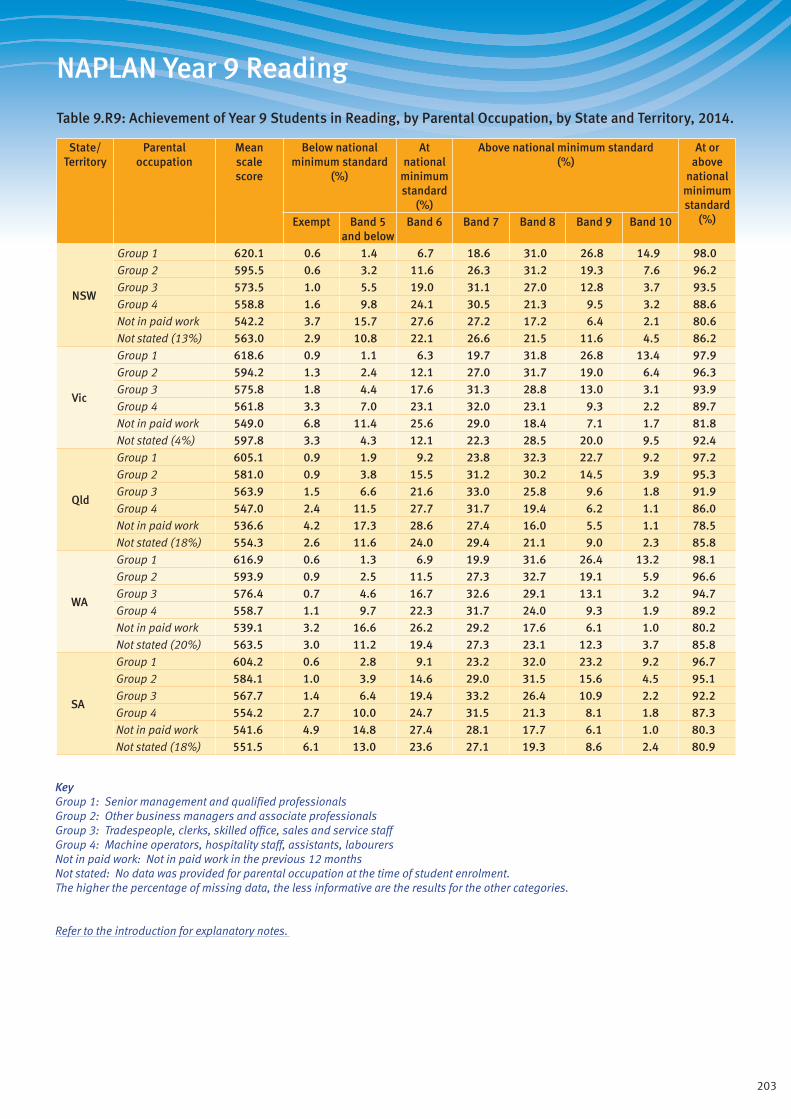
203
NAPLAN Year 9 Reading
Table 9.R9: Achievement of Year 9 Students in Reading, by Parental Occupation, by State and Territory, 2014.
State/ Territory
Parental occupation
Mean scale score
Below national minimum standard
(%)
At national
minimum standard
(%)
Above national minimum standard (%)
At or above
national minimum standard
(%)Exempt Band 5 and below
Band 6 Band 7 Band 8 Band 9 Band 10
NSW
Group 1 620.1 0.6 1.4 6.7 18.6 31.0 26.8 14.9 98.0Group 2 595.5 0.6 3.2 11.6 26.3 31.2 19.3 7.6 96.2Group 3 573.5 1.0 5.5 19.0 31.1 27.0 12.8 3.7 93.5Group 4 558.8 1.6 9.8 24.1 30.5 21.3 9.5 3.2 88.6Not in paid work 542.2 3.7 15.7 27.6 27.2 17.2 6.4 2.1 80.6Not stated (13%) 563.0 2.9 10.8 22.1 26.6 21.5 11.6 4.5 86.2
Vic
Group 1 618.6 0.9 1.1 6.3 19.7 31.8 26.8 13.4 97.9Group 2 594.2 1.3 2.4 12.1 27.0 31.7 19.0 6.4 96.3Group 3 575.8 1.8 4.4 17.6 31.3 28.8 13.0 3.1 93.9Group 4 561.8 3.3 7.0 23.1 32.0 23.1 9.3 2.2 89.7Not in paid work 549.0 6.8 11.4 25.6 29.0 18.4 7.1 1.7 81.8Not stated (4%) 597.8 3.3 4.3 12.1 22.3 28.5 20.0 9.5 92.4
Qld
Group 1 605.1 0.9 1.9 9.2 23.8 32.3 22.7 9.2 97.2Group 2 581.0 0.9 3.8 15.5 31.2 30.2 14.5 3.9 95.3Group 3 563.9 1.5 6.6 21.6 33.0 25.8 9.6 1.8 91.9Group 4 547.0 2.4 11.5 27.7 31.7 19.4 6.2 1.1 86.0Not in paid work 536.6 4.2 17.3 28.6 27.4 16.0 5.5 1.1 78.5Not stated (18%) 554.3 2.6 11.6 24.0 29.4 21.1 9.0 2.3 85.8
WA
Group 1 616.9 0.6 1.3 6.9 19.9 31.6 26.4 13.2 98.1Group 2 593.9 0.9 2.5 11.5 27.3 32.7 19.1 5.9 96.6Group 3 576.4 0.7 4.6 16.7 32.6 29.1 13.1 3.2 94.7Group 4 558.7 1.1 9.7 22.3 31.7 24.0 9.3 1.9 89.2Not in paid work 539.1 3.2 16.6 26.2 29.2 17.6 6.1 1.0 80.2Not stated (20%) 563.5 3.0 11.2 19.4 27.3 23.1 12.3 3.7 85.8
SA
Group 1 604.2 0.6 2.8 9.1 23.2 32.0 23.2 9.2 96.7Group 2 584.1 1.0 3.9 14.6 29.0 31.5 15.6 4.5 95.1Group 3 567.7 1.4 6.4 19.4 33.2 26.4 10.9 2.2 92.2Group 4 554.2 2.7 10.0 24.7 31.5 21.3 8.1 1.8 87.3Not in paid work 541.6 4.9 14.8 27.4 28.1 17.7 6.1 1.0 80.3Not stated (18%) 551.5 6.1 13.0 23.6 27.1 19.3 8.6 2.4 80.9
KeyGroup 1: Senior management and qualified professionalsGroup 2: Other business managers and associate professionalsGroup 3: Tradespeople, clerks, skilled office, sales and service staffGroup 4: Machine operators, hospitality staff, assistants, labourersNot in paid work: Not in paid work in the previous 12 monthsNot stated: No data was provided for parental occupation at the time of student enrolment. The higher the percentage of missing data, the less informative are the results for the other categories.
Refer to the introduction for explanatory notes.

204
NAPLAN Year 9 Reading
Table 9.R9 (cont.): Achievement of Year 9 Students in Reading, by Parental Occupation, by State and Territory, 2014.
State/ Territory
Parental occupation
Mean scale score
Below national minimum standard
(%)
At national
minimum standard
(%)
Above national minimum standard (%)
At or above
national minimum standard
(%)Exempt Band 5 and below
Band 6 Band 7 Band 8 Band 9 Band 10
Tas
Group 1 619.3 1.0 1.4 7.2 19.5 29.3 26.4 15.1 97.6Group 2 588.6 0.9 3.6 13.4 28.3 30.8 17.0 6.0 95.5Group 3 565.8 0.6 6.3 21.6 33.0 25.3 11.1 2.0 93.1Group 4 551.0 1.1 10.4 26.9 32.1 20.9 6.9 1.6 88.5Not in paid work 527.7 3.9 21.3 30.2 25.8 13.4 4.6 0.8 74.8Not stated (15%) 561.8 3.3 12.3 22.4 24.8 20.7 11.5 4.9 84.4
ACT
Group 1 618.4 1.1 1.8 7.0 19.5 28.8 27.1 14.6 97.1Group 2 596.0 0.9 3.9 11.3 25.4 29.9 20.5 8.1 95.2Group 3 576.5 1.4 5.3 17.8 30.3 26.6 14.7 3.9 93.3Group 4 559.2 2.0 10.7 23.3 27.3 21.7 13.1 1.8 87.3Not in paid work 551.1 6.7 12.8 26.7 23.6 19.1 9.0 2.0 80.4Not stated (12%) 574.4 5.1 8.8 18.2 24.6 23.0 13.8 6.5 86.2
NT
Group 1 584.9 1.0 6.9 14.6 26.7 25.7 17.5 7.6 92.0Group 2 581.9 2.1 5.4 16.8 27.4 26.7 16.2 5.5 92.5Group 3 544.9 1.4 13.7 26.3 32.2 18.7 6.6 1.1 84.9Group 4 512.2 2.2 30.2 26.9 23.1 11.0 5.4 1.0 67.5Not in paid work 458.6 2.7 58.8 20.0 9.8 5.6 2.6 0.5 38.5Not stated (27%) 437.5 3.3 62.0 13.0 11.9 7.1 2.2 0.5 34.7
Aust
Group 1 614.9 0.8 1.6 7.4 20.5 31.4 25.6 12.7 97.6Group 2 591.0 0.9 3.1 12.8 27.8 31.3 17.9 6.1 95.9Group 3 571.5 1.3 5.5 19.1 31.9 27.3 12.0 2.9 93.2Group 4 556.5 2.3 9.4 24.5 31.3 21.6 8.6 2.2 88.3Not in paid work 542.2 5.0 15.0 26.9 27.8 17.3 6.4 1.6 80.0Not stated (13%) 559.3 3.3 12.0 21.4 26.9 21.6 11.1 3.8 84.8
KeyGroup 1: Senior management and qualified professionalsGroup 2: Other business managers and associate professionalsGroup 3: Tradespeople, clerks, skilled office, sales and service staffGroup 4: Machine operators, hospitality staff, assistants, labourersNot in paid work: Not in paid work in the previous 12 monthsNot stated: No data was provided for parental occupation at the time of student enrolment. The higher the percentage of missing data, the less informative are the results for the other categories.
Refer to the introduction for explanatory notes.
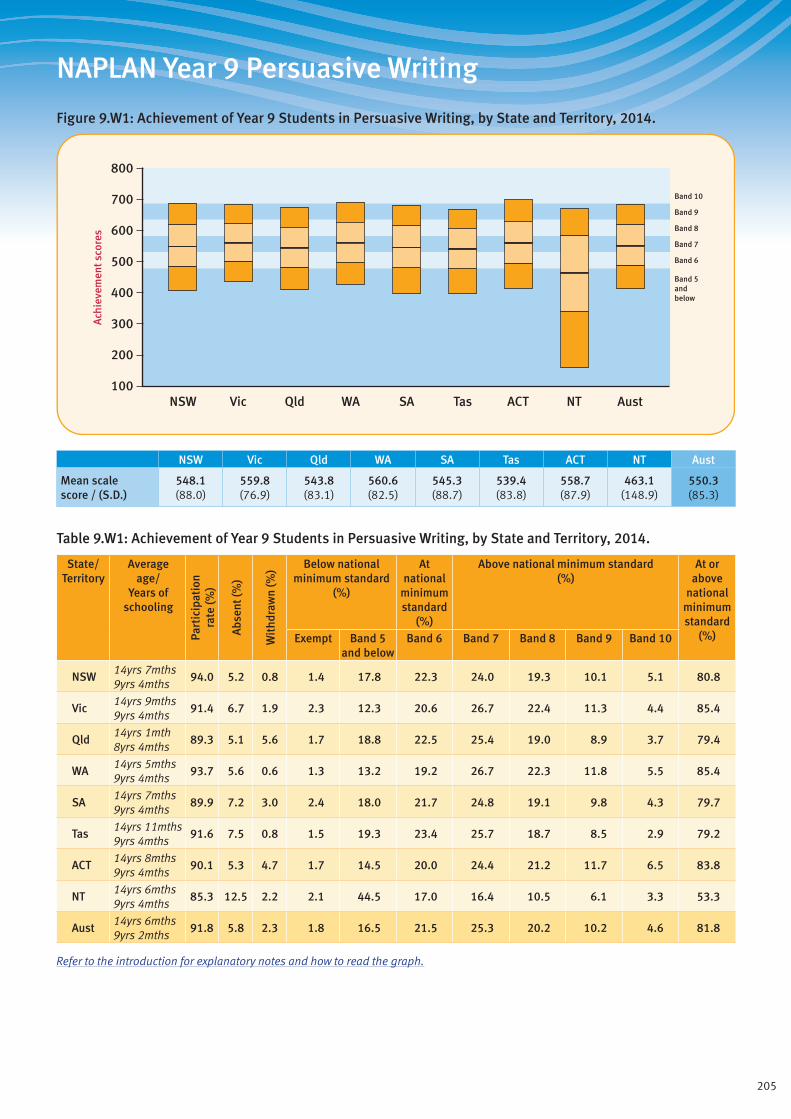
205
NAPLAN Year 9 Persuasive Writing
Figure 9.W1: Achievement of Year 9 Students in Persuasive Writing, by State and Territory, 2014.
Band 5andbelow
Band 6
Band 7
Band 8
Band 9
Band 10
800
700
500
600
400
300
100
200
Ach
ieve
men
t sco
res
ACTQld SAWA TasVicNSW NT Aust
NSW Vic Qld WA SA Tas ACT NT Aust
Mean scale score / (S.D.)
548.1 (88.0)
559.8 (76.9)
543.8 (83.1)
560.6 (82.5)
545.3 (88.7)
539.4 (83.8)
558.7 (87.9)
463.1 (148.9)
550.3 (85.3)
Table 9.W1: Achievement of Year 9 Students in Persuasive Writing, by State and Territory, 2014.
State/ Territory
Average age/
Years of schooling
Part
icip
atio
nra
te (%
)
Abs
ent (
%)
Wit
hdra
wn
(%) Below national
minimum standard (%)
At national
minimum standard
(%)
Above national minimum standard (%)
At or above
national minimum standard
(%)Exempt Band 5 and below
Band 6 Band 7 Band 8 Band 9 Band 10
NSW14yrs 7mths 9yrs 4mths
94.0 5.2 0.8 1.4 17.8 22.3 24.0 19.3 10.1 5.1 80.8
Vic14yrs 9mths 9yrs 4mths
91.4 6.7 1.9 2.3 12.3 20.6 26.7 22.4 11.3 4.4 85.4
Qld14yrs 1mth 8yrs 4mths
89.3 5.1 5.6 1.7 18.8 22.5 25.4 19.0 8.9 3.7 79.4
WA14yrs 5mths 9yrs 4mths
93.7 5.6 0.6 1.3 13.2 19.2 26.7 22.3 11.8 5.5 85.4
SA14yrs 7mths 9yrs 4mths
89.9 7.2 3.0 2.4 18.0 21.7 24.8 19.1 9.8 4.3 79.7
Tas14yrs 11mths 9yrs 4mths
91.6 7.5 0.8 1.5 19.3 23.4 25.7 18.7 8.5 2.9 79.2
ACT14yrs 8mths 9yrs 4mths
90.1 5.3 4.7 1.7 14.5 20.0 24.4 21.2 11.7 6.5 83.8
NT14yrs 6mths 9yrs 4mths
85.3 12.5 2.2 2.1 44.5 17.0 16.4 10.5 6.1 3.3 53.3
Aust14yrs 6mths 9yrs 2mths
91.8 5.8 2.3 1.8 16.5 21.5 25.3 20.2 10.2 4.6 81.8
Refer to the introduction for explanatory notes and how to read the graph.
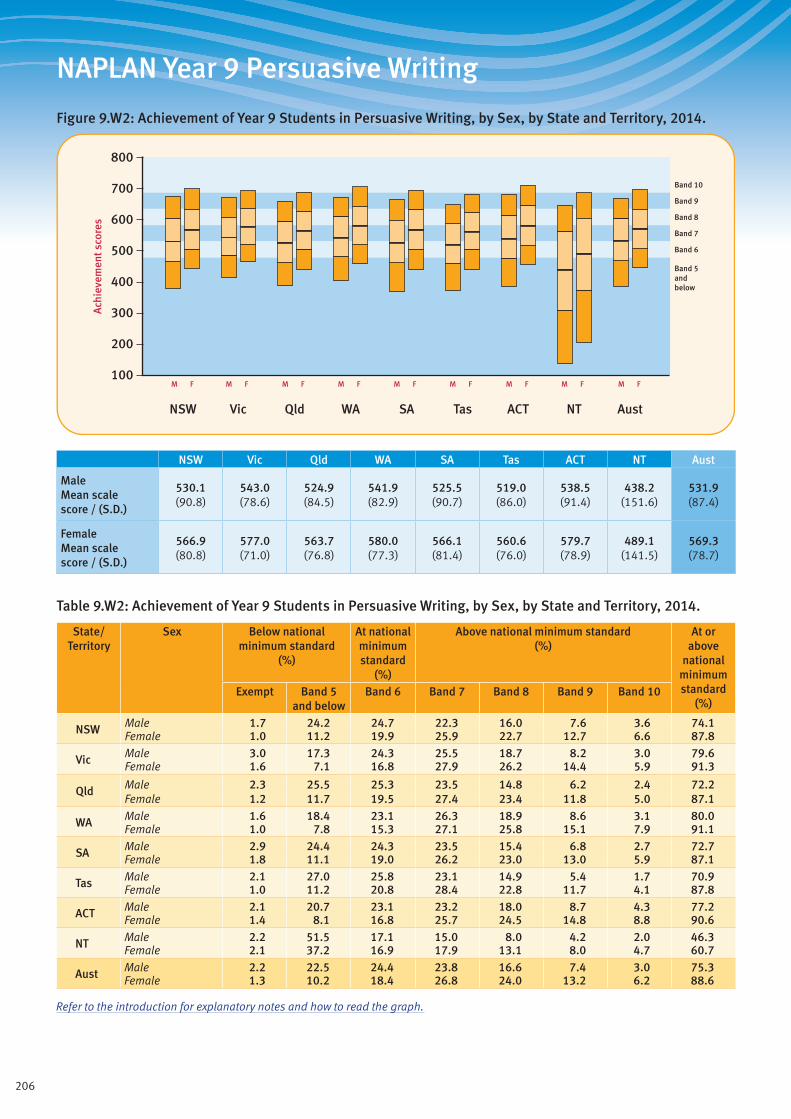
206
NAPLAN Year 9 Persuasive Writing
Figure 9.W2: Achievement of Year 9 Students in Persuasive Writing, by Sex, by State and Territory, 2014.
Band 5andbelow
Band 6
Band 7
Band 8
Band 9
Band 10
ACTQld SAWA TasVicNSW NT Aust
M F M F M F M F M F M F M F M F M F
800
700
500
600
400
300
100
200
Ach
ieve
men
t sco
res
NSW Vic Qld WA SA Tas ACT NT Aust
Male Mean scale score / (S.D.)
530.1 (90.8)
543.0 (78.6)
524.9 (84.5)
541.9 (82.9)
525.5 (90.7)
519.0 (86.0)
538.5 (91.4)
438.2 (151.6)
531.9 (87.4)
Female Mean scale score / (S.D.)
566.9 (80.8)
577.0 (71.0)
563.7 (76.8)
580.0 (77.3)
566.1 (81.4)
560.6 (76.0)
579.7 (78.9)
489.1 (141.5)
569.3 (78.7)
Table 9.W2: Achievement of Year 9 Students in Persuasive Writing, by Sex, by State and Territory, 2014.
State/ Territory
Sex Below national minimum standard
(%)
At national minimum standard
(%)
Above national minimum standard (%)
At or above
national minimum standard
(%)Exempt Band 5
and belowBand 6 Band 7 Band 8 Band 9 Band 10
NSW Male 1.7 24.2 24.7 22.3 16.0 7.6 3.6 74.1Female 1.0 11.2 19.9 25.9 22.7 12.7 6.6 87.8
Vic Male 3.0 17.3 24.3 25.5 18.7 8.2 3.0 79.6Female 1.6 7.1 16.8 27.9 26.2 14.4 5.9 91.3
Qld Male 2.3 25.5 25.3 23.5 14.8 6.2 2.4 72.2Female 1.2 11.7 19.5 27.4 23.4 11.8 5.0 87.1
WA Male 1.6 18.4 23.1 26.3 18.9 8.6 3.1 80.0Female 1.0 7.8 15.3 27.1 25.8 15.1 7.9 91.1
SA Male 2.9 24.4 24.3 23.5 15.4 6.8 2.7 72.7Female 1.8 11.1 19.0 26.2 23.0 13.0 5.9 87.1
Tas Male 2.1 27.0 25.8 23.1 14.9 5.4 1.7 70.9Female 1.0 11.2 20.8 28.4 22.8 11.7 4.1 87.8
ACT Male 2.1 20.7 23.1 23.2 18.0 8.7 4.3 77.2Female 1.4 8.1 16.8 25.7 24.5 14.8 8.8 90.6
NT Male 2.2 51.5 17.1 15.0 8.0 4.2 2.0 46.3Female 2.1 37.2 16.9 17.9 13.1 8.0 4.7 60.7
Aust Male 2.2 22.5 24.4 23.8 16.6 7.4 3.0 75.3Female 1.3 10.2 18.4 26.8 24.0 13.2 6.2 88.6
Refer to the introduction for explanatory notes and how to read the graph.
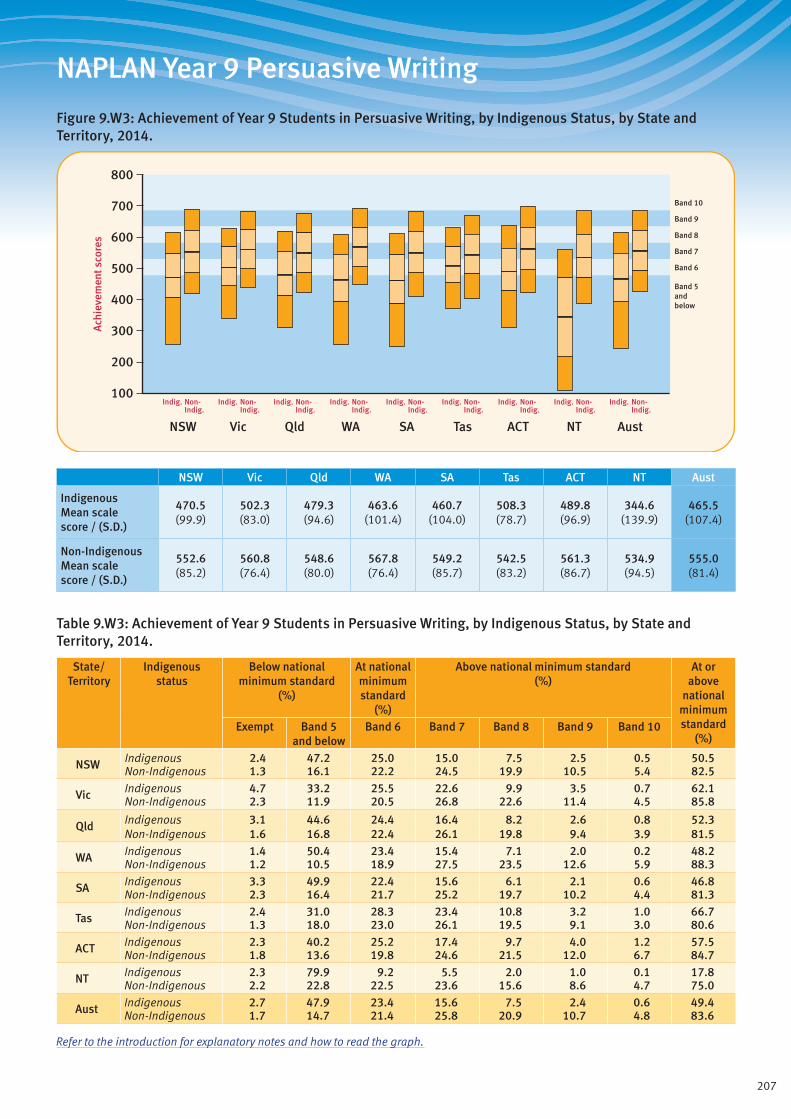
207
NAPLAN Year 9 Persuasive Writing
Figure 9.W3: Achievement of Year 9 Students in Persuasive Writing, by Indigenous Status, by State and Territory, 2014.
Band 5andbelow
Band 6
Band 7
Band 8
Band 9
Band 10
ACTQld SAWA TasVicNSW NT Aust
800
700
500
600
400
300
100
200
Ach
ieve
men
t sco
res
Indig. Non-Indig.
Indig. Non-Indig.
Indig. Non-Indig.
Indig. Non-Indig.
Indig. Non-Indig.
Indig. Non-Indig.
Indig. Non-Indig.
Indig. Non-Indig.
Indig. Non-Indig.
NSW Vic Qld WA SA Tas ACT NT Aust
Indigenous Mean scale score / (S.D.)
470.5 (99.9)
502.3 (83.0)
479.3 (94.6)
463.6 (101.4)
460.7 (104.0)
508.3 (78.7)
489.8 (96.9)
344.6 (139.9)
465.5 (107.4)
Non-Indigenous Mean scale score / (S.D.)
552.6 (85.2)
560.8 (76.4)
548.6 (80.0)
567.8 (76.4)
549.2 (85.7)
542.5 (83.2)
561.3 (86.7)
534.9 (94.5)
555.0 (81.4)
Table 9.W3: Achievement of Year 9 Students in Persuasive Writing, by Indigenous Status, by State and Territory, 2014.
State/ Territory
Indigenous status
Below national minimum standard
(%)
At national minimum standard
(%)
Above national minimum standard (%)
At or above
national minimum standard
(%)Exempt Band 5
and belowBand 6 Band 7 Band 8 Band 9 Band 10
NSW Indigenous 2.4 47.2 25.0 15.0 7.5 2.5 0.5 50.5Non-Indigenous 1.3 16.1 22.2 24.5 19.9 10.5 5.4 82.5
Vic Indigenous 4.7 33.2 25.5 22.6 9.9 3.5 0.7 62.1Non-Indigenous 2.3 11.9 20.5 26.8 22.6 11.4 4.5 85.8
Qld Indigenous 3.1 44.6 24.4 16.4 8.2 2.6 0.8 52.3Non-Indigenous 1.6 16.8 22.4 26.1 19.8 9.4 3.9 81.5
WA Indigenous 1.4 50.4 23.4 15.4 7.1 2.0 0.2 48.2Non-Indigenous 1.2 10.5 18.9 27.5 23.5 12.6 5.9 88.3
SA Indigenous 3.3 49.9 22.4 15.6 6.1 2.1 0.6 46.8Non-Indigenous 2.3 16.4 21.7 25.2 19.7 10.2 4.4 81.3
Tas Indigenous 2.4 31.0 28.3 23.4 10.8 3.2 1.0 66.7Non-Indigenous 1.3 18.0 23.0 26.1 19.5 9.1 3.0 80.6
ACT Indigenous 2.3 40.2 25.2 17.4 9.7 4.0 1.2 57.5Non-Indigenous 1.8 13.6 19.8 24.6 21.5 12.0 6.7 84.7
NT Indigenous 2.3 79.9 9.2 5.5 2.0 1.0 0.1 17.8Non-Indigenous 2.2 22.8 22.5 23.6 15.6 8.6 4.7 75.0
Aust Indigenous 2.7 47.9 23.4 15.6 7.5 2.4 0.6 49.4Non-Indigenous 1.7 14.7 21.4 25.8 20.9 10.7 4.8 83.6
Refer to the introduction for explanatory notes and how to read the graph.
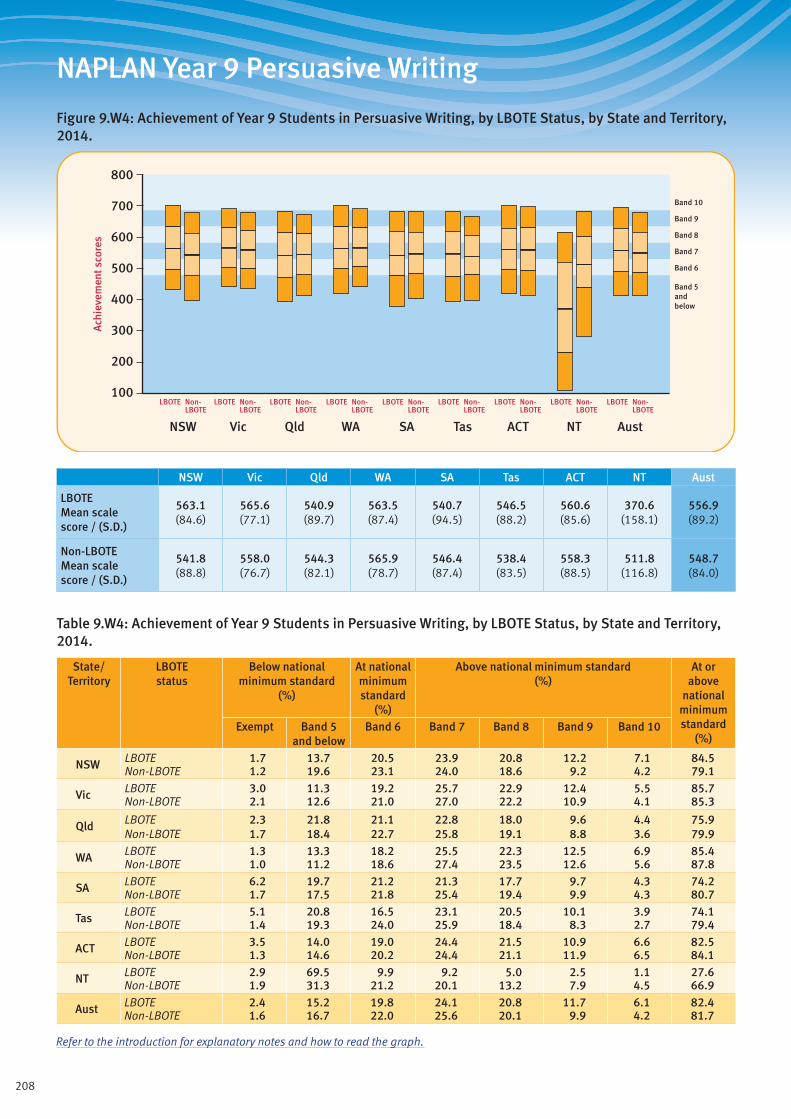
208
NAPLAN Year 9 Persuasive Writing
Figure 9.W4: Achievement of Year 9 Students in Persuasive Writing, by LBOTE Status, by State and Territory, 2014.
Band 5andbelow
Band 6
Band 7
Band 8
Band 9
Band 10
ACTQld SAWA TasVicNSW NT Aust
800
700
500
600
400
300
100
200
Ach
ieve
men
t sco
res
LBOTE Non-LBOTE
LBOTE Non-LBOTE
LBOTE Non-LBOTE
LBOTE Non-LBOTE
LBOTE Non-LBOTE
LBOTE Non-LBOTE
LBOTE Non-LBOTE
LBOTE Non-LBOTE
LBOTE Non-LBOTE
NSW Vic Qld WA SA Tas ACT NT Aust
LBOTE Mean scale score / (S.D.)
563.1 (84.6)
565.6 (77.1)
540.9 (89.7)
563.5 (87.4)
540.7 (94.5)
546.5 (88.2)
560.6 (85.6)
370.6 (158.1)
556.9 (89.2)
Non-LBOTE Mean scale score / (S.D.)
541.8 (88.8)
558.0 (76.7)
544.3 (82.1)
565.9 (78.7)
546.4 (87.4)
538.4 (83.5)
558.3 (88.5)
511.8 (116.8)
548.7 (84.0)
Table 9.W4: Achievement of Year 9 Students in Persuasive Writing, by LBOTE Status, by State and Territory, 2014.
State/ Territory
LBOTE status
Below national minimum standard
(%)
At national minimum standard
(%)
Above national minimum standard (%)
At or above
national minimum standard
(%)Exempt Band 5
and belowBand 6 Band 7 Band 8 Band 9 Band 10
NSW LBOTE 1.7 13.7 20.5 23.9 20.8 12.2 7.1 84.5Non-LBOTE 1.2 19.6 23.1 24.0 18.6 9.2 4.2 79.1
Vic LBOTE 3.0 11.3 19.2 25.7 22.9 12.4 5.5 85.7Non-LBOTE 2.1 12.6 21.0 27.0 22.2 10.9 4.1 85.3
Qld LBOTE 2.3 21.8 21.1 22.8 18.0 9.6 4.4 75.9Non-LBOTE 1.7 18.4 22.7 25.8 19.1 8.8 3.6 79.9
WA LBOTE 1.3 13.3 18.2 25.5 22.3 12.5 6.9 85.4Non-LBOTE 1.0 11.2 18.6 27.4 23.5 12.6 5.6 87.8
SA LBOTE 6.2 19.7 21.2 21.3 17.7 9.7 4.3 74.2Non-LBOTE 1.7 17.5 21.8 25.4 19.4 9.9 4.3 80.7
Tas LBOTE 5.1 20.8 16.5 23.1 20.5 10.1 3.9 74.1Non-LBOTE 1.4 19.3 24.0 25.9 18.4 8.3 2.7 79.4
ACT LBOTE 3.5 14.0 19.0 24.4 21.5 10.9 6.6 82.5Non-LBOTE 1.3 14.6 20.2 24.4 21.1 11.9 6.5 84.1
NT LBOTE 2.9 69.5 9.9 9.2 5.0 2.5 1.1 27.6Non-LBOTE 1.9 31.3 21.2 20.1 13.2 7.9 4.5 66.9
Aust LBOTE 2.4 15.2 19.8 24.1 20.8 11.7 6.1 82.4Non-LBOTE 1.6 16.7 22.0 25.6 20.1 9.9 4.2 81.7
Refer to the introduction for explanatory notes and how to read the graph.
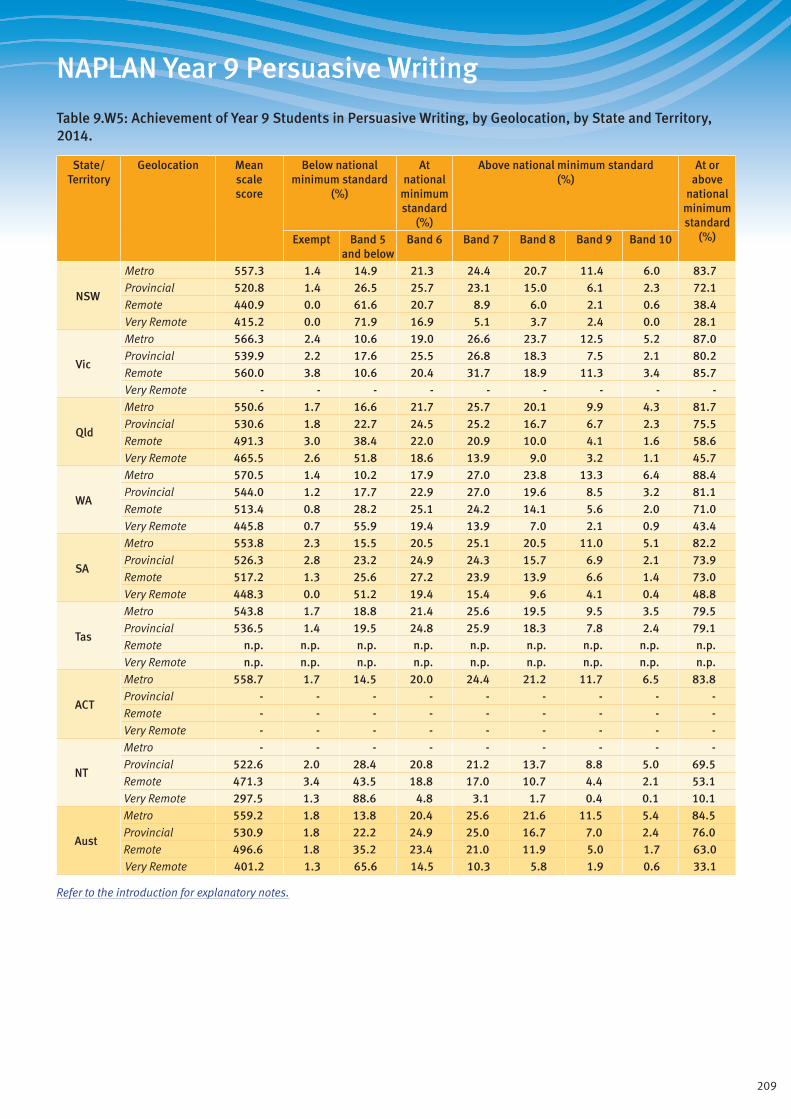
209
NAPLAN Year 9 Persuasive Writing
Table 9.W5: Achievement of Year 9 Students in Persuasive Writing, by Geolocation, by State and Territory, 2014.
State/ Territory
Geolocation Mean scale score
Below national minimum standard
(%)
At national
minimum standard
(%)
Above national minimum standard (%)
At or above
national minimum standard
(%)Exempt Band 5 and below
Band 6 Band 7 Band 8 Band 9 Band 10
NSW
Metro 557.3 1.4 14.9 21.3 24.4 20.7 11.4 6.0 83.7Provincial 520.8 1.4 26.5 25.7 23.1 15.0 6.1 2.3 72.1Remote 440.9 0.0 61.6 20.7 8.9 6.0 2.1 0.6 38.4Very Remote 415.2 0.0 71.9 16.9 5.1 3.7 2.4 0.0 28.1
Vic
Metro 566.3 2.4 10.6 19.0 26.6 23.7 12.5 5.2 87.0Provincial 539.9 2.2 17.6 25.5 26.8 18.3 7.5 2.1 80.2Remote 560.0 3.8 10.6 20.4 31.7 18.9 11.3 3.4 85.7Very Remote - - - - - - - - -
Qld
Metro 550.6 1.7 16.6 21.7 25.7 20.1 9.9 4.3 81.7Provincial 530.6 1.8 22.7 24.5 25.2 16.7 6.7 2.3 75.5Remote 491.3 3.0 38.4 22.0 20.9 10.0 4.1 1.6 58.6Very Remote 465.5 2.6 51.8 18.6 13.9 9.0 3.2 1.1 45.7
WA
Metro 570.5 1.4 10.2 17.9 27.0 23.8 13.3 6.4 88.4Provincial 544.0 1.2 17.7 22.9 27.0 19.6 8.5 3.2 81.1Remote 513.4 0.8 28.2 25.1 24.2 14.1 5.6 2.0 71.0Very Remote 445.8 0.7 55.9 19.4 13.9 7.0 2.1 0.9 43.4
SA
Metro 553.8 2.3 15.5 20.5 25.1 20.5 11.0 5.1 82.2Provincial 526.3 2.8 23.2 24.9 24.3 15.7 6.9 2.1 73.9Remote 517.2 1.3 25.6 27.2 23.9 13.9 6.6 1.4 73.0Very Remote 448.3 0.0 51.2 19.4 15.4 9.6 4.1 0.4 48.8
Tas
Metro 543.8 1.7 18.8 21.4 25.6 19.5 9.5 3.5 79.5Provincial 536.5 1.4 19.5 24.8 25.9 18.3 7.8 2.4 79.1Remote n.p. n.p. n.p. n.p. n.p. n.p. n.p. n.p. n.p.Very Remote n.p. n.p. n.p. n.p. n.p. n.p. n.p. n.p. n.p.
ACT
Metro 558.7 1.7 14.5 20.0 24.4 21.2 11.7 6.5 83.8Provincial - - - - - - - - -Remote - - - - - - - - -Very Remote - - - - - - - - -
NT
Metro - - - - - - - - -Provincial 522.6 2.0 28.4 20.8 21.2 13.7 8.8 5.0 69.5Remote 471.3 3.4 43.5 18.8 17.0 10.7 4.4 2.1 53.1Very Remote 297.5 1.3 88.6 4.8 3.1 1.7 0.4 0.1 10.1
Aust
Metro 559.2 1.8 13.8 20.4 25.6 21.6 11.5 5.4 84.5Provincial 530.9 1.8 22.2 24.9 25.0 16.7 7.0 2.4 76.0Remote 496.6 1.8 35.2 23.4 21.0 11.9 5.0 1.7 63.0Very Remote 401.2 1.3 65.6 14.5 10.3 5.8 1.9 0.6 33.1
Refer to the introduction for explanatory notes.

210
NAPLAN Year 9 Persuasive Writing
Table 9.W6: Achievement of Year 9 Indigenous Students in Persuasive Writing, by Geolocation, by State and Territory, 2014.
State/ Territory
Geolocation Mean scale score
Below national minimum standard
(%)
At national
minimum standard
(%)
Above national minimum standard (%)
At or above
national minimum standard
(%)Exempt Band 5 and below
Band 6 Band 7 Band 8 Band 9 Band 10
NSW
Metro 486.3 2.5 40.5 27.0 16.8 9.1 3.5 0.7 57.0Provincial 462.3 2.5 50.9 23.9 14.1 6.5 1.8 0.4 46.6Remote 389.6 0.0 77.1 15.8 5.9 1.2 0.0 0.0 22.9Very Remote n.p. n.p. n.p. n.p. n.p. n.p. n.p. n.p. n.p.
Vic
Metro 510.6 4.7 30.2 25.7 23.3 11.2 3.7 1.2 65.0Provincial 494.4 4.7 35.9 25.2 21.9 8.8 3.2 0.2 59.4Remote n.p. n.p. n.p. n.p. n.p. n.p. n.p. n.p. n.p.Very Remote - - - - - - - - -
Qld
Metro 492.9 3.5 38.3 26.6 18.2 9.4 3.0 0.9 58.1Provincial 477.5 2.3 46.1 24.2 16.3 8.0 2.4 0.7 51.6Remote 422.7 5.2 63.5 16.3 9.8 3.8 1.2 0.2 31.3Very Remote 418.7 3.1 72.7 13.4 6.9 2.5 1.0 0.3 24.2
WA
Metro 498.3 1.9 36.7 26.2 20.9 10.3 3.4 0.5 61.4Provincial 473.2 1.4 48.6 25.7 16.0 6.7 1.4 0.1 50.0Remote 443.1 0.9 56.4 23.9 12.6 5.2 0.9 0.1 42.7Very Remote 398.0 0.9 76.0 13.8 5.6 2.9 1.0 0.0 23.2
SA
Metro 477.0 3.2 44.4 24.4 17.4 7.2 2.5 1.0 52.4Provincial 459.9 4.6 49.1 22.8 15.4 5.9 2.0 0.3 46.3Remote n.p. n.p. n.p. n.p. n.p. n.p. n.p. n.p. n.p.Very Remote 377.8 0.0 79.5 10.8 7.0 2.4 0.3 0.0 20.5
Tas
Metro 503.5 2.5 35.1 27.0 22.5 8.7 2.7 1.4 62.4Provincial 511.6 2.0 28.3 28.9 24.1 12.3 3.6 0.8 69.7Remote n.p. n.p. n.p. n.p. n.p. n.p. n.p. n.p. n.p.Very Remote n.p. n.p. n.p. n.p. n.p. n.p. n.p. n.p. n.p.
ACT
Metro 489.8 2.3 40.2 25.2 17.4 9.7 4.0 1.2 57.5Provincial - - - - - - - - -Remote - - - - - - - - -Very Remote - - - - - - - - -
NT
Metro - - - - - - - - -Provincial 444.6 1.2 57.8 19.3 13.3 5.0 2.8 0.5 41.0Remote 380.3 6.1 72.6 12.6 6.0 2.0 0.7 0.0 21.3Very Remote 271.4 1.4 96.0 1.8 0.6 0.3 0.0 0.0 2.6
Aust
Metro 491.8 3.0 38.6 26.4 18.5 9.4 3.2 0.8 58.4Provincial 471.6 2.6 47.2 24.2 16.1 7.3 2.2 0.5 50.2Remote 416.0 3.1 65.1 18.1 9.4 3.4 0.9 0.1 31.9Very Remote 345.3 1.5 84.3 8.3 3.7 1.6 0.5 0.1 14.2
Refer to the introduction for explanatory notes.
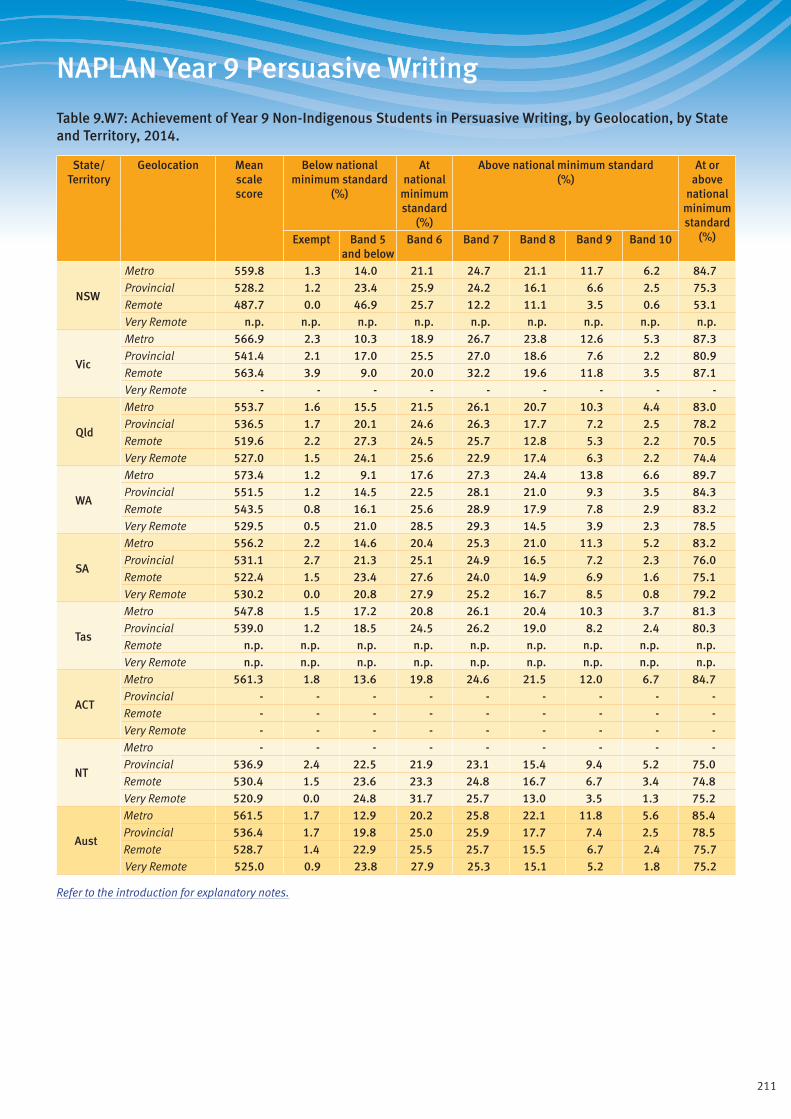
211
NAPLAN Year 9 Persuasive Writing
Table 9.W7: Achievement of Year 9 Non-Indigenous Students in Persuasive Writing, by Geolocation, by State and Territory, 2014.
State/ Territory
Geolocation Mean scale score
Below national minimum standard
(%)
At national
minimum standard
(%)
Above national minimum standard (%)
At or above
national minimum standard
(%)Exempt Band 5 and below
Band 6 Band 7 Band 8 Band 9 Band 10
NSW
Metro 559.8 1.3 14.0 21.1 24.7 21.1 11.7 6.2 84.7Provincial 528.2 1.2 23.4 25.9 24.2 16.1 6.6 2.5 75.3Remote 487.7 0.0 46.9 25.7 12.2 11.1 3.5 0.6 53.1Very Remote n.p. n.p. n.p. n.p. n.p. n.p. n.p. n.p. n.p.
Vic
Metro 566.9 2.3 10.3 18.9 26.7 23.8 12.6 5.3 87.3Provincial 541.4 2.1 17.0 25.5 27.0 18.6 7.6 2.2 80.9Remote 563.4 3.9 9.0 20.0 32.2 19.6 11.8 3.5 87.1Very Remote - - - - - - - - -
Qld
Metro 553.7 1.6 15.5 21.5 26.1 20.7 10.3 4.4 83.0Provincial 536.5 1.7 20.1 24.6 26.3 17.7 7.2 2.5 78.2Remote 519.6 2.2 27.3 24.5 25.7 12.8 5.3 2.2 70.5Very Remote 527.0 1.5 24.1 25.6 22.9 17.4 6.3 2.2 74.4
WA
Metro 573.4 1.2 9.1 17.6 27.3 24.4 13.8 6.6 89.7Provincial 551.5 1.2 14.5 22.5 28.1 21.0 9.3 3.5 84.3Remote 543.5 0.8 16.1 25.6 28.9 17.9 7.8 2.9 83.2Very Remote 529.5 0.5 21.0 28.5 29.3 14.5 3.9 2.3 78.5
SA
Metro 556.2 2.2 14.6 20.4 25.3 21.0 11.3 5.2 83.2Provincial 531.1 2.7 21.3 25.1 24.9 16.5 7.2 2.3 76.0Remote 522.4 1.5 23.4 27.6 24.0 14.9 6.9 1.6 75.1Very Remote 530.2 0.0 20.8 27.9 25.2 16.7 8.5 0.8 79.2
Tas
Metro 547.8 1.5 17.2 20.8 26.1 20.4 10.3 3.7 81.3Provincial 539.0 1.2 18.5 24.5 26.2 19.0 8.2 2.4 80.3Remote n.p. n.p. n.p. n.p. n.p. n.p. n.p. n.p. n.p.Very Remote n.p. n.p. n.p. n.p. n.p. n.p. n.p. n.p. n.p.
ACT
Metro 561.3 1.8 13.6 19.8 24.6 21.5 12.0 6.7 84.7Provincial - - - - - - - - -Remote - - - - - - - - -Very Remote - - - - - - - - -
NT
Metro - - - - - - - - -Provincial 536.9 2.4 22.5 21.9 23.1 15.4 9.4 5.2 75.0Remote 530.4 1.5 23.6 23.3 24.8 16.7 6.7 3.4 74.8Very Remote 520.9 0.0 24.8 31.7 25.7 13.0 3.5 1.3 75.2
Aust
Metro 561.5 1.7 12.9 20.2 25.8 22.1 11.8 5.6 85.4Provincial 536.4 1.7 19.8 25.0 25.9 17.7 7.4 2.5 78.5Remote 528.7 1.4 22.9 25.5 25.7 15.5 6.7 2.4 75.7Very Remote 525.0 0.9 23.8 27.9 25.3 15.1 5.2 1.8 75.2
Refer to the introduction for explanatory notes.

212
NAPLAN Year 9 Persuasive Writing
Table 9.W8: Achievement of Year 9 Students in Persuasive Writing, by Parental Education, by State and Territory, 2014.
State/ Territory
Parental education
Mean scale score
Below national minimum standard
(%)
At national
minimum standard
(%)
Above national minimum standard (%)
At or above
national minimum standard
(%)Exempt Band 5 and below
Band 6 Band 7 Band 8 Band 9 Band 10
NSW
Bachelor 589.7 0.7 6.3 14.9 24.1 26.5 17.0 10.5 93.0Diploma 554.1 0.9 13.8 23.2 26.8 21.1 10.1 4.1 85.3Certificate 528.0 1.2 22.6 27.4 24.9 15.7 6.3 2.0 76.3Year 12 537.6 1.7 19.4 25.4 25.4 17.0 8.0 3.0 78.9Year 11 494.8 3.0 36.8 26.9 19.2 9.8 3.2 1.0 60.2Not stated (8%) 531.2 2.5 24.1 23.1 22.1 16.1 8.1 4.0 73.4
Vic
Bachelor 591.1 1.3 4.9 13.0 25.6 28.6 18.1 8.5 93.8Diploma 559.6 1.6 10.8 21.7 28.7 23.1 10.4 3.7 87.6Certificate 540.8 2.2 16.5 25.5 28.0 18.8 7.1 1.9 81.3Year 12 552.1 2.6 13.1 23.2 27.9 21.0 9.3 2.9 84.3Year 11 522.2 5.4 23.2 27.4 24.5 14.0 4.4 1.1 71.5Not stated (4%) 572.8 3.6 10.6 16.3 23.2 24.8 15.1 6.3 85.7
Qld
Bachelor 580.3 1.0 8.0 16.2 25.8 26.0 15.4 7.6 91.1Diploma 548.7 1.1 15.2 23.6 28.1 20.1 8.9 3.0 83.7Certificate 532.9 1.5 21.2 25.4 26.5 16.9 6.3 2.1 77.2Year 12 532.3 1.9 22.0 24.9 25.8 16.6 6.4 2.3 76.0Year 11 502.8 3.2 34.0 26.5 20.9 10.7 3.7 1.0 62.8Not stated (14%) 530.2 2.8 24.1 22.7 23.2 16.6 7.6 3.0 73.1
WA
Bachelor 597.6 0.7 4.3 11.8 24.7 28.5 19.4 10.6 95.0Diploma 567.2 0.7 9.0 19.1 30.0 25.1 11.6 4.5 90.2Certificate 549.6 0.8 14.1 23.6 29.2 20.5 8.5 3.2 85.0Year 12 555.6 1.0 13.5 22.1 27.1 21.9 10.0 4.3 85.4Year 11 515.5 2.0 28.4 26.0 24.4 12.9 4.6 1.8 69.6Not stated (15%) 537.8 3.4 20.7 20.2 25.0 17.8 9.2 3.7 75.9
SA
Bachelor 583.6 0.8 7.2 15.5 25.4 26.1 16.1 8.9 92.0Diploma 554.9 1.7 13.4 21.5 27.2 20.9 11.2 4.1 84.9Certificate 532.9 1.7 20.5 24.8 26.5 17.0 7.3 2.2 77.8Year 12 539.1 2.3 18.5 24.5 26.3 17.6 7.8 3.0 79.3Year 11 503.4 4.4 32.5 26.8 19.3 11.1 4.6 1.4 63.1Not stated (12%) 532.0 5.6 22.9 20.5 22.0 17.1 8.0 3.8 71.4
KeyBachelor: Bachelor degree or aboveDiploma: Advanced diploma/diplomaCertificate: Certificate I to IVYear 12: Year 12 or equivalentYear 11: Year 11 or equivalent or belowNot stated: No data was provided for parental education at the time of student enrolment. The higher the percentage of missing data, the less informative are the results for the other categories.
Refer to the introduction for explanatory notes.

213
NAPLAN Year 9 Persuasive Writing
Table 9.W8 (cont.): Achievement of Year 9 Students in Persuasive Writing, by Parental Education, by State and Territory, 2014.
State/ Territory
Parental education
Mean scale score
Below national minimum standard
(%)
At national
minimum standard
(%)
Above national minimum standard (%)
At or above
national minimum standard
(%)Exempt Band 5 and below
Band 6 Band 7 Band 8 Band 9 Band 10
Tas
Bachelor 585.2 0.8 6.5 13.9 26.4 28.1 17.0 7.3 92.7Diploma 555.6 1.1 12.4 21.2 28.8 23.3 10.1 3.1 86.5Certificate 530.5 1.1 19.7 27.4 27.5 16.8 5.9 1.5 79.1Year 12 530.6 1.1 24.6 25.0 19.7 16.6 9.5 3.6 74.3Year 11 505.4 2.1 32.3 26.8 22.7 11.3 3.8 0.8 65.5Not stated (11%) 532.8 3.5 21.3 23.7 24.9 17.6 6.9 2.0 75.2
ACT
Bachelor 584.2 1.1 7.6 15.2 24.8 25.4 15.9 10.0 91.3Diploma 544.4 0.9 15.7 23.9 27.8 19.7 9.2 2.8 83.4Certificate 530.8 1.5 23.0 25.3 22.9 17.2 7.3 2.8 75.5Year 12 539.7 1.9 17.8 26.8 25.5 17.7 7.0 3.2 80.2Year 11 513.4 3.7 31.8 22.5 18.9 11.0 7.2 5.0 64.6Not stated (8%) 542.5 5.4 20.2 21.4 21.5 17.5 9.0 4.9 74.4
NT
Bachelor 559.6 1.0 15.7 18.8 24.1 19.8 12.6 8.0 83.3Diploma 534.8 1.5 24.2 21.5 24.5 14.6 9.2 4.5 74.3Certificate 500.9 1.5 34.9 24.2 19.5 11.8 5.4 2.6 63.6Year 12 513.8 3.3 28.7 26.2 22.9 10.6 6.1 2.1 67.9Year 11 406.0 3.0 66.3 14.3 9.7 4.3 1.7 0.7 30.6Not stated (28%) 363.9 2.9 69.5 8.3 8.4 5.3 3.5 2.1 27.6
Aust
Bachelor 588.3 0.9 6.2 14.4 25.0 27.1 17.1 9.3 92.9Diploma 555.6 1.2 12.9 22.3 28.0 21.8 10.2 3.8 86.0Certificate 534.5 1.5 19.9 25.9 26.5 17.3 6.8 2.1 78.6Year 12 542.1 2.0 17.7 24.3 26.3 18.5 8.2 3.0 80.3Year 11 505.6 3.6 31.7 26.7 21.5 11.5 3.9 1.2 64.7Not stated (10%) 531.9 3.2 23.1 21.1 22.7 17.3 8.7 3.8 73.6
KeyBachelor: Bachelor degree or aboveDiploma: Advanced diploma/diplomaCertificate: Certificate I to IVYear 12: Year 12 or equivalentYear 11: Year 11 or equivalent or belowNot stated: No data was provided for parental education at the time of student enrolment. The higher the percentage of missing data, the less informative are the results for the other categories.
Refer to the introduction for explanatory notes.
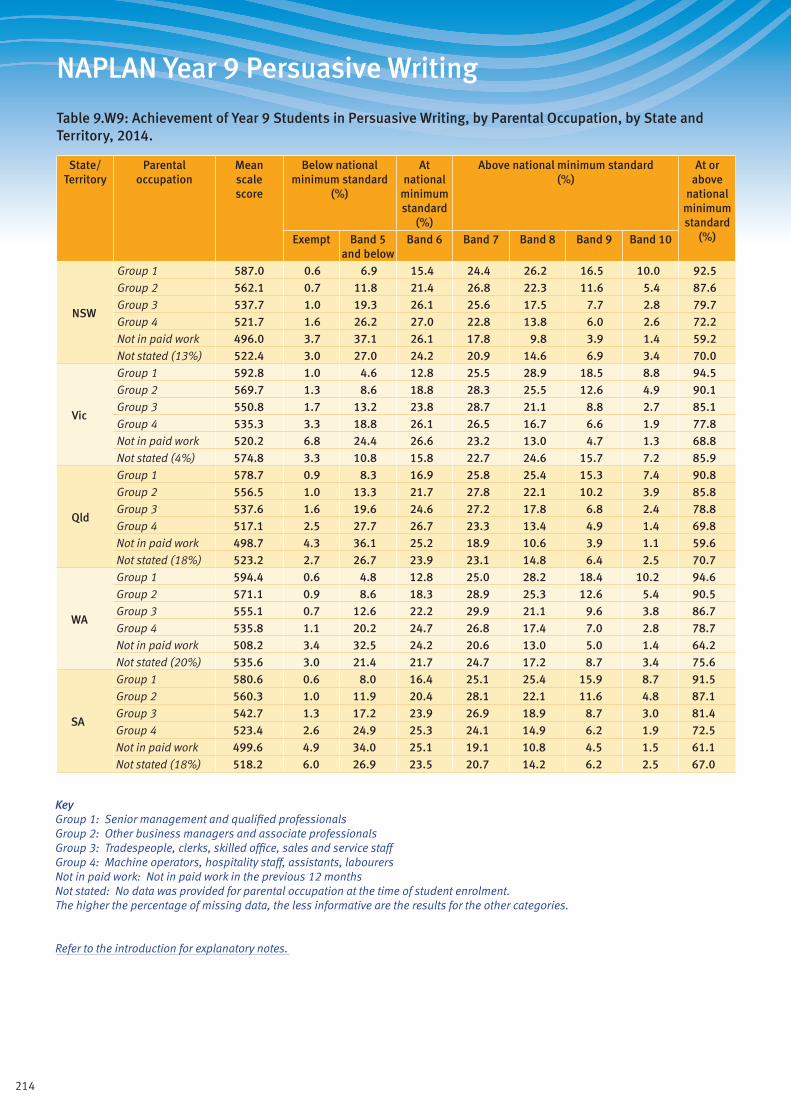
214
NAPLAN Year 9 Persuasive Writing
Table 9.W9: Achievement of Year 9 Students in Persuasive Writing, by Parental Occupation, by State and Territory, 2014.
State/ Territory
Parental occupation
Mean scale score
Below national minimum standard
(%)
At national
minimum standard
(%)
Above national minimum standard (%)
At or above
national minimum standard
(%)Exempt Band 5 and below
Band 6 Band 7 Band 8 Band 9 Band 10
NSW
Group 1 587.0 0.6 6.9 15.4 24.4 26.2 16.5 10.0 92.5Group 2 562.1 0.7 11.8 21.4 26.8 22.3 11.6 5.4 87.6Group 3 537.7 1.0 19.3 26.1 25.6 17.5 7.7 2.8 79.7Group 4 521.7 1.6 26.2 27.0 22.8 13.8 6.0 2.6 72.2Not in paid work 496.0 3.7 37.1 26.1 17.8 9.8 3.9 1.4 59.2Not stated (13%) 522.4 3.0 27.0 24.2 20.9 14.6 6.9 3.4 70.0
Vic
Group 1 592.8 1.0 4.6 12.8 25.5 28.9 18.5 8.8 94.5Group 2 569.7 1.3 8.6 18.8 28.3 25.5 12.6 4.9 90.1Group 3 550.8 1.7 13.2 23.8 28.7 21.1 8.8 2.7 85.1Group 4 535.3 3.3 18.8 26.1 26.5 16.7 6.6 1.9 77.8Not in paid work 520.2 6.8 24.4 26.6 23.2 13.0 4.7 1.3 68.8Not stated (4%) 574.8 3.3 10.8 15.8 22.7 24.6 15.7 7.2 85.9
Qld
Group 1 578.7 0.9 8.3 16.9 25.8 25.4 15.3 7.4 90.8Group 2 556.5 1.0 13.3 21.7 27.8 22.1 10.2 3.9 85.8Group 3 537.6 1.6 19.6 24.6 27.2 17.8 6.8 2.4 78.8Group 4 517.1 2.5 27.7 26.7 23.3 13.4 4.9 1.4 69.8Not in paid work 498.7 4.3 36.1 25.2 18.9 10.6 3.9 1.1 59.6Not stated (18%) 523.2 2.7 26.7 23.9 23.1 14.8 6.4 2.5 70.7
WA
Group 1 594.4 0.6 4.8 12.8 25.0 28.2 18.4 10.2 94.6Group 2 571.1 0.9 8.6 18.3 28.9 25.3 12.6 5.4 90.5Group 3 555.1 0.7 12.6 22.2 29.9 21.1 9.6 3.8 86.7Group 4 535.8 1.1 20.2 24.7 26.8 17.4 7.0 2.8 78.7Not in paid work 508.2 3.4 32.5 24.2 20.6 13.0 5.0 1.4 64.2Not stated (20%) 535.6 3.0 21.4 21.7 24.7 17.2 8.7 3.4 75.6
SA
Group 1 580.6 0.6 8.0 16.4 25.1 25.4 15.9 8.7 91.5Group 2 560.3 1.0 11.9 20.4 28.1 22.1 11.6 4.8 87.1Group 3 542.7 1.3 17.2 23.9 26.9 18.9 8.7 3.0 81.4Group 4 523.4 2.6 24.9 25.3 24.1 14.9 6.2 1.9 72.5Not in paid work 499.6 4.9 34.0 25.1 19.1 10.8 4.5 1.5 61.1Not stated (18%) 518.2 6.0 26.9 23.5 20.7 14.2 6.2 2.5 67.0
KeyGroup 1: Senior management and qualified professionalsGroup 2: Other business managers and associate professionalsGroup 3: Tradespeople, clerks, skilled office, sales and service staffGroup 4: Machine operators, hospitality staff, assistants, labourersNot in paid work: Not in paid work in the previous 12 monthsNot stated: No data was provided for parental occupation at the time of student enrolment. The higher the percentage of missing data, the less informative are the results for the other categories.
Refer to the introduction for explanatory notes.
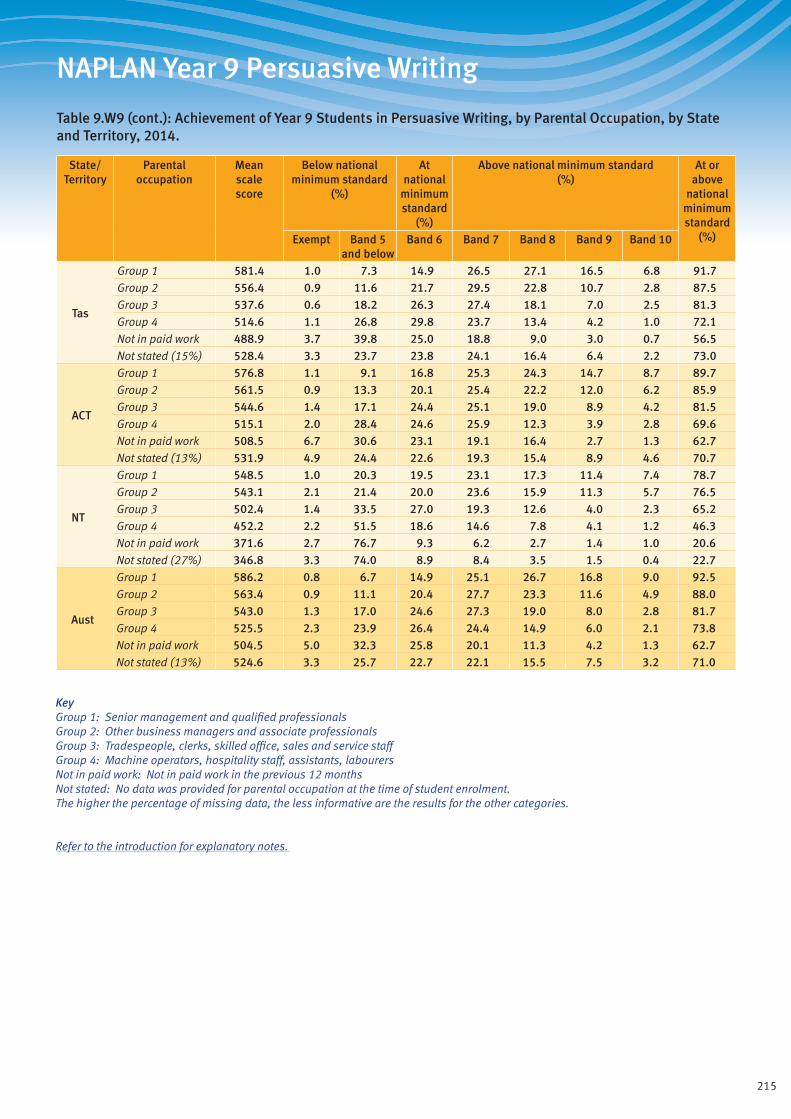
215
NAPLAN Year 9 Persuasive Writing
Table 9.W9 (cont.): Achievement of Year 9 Students in Persuasive Writing, by Parental Occupation, by State and Territory, 2014.
State/ Territory
Parental occupation
Mean scale score
Below national minimum standard
(%)
At national
minimum standard
(%)
Above national minimum standard (%)
At or above
national minimum standard
(%)Exempt Band 5 and below
Band 6 Band 7 Band 8 Band 9 Band 10
Tas
Group 1 581.4 1.0 7.3 14.9 26.5 27.1 16.5 6.8 91.7Group 2 556.4 0.9 11.6 21.7 29.5 22.8 10.7 2.8 87.5Group 3 537.6 0.6 18.2 26.3 27.4 18.1 7.0 2.5 81.3Group 4 514.6 1.1 26.8 29.8 23.7 13.4 4.2 1.0 72.1Not in paid work 488.9 3.7 39.8 25.0 18.8 9.0 3.0 0.7 56.5Not stated (15%) 528.4 3.3 23.7 23.8 24.1 16.4 6.4 2.2 73.0
ACT
Group 1 576.8 1.1 9.1 16.8 25.3 24.3 14.7 8.7 89.7Group 2 561.5 0.9 13.3 20.1 25.4 22.2 12.0 6.2 85.9Group 3 544.6 1.4 17.1 24.4 25.1 19.0 8.9 4.2 81.5Group 4 515.1 2.0 28.4 24.6 25.9 12.3 3.9 2.8 69.6Not in paid work 508.5 6.7 30.6 23.1 19.1 16.4 2.7 1.3 62.7Not stated (13%) 531.9 4.9 24.4 22.6 19.3 15.4 8.9 4.6 70.7
NT
Group 1 548.5 1.0 20.3 19.5 23.1 17.3 11.4 7.4 78.7Group 2 543.1 2.1 21.4 20.0 23.6 15.9 11.3 5.7 76.5Group 3 502.4 1.4 33.5 27.0 19.3 12.6 4.0 2.3 65.2Group 4 452.2 2.2 51.5 18.6 14.6 7.8 4.1 1.2 46.3Not in paid work 371.6 2.7 76.7 9.3 6.2 2.7 1.4 1.0 20.6Not stated (27%) 346.8 3.3 74.0 8.9 8.4 3.5 1.5 0.4 22.7
Aust
Group 1 586.2 0.8 6.7 14.9 25.1 26.7 16.8 9.0 92.5Group 2 563.4 0.9 11.1 20.4 27.7 23.3 11.6 4.9 88.0Group 3 543.0 1.3 17.0 24.6 27.3 19.0 8.0 2.8 81.7Group 4 525.5 2.3 23.9 26.4 24.4 14.9 6.0 2.1 73.8Not in paid work 504.5 5.0 32.3 25.8 20.1 11.3 4.2 1.3 62.7Not stated (13%) 524.6 3.3 25.7 22.7 22.1 15.5 7.5 3.2 71.0
KeyGroup 1: Senior management and qualified professionalsGroup 2: Other business managers and associate professionalsGroup 3: Tradespeople, clerks, skilled office, sales and service staffGroup 4: Machine operators, hospitality staff, assistants, labourersNot in paid work: Not in paid work in the previous 12 monthsNot stated: No data was provided for parental occupation at the time of student enrolment. The higher the percentage of missing data, the less informative are the results for the other categories.
Refer to the introduction for explanatory notes.
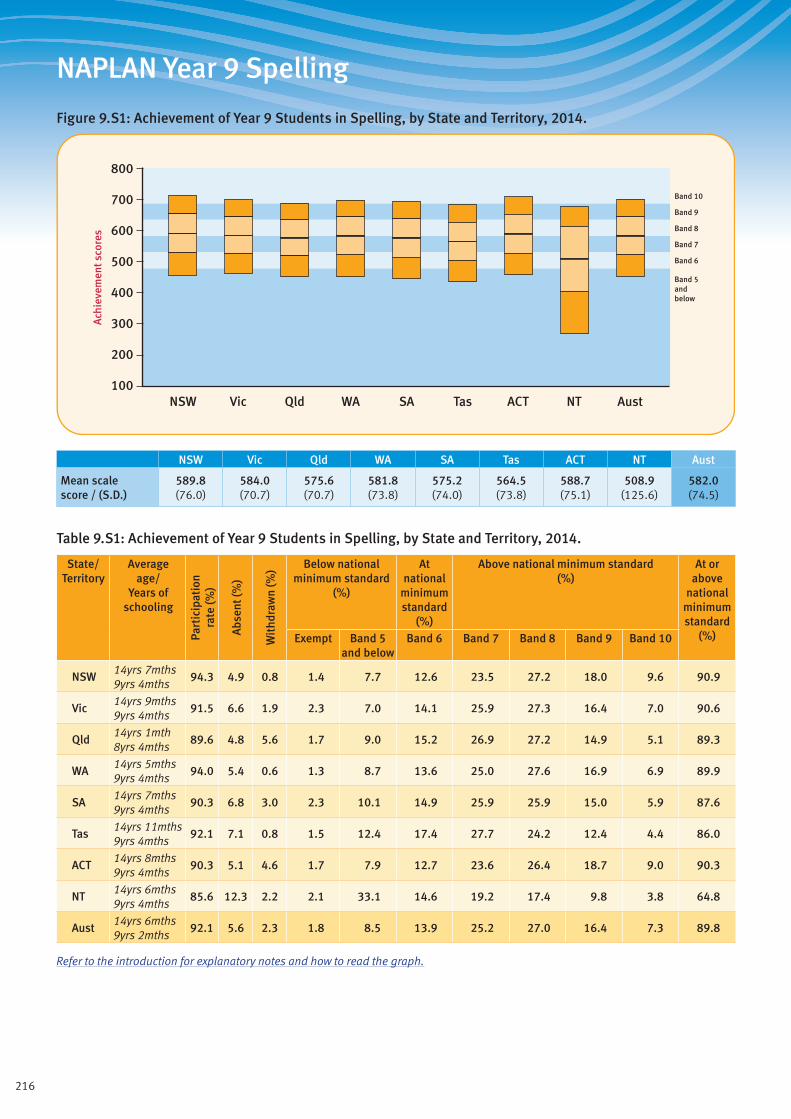
216
NAPLAN Year 9 Spelling
Figure 9.S1: Achievement of Year 9 Students in Spelling, by State and Territory, 2014.
Band 5andbelow
Band 6
Band 7
Band 8
Band 9
Band 10
800
700
500
600
400
300
100
200
Ach
ieve
men
t sco
res
ACTQld SAWA TasVicNSW NT Aust
NSW Vic Qld WA SA Tas ACT NT Aust
Mean scale score / (S.D.)
589.8 (76.0)
584.0 (70.7)
575.6 (70.7)
581.8 (73.8)
575.2 (74.0)
564.5 (73.8)
588.7 (75.1)
508.9 (125.6)
582.0 (74.5)
Table 9.S1: Achievement of Year 9 Students in Spelling, by State and Territory, 2014.
State/ Territory
Average age/
Years of schooling
Part
icip
atio
nra
te (%
)
Abs
ent (
%)
Wit
hdra
wn
(%) Below national
minimum standard (%)
At national
minimum standard
(%)
Above national minimum standard (%)
At or above
national minimum standard
(%)Exempt Band 5 and below
Band 6 Band 7 Band 8 Band 9 Band 10
NSW14yrs 7mths 9yrs 4mths
94.3 4.9 0.8 1.4 7.7 12.6 23.5 27.2 18.0 9.6 90.9
Vic14yrs 9mths 9yrs 4mths
91.5 6.6 1.9 2.3 7.0 14.1 25.9 27.3 16.4 7.0 90.6
Qld14yrs 1mth 8yrs 4mths
89.6 4.8 5.6 1.7 9.0 15.2 26.9 27.2 14.9 5.1 89.3
WA14yrs 5mths 9yrs 4mths
94.0 5.4 0.6 1.3 8.7 13.6 25.0 27.6 16.9 6.9 89.9
SA14yrs 7mths 9yrs 4mths
90.3 6.8 3.0 2.3 10.1 14.9 25.9 25.9 15.0 5.9 87.6
Tas14yrs 11mths 9yrs 4mths
92.1 7.1 0.8 1.5 12.4 17.4 27.7 24.2 12.4 4.4 86.0
ACT14yrs 8mths 9yrs 4mths
90.3 5.1 4.6 1.7 7.9 12.7 23.6 26.4 18.7 9.0 90.3
NT14yrs 6mths 9yrs 4mths
85.6 12.3 2.2 2.1 33.1 14.6 19.2 17.4 9.8 3.8 64.8
Aust14yrs 6mths 9yrs 2mths
92.1 5.6 2.3 1.8 8.5 13.9 25.2 27.0 16.4 7.3 89.8
Refer to the introduction for explanatory notes and how to read the graph.
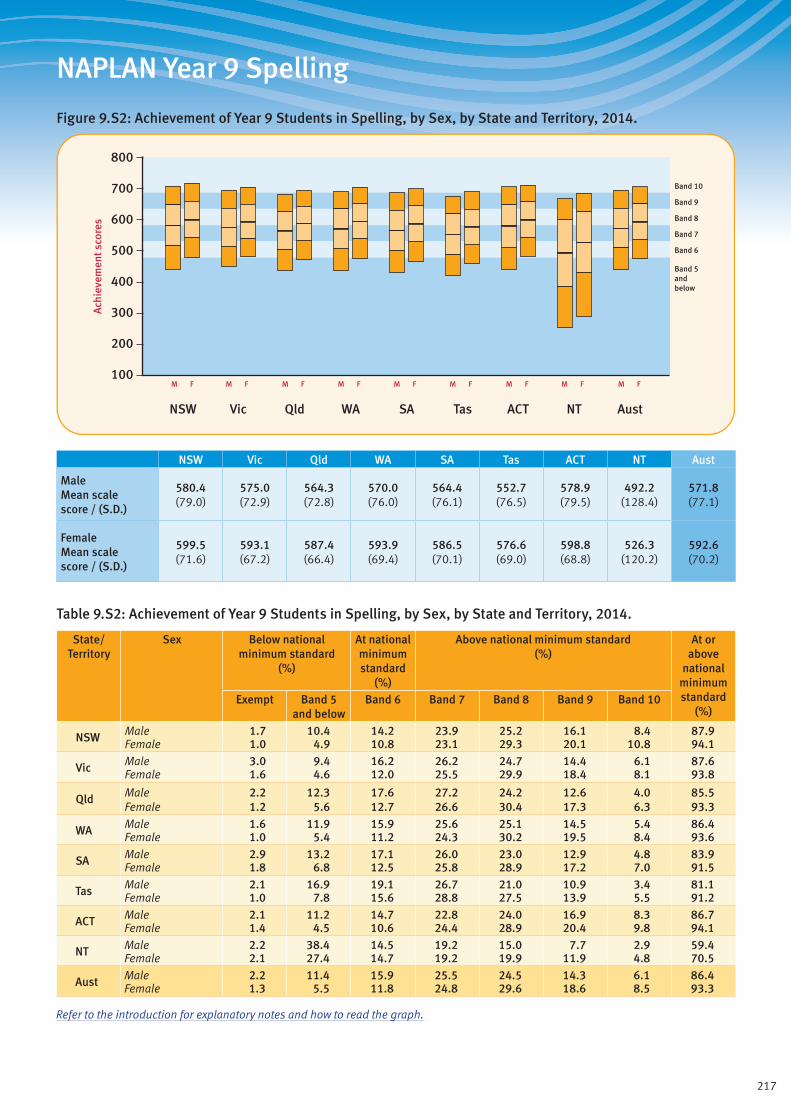
217
NAPLAN Year 9 Spelling
Figure 9.S2: Achievement of Year 9 Students in Spelling, by Sex, by State and Territory, 2014.
Band 5andbelow
Band 6
Band 7
Band 8
Band 9
Band 10
ACTQld SAWA TasVicNSW NT Aust
M F M F M F M F M F M F M F M F M F
800
700
500
600
400
300
100
200
Ach
ieve
men
t sco
res
NSW Vic Qld WA SA Tas ACT NT Aust
Male Mean scale score / (S.D.)
580.4 (79.0)
575.0 (72.9)
564.3 (72.8)
570.0 (76.0)
564.4 (76.1)
552.7 (76.5)
578.9 (79.5)
492.2 (128.4)
571.8 (77.1)
Female Mean scale score / (S.D.)
599.5 (71.6)
593.1 (67.2)
587.4 (66.4)
593.9 (69.4)
586.5 (70.1)
576.6 (69.0)
598.8 (68.8)
526.3 (120.2)
592.6 (70.2)
Table 9.S2: Achievement of Year 9 Students in Spelling, by Sex, by State and Territory, 2014.
State/ Territory
Sex Below national minimum standard
(%)
At national minimum standard
(%)
Above national minimum standard (%)
At or above
national minimum standard
(%)Exempt Band 5
and belowBand 6 Band 7 Band 8 Band 9 Band 10
NSW Male 1.7 10.4 14.2 23.9 25.2 16.1 8.4 87.9Female 1.0 4.9 10.8 23.1 29.3 20.1 10.8 94.1
Vic Male 3.0 9.4 16.2 26.2 24.7 14.4 6.1 87.6Female 1.6 4.6 12.0 25.5 29.9 18.4 8.1 93.8
Qld Male 2.2 12.3 17.6 27.2 24.2 12.6 4.0 85.5Female 1.2 5.6 12.7 26.6 30.4 17.3 6.3 93.3
WA Male 1.6 11.9 15.9 25.6 25.1 14.5 5.4 86.4Female 1.0 5.4 11.2 24.3 30.2 19.5 8.4 93.6
SA Male 2.9 13.2 17.1 26.0 23.0 12.9 4.8 83.9Female 1.8 6.8 12.5 25.8 28.9 17.2 7.0 91.5
Tas Male 2.1 16.9 19.1 26.7 21.0 10.9 3.4 81.1Female 1.0 7.8 15.6 28.8 27.5 13.9 5.5 91.2
ACT Male 2.1 11.2 14.7 22.8 24.0 16.9 8.3 86.7Female 1.4 4.5 10.6 24.4 28.9 20.4 9.8 94.1
NT Male 2.2 38.4 14.5 19.2 15.0 7.7 2.9 59.4Female 2.1 27.4 14.7 19.2 19.9 11.9 4.8 70.5
Aust Male 2.2 11.4 15.9 25.5 24.5 14.3 6.1 86.4Female 1.3 5.5 11.8 24.8 29.6 18.6 8.5 93.3
Refer to the introduction for explanatory notes and how to read the graph.

218
NAPLAN Year 9 Spelling
Figure 9.S3: Achievement of Year 9 Students in Spelling, by Indigenous Status, by State and Territory, 2014.
Band 5andbelow
Band 6
Band 7
Band 8
Band 9
Band 10
ACTQld SAWA TasVicNSW NT Aust
800
700
500
600
400
300
100
200
Ach
ieve
men
t sco
res
Indig. Non-Indig.
Indig. Non-Indig.
Indig. Non-Indig.
Indig. Non-Indig.
Indig. Non-Indig.
Indig. Non-Indig.
Indig. Non-Indig.
Indig. Non-Indig.
Indig. Non-Indig.
NSW Vic Qld WA SA Tas ACT NT Aust
Indigenous Mean scale score / (S.D.)
532.8 (74.8)
535.6 (66.6)
534.9 (73.9)
512.1 (81.4)
518.5 (77.1)
534.7 (73.6)
528.9 (71.5)
410.8 (124.3)
520.5 (86.4)
Non-Indigenous Mean scale score / (S.D.)
593.1 (74.8)
584.7 (70.5)
578.6 (69.4)
586.9 (70.7)
577.8 (72.8)
566.3 (72.3)
590.9 (74.4)
568.5 (75.9)
585.4 (72.3)
Table 9.S3: Achievement of Year 9 Students in Spelling, by Indigenous Status, by State and Territory, 2014.
State/ Territory
Indigenous status
Below national minimum standard
(%)
At national minimum standard
(%)
Above national minimum standard (%)
At or above
national minimum standard
(%)Exempt Band 5
and belowBand 6 Band 7 Band 8 Band 9 Band 10
NSW Indigenous 2.4 23.0 22.5 25.9 18.2 6.8 1.2 74.7Non-Indigenous 1.3 6.8 12.0 23.4 27.7 18.7 10.1 91.9
Vic Indigenous 4.7 18.7 25.2 28.2 16.6 5.6 1.0 76.6Non-Indigenous 2.3 6.8 13.9 25.8 27.4 16.5 7.2 90.9
Qld Indigenous 3.1 21.4 22.3 26.6 18.8 6.5 1.3 75.5Non-Indigenous 1.6 8.1 14.6 26.9 27.9 15.5 5.4 90.3
WA Indigenous 1.4 32.7 23.0 22.9 14.4 4.9 0.8 65.9Non-Indigenous 1.1 7.0 12.9 25.1 28.6 17.9 7.4 91.9
SA Indigenous 3.2 28.7 23.4 24.6 14.1 4.7 1.2 68.1Non-Indigenous 2.3 9.2 14.5 26.0 26.5 15.4 6.1 88.5
Tas Indigenous 2.4 21.9 22.0 29.6 15.7 6.7 1.7 75.7Non-Indigenous 1.3 11.5 17.1 27.8 25.2 12.7 4.3 87.1
ACT Indigenous 2.3 23.4 22.8 28.8 17.1 5.2 0.5 74.3Non-Indigenous 1.8 7.4 12.2 23.5 26.7 19.1 9.3 90.9
NT Indigenous 2.3 66.7 12.4 10.1 6.4 1.7 0.4 30.9Non-Indigenous 2.2 11.9 16.7 25.5 24.3 14.2 5.3 85.9
Aust Indigenous 2.7 27.2 22.0 24.7 16.5 5.8 1.1 70.2Non-Indigenous 1.7 7.4 13.5 25.2 27.6 17.0 7.6 90.9
Refer to the introduction for explanatory notes and how to read the graph.
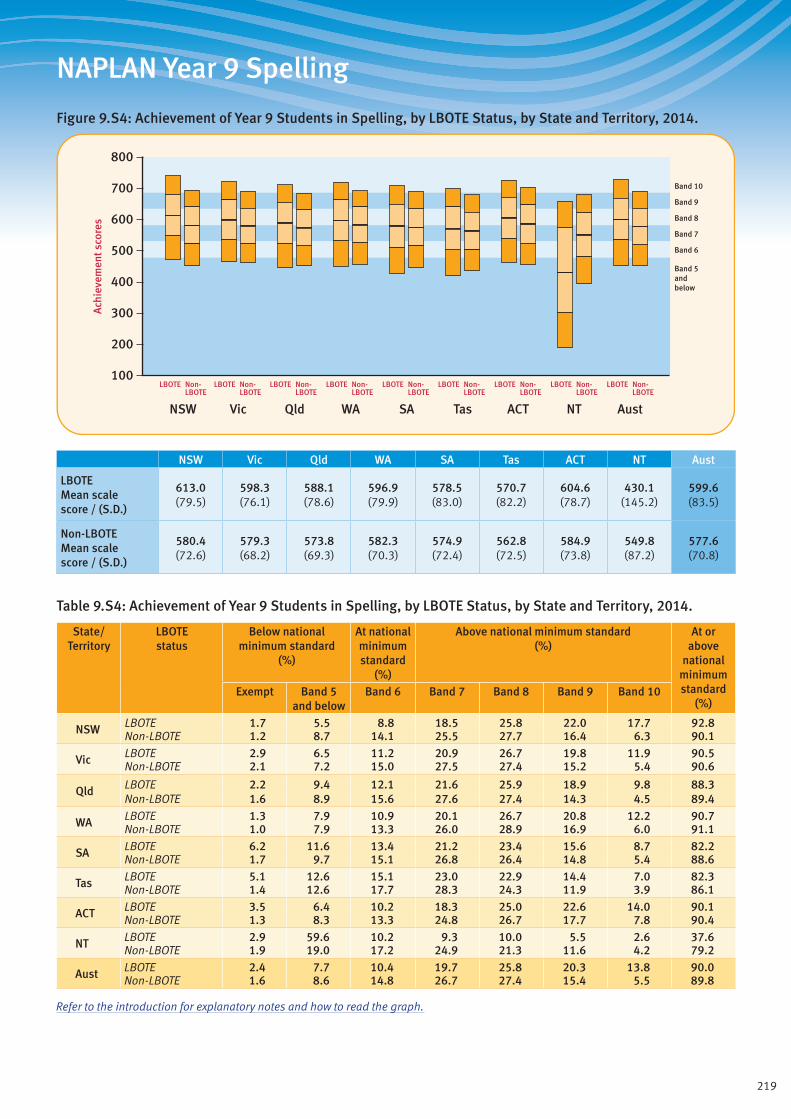
219
NAPLAN Year 9 Spelling
Figure 9.S4: Achievement of Year 9 Students in Spelling, by LBOTE Status, by State and Territory, 2014.
Band 5andbelow
Band 6
Band 7
Band 8
Band 9
Band 10
ACTQld SAWA TasVicNSW NT Aust
800
700
500
600
400
300
100
200
Ach
ieve
men
t sco
res
LBOTE Non-LBOTE
LBOTE Non-LBOTE
LBOTE Non-LBOTE
LBOTE Non-LBOTE
LBOTE Non-LBOTE
LBOTE Non-LBOTE
LBOTE Non-LBOTE
LBOTE Non-LBOTE
LBOTE Non-LBOTE
NSW Vic Qld WA SA Tas ACT NT Aust
LBOTE Mean scale score / (S.D.)
613.0 (79.5)
598.3 (76.1)
588.1 (78.6)
596.9 (79.9)
578.5 (83.0)
570.7 (82.2)
604.6 (78.7)
430.1 (145.2)
599.6 (83.5)
Non-LBOTE Mean scale score / (S.D.)
580.4 (72.6)
579.3 (68.2)
573.8 (69.3)
582.3 (70.3)
574.9 (72.4)
562.8 (72.5)
584.9 (73.8)
549.8 (87.2)
577.6 (70.8)
Table 9.S4: Achievement of Year 9 Students in Spelling, by LBOTE Status, by State and Territory, 2014.
State/ Territory
LBOTE status
Below national minimum standard
(%)
At national minimum standard
(%)
Above national minimum standard (%)
At or above
national minimum standard
(%)Exempt Band 5
and belowBand 6 Band 7 Band 8 Band 9 Band 10
NSW LBOTE 1.7 5.5 8.8 18.5 25.8 22.0 17.7 92.8Non-LBOTE 1.2 8.7 14.1 25.5 27.7 16.4 6.3 90.1
Vic LBOTE 2.9 6.5 11.2 20.9 26.7 19.8 11.9 90.5Non-LBOTE 2.1 7.2 15.0 27.5 27.4 15.2 5.4 90.6
Qld LBOTE 2.2 9.4 12.1 21.6 25.9 18.9 9.8 88.3Non-LBOTE 1.6 8.9 15.6 27.6 27.4 14.3 4.5 89.4
WA LBOTE 1.3 7.9 10.9 20.1 26.7 20.8 12.2 90.7Non-LBOTE 1.0 7.9 13.3 26.0 28.9 16.9 6.0 91.1
SA LBOTE 6.2 11.6 13.4 21.2 23.4 15.6 8.7 82.2Non-LBOTE 1.7 9.7 15.1 26.8 26.4 14.8 5.4 88.6
Tas LBOTE 5.1 12.6 15.1 23.0 22.9 14.4 7.0 82.3Non-LBOTE 1.4 12.6 17.7 28.3 24.3 11.9 3.9 86.1
ACT LBOTE 3.5 6.4 10.2 18.3 25.0 22.6 14.0 90.1Non-LBOTE 1.3 8.3 13.3 24.8 26.7 17.7 7.8 90.4
NT LBOTE 2.9 59.6 10.2 9.3 10.0 5.5 2.6 37.6Non-LBOTE 1.9 19.0 17.2 24.9 21.3 11.6 4.2 79.2
Aust LBOTE 2.4 7.7 10.4 19.7 25.8 20.3 13.8 90.0Non-LBOTE 1.6 8.6 14.8 26.7 27.4 15.4 5.5 89.8
Refer to the introduction for explanatory notes and how to read the graph.
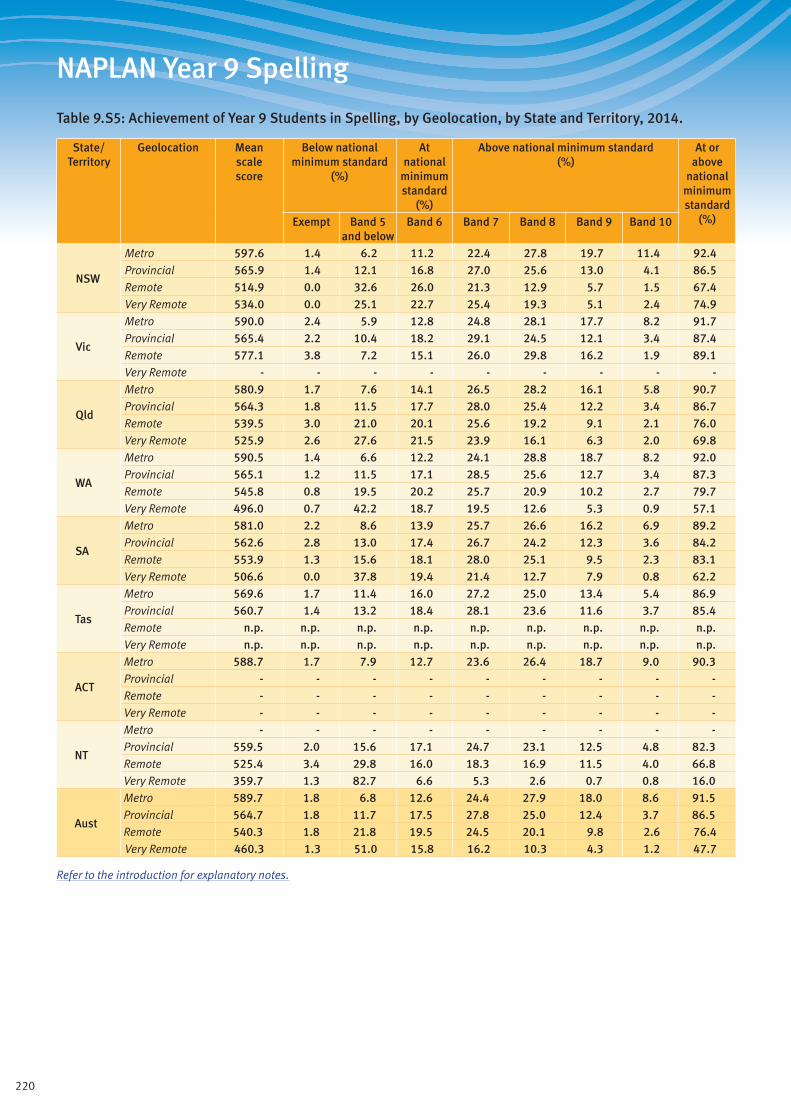
220
NAPLAN Year 9 Spelling
Table 9.S5: Achievement of Year 9 Students in Spelling, by Geolocation, by State and Territory, 2014.
State/ Territory
Geolocation Mean scale score
Below national minimum standard
(%)
At national
minimum standard
(%)
Above national minimum standard (%)
At or above
national minimum standard
(%)Exempt Band 5 and below
Band 6 Band 7 Band 8 Band 9 Band 10
NSW
Metro 597.6 1.4 6.2 11.2 22.4 27.8 19.7 11.4 92.4Provincial 565.9 1.4 12.1 16.8 27.0 25.6 13.0 4.1 86.5Remote 514.9 0.0 32.6 26.0 21.3 12.9 5.7 1.5 67.4Very Remote 534.0 0.0 25.1 22.7 25.4 19.3 5.1 2.4 74.9
Vic
Metro 590.0 2.4 5.9 12.8 24.8 28.1 17.7 8.2 91.7Provincial 565.4 2.2 10.4 18.2 29.1 24.5 12.1 3.4 87.4Remote 577.1 3.8 7.2 15.1 26.0 29.8 16.2 1.9 89.1Very Remote - - - - - - - - -
Qld
Metro 580.9 1.7 7.6 14.1 26.5 28.2 16.1 5.8 90.7Provincial 564.3 1.8 11.5 17.7 28.0 25.4 12.2 3.4 86.7Remote 539.5 3.0 21.0 20.1 25.6 19.2 9.1 2.1 76.0Very Remote 525.9 2.6 27.6 21.5 23.9 16.1 6.3 2.0 69.8
WA
Metro 590.5 1.4 6.6 12.2 24.1 28.8 18.7 8.2 92.0Provincial 565.1 1.2 11.5 17.1 28.5 25.6 12.7 3.4 87.3Remote 545.8 0.8 19.5 20.2 25.7 20.9 10.2 2.7 79.7Very Remote 496.0 0.7 42.2 18.7 19.5 12.6 5.3 0.9 57.1
SA
Metro 581.0 2.2 8.6 13.9 25.7 26.6 16.2 6.9 89.2Provincial 562.6 2.8 13.0 17.4 26.7 24.2 12.3 3.6 84.2Remote 553.9 1.3 15.6 18.1 28.0 25.1 9.5 2.3 83.1Very Remote 506.6 0.0 37.8 19.4 21.4 12.7 7.9 0.8 62.2
Tas
Metro 569.6 1.7 11.4 16.0 27.2 25.0 13.4 5.4 86.9Provincial 560.7 1.4 13.2 18.4 28.1 23.6 11.6 3.7 85.4Remote n.p. n.p. n.p. n.p. n.p. n.p. n.p. n.p. n.p.Very Remote n.p. n.p. n.p. n.p. n.p. n.p. n.p. n.p. n.p.
ACT
Metro 588.7 1.7 7.9 12.7 23.6 26.4 18.7 9.0 90.3Provincial - - - - - - - - -Remote - - - - - - - - -Very Remote - - - - - - - - -
NT
Metro - - - - - - - - -Provincial 559.5 2.0 15.6 17.1 24.7 23.1 12.5 4.8 82.3Remote 525.4 3.4 29.8 16.0 18.3 16.9 11.5 4.0 66.8Very Remote 359.7 1.3 82.7 6.6 5.3 2.6 0.7 0.8 16.0
Aust
Metro 589.7 1.8 6.8 12.6 24.4 27.9 18.0 8.6 91.5Provincial 564.7 1.8 11.7 17.5 27.8 25.0 12.4 3.7 86.5Remote 540.3 1.8 21.8 19.5 24.5 20.1 9.8 2.6 76.4Very Remote 460.3 1.3 51.0 15.8 16.2 10.3 4.3 1.2 47.7
Refer to the introduction for explanatory notes.
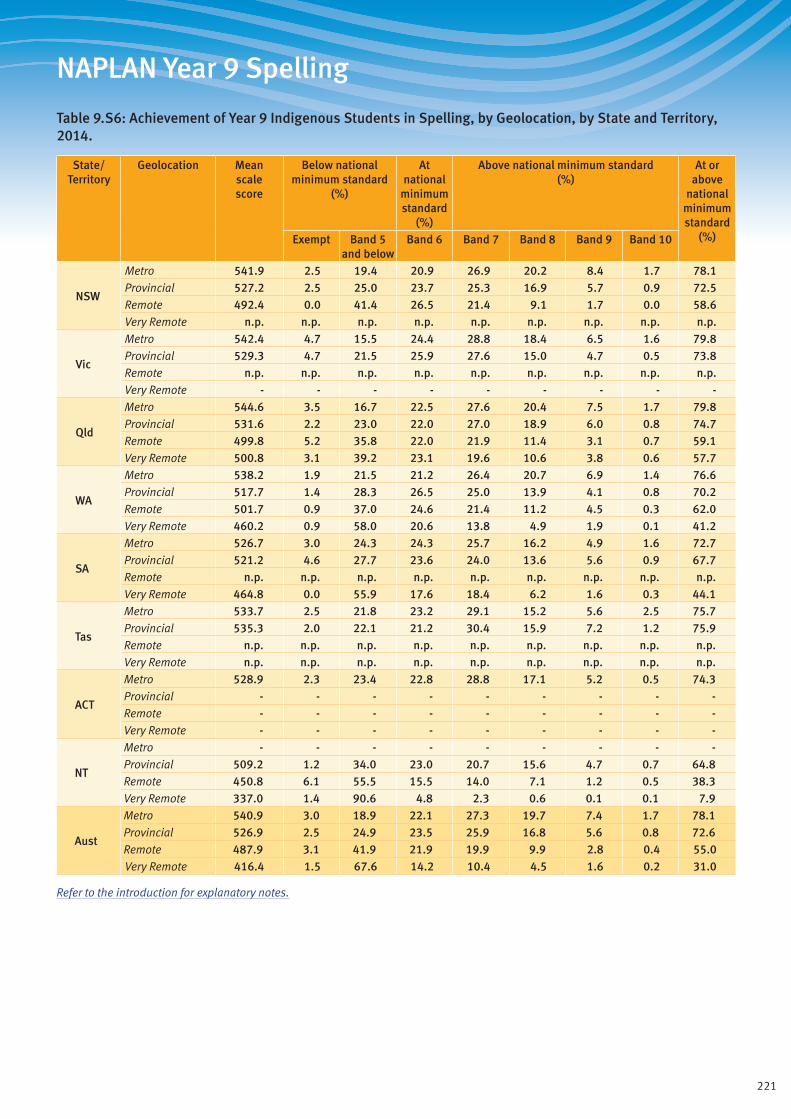
221
NAPLAN Year 9 Spelling
Table 9.S6: Achievement of Year 9 Indigenous Students in Spelling, by Geolocation, by State and Territory, 2014.
State/ Territory
Geolocation Mean scale score
Below national minimum standard
(%)
At national
minimum standard
(%)
Above national minimum standard (%)
At or above
national minimum standard
(%)Exempt Band 5 and below
Band 6 Band 7 Band 8 Band 9 Band 10
NSW
Metro 541.9 2.5 19.4 20.9 26.9 20.2 8.4 1.7 78.1Provincial 527.2 2.5 25.0 23.7 25.3 16.9 5.7 0.9 72.5Remote 492.4 0.0 41.4 26.5 21.4 9.1 1.7 0.0 58.6Very Remote n.p. n.p. n.p. n.p. n.p. n.p. n.p. n.p. n.p.
Vic
Metro 542.4 4.7 15.5 24.4 28.8 18.4 6.5 1.6 79.8Provincial 529.3 4.7 21.5 25.9 27.6 15.0 4.7 0.5 73.8Remote n.p. n.p. n.p. n.p. n.p. n.p. n.p. n.p. n.p.Very Remote - - - - - - - - -
Qld
Metro 544.6 3.5 16.7 22.5 27.6 20.4 7.5 1.7 79.8Provincial 531.6 2.2 23.0 22.0 27.0 18.9 6.0 0.8 74.7Remote 499.8 5.2 35.8 22.0 21.9 11.4 3.1 0.7 59.1Very Remote 500.8 3.1 39.2 23.1 19.6 10.6 3.8 0.6 57.7
WA
Metro 538.2 1.9 21.5 21.2 26.4 20.7 6.9 1.4 76.6Provincial 517.7 1.4 28.3 26.5 25.0 13.9 4.1 0.8 70.2Remote 501.7 0.9 37.0 24.6 21.4 11.2 4.5 0.3 62.0Very Remote 460.2 0.9 58.0 20.6 13.8 4.9 1.9 0.1 41.2
SA
Metro 526.7 3.0 24.3 24.3 25.7 16.2 4.9 1.6 72.7Provincial 521.2 4.6 27.7 23.6 24.0 13.6 5.6 0.9 67.7Remote n.p. n.p. n.p. n.p. n.p. n.p. n.p. n.p. n.p.Very Remote 464.8 0.0 55.9 17.6 18.4 6.2 1.6 0.3 44.1
Tas
Metro 533.7 2.5 21.8 23.2 29.1 15.2 5.6 2.5 75.7Provincial 535.3 2.0 22.1 21.2 30.4 15.9 7.2 1.2 75.9Remote n.p. n.p. n.p. n.p. n.p. n.p. n.p. n.p. n.p.Very Remote n.p. n.p. n.p. n.p. n.p. n.p. n.p. n.p. n.p.
ACT
Metro 528.9 2.3 23.4 22.8 28.8 17.1 5.2 0.5 74.3Provincial - - - - - - - - -Remote - - - - - - - - -Very Remote - - - - - - - - -
NT
Metro - - - - - - - - -Provincial 509.2 1.2 34.0 23.0 20.7 15.6 4.7 0.7 64.8Remote 450.8 6.1 55.5 15.5 14.0 7.1 1.2 0.5 38.3Very Remote 337.0 1.4 90.6 4.8 2.3 0.6 0.1 0.1 7.9
Aust
Metro 540.9 3.0 18.9 22.1 27.3 19.7 7.4 1.7 78.1Provincial 526.9 2.5 24.9 23.5 25.9 16.8 5.6 0.8 72.6Remote 487.9 3.1 41.9 21.9 19.9 9.9 2.8 0.4 55.0Very Remote 416.4 1.5 67.6 14.2 10.4 4.5 1.6 0.2 31.0
Refer to the introduction for explanatory notes.
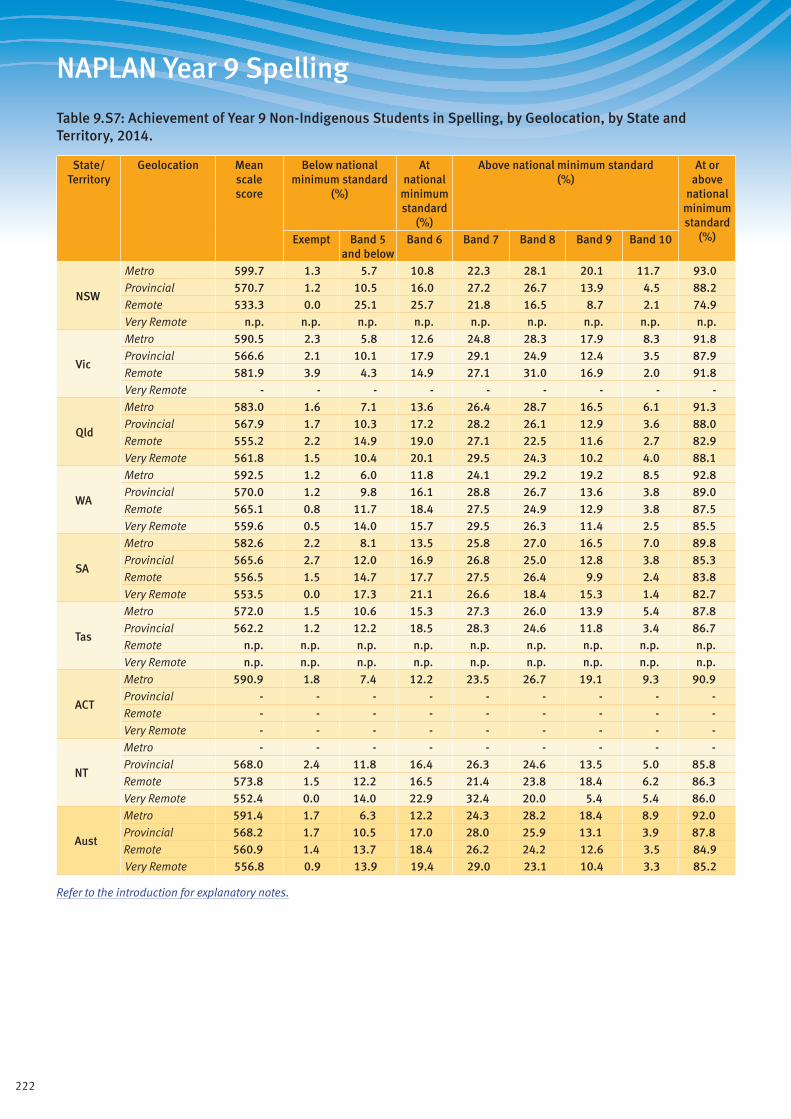
222
NAPLAN Year 9 Spelling
Table 9.S7: Achievement of Year 9 Non-Indigenous Students in Spelling, by Geolocation, by State and Territory, 2014.
State/ Territory
Geolocation Mean scale score
Below national minimum standard
(%)
At national
minimum standard
(%)
Above national minimum standard (%)
At or above
national minimum standard
(%)Exempt Band 5 and below
Band 6 Band 7 Band 8 Band 9 Band 10
NSW
Metro 599.7 1.3 5.7 10.8 22.3 28.1 20.1 11.7 93.0Provincial 570.7 1.2 10.5 16.0 27.2 26.7 13.9 4.5 88.2Remote 533.3 0.0 25.1 25.7 21.8 16.5 8.7 2.1 74.9Very Remote n.p. n.p. n.p. n.p. n.p. n.p. n.p. n.p. n.p.
Vic
Metro 590.5 2.3 5.8 12.6 24.8 28.3 17.9 8.3 91.8Provincial 566.6 2.1 10.1 17.9 29.1 24.9 12.4 3.5 87.9Remote 581.9 3.9 4.3 14.9 27.1 31.0 16.9 2.0 91.8Very Remote - - - - - - - - -
Qld
Metro 583.0 1.6 7.1 13.6 26.4 28.7 16.5 6.1 91.3Provincial 567.9 1.7 10.3 17.2 28.2 26.1 12.9 3.6 88.0Remote 555.2 2.2 14.9 19.0 27.1 22.5 11.6 2.7 82.9Very Remote 561.8 1.5 10.4 20.1 29.5 24.3 10.2 4.0 88.1
WA
Metro 592.5 1.2 6.0 11.8 24.1 29.2 19.2 8.5 92.8Provincial 570.0 1.2 9.8 16.1 28.8 26.7 13.6 3.8 89.0Remote 565.1 0.8 11.7 18.4 27.5 24.9 12.9 3.8 87.5Very Remote 559.6 0.5 14.0 15.7 29.5 26.3 11.4 2.5 85.5
SA
Metro 582.6 2.2 8.1 13.5 25.8 27.0 16.5 7.0 89.8Provincial 565.6 2.7 12.0 16.9 26.8 25.0 12.8 3.8 85.3Remote 556.5 1.5 14.7 17.7 27.5 26.4 9.9 2.4 83.8Very Remote 553.5 0.0 17.3 21.1 26.6 18.4 15.3 1.4 82.7
Tas
Metro 572.0 1.5 10.6 15.3 27.3 26.0 13.9 5.4 87.8Provincial 562.2 1.2 12.2 18.5 28.3 24.6 11.8 3.4 86.7Remote n.p. n.p. n.p. n.p. n.p. n.p. n.p. n.p. n.p.Very Remote n.p. n.p. n.p. n.p. n.p. n.p. n.p. n.p. n.p.
ACT
Metro 590.9 1.8 7.4 12.2 23.5 26.7 19.1 9.3 90.9Provincial - - - - - - - - -Remote - - - - - - - - -Very Remote - - - - - - - - -
NT
Metro - - - - - - - - -Provincial 568.0 2.4 11.8 16.4 26.3 24.6 13.5 5.0 85.8Remote 573.8 1.5 12.2 16.5 21.4 23.8 18.4 6.2 86.3Very Remote 552.4 0.0 14.0 22.9 32.4 20.0 5.4 5.4 86.0
Aust
Metro 591.4 1.7 6.3 12.2 24.3 28.2 18.4 8.9 92.0Provincial 568.2 1.7 10.5 17.0 28.0 25.9 13.1 3.9 87.8Remote 560.9 1.4 13.7 18.4 26.2 24.2 12.6 3.5 84.9Very Remote 556.8 0.9 13.9 19.4 29.0 23.1 10.4 3.3 85.2
Refer to the introduction for explanatory notes.
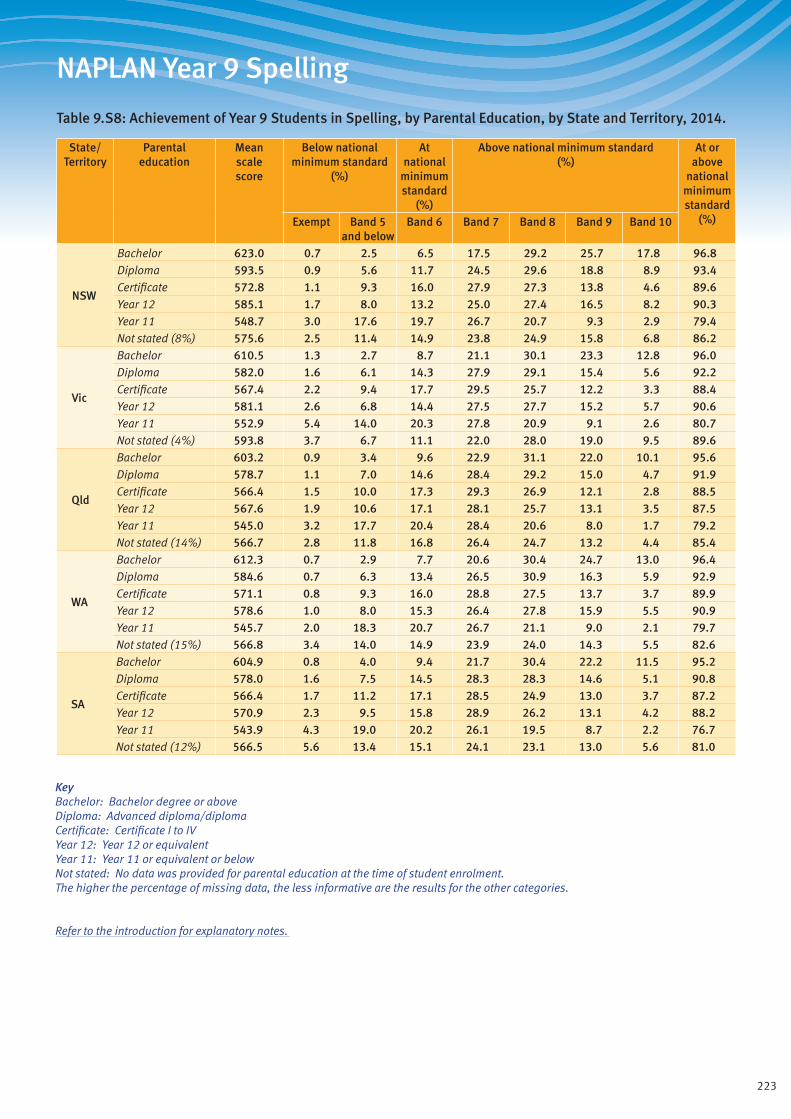
223
NAPLAN Year 9 Spelling
Table 9.S8: Achievement of Year 9 Students in Spelling, by Parental Education, by State and Territory, 2014.
State/ Territory
Parental education
Mean scale score
Below national minimum standard
(%)
At national
minimum standard
(%)
Above national minimum standard (%)
At or above
national minimum standard
(%)Exempt Band 5 and below
Band 6 Band 7 Band 8 Band 9 Band 10
NSW
Bachelor 623.0 0.7 2.5 6.5 17.5 29.2 25.7 17.8 96.8Diploma 593.5 0.9 5.6 11.7 24.5 29.6 18.8 8.9 93.4Certificate 572.8 1.1 9.3 16.0 27.9 27.3 13.8 4.6 89.6Year 12 585.1 1.7 8.0 13.2 25.0 27.4 16.5 8.2 90.3Year 11 548.7 3.0 17.6 19.7 26.7 20.7 9.3 2.9 79.4Not stated (8%) 575.6 2.5 11.4 14.9 23.8 24.9 15.8 6.8 86.2
Vic
Bachelor 610.5 1.3 2.7 8.7 21.1 30.1 23.3 12.8 96.0Diploma 582.0 1.6 6.1 14.3 27.9 29.1 15.4 5.6 92.2Certificate 567.4 2.2 9.4 17.7 29.5 25.7 12.2 3.3 88.4Year 12 581.1 2.6 6.8 14.4 27.5 27.7 15.2 5.7 90.6Year 11 552.9 5.4 14.0 20.3 27.8 20.9 9.1 2.6 80.7Not stated (4%) 593.8 3.7 6.7 11.1 22.0 28.0 19.0 9.5 89.6
Qld
Bachelor 603.2 0.9 3.4 9.6 22.9 31.1 22.0 10.1 95.6Diploma 578.7 1.1 7.0 14.6 28.4 29.2 15.0 4.7 91.9Certificate 566.4 1.5 10.0 17.3 29.3 26.9 12.1 2.8 88.5Year 12 567.6 1.9 10.6 17.1 28.1 25.7 13.1 3.5 87.5Year 11 545.0 3.2 17.7 20.4 28.4 20.6 8.0 1.7 79.2Not stated (14%) 566.7 2.8 11.8 16.8 26.4 24.7 13.2 4.4 85.4
WA
Bachelor 612.3 0.7 2.9 7.7 20.6 30.4 24.7 13.0 96.4Diploma 584.6 0.7 6.3 13.4 26.5 30.9 16.3 5.9 92.9Certificate 571.1 0.8 9.3 16.0 28.8 27.5 13.7 3.7 89.9Year 12 578.6 1.0 8.0 15.3 26.4 27.8 15.9 5.5 90.9Year 11 545.7 2.0 18.3 20.7 26.7 21.1 9.0 2.1 79.7Not stated (15%) 566.8 3.4 14.0 14.9 23.9 24.0 14.3 5.5 82.6
SA
Bachelor 604.9 0.8 4.0 9.4 21.7 30.4 22.2 11.5 95.2Diploma 578.0 1.6 7.5 14.5 28.3 28.3 14.6 5.1 90.8Certificate 566.4 1.7 11.2 17.1 28.5 24.9 13.0 3.7 87.2Year 12 570.9 2.3 9.5 15.8 28.9 26.2 13.1 4.2 88.2Year 11 543.9 4.3 19.0 20.2 26.1 19.5 8.7 2.2 76.7Not stated (12%) 566.5 5.6 13.4 15.1 24.1 23.1 13.0 5.6 81.0
KeyBachelor: Bachelor degree or aboveDiploma: Advanced diploma/diplomaCertificate: Certificate I to IVYear 12: Year 12 or equivalentYear 11: Year 11 or equivalent or belowNot stated: No data was provided for parental education at the time of student enrolment. The higher the percentage of missing data, the less informative are the results for the other categories.
Refer to the introduction for explanatory notes.
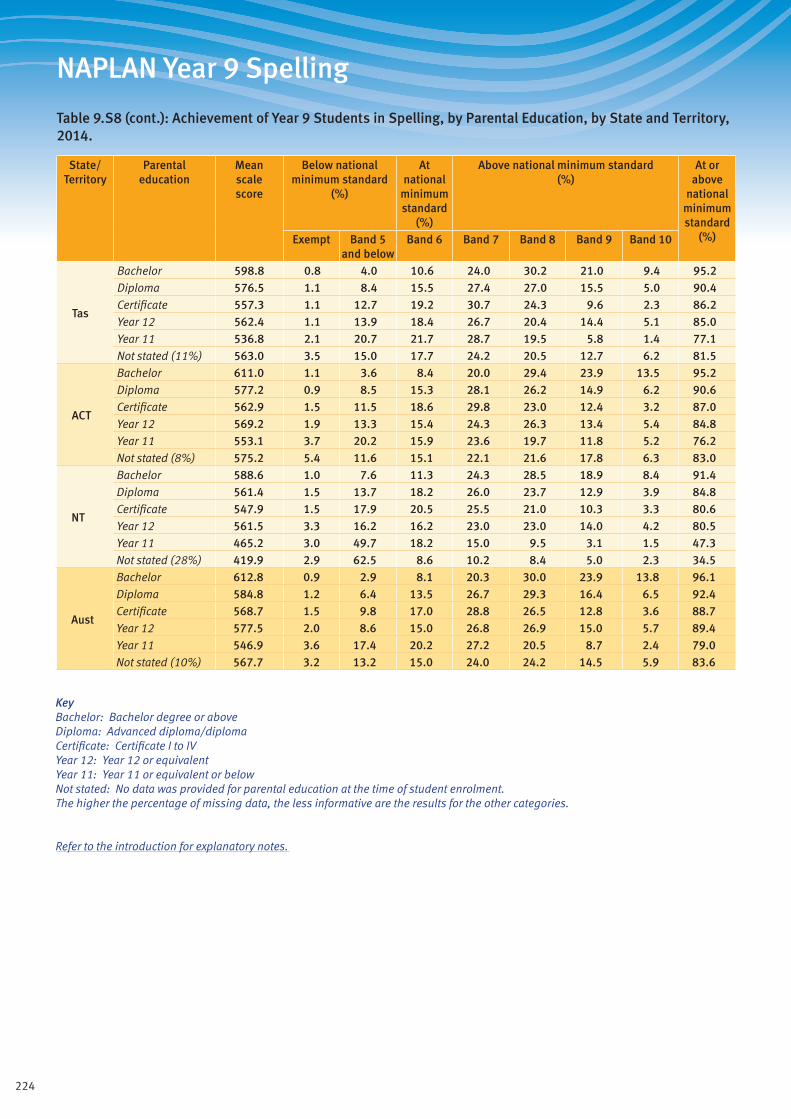
224
NAPLAN Year 9 Spelling
Table 9.S8 (cont.): Achievement of Year 9 Students in Spelling, by Parental Education, by State and Territory, 2014.
State/ Territory
Parental education
Mean scale score
Below national minimum standard
(%)
At national
minimum standard
(%)
Above national minimum standard (%)
At or above
national minimum standard
(%)Exempt Band 5 and below
Band 6 Band 7 Band 8 Band 9 Band 10
Tas
Bachelor 598.8 0.8 4.0 10.6 24.0 30.2 21.0 9.4 95.2Diploma 576.5 1.1 8.4 15.5 27.4 27.0 15.5 5.0 90.4Certificate 557.3 1.1 12.7 19.2 30.7 24.3 9.6 2.3 86.2Year 12 562.4 1.1 13.9 18.4 26.7 20.4 14.4 5.1 85.0Year 11 536.8 2.1 20.7 21.7 28.7 19.5 5.8 1.4 77.1Not stated (11%) 563.0 3.5 15.0 17.7 24.2 20.5 12.7 6.2 81.5
ACT
Bachelor 611.0 1.1 3.6 8.4 20.0 29.4 23.9 13.5 95.2Diploma 577.2 0.9 8.5 15.3 28.1 26.2 14.9 6.2 90.6Certificate 562.9 1.5 11.5 18.6 29.8 23.0 12.4 3.2 87.0Year 12 569.2 1.9 13.3 15.4 24.3 26.3 13.4 5.4 84.8Year 11 553.1 3.7 20.2 15.9 23.6 19.7 11.8 5.2 76.2Not stated (8%) 575.2 5.4 11.6 15.1 22.1 21.6 17.8 6.3 83.0
NT
Bachelor 588.6 1.0 7.6 11.3 24.3 28.5 18.9 8.4 91.4Diploma 561.4 1.5 13.7 18.2 26.0 23.7 12.9 3.9 84.8Certificate 547.9 1.5 17.9 20.5 25.5 21.0 10.3 3.3 80.6Year 12 561.5 3.3 16.2 16.2 23.0 23.0 14.0 4.2 80.5Year 11 465.2 3.0 49.7 18.2 15.0 9.5 3.1 1.5 47.3Not stated (28%) 419.9 2.9 62.5 8.6 10.2 8.4 5.0 2.3 34.5
Aust
Bachelor 612.8 0.9 2.9 8.1 20.3 30.0 23.9 13.8 96.1Diploma 584.8 1.2 6.4 13.5 26.7 29.3 16.4 6.5 92.4Certificate 568.7 1.5 9.8 17.0 28.8 26.5 12.8 3.6 88.7Year 12 577.5 2.0 8.6 15.0 26.8 26.9 15.0 5.7 89.4Year 11 546.9 3.6 17.4 20.2 27.2 20.5 8.7 2.4 79.0Not stated (10%) 567.7 3.2 13.2 15.0 24.0 24.2 14.5 5.9 83.6
KeyBachelor: Bachelor degree or aboveDiploma: Advanced diploma/diplomaCertificate: Certificate I to IVYear 12: Year 12 or equivalentYear 11: Year 11 or equivalent or belowNot stated: No data was provided for parental education at the time of student enrolment. The higher the percentage of missing data, the less informative are the results for the other categories.
Refer to the introduction for explanatory notes.
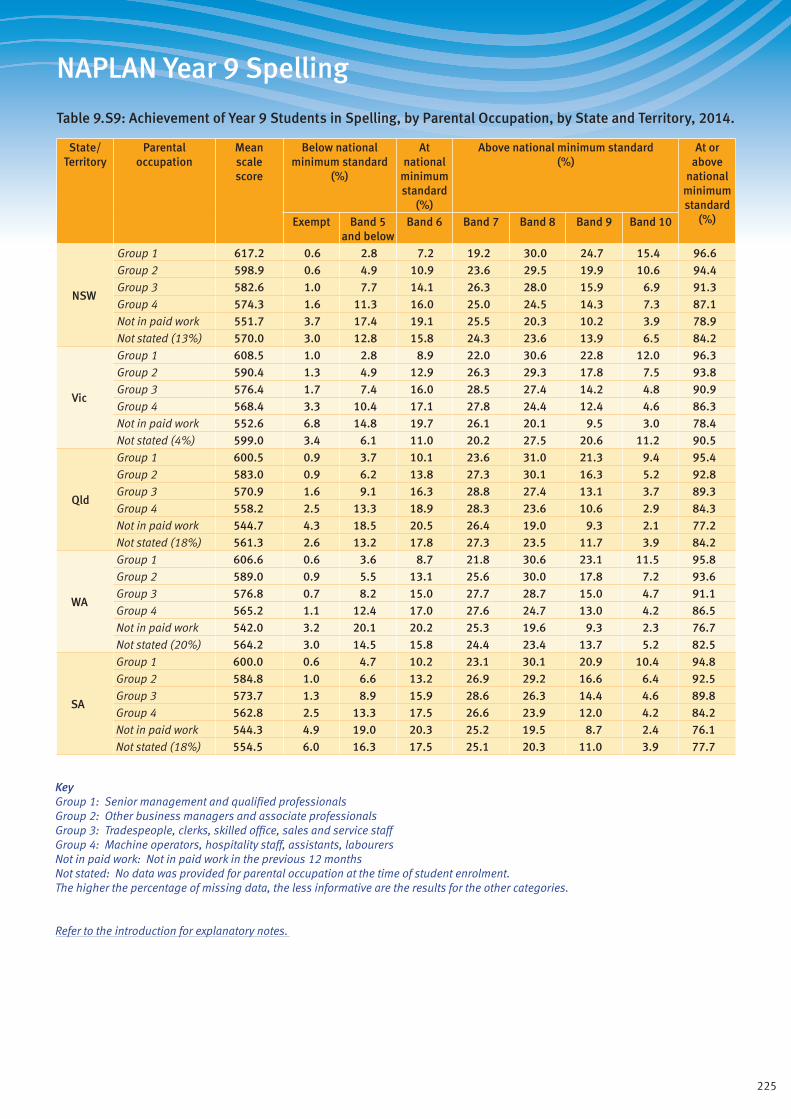
225
NAPLAN Year 9 Spelling
Table 9.S9: Achievement of Year 9 Students in Spelling, by Parental Occupation, by State and Territory, 2014.
State/ Territory
Parental occupation
Mean scale score
Below national minimum standard
(%)
At national
minimum standard
(%)
Above national minimum standard (%)
At or above
national minimum standard
(%)Exempt Band 5 and below
Band 6 Band 7 Band 8 Band 9 Band 10
NSW
Group 1 617.2 0.6 2.8 7.2 19.2 30.0 24.7 15.4 96.6Group 2 598.9 0.6 4.9 10.9 23.6 29.5 19.9 10.6 94.4Group 3 582.6 1.0 7.7 14.1 26.3 28.0 15.9 6.9 91.3Group 4 574.3 1.6 11.3 16.0 25.0 24.5 14.3 7.3 87.1Not in paid work 551.7 3.7 17.4 19.1 25.5 20.3 10.2 3.9 78.9Not stated (13%) 570.0 3.0 12.8 15.8 24.3 23.6 13.9 6.5 84.2
Vic
Group 1 608.5 1.0 2.8 8.9 22.0 30.6 22.8 12.0 96.3Group 2 590.4 1.3 4.9 12.9 26.3 29.3 17.8 7.5 93.8Group 3 576.4 1.7 7.4 16.0 28.5 27.4 14.2 4.8 90.9Group 4 568.4 3.3 10.4 17.1 27.8 24.4 12.4 4.6 86.3Not in paid work 552.6 6.8 14.8 19.7 26.1 20.1 9.5 3.0 78.4Not stated (4%) 599.0 3.4 6.1 11.0 20.2 27.5 20.6 11.2 90.5
Qld
Group 1 600.5 0.9 3.7 10.1 23.6 31.0 21.3 9.4 95.4Group 2 583.0 0.9 6.2 13.8 27.3 30.1 16.3 5.2 92.8Group 3 570.9 1.6 9.1 16.3 28.8 27.4 13.1 3.7 89.3Group 4 558.2 2.5 13.3 18.9 28.3 23.6 10.6 2.9 84.3Not in paid work 544.7 4.3 18.5 20.5 26.4 19.0 9.3 2.1 77.2Not stated (18%) 561.3 2.6 13.2 17.8 27.3 23.5 11.7 3.9 84.2
WA
Group 1 606.6 0.6 3.6 8.7 21.8 30.6 23.1 11.5 95.8Group 2 589.0 0.9 5.5 13.1 25.6 30.0 17.8 7.2 93.6Group 3 576.8 0.7 8.2 15.0 27.7 28.7 15.0 4.7 91.1Group 4 565.2 1.1 12.4 17.0 27.6 24.7 13.0 4.2 86.5Not in paid work 542.0 3.2 20.1 20.2 25.3 19.6 9.3 2.3 76.7Not stated (20%) 564.2 3.0 14.5 15.8 24.4 23.4 13.7 5.2 82.5
SA
Group 1 600.0 0.6 4.7 10.2 23.1 30.1 20.9 10.4 94.8Group 2 584.8 1.0 6.6 13.2 26.9 29.2 16.6 6.4 92.5Group 3 573.7 1.3 8.9 15.9 28.6 26.3 14.4 4.6 89.8Group 4 562.8 2.5 13.3 17.5 26.6 23.9 12.0 4.2 84.2Not in paid work 544.3 4.9 19.0 20.3 25.2 19.5 8.7 2.4 76.1Not stated (18%) 554.5 6.0 16.3 17.5 25.1 20.3 11.0 3.9 77.7
KeyGroup 1: Senior management and qualified professionalsGroup 2: Other business managers and associate professionalsGroup 3: Tradespeople, clerks, skilled office, sales and service staffGroup 4: Machine operators, hospitality staff, assistants, labourersNot in paid work: Not in paid work in the previous 12 monthsNot stated: No data was provided for parental occupation at the time of student enrolment. The higher the percentage of missing data, the less informative are the results for the other categories.
Refer to the introduction for explanatory notes.

226
NAPLAN Year 9 Spelling
Table 9.S9 (cont.): Achievement of Year 9 Students in Spelling, by Parental Occupation, by State and Territory, 2014.
State/ Territory
Parental occupation
Mean scale score
Below national minimum standard
(%)
At national
minimum standard
(%)
Above national minimum standard (%)
At or above
national minimum standard
(%)Exempt Band 5 and below
Band 6 Band 7 Band 8 Band 9 Band 10
Tas
Group 1 596.0 1.0 4.6 10.8 25.2 29.0 20.3 9.1 94.4Group 2 578.0 0.9 7.0 15.7 28.1 29.4 14.2 4.8 92.1Group 3 560.6 0.6 11.3 19.3 31.9 23.2 10.8 2.8 88.1Group 4 548.8 1.1 16.4 20.6 29.5 21.5 8.7 2.2 82.5Not in paid work 522.2 3.7 26.5 22.6 25.2 16.7 4.8 0.5 69.8Not stated (15%) 557.6 3.3 16.8 18.0 24.4 20.6 11.3 5.5 79.9
ACT
Group 1 605.2 1.1 4.9 9.4 21.0 28.6 22.7 12.3 93.9Group 2 590.1 0.9 6.5 12.5 25.1 27.8 18.7 8.6 92.6Group 3 571.3 1.4 9.8 16.9 28.3 25.9 12.6 5.2 88.8Group 4 558.1 2.0 17.6 18.6 22.0 21.0 13.4 5.4 80.4Not in paid work 548.6 6.7 18.7 18.9 25.2 16.0 11.9 2.7 74.6Not stated (13%) 568.1 4.9 13.5 15.5 23.8 20.8 15.7 5.7 81.6
NT
Group 1 572.8 1.0 11.5 15.3 25.1 25.5 15.0 6.5 87.4Group 2 578.4 2.1 10.1 15.4 22.1 25.9 17.4 6.9 87.8Group 3 547.7 1.4 18.3 18.8 27.3 21.6 9.8 2.8 80.3Group 4 509.6 2.2 34.3 18.9 18.7 14.9 7.6 3.4 63.4Not in paid work 437.0 2.7 59.9 14.8 10.7 7.3 2.8 1.8 37.4Not stated (27%) 408.5 3.3 65.6 9.5 10.6 6.8 3.3 0.8 31.1
Aust
Group 1 608.2 0.8 3.4 8.8 21.5 30.3 22.9 12.3 95.9Group 2 590.8 0.9 5.5 12.5 25.6 29.5 18.0 7.9 93.6Group 3 576.2 1.3 8.2 15.5 27.9 27.5 14.4 5.1 90.4Group 4 566.6 2.3 12.0 17.3 26.9 24.1 12.5 5.0 85.7Not in paid work 547.7 5.0 17.6 19.7 25.7 19.6 9.4 2.9 77.4Not stated (13%) 563.2 3.3 14.3 16.2 24.7 23.0 13.1 5.4 82.4
KeyGroup 1: Senior management and qualified professionalsGroup 2: Other business managers and associate professionalsGroup 3: Tradespeople, clerks, skilled office, sales and service staffGroup 4: Machine operators, hospitality staff, assistants, labourersNot in paid work: Not in paid work in the previous 12 monthsNot stated: No data was provided for parental occupation at the time of student enrolment. The higher the percentage of missing data, the less informative are the results for the other categories.
Refer to the introduction for explanatory notes.

227
NAPLAN Year 9 Grammar and Punctuation
Figure 9.G1: Achievement of Year 9 Students in Grammar and Punctuation, by State and Territory, 2014.
Band 5andbelow
Band 6
Band 7
Band 8
Band 9
Band 10
800
700
500
600
400
300
100
200
Ach
ieve
men
t sco
res
ACTQld SAWA TasVicNSW NT Aust
NSW Vic Qld WA SA Tas ACT NT Aust
Mean scale score / (S.D.)
576.6 (72.8)
578.6 (68.7)
567.4 (68.9)
574.9 (70.5)
567.6 (69.1)
564.0 (71.0)
588.3 (70.1)
507.2 (114.8)
573.5 (71.4)
Table 9.G1: Achievement of Year 9 Students in Grammar and Punctuation, by State and Territory, 2014.
State/ Territory
Average age/
Years of schooling
Part
icip
atio
nra
te (%
)
Abs
ent (
%)
Wit
hdra
wn
(%) Below national
minimum standard (%)
At national
minimum standard
(%)
Above national minimum standard (%)
At or above
national minimum standard
(%)Exempt Band 5 and below
Band 6 Band 7 Band 8 Band 9 Band 10
NSW14yrs 7mths 9yrs 4mths
94.3 4.9 0.8 1.4 8.6 17.8 26.1 24.7 14.6 6.9 90.1
Vic14yrs 9mths 9yrs 4mths
91.5 6.6 1.9 2.3 6.7 17.4 27.0 25.8 14.7 6.0 90.9
Qld14yrs 1mth 8yrs 4mths
89.6 4.8 5.6 1.7 9.5 19.8 28.2 24.2 12.3 4.3 88.8
WA14yrs 5mths 9yrs 4mths
94.0 5.4 0.6 1.3 8.4 17.0 27.2 25.9 14.6 5.5 90.2
SA14yrs 7mths 9yrs 4mths
90.3 6.8 3.0 2.3 9.5 19.2 27.7 24.6 12.5 4.2 88.1
Tas14yrs 11mths 9yrs 4mths
92.1 7.1 0.8 1.5 11.4 20.7 26.9 23.1 12.0 4.4 87.1
ACT14yrs 8mths 9yrs 4mths
90.3 5.1 4.6 1.7 6.2 13.7 24.8 27.3 18.5 7.7 92.0
NT14yrs 6mths 9yrs 4mths
85.6 12.3 2.2 2.1 34.2 17.5 19.9 14.9 8.1 3.3 63.7
Aust14yrs 6mths 9yrs 2mths
92.1 5.6 2.3 1.8 8.7 18.1 26.9 24.9 13.9 5.7 89.6
Refer to the introduction for explanatory notes and how to read the graph.
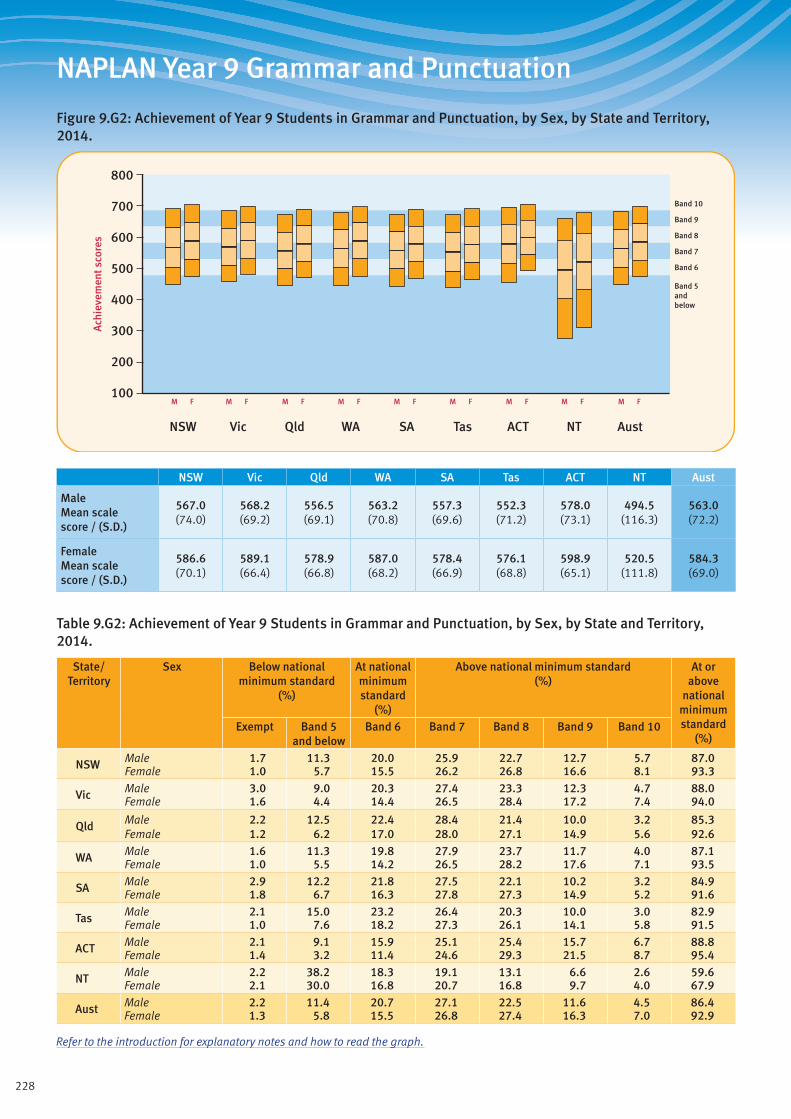
228
NAPLAN Year 9 Grammar and Punctuation
Figure 9.G2: Achievement of Year 9 Students in Grammar and Punctuation, by Sex, by State and Territory, 2014.
Band 5andbelow
Band 6
Band 7
Band 8
Band 9
Band 10
ACTQld SAWA TasVicNSW NT Aust
M F M F M F M F M F M F M F M F M F
800
700
500
600
400
300
100
200
Ach
ieve
men
t sco
res
NSW Vic Qld WA SA Tas ACT NT Aust
Male Mean scale score / (S.D.)
567.0 (74.0)
568.2 (69.2)
556.5 (69.1)
563.2 (70.8)
557.3 (69.6)
552.3 (71.2)
578.0 (73.1)
494.5 (116.3)
563.0 (72.2)
Female Mean scale score / (S.D.)
586.6 (70.1)
589.1 (66.4)
578.9 (66.8)
587.0 (68.2)
578.4 (66.9)
576.1 (68.8)
598.9 (65.1)
520.5 (111.8)
584.3 (69.0)
Table 9.G2: Achievement of Year 9 Students in Grammar and Punctuation, by Sex, by State and Territory, 2014.
State/ Territory
Sex Below national minimum standard
(%)
At national minimum standard
(%)
Above national minimum standard (%)
At or above
national minimum standard
(%)Exempt Band 5
and belowBand 6 Band 7 Band 8 Band 9 Band 10
NSW Male 1.7 11.3 20.0 25.9 22.7 12.7 5.7 87.0Female 1.0 5.7 15.5 26.2 26.8 16.6 8.1 93.3
Vic Male 3.0 9.0 20.3 27.4 23.3 12.3 4.7 88.0Female 1.6 4.4 14.4 26.5 28.4 17.2 7.4 94.0
Qld Male 2.2 12.5 22.4 28.4 21.4 10.0 3.2 85.3Female 1.2 6.2 17.0 28.0 27.1 14.9 5.6 92.6
WA Male 1.6 11.3 19.8 27.9 23.7 11.7 4.0 87.1Female 1.0 5.5 14.2 26.5 28.2 17.6 7.1 93.5
SA Male 2.9 12.2 21.8 27.5 22.1 10.2 3.2 84.9Female 1.8 6.7 16.3 27.8 27.3 14.9 5.2 91.6
Tas Male 2.1 15.0 23.2 26.4 20.3 10.0 3.0 82.9Female 1.0 7.6 18.2 27.3 26.1 14.1 5.8 91.5
ACT Male 2.1 9.1 15.9 25.1 25.4 15.7 6.7 88.8Female 1.4 3.2 11.4 24.6 29.3 21.5 8.7 95.4
NT Male 2.2 38.2 18.3 19.1 13.1 6.6 2.6 59.6Female 2.1 30.0 16.8 20.7 16.8 9.7 4.0 67.9
Aust Male 2.2 11.4 20.7 27.1 22.5 11.6 4.5 86.4Female 1.3 5.8 15.5 26.8 27.4 16.3 7.0 92.9
Refer to the introduction for explanatory notes and how to read the graph.
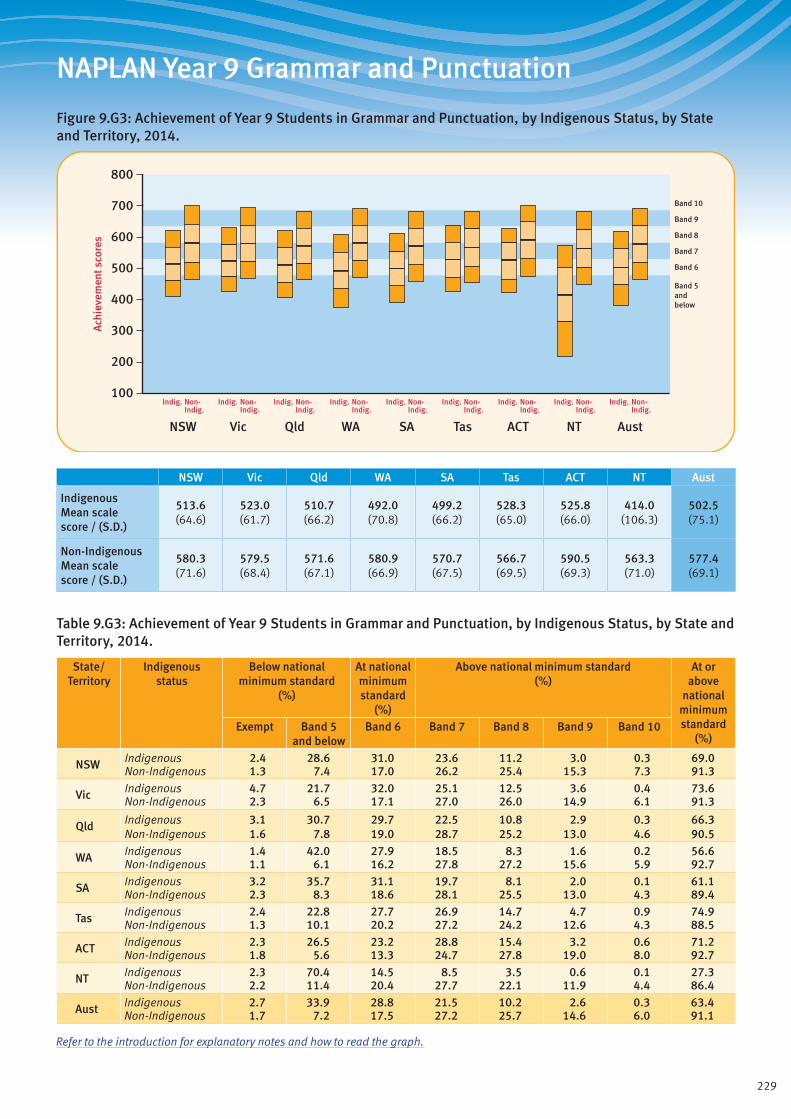
229
NAPLAN Year 9 Grammar and Punctuation
Figure 9.G3: Achievement of Year 9 Students in Grammar and Punctuation, by Indigenous Status, by State and Territory, 2014.
Band 5andbelow
Band 6
Band 7
Band 8
Band 9
Band 10
ACTQld SAWA TasVicNSW NT Aust
800
700
500
600
400
300
100
200
Ach
ieve
men
t sco
res
Indig. Non-Indig.
Indig. Non-Indig.
Indig. Non-Indig.
Indig. Non-Indig.
Indig. Non-Indig.
Indig. Non-Indig.
Indig. Non-Indig.
Indig. Non-Indig.
Indig. Non-Indig.
NSW Vic Qld WA SA Tas ACT NT Aust
Indigenous Mean scale score / (S.D.)
513.6 (64.6)
523.0 (61.7)
510.7 (66.2)
492.0 (70.8)
499.2 (66.2)
528.3 (65.0)
525.8 (66.0)
414.0 (106.3)
502.5 (75.1)
Non-Indigenous Mean scale score / (S.D.)
580.3 (71.6)
579.5 (68.4)
571.6 (67.1)
580.9 (66.9)
570.7 (67.5)
566.7 (69.5)
590.5 (69.3)
563.3 (71.0)
577.4 (69.1)
Table 9.G3: Achievement of Year 9 Students in Grammar and Punctuation, by Indigenous Status, by State and Territory, 2014.
State/ Territory
Indigenous status
Below national minimum standard
(%)
At national minimum standard
(%)
Above national minimum standard (%)
At or above
national minimum standard
(%)Exempt Band 5
and belowBand 6 Band 7 Band 8 Band 9 Band 10
NSW Indigenous 2.4 28.6 31.0 23.6 11.2 3.0 0.3 69.0Non-Indigenous 1.3 7.4 17.0 26.2 25.4 15.3 7.3 91.3
Vic Indigenous 4.7 21.7 32.0 25.1 12.5 3.6 0.4 73.6Non-Indigenous 2.3 6.5 17.1 27.0 26.0 14.9 6.1 91.3
Qld Indigenous 3.1 30.7 29.7 22.5 10.8 2.9 0.3 66.3Non-Indigenous 1.6 7.8 19.0 28.7 25.2 13.0 4.6 90.5
WA Indigenous 1.4 42.0 27.9 18.5 8.3 1.6 0.2 56.6Non-Indigenous 1.1 6.1 16.2 27.8 27.2 15.6 5.9 92.7
SA Indigenous 3.2 35.7 31.1 19.7 8.1 2.0 0.1 61.1Non-Indigenous 2.3 8.3 18.6 28.1 25.5 13.0 4.3 89.4
Tas Indigenous 2.4 22.8 27.7 26.9 14.7 4.7 0.9 74.9Non-Indigenous 1.3 10.1 20.2 27.2 24.2 12.6 4.3 88.5
ACT Indigenous 2.3 26.5 23.2 28.8 15.4 3.2 0.6 71.2Non-Indigenous 1.8 5.6 13.3 24.7 27.8 19.0 8.0 92.7
NT Indigenous 2.3 70.4 14.5 8.5 3.5 0.6 0.1 27.3Non-Indigenous 2.2 11.4 20.4 27.7 22.1 11.9 4.4 86.4
Aust Indigenous 2.7 33.9 28.8 21.5 10.2 2.6 0.3 63.4Non-Indigenous 1.7 7.2 17.5 27.2 25.7 14.6 6.0 91.1
Refer to the introduction for explanatory notes and how to read the graph.
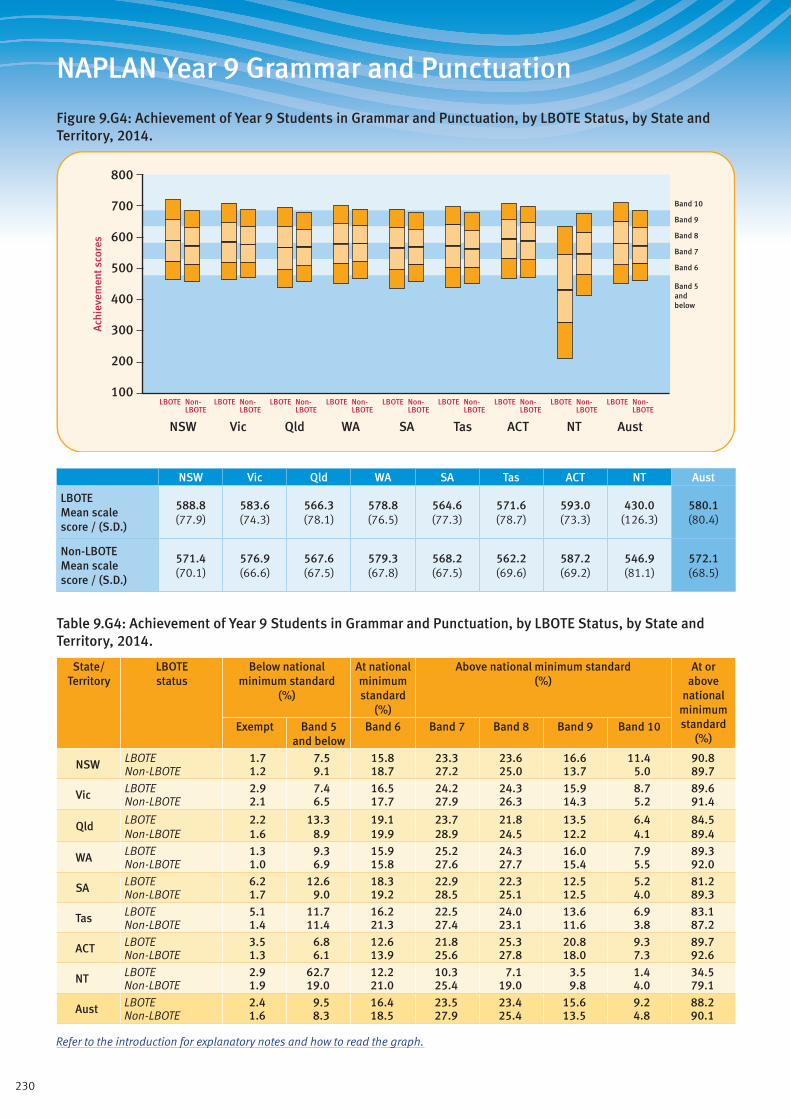
230
NAPLAN Year 9 Grammar and Punctuation
Figure 9.G4: Achievement of Year 9 Students in Grammar and Punctuation, by LBOTE Status, by State and Territory, 2014.
Band 5andbelow
Band 6
Band 7
Band 8
Band 9
Band 10
ACTQld SAWA TasVicNSW NT Aust
800
700
500
600
400
300
100
200
Ach
ieve
men
t sco
res
LBOTE Non-LBOTE
LBOTE Non-LBOTE
LBOTE Non-LBOTE
LBOTE Non-LBOTE
LBOTE Non-LBOTE
LBOTE Non-LBOTE
LBOTE Non-LBOTE
LBOTE Non-LBOTE
LBOTE Non-LBOTE
NSW Vic Qld WA SA Tas ACT NT Aust
LBOTE Mean scale score / (S.D.)
588.8 (77.9)
583.6 (74.3)
566.3 (78.1)
578.8 (76.5)
564.6 (77.3)
571.6 (78.7)
593.0 (73.3)
430.0 (126.3)
580.1 (80.4)
Non-LBOTE Mean scale score / (S.D.)
571.4 (70.1)
576.9 (66.6)
567.6 (67.5)
579.3 (67.8)
568.2 (67.5)
562.2 (69.6)
587.2 (69.2)
546.9 (81.1)
572.1 (68.5)
Table 9.G4: Achievement of Year 9 Students in Grammar and Punctuation, by LBOTE Status, by State and Territory, 2014.
State/ Territory
LBOTE status
Below national minimum standard
(%)
At national minimum standard
(%)
Above national minimum standard (%)
At or above
national minimum standard
(%)Exempt Band 5
and belowBand 6 Band 7 Band 8 Band 9 Band 10
NSW LBOTE 1.7 7.5 15.8 23.3 23.6 16.6 11.4 90.8Non-LBOTE 1.2 9.1 18.7 27.2 25.0 13.7 5.0 89.7
Vic LBOTE 2.9 7.4 16.5 24.2 24.3 15.9 8.7 89.6Non-LBOTE 2.1 6.5 17.7 27.9 26.3 14.3 5.2 91.4
Qld LBOTE 2.2 13.3 19.1 23.7 21.8 13.5 6.4 84.5Non-LBOTE 1.6 8.9 19.9 28.9 24.5 12.2 4.1 89.4
WA LBOTE 1.3 9.3 15.9 25.2 24.3 16.0 7.9 89.3Non-LBOTE 1.0 6.9 15.8 27.6 27.7 15.4 5.5 92.0
SA LBOTE 6.2 12.6 18.3 22.9 22.3 12.5 5.2 81.2Non-LBOTE 1.7 9.0 19.2 28.5 25.1 12.5 4.0 89.3
Tas LBOTE 5.1 11.7 16.2 22.5 24.0 13.6 6.9 83.1Non-LBOTE 1.4 11.4 21.3 27.4 23.1 11.6 3.8 87.2
ACT LBOTE 3.5 6.8 12.6 21.8 25.3 20.8 9.3 89.7Non-LBOTE 1.3 6.1 13.9 25.6 27.8 18.0 7.3 92.6
NT LBOTE 2.9 62.7 12.2 10.3 7.1 3.5 1.4 34.5Non-LBOTE 1.9 19.0 21.0 25.4 19.0 9.8 4.0 79.1
Aust LBOTE 2.4 9.5 16.4 23.5 23.4 15.6 9.2 88.2Non-LBOTE 1.6 8.3 18.5 27.9 25.4 13.5 4.8 90.1
Refer to the introduction for explanatory notes and how to read the graph.
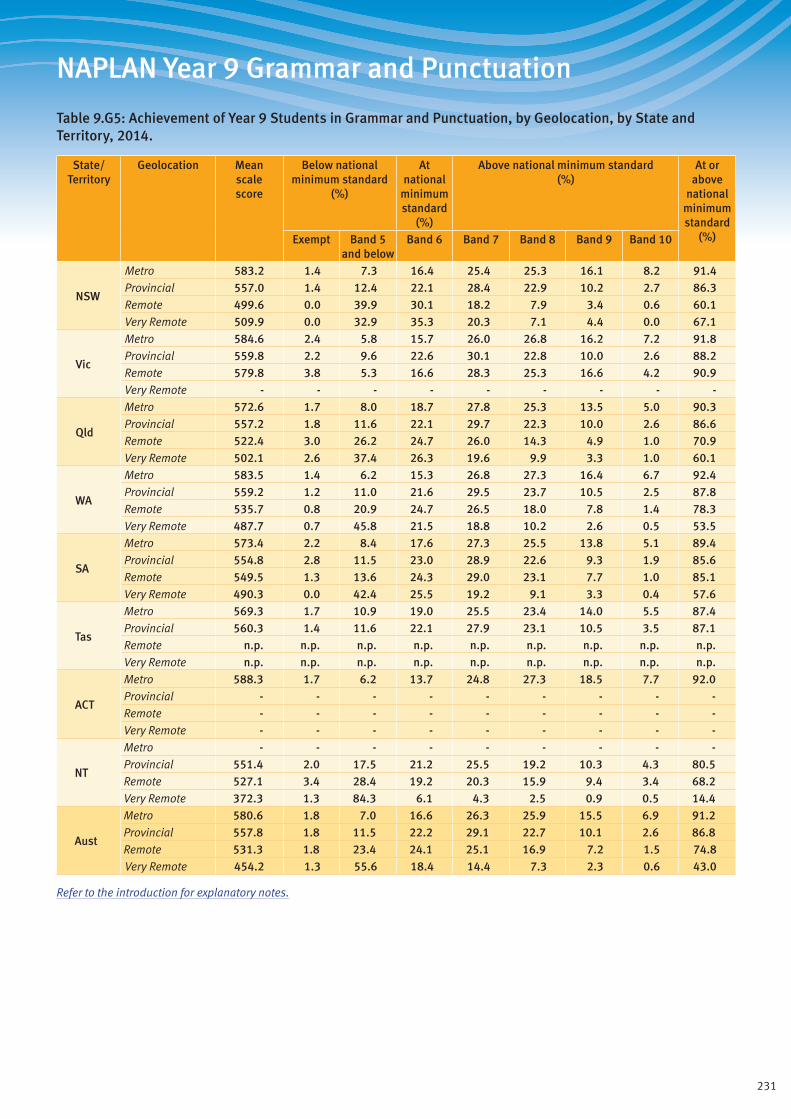
231
NAPLAN Year 9 Grammar and Punctuation
Table 9.G5: Achievement of Year 9 Students in Grammar and Punctuation, by Geolocation, by State and Territory, 2014.
State/ Territory
Geolocation Mean scale score
Below national minimum standard
(%)
At national
minimum standard
(%)
Above national minimum standard (%)
At or above
national minimum standard
(%)Exempt Band 5 and below
Band 6 Band 7 Band 8 Band 9 Band 10
NSW
Metro 583.2 1.4 7.3 16.4 25.4 25.3 16.1 8.2 91.4Provincial 557.0 1.4 12.4 22.1 28.4 22.9 10.2 2.7 86.3Remote 499.6 0.0 39.9 30.1 18.2 7.9 3.4 0.6 60.1Very Remote 509.9 0.0 32.9 35.3 20.3 7.1 4.4 0.0 67.1
Vic
Metro 584.6 2.4 5.8 15.7 26.0 26.8 16.2 7.2 91.8Provincial 559.8 2.2 9.6 22.6 30.1 22.8 10.0 2.6 88.2Remote 579.8 3.8 5.3 16.6 28.3 25.3 16.6 4.2 90.9Very Remote - - - - - - - - -
Qld
Metro 572.6 1.7 8.0 18.7 27.8 25.3 13.5 5.0 90.3Provincial 557.2 1.8 11.6 22.1 29.7 22.3 10.0 2.6 86.6Remote 522.4 3.0 26.2 24.7 26.0 14.3 4.9 1.0 70.9Very Remote 502.1 2.6 37.4 26.3 19.6 9.9 3.3 1.0 60.1
WA
Metro 583.5 1.4 6.2 15.3 26.8 27.3 16.4 6.7 92.4Provincial 559.2 1.2 11.0 21.6 29.5 23.7 10.5 2.5 87.8Remote 535.7 0.8 20.9 24.7 26.5 18.0 7.8 1.4 78.3Very Remote 487.7 0.7 45.8 21.5 18.8 10.2 2.6 0.5 53.5
SA
Metro 573.4 2.2 8.4 17.6 27.3 25.5 13.8 5.1 89.4Provincial 554.8 2.8 11.5 23.0 28.9 22.6 9.3 1.9 85.6Remote 549.5 1.3 13.6 24.3 29.0 23.1 7.7 1.0 85.1Very Remote 490.3 0.0 42.4 25.5 19.2 9.1 3.3 0.4 57.6
Tas
Metro 569.3 1.7 10.9 19.0 25.5 23.4 14.0 5.5 87.4Provincial 560.3 1.4 11.6 22.1 27.9 23.1 10.5 3.5 87.1Remote n.p. n.p. n.p. n.p. n.p. n.p. n.p. n.p. n.p.Very Remote n.p. n.p. n.p. n.p. n.p. n.p. n.p. n.p. n.p.
ACT
Metro 588.3 1.7 6.2 13.7 24.8 27.3 18.5 7.7 92.0Provincial - - - - - - - - -Remote - - - - - - - - -Very Remote - - - - - - - - -
NT
Metro - - - - - - - - -Provincial 551.4 2.0 17.5 21.2 25.5 19.2 10.3 4.3 80.5Remote 527.1 3.4 28.4 19.2 20.3 15.9 9.4 3.4 68.2Very Remote 372.3 1.3 84.3 6.1 4.3 2.5 0.9 0.5 14.4
Aust
Metro 580.6 1.8 7.0 16.6 26.3 25.9 15.5 6.9 91.2Provincial 557.8 1.8 11.5 22.2 29.1 22.7 10.1 2.6 86.8Remote 531.3 1.8 23.4 24.1 25.1 16.9 7.2 1.5 74.8Very Remote 454.2 1.3 55.6 18.4 14.4 7.3 2.3 0.6 43.0
Refer to the introduction for explanatory notes.

232
NAPLAN Year 9 Grammar and Punctuation
Table 9.G6: Achievement of Year 9 Indigenous Students in Grammar and Punctuation, by Geolocation, by State and Territory, 2014.
State/ Territory
Geolocation Mean scale score
Below national minimum standard
(%)
At national
minimum standard
(%)
Above national minimum standard (%)
At or above
national minimum standard
(%)Exempt Band 5 and below
Band 6 Band 7 Band 8 Band 9 Band 10
NSW
Metro 521.2 2.5 24.3 30.3 25.5 13.1 3.9 0.4 73.2Provincial 509.6 2.5 30.6 31.6 22.7 10.2 2.2 0.2 66.9Remote 470.3 0.0 55.6 31.1 10.5 1.8 1.1 0.0 44.4Very Remote n.p. n.p. n.p. n.p. n.p. n.p. n.p. n.p. n.p.
Vic
Metro 529.8 4.7 18.8 30.3 26.4 14.4 4.6 0.7 76.4Provincial 516.6 4.7 24.3 33.5 24.1 10.6 2.6 0.1 70.9Remote n.p. n.p. n.p. n.p. n.p. n.p. n.p. n.p. n.p.Very Remote - - - - - - - - -
Qld
Metro 520.4 3.5 25.2 30.2 24.4 12.8 3.5 0.5 71.3Provincial 509.5 2.2 31.4 30.4 23.2 10.0 2.7 0.2 66.4Remote 468.9 5.2 51.8 25.8 12.1 4.2 1.0 0.0 43.1Very Remote 468.2 3.1 56.6 24.6 10.7 3.9 1.1 0.1 40.3
WA
Metro 514.6 1.9 29.8 27.9 25.3 11.9 2.8 0.4 68.3Provincial 497.1 1.4 37.8 34.2 18.0 7.6 0.8 0.2 60.8Remote 479.6 0.9 48.9 27.7 14.3 6.7 1.3 0.1 50.2Very Remote 449.6 0.9 67.0 19.7 8.6 3.4 0.4 0.0 32.1
SA
Metro 505.7 3.0 33.2 29.5 22.5 9.5 2.2 0.0 63.8Provincial 503.6 4.6 31.0 35.1 19.2 7.9 2.1 0.1 64.4Remote n.p. n.p. n.p. n.p. n.p. n.p. n.p. n.p. n.p.Very Remote 445.2 0.0 68.1 20.3 8.1 1.9 0.8 0.8 31.9
Tas
Metro 524.9 2.5 24.0 27.6 29.8 9.1 5.0 1.8 73.5Provincial 531.1 2.0 21.7 28.0 24.9 18.6 4.6 0.3 76.3Remote n.p. n.p. n.p. n.p. n.p. n.p. n.p. n.p. n.p.Very Remote n.p. n.p. n.p. n.p. n.p. n.p. n.p. n.p. n.p.
ACT
Metro 525.8 2.3 26.5 23.2 28.8 15.4 3.2 0.6 71.2Provincial - - - - - - - - -Remote - - - - - - - - -Very Remote - - - - - - - - -
NT
Metro - - - - - - - - -Provincial 494.6 1.2 42.0 27.2 19.4 8.4 1.6 0.2 56.8Remote 453.0 6.1 56.8 22.3 10.5 3.4 0.8 0.2 37.1Very Remote 351.1 1.4 92.7 3.9 1.3 0.7 0.0 0.0 5.9
Aust
Metro 520.0 3.0 25.5 29.7 25.2 12.6 3.6 0.5 71.6Provincial 509.1 2.5 31.1 31.4 22.3 10.2 2.4 0.2 66.4Remote 470.3 3.1 52.0 26.9 12.4 4.6 1.1 0.1 45.0Very Remote 411.1 1.5 75.6 14.1 6.1 2.2 0.4 0.1 22.9
Refer to the introduction for explanatory notes.

233
NAPLAN Year 9 Grammar and Punctuation
Table 9.G7: Achievement of Year 9 Non-Indigenous Students in Grammar and Punctuation, by Geolocation, by State and Territory, 2014.
State/ Territory
Geolocation Mean scale score
Below national minimum standard
(%)
At national
minimum standard
(%)
Above national minimum standard (%)
At or above
national minimum standard
(%)Exempt Band 5 and below
Band 6 Band 7 Band 8 Band 9 Band 10
NSW
Metro 585.4 1.3 6.6 15.9 25.4 25.7 16.5 8.6 92.1Provincial 562.9 1.2 10.1 20.9 29.1 24.5 11.2 3.0 88.7Remote 525.4 0.0 25.6 29.2 25.9 13.7 5.1 0.6 74.4Very Remote n.p. n.p. n.p. n.p. n.p. n.p. n.p. n.p. n.p.
Vic
Metro 585.2 2.3 5.6 15.5 26.0 26.9 16.4 7.2 92.1Provincial 561.3 2.1 9.1 22.2 30.3 23.3 10.3 2.7 88.8Remote 583.6 3.9 3.5 15.3 29.4 26.3 17.3 4.3 92.5Very Remote - - - - - - - - -
Qld
Metro 575.5 1.6 7.1 18.1 28.0 25.9 14.0 5.3 91.3Provincial 562.5 1.7 9.4 21.2 30.4 23.6 10.8 2.8 88.8Remote 543.5 2.2 15.7 24.2 31.6 18.4 6.5 1.4 82.1Very Remote 548.6 1.5 10.9 28.6 31.7 18.5 6.5 2.4 87.6
WA
Metro 586.0 1.2 5.3 14.8 26.9 27.9 16.9 6.9 93.5Provincial 565.2 1.2 8.6 20.3 30.4 25.3 11.6 2.8 90.2Remote 559.6 0.8 8.9 23.5 31.6 22.6 10.7 1.9 90.3Very Remote 554.1 0.5 9.2 23.9 36.2 22.4 6.3 1.4 90.3
SA
Metro 575.5 2.2 7.6 17.2 27.5 26.1 14.2 5.2 90.3Provincial 558.6 2.7 10.2 22.0 29.5 23.8 9.9 2.0 87.1Remote 552.7 1.5 11.9 23.4 30.1 24.2 7.8 1.1 86.6Very Remote 539.6 0.0 14.5 31.2 30.7 17.3 6.3 0.0 85.5
Tas
Metro 572.8 1.5 9.8 18.2 25.2 24.7 14.9 5.6 88.7Provincial 562.3 1.2 10.3 21.7 28.8 23.9 10.8 3.4 88.5Remote n.p. n.p. n.p. n.p. n.p. n.p. n.p. n.p. n.p.Very Remote n.p. n.p. n.p. n.p. n.p. n.p. n.p. n.p. n.p.
ACT
Metro 590.5 1.8 5.6 13.3 24.7 27.8 19.0 8.0 92.7Provincial - - - - - - - - -Remote - - - - - - - - -Very Remote - - - - - - - - -
NT
Metro - - - - - - - - -Provincial 560.5 2.4 12.1 20.9 27.6 21.6 11.2 4.1 85.5Remote 575.3 1.5 8.9 17.2 27.1 24.6 15.4 5.3 89.6Very Remote 553.1 0.0 11.7 26.0 30.8 18.7 7.6 5.1 88.3
Aust
Metro 582.7 1.7 6.4 16.2 26.4 26.4 15.9 7.1 91.9Provincial 562.2 1.7 9.6 21.3 29.8 23.9 10.8 2.8 88.7Remote 555.3 1.4 11.9 22.9 30.2 21.8 9.7 2.1 86.7Very Remote 548.6 0.9 11.5 27.3 32.8 19.1 6.5 1.9 87.6
Refer to the introduction for explanatory notes.
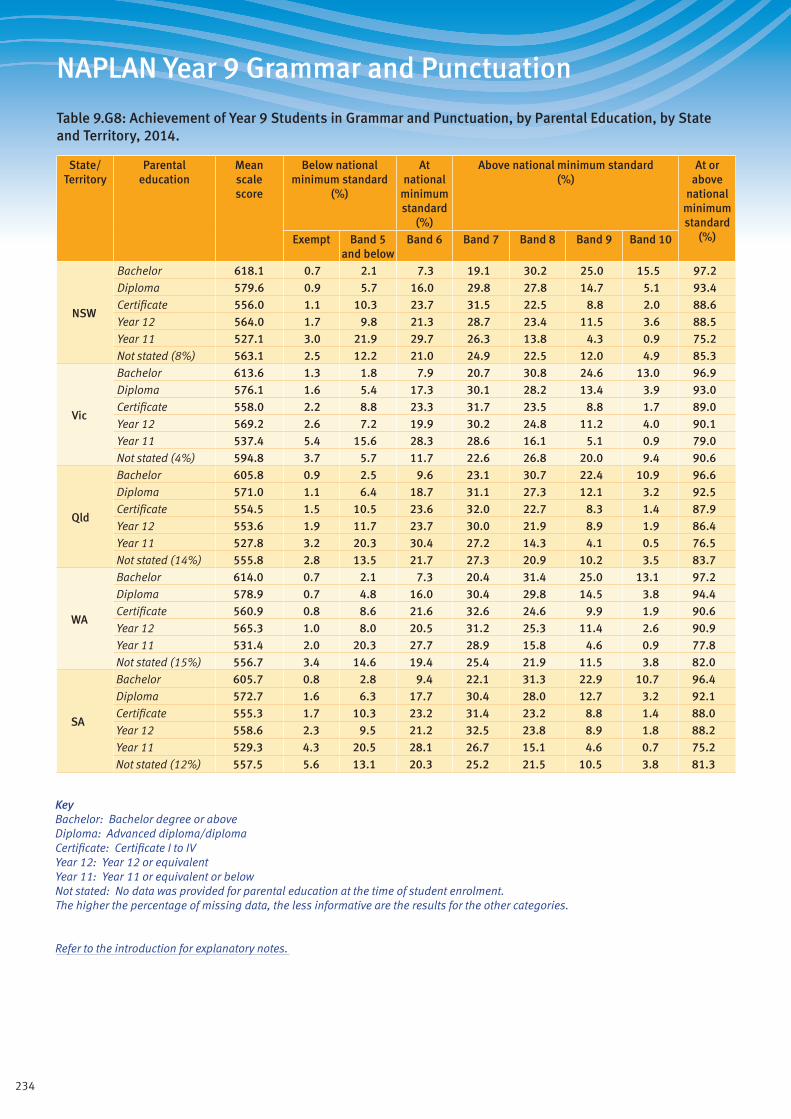
234
NAPLAN Year 9 Grammar and Punctuation
Table 9.G8: Achievement of Year 9 Students in Grammar and Punctuation, by Parental Education, by State and Territory, 2014.
State/ Territory
Parental education
Mean scale score
Below national minimum standard
(%)
At national
minimum standard
(%)
Above national minimum standard (%)
At or above
national minimum standard
(%)Exempt Band 5 and below
Band 6 Band 7 Band 8 Band 9 Band 10
NSW
Bachelor 618.1 0.7 2.1 7.3 19.1 30.2 25.0 15.5 97.2Diploma 579.6 0.9 5.7 16.0 29.8 27.8 14.7 5.1 93.4Certificate 556.0 1.1 10.3 23.7 31.5 22.5 8.8 2.0 88.6Year 12 564.0 1.7 9.8 21.3 28.7 23.4 11.5 3.6 88.5Year 11 527.1 3.0 21.9 29.7 26.3 13.8 4.3 0.9 75.2Not stated (8%) 563.1 2.5 12.2 21.0 24.9 22.5 12.0 4.9 85.3
Vic
Bachelor 613.6 1.3 1.8 7.9 20.7 30.8 24.6 13.0 96.9Diploma 576.1 1.6 5.4 17.3 30.1 28.2 13.4 3.9 93.0Certificate 558.0 2.2 8.8 23.3 31.7 23.5 8.8 1.7 89.0Year 12 569.2 2.6 7.2 19.9 30.2 24.8 11.2 4.0 90.1Year 11 537.4 5.4 15.6 28.3 28.6 16.1 5.1 0.9 79.0Not stated (4%) 594.8 3.7 5.7 11.7 22.6 26.8 20.0 9.4 90.6
Qld
Bachelor 605.8 0.9 2.5 9.6 23.1 30.7 22.4 10.9 96.6Diploma 571.0 1.1 6.4 18.7 31.1 27.3 12.1 3.2 92.5Certificate 554.5 1.5 10.5 23.6 32.0 22.7 8.3 1.4 87.9Year 12 553.6 1.9 11.7 23.7 30.0 21.9 8.9 1.9 86.4Year 11 527.8 3.2 20.3 30.4 27.2 14.3 4.1 0.5 76.5Not stated (14%) 555.8 2.8 13.5 21.7 27.3 20.9 10.2 3.5 83.7
WA
Bachelor 614.0 0.7 2.1 7.3 20.4 31.4 25.0 13.1 97.2Diploma 578.9 0.7 4.8 16.0 30.4 29.8 14.5 3.8 94.4Certificate 560.9 0.8 8.6 21.6 32.6 24.6 9.9 1.9 90.6Year 12 565.3 1.0 8.0 20.5 31.2 25.3 11.4 2.6 90.9Year 11 531.4 2.0 20.3 27.7 28.9 15.8 4.6 0.9 77.8Not stated (15%) 556.7 3.4 14.6 19.4 25.4 21.9 11.5 3.8 82.0
SA
Bachelor 605.7 0.8 2.8 9.4 22.1 31.3 22.9 10.7 96.4Diploma 572.7 1.6 6.3 17.7 30.4 28.0 12.7 3.2 92.1Certificate 555.3 1.7 10.3 23.2 31.4 23.2 8.8 1.4 88.0Year 12 558.6 2.3 9.5 21.2 32.5 23.8 8.9 1.8 88.2Year 11 529.3 4.3 20.5 28.1 26.7 15.1 4.6 0.7 75.2Not stated (12%) 557.5 5.6 13.1 20.3 25.2 21.5 10.5 3.8 81.3
KeyBachelor: Bachelor degree or aboveDiploma: Advanced diploma/diplomaCertificate: Certificate I to IVYear 12: Year 12 or equivalentYear 11: Year 11 or equivalent or belowNot stated: No data was provided for parental education at the time of student enrolment. The higher the percentage of missing data, the less informative are the results for the other categories.
Refer to the introduction for explanatory notes.
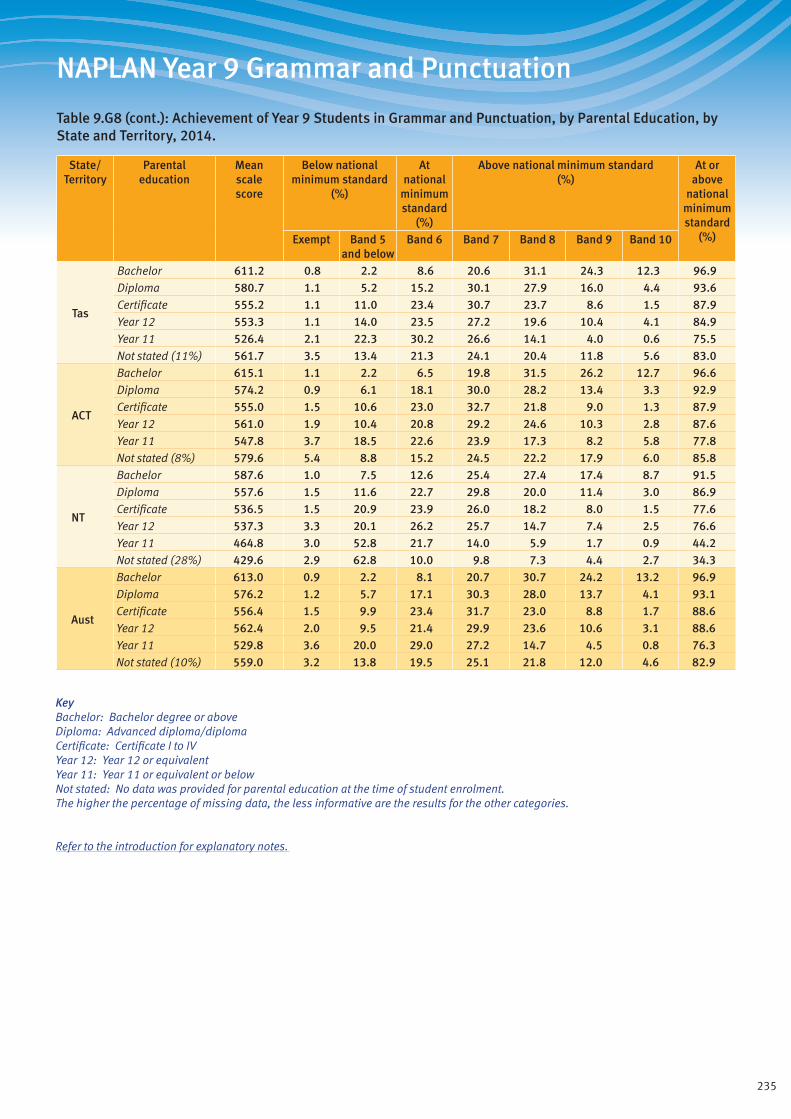
235
NAPLAN Year 9 Grammar and Punctuation
Table 9.G8 (cont.): Achievement of Year 9 Students in Grammar and Punctuation, by Parental Education, by State and Territory, 2014.
State/ Territory
Parental education
Mean scale score
Below national minimum standard
(%)
At national
minimum standard
(%)
Above national minimum standard (%)
At or above
national minimum standard
(%)Exempt Band 5 and below
Band 6 Band 7 Band 8 Band 9 Band 10
Tas
Bachelor 611.2 0.8 2.2 8.6 20.6 31.1 24.3 12.3 96.9Diploma 580.7 1.1 5.2 15.2 30.1 27.9 16.0 4.4 93.6Certificate 555.2 1.1 11.0 23.4 30.7 23.7 8.6 1.5 87.9Year 12 553.3 1.1 14.0 23.5 27.2 19.6 10.4 4.1 84.9Year 11 526.4 2.1 22.3 30.2 26.6 14.1 4.0 0.6 75.5Not stated (11%) 561.7 3.5 13.4 21.3 24.1 20.4 11.8 5.6 83.0
ACT
Bachelor 615.1 1.1 2.2 6.5 19.8 31.5 26.2 12.7 96.6Diploma 574.2 0.9 6.1 18.1 30.0 28.2 13.4 3.3 92.9Certificate 555.0 1.5 10.6 23.0 32.7 21.8 9.0 1.3 87.9Year 12 561.0 1.9 10.4 20.8 29.2 24.6 10.3 2.8 87.6Year 11 547.8 3.7 18.5 22.6 23.9 17.3 8.2 5.8 77.8Not stated (8%) 579.6 5.4 8.8 15.2 24.5 22.2 17.9 6.0 85.8
NT
Bachelor 587.6 1.0 7.5 12.6 25.4 27.4 17.4 8.7 91.5Diploma 557.6 1.5 11.6 22.7 29.8 20.0 11.4 3.0 86.9Certificate 536.5 1.5 20.9 23.9 26.0 18.2 8.0 1.5 77.6Year 12 537.3 3.3 20.1 26.2 25.7 14.7 7.4 2.5 76.6Year 11 464.8 3.0 52.8 21.7 14.0 5.9 1.7 0.9 44.2Not stated (28%) 429.6 2.9 62.8 10.0 9.8 7.3 4.4 2.7 34.3
Aust
Bachelor 613.0 0.9 2.2 8.1 20.7 30.7 24.2 13.2 96.9Diploma 576.2 1.2 5.7 17.1 30.3 28.0 13.7 4.1 93.1Certificate 556.4 1.5 9.9 23.4 31.7 23.0 8.8 1.7 88.6Year 12 562.4 2.0 9.5 21.4 29.9 23.6 10.6 3.1 88.6Year 11 529.8 3.6 20.0 29.0 27.2 14.7 4.5 0.8 76.3Not stated (10%) 559.0 3.2 13.8 19.5 25.1 21.8 12.0 4.6 82.9
KeyBachelor: Bachelor degree or aboveDiploma: Advanced diploma/diplomaCertificate: Certificate I to IVYear 12: Year 12 or equivalentYear 11: Year 11 or equivalent or belowNot stated: No data was provided for parental education at the time of student enrolment. The higher the percentage of missing data, the less informative are the results for the other categories.
Refer to the introduction for explanatory notes.
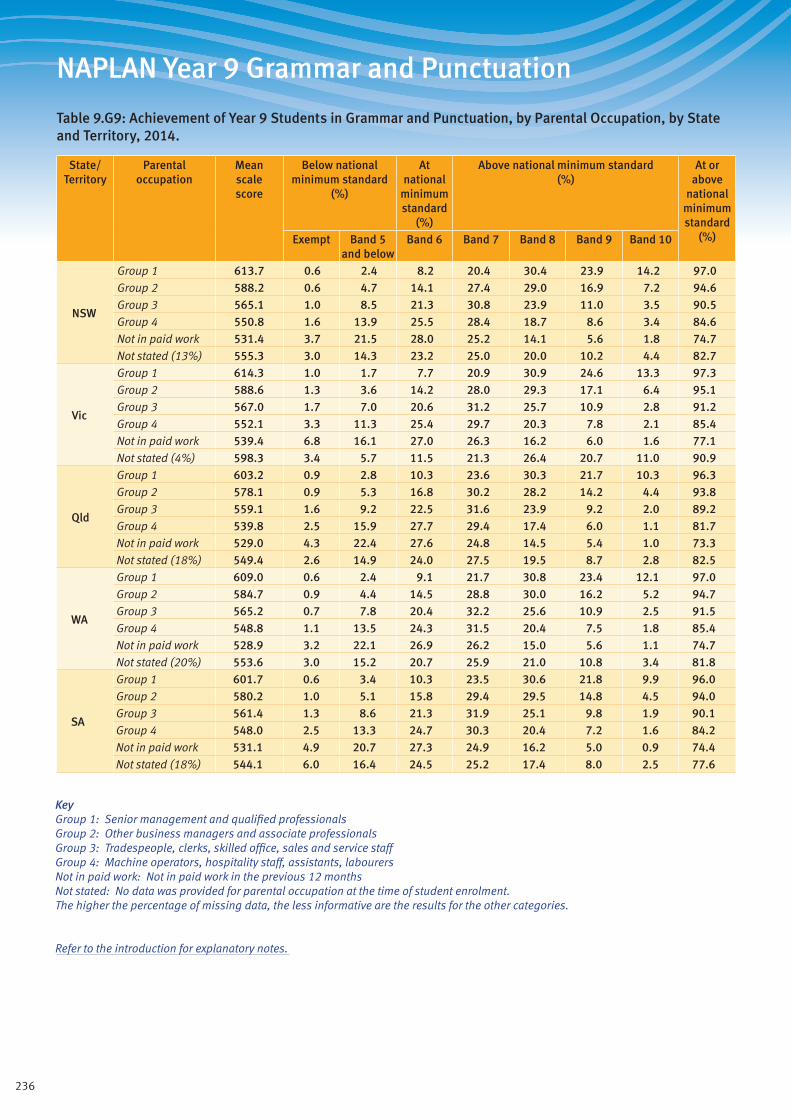
236
NAPLAN Year 9 Grammar and Punctuation
Table 9.G9: Achievement of Year 9 Students in Grammar and Punctuation, by Parental Occupation, by State and Territory, 2014.
State/ Territory
Parental occupation
Mean scale score
Below national minimum standard
(%)
At national
minimum standard
(%)
Above national minimum standard (%)
At or above
national minimum standard
(%)Exempt Band 5 and below
Band 6 Band 7 Band 8 Band 9 Band 10
NSW
Group 1 613.7 0.6 2.4 8.2 20.4 30.4 23.9 14.2 97.0Group 2 588.2 0.6 4.7 14.1 27.4 29.0 16.9 7.2 94.6Group 3 565.1 1.0 8.5 21.3 30.8 23.9 11.0 3.5 90.5Group 4 550.8 1.6 13.9 25.5 28.4 18.7 8.6 3.4 84.6Not in paid work 531.4 3.7 21.5 28.0 25.2 14.1 5.6 1.8 74.7Not stated (13%) 555.3 3.0 14.3 23.2 25.0 20.0 10.2 4.4 82.7
Vic
Group 1 614.3 1.0 1.7 7.7 20.9 30.9 24.6 13.3 97.3Group 2 588.6 1.3 3.6 14.2 28.0 29.3 17.1 6.4 95.1Group 3 567.0 1.7 7.0 20.6 31.2 25.7 10.9 2.8 91.2Group 4 552.1 3.3 11.3 25.4 29.7 20.3 7.8 2.1 85.4Not in paid work 539.4 6.8 16.1 27.0 26.3 16.2 6.0 1.6 77.1Not stated (4%) 598.3 3.4 5.7 11.5 21.3 26.4 20.7 11.0 90.9
Qld
Group 1 603.2 0.9 2.8 10.3 23.6 30.3 21.7 10.3 96.3Group 2 578.1 0.9 5.3 16.8 30.2 28.2 14.2 4.4 93.8Group 3 559.1 1.6 9.2 22.5 31.6 23.9 9.2 2.0 89.2Group 4 539.8 2.5 15.9 27.7 29.4 17.4 6.0 1.1 81.7Not in paid work 529.0 4.3 22.4 27.6 24.8 14.5 5.4 1.0 73.3Not stated (18%) 549.4 2.6 14.9 24.0 27.5 19.5 8.7 2.8 82.5
WA
Group 1 609.0 0.6 2.4 9.1 21.7 30.8 23.4 12.1 97.0Group 2 584.7 0.9 4.4 14.5 28.8 30.0 16.2 5.2 94.7Group 3 565.2 0.7 7.8 20.4 32.2 25.6 10.9 2.5 91.5Group 4 548.8 1.1 13.5 24.3 31.5 20.4 7.5 1.8 85.4Not in paid work 528.9 3.2 22.1 26.9 26.2 15.0 5.6 1.1 74.7Not stated (20%) 553.6 3.0 15.2 20.7 25.9 21.0 10.8 3.4 81.8
SA
Group 1 601.7 0.6 3.4 10.3 23.5 30.6 21.8 9.9 96.0Group 2 580.2 1.0 5.1 15.8 29.4 29.5 14.8 4.5 94.0Group 3 561.4 1.3 8.6 21.3 31.9 25.1 9.8 1.9 90.1Group 4 548.0 2.5 13.3 24.7 30.3 20.4 7.2 1.6 84.2Not in paid work 531.1 4.9 20.7 27.3 24.9 16.2 5.0 0.9 74.4Not stated (18%) 544.1 6.0 16.4 24.5 25.2 17.4 8.0 2.5 77.6
KeyGroup 1: Senior management and qualified professionalsGroup 2: Other business managers and associate professionalsGroup 3: Tradespeople, clerks, skilled office, sales and service staffGroup 4: Machine operators, hospitality staff, assistants, labourersNot in paid work: Not in paid work in the previous 12 monthsNot stated: No data was provided for parental occupation at the time of student enrolment. The higher the percentage of missing data, the less informative are the results for the other categories.
Refer to the introduction for explanatory notes.
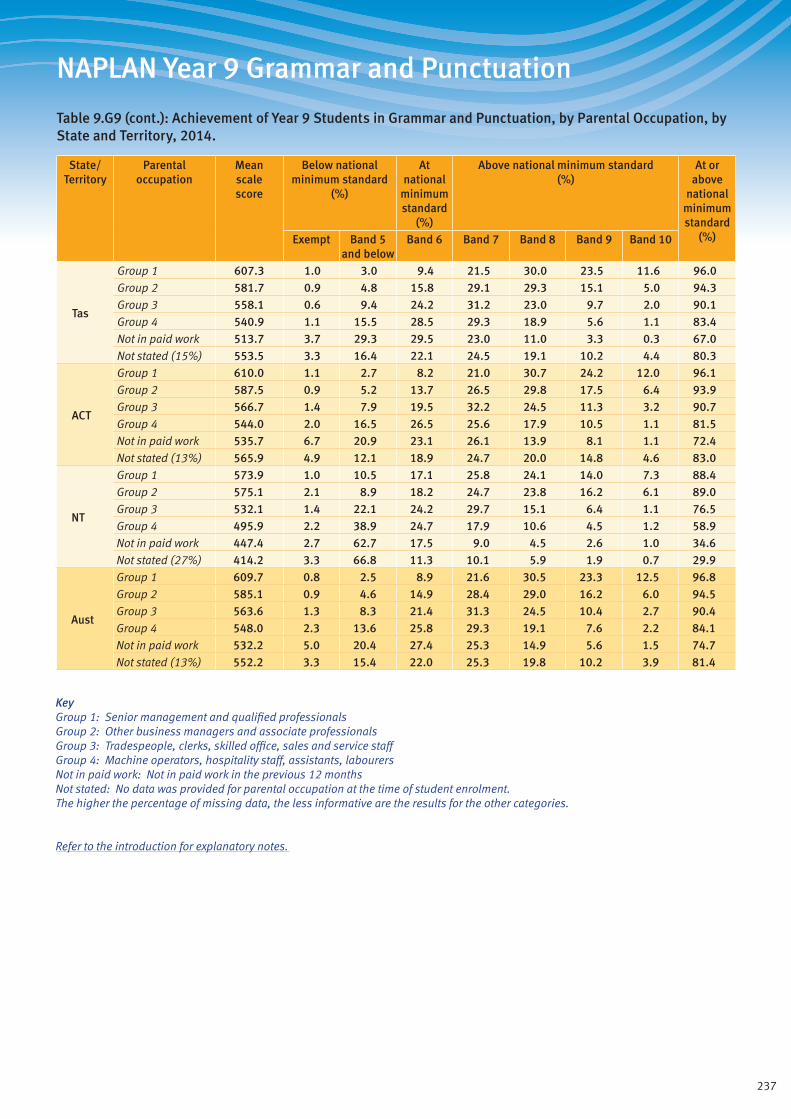
237
NAPLAN Year 9 Grammar and Punctuation
Table 9.G9 (cont.): Achievement of Year 9 Students in Grammar and Punctuation, by Parental Occupation, by State and Territory, 2014.
State/ Territory
Parental occupation
Mean scale score
Below national minimum standard
(%)
At national
minimum standard
(%)
Above national minimum standard (%)
At or above
national minimum standard
(%)Exempt Band 5 and below
Band 6 Band 7 Band 8 Band 9 Band 10
Tas
Group 1 607.3 1.0 3.0 9.4 21.5 30.0 23.5 11.6 96.0Group 2 581.7 0.9 4.8 15.8 29.1 29.3 15.1 5.0 94.3Group 3 558.1 0.6 9.4 24.2 31.2 23.0 9.7 2.0 90.1Group 4 540.9 1.1 15.5 28.5 29.3 18.9 5.6 1.1 83.4Not in paid work 513.7 3.7 29.3 29.5 23.0 11.0 3.3 0.3 67.0Not stated (15%) 553.5 3.3 16.4 22.1 24.5 19.1 10.2 4.4 80.3
ACT
Group 1 610.0 1.1 2.7 8.2 21.0 30.7 24.2 12.0 96.1Group 2 587.5 0.9 5.2 13.7 26.5 29.8 17.5 6.4 93.9Group 3 566.7 1.4 7.9 19.5 32.2 24.5 11.3 3.2 90.7Group 4 544.0 2.0 16.5 26.5 25.6 17.9 10.5 1.1 81.5Not in paid work 535.7 6.7 20.9 23.1 26.1 13.9 8.1 1.1 72.4Not stated (13%) 565.9 4.9 12.1 18.9 24.7 20.0 14.8 4.6 83.0
NT
Group 1 573.9 1.0 10.5 17.1 25.8 24.1 14.0 7.3 88.4Group 2 575.1 2.1 8.9 18.2 24.7 23.8 16.2 6.1 89.0Group 3 532.1 1.4 22.1 24.2 29.7 15.1 6.4 1.1 76.5Group 4 495.9 2.2 38.9 24.7 17.9 10.6 4.5 1.2 58.9Not in paid work 447.4 2.7 62.7 17.5 9.0 4.5 2.6 1.0 34.6Not stated (27%) 414.2 3.3 66.8 11.3 10.1 5.9 1.9 0.7 29.9
Aust
Group 1 609.7 0.8 2.5 8.9 21.6 30.5 23.3 12.5 96.8Group 2 585.1 0.9 4.6 14.9 28.4 29.0 16.2 6.0 94.5Group 3 563.6 1.3 8.3 21.4 31.3 24.5 10.4 2.7 90.4Group 4 548.0 2.3 13.6 25.8 29.3 19.1 7.6 2.2 84.1Not in paid work 532.2 5.0 20.4 27.4 25.3 14.9 5.6 1.5 74.7Not stated (13%) 552.2 3.3 15.4 22.0 25.3 19.8 10.2 3.9 81.4
KeyGroup 1: Senior management and qualified professionalsGroup 2: Other business managers and associate professionalsGroup 3: Tradespeople, clerks, skilled office, sales and service staffGroup 4: Machine operators, hospitality staff, assistants, labourersNot in paid work: Not in paid work in the previous 12 monthsNot stated: No data was provided for parental occupation at the time of student enrolment. The higher the percentage of missing data, the less informative are the results for the other categories.
Refer to the introduction for explanatory notes.
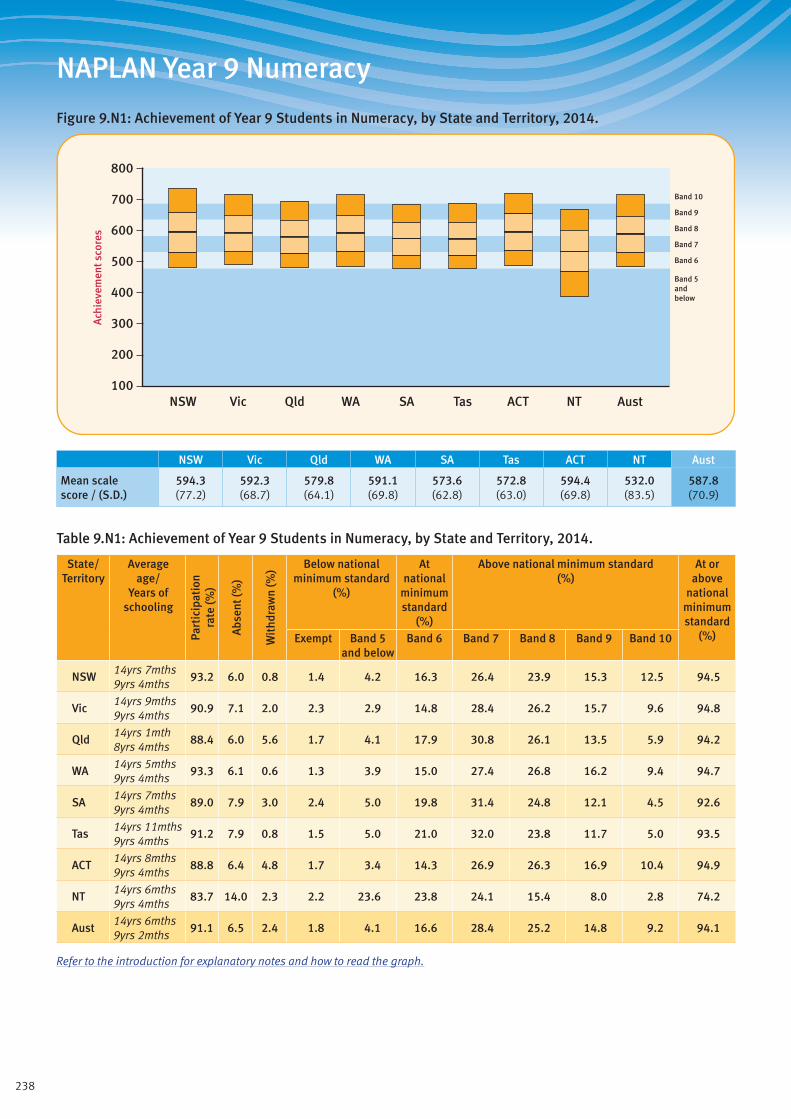
238
NAPLAN Year 9 Numeracy
Figure 9.N1: Achievement of Year 9 Students in Numeracy, by State and Territory, 2014.
Band 5andbelow
Band 6
Band 7
Band 8
Band 9
Band 10
800
700
500
600
400
300
100
200
Ach
ieve
men
t sco
res
ACTQld SAWA TasVicNSW NT Aust
NSW Vic Qld WA SA Tas ACT NT Aust
Mean scale score / (S.D.)
594.3 (77.2)
592.3 (68.7)
579.8 (64.1)
591.1 (69.8)
573.6 (62.8)
572.8 (63.0)
594.4 (69.8)
532.0 (83.5)
587.8 (70.9)
Table 9.N1: Achievement of Year 9 Students in Numeracy, by State and Territory, 2014.
State/ Territory
Average age/
Years of schooling
Part
icip
atio
nra
te (%
)
Abs
ent (
%)
Wit
hdra
wn
(%) Below national
minimum standard (%)
At national
minimum standard
(%)
Above national minimum standard (%)
At or above
national minimum standard
(%)Exempt Band 5 and below
Band 6 Band 7 Band 8 Band 9 Band 10
NSW14yrs 7mths 9yrs 4mths
93.2 6.0 0.8 1.4 4.2 16.3 26.4 23.9 15.3 12.5 94.5
Vic14yrs 9mths 9yrs 4mths
90.9 7.1 2.0 2.3 2.9 14.8 28.4 26.2 15.7 9.6 94.8
Qld14yrs 1mth 8yrs 4mths
88.4 6.0 5.6 1.7 4.1 17.9 30.8 26.1 13.5 5.9 94.2
WA14yrs 5mths 9yrs 4mths
93.3 6.1 0.6 1.3 3.9 15.0 27.4 26.8 16.2 9.4 94.7
SA14yrs 7mths 9yrs 4mths
89.0 7.9 3.0 2.4 5.0 19.8 31.4 24.8 12.1 4.5 92.6
Tas14yrs 11mths 9yrs 4mths
91.2 7.9 0.8 1.5 5.0 21.0 32.0 23.8 11.7 5.0 93.5
ACT14yrs 8mths 9yrs 4mths
88.8 6.4 4.8 1.7 3.4 14.3 26.9 26.3 16.9 10.4 94.9
NT14yrs 6mths 9yrs 4mths
83.7 14.0 2.3 2.2 23.6 23.8 24.1 15.4 8.0 2.8 74.2
Aust14yrs 6mths 9yrs 2mths
91.1 6.5 2.4 1.8 4.1 16.6 28.4 25.2 14.8 9.2 94.1
Refer to the introduction for explanatory notes and how to read the graph.
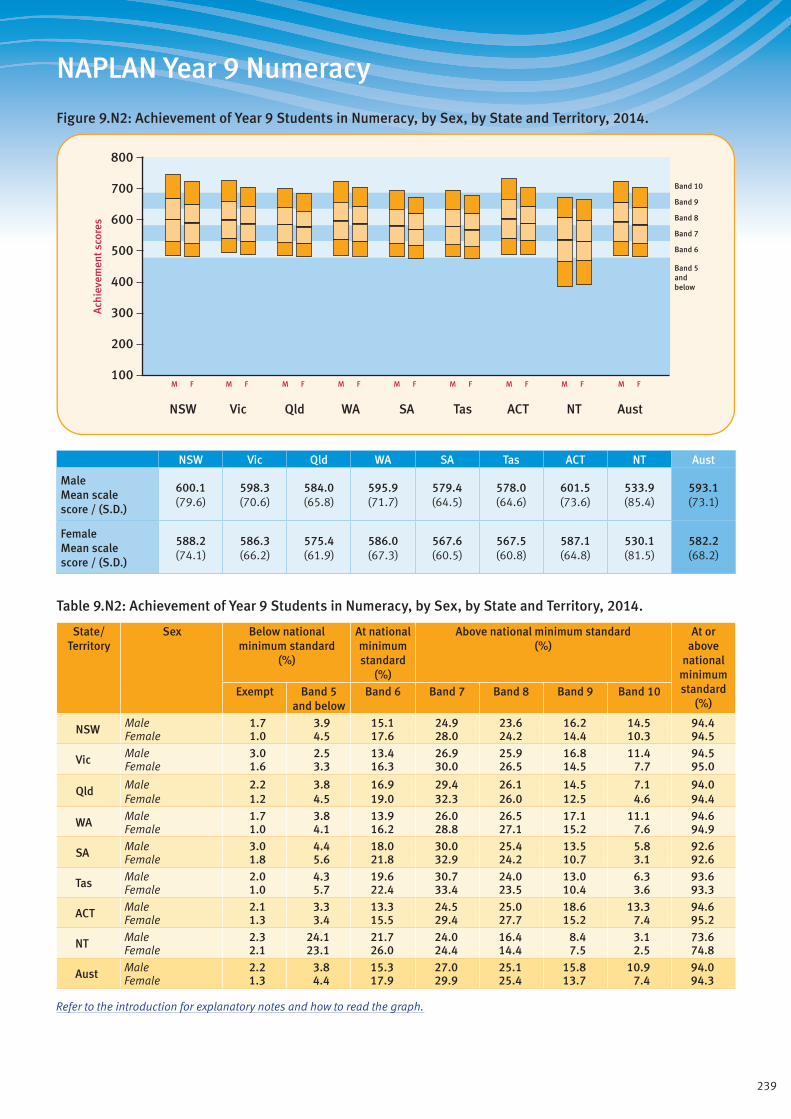
239
NAPLAN Year 9 Numeracy
Figure 9.N2: Achievement of Year 9 Students in Numeracy, by Sex, by State and Territory, 2014.
Band 5andbelow
Band 6
Band 7
Band 8
Band 9
Band 10
ACTQld SAWA TasVicNSW NT Aust
M F M F M F M F M F M F M F M F M F
800
700
500
600
400
300
100
200
Ach
ieve
men
t sco
res
NSW Vic Qld WA SA Tas ACT NT Aust
Male Mean scale score / (S.D.)
600.1 (79.6)
598.3 (70.6)
584.0 (65.8)
595.9 (71.7)
579.4 (64.5)
578.0 (64.6)
601.5 (73.6)
533.9 (85.4)
593.1 (73.1)
Female Mean scale score / (S.D.)
588.2 (74.1)
586.3 (66.2)
575.4 (61.9)
586.0 (67.3)
567.6 (60.5)
567.5 (60.8)
587.1 (64.8)
530.1 (81.5)
582.2 (68.2)
Table 9.N2: Achievement of Year 9 Students in Numeracy, by Sex, by State and Territory, 2014.
State/ Territory
Sex Below national minimum standard
(%)
At national minimum standard
(%)
Above national minimum standard (%)
At or above
national minimum standard
(%)Exempt Band 5
and belowBand 6 Band 7 Band 8 Band 9 Band 10
NSW Male 1.7 3.9 15.1 24.9 23.6 16.2 14.5 94.4Female 1.0 4.5 17.6 28.0 24.2 14.4 10.3 94.5
Vic Male 3.0 2.5 13.4 26.9 25.9 16.8 11.4 94.5Female 1.6 3.3 16.3 30.0 26.5 14.5 7.7 95.0
Qld Male 2.2 3.8 16.9 29.4 26.1 14.5 7.1 94.0Female 1.2 4.5 19.0 32.3 26.0 12.5 4.6 94.4
WA Male 1.7 3.8 13.9 26.0 26.5 17.1 11.1 94.6Female 1.0 4.1 16.2 28.8 27.1 15.2 7.6 94.9
SA Male 3.0 4.4 18.0 30.0 25.4 13.5 5.8 92.6Female 1.8 5.6 21.8 32.9 24.2 10.7 3.1 92.6
Tas Male 2.0 4.3 19.6 30.7 24.0 13.0 6.3 93.6Female 1.0 5.7 22.4 33.4 23.5 10.4 3.6 93.3
ACT Male 2.1 3.3 13.3 24.5 25.0 18.6 13.3 94.6Female 1.3 3.4 15.5 29.4 27.7 15.2 7.4 95.2
NT Male 2.3 24.1 21.7 24.0 16.4 8.4 3.1 73.6Female 2.1 23.1 26.0 24.4 14.4 7.5 2.5 74.8
Aust Male 2.2 3.8 15.3 27.0 25.1 15.8 10.9 94.0Female 1.3 4.4 17.9 29.9 25.4 13.7 7.4 94.3
Refer to the introduction for explanatory notes and how to read the graph.

240
NAPLAN Year 9 Numeracy
Figure 9.N3: Achievement of Year 9 Students in Numeracy, by Indigenous Status, by State and Territory, 2014.
Band 5andbelow
Band 6
Band 7
Band 8
Band 9
Band 10
ACTQld SAWA TasVicNSW NT Aust
800
700
500
600
400
300
100
200
Ach
ieve
men
t sco
res
Indig. Non-Indig.
Indig. Non-Indig.
Indig. Non-Indig.
Indig. Non-Indig.
Indig. Non-Indig.
Indig. Non-Indig.
Indig. Non-Indig.
Indig. Non-Indig.
Indig. Non-Indig.
NSW Vic Qld WA SA Tas ACT NT Aust
Indigenous Mean scale score / (S.D.)
531.5 (62.2)
538.3 (57.6)
525.6 (57.4)
518.0 (65.6)
513.8 (54.7)
541.2 (55.8)
535.6 (58.2)
467.6 (70.4)
522.8 (63.4)
Non-Indigenous Mean scale score / (S.D.)
598.0 (76.5)
593.2 (68.5)
583.7 (62.6)
596.5 (67.2)
576.3 (61.6)
575.0 (62.0)
596.2 (69.3)
569.2 (60.2)
591.4 (69.6)
Table 9.N3: Achievement of Year 9 Students in Numeracy, by Indigenous Status, by State and Territory, 2014.
State/ Territory
Indigenous status
Below national minimum standard
(%)
At national minimum standard
(%)
Above national minimum standard (%)
At or above
national minimum standard
(%)Exempt Band 5
and belowBand 6 Band 7 Band 8 Band 9 Band 10
NSW Indigenous 2.4 16.5 34.5 28.1 12.8 4.5 1.3 81.1Non-Indigenous 1.3 3.5 15.3 26.3 24.6 15.9 13.2 95.3
Vic Indigenous 4.7 11.9 32.8 30.1 14.8 4.6 1.0 83.3Non-Indigenous 2.2 2.8 14.5 28.4 26.4 15.9 9.7 95.0
Qld Indigenous 3.1 19.1 34.9 27.4 11.4 3.6 0.5 77.8Non-Indigenous 1.6 3.0 16.6 31.1 27.2 14.2 6.2 95.4
WA Indigenous 1.4 24.4 34.5 24.5 10.8 3.5 0.8 74.2Non-Indigenous 1.2 2.5 13.6 27.5 28.0 17.2 10.1 96.4
SA Indigenous 3.3 23.4 38.5 24.7 8.1 1.8 0.1 73.2Non-Indigenous 2.3 4.1 19.0 31.7 25.7 12.7 4.6 93.6
Tas Indigenous 2.4 11.4 32.3 32.4 16.4 3.9 1.2 86.2Non-Indigenous 1.3 4.4 20.0 32.4 24.6 12.3 5.0 94.3
ACT Indigenous 2.3 14.9 29.2 35.2 15.4 2.0 0.9 82.8Non-Indigenous 1.7 3.0 13.9 26.7 26.7 17.4 10.7 95.3
NT Indigenous 2.3 53.6 28.3 11.2 3.5 1.1 0.0 44.1Non-Indigenous 2.3 4.6 22.1 33.5 23.0 11.0 3.6 93.1
Aust Indigenous 2.7 21.1 34.1 26.3 11.4 3.6 0.8 76.2Non-Indigenous 1.7 3.1 15.6 28.5 26.0 15.4 9.6 95.2
Refer to the introduction for explanatory notes and how to read the graph.

241
NAPLAN Year 9 Numeracy
Figure 9.N4: Achievement of Year 9 Students in Numeracy, by LBOTE Status, by State and Territory, 2014.
Band 5andbelow
Band 6
Band 7
Band 8
Band 9
Band 10
ACTQld SAWA TasVicNSW NT Aust
800
700
500
600
400
300
100
200
Ach
ieve
men
t sco
res
LBOTE Non-LBOTE
LBOTE Non-LBOTE
LBOTE Non-LBOTE
LBOTE Non-LBOTE
LBOTE Non-LBOTE
LBOTE Non-LBOTE
LBOTE Non-LBOTE
LBOTE Non-LBOTE
LBOTE Non-LBOTE
NSW Vic Qld WA SA Tas ACT NT Aust
LBOTE Mean scale score / (S.D.)
613.7 (87.8)
602.5 (77.3)
583.1 (74.7)
599.7 (77.5)
575.8 (71.2)
579.0 (69.1)
599.9 (74.1)
482.6 (87.5)
601.4 (83.6)
Non-LBOTE Mean scale score / (S.D.)
586.3 (71.1)
589.0 (65.3)
579.4 (62.4)
594.2 (67.1)
573.4 (61.2)
571.1 (61.8)
593.2 (68.7)
555.0 (67.2)
584.3 (66.5)
Table 9.N4: Achievement of Year 9 Students in Numeracy, by LBOTE Status, by State and Territory, 2014.
State/ Territory
LBOTE status
Below national minimum standard
(%)
At national minimum standard
(%)
Above national minimum standard (%)
At or above
national minimum standard
(%)Exempt Band 5
and belowBand 6 Band 7 Band 8 Band 9 Band 10
NSW LBOTE 1.7 3.2 14.3 22.8 21.2 15.8 21.0 95.1Non-LBOTE 1.2 4.6 17.2 27.9 25.0 15.0 9.0 94.1
Vic LBOTE 2.9 2.9 14.5 25.1 22.9 16.7 14.9 94.1Non-LBOTE 2.1 2.9 14.9 29.6 27.2 15.4 7.9 95.0
Qld LBOTE 2.2 6.5 18.5 25.9 22.5 14.7 9.6 91.2Non-LBOTE 1.6 3.8 17.8 31.5 26.6 13.3 5.3 94.6
WA LBOTE 1.3 4.2 14.3 24.3 24.7 17.1 14.2 94.4Non-LBOTE 1.1 3.1 13.6 27.6 28.3 17.1 9.2 95.9
SA LBOTE 6.2 6.6 19.6 26.4 21.0 13.2 6.8 87.1Non-LBOTE 1.8 4.6 19.8 32.2 25.5 12.0 4.0 93.6
Tas LBOTE 4.9 7.4 15.8 27.5 23.9 13.7 6.7 87.7Non-LBOTE 1.4 5.0 21.6 32.7 23.7 11.3 4.5 93.7
ACT LBOTE 3.4 3.1 14.4 24.0 24.7 16.9 13.5 93.5Non-LBOTE 1.3 3.4 14.3 27.6 26.8 17.0 9.7 95.3
NT LBOTE 3.0 48.3 22.1 14.4 7.8 3.4 1.1 48.7Non-LBOTE 1.9 10.9 25.3 30.4 18.8 9.3 3.3 87.1
Aust LBOTE 2.3 4.5 15.3 24.0 22.0 15.7 16.1 93.2Non-LBOTE 1.6 3.9 16.9 29.7 26.2 14.5 7.3 94.5
Refer to the introduction for explanatory notes and how to read the graph.
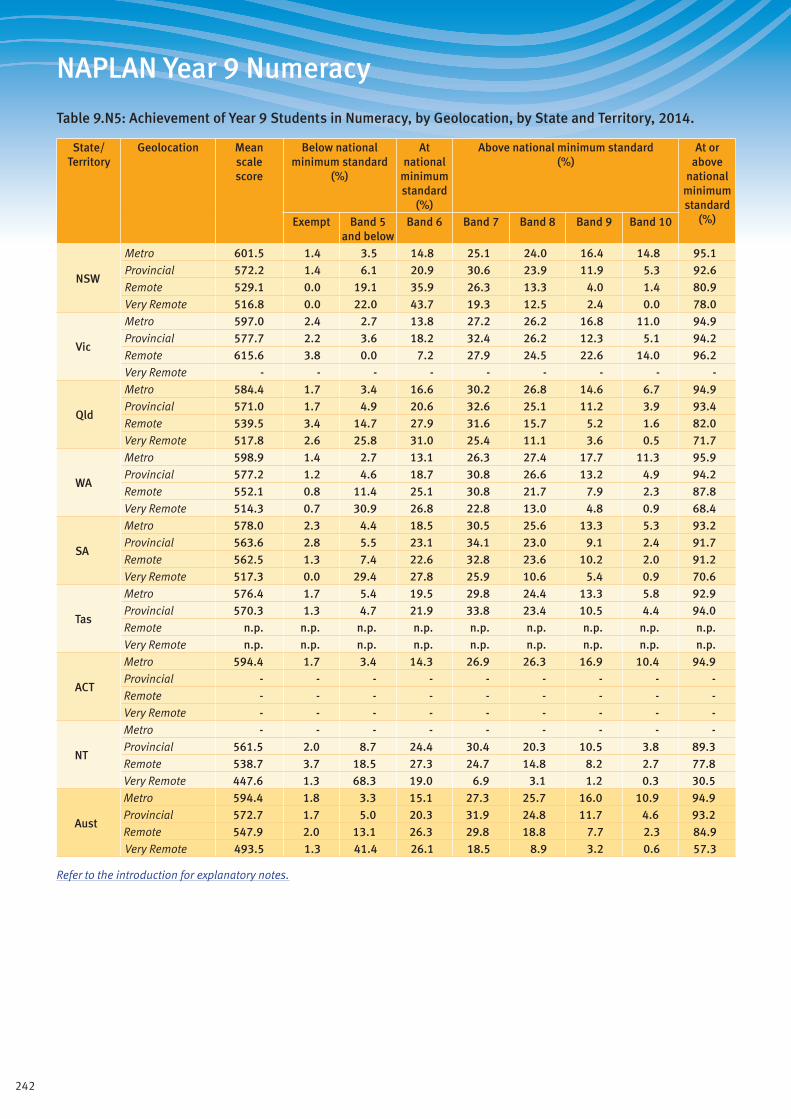
242
NAPLAN Year 9 Numeracy
Table 9.N5: Achievement of Year 9 Students in Numeracy, by Geolocation, by State and Territory, 2014.
State/ Territory
Geolocation Mean scale score
Below national minimum standard
(%)
At national
minimum standard
(%)
Above national minimum standard (%)
At or above
national minimum standard
(%)Exempt Band 5 and below
Band 6 Band 7 Band 8 Band 9 Band 10
NSW
Metro 601.5 1.4 3.5 14.8 25.1 24.0 16.4 14.8 95.1Provincial 572.2 1.4 6.1 20.9 30.6 23.9 11.9 5.3 92.6Remote 529.1 0.0 19.1 35.9 26.3 13.3 4.0 1.4 80.9Very Remote 516.8 0.0 22.0 43.7 19.3 12.5 2.4 0.0 78.0
Vic
Metro 597.0 2.4 2.7 13.8 27.2 26.2 16.8 11.0 94.9Provincial 577.7 2.2 3.6 18.2 32.4 26.2 12.3 5.1 94.2Remote 615.6 3.8 0.0 7.2 27.9 24.5 22.6 14.0 96.2Very Remote - - - - - - - - -
Qld
Metro 584.4 1.7 3.4 16.6 30.2 26.8 14.6 6.7 94.9Provincial 571.0 1.7 4.9 20.6 32.6 25.1 11.2 3.9 93.4Remote 539.5 3.4 14.7 27.9 31.6 15.7 5.2 1.6 82.0Very Remote 517.8 2.6 25.8 31.0 25.4 11.1 3.6 0.5 71.7
WA
Metro 598.9 1.4 2.7 13.1 26.3 27.4 17.7 11.3 95.9Provincial 577.2 1.2 4.6 18.7 30.8 26.6 13.2 4.9 94.2Remote 552.1 0.8 11.4 25.1 30.8 21.7 7.9 2.3 87.8Very Remote 514.3 0.7 30.9 26.8 22.8 13.0 4.8 0.9 68.4
SA
Metro 578.0 2.3 4.4 18.5 30.5 25.6 13.3 5.3 93.2Provincial 563.6 2.8 5.5 23.1 34.1 23.0 9.1 2.4 91.7Remote 562.5 1.3 7.4 22.6 32.8 23.6 10.2 2.0 91.2Very Remote 517.3 0.0 29.4 27.8 25.9 10.6 5.4 0.9 70.6
Tas
Metro 576.4 1.7 5.4 19.5 29.8 24.4 13.3 5.8 92.9Provincial 570.3 1.3 4.7 21.9 33.8 23.4 10.5 4.4 94.0Remote n.p. n.p. n.p. n.p. n.p. n.p. n.p. n.p. n.p.Very Remote n.p. n.p. n.p. n.p. n.p. n.p. n.p. n.p. n.p.
ACT
Metro 594.4 1.7 3.4 14.3 26.9 26.3 16.9 10.4 94.9Provincial - - - - - - - - -Remote - - - - - - - - -Very Remote - - - - - - - - -
NT
Metro - - - - - - - - -Provincial 561.5 2.0 8.7 24.4 30.4 20.3 10.5 3.8 89.3Remote 538.7 3.7 18.5 27.3 24.7 14.8 8.2 2.7 77.8Very Remote 447.6 1.3 68.3 19.0 6.9 3.1 1.2 0.3 30.5
Aust
Metro 594.4 1.8 3.3 15.1 27.3 25.7 16.0 10.9 94.9Provincial 572.7 1.7 5.0 20.3 31.9 24.8 11.7 4.6 93.2Remote 547.9 2.0 13.1 26.3 29.8 18.8 7.7 2.3 84.9Very Remote 493.5 1.3 41.4 26.1 18.5 8.9 3.2 0.6 57.3
Refer to the introduction for explanatory notes.
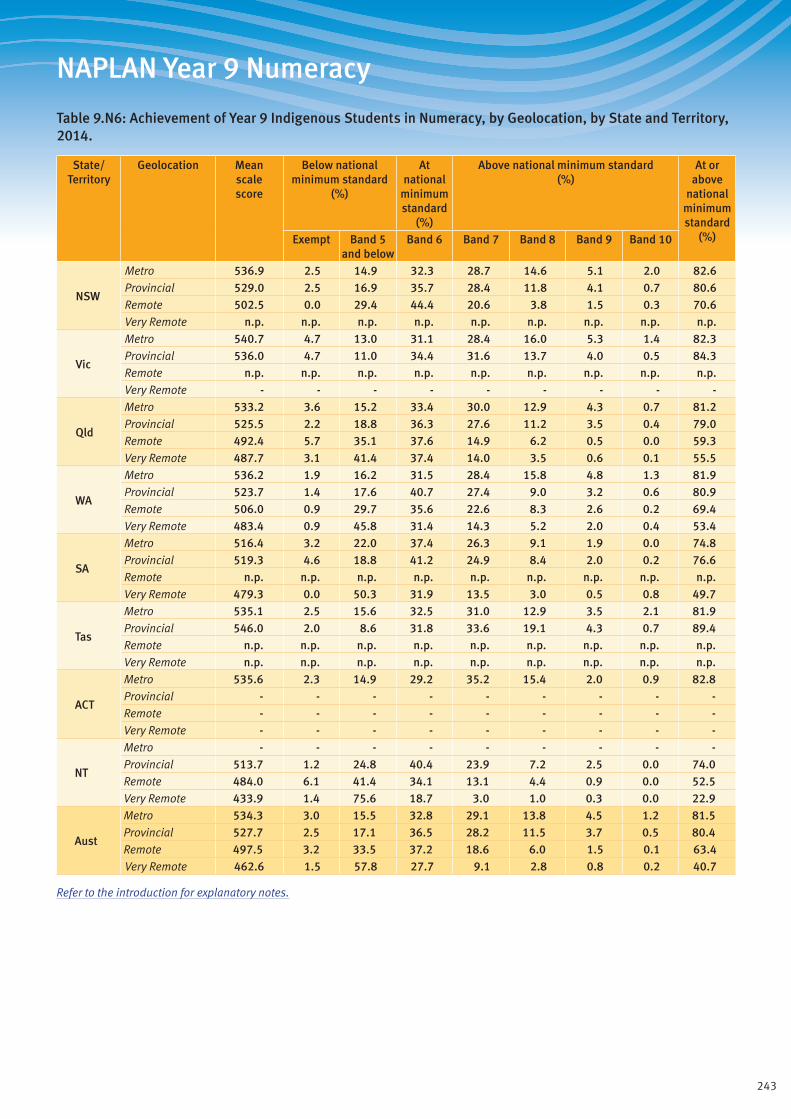
243
NAPLAN Year 9 Numeracy
Table 9.N6: Achievement of Year 9 Indigenous Students in Numeracy, by Geolocation, by State and Territory, 2014.
State/ Territory
Geolocation Mean scale score
Below national minimum standard
(%)
At national
minimum standard
(%)
Above national minimum standard (%)
At or above
national minimum standard
(%)Exempt Band 5 and below
Band 6 Band 7 Band 8 Band 9 Band 10
NSW
Metro 536.9 2.5 14.9 32.3 28.7 14.6 5.1 2.0 82.6Provincial 529.0 2.5 16.9 35.7 28.4 11.8 4.1 0.7 80.6Remote 502.5 0.0 29.4 44.4 20.6 3.8 1.5 0.3 70.6Very Remote n.p. n.p. n.p. n.p. n.p. n.p. n.p. n.p. n.p.
Vic
Metro 540.7 4.7 13.0 31.1 28.4 16.0 5.3 1.4 82.3Provincial 536.0 4.7 11.0 34.4 31.6 13.7 4.0 0.5 84.3Remote n.p. n.p. n.p. n.p. n.p. n.p. n.p. n.p. n.p.Very Remote - - - - - - - - -
Qld
Metro 533.2 3.6 15.2 33.4 30.0 12.9 4.3 0.7 81.2Provincial 525.5 2.2 18.8 36.3 27.6 11.2 3.5 0.4 79.0Remote 492.4 5.7 35.1 37.6 14.9 6.2 0.5 0.0 59.3Very Remote 487.7 3.1 41.4 37.4 14.0 3.5 0.6 0.1 55.5
WA
Metro 536.2 1.9 16.2 31.5 28.4 15.8 4.8 1.3 81.9Provincial 523.7 1.4 17.6 40.7 27.4 9.0 3.2 0.6 80.9Remote 506.0 0.9 29.7 35.6 22.6 8.3 2.6 0.2 69.4Very Remote 483.4 0.9 45.8 31.4 14.3 5.2 2.0 0.4 53.4
SA
Metro 516.4 3.2 22.0 37.4 26.3 9.1 1.9 0.0 74.8Provincial 519.3 4.6 18.8 41.2 24.9 8.4 2.0 0.2 76.6Remote n.p. n.p. n.p. n.p. n.p. n.p. n.p. n.p. n.p.Very Remote 479.3 0.0 50.3 31.9 13.5 3.0 0.5 0.8 49.7
Tas
Metro 535.1 2.5 15.6 32.5 31.0 12.9 3.5 2.1 81.9Provincial 546.0 2.0 8.6 31.8 33.6 19.1 4.3 0.7 89.4Remote n.p. n.p. n.p. n.p. n.p. n.p. n.p. n.p. n.p.Very Remote n.p. n.p. n.p. n.p. n.p. n.p. n.p. n.p. n.p.
ACT
Metro 535.6 2.3 14.9 29.2 35.2 15.4 2.0 0.9 82.8Provincial - - - - - - - - -Remote - - - - - - - - -Very Remote - - - - - - - - -
NT
Metro - - - - - - - - -Provincial 513.7 1.2 24.8 40.4 23.9 7.2 2.5 0.0 74.0Remote 484.0 6.1 41.4 34.1 13.1 4.4 0.9 0.0 52.5Very Remote 433.9 1.4 75.6 18.7 3.0 1.0 0.3 0.0 22.9
Aust
Metro 534.3 3.0 15.5 32.8 29.1 13.8 4.5 1.2 81.5Provincial 527.7 2.5 17.1 36.5 28.2 11.5 3.7 0.5 80.4Remote 497.5 3.2 33.5 37.2 18.6 6.0 1.5 0.1 63.4Very Remote 462.6 1.5 57.8 27.7 9.1 2.8 0.8 0.2 40.7
Refer to the introduction for explanatory notes.
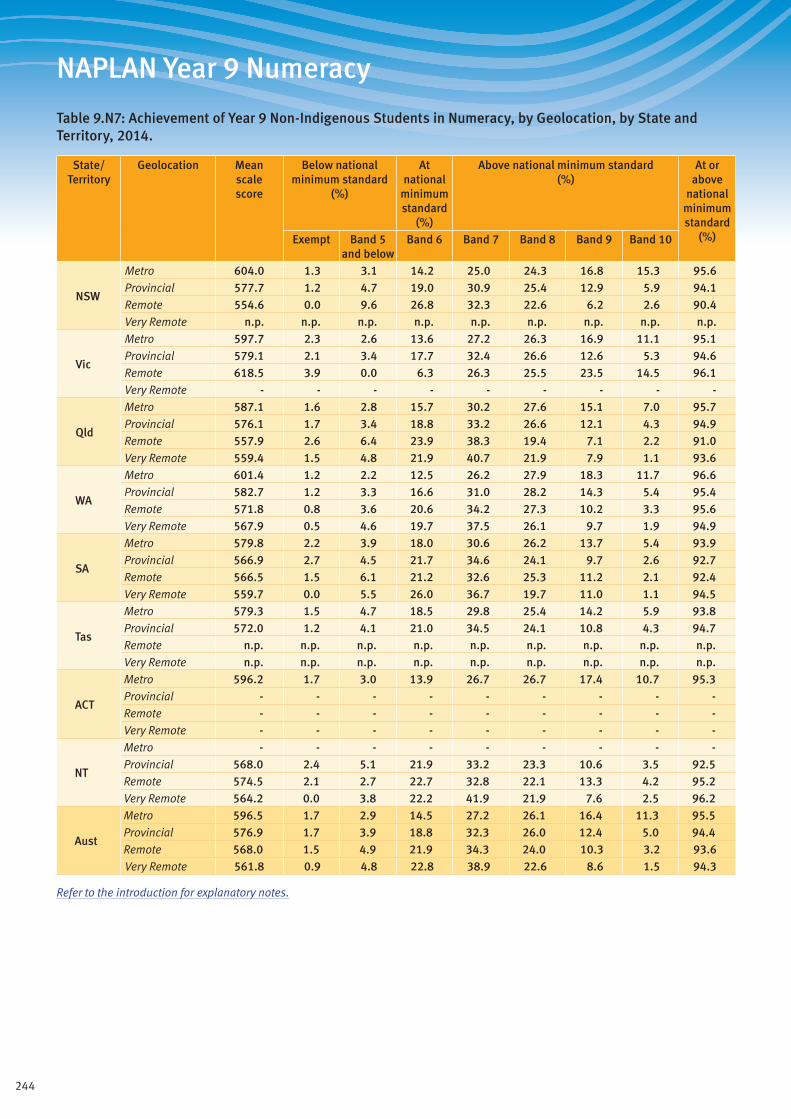
244
NAPLAN Year 9 Numeracy
Table 9.N7: Achievement of Year 9 Non-Indigenous Students in Numeracy, by Geolocation, by State and Territory, 2014.
State/ Territory
Geolocation Mean scale score
Below national minimum standard
(%)
At national
minimum standard
(%)
Above national minimum standard (%)
At or above
national minimum standard
(%)Exempt Band 5 and below
Band 6 Band 7 Band 8 Band 9 Band 10
NSW
Metro 604.0 1.3 3.1 14.2 25.0 24.3 16.8 15.3 95.6Provincial 577.7 1.2 4.7 19.0 30.9 25.4 12.9 5.9 94.1Remote 554.6 0.0 9.6 26.8 32.3 22.6 6.2 2.6 90.4Very Remote n.p. n.p. n.p. n.p. n.p. n.p. n.p. n.p. n.p.
Vic
Metro 597.7 2.3 2.6 13.6 27.2 26.3 16.9 11.1 95.1Provincial 579.1 2.1 3.4 17.7 32.4 26.6 12.6 5.3 94.6Remote 618.5 3.9 0.0 6.3 26.3 25.5 23.5 14.5 96.1Very Remote - - - - - - - - -
Qld
Metro 587.1 1.6 2.8 15.7 30.2 27.6 15.1 7.0 95.7Provincial 576.1 1.7 3.4 18.8 33.2 26.6 12.1 4.3 94.9Remote 557.9 2.6 6.4 23.9 38.3 19.4 7.1 2.2 91.0Very Remote 559.4 1.5 4.8 21.9 40.7 21.9 7.9 1.1 93.6
WA
Metro 601.4 1.2 2.2 12.5 26.2 27.9 18.3 11.7 96.6Provincial 582.7 1.2 3.3 16.6 31.0 28.2 14.3 5.4 95.4Remote 571.8 0.8 3.6 20.6 34.2 27.3 10.2 3.3 95.6Very Remote 567.9 0.5 4.6 19.7 37.5 26.1 9.7 1.9 94.9
SA
Metro 579.8 2.2 3.9 18.0 30.6 26.2 13.7 5.4 93.9Provincial 566.9 2.7 4.5 21.7 34.6 24.1 9.7 2.6 92.7Remote 566.5 1.5 6.1 21.2 32.6 25.3 11.2 2.1 92.4Very Remote 559.7 0.0 5.5 26.0 36.7 19.7 11.0 1.1 94.5
Tas
Metro 579.3 1.5 4.7 18.5 29.8 25.4 14.2 5.9 93.8Provincial 572.0 1.2 4.1 21.0 34.5 24.1 10.8 4.3 94.7Remote n.p. n.p. n.p. n.p. n.p. n.p. n.p. n.p. n.p.Very Remote n.p. n.p. n.p. n.p. n.p. n.p. n.p. n.p. n.p.
ACT
Metro 596.2 1.7 3.0 13.9 26.7 26.7 17.4 10.7 95.3Provincial - - - - - - - - -Remote - - - - - - - - -Very Remote - - - - - - - - -
NT
Metro - - - - - - - - -Provincial 568.0 2.4 5.1 21.9 33.2 23.3 10.6 3.5 92.5Remote 574.5 2.1 2.7 22.7 32.8 22.1 13.3 4.2 95.2Very Remote 564.2 0.0 3.8 22.2 41.9 21.9 7.6 2.5 96.2
Aust
Metro 596.5 1.7 2.9 14.5 27.2 26.1 16.4 11.3 95.5Provincial 576.9 1.7 3.9 18.8 32.3 26.0 12.4 5.0 94.4Remote 568.0 1.5 4.9 21.9 34.3 24.0 10.3 3.2 93.6Very Remote 561.8 0.9 4.8 22.8 38.9 22.6 8.6 1.5 94.3
Refer to the introduction for explanatory notes.
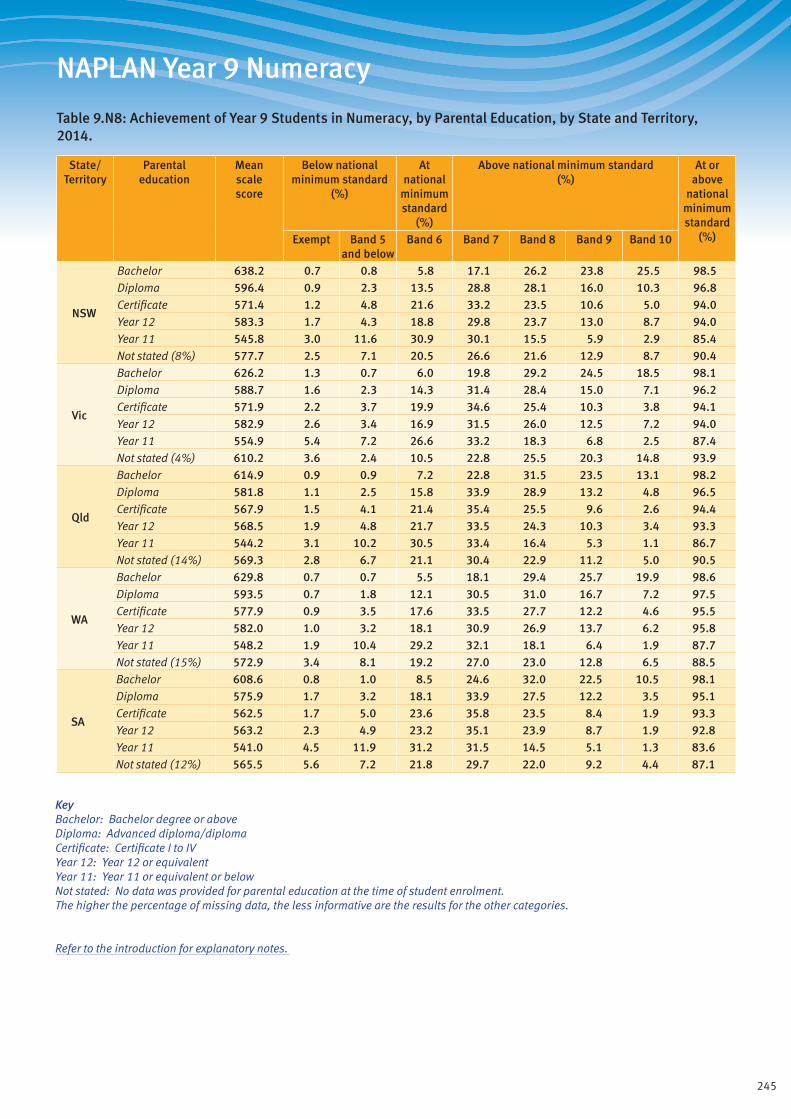
245
NAPLAN Year 9 Numeracy
Table 9.N8: Achievement of Year 9 Students in Numeracy, by Parental Education, by State and Territory, 2014.
State/ Territory
Parental education
Mean scale score
Below national minimum standard
(%)
At national
minimum standard
(%)
Above national minimum standard (%)
At or above
national minimum standard
(%)Exempt Band 5 and below
Band 6 Band 7 Band 8 Band 9 Band 10
NSW
Bachelor 638.2 0.7 0.8 5.8 17.1 26.2 23.8 25.5 98.5Diploma 596.4 0.9 2.3 13.5 28.8 28.1 16.0 10.3 96.8Certificate 571.4 1.2 4.8 21.6 33.2 23.5 10.6 5.0 94.0Year 12 583.3 1.7 4.3 18.8 29.8 23.7 13.0 8.7 94.0Year 11 545.8 3.0 11.6 30.9 30.1 15.5 5.9 2.9 85.4Not stated (8%) 577.7 2.5 7.1 20.5 26.6 21.6 12.9 8.7 90.4
Vic
Bachelor 626.2 1.3 0.7 6.0 19.8 29.2 24.5 18.5 98.1Diploma 588.7 1.6 2.3 14.3 31.4 28.4 15.0 7.1 96.2Certificate 571.9 2.2 3.7 19.9 34.6 25.4 10.3 3.8 94.1Year 12 582.9 2.6 3.4 16.9 31.5 26.0 12.5 7.2 94.0Year 11 554.9 5.4 7.2 26.6 33.2 18.3 6.8 2.5 87.4Not stated (4%) 610.2 3.6 2.4 10.5 22.8 25.5 20.3 14.8 93.9
Qld
Bachelor 614.9 0.9 0.9 7.2 22.8 31.5 23.5 13.1 98.2Diploma 581.8 1.1 2.5 15.8 33.9 28.9 13.2 4.8 96.5Certificate 567.9 1.5 4.1 21.4 35.4 25.5 9.6 2.6 94.4Year 12 568.5 1.9 4.8 21.7 33.5 24.3 10.3 3.4 93.3Year 11 544.2 3.1 10.2 30.5 33.4 16.4 5.3 1.1 86.7Not stated (14%) 569.3 2.8 6.7 21.1 30.4 22.9 11.2 5.0 90.5
WA
Bachelor 629.8 0.7 0.7 5.5 18.1 29.4 25.7 19.9 98.6Diploma 593.5 0.7 1.8 12.1 30.5 31.0 16.7 7.2 97.5Certificate 577.9 0.9 3.5 17.6 33.5 27.7 12.2 4.6 95.5Year 12 582.0 1.0 3.2 18.1 30.9 26.9 13.7 6.2 95.8Year 11 548.2 1.9 10.4 29.2 32.1 18.1 6.4 1.9 87.7Not stated (15%) 572.9 3.4 8.1 19.2 27.0 23.0 12.8 6.5 88.5
SA
Bachelor 608.6 0.8 1.0 8.5 24.6 32.0 22.5 10.5 98.1Diploma 575.9 1.7 3.2 18.1 33.9 27.5 12.2 3.5 95.1Certificate 562.5 1.7 5.0 23.6 35.8 23.5 8.4 1.9 93.3Year 12 563.2 2.3 4.9 23.2 35.1 23.9 8.7 1.9 92.8Year 11 541.0 4.5 11.9 31.2 31.5 14.5 5.1 1.3 83.6Not stated (12%) 565.5 5.6 7.2 21.8 29.7 22.0 9.2 4.4 87.1
KeyBachelor: Bachelor degree or aboveDiploma: Advanced diploma/diplomaCertificate: Certificate I to IVYear 12: Year 12 or equivalentYear 11: Year 11 or equivalent or belowNot stated: No data was provided for parental education at the time of student enrolment. The higher the percentage of missing data, the less informative are the results for the other categories.
Refer to the introduction for explanatory notes.

246
NAPLAN Year 9 Numeracy
Table 9.N8 (cont.): Achievement of Year 9 Students in Numeracy, by Parental Education, by State and Territory, 2014.
State/ Territory
Parental education
Mean scale score
Below national minimum standard
(%)
At national
minimum standard
(%)
Above national minimum standard (%)
At or above
national minimum standard
(%)Exempt Band 5 and below
Band 6 Band 7 Band 8 Band 9 Band 10
Tas
Bachelor 614.7 0.7 0.8 6.4 24.0 31.6 23.7 12.7 98.5Diploma 588.0 1.1 1.8 13.3 32.1 31.2 14.9 5.5 97.1Certificate 564.7 1.1 4.2 23.5 36.4 23.6 8.7 2.5 94.7Year 12 565.0 1.1 7.5 24.2 31.0 22.8 9.2 4.2 91.4Year 11 539.4 2.1 10.6 34.2 34.5 13.7 4.1 0.9 87.2Not stated (11%) 570.3 3.5 6.7 21.4 29.8 21.7 11.3 5.5 89.8
ACT
Bachelor 621.0 1.1 0.9 6.8 21.2 29.4 24.0 16.6 97.9Diploma 579.2 0.9 3.1 18.8 32.3 26.6 12.4 5.9 96.0Certificate 560.5 1.4 6.1 24.6 35.6 21.6 8.2 2.5 92.5Year 12 574.1 1.9 5.0 19.1 31.1 25.7 11.9 5.2 93.1Year 11 549.6 3.7 12.2 28.7 28.5 15.4 6.3 5.2 84.1Not stated (8%) 587.1 5.4 5.0 14.7 26.7 25.6 14.2 8.4 89.6
NT
Bachelor 590.5 1.0 2.2 15.2 27.7 29.5 17.1 7.2 96.8Diploma 568.4 1.8 3.8 21.5 34.7 25.1 10.3 2.7 94.4Certificate 545.2 1.5 12.2 28.3 34.0 16.1 6.6 1.4 86.3Year 12 548.2 3.3 11.1 29.4 30.6 16.7 7.7 1.2 85.6Year 11 494.4 3.0 36.7 34.7 18.1 5.3 1.9 0.4 60.3Not stated (28%) 486.3 3.1 49.0 20.1 12.3 7.2 5.6 2.7 47.9
Aust
Bachelor 626.8 0.9 0.8 6.3 19.8 28.9 24.0 19.3 98.3Diploma 589.2 1.1 2.4 14.5 31.2 28.6 14.9 7.4 96.5Certificate 570.2 1.5 4.3 21.1 34.4 24.7 10.2 3.8 94.1Year 12 577.4 2.0 4.2 19.4 31.7 24.8 11.9 6.1 93.8Year 11 546.9 3.6 10.4 29.7 31.9 16.4 5.9 2.2 86.0Not stated (10%) 574.0 3.2 7.8 19.4 27.4 22.4 12.6 7.2 88.9
KeyBachelor: Bachelor degree or aboveDiploma: Advanced diploma/diplomaCertificate: Certificate I to IVYear 12: Year 12 or equivalentYear 11: Year 11 or equivalent or belowNot stated: No data was provided for parental education at the time of student enrolment. The higher the percentage of missing data, the less informative are the results for the other categories.
Refer to the introduction for explanatory notes.
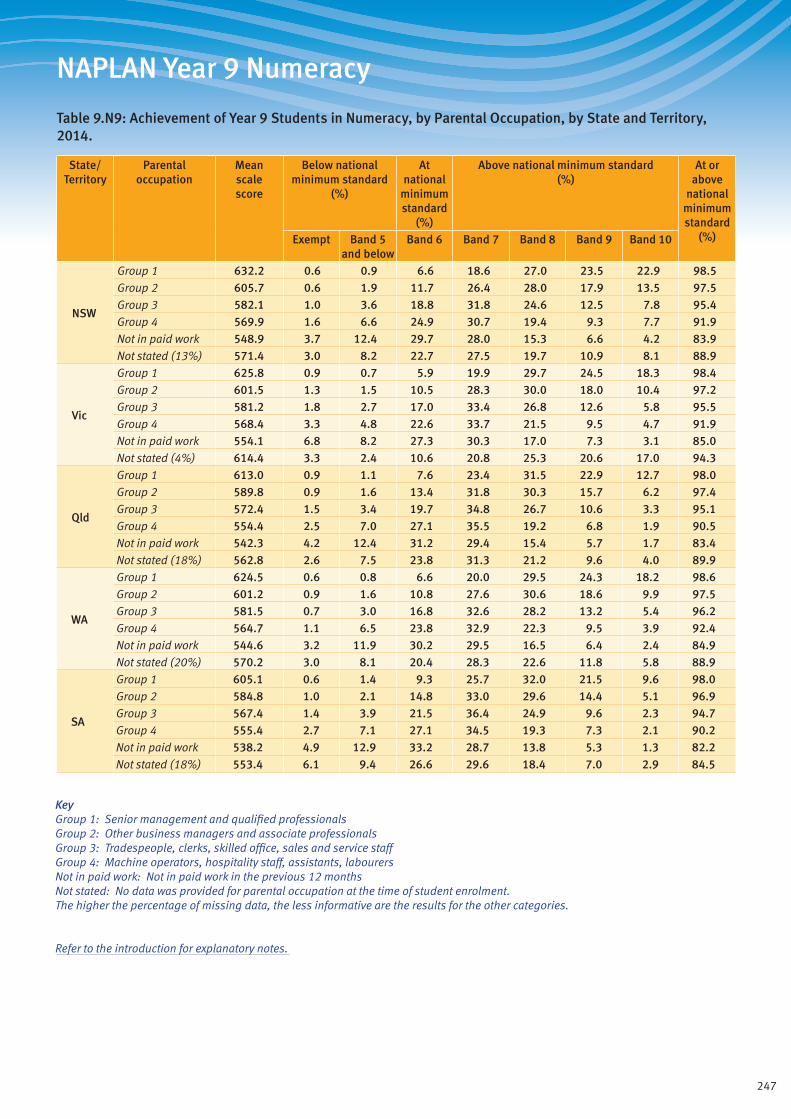
247
NAPLAN Year 9 Numeracy
Table 9.N9: Achievement of Year 9 Students in Numeracy, by Parental Occupation, by State and Territory, 2014.
State/ Territory
Parental occupation
Mean scale score
Below national minimum standard
(%)
At national
minimum standard
(%)
Above national minimum standard (%)
At or above
national minimum standard
(%)Exempt Band 5 and below
Band 6 Band 7 Band 8 Band 9 Band 10
NSW
Group 1 632.2 0.6 0.9 6.6 18.6 27.0 23.5 22.9 98.5Group 2 605.7 0.6 1.9 11.7 26.4 28.0 17.9 13.5 97.5Group 3 582.1 1.0 3.6 18.8 31.8 24.6 12.5 7.8 95.4Group 4 569.9 1.6 6.6 24.9 30.7 19.4 9.3 7.7 91.9Not in paid work 548.9 3.7 12.4 29.7 28.0 15.3 6.6 4.2 83.9Not stated (13%) 571.4 3.0 8.2 22.7 27.5 19.7 10.9 8.1 88.9
Vic
Group 1 625.8 0.9 0.7 5.9 19.9 29.7 24.5 18.3 98.4Group 2 601.5 1.3 1.5 10.5 28.3 30.0 18.0 10.4 97.2Group 3 581.2 1.8 2.7 17.0 33.4 26.8 12.6 5.8 95.5Group 4 568.4 3.3 4.8 22.6 33.7 21.5 9.5 4.7 91.9Not in paid work 554.1 6.8 8.2 27.3 30.3 17.0 7.3 3.1 85.0Not stated (4%) 614.4 3.3 2.4 10.6 20.8 25.3 20.6 17.0 94.3
Qld
Group 1 613.0 0.9 1.1 7.6 23.4 31.5 22.9 12.7 98.0Group 2 589.8 0.9 1.6 13.4 31.8 30.3 15.7 6.2 97.4Group 3 572.4 1.5 3.4 19.7 34.8 26.7 10.6 3.3 95.1Group 4 554.4 2.5 7.0 27.1 35.5 19.2 6.8 1.9 90.5Not in paid work 542.3 4.2 12.4 31.2 29.4 15.4 5.7 1.7 83.4Not stated (18%) 562.8 2.6 7.5 23.8 31.3 21.2 9.6 4.0 89.9
WA
Group 1 624.5 0.6 0.8 6.6 20.0 29.5 24.3 18.2 98.6Group 2 601.2 0.9 1.6 10.8 27.6 30.6 18.6 9.9 97.5Group 3 581.5 0.7 3.0 16.8 32.6 28.2 13.2 5.4 96.2Group 4 564.7 1.1 6.5 23.8 32.9 22.3 9.5 3.9 92.4Not in paid work 544.6 3.2 11.9 30.2 29.5 16.5 6.4 2.4 84.9Not stated (20%) 570.2 3.0 8.1 20.4 28.3 22.6 11.8 5.8 88.9
SA
Group 1 605.1 0.6 1.4 9.3 25.7 32.0 21.5 9.6 98.0Group 2 584.8 1.0 2.1 14.8 33.0 29.6 14.4 5.1 96.9Group 3 567.4 1.4 3.9 21.5 36.4 24.9 9.6 2.3 94.7Group 4 555.4 2.7 7.1 27.1 34.5 19.3 7.3 2.1 90.2Not in paid work 538.2 4.9 12.9 33.2 28.7 13.8 5.3 1.3 82.2Not stated (18%) 553.4 6.1 9.4 26.6 29.6 18.4 7.0 2.9 84.5
KeyGroup 1: Senior management and qualified professionalsGroup 2: Other business managers and associate professionalsGroup 3: Tradespeople, clerks, skilled office, sales and service staffGroup 4: Machine operators, hospitality staff, assistants, labourersNot in paid work: Not in paid work in the previous 12 monthsNot stated: No data was provided for parental occupation at the time of student enrolment. The higher the percentage of missing data, the less informative are the results for the other categories.
Refer to the introduction for explanatory notes.

248
NAPLAN Year 9 Numeracy
Table 9.N9 (cont.): Achievement of Year 9 Students in Numeracy, by Parental Occupation, by State and Territory, 2014.
State/ Territory
Parental occupation
Mean scale score
Below national minimum standard
(%)
At national
minimum standard
(%)
Above national minimum standard (%)
At or above
national minimum standard
(%)Exempt Band 5 and below
Band 6 Band 7 Band 8 Band 9 Band 10
Tas
Group 1 611.6 0.9 0.8 7.5 25.0 30.3 23.7 11.7 98.3Group 2 588.9 0.9 1.4 14.4 31.9 30.5 14.6 6.3 97.7Group 3 569.6 0.6 3.1 20.7 37.4 25.8 9.2 3.2 96.3Group 4 549.3 1.1 7.2 31.0 36.9 17.2 5.4 1.2 91.8Not in paid work 529.7 3.7 15.6 37.2 27.6 11.8 3.5 0.5 80.7Not stated (15%) 562.4 3.3 7.9 24.4 31.2 19.5 9.3 4.5 88.8
ACT
Group 1 616.3 1.1 1.4 8.1 22.4 29.0 22.3 15.8 97.5Group 2 594.3 0.9 1.9 14.3 28.7 28.5 16.6 9.1 97.2Group 3 568.6 1.4 4.8 21.8 34.1 23.8 10.3 3.8 93.8Group 4 554.1 1.5 9.7 28.3 31.2 15.7 10.6 3.0 88.8Not in paid work 553.0 6.7 10.3 27.0 28.3 16.9 6.1 4.7 82.9Not stated (12%) 573.1 5.1 7.7 19.4 27.6 21.6 11.9 6.7 87.3
NT
Group 1 581.9 1.0 4.0 18.8 29.1 24.9 15.4 6.8 94.9Group 2 577.4 2.1 3.1 20.0 31.7 24.3 13.9 4.7 94.8Group 3 545.4 1.6 11.7 28.7 33.5 17.2 6.0 1.3 86.7Group 4 519.1 2.2 24.3 33.2 25.1 10.1 4.3 0.7 73.5Not in paid work 481.3 2.7 47.8 30.3 13.8 3.5 1.6 0.3 49.5Not stated (27%) 471.8 3.4 52.3 22.7 12.7 6.1 2.2 0.5 44.2
Aust
Group 1 622.8 0.8 0.9 7.0 20.8 29.2 23.5 17.8 98.3Group 2 598.7 0.9 1.7 12.0 28.8 29.4 17.2 10.0 97.4Group 3 577.9 1.3 3.4 18.6 33.4 26.0 11.8 5.4 95.3Group 4 563.9 2.3 6.3 24.9 33.1 20.1 8.6 4.7 91.4Not in paid work 547.5 5.0 11.3 29.5 29.0 15.7 6.5 3.0 83.7Not stated (13%) 567.5 3.3 8.6 22.2 28.3 20.6 10.7 6.3 88.2
KeyGroup 1: Senior management and qualified professionalsGroup 2: Other business managers and associate professionalsGroup 3: Tradespeople, clerks, skilled office, sales and service staffGroup 4: Machine operators, hospitality staff, assistants, labourersNot in paid work: Not in paid work in the previous 12 monthsNot stated: No data was provided for parental occupation at the time of student enrolment. The higher the percentage of missing data, the less informative are the results for the other categories.
Refer to the introduction for explanatory notes.
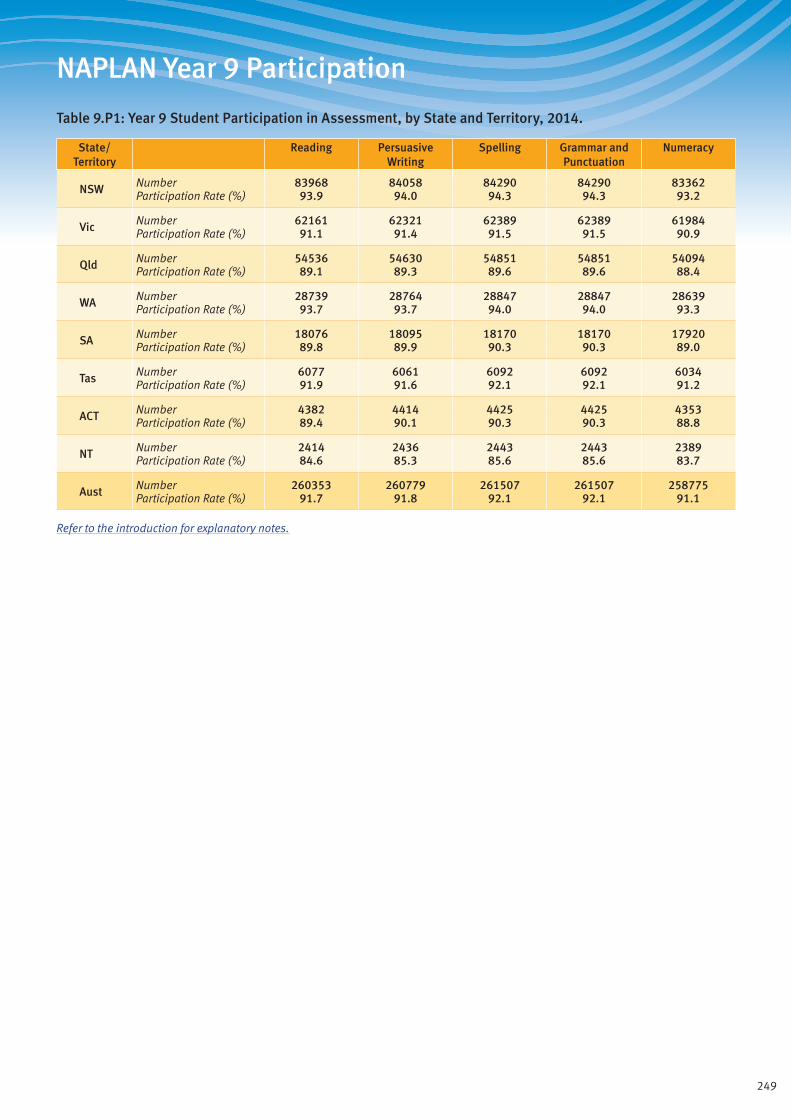
249
NAPLAN Year 9 Participation
Table 9.P1: Year 9 Student Participation in Assessment, by State and Territory, 2014.
State/ Territory
Reading Persuasive Writing
Spelling Grammar and Punctuation
Numeracy
NSW Number 83968 84058 84290 84290 83362Participation Rate (%) 93.9 94.0 94.3 94.3 93.2
Vic Number 62161 62321 62389 62389 61984Participation Rate (%) 91.1 91.4 91.5 91.5 90.9
Qld Number 54536 54630 54851 54851 54094Participation Rate (%) 89.1 89.3 89.6 89.6 88.4
WA Number 28739 28764 28847 28847 28639Participation Rate (%) 93.7 93.7 94.0 94.0 93.3
SA Number 18076 18095 18170 18170 17920Participation Rate (%) 89.8 89.9 90.3 90.3 89.0
Tas Number 6077 6061 6092 6092 6034Participation Rate (%) 91.9 91.6 92.1 92.1 91.2
ACT Number 4382 4414 4425 4425 4353Participation Rate (%) 89.4 90.1 90.3 90.3 88.8
NT Number 2414 2436 2443 2443 2389Participation Rate (%) 84.6 85.3 85.6 85.6 83.7
Aust Number 260353 260779 261507 261507 258775Participation Rate (%) 91.7 91.8 92.1 92.1 91.1
Refer to the introduction for explanatory notes.
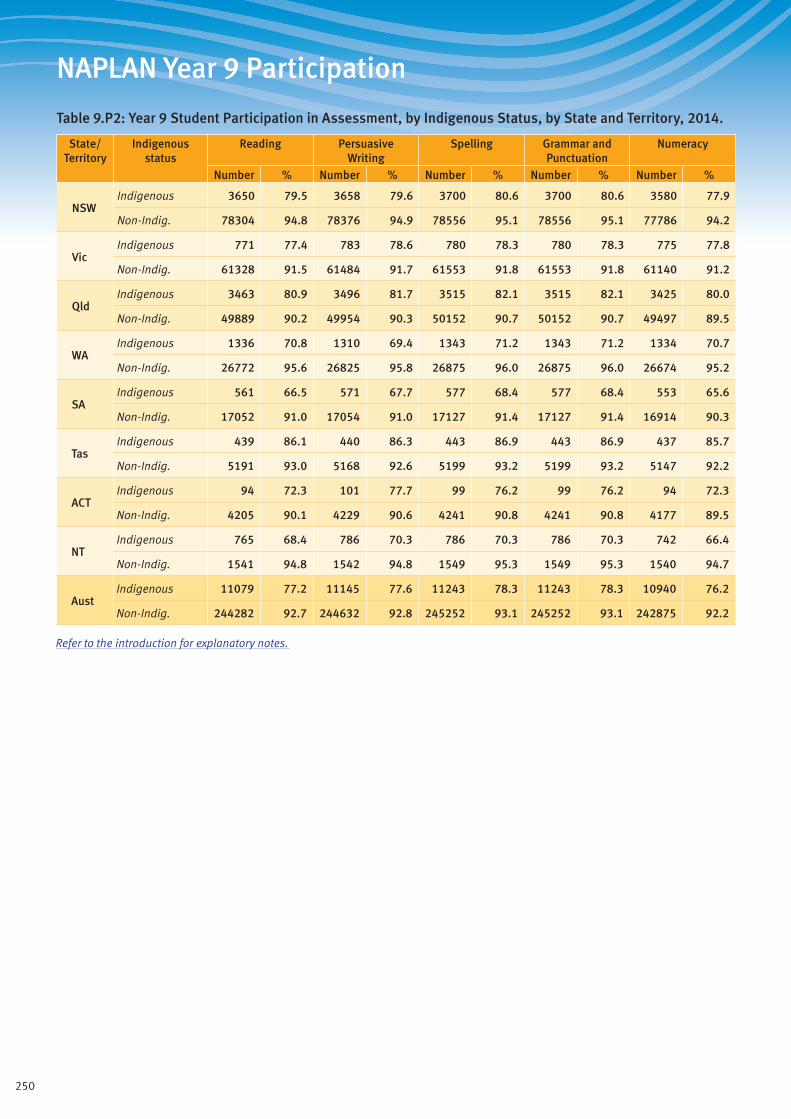
250
NAPLAN Year 9 Participation
Table 9.P2: Year 9 Student Participation in Assessment, by Indigenous Status, by State and Territory, 2014.
State/ Territory
Indigenous status
Reading Persuasive Writing
Spelling Grammar and Punctuation
Numeracy
Number % Number % Number % Number % Number %
NSWIndigenous 3650 79.5 3658 79.6 3700 80.6 3700 80.6 3580 77.9
Non-Indig. 78304 94.8 78376 94.9 78556 95.1 78556 95.1 77786 94.2
VicIndigenous 771 77.4 783 78.6 780 78.3 780 78.3 775 77.8
Non-Indig. 61328 91.5 61484 91.7 61553 91.8 61553 91.8 61140 91.2
QldIndigenous 3463 80.9 3496 81.7 3515 82.1 3515 82.1 3425 80.0
Non-Indig. 49889 90.2 49954 90.3 50152 90.7 50152 90.7 49497 89.5
WAIndigenous 1336 70.8 1310 69.4 1343 71.2 1343 71.2 1334 70.7
Non-Indig. 26772 95.6 26825 95.8 26875 96.0 26875 96.0 26674 95.2
SAIndigenous 561 66.5 571 67.7 577 68.4 577 68.4 553 65.6
Non-Indig. 17052 91.0 17054 91.0 17127 91.4 17127 91.4 16914 90.3
TasIndigenous 439 86.1 440 86.3 443 86.9 443 86.9 437 85.7
Non-Indig. 5191 93.0 5168 92.6 5199 93.2 5199 93.2 5147 92.2
ACTIndigenous 94 72.3 101 77.7 99 76.2 99 76.2 94 72.3
Non-Indig. 4205 90.1 4229 90.6 4241 90.8 4241 90.8 4177 89.5
NTIndigenous 765 68.4 786 70.3 786 70.3 786 70.3 742 66.4
Non-Indig. 1541 94.8 1542 94.8 1549 95.3 1549 95.3 1540 94.7
AustIndigenous 11079 77.2 11145 77.6 11243 78.3 11243 78.3 10940 76.2
Non-Indig. 244282 92.7 244632 92.8 245252 93.1 245252 93.1 242875 92.2
Refer to the introduction for explanatory notes.
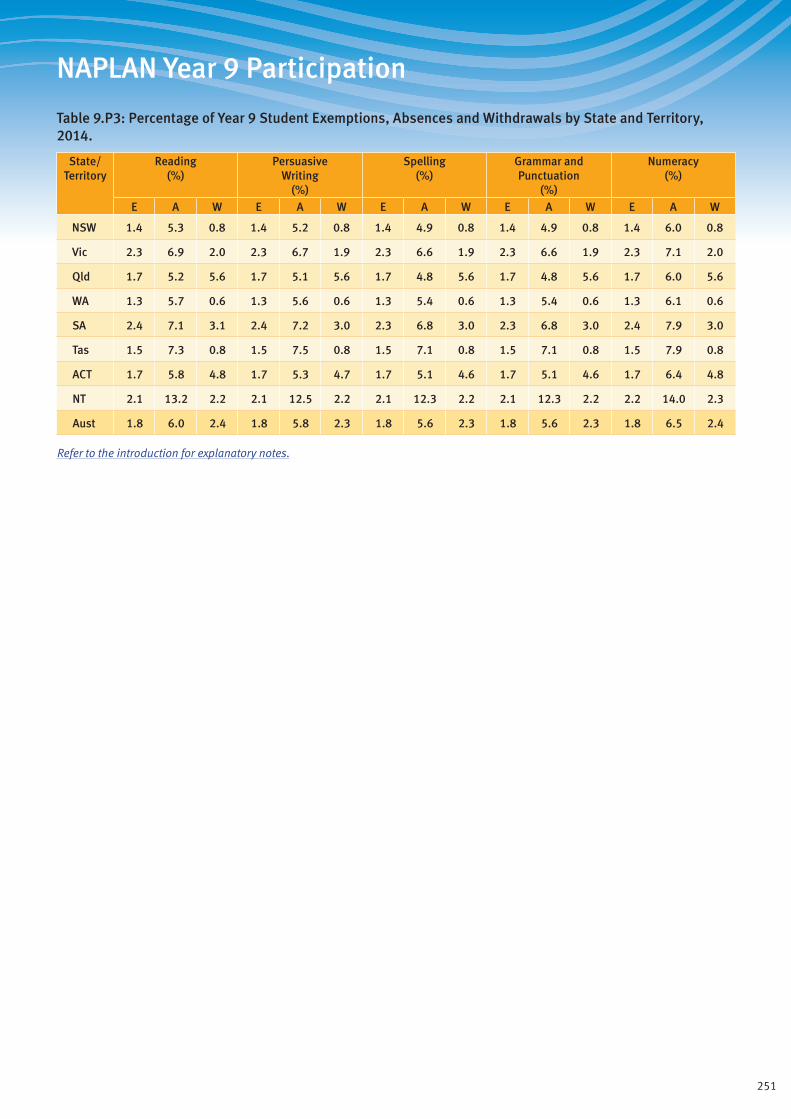
251
NAPLAN Year 9 Participation
Table 9.P3: Percentage of Year 9 Student Exemptions, Absences and Withdrawals by State and Territory, 2014.
State/ Territory
Reading (%)
Persuasive Writing
(%)
Spelling (%)
Grammar and Punctuation
(%)
Numeracy (%)
E A W E A W E A W E A W E A W
NSW 1.4 5.3 0.8 1.4 5.2 0.8 1.4 4.9 0.8 1.4 4.9 0.8 1.4 6.0 0.8
Vic 2.3 6.9 2.0 2.3 6.7 1.9 2.3 6.6 1.9 2.3 6.6 1.9 2.3 7.1 2.0
Qld 1.7 5.2 5.6 1.7 5.1 5.6 1.7 4.8 5.6 1.7 4.8 5.6 1.7 6.0 5.6
WA 1.3 5.7 0.6 1.3 5.6 0.6 1.3 5.4 0.6 1.3 5.4 0.6 1.3 6.1 0.6
SA 2.4 7.1 3.1 2.4 7.2 3.0 2.3 6.8 3.0 2.3 6.8 3.0 2.4 7.9 3.0
Tas 1.5 7.3 0.8 1.5 7.5 0.8 1.5 7.1 0.8 1.5 7.1 0.8 1.5 7.9 0.8
ACT 1.7 5.8 4.8 1.7 5.3 4.7 1.7 5.1 4.6 1.7 5.1 4.6 1.7 6.4 4.8
NT 2.1 13.2 2.2 2.1 12.5 2.2 2.1 12.3 2.2 2.1 12.3 2.2 2.2 14.0 2.3
Aust 1.8 6.0 2.4 1.8 5.8 2.3 1.8 5.6 2.3 1.8 5.6 2.3 1.8 6.5 2.4
Refer to the introduction for explanatory notes.
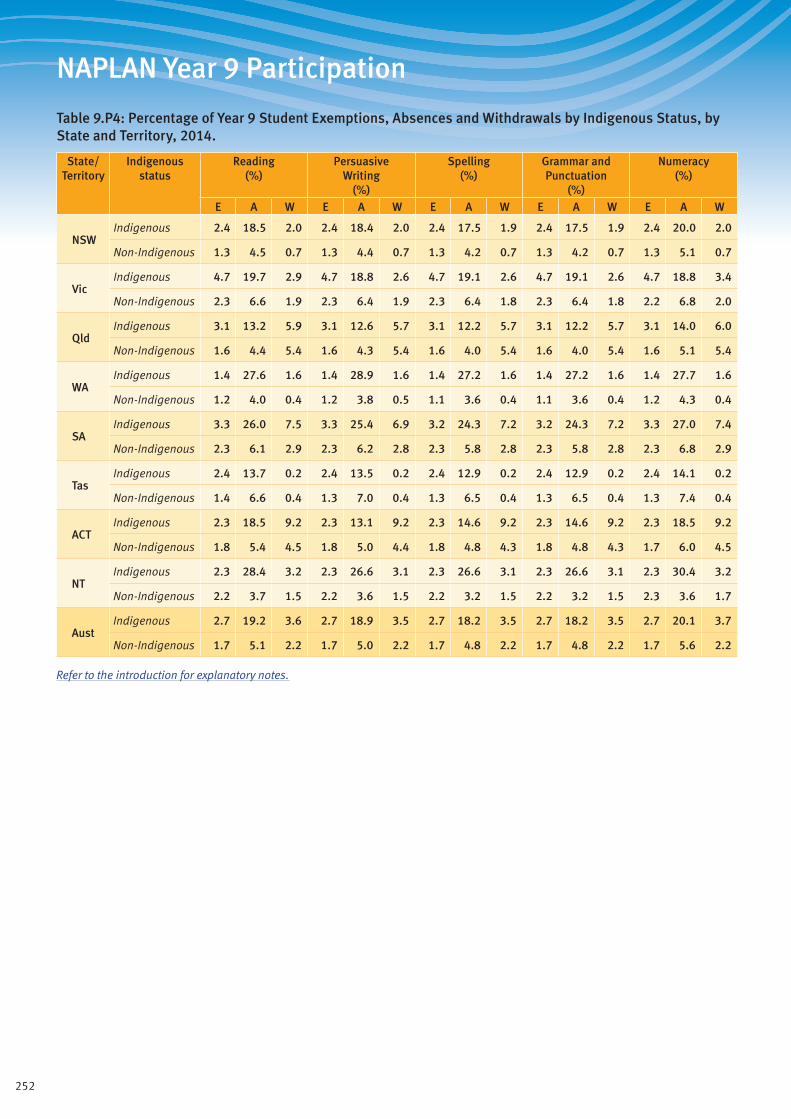
252
NAPLAN Year 9 Participation
Table 9.P4: Percentage of Year 9 Student Exemptions, Absences and Withdrawals by Indigenous Status, by State and Territory, 2014.
State/ Territory
Indigenous status
Reading (%)
Persuasive Writing
(%)
Spelling (%)
Grammar and Punctuation
(%)
Numeracy (%)
E A W E A W E A W E A W E A W
NSWIndigenous 2.4 18.5 2.0 2.4 18.4 2.0 2.4 17.5 1.9 2.4 17.5 1.9 2.4 20.0 2.0
Non-Indigenous 1.3 4.5 0.7 1.3 4.4 0.7 1.3 4.2 0.7 1.3 4.2 0.7 1.3 5.1 0.7
VicIndigenous 4.7 19.7 2.9 4.7 18.8 2.6 4.7 19.1 2.6 4.7 19.1 2.6 4.7 18.8 3.4
Non-Indigenous 2.3 6.6 1.9 2.3 6.4 1.9 2.3 6.4 1.8 2.3 6.4 1.8 2.2 6.8 2.0
QldIndigenous 3.1 13.2 5.9 3.1 12.6 5.7 3.1 12.2 5.7 3.1 12.2 5.7 3.1 14.0 6.0
Non-Indigenous 1.6 4.4 5.4 1.6 4.3 5.4 1.6 4.0 5.4 1.6 4.0 5.4 1.6 5.1 5.4
WAIndigenous 1.4 27.6 1.6 1.4 28.9 1.6 1.4 27.2 1.6 1.4 27.2 1.6 1.4 27.7 1.6
Non-Indigenous 1.2 4.0 0.4 1.2 3.8 0.5 1.1 3.6 0.4 1.1 3.6 0.4 1.2 4.3 0.4
SAIndigenous 3.3 26.0 7.5 3.3 25.4 6.9 3.2 24.3 7.2 3.2 24.3 7.2 3.3 27.0 7.4
Non-Indigenous 2.3 6.1 2.9 2.3 6.2 2.8 2.3 5.8 2.8 2.3 5.8 2.8 2.3 6.8 2.9
TasIndigenous 2.4 13.7 0.2 2.4 13.5 0.2 2.4 12.9 0.2 2.4 12.9 0.2 2.4 14.1 0.2
Non-Indigenous 1.4 6.6 0.4 1.3 7.0 0.4 1.3 6.5 0.4 1.3 6.5 0.4 1.3 7.4 0.4
ACTIndigenous 2.3 18.5 9.2 2.3 13.1 9.2 2.3 14.6 9.2 2.3 14.6 9.2 2.3 18.5 9.2
Non-Indigenous 1.8 5.4 4.5 1.8 5.0 4.4 1.8 4.8 4.3 1.8 4.8 4.3 1.7 6.0 4.5
NTIndigenous 2.3 28.4 3.2 2.3 26.6 3.1 2.3 26.6 3.1 2.3 26.6 3.1 2.3 30.4 3.2
Non-Indigenous 2.2 3.7 1.5 2.2 3.6 1.5 2.2 3.2 1.5 2.2 3.2 1.5 2.3 3.6 1.7
AustIndigenous 2.7 19.2 3.6 2.7 18.9 3.5 2.7 18.2 3.5 2.7 18.2 3.5 2.7 20.1 3.7
Non-Indigenous 1.7 5.1 2.2 1.7 5.0 2.2 1.7 4.8 2.2 1.7 4.8 2.2 1.7 5.6 2.2
Refer to the introduction for explanatory notes.
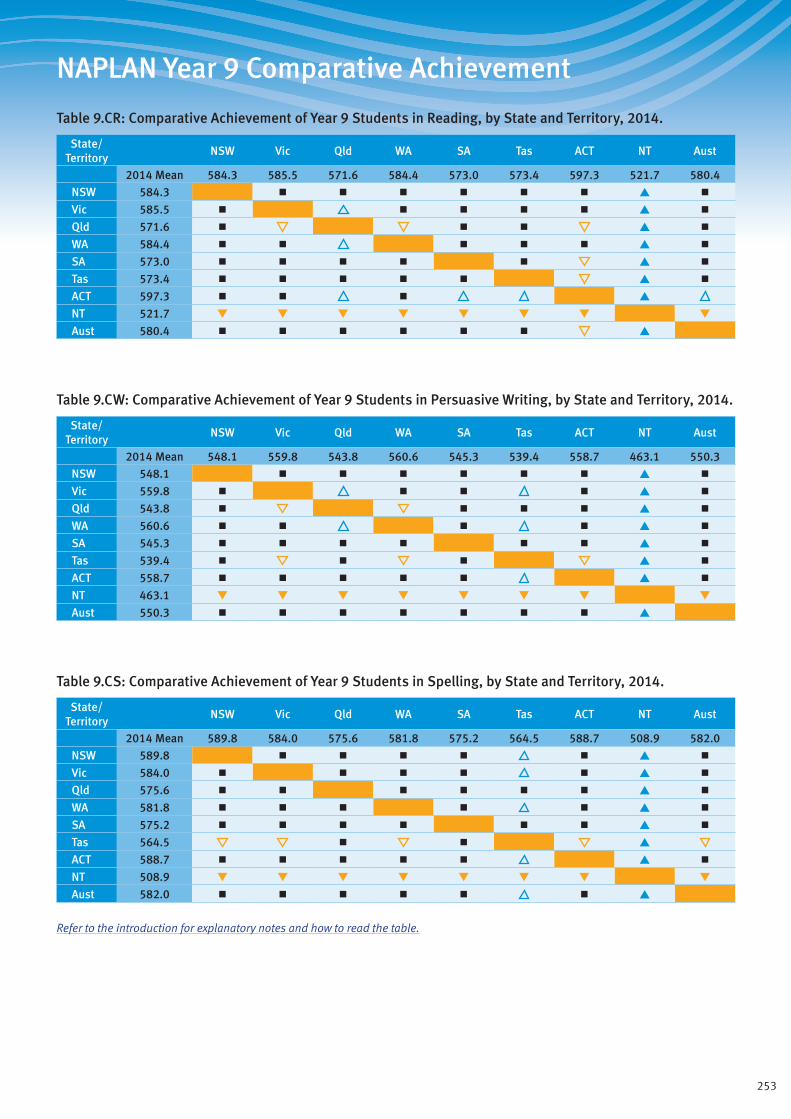
253
NAPLAN Year 9 Comparative Achievement
Table 9.CR: Comparative Achievement of Year 9 Students in Reading, by State and Territory, 2014.
State/ Territory
NSW Vic Qld WA SA Tas ACT NT Aust
2014 Mean 584.3 585.5 571.6 584.4 573.0 573.4 597.3 521.7 580.4
NSW 584.3 ■ ■ ■ ■ ■ ■ ▲ ■
Vic 585.5 ■ ■ ■ ■ ■ ▲ ■
Qld 571.6 ■ ■ ■ ▲ ■
WA 584.4 ■ ■ ■ ■ ■ ▲ ■
SA 573.0 ■ ■ ■ ■ ■ ▲ ■
Tas 573.4 ■ ■ ■ ■ ■ ▲ ■
ACT 597.3 ■ ■ ■ ▲
NT 521.7 ▼ ▼ ▼ ▼ ▼ ▼ ▼ ▼
Aust 580.4 ■ ■ ■ ■ ■ ■ ▲
Table 9.CW: Comparative Achievement of Year 9 Students in Persuasive Writing, by State and Territory, 2014.
State/ Territory
NSW Vic Qld WA SA Tas ACT NT Aust
2014 Mean 548.1 559.8 543.8 560.6 545.3 539.4 558.7 463.1 550.3
NSW 548.1 ■ ■ ■ ■ ■ ■ ▲ ■
Vic 559.8 ■ ■ ■ ■ ▲ ■
Qld 543.8 ■ ■ ■ ■ ▲ ■
WA 560.6 ■ ■ ■ ■ ▲ ■
SA 545.3 ■ ■ ■ ■ ■ ■ ▲ ■
Tas 539.4 ■ ■ ■ ▲ ■
ACT 558.7 ■ ■ ■ ■ ■ ▲ ■
NT 463.1 ▼ ▼ ▼ ▼ ▼ ▼ ▼ ▼
Aust 550.3 ■ ■ ■ ■ ■ ■ ■ ▲
Table 9.CS: Comparative Achievement of Year 9 Students in Spelling, by State and Territory, 2014.
State/ Territory
NSW Vic Qld WA SA Tas ACT NT Aust
2014 Mean 589.8 584.0 575.6 581.8 575.2 564.5 588.7 508.9 582.0
NSW 589.8 ■ ■ ■ ■ ■ ▲ ■
Vic 584.0 ■ ■ ■ ■ ■ ▲ ■
Qld 575.6 ■ ■ ■ ■ ■ ■ ▲ ■
WA 581.8 ■ ■ ■ ■ ■ ▲ ■
SA 575.2 ■ ■ ■ ■ ■ ■ ▲ ■
Tas 564.5 ■ ■ ▲
ACT 588.7 ■ ■ ■ ■ ■ ▲ ■
NT 508.9 ▼ ▼ ▼ ▼ ▼ ▼ ▼ ▼
Aust 582.0 ■ ■ ■ ■ ■ ■ ▲
Refer to the introduction for explanatory notes and how to read the table.

254
NAPLAN Year 9 Comparative Achievement
Table 9.CG: Comparative Achievement of Year 9 Students in Grammar and Punctuation, by State and Territory, 2014.
State/ Territory
NSW Vic Qld WA SA Tas ACT NT Aust
2014 Mean 576.6 578.6 567.4 574.9 567.6 564.0 588.3 507.2 573.5
NSW 576.6 ■ ■ ■ ■ ■ ■ ▲ ■
Vic 578.6 ■ ■ ■ ■ ■ ▲ ■
Qld 567.4 ■ ■ ■ ■ ■ ▲ ■
WA 574.9 ■ ■ ■ ■ ■ ■ ▲ ■
SA 567.6 ■ ■ ■ ■ ■ ▲ ■
Tas 564.0 ■ ■ ■ ■ ▲ ■
ACT 588.3 ■ ■ ■ ▲
NT 507.2 ▼ ▼ ▼ ▼ ▼ ▼ ▼ ▼
Aust 573.5 ■ ■ ■ ■ ■ ■ ▲
Table 9.CN: Comparative Achievement of Year 9 Students in Numeracy, by State and Territory, 2014.
State/ Territory
NSW Vic Qld WA SA Tas ACT NT Aust
2014 Mean 594.3 592.3 579.8 591.1 573.6 572.8 594.4 532.0 587.8
NSW 594.3 ■ ■ ■ ▲ ■
Vic 592.3 ■ ■ ■ ■ ▲ ■
Qld 579.8 ■ ■ ■ ■ ▲ ■
WA 591.1 ■ ■ ■ ■ ▲ ■
SA 573.6 ■ ■ ▲
Tas 572.8 ■ ■ ▲
ACT 594.4 ■ ■ ■ ▲ ■
NT 532.0 ▼ ▼ ▼ ▼ ▼ ▼ ▼ ▼
Aust 587.8 ■ ■ ■ ■ ■ ▲
Refer to the introduction for explanatory notes and how to read the table.
255
NAPLAN Year 9 Commentary
Overall national and jurisdiction results (Year 9)
Achievement scoresFigures 9.R1, 9.W1, 9.S1, 9.G1 and 9.N1 show the distributions of achievement scores in reading, persuasive writing, spelling, grammar and punctuation, and numeracy, respectively, for each jurisdiction and for Australia overall. The table below each figure presents the mean scale score and standard deviation for each jurisdiction and for Australia overall.
In all achievement domains, mean scores for New South Wales, Victoria, Queensland and Western Australia are close to the national mean scores. Mean scores for the ACT are above and statistically significantly different from the national mean scores in reading and in grammar and punctuation, and close to the national mean scores in persuasive writing, spelling and numeracy. Mean scores for South Australia are below and statistically significantly different from the national mean scores in numeracy, and close to the national mean scores in reading, persuasive writing, spelling, and grammar and punctuation. Mean scores for Tasmania are below and statistically significantly different from the national mean scores in spelling and numeracy, and close to the national mean scores in reading, persuasive writing, and grammar and punctuation. For the Northern Territory, mean scores are substantially below and statistically significantly different from national mean scores in all five domains.
In most domains, the spread of scores for the Northern Territory, as indicated by the standard deviation, is much greater than in the other jurisdictions. This is also indicated by the length of the bars in the figures. In numeracy, the standard deviation is closer to the standard deviation for other jurisdictions and the mean score is above the national 20th percentile score.
Achievement bandsFor further descriptive reporting, achievement scores are grouped into ten bands. For students in Year 9, Band 5 and below is the lowest band that is reported and indicates a score below the national minimum standard. Band 6 (the next lowest band) indicates a score at the national minimum standard (see p. v). Band 10 is the highest reported band on the NAPLAN scale and represents high achievement for Year 9. Exempt students do not receive an achievement score, and so are not included in the calculation of means and standard deviations, but they are counted as below the national minimum standard in reporting achievement band percentages.
Tables 9.R1, 9.W1, 9.S1, 9.G1 and 9.N1 present the percentages of students in each band for each jurisdiction and Australia overall in each of the five achievement domains. The last column of each table shows the percentage of students who achieved at or above the national minimum standard in the achievement domain. In reading and numeracy, more than 92% of students across Australia achieved at or above the national minimum standard, and in spelling and in grammar and punctuation, close to 90% of students achieved at or above the national minimum standard. In persuasive writing, however, 82% of students across Australia achieved at or above the national minimum standard.
SexMean scale scores and score distributions are shown in Figures 9.R2, 9.W2, 9.S2, 9.G2 and 9.N2 separately for male and female students. Mean scale scores for female students are higher than the mean scale scores for male students in persuasive writing, spelling, and grammar and punctuation for Australia overall and for all jurisdictions. The national differences are 21 scale points in spelling and in grammar and punctuation and 37 scale points in persuasive writing. In reading and numeracy, the mean scores for male students are close to the mean scores for female students.
Tables 9.R2, 9.W2, 9.S2, 9.G2 and 9.N2 present the percentages of male students and female students in each achievement band. In reading, persuasive writing, spelling, and grammar and
punctuation, a higher percentage of female students achieved at or above the national minimum standard compared with male students, with differences between 4 percentage points in reading and 13 percentage points in persuasive writing. In numeracy, the percentage of female students who achieved at or above the national minimum standard is close to the percentage of male students who achieved at or above the national minimum standard. For all jurisdictions, greater percentages of male students than female students achieved in the two highest achievement bands (Band 9 and Band 10) in numeracy. In all other assessment domains, greater percentages of female students than male students achieved in the three highest achievement bands (Band 8, Band 9 and Band 10).
Indigenous studentsFigures 9.R3, 9.W3, 9.S3, 9.G3 and 9.N3 display the distributions of scores, mean scale scores and standard deviations separately for Indigenous students and non-Indigenous students. In each achievement domain and for all jurisdictions, the mean scale score for Indigenous students is substantially below the mean scale score for non-Indigenous students. Differences for Australia overall range from 65 scale points in spelling to 90 scale points in persuasive writing.
Tables 9.R3, 9.W3, 9.S3, 9.G3 and 9.N3 present the percentages of Indigenous and non-Indigenous students in each achievement band in each domain for all jurisdictions and Australia overall. Across Australia, 71% of Indigenous students achieved at or above the national minimum standard in reading, and 76% achieved at or above the national minimum standard in numeracy.
Language background other than EnglishFigures 9.R4, 9.W4, 9.S4, 9.G4 and 9.N4 provide the distributions of scores, mean scale scores and standard deviations for students from a language background other than English separately from students whose language background is English for each jurisdiction and for Australia overall. For Australia overall, mean scores for students from a language background other than English are higher than mean scores for students from an English-language background in spelling and numeracy.
For Queensland, Western Australia, South Australia and Tasmania, mean scores in all domains are close for the two groups of students. For New South Wales, mean scores for students from a language background other than English are higher than mean scores for students from an English-language background in persuasive writing, spelling, grammar and punctuation, and numeracy, and close to the mean scores in reading. In the Northern Territory, mean scores for students from a language background other than English are lower in all five achievement domains compared with mean scores for students from an English-language background.
Tables 9.R4, 9.W4, 9.S4, 9.G4 and 9.N4 provide information on the percentage of students in each achievement band in each domain for each jurisdiction, separately for students from a language background other than English and students from an English-language background. For Australia overall, there is little difference between the two groups in the percentage of students who scored at or above the national minimum standard in any of the five achievement domains. The greatest difference is 3 percentage points in reading. In numeracy, the difference is 1 percentage point, although 16% of students with a language background other than English achieved in Band 10 compared with 7% of students from an English-language background.
GeolocationTables 9.R5, 9.W5, 9.S5, 9.G5 and 9.N5 present summary results for students from schools in metropolitan, provincial, remote and very remote locations for each jurisdiction and for Australia overall. These tables include the mean scale score and the percentage of students in each achievement band. In Victoria there is no very remote geolocation; in the ACT there is no secondary school in a provincial, remote or very remote geolocation; and in the Northern
256
NAPLAN Year 9 Commentary
Territory there is no metropolitan geolocation. In addition, there are too few Year 9 students attending schools in remote and very remote locations in Tasmania to provide reliable results.
Across all five achievement domains, there is a consistent pattern in the results for Australia overall. Students attending schools in metropolitan geolocations have the highest mean score, followed by students attending schools in provincial geolocations, then students attending schools in remote locations, then students attending schools in very remote locations. This pattern holds for the percentage of students who achieved at or above the national minimum standard.
Within each jurisdiction, the relationship between geolocation and mean scale scores differs from the national pattern. For Victoria, mean scores for students attending schools in remote locations are close to mean scores for students attending schools in other locations; for South Australia, mean scores for students attending schools in remote locations are close to mean scores for students attending schools in provincial locations; and for Tasmania mean scores for students attending schools in metropolitan locations are close to mean scores for students attending schools in provincial locations. The distributions of achievement bands show similar results within jurisdictions. Greater percentages of students attending schools in metropolitan locations across Australia and in most jurisdictions achieved at both Band 9 and Band 10 compared with students attending schools in other locations.
Results by geolocation are also reported by Indigenous status, in Tables 9.R6, 9.W6, 9.S6, 9.G6 and 9.N6 for Indigenous students and in Tables 9.R7, 9.W7, 9.S7, 9.G7 and 9.N7 for non-Indigenous students. For both Indigenous and non-Indigenous students, the patterns of mean scores by geolocation generally hold, across Australia and within each jurisdiction, with only a small difference between Indigenous students attending schools in metropolitan locations and Indigenous students attending schools in provincial locations.
Parental educationTables 9.R8, 9.W8, 9.S8, 9.G8 and 9.N8 provide results for each jurisdiction and Australia overall by parental education. Parental education refers to the highest level of education completed by either parent or guardian. It includes primary and secondary school and post-school qualifications, such as certificates, diplomas and degrees. The percentage of parents who did not report this information on their child’s school enrolment form varies across jurisdictions, from 4% in Victoria to 28% in Northern Territory. For Australia overall, there is no information on parental education for 10% of Year 9 students, so these results should be treated with caution.
In all domains, mean scores are higher for students whose parents have higher levels of education. Students whose parents hold a bachelor degree or higher have the highest mean scores for each jurisdiction and for Australia overall, and the greatest percentage of students who achieved at or above the national minimum standard. Mean scores for students with parents whose highest level of education is a certificate are close to mean scores for students with parents whose highest level is Year 12 completion.
Parental occupationTables 9.R9, 9.W9, 9.S9, 9.G9 and 9.N9 show results for each jurisdiction and Australia overall by parental occupation. Parental occupation group includes the main work undertaken by the parent/guardian. If a parent/guardian has more than one job, the occupation group reflecting the main job is reported. If both parents/guardians are working, the higher of the two occupation groups is used. Occupations are classified into four groups; a fifth group represents those not in paid work. The percentage of parents who did not report this information on their child’s school enrolment form varies across jurisdictions, from 4% in Victoria to 27% in the Northern Territory. For Australia overall, there is no information on parental occupation for 13% of students, so these results should be treated with caution.
Students with parents in Occupation Group 1, which includes senior managers and qualified professionals, have the highest mean scale scores in all domains for Australia overall. The next highest mean scores were achieved by students with parents in
Occupation Group 2, which includes other business managers and associate professionals, followed by Occupation Group 3 (tradespeople; clerks; and skilled office, sales and service staff) and Occupation Group 4 (machine operators, hospitality staff, assistants and labourers). For the Northern Territory, the mean scores for students with parents in Occupation Group 1 are close to the mean scores for students with parents in Occupation Group 2. Students whose parents are not in paid work have the lowest mean scores in all domains across Australia and for all jurisdictions.
Parental occupation is also related to the percentage of students who achieved at or above the national minimum standard. Students with parents in Occupation Group 1 most frequently achieved at or above the national minimum standard, with differences of approximately 2 percentage points between Group 1 and Group 2 in reading, spelling, and grammar and punctuation, and 1 percentage point in numeracy. Nationally, for students with at least one parent in Occupation Group 1, the percentage who achieved at or above the national minimum standard is lowest in persuasive writing (93%) and highest in numeracy (98%). For students with at least one parent in paid work at any occupation level, more than 88% across Australia achieved at or above the national minimum standard in reading and more than 91% achieved at or above the national minimum standard in numeracy.
ParticipationTables 9.P1, 9.P2, 9.P3 and 9.P4 provide data on participation in the tests in each domain for each jurisdiction and for Australia overall. Table 9.P1 provides the overall rates and Table 9.P2 provides rates separately for Indigenous and non-Indigenous students. Tables 9.P3 and 9.P4 provide data on exemptions, absences and withdrawals for the tests in each domain, with Table 9.P4 showing these rates separately for Indigenous and non-Indigenous students. Students who are absent or withdrawn are considered non-participating. Students who are exempt do not receive a scale score but are considered to have achieved below the national minimum standard.
The participation rate is lower in Year 9 than in all other year levels. The overall participation rate is highest in spelling and in grammar and punctuation at 92.1% and lowest in numeracy at 91.1%. Among the eight jurisdictions, New South Wales and Western Australia have the highest participation rates (between 93.2% and 94.3%) and the Northern Territory has the lowest (between 83.7% and 85.6%). Participation rates are lower among Indigenous students, ranging from 76.2% in numeracy to 78.3% in spelling, and grammar and punctuation.
Across Australia 1.8% of students were granted exemptions from the assessments in each domain. Exemption rates for Indigenous students vary across jurisdictions, from 1.4% for Western Australia to 4.7% for Victoria. There is also wide variation in absence and withdrawal rates across jurisdictions and domains. Students were absent most frequently for the numeracy assessment (6.5%). Across Australia, 20.1% of Indigenous students were absent for the numeracy assessment, including more than 27% of Indigenous students from Western Australia, South Australia and the Northern Territory.
257
2008–2014 Time series NAPLAN Years 3, 5, 7 and 9
Reading .......................................... 258• Students in Australia
• Year 3 Students by Sex
• Year 5 Students by Sex
• Year 7 Students by Sex
• Year 9 Students by Sex
• Year 3 Students by Indigenous status
• Year 5 Students by Indigenous status
• Year 7 Students by Indigenous status
• Year 9 Students by Indigenous status
• Year 3 Students by LBOTE status
• Year 5 Students by LBOTE status
• Year 7 Students by LBOTE status
• Year 9 Students by LBOTE status
• Students in New South Wales
• Students in Victoria
• Students in Queensland
• Students in Western Australia
• Students in South Australia
• Students in Tasmania
• Students in Australian Capital Territory
• Students in Northern Territory
Numeracy ....................................... 279• Students in Australia
• Year 3 Students by Sex
• Year 5 Students by Sex
• Year 7 Students by Sex
• Year 9 Students by Sex
• Year 3 Students by Indigenous status
• Year 5 Students by Indigenous status
• Year 7 Students by Indigenous status
• Year 9 Students by Indigenous status
• Year 3 Students by LBOTE status
• Year 5 Students by LBOTE status
• Year 7 Students by LBOTE status
• Year 9 Students by LBOTE status
• Students in New South Wales
• Students in Victoria
• Students in Queensland
• Students in Western Australia
• Students in South Australia
• Students in Tasmania
• Students in Australian Capital Territory
• Students in Northern Territory
Commentary .................................... 300
Participation ................................... 303• Year 3 Students by State and Territory
• Year 3 Students by Indigenous Status
• Year 5 Students by State and Territory
• Year 5 Students by Indigenous Status
• Year 7 Students by State and Territory
• Year 7 Students by Indigenous Status
• Year 9 Students by State and Territory
• Year 9 Students by Indigenous Status
Commentary .................................... 324
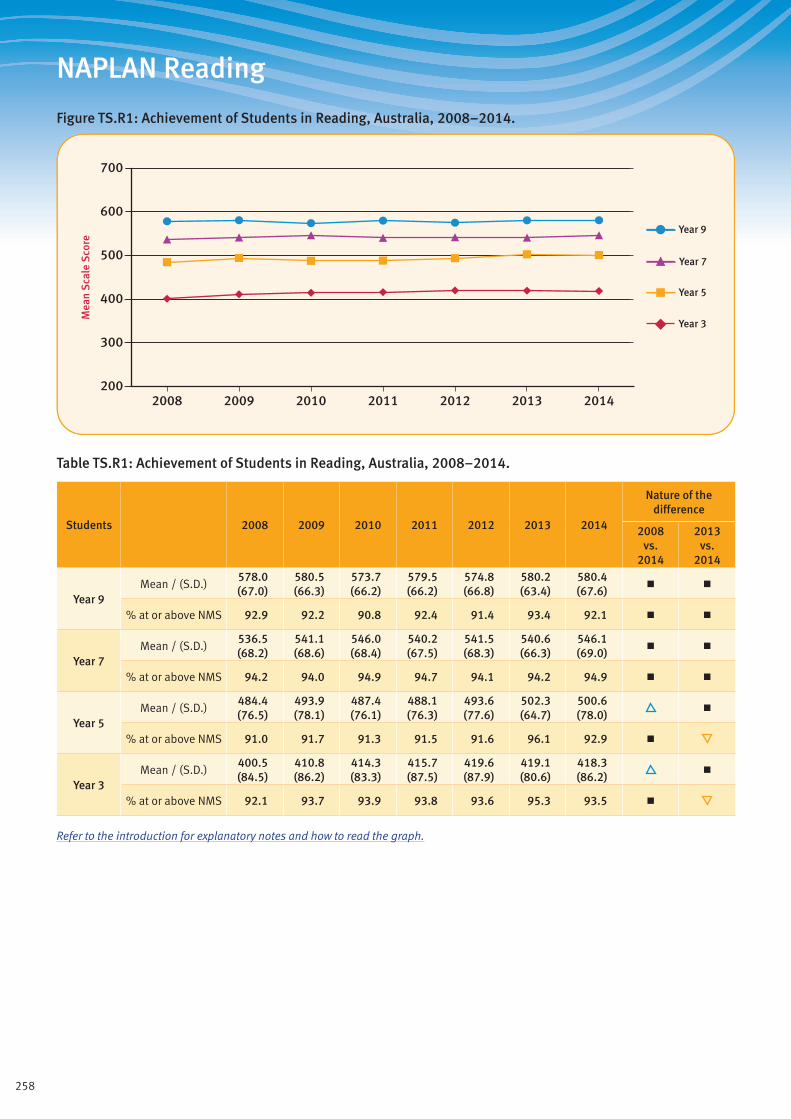
258
NAPLAN Reading
Figure TS.R1: Achievement of Students in Reading, Australia, 2008–2014.
Mea
n S
cale
Sco
re
Year 3
Year 5
Year 7
Year 9
200
300
400
500
600
700
2014201320122011201020092008
Table TS.R1: Achievement of Students in Reading, Australia, 2008–2014.
Students 2008 2009 2010 2011 2012 2013 2014
Nature of the difference
2008 vs.
2014
2013 vs.
2014
Year 9Mean / (S.D.)
578.0 (67.0)
580.5 (66.3)
573.7 (66.2)
579.5 (66.2)
574.8 (66.8)
580.2 (63.4)
580.4 (67.6)
■ ■
% at or above NMS 92.9 92.2 90.8 92.4 91.4 93.4 92.1 ■ ■
Year 7Mean / (S.D.)
536.5 (68.2)
541.1 (68.6)
546.0 (68.4)
540.2 (67.5)
541.5 (68.3)
540.6 (66.3)
546.1 (69.0)
■ ■
% at or above NMS 94.2 94.0 94.9 94.7 94.1 94.2 94.9 ■ ■
Year 5Mean / (S.D.)
484.4 (76.5)
493.9 (78.1)
487.4 (76.1)
488.1 (76.3)
493.6 (77.6)
502.3 (64.7)
500.6 (78.0)
■
% at or above NMS 91.0 91.7 91.3 91.5 91.6 96.1 92.9 ■
Year 3Mean / (S.D.)
400.5 (84.5)
410.8 (86.2)
414.3 (83.3)
415.7 (87.5)
419.6 (87.9)
419.1 (80.6)
418.3 (86.2)
■
% at or above NMS 92.1 93.7 93.9 93.8 93.6 95.3 93.5 ■
Refer to the introduction for explanatory notes and how to read the graph.
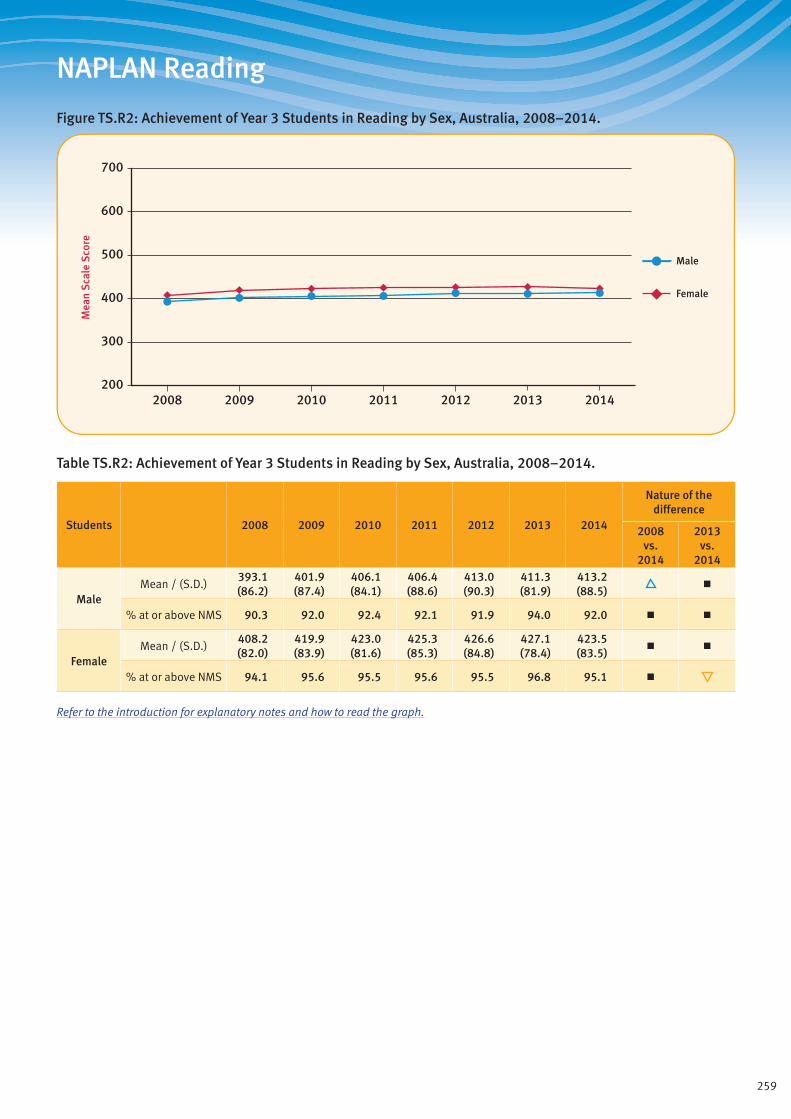
259
NAPLAN Reading
Figure TS.R2: Achievement of Year 3 Students in Reading by Sex, Australia, 2008–2014.
Mea
n S
cale
Sco
re
Female
Male
200
300
400
500
600
700
2014201320122011201020092008
Table TS.R2: Achievement of Year 3 Students in Reading by Sex, Australia, 2008–2014.
Students 2008 2009 2010 2011 2012 2013 2014
Nature of the difference
2008 vs.
2014
2013 vs.
2014
MaleMean / (S.D.)
393.1 (86.2)
401.9 (87.4)
406.1 (84.1)
406.4 (88.6)
413.0 (90.3)
411.3 (81.9)
413.2 (88.5)
■
% at or above NMS 90.3 92.0 92.4 92.1 91.9 94.0 92.0 ■ ■
FemaleMean / (S.D.)
408.2 (82.0)
419.9 (83.9)
423.0 (81.6)
425.3 (85.3)
426.6 (84.8)
427.1 (78.4)
423.5 (83.5)
■ ■
% at or above NMS 94.1 95.6 95.5 95.6 95.5 96.8 95.1 ■
Refer to the introduction for explanatory notes and how to read the graph.
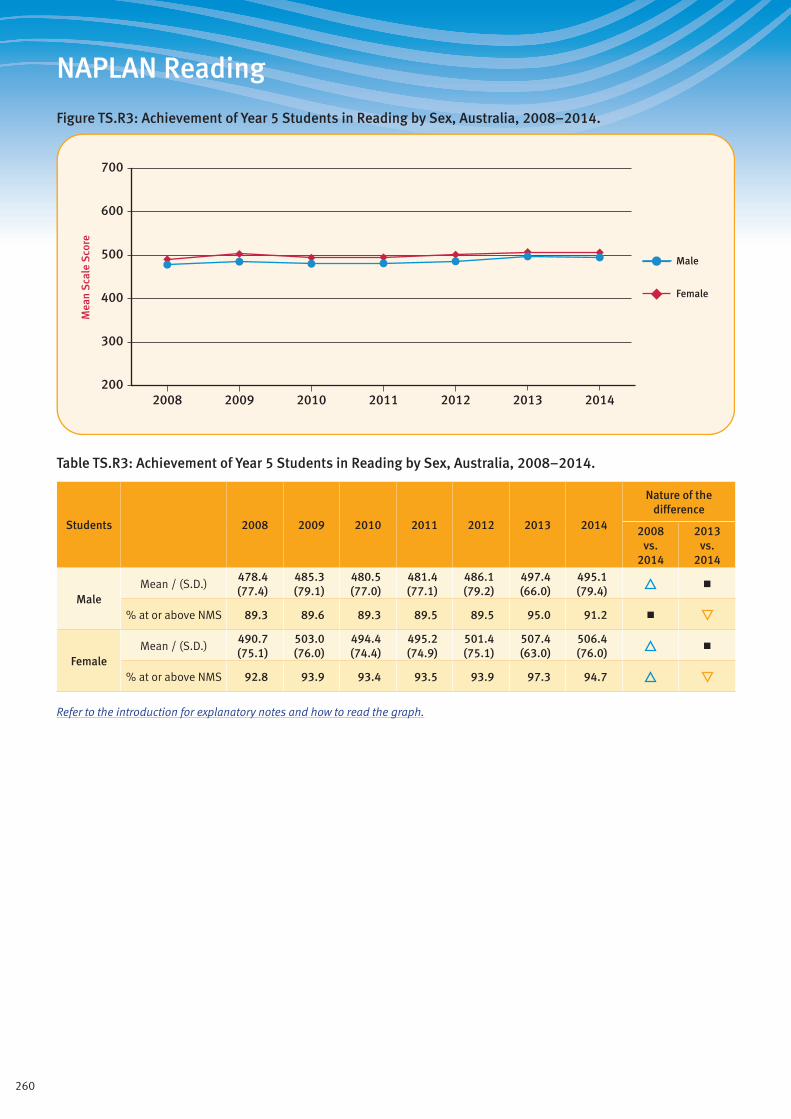
260
NAPLAN Reading
Figure TS.R3: Achievement of Year 5 Students in Reading by Sex, Australia, 2008–2014.
Mea
n S
cale
Sco
re
Female
Male
200
300
400
500
600
700
2014201320122011201020092008
Table TS.R3: Achievement of Year 5 Students in Reading by Sex, Australia, 2008–2014.
Students 2008 2009 2010 2011 2012 2013 2014
Nature of the difference
2008 vs.
2014
2013 vs.
2014
MaleMean / (S.D.)
478.4 (77.4)
485.3 (79.1)
480.5 (77.0)
481.4 (77.1)
486.1 (79.2)
497.4 (66.0)
495.1 (79.4)
■
% at or above NMS 89.3 89.6 89.3 89.5 89.5 95.0 91.2 ■
FemaleMean / (S.D.)
490.7 (75.1)
503.0 (76.0)
494.4 (74.4)
495.2 (74.9)
501.4 (75.1)
507.4 (63.0)
506.4 (76.0)
■
% at or above NMS 92.8 93.9 93.4 93.5 93.9 97.3 94.7
Refer to the introduction for explanatory notes and how to read the graph.
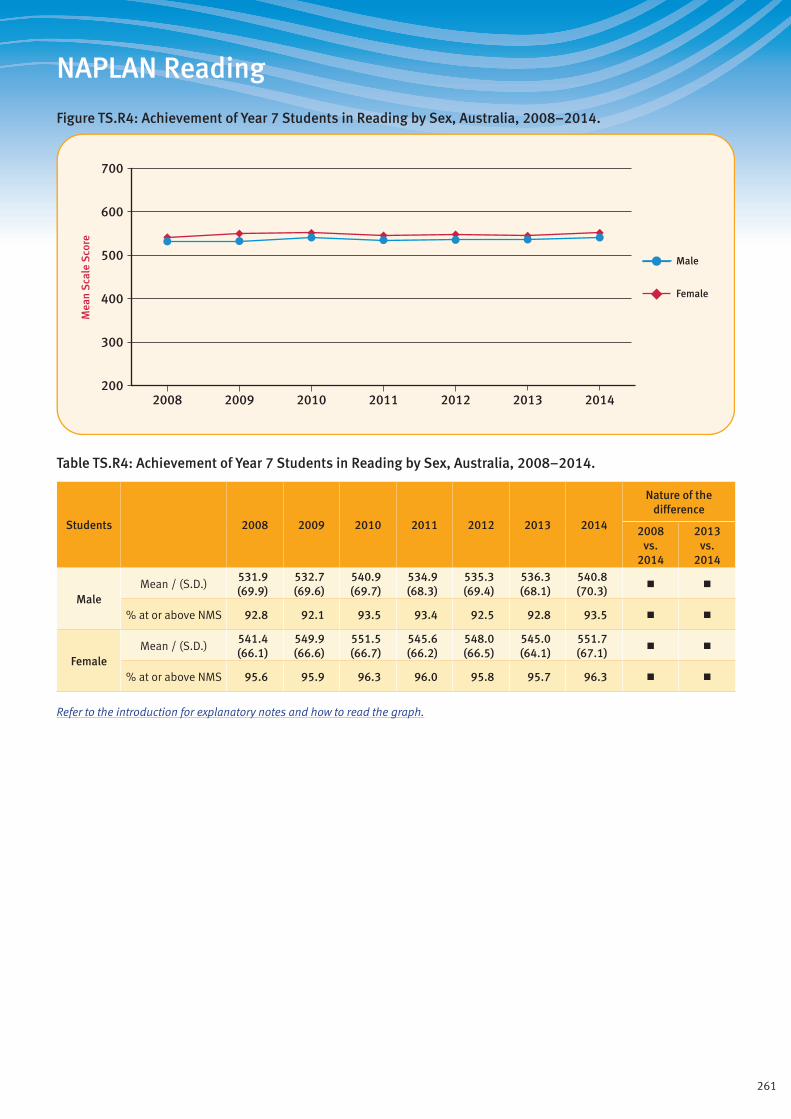
261
NAPLAN Reading
Figure TS.R4: Achievement of Year 7 Students in Reading by Sex, Australia, 2008–2014.
Mea
n S
cale
Sco
re
Female
Male
200
300
400
500
600
700
2014201320122011201020092008
Table TS.R4: Achievement of Year 7 Students in Reading by Sex, Australia, 2008–2014.
Students 2008 2009 2010 2011 2012 2013 2014
Nature of the difference
2008 vs.
2014
2013 vs.
2014
MaleMean / (S.D.)
531.9 (69.9)
532.7 (69.6)
540.9 (69.7)
534.9 (68.3)
535.3 (69.4)
536.3 (68.1)
540.8 (70.3)
■ ■
% at or above NMS 92.8 92.1 93.5 93.4 92.5 92.8 93.5 ■ ■
FemaleMean / (S.D.)
541.4 (66.1)
549.9 (66.6)
551.5 (66.7)
545.6 (66.2)
548.0 (66.5)
545.0 (64.1)
551.7 (67.1)
■ ■
% at or above NMS 95.6 95.9 96.3 96.0 95.8 95.7 96.3 ■ ■
Refer to the introduction for explanatory notes and how to read the graph.
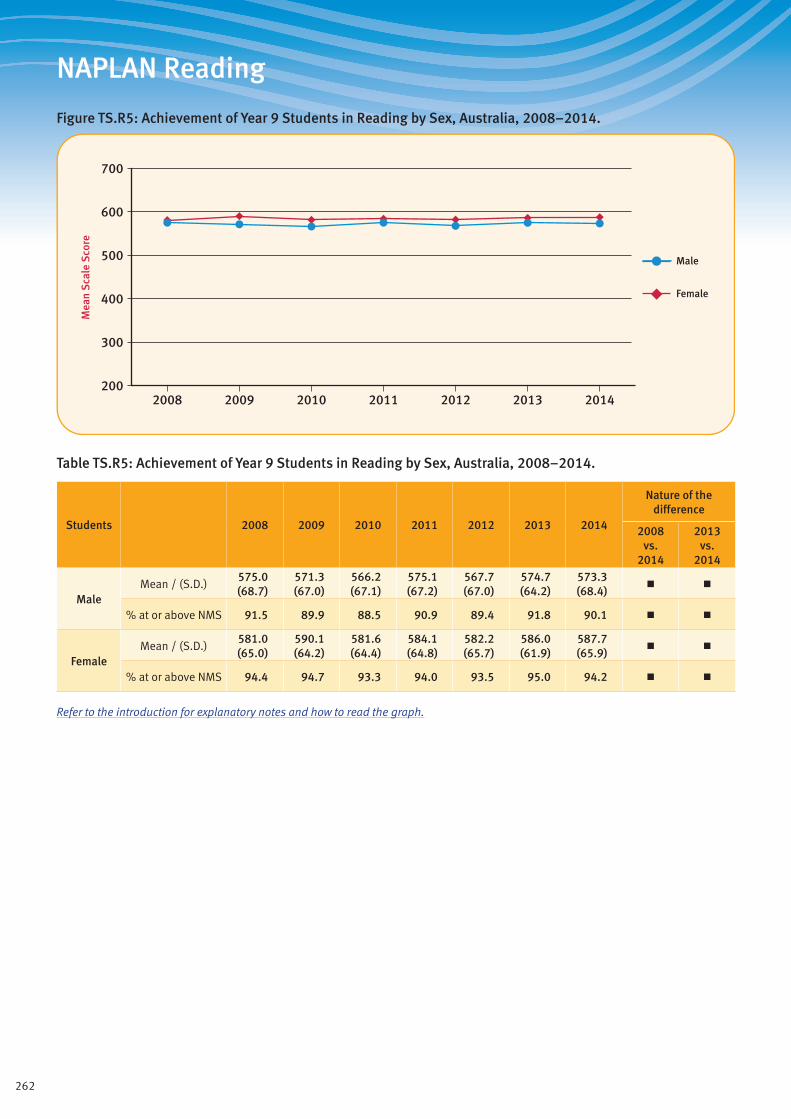
262
NAPLAN Reading
Figure TS.R5: Achievement of Year 9 Students in Reading by Sex, Australia, 2008–2014.
Mea
n S
cale
Sco
re
Female
Male
200
300
400
500
600
700
2014201320122011201020092008
Table TS.R5: Achievement of Year 9 Students in Reading by Sex, Australia, 2008–2014.
Students 2008 2009 2010 2011 2012 2013 2014
Nature of the difference
2008 vs.
2014
2013 vs.
2014
MaleMean / (S.D.)
575.0 (68.7)
571.3 (67.0)
566.2 (67.1)
575.1 (67.2)
567.7 (67.0)
574.7 (64.2)
573.3 (68.4)
■ ■
% at or above NMS 91.5 89.9 88.5 90.9 89.4 91.8 90.1 ■ ■
FemaleMean / (S.D.)
581.0 (65.0)
590.1 (64.2)
581.6 (64.4)
584.1 (64.8)
582.2 (65.7)
586.0 (61.9)
587.7 (65.9)
■ ■
% at or above NMS 94.4 94.7 93.3 94.0 93.5 95.0 94.2 ■ ■
Refer to the introduction for explanatory notes and how to read the graph.
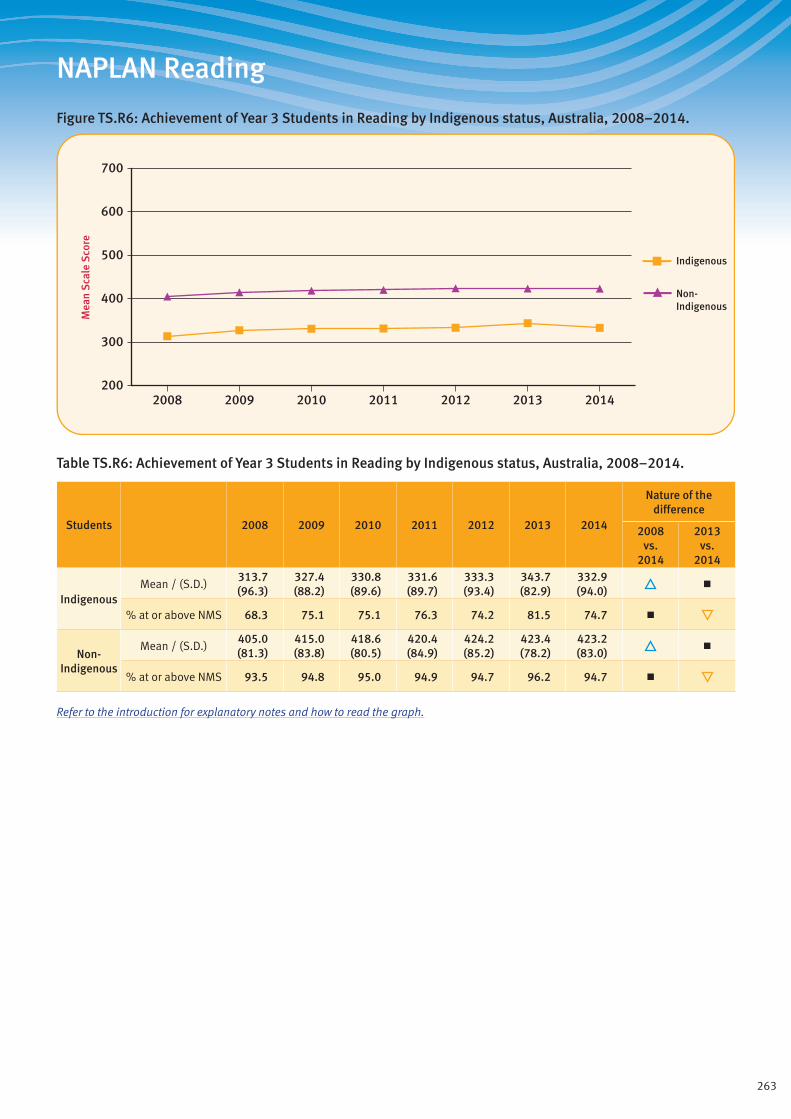
263
NAPLAN Reading
Figure TS.R6: Achievement of Year 3 Students in Reading by Indigenous status, Australia, 2008–2014.
Mea
n S
cale
Sco
re
Non-Indigenous
Indigenous
200
300
400
500
600
700
2014201320122011201020092008
Table TS.R6: Achievement of Year 3 Students in Reading by Indigenous status, Australia, 2008–2014.
Students 2008 2009 2010 2011 2012 2013 2014
Nature of the difference
2008 vs.
2014
2013 vs.
2014
IndigenousMean / (S.D.)
313.7 (96.3)
327.4 (88.2)
330.8 (89.6)
331.6 (89.7)
333.3 (93.4)
343.7 (82.9)
332.9 (94.0)
■
% at or above NMS 68.3 75.1 75.1 76.3 74.2 81.5 74.7 ■
Non- Indigenous
Mean / (S.D.)405.0 (81.3)
415.0 (83.8)
418.6 (80.5)
420.4 (84.9)
424.2 (85.2)
423.4 (78.2)
423.2 (83.0)
■
% at or above NMS 93.5 94.8 95.0 94.9 94.7 96.2 94.7 ■
Refer to the introduction for explanatory notes and how to read the graph.
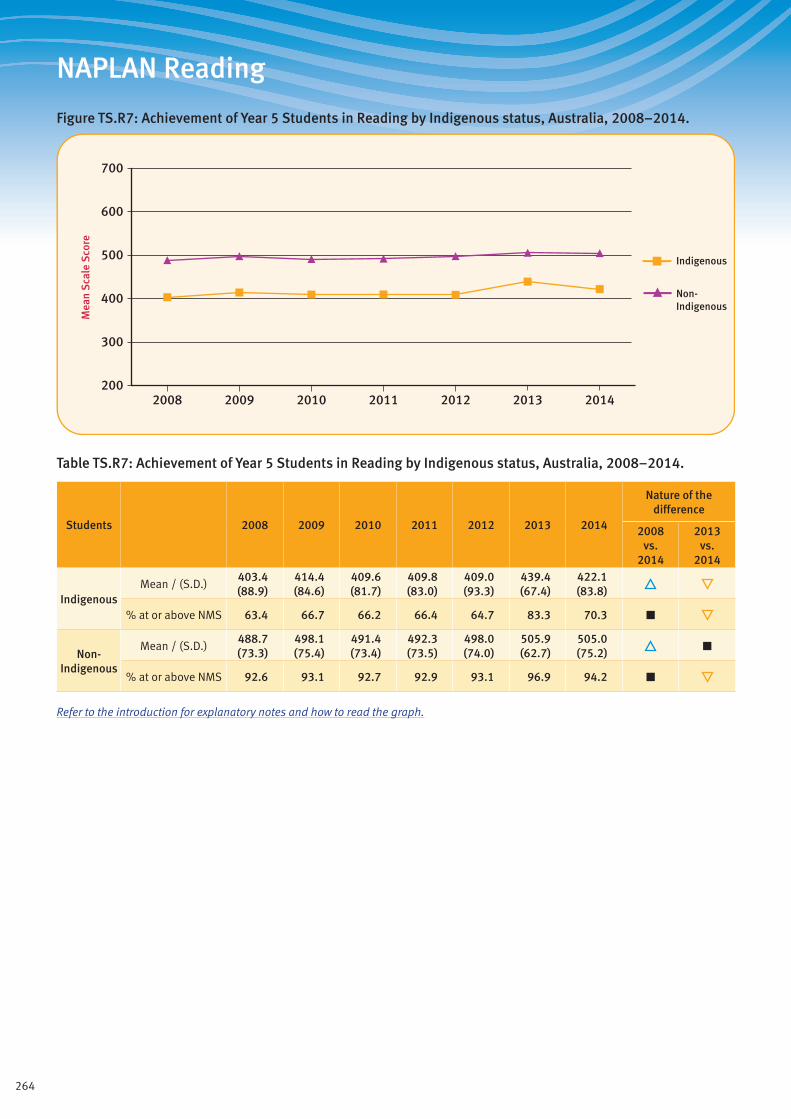
264
NAPLAN Reading
Figure TS.R7: Achievement of Year 5 Students in Reading by Indigenous status, Australia, 2008–2014.
Mea
n S
cale
Sco
re
Non-Indigenous
Indigenous
200
300
400
500
600
700
2014201320122011201020092008
Table TS.R7: Achievement of Year 5 Students in Reading by Indigenous status, Australia, 2008–2014.
Students 2008 2009 2010 2011 2012 2013 2014
Nature of the difference
2008 vs.
2014
2013 vs.
2014
IndigenousMean / (S.D.)
403.4 (88.9)
414.4 (84.6)
409.6 (81.7)
409.8 (83.0)
409.0 (93.3)
439.4 (67.4)
422.1 (83.8)
% at or above NMS 63.4 66.7 66.2 66.4 64.7 83.3 70.3 ■
Non- Indigenous
Mean / (S.D.)488.7 (73.3)
498.1 (75.4)
491.4 (73.4)
492.3 (73.5)
498.0 (74.0)
505.9 (62.7)
505.0 (75.2)
■
% at or above NMS 92.6 93.1 92.7 92.9 93.1 96.9 94.2 ■
Refer to the introduction for explanatory notes and how to read the graph.

265
NAPLAN Reading
Figure TS.R8: Achievement of Year 7 Students in Reading by Indigenous status, Australia, 2008–2014.
Mea
n S
cale
Sco
re
Non-Indigenous
Indigenous
200
300
400
500
600
700
2014201320122011201020092008
Table TS.R8: Achievement of Year 7 Students in Reading by Indigenous status, Australia, 2008–2014.
Students 2008 2009 2010 2011 2012 2013 2014
Nature of the difference
2008 vs.
2014
2013 vs.
2014
IndigenousMean / (S.D.)
466.5 (76.3)
473.2 (71.5)
477.0 (67.7)
475.3 (66.6)
474.8 (72.5)
472.4 (72.3)
479.0 (72.4)
■ ■
% at or above NMS 71.9 73.2 76.6 77.1 75.4 73.2 77.1 ■ ■
Non- Indigenous
Mean / (S.D.)540.2 (65.7)
544.4 (66.7)
549.6 (66.5)
543.7 (65.6)
545.0 (66.1)
544.3 (63.8)
549.8 (66.8)
■ ■
% at or above NMS 95.4 95.0 95.9 95.7 95.1 95.4 95.9 ■ ■
Refer to the introduction for explanatory notes and how to read the graph.

266
NAPLAN Reading
Figure TS.R9: Achievement of Year 9 Students in Reading by Indigenous status, Australia, 2008–2014.
Mea
n S
cale
Sco
re
Non-Indigenous
Indigenous
200
300
400
500
600
700
2014201320122011201020092008
Table TS.R9: Achievement of Year 9 Students in Reading by Indigenous status, Australia, 2008–2014.
Students 2008 2009 2010 2011 2012 2013 2014
Nature of the difference
2008 vs.
2014
2013 vs.
2014
IndigenousMean / (S.D.)
513.8 (73.2)
510.2 (74.2)
505.6 (67.1)
518.1 (66.3)
509.8 (69.5)
520.1 (65.0)
517.4 (71.4)
■ ■
% at or above NMS 70.7 67.0 64.2 71.9 67.2 73.9 71.2 ■ ■
Non- Indigenous
Mean / (S.D.)581.3 (65.0)
583.8 (64.0)
577.1 (64.3)
582.5 (64.5)
578.0 (64.9)
583.6 (61.4)
583.9 (65.6)
■ ■
% at or above NMS 94.2 93.5 92.2 93.5 92.7 94.5 93.3 ■ ■
Refer to the introduction for explanatory notes and how to read the graph.
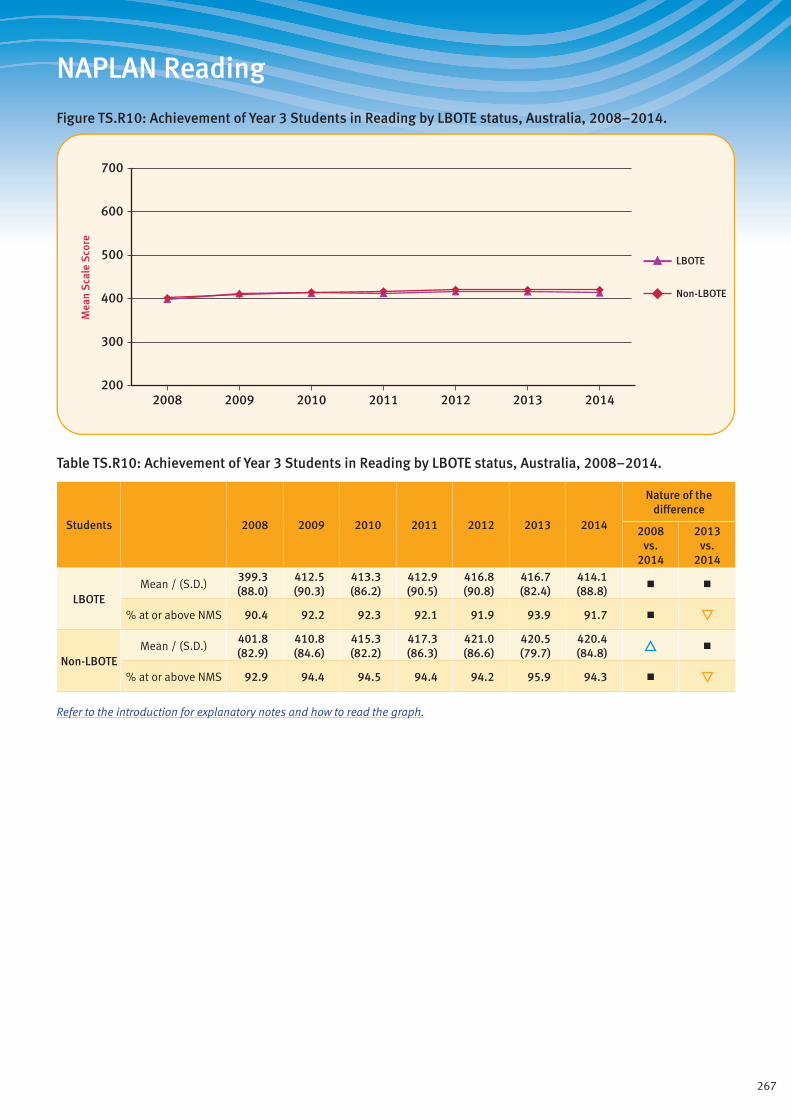
267
NAPLAN Reading
Figure TS.R10: Achievement of Year 3 Students in Reading by LBOTE status, Australia, 2008–2014.
Mea
n S
cale
Sco
re
Non-LBOTE
LBOTE
200
300
400
500
600
700
2014201320122011201020092008
Table TS.R10: Achievement of Year 3 Students in Reading by LBOTE status, Australia, 2008–2014.
Students 2008 2009 2010 2011 2012 2013 2014
Nature of the difference
2008 vs.
2014
2013 vs.
2014
LBOTEMean / (S.D.)
399.3 (88.0)
412.5 (90.3)
413.3 (86.2)
412.9 (90.5)
416.8 (90.8)
416.7 (82.4)
414.1 (88.8)
■ ■
% at or above NMS 90.4 92.2 92.3 92.1 91.9 93.9 91.7 ■
Non-LBOTEMean / (S.D.)
401.8 (82.9)
410.8 (84.6)
415.3 (82.2)
417.3 (86.3)
421.0 (86.6)
420.5 (79.7)
420.4 (84.8)
■
% at or above NMS 92.9 94.4 94.5 94.4 94.2 95.9 94.3 ■
Refer to the introduction for explanatory notes and how to read the graph.
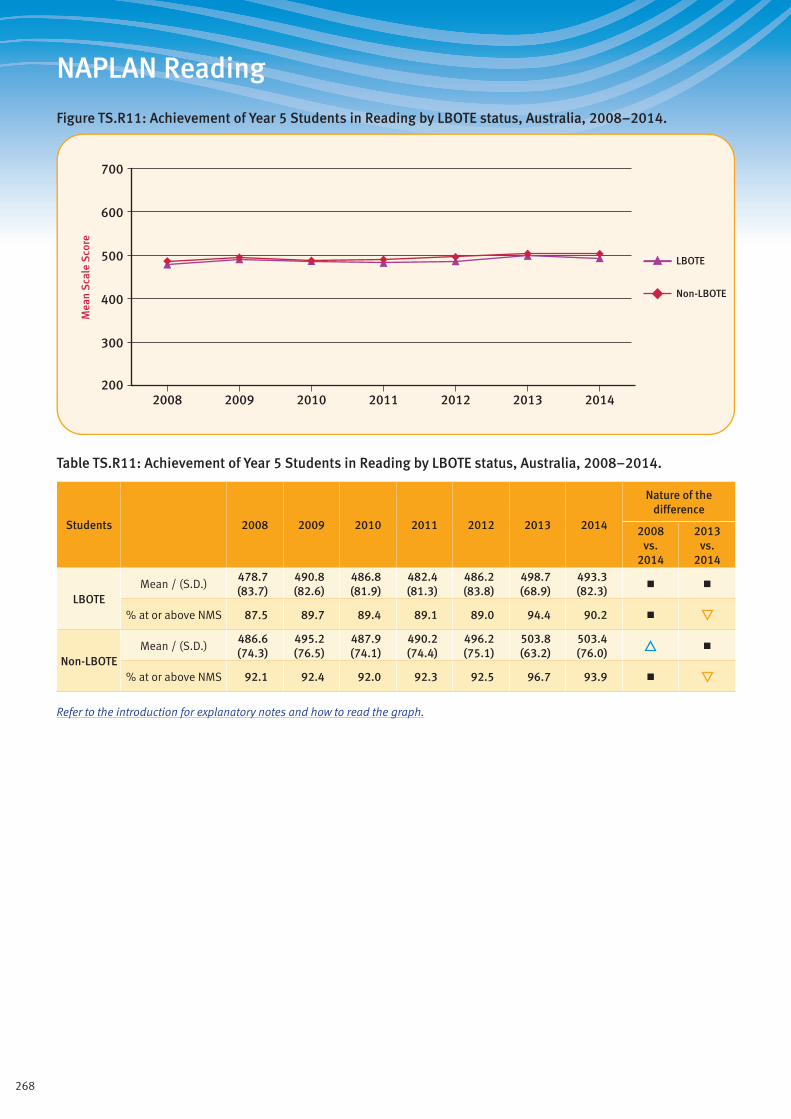
268
NAPLAN Reading
Figure TS.R11: Achievement of Year 5 Students in Reading by LBOTE status, Australia, 2008–2014.
Mea
n S
cale
Sco
re
Non-LBOTE
LBOTE
200
300
400
500
600
700
2014201320122011201020092008
Table TS.R11: Achievement of Year 5 Students in Reading by LBOTE status, Australia, 2008–2014.
Students 2008 2009 2010 2011 2012 2013 2014
Nature of the difference
2008 vs.
2014
2013 vs.
2014
LBOTEMean / (S.D.)
478.7 (83.7)
490.8 (82.6)
486.8 (81.9)
482.4 (81.3)
486.2 (83.8)
498.7 (68.9)
493.3 (82.3)
■ ■
% at or above NMS 87.5 89.7 89.4 89.1 89.0 94.4 90.2 ■
Non-LBOTEMean / (S.D.)
486.6 (74.3)
495.2 (76.5)
487.9 (74.1)
490.2 (74.4)
496.2 (75.1)
503.8 (63.2)
503.4 (76.0)
■
% at or above NMS 92.1 92.4 92.0 92.3 92.5 96.7 93.9 ■
Refer to the introduction for explanatory notes and how to read the graph.
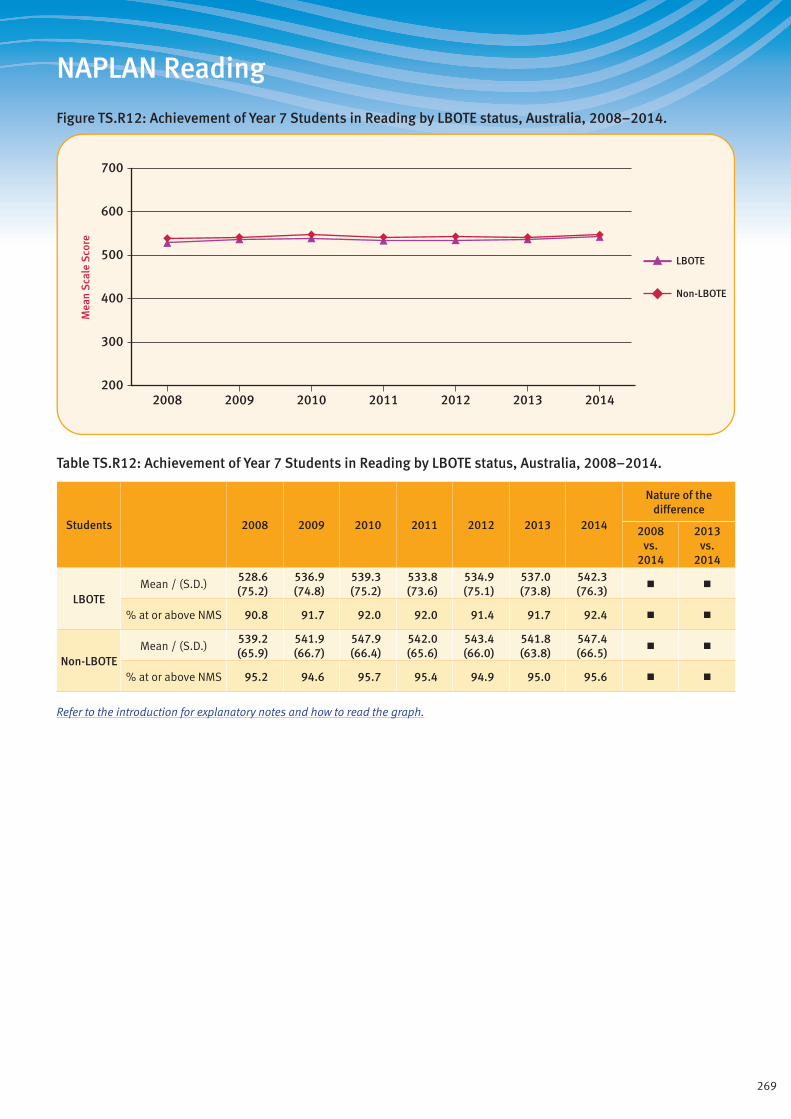
269
NAPLAN Reading
Figure TS.R12: Achievement of Year 7 Students in Reading by LBOTE status, Australia, 2008–2014.
Mea
n S
cale
Sco
re
Non-LBOTE
LBOTE
200
300
400
500
600
700
2014201320122011201020092008
Table TS.R12: Achievement of Year 7 Students in Reading by LBOTE status, Australia, 2008–2014.
Students 2008 2009 2010 2011 2012 2013 2014
Nature of the difference
2008 vs.
2014
2013 vs.
2014
LBOTEMean / (S.D.)
528.6 (75.2)
536.9 (74.8)
539.3 (75.2)
533.8 (73.6)
534.9 (75.1)
537.0 (73.8)
542.3 (76.3)
■ ■
% at or above NMS 90.8 91.7 92.0 92.0 91.4 91.7 92.4 ■ ■
Non-LBOTEMean / (S.D.)
539.2 (65.9)
541.9 (66.7)
547.9 (66.4)
542.0 (65.6)
543.4 (66.0)
541.8 (63.8)
547.4 (66.5)
■ ■
% at or above NMS 95.2 94.6 95.7 95.4 94.9 95.0 95.6 ■ ■
Refer to the introduction for explanatory notes and how to read the graph.
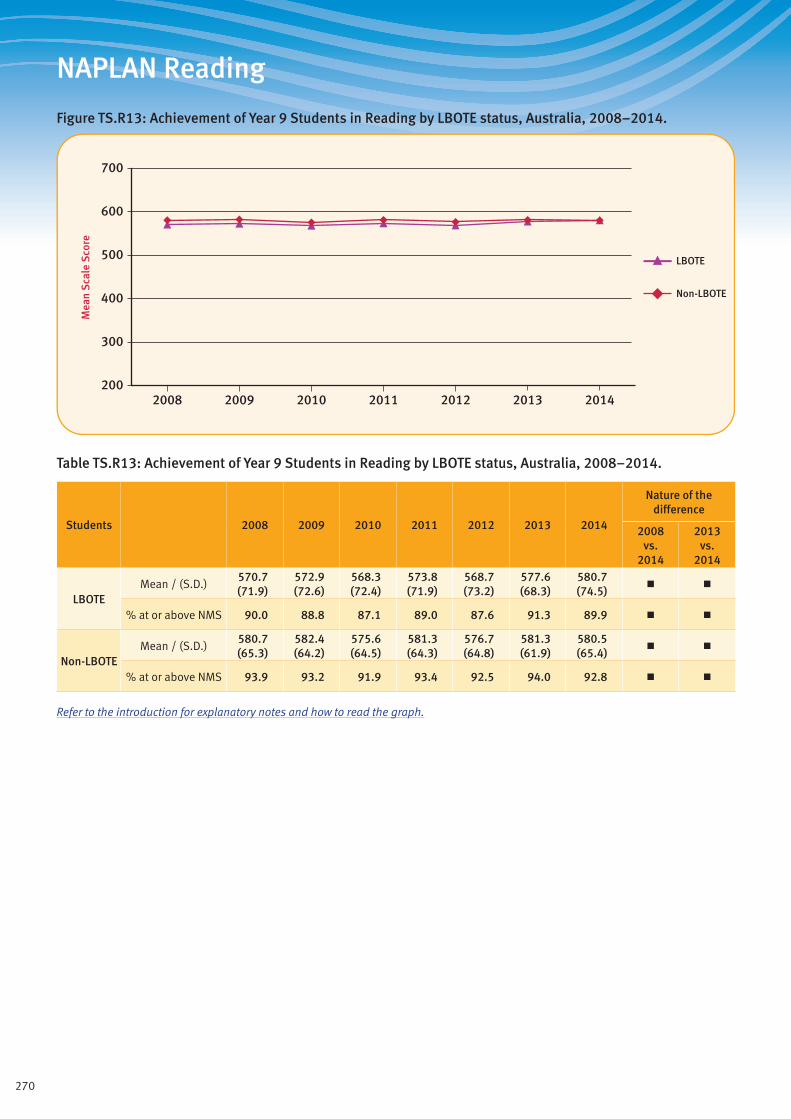
270
NAPLAN Reading
Figure TS.R13: Achievement of Year 9 Students in Reading by LBOTE status, Australia, 2008–2014.
Mea
n S
cale
Sco
re
Non-LBOTE
LBOTE
200
300
400
500
600
700
2014201320122011201020092008
Table TS.R13: Achievement of Year 9 Students in Reading by LBOTE status, Australia, 2008–2014.
Students 2008 2009 2010 2011 2012 2013 2014
Nature of the difference
2008 vs.
2014
2013 vs.
2014
LBOTEMean / (S.D.)
570.7 (71.9)
572.9 (72.6)
568.3 (72.4)
573.8 (71.9)
568.7 (73.2)
577.6 (68.3)
580.7 (74.5)
■ ■
% at or above NMS 90.0 88.8 87.1 89.0 87.6 91.3 89.9 ■ ■
Non-LBOTEMean / (S.D.)
580.7 (65.3)
582.4 (64.2)
575.6 (64.5)
581.3 (64.3)
576.7 (64.8)
581.3 (61.9)
580.5 (65.4)
■ ■
% at or above NMS 93.9 93.2 91.9 93.4 92.5 94.0 92.8 ■ ■
Refer to the introduction for explanatory notes and how to read the graph.

271
NAPLAN Reading
Figure TS.R14: Achievement of Students in Reading, NSW, 2008–2014.
Mea
n S
cale
Sco
re
Year 3
Year 5
Year 7
Year 9
200
300
400
500
600
700
2014201320122011201020092008
Table TS.R14: Achievement of Students in Reading, NSW, 2008–2014.
Students 2008 2009 2010 2011 2012 2013 2014
Nature of the difference
2008 vs.
2014
2013 vs.
2014
Year 9Mean / (S.D.)
583.1 (66.9)
585.4 (66.4)
578.2 (68.6)
583.0 (67.8)
577.9 (67.5)
584.0 (64.1)
584.3 (69.1)
■ ■
% at or above NMS 94.4 93.6 91.2 93.0 91.9 94.1 92.6 ■ ■
Year 7Mean / (S.D.)
542.5 (69.0)
545.9 (70.3)
548.6 (71.0)
543.5 (69.9)
546.1 (70.4)
544.1 (67.5)
548.3 (69.9)
■ ■
% at or above NMS 95.4 94.8 95.0 95.0 94.7 94.7 95.4 ■ ■
Year 5Mean / (S.D.)
494.7 (74.9)
503.4 (77.6)
496.2 (76.0)
495.4 (75.8)
499.8 (77.1)
506.4 (65.0)
504.0 (77.8)
■ ■
% at or above NMS 93.5 93.7 93.0 93.1 92.9 96.8 93.7 ■
Year 3Mean / (S.D.)
412.3 (80.1)
422.3 (85.4)
421.7 (81.6)
423.1 (85.4)
426.0 (86.5)
424.0 (79.1)
422.9 (84.2)
■ ■
% at or above NMS 95.1 95.6 95.3 95.2 94.8 96.3 94.7 ■
Refer to the introduction for explanatory notes and how to read the graph.

272
NAPLAN Reading
Figure TS.R15: Achievement of Students in Reading, Vic, 2008–2014.
Mea
n S
cale
Sco
re
Year 3
Year 5
Year 7
Year 9
200
300
400
500
600
700
2014201320122011201020092008
Table TS.R15: Achievement of Students in Reading, Vic, 2008–2014.
Students 2008 2009 2010 2011 2012 2013 2014
Nature of the difference
2008 vs.
2014
2013 vs.
2014
Year 9Mean / (S.D.)
584.6 (62.6)
588.0 (62.0)
582.1 (61.7)
585.0 (62.3)
581.6 (64.5)
584.6 (60.6)
585.5 (64.7)
■ ■
% at or above NMS 94.7 94.3 93.3 94.0 93.0 94.3 93.3 ■ ■
Year 7Mean / (S.D.)
543.0 (63.1)
547.1 (64.6)
553.3 (65.0)
544.8 (63.3)
548.3 (64.4)
546.9 (61.6)
550.3 (65.9)
■ ■
% at or above NMS 95.8 95.4 96.2 95.8 95.5 95.6 95.6 ■ ■
Year 5Mean / (S.D.)
496.7 (69.3)
506.3 (71.5)
502.2 (69.8)
503.7 (70.5)
504.1 (70.6)
510.1 (61.2)
509.8 (73.1)
■ ■
% at or above NMS 93.7 94.2 94.2 94.3 94.1 96.5 94.2 ■
Year 3Mean / (S.D.)
419.9 (74.9)
430.4 (81.7)
430.6 (77.8)
433.5 (82.8)
432.0 (82.0)
434.1 (76.6)
431.7 (80.8)
■ ■
% at or above NMS 95.2 95.2 95.4 95.3 95.2 96.0 94.6 ■ ■
Refer to the introduction for explanatory notes and how to read the graph.

273
NAPLAN Reading
Figure TS.R16: Achievement of Students in Reading, Qld, 2008–2014.
Mea
n S
cale
Sco
re
Year 3
Year 5
Year 7
Year 9
200
300
400
500
600
700
2014201320122011201020092008
Table TS.R16: Achievement of Students in Reading, Qld, 2008–2014.
Students 2008 2009 2010 2011 2012 2013 2014
Nature of the difference
2008 vs.
2014
2013 vs.
2014
Year 9Mean / (S.D.)
568.2 (68.0)
570.4 (65.6)
564.9 (63.8)
572.4 (64.2)
566.8 (63.6)
572.4 (62.0)
571.6 (64.3)
■ ■
% at or above NMS 90.5 90.0 89.5 91.6 90.5 92.7 91.3 ■ ■
Year 7Mean / (S.D.)
528.1 (67.1)
532.8 (66.2)
537.5 (64.6)
533.5 (65.0)
532.7 (64.9)
533.5 (64.1)
541.6 (66.9)
■
% at or above NMS 92.9 92.9 94.6 94.3 93.3 93.6 94.4 ■ ■
Year 5Mean / (S.D.)
466.1 (77.5)
477.8 (76.8)
468.7 (72.5)
469.4 (71.9)
480.3 (75.5)
497.0 (63.4)
496.1 (76.6)
■
% at or above NMS 86.9 88.9 88.2 88.6 89.1 96.2 92.8
Year 3Mean / (S.D.)
371.1 (84.9)
385.9 (79.3)
393.0 (79.0)
399.9 (84.6)
408.5 (87.4)
407.7 (78.8)
409.4 (84.0)
■
% at or above NMS 87.1 92.0 92.1 92.8 92.7 95.1 93.4 ■
Refer to the introduction for explanatory notes and how to read the graph.
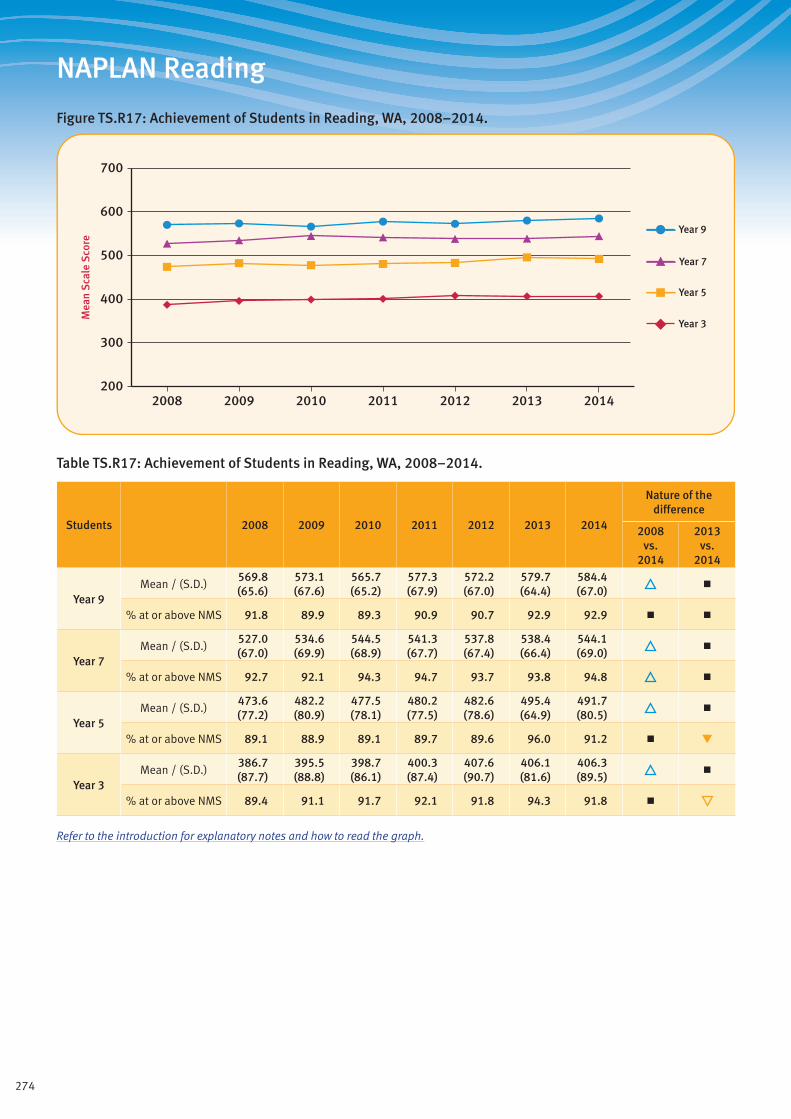
274
NAPLAN Reading
Figure TS.R17: Achievement of Students in Reading, WA, 2008–2014.
Mea
n S
cale
Sco
re
Year 3
Year 5
Year 7
Year 9
200
300
400
500
600
700
2014201320122011201020092008
Table TS.R17: Achievement of Students in Reading, WA, 2008–2014.
Students 2008 2009 2010 2011 2012 2013 2014
Nature of the difference
2008 vs.
2014
2013 vs.
2014
Year 9Mean / (S.D.)
569.8 (65.6)
573.1 (67.6)
565.7 (65.2)
577.3 (67.9)
572.2 (67.0)
579.7 (64.4)
584.4 (67.0)
■
% at or above NMS 91.8 89.9 89.3 90.9 90.7 92.9 92.9 ■ ■
Year 7Mean / (S.D.)
527.0 (67.0)
534.6 (69.9)
544.5 (68.9)
541.3 (67.7)
537.8 (67.4)
538.4 (66.4)
544.1 (69.0)
■
% at or above NMS 92.7 92.1 94.3 94.7 93.7 93.8 94.8 ■
Year 5Mean / (S.D.)
473.6 (77.2)
482.2 (80.9)
477.5 (78.1)
480.2 (77.5)
482.6 (78.6)
495.4 (64.9)
491.7 (80.5)
■
% at or above NMS 89.1 88.9 89.1 89.7 89.6 96.0 91.2 ■ ▼
Year 3Mean / (S.D.)
386.7 (87.7)
395.5 (88.8)
398.7 (86.1)
400.3 (87.4)
407.6 (90.7)
406.1 (81.6)
406.3 (89.5)
■
% at or above NMS 89.4 91.1 91.7 92.1 91.8 94.3 91.8 ■
Refer to the introduction for explanatory notes and how to read the graph.

275
NAPLAN Reading
Figure TS.R18: Achievement of Students in Reading, SA, 2008–2014.
Mea
n S
cale
Sco
re
Year 3
Year 5
Year 7
Year 9
200
300
400
500
600
700
2014201320122011201020092008
Table TS.R18: Achievement of Students in Reading, SA, 2008–2014.
Students 2008 2009 2010 2011 2012 2013 2014
Nature of the difference
2008 vs.
2014
2013 vs.
2014
Year 9Mean / (S.D.)
574.9 (64.1)
577.4 (63.7)
567.1 (64.4)
572.9 (63.2)
570.1 (64.6)
576.6 (59.7)
573.0 (65.6)
■ ■
% at or above NMS 91.7 92.1 89.9 91.6 90.8 93.2 90.3 ■
Year 7Mean / (S.D.)
533.5 (65.2)
536.8 (66.6)
543.2 (64.7)
533.8 (63.4)
537.0 (65.2)
535.9 (64.0)
541.1 (65.1)
■ ■
% at or above NMS 93.4 93.6 95.3 94.2 93.7 94.0 95.0 ■ ■
Year 5Mean / (S.D.)
477.9 (71.3)
484.3 (75.2)
476.5 (72.6)
478.0 (73.6)
483.9 (73.7)
491.9 (60.9)
489.6 (75.6)
■ ■
% at or above NMS 89.9 91.0 90.1 90.1 90.7 95.7 91.6 ■
Year 3Mean / (S.D.)
400.5 (80.5)
399.0 (80.2)
401.6 (79.2)
402.2 (85.7)
408.9 (85.0)
409.6 (78.9)
407.3 (86.3)
■ ■
% at or above NMS 91.5 93.6 93.2 92.0 92.6 94.3 91.8 ■
Refer to the introduction for explanatory notes and how to read the graph.
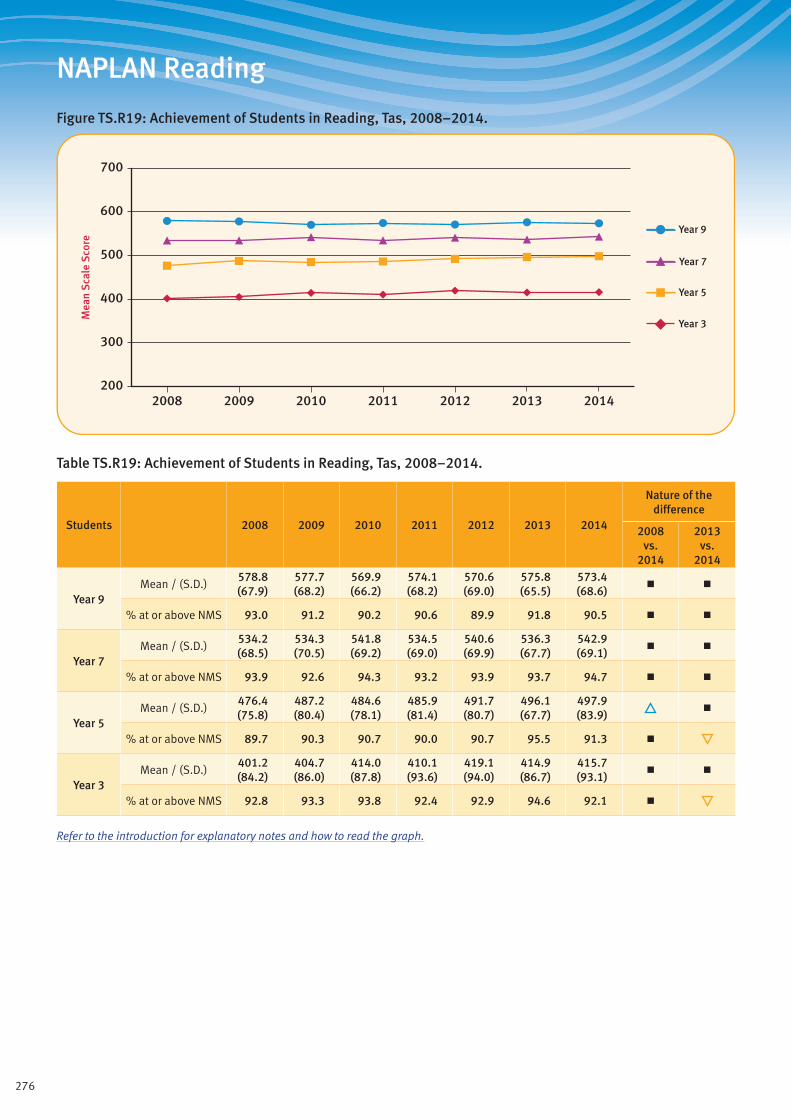
276
NAPLAN Reading
Figure TS.R19: Achievement of Students in Reading, Tas, 2008–2014.
Mea
n S
cale
Sco
re
Year 3
Year 5
Year 7
Year 9
200
300
400
500
600
700
2014201320122011201020092008
Table TS.R19: Achievement of Students in Reading, Tas, 2008–2014.
Students 2008 2009 2010 2011 2012 2013 2014
Nature of the difference
2008 vs.
2014
2013 vs.
2014
Year 9Mean / (S.D.)
578.8 (67.9)
577.7 (68.2)
569.9 (66.2)
574.1 (68.2)
570.6 (69.0)
575.8 (65.5)
573.4 (68.6)
■ ■
% at or above NMS 93.0 91.2 90.2 90.6 89.9 91.8 90.5 ■ ■
Year 7Mean / (S.D.)
534.2 (68.5)
534.3 (70.5)
541.8 (69.2)
534.5 (69.0)
540.6 (69.9)
536.3 (67.7)
542.9 (69.1)
■ ■
% at or above NMS 93.9 92.6 94.3 93.2 93.9 93.7 94.7 ■ ■
Year 5Mean / (S.D.)
476.4 (75.8)
487.2 (80.4)
484.6 (78.1)
485.9 (81.4)
491.7 (80.7)
496.1 (67.7)
497.9 (83.9)
■
% at or above NMS 89.7 90.3 90.7 90.0 90.7 95.5 91.3 ■
Year 3Mean / (S.D.)
401.2 (84.2)
404.7 (86.0)
414.0 (87.8)
410.1 (93.6)
419.1 (94.0)
414.9 (86.7)
415.7 (93.1)
■ ■
% at or above NMS 92.8 93.3 93.8 92.4 92.9 94.6 92.1 ■
Refer to the introduction for explanatory notes and how to read the graph.

277
NAPLAN Reading
Figure TS.R20: Achievement of Students in Reading, ACT, 2008–2014.
Mea
n S
cale
Sco
re
Year 3
Year 5
Year 7
Year 9
200
300
400
500
600
700
2014201320122011201020092008
Table TS.R20: Achievement of Students in Reading, ACT, 2008–2014.
Students 2008 2009 2010 2011 2012 2013 2014
Nature of the difference
2008 vs.
2014
2013 vs.
2014
Year 9Mean / (S.D.)
601.9 (68.4)
598.9 (65.4)
594.8 (67.5)
597.9 (68.8)
597.0 (68.8)
599.5 (61.3)
597.3 (68.4)
■ ■
% at or above NMS 96.6 94.1 93.7 94.4 94.7 96.0 93.9 ■
Year 7Mean / (S.D.)
558.2 (70.2)
558.3 (69.4)
567.3 (67.2)
561.8 (66.9)
558.6 (68.3)
560.6 (64.6)
567.3 (68.5)
■ ■
% at or above NMS 96.3 95.5 96.9 96.8 95.7 95.9 96.5 ■ ■
Year 5Mean / (S.D.)
503.3 (72.2)
512.7 (75.3)
508.6 (72.8)
516.3 (74.0)
519.0 (75.5)
519.2 (63.7)
522.0 (76.9)
■
% at or above NMS 94.8 94.0 94.2 94.5 94.9 97.0 95.6 ■ ■
Year 3Mean / (S.D.)
421.0 (81.5)
433.6 (84.3)
439.1 (83.4)
443.0 (87.9)
443.8 (88.1)
441.9 (81.0)
438.7 (86.4)
■
% at or above NMS 94.4 94.7 95.7 95.6 96.0 96.1 95.4 ■ ■
Refer to the introduction for explanatory notes and how to read the graph.
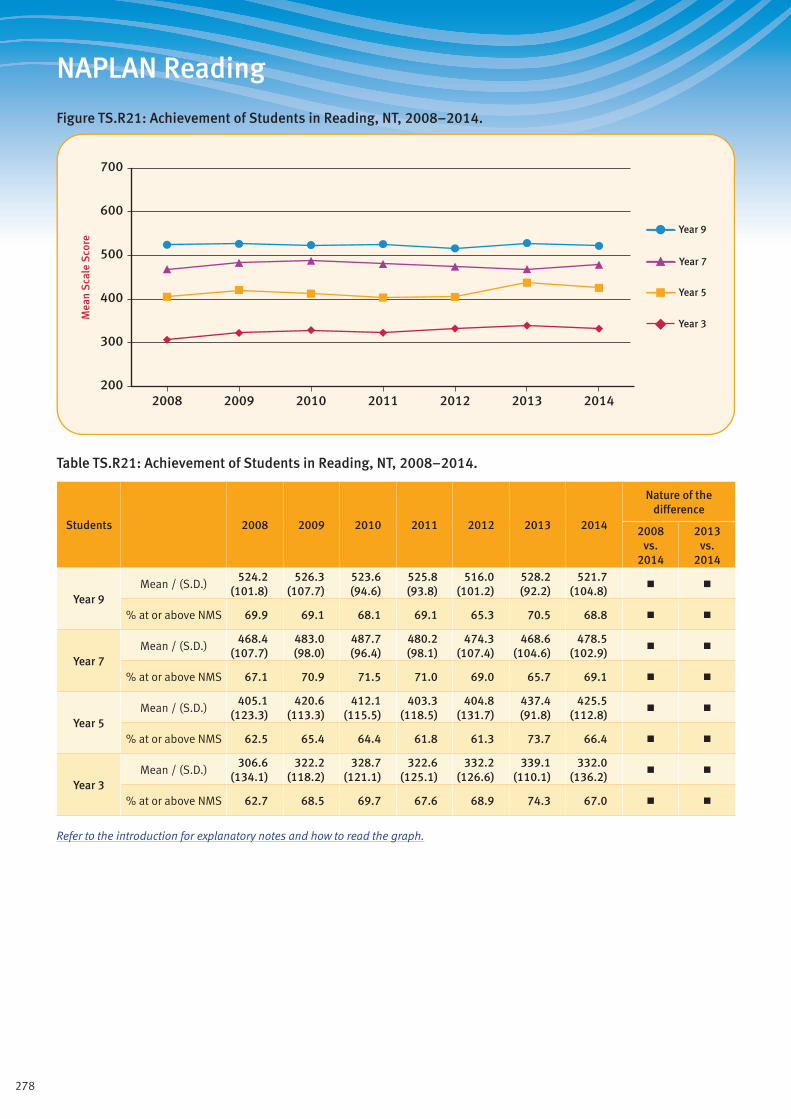
278
NAPLAN Reading
Figure TS.R21: Achievement of Students in Reading, NT, 2008–2014.
Mea
n S
cale
Sco
re
Year 3
Year 5
Year 7
Year 9
200
300
400
500
600
700
2014201320122011201020092008
Table TS.R21: Achievement of Students in Reading, NT, 2008–2014.
Students 2008 2009 2010 2011 2012 2013 2014
Nature of the difference
2008 vs.
2014
2013 vs.
2014
Year 9Mean / (S.D.)
524.2 (101.8)
526.3 (107.7)
523.6 (94.6)
525.8 (93.8)
516.0 (101.2)
528.2 (92.2)
521.7 (104.8)
■ ■
% at or above NMS 69.9 69.1 68.1 69.1 65.3 70.5 68.8 ■ ■
Year 7Mean / (S.D.)
468.4 (107.7)
483.0 (98.0)
487.7 (96.4)
480.2 (98.1)
474.3 (107.4)
468.6 (104.6)
478.5 (102.9)
■ ■
% at or above NMS 67.1 70.9 71.5 71.0 69.0 65.7 69.1 ■ ■
Year 5Mean / (S.D.)
405.1 (123.3)
420.6 (113.3)
412.1 (115.5)
403.3 (118.5)
404.8 (131.7)
437.4 (91.8)
425.5 (112.8)
■ ■
% at or above NMS 62.5 65.4 64.4 61.8 61.3 73.7 66.4 ■ ■
Year 3Mean / (S.D.)
306.6 (134.1)
322.2 (118.2)
328.7 (121.1)
322.6 (125.1)
332.2 (126.6)
339.1 (110.1)
332.0 (136.2)
■ ■
% at or above NMS 62.7 68.5 69.7 67.6 68.9 74.3 67.0 ■ ■
Refer to the introduction for explanatory notes and how to read the graph.
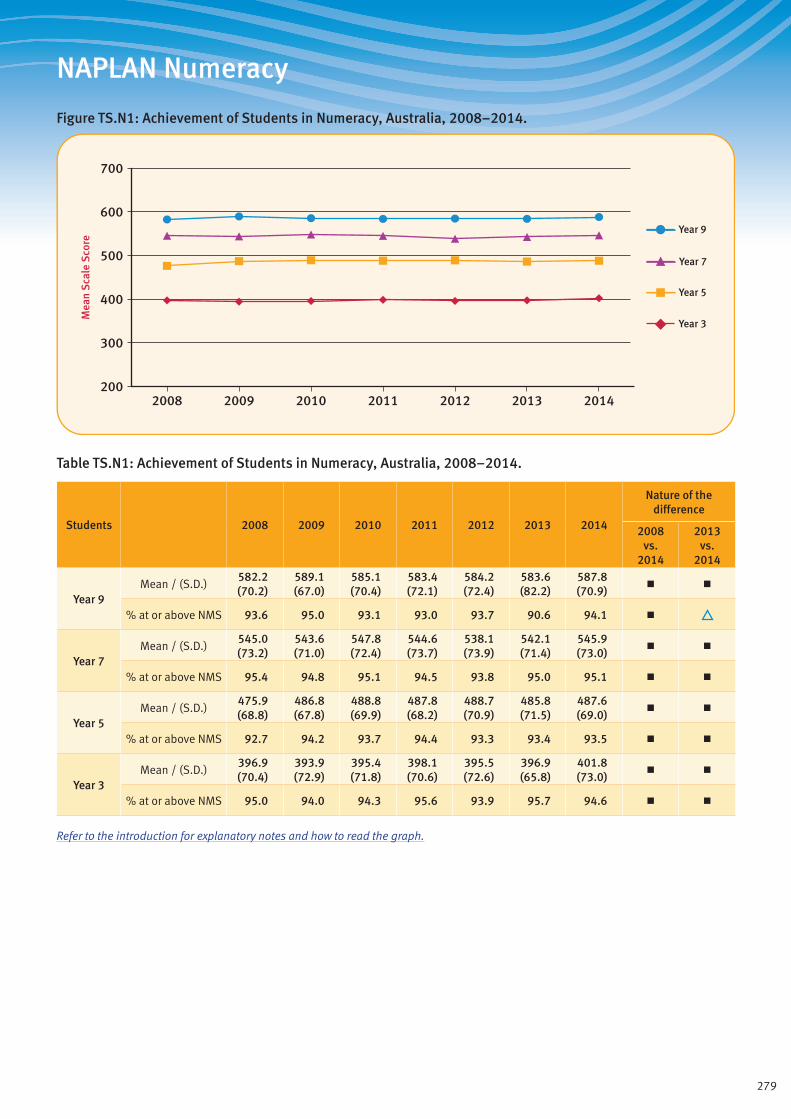
279
NAPLAN Numeracy
Figure TS.N1: Achievement of Students in Numeracy, Australia, 2008–2014.
Mea
n S
cale
Sco
re
Year 3
Year 5
Year 7
Year 9
200
300
400
500
600
700
2014201320122011201020092008
Table TS.N1: Achievement of Students in Numeracy, Australia, 2008–2014.
Students 2008 2009 2010 2011 2012 2013 2014
Nature of the difference
2008 vs.
2014
2013 vs.
2014
Year 9Mean / (S.D.)
582.2 (70.2)
589.1 (67.0)
585.1 (70.4)
583.4 (72.1)
584.2 (72.4)
583.6 (82.2)
587.8 (70.9)
■ ■
% at or above NMS 93.6 95.0 93.1 93.0 93.7 90.6 94.1 ■
Year 7Mean / (S.D.)
545.0 (73.2)
543.6 (71.0)
547.8 (72.4)
544.6 (73.7)
538.1 (73.9)
542.1 (71.4)
545.9 (73.0)
■ ■
% at or above NMS 95.4 94.8 95.1 94.5 93.8 95.0 95.1 ■ ■
Year 5Mean / (S.D.)
475.9 (68.8)
486.8 (67.8)
488.8 (69.9)
487.8 (68.2)
488.7 (70.9)
485.8 (71.5)
487.6 (69.0)
■ ■
% at or above NMS 92.7 94.2 93.7 94.4 93.3 93.4 93.5 ■ ■
Year 3Mean / (S.D.)
396.9 (70.4)
393.9 (72.9)
395.4 (71.8)
398.1 (70.6)
395.5 (72.6)
396.9 (65.8)
401.8 (73.0)
■ ■
% at or above NMS 95.0 94.0 94.3 95.6 93.9 95.7 94.6 ■ ■
Refer to the introduction for explanatory notes and how to read the graph.

280
NAPLAN Numeracy
Figure TS.N2: Achievement of Year 3 Students in Numeracy by Sex, Australia, 2008–2014.
Mea
n S
cale
Sco
re
Female
Male
200
300
400
500
600
700
2014201320122011201020092008
Table TS.N2: Achievement of Year 3 Students in Numeracy by Sex, Australia, 2008–2014.
Students 2008 2009 2010 2011 2012 2013 2014
Nature of the difference
2008 vs.
2014
2013 vs.
2014
MaleMean / (S.D.)
400.6 (72.8)
397.5 (75.3)
397.8 (74.0)
402.6 (73.0)
399.5 (75.0)
399.0 (68.4)
405.2 (74.9)
■ ■
% at or above NMS 94.6 93.5 93.7 95.2 93.3 95.0 94.2 ■ ■
FemaleMean / (S.D.)
393.1 (67.6)
390.2 (70.0)
392.9 (69.3)
393.5 (67.6)
391.2 (69.8)
394.6 (63.0)
398.4 (70.9)
■ ■
% at or above NMS 95.5 94.5 94.9 96.0 94.6 96.5 95.1 ■
Refer to the introduction for explanatory notes and how to read the graph.
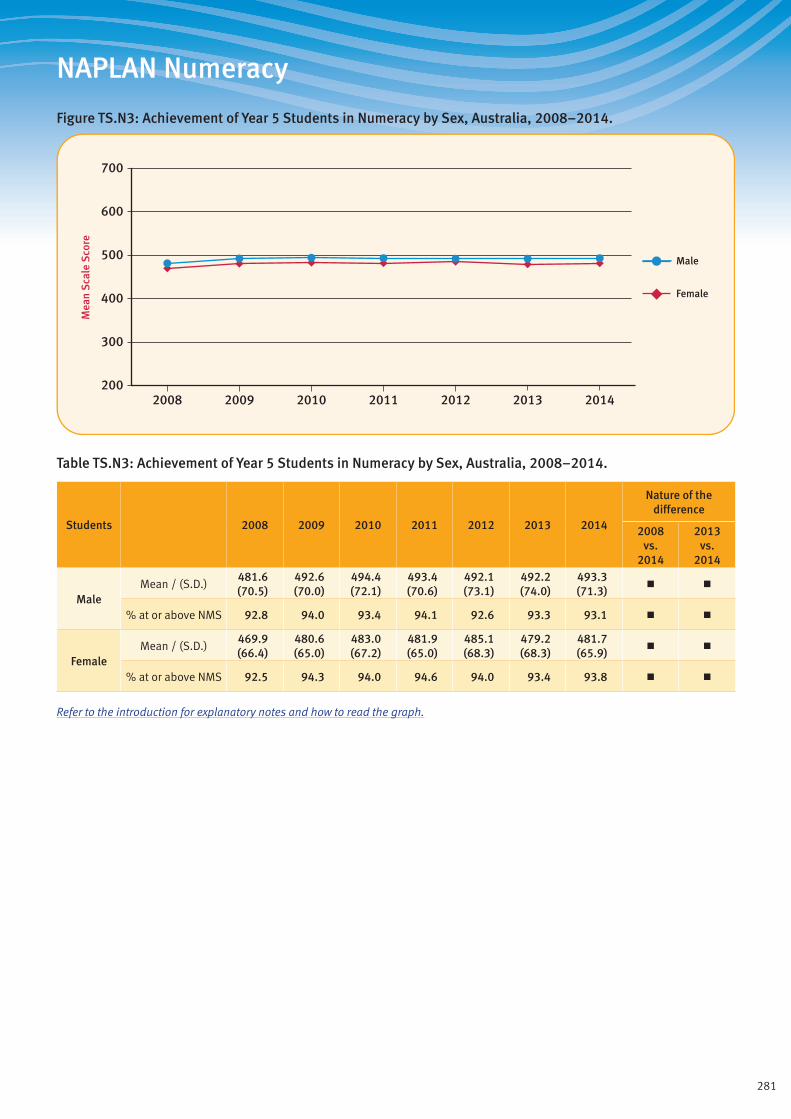
281
NAPLAN Numeracy
Figure TS.N3: Achievement of Year 5 Students in Numeracy by Sex, Australia, 2008–2014.
Mea
n S
cale
Sco
re
Female
Male
200
300
400
500
600
700
2014201320122011201020092008
Table TS.N3: Achievement of Year 5 Students in Numeracy by Sex, Australia, 2008–2014.
Students 2008 2009 2010 2011 2012 2013 2014
Nature of the difference
2008 vs.
2014
2013 vs.
2014
MaleMean / (S.D.)
481.6 (70.5)
492.6 (70.0)
494.4 (72.1)
493.4 (70.6)
492.1 (73.1)
492.2 (74.0)
493.3 (71.3)
■ ■
% at or above NMS 92.8 94.0 93.4 94.1 92.6 93.3 93.1 ■ ■
FemaleMean / (S.D.)
469.9 (66.4)
480.6 (65.0)
483.0 (67.2)
481.9 (65.0)
485.1 (68.3)
479.2 (68.3)
481.7 (65.9)
■ ■
% at or above NMS 92.5 94.3 94.0 94.6 94.0 93.4 93.8 ■ ■
Refer to the introduction for explanatory notes and how to read the graph.
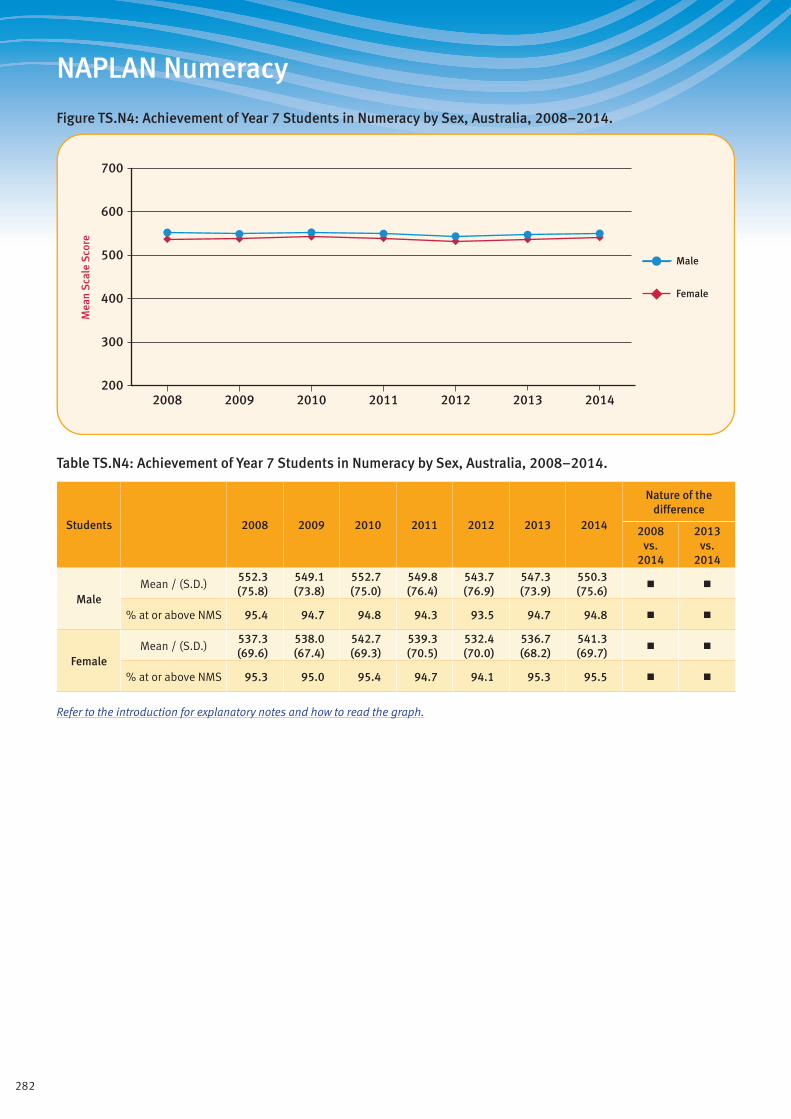
282
NAPLAN Numeracy
Figure TS.N4: Achievement of Year 7 Students in Numeracy by Sex, Australia, 2008–2014.
Mea
n S
cale
Sco
re
Female
Male
200
300
400
500
600
700
2014201320122011201020092008
Table TS.N4: Achievement of Year 7 Students in Numeracy by Sex, Australia, 2008–2014.
Students 2008 2009 2010 2011 2012 2013 2014
Nature of the difference
2008 vs.
2014
2013 vs.
2014
MaleMean / (S.D.)
552.3 (75.8)
549.1 (73.8)
552.7 (75.0)
549.8 (76.4)
543.7 (76.9)
547.3 (73.9)
550.3 (75.6)
■ ■
% at or above NMS 95.4 94.7 94.8 94.3 93.5 94.7 94.8 ■ ■
FemaleMean / (S.D.)
537.3 (69.6)
538.0 (67.4)
542.7 (69.3)
539.3 (70.5)
532.4 (70.0)
536.7 (68.2)
541.3 (69.7)
■ ■
% at or above NMS 95.3 95.0 95.4 94.7 94.1 95.3 95.5 ■ ■
Refer to the introduction for explanatory notes and how to read the graph.
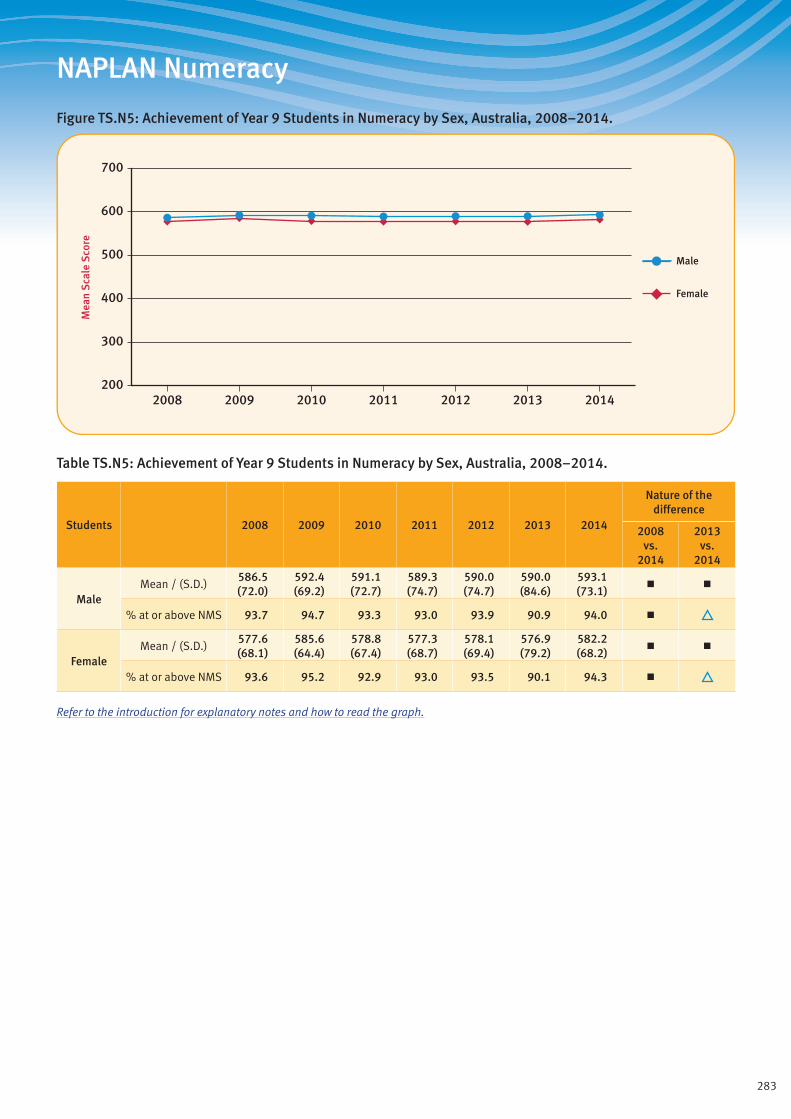
283
NAPLAN Numeracy
Figure TS.N5: Achievement of Year 9 Students in Numeracy by Sex, Australia, 2008–2014.
Mea
n S
cale
Sco
re
Female
Male
200
300
400
500
600
700
2014201320122011201020092008
Table TS.N5: Achievement of Year 9 Students in Numeracy by Sex, Australia, 2008–2014.
Students 2008 2009 2010 2011 2012 2013 2014
Nature of the difference
2008 vs.
2014
2013 vs.
2014
MaleMean / (S.D.)
586.5 (72.0)
592.4 (69.2)
591.1 (72.7)
589.3 (74.7)
590.0 (74.7)
590.0 (84.6)
593.1 (73.1)
■ ■
% at or above NMS 93.7 94.7 93.3 93.0 93.9 90.9 94.0 ■
FemaleMean / (S.D.)
577.6 (68.1)
585.6 (64.4)
578.8 (67.4)
577.3 (68.7)
578.1 (69.4)
576.9 (79.2)
582.2 (68.2)
■ ■
% at or above NMS 93.6 95.2 92.9 93.0 93.5 90.1 94.3 ■
Refer to the introduction for explanatory notes and how to read the graph.
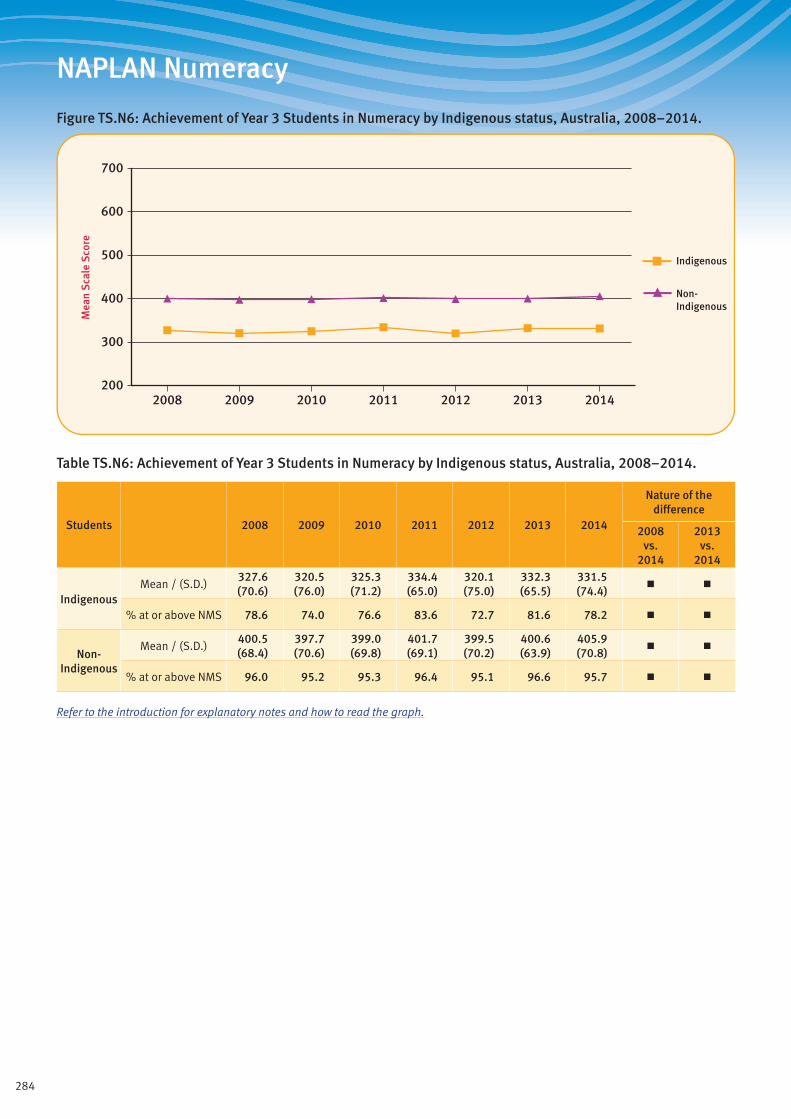
284
NAPLAN Numeracy
Figure TS.N6: Achievement of Year 3 Students in Numeracy by Indigenous status, Australia, 2008–2014.
Mea
n S
cale
Sco
re
Non-Indigenous
Indigenous
200
300
400
500
600
700
2014201320122011201020092008
Table TS.N6: Achievement of Year 3 Students in Numeracy by Indigenous status, Australia, 2008–2014.
Students 2008 2009 2010 2011 2012 2013 2014
Nature of the difference
2008 vs.
2014
2013 vs.
2014
IndigenousMean / (S.D.)
327.6 (70.6)
320.5 (76.0)
325.3 (71.2)
334.4 (65.0)
320.1 (75.0)
332.3 (65.5)
331.5 (74.4)
■ ■
% at or above NMS 78.6 74.0 76.6 83.6 72.7 81.6 78.2 ■ ■
Non- Indigenous
Mean / (S.D.)400.5 (68.4)
397.7 (70.6)
399.0 (69.8)
401.7 (69.1)
399.5 (70.2)
400.6 (63.9)
405.9 (70.8)
■ ■
% at or above NMS 96.0 95.2 95.3 96.4 95.1 96.6 95.7 ■ ■
Refer to the introduction for explanatory notes and how to read the graph.
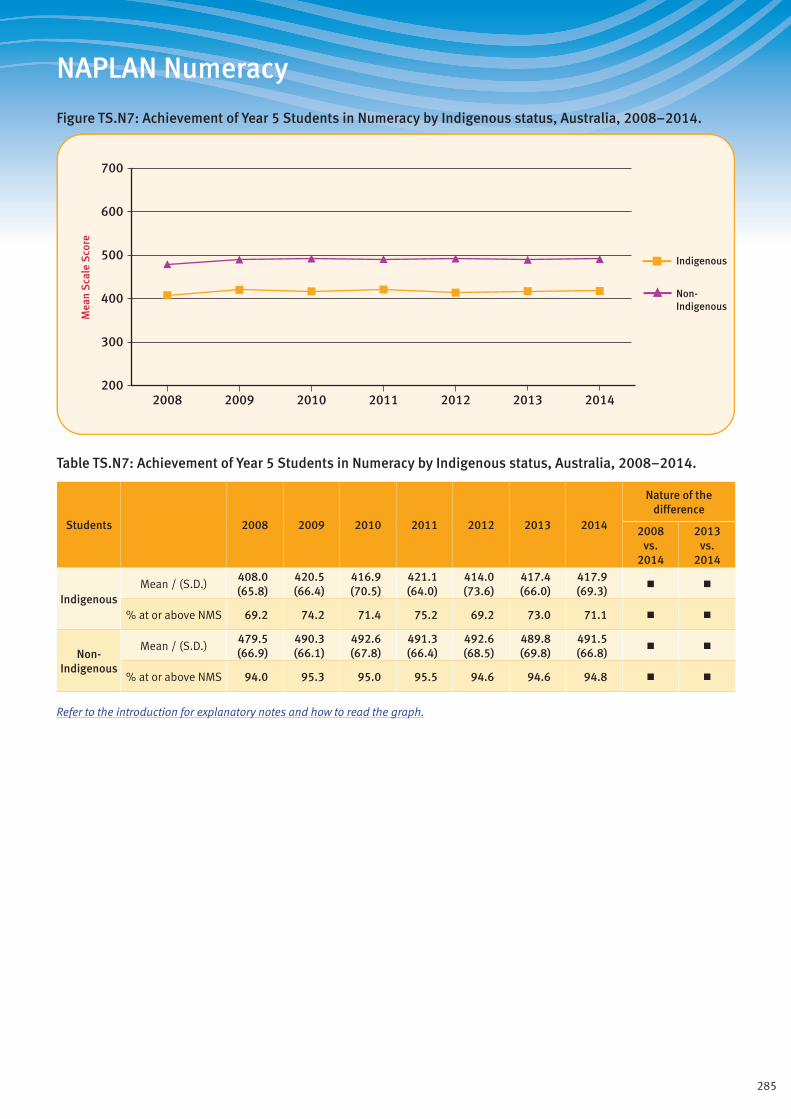
285
NAPLAN Numeracy
Figure TS.N7: Achievement of Year 5 Students in Numeracy by Indigenous status, Australia, 2008–2014.
Mea
n S
cale
Sco
re
Non-Indigenous
Indigenous
200
300
400
500
600
700
2014201320122011201020092008
Table TS.N7: Achievement of Year 5 Students in Numeracy by Indigenous status, Australia, 2008–2014.
Students 2008 2009 2010 2011 2012 2013 2014
Nature of the difference
2008 vs.
2014
2013 vs.
2014
IndigenousMean / (S.D.)
408.0 (65.8)
420.5 (66.4)
416.9 (70.5)
421.1 (64.0)
414.0 (73.6)
417.4 (66.0)
417.9 (69.3)
■ ■
% at or above NMS 69.2 74.2 71.4 75.2 69.2 73.0 71.1 ■ ■
Non- Indigenous
Mean / (S.D.)479.5 (66.9)
490.3 (66.1)
492.6 (67.8)
491.3 (66.4)
492.6 (68.5)
489.8 (69.8)
491.5 (66.8)
■ ■
% at or above NMS 94.0 95.3 95.0 95.5 94.6 94.6 94.8 ■ ■
Refer to the introduction for explanatory notes and how to read the graph.

286
NAPLAN Numeracy
Figure TS.N8: Achievement of Year 7 Students in Numeracy by Indigenous status, Australia, 2008–2014.
Mea
n S
cale
Sco
re
Non-Indigenous
Indigenous
200
300
400
500
600
700
2014201320122011201020092008
Table TS.N8: Achievement of Year 7 Students in Numeracy by Indigenous status, Australia, 2008–2014.
Students 2008 2009 2010 2011 2012 2013 2014
Nature of the difference
2008 vs.
2014
2013 vs.
2014
IndigenousMean / (S.D.)
476.2 (67.2)
474.4 (65.2)
477.5 (66.6)
474.8 (65.8)
469.4 (66.0)
475.7 (63.6)
478.5 (64.4)
■ ■
% at or above NMS 78.6 75.8 77.0 76.5 74.4 78.1 79.5 ■ ■
Non- Indigenous
Mean / (S.D.)548.6 (71.6)
547.0 (69.4)
551.4 (70.8)
548.5 (72.1)
541.8 (72.3)
545.8 (69.9)
549.7 (71.5)
■ ■
% at or above NMS 96.4 95.8 96.1 95.5 94.9 96.0 96.1 ■ ■
Refer to the introduction for explanatory notes and how to read the graph.

287
NAPLAN Numeracy
Figure TS.N9: Achievement of Year 9 Students in Numeracy by Indigenous status, Australia, 2008–2014.
Mea
n S
cale
Sco
re
Non-Indigenous
Indigenous
200
300
400
500
600
700
2014201320122011201020092008
Table TS.N9: Achievement of Year 9 Students in Numeracy by Indigenous status, Australia, 2008–2014.
Students 2008 2009 2010 2011 2012 2013 2014
Nature of the difference
2008 vs.
2014
2013 vs.
2014
IndigenousMean / (S.D.)
515.1 (65.6)
520.2 (63.2)
515.2 (64.7)
515.8 (62.2)
518.2 (61.3)
507.9 (72.2)
522.8 (63.4)
■
% at or above NMS 72.5 75.0 70.4 72.0 74.2 65.7 76.2 ■
Non- Indigenous
Mean / (S.D.)585.7 (68.7)
592.4 (65.3)
588.5 (68.8)
586.7 (70.8)
587.5 (71.3)
587.8 (80.7)
591.4 (69.6)
■ ■
% at or above NMS 94.8 96.0 94.3 94.1 94.7 92.0 95.2 ■
Refer to the introduction for explanatory notes and how to read the graph.
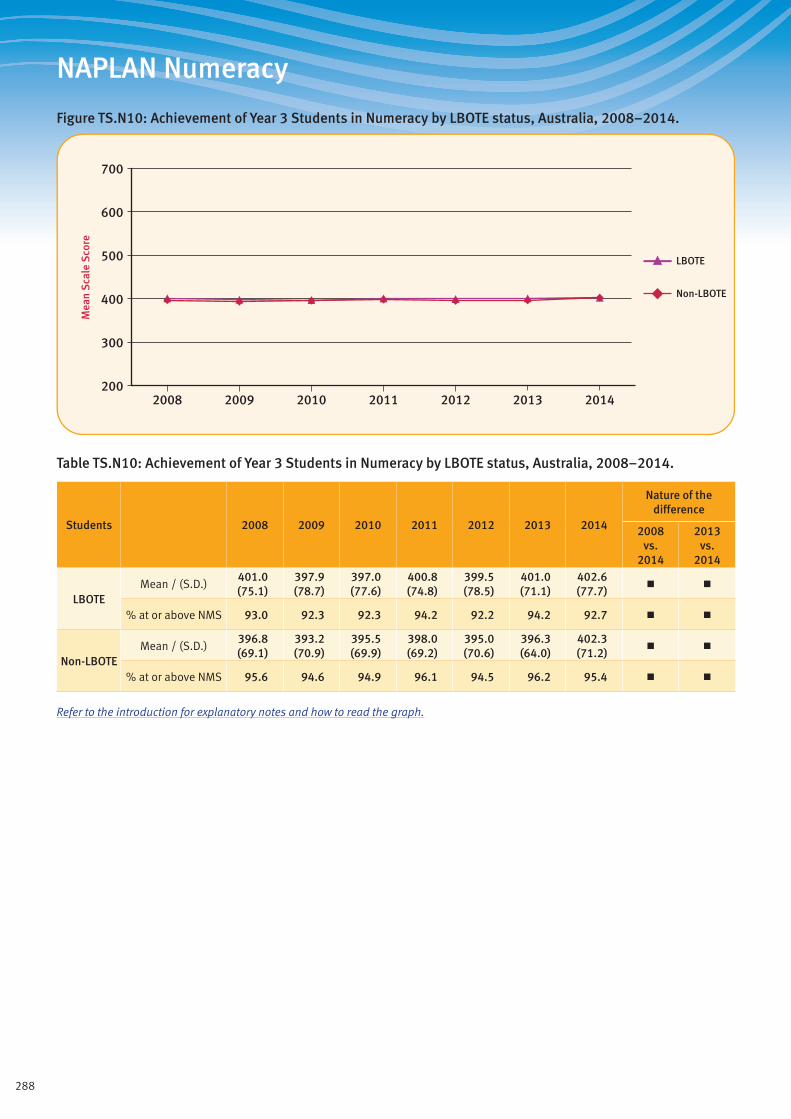
288
NAPLAN Numeracy
Figure TS.N10: Achievement of Year 3 Students in Numeracy by LBOTE status, Australia, 2008–2014.
Mea
n S
cale
Sco
re
Non-LBOTE
LBOTE
200
300
400
500
600
700
2014201320122011201020092008
Table TS.N10: Achievement of Year 3 Students in Numeracy by LBOTE status, Australia, 2008–2014.
Students 2008 2009 2010 2011 2012 2013 2014
Nature of the difference
2008 vs.
2014
2013 vs.
2014
LBOTEMean / (S.D.)
401.0 (75.1)
397.9 (78.7)
397.0 (77.6)
400.8 (74.8)
399.5 (78.5)
401.0 (71.1)
402.6 (77.7)
■ ■
% at or above NMS 93.0 92.3 92.3 94.2 92.2 94.2 92.7 ■ ■
Non-LBOTEMean / (S.D.)
396.8 (69.1)
393.2 (70.9)
395.5 (69.9)
398.0 (69.2)
395.0 (70.6)
396.3 (64.0)
402.3 (71.2)
■ ■
% at or above NMS 95.6 94.6 94.9 96.1 94.5 96.2 95.4 ■ ■
Refer to the introduction for explanatory notes and how to read the graph.
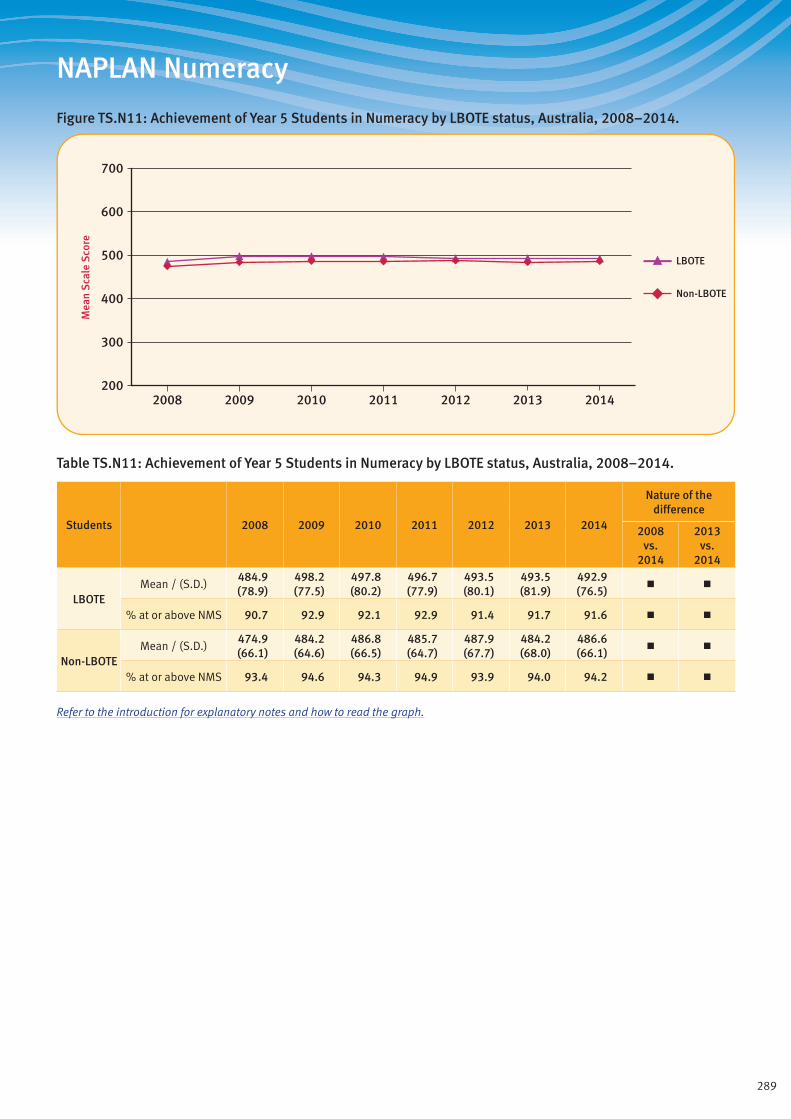
289
NAPLAN Numeracy
Figure TS.N11: Achievement of Year 5 Students in Numeracy by LBOTE status, Australia, 2008–2014.
Mea
n S
cale
Sco
re
Non-LBOTE
LBOTE
200
300
400
500
600
700
2014201320122011201020092008
Table TS.N11: Achievement of Year 5 Students in Numeracy by LBOTE status, Australia, 2008–2014.
Students 2008 2009 2010 2011 2012 2013 2014
Nature of the difference
2008 vs.
2014
2013 vs.
2014
LBOTEMean / (S.D.)
484.9 (78.9)
498.2 (77.5)
497.8 (80.2)
496.7 (77.9)
493.5 (80.1)
493.5 (81.9)
492.9 (76.5)
■ ■
% at or above NMS 90.7 92.9 92.1 92.9 91.4 91.7 91.6 ■ ■
Non-LBOTEMean / (S.D.)
474.9 (66.1)
484.2 (64.6)
486.8 (66.5)
485.7 (64.7)
487.9 (67.7)
484.2 (68.0)
486.6 (66.1)
■ ■
% at or above NMS 93.4 94.6 94.3 94.9 93.9 94.0 94.2 ■ ■
Refer to the introduction for explanatory notes and how to read the graph.

290
NAPLAN Numeracy
Figure TS.N12: Achievement of Year 7 Students in Numeracy by LBOTE status, Australia, 2008–2014.
Mea
n S
cale
Sco
re
Non-LBOTE
LBOTE
200
300
400
500
600
700
2014201320122011201020092008
Table TS.N12: Achievement of Year 7 Students in Numeracy by LBOTE status, Australia, 2008–2014.
Students 2008 2009 2010 2011 2012 2013 2014
Nature of the difference
2008 vs.
2014
2013 vs.
2014
LBOTEMean / (S.D.)
553.0 (84.8)
556.3 (84.1)
557.1 (85.3)
553.9 (87.0)
549.0 (87.6)
554.3 (85.6)
557.3 (85.5)
■ ■
% at or above NMS 93.6 93.9 93.3 92.7 92.4 93.6 93.9 ■ ■
Non-LBOTEMean / (S.D.)
544.4 (70.3)
540.3 (66.7)
545.7 (68.6)
542.6 (69.7)
535.6 (69.5)
539.1 (66.5)
543.0 (68.5)
■ ■
% at or above NMS 96.0 95.1 95.6 95.0 94.2 95.5 95.6 ■ ■
Refer to the introduction for explanatory notes and how to read the graph.

291
NAPLAN Numeracy
Figure TS.N13: Achievement of Year 9 Students in Numeracy by LBOTE status, Australia, 2008–2014.
Mea
n S
cale
Sco
re
Non-LBOTE
LBOTE
200
300
400
500
600
700
2014201320122011201020092008
Table TS.N13: Achievement of Year 9 Students in Numeracy by LBOTE status, Australia, 2008–2014.
Students 2008 2009 2010 2011 2012 2013 2014
Nature of the difference
2008 vs.
2014
2013 vs.
2014
LBOTEMean / (S.D.)
594.8 (80.9)
604.4 (80.6)
598.5 (84.9)
596.5 (84.5)
599.8 (86.0)
601.7 (98.5)
601.4 (83.6)
■ ■
% at or above NMS 93.0 93.9 91.5 91.6 92.8 89.8 93.2 ■
Non-LBOTEMean / (S.D.)
581.1 (67.3)
585.6 (62.4)
582.5 (66.1)
580.4 (68.0)
580.7 (67.9)
579.4 (76.9)
584.3 (66.5)
■ ■
% at or above NMS 94.2 95.3 93.6 93.5 94.1 90.9 94.5 ■
Refer to the introduction for explanatory notes and how to read the graph.
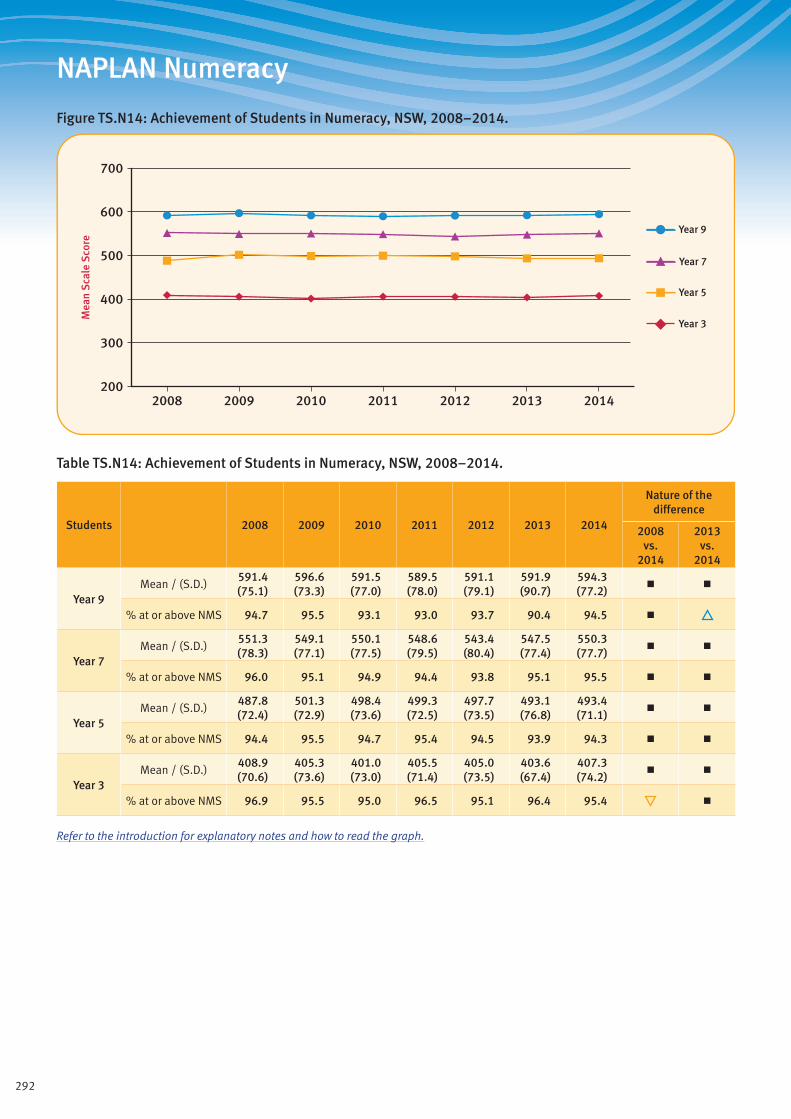
292
NAPLAN Numeracy
Figure TS.N14: Achievement of Students in Numeracy, NSW, 2008–2014.
Mea
n S
cale
Sco
re
Year 3
Year 5
Year 7
Year 9
200
300
400
500
600
700
2014201320122011201020092008
Table TS.N14: Achievement of Students in Numeracy, NSW, 2008–2014.
Students 2008 2009 2010 2011 2012 2013 2014
Nature of the difference
2008 vs.
2014
2013 vs.
2014
Year 9Mean / (S.D.)
591.4 (75.1)
596.6 (73.3)
591.5 (77.0)
589.5 (78.0)
591.1 (79.1)
591.9 (90.7)
594.3 (77.2)
■ ■
% at or above NMS 94.7 95.5 93.1 93.0 93.7 90.4 94.5 ■
Year 7Mean / (S.D.)
551.3 (78.3)
549.1 (77.1)
550.1 (77.5)
548.6 (79.5)
543.4 (80.4)
547.5 (77.4)
550.3 (77.7)
■ ■
% at or above NMS 96.0 95.1 94.9 94.4 93.8 95.1 95.5 ■ ■
Year 5Mean / (S.D.)
487.8 (72.4)
501.3 (72.9)
498.4 (73.6)
499.3 (72.5)
497.7 (73.5)
493.1 (76.8)
493.4 (71.1)
■ ■
% at or above NMS 94.4 95.5 94.7 95.4 94.5 93.9 94.3 ■ ■
Year 3Mean / (S.D.)
408.9 (70.6)
405.3 (73.6)
401.0 (73.0)
405.5 (71.4)
405.0 (73.5)
403.6 (67.4)
407.3 (74.2)
■ ■
% at or above NMS 96.9 95.5 95.0 96.5 95.1 96.4 95.4 ■
Refer to the introduction for explanatory notes and how to read the graph.
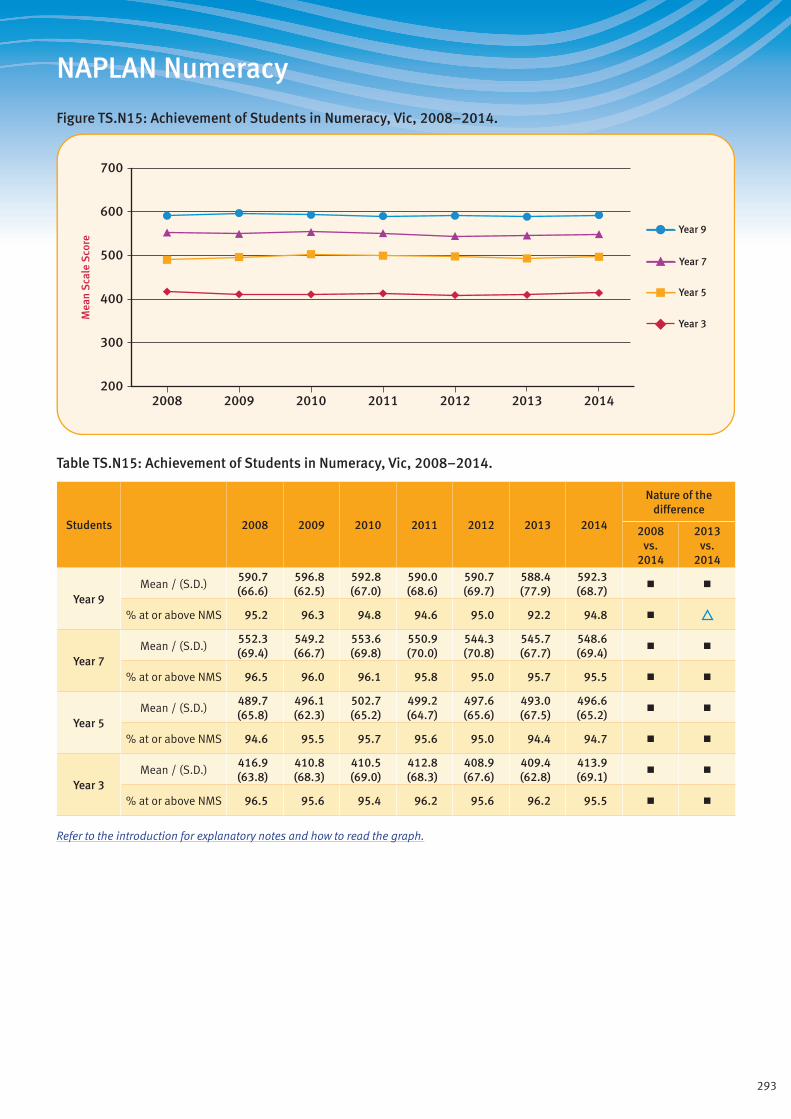
293
NAPLAN Numeracy
Figure TS.N15: Achievement of Students in Numeracy, Vic, 2008–2014.
Mea
n S
cale
Sco
re
Year 3
Year 5
Year 7
Year 9
200
300
400
500
600
700
2014201320122011201020092008
Table TS.N15: Achievement of Students in Numeracy, Vic, 2008–2014.
Students 2008 2009 2010 2011 2012 2013 2014
Nature of the difference
2008 vs.
2014
2013 vs.
2014
Year 9Mean / (S.D.)
590.7 (66.6)
596.8 (62.5)
592.8 (67.0)
590.0 (68.6)
590.7 (69.7)
588.4 (77.9)
592.3 (68.7)
■ ■
% at or above NMS 95.2 96.3 94.8 94.6 95.0 92.2 94.8 ■
Year 7Mean / (S.D.)
552.3 (69.4)
549.2 (66.7)
553.6 (69.8)
550.9 (70.0)
544.3 (70.8)
545.7 (67.7)
548.6 (69.4)
■ ■
% at or above NMS 96.5 96.0 96.1 95.8 95.0 95.7 95.5 ■ ■
Year 5Mean / (S.D.)
489.7 (65.8)
496.1 (62.3)
502.7 (65.2)
499.2 (64.7)
497.6 (65.6)
493.0 (67.5)
496.6 (65.2)
■ ■
% at or above NMS 94.6 95.5 95.7 95.6 95.0 94.4 94.7 ■ ■
Year 3Mean / (S.D.)
416.9 (63.8)
410.8 (68.3)
410.5 (69.0)
412.8 (68.3)
408.9 (67.6)
409.4 (62.8)
413.9 (69.1)
■ ■
% at or above NMS 96.5 95.6 95.4 96.2 95.6 96.2 95.5 ■ ■
Refer to the introduction for explanatory notes and how to read the graph.

294
NAPLAN Numeracy
Figure TS.N16: Achievement of Students in Numeracy, Qld, 2008–2014.
Mea
n S
cale
Sco
re
Year 3
Year 5
Year 7
Year 9
200
300
400
500
600
700
2014201320122011201020092008
Table TS.N16: Achievement of Students in Numeracy, Qld, 2008–2014.
Students 2008 2009 2010 2011 2012 2013 2014
Nature of the difference
2008 vs.
2014
2013 vs.
2014
Year 9Mean / (S.D.)
570.7 (66.2)
579.6 (60.7)
577.4 (63.0)
574.4 (65.7)
574.6 (64.4)
573.2 (74.5)
579.8 (64.1)
■ ■
% at or above NMS 92.4 94.5 93.1 92.8 93.7 90.1 94.2 ■
Year 7Mean / (S.D.)
539.0 (70.4)
539.7 (65.9)
546.2 (68.2)
538.7 (68.3)
532.0 (67.5)
538.5 (65.7)
543.6 (69.1)
■ ■
% at or above NMS 94.9 94.8 95.4 94.6 93.8 95.4 95.3 ■ ■
Year 5Mean / (S.D.)
458.2 (62.7)
470.4 (61.7)
474.1 (63.8)
470.3 (59.8)
476.1 (66.7)
481.1 (66.7)
481.7 (66.4)
■
% at or above NMS 90.4 92.6 92.6 93.4 91.7 93.6 93.1 ■
Year 3Mean / (S.D.)
367.9 (67.0)
372.4 (66.6)
378.5 (65.9)
384.6 (66.9)
380.9 (69.9)
386.2 (62.0)
393.4 (70.6)
■
% at or above NMS 92.0 92.3 93.4 95.2 92.7 95.8 94.6 ■
Refer to the introduction for explanatory notes and how to read the graph.

295
NAPLAN Numeracy
Figure TS.N17: Achievement of Students in Numeracy, WA, 2008–2014.
Mea
n S
cale
Sco
re
Year 3
Year 5
Year 7
Year 9
200
300
400
500
600
700
2014201320122011201020092008
Table TS.N17: Achievement of Students in Numeracy, WA, 2008–2014.
Students 2008 2009 2010 2011 2012 2013 2014
Nature of the difference
2008 vs.
2014
2013 vs.
2014
Year 9Mean / (S.D.)
570.7 (66.6)
581.5 (65.4)
577.9 (68.5)
582.2 (72.1)
582.0 (71.7)
584.4 (80.9)
591.1 (69.8)
■
% at or above NMS 92.3 93.5 92.0 92.1 93.1 90.8 94.7
Year 7Mean / (S.D.)
533.7 (68.7)
536.3 (69.1)
545.8 (70.2)
544.6 (72.0)
534.9 (70.9)
541.7 (71.1)
545.5 (72.1)
■ ■
% at or above NMS 94.7 93.6 94.8 94.7 93.9 95.1 95.4 ■ ■
Year 5Mean / (S.D.)
460.7 (63.4)
472.9 (63.9)
476.8 (68.1)
479.2 (66.3)
477.5 (70.3)
477.6 (69.7)
480.6 (70.4)
■
% at or above NMS 91.1 92.8 92.3 93.4 91.7 92.7 92.2 ■ ■
Year 3Mean / (S.D.)
381.9 (66.4)
379.7 (71.5)
382.8 (69.8)
386.6 (68.7)
383.9 (72.8)
387.3 (64.7)
392.5 (74.1)
■ ■
% at or above NMS 94.5 92.3 93.5 95.3 92.5 95.4 93.8 ■ ■
Refer to the introduction for explanatory notes and how to read the graph.

296
NAPLAN Numeracy
Figure TS.N18: Achievement of Students in Numeracy, SA, 2008–2014.
Mea
n S
cale
Sco
re
Year 3
Year 5
Year 7
Year 9
200
300
400
500
600
700
2014201320122011201020092008
Table TS.N18: Achievement of Students in Numeracy, SA, 2008–2014.
Students 2008 2009 2010 2011 2012 2013 2014
Nature of the difference
2008 vs.
2014
2013 vs.
2014
Year 9Mean / (S.D.)
571.1 (62.8)
578.7 (61.1)
573.1 (64.6)
572.0 (66.5)
573.3 (65.6)
571.7 (72.3)
573.6 (62.8)
■ ■
% at or above NMS 92.0 94.7 92.1 91.7 92.9 90.1 92.6 ■ ■
Year 7Mean / (S.D.)
536.2 (67.7)
532.0 (65.1)
538.5 (65.8)
534.9 (67.9)
529.1 (67.0)
530.8 (64.6)
533.9 (65.0)
■ ■
% at or above NMS 94.5 94.2 95.2 93.9 93.5 94.6 94.8 ■ ■
Year 5Mean / (S.D.)
460.4 (60.7)
470.4 (60.5)
472.6 (64.2)
470.9 (60.8)
471.9 (64.7)
467.4 (63.7)
470.9 (64.1)
■ ■
% at or above NMS 90.5 93.3 92.2 93.1 91.7 92.0 91.8 ■ ■
Year 3Mean / (S.D.)
388.8 (64.9)
379.2 (68.9)
379.9 (66.8)
379.4 (64.9)
377.4 (67.9)
379.9 (61.3)
385.4 (68.8)
■ ■
% at or above NMS 93.8 92.7 93.2 94.1 91.9 94.4 93.2 ■ ■
Refer to the introduction for explanatory notes and how to read the graph.
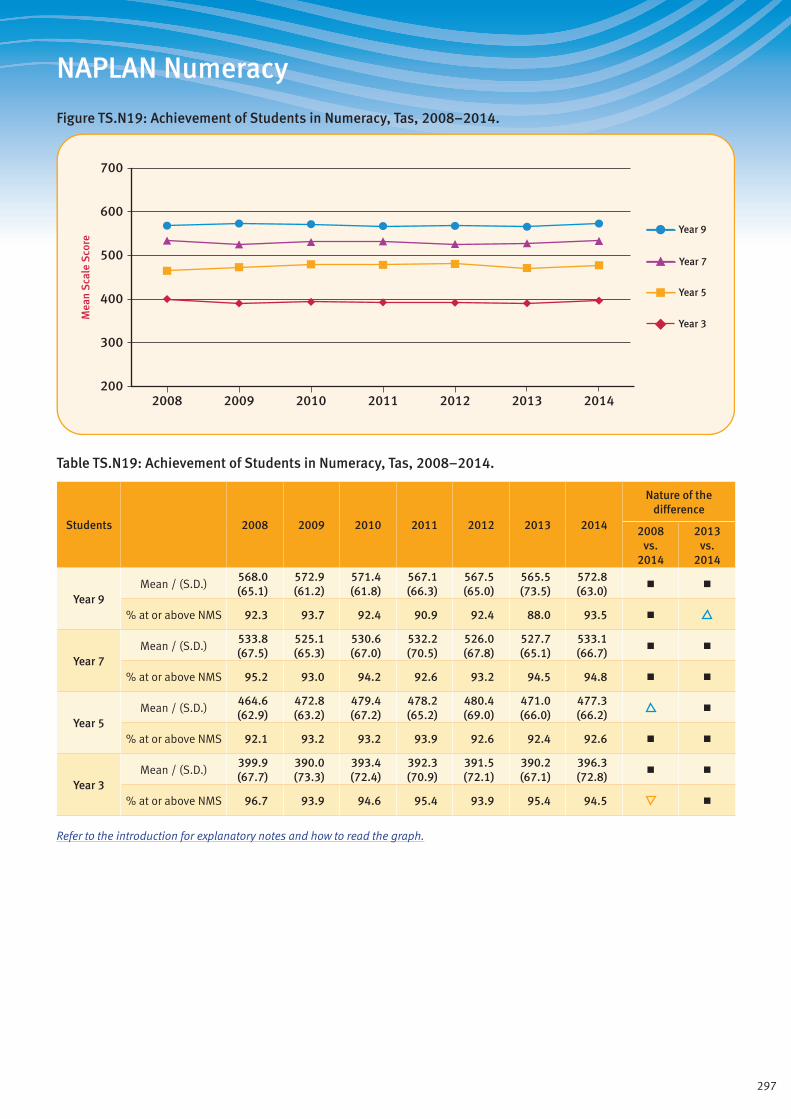
297
NAPLAN Numeracy
Figure TS.N19: Achievement of Students in Numeracy, Tas, 2008–2014.
Mea
n S
cale
Sco
re
Year 3
Year 5
Year 7
Year 9
200
300
400
500
600
700
2014201320122011201020092008
Table TS.N19: Achievement of Students in Numeracy, Tas, 2008–2014.
Students 2008 2009 2010 2011 2012 2013 2014
Nature of the difference
2008 vs.
2014
2013 vs.
2014
Year 9Mean / (S.D.)
568.0 (65.1)
572.9 (61.2)
571.4 (61.8)
567.1 (66.3)
567.5 (65.0)
565.5 (73.5)
572.8 (63.0)
■ ■
% at or above NMS 92.3 93.7 92.4 90.9 92.4 88.0 93.5 ■
Year 7Mean / (S.D.)
533.8 (67.5)
525.1 (65.3)
530.6 (67.0)
532.2 (70.5)
526.0 (67.8)
527.7 (65.1)
533.1 (66.7)
■ ■
% at or above NMS 95.2 93.0 94.2 92.6 93.2 94.5 94.8 ■ ■
Year 5Mean / (S.D.)
464.6 (62.9)
472.8 (63.2)
479.4 (67.2)
478.2 (65.2)
480.4 (69.0)
471.0 (66.0)
477.3 (66.2)
■
% at or above NMS 92.1 93.2 93.2 93.9 92.6 92.4 92.6 ■ ■
Year 3Mean / (S.D.)
399.9 (67.7)
390.0 (73.3)
393.4 (72.4)
392.3 (70.9)
391.5 (72.1)
390.2 (67.1)
396.3 (72.8)
■ ■
% at or above NMS 96.7 93.9 94.6 95.4 93.9 95.4 94.5 ■
Refer to the introduction for explanatory notes and how to read the graph.

298
NAPLAN Numeracy
Figure TS.N20: Achievement of Students in Numeracy, ACT, 2008–2014.
Mea
n S
cale
Sco
re
Year 3
Year 5
Year 7
Year 9
200
300
400
500
600
700
2014201320122011201020092008
Table TS.N20: Achievement of Students in Numeracy, ACT, 2008–2014.
Students 2008 2009 2010 2011 2012 2013 2014
Nature of the difference
2008 vs.
2014
2013 vs.
2014
Year 9Mean / (S.D.)
594.9 (68.0)
600.4 (66.8)
597.2 (69.5)
593.0 (71.9)
596.5 (72.5)
596.9 (80.3)
594.4 (69.8)
■ ■
% at or above NMS 96.6 95.4 94.7 94.6 95.5 92.9 94.9 ■ ■
Year 7Mean / (S.D.)
556.2 (71.0)
549.4 (69.3)
556.2 (69.1)
555.5 (71.8)
545.9 (72.0)
549.7 (66.7)
556.6 (69.1)
■ ■
% at or above NMS 97.1 95.7 96.8 95.7 95.0 95.8 96.3 ■ ■
Year 5Mean / (S.D.)
483.8 (64.1)
495.8 (63.5)
498.7 (65.0)
502.0 (63.9)
504.4 (66.6)
497.9 (70.5)
497.4 (64.9)
■
% at or above NMS 94.9 95.5 95.3 95.4 95.8 95.0 95.9 ■ ■
Year 3Mean / (S.D.)
411.5 (66.8)
408.0 (68.9)
412.6 (68.0)
414.4 (70.5)
410.1 (68.2)
413.2 (63.0)
413.9 (69.6)
■ ■
% at or above NMS 96.4 94.8 96.6 96.5 96.5 96.6 96.5 ■ ■
Refer to the introduction for explanatory notes and how to read the graph.

299
NAPLAN Numeracy
Figure TS.N21: Achievement of Students in Numeracy, NT, 2008–2014.
Mea
n S
cale
Sco
re
Year 3
Year 5
Year 7
Year 9
200
300
400
500
600
700
2014201320122011201020092008
Table TS.N21: Achievement of Students in Numeracy, NT, 2008–2014.
Students 2008 2009 2010 2011 2012 2013 2014
Nature of the difference
2008 vs.
2014
2013 vs.
2014
Year 9Mean / (S.D.)
532.6 (83.5)
539.7 (82.8)
529.9 (88.4)
528.8 (81.7)
532.1 (80.8)
523.3 (94.9)
532.0 (83.5)
■ ■
% at or above NMS 74.1 76.2 70.5 72.6 74.0 68.2 74.2 ■ ■
Year 7Mean / (S.D.)
488.1 (84.0)
485.2 (80.7)
486.6 (90.1)
481.3 (90.1)
474.7 (90.2)
476.5 (82.3)
484.4 (84.5)
■ ■
% at or above NMS 75.9 74.8 72.4 71.7 70.5 72.3 74.4 ■ ■
Year 5Mean / (S.D.)
416.3 (81.0)
429.6 (83.2)
421.5 (92.1)
423.6 (79.0)
417.6 (94.4)
421.9 (83.0)
422.7 (87.0)
■ ■
% at or above NMS 69.1 73.5 69.2 72.5 66.5 69.7 68.2 ■ ■
Year 3Mean / (S.D.)
338.4 (86.3)
322.4 (98.3)
329.4 (90.8)
337.8 (81.8)
323.2 (96.6)
332.0 (83.3)
338.1 (96.6)
■ ■
% at or above NMS 77.0 70.4 72.4 79.1 70.0 75.7 73.0 ■ ■
Refer to the introduction for explanatory notes and how to read the graph.
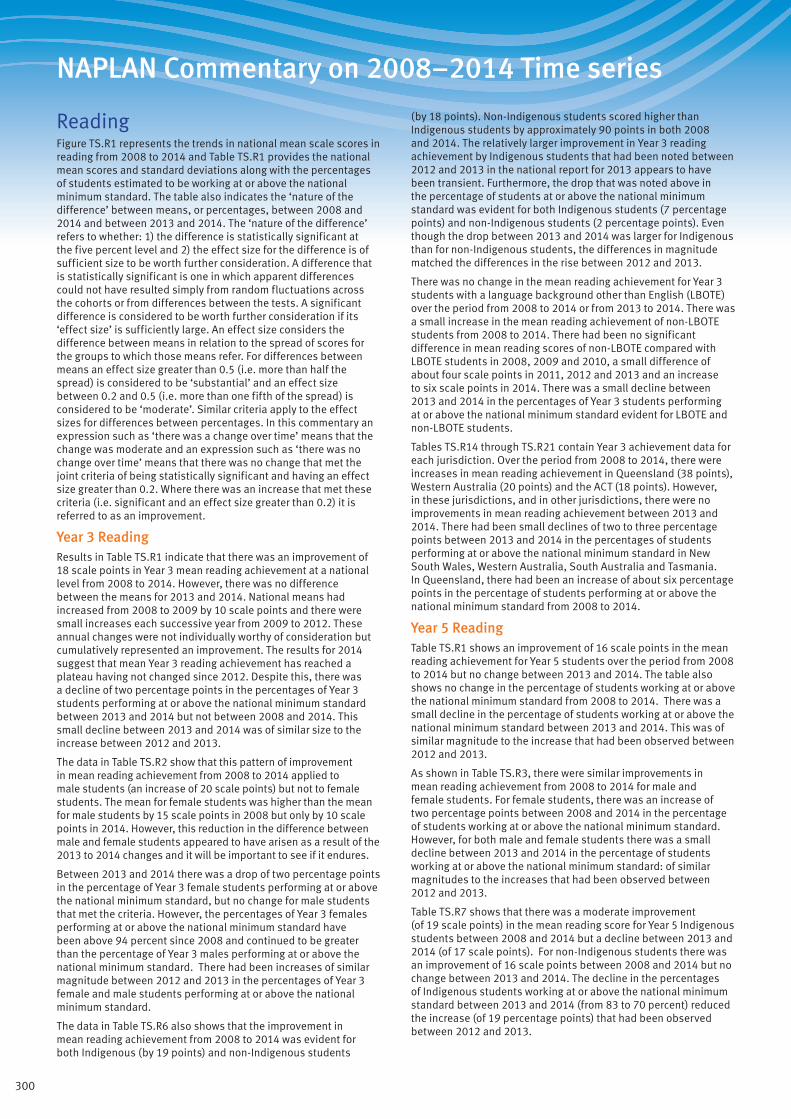
300
NAPLAN Commentary on 2008–2014 Time series
ReadingFigure TS.R1 represents the trends in national mean scale scores in reading from 2008 to 2014 and Table TS.R1 provides the national mean scores and standard deviations along with the percentages of students estimated to be working at or above the national minimum standard. The table also indicates the ‘nature of the difference’ between means, or percentages, between 2008 and 2014 and between 2013 and 2014. The ‘nature of the difference’ refers to whether: 1) the difference is statistically significant at the five percent level and 2) the effect size for the difference is of sufficient size to be worth further consideration. A difference that is statistically significant is one in which apparent differences could not have resulted simply from random fluctuations across the cohorts or from differences between the tests. A significant difference is considered to be worth further consideration if its ‘effect size’ is sufficiently large. An effect size considers the difference between means in relation to the spread of scores for the groups to which those means refer. For differences between means an effect size greater than 0.5 (i.e. more than half the spread) is considered to be ‘substantial’ and an effect size between 0.2 and 0.5 (i.e. more than one fifth of the spread) is considered to be ‘moderate’. Similar criteria apply to the effect sizes for differences between percentages. In this commentary an expression such as ‘there was a change over time’ means that the change was moderate and an expression such as ‘there was no change over time’ means that there was no change that met the joint criteria of being statistically significant and having an effect size greater than 0.2. Where there was an increase that met these criteria (i.e. significant and an effect size greater than 0.2) it is referred to as an improvement.
Year 3 ReadingResults in Table TS.R1 indicate that there was an improvement of 18 scale points in Year 3 mean reading achievement at a national level from 2008 to 2014. However, there was no difference between the means for 2013 and 2014. National means had increased from 2008 to 2009 by 10 scale points and there were small increases each successive year from 2009 to 2012. These annual changes were not individually worthy of consideration but cumulatively represented an improvement. The results for 2014 suggest that mean Year 3 reading achievement has reached a plateau having not changed since 2012. Despite this, there was a decline of two percentage points in the percentages of Year 3 students performing at or above the national minimum standard between 2013 and 2014 but not between 2008 and 2014. This small decline between 2013 and 2014 was of similar size to the increase between 2012 and 2013.
The data in Table TS.R2 show that this pattern of improvement in mean reading achievement from 2008 to 2014 applied to male students (an increase of 20 scale points) but not to female students. The mean for female students was higher than the mean for male students by 15 scale points in 2008 but only by 10 scale points in 2014. However, this reduction in the difference between male and female students appeared to have arisen as a result of the 2013 to 2014 changes and it will be important to see if it endures.
Between 2013 and 2014 there was a drop of two percentage points in the percentage of Year 3 female students performing at or above the national minimum standard, but no change for male students that met the criteria. However, the percentages of Year 3 females performing at or above the national minimum standard have been above 94 percent since 2008 and continued to be greater than the percentage of Year 3 males performing at or above the national minimum standard. There had been increases of similar magnitude between 2012 and 2013 in the percentages of Year 3 female and male students performing at or above the national minimum standard.
The data in Table TS.R6 also shows that the improvement in mean reading achievement from 2008 to 2014 was evident for both Indigenous (by 19 points) and non-Indigenous students
(by 18 points). Non-Indigenous students scored higher than Indigenous students by approximately 90 points in both 2008 and 2014. The relatively larger improvement in Year 3 reading achievement by Indigenous students that had been noted between 2012 and 2013 in the national report for 2013 appears to have been transient. Furthermore, the drop that was noted above in the percentage of students at or above the national minimum standard was evident for both Indigenous students (7 percentage points) and non-Indigenous students (2 percentage points). Even though the drop between 2013 and 2014 was larger for Indigenous than for non-Indigenous students, the differences in magnitude matched the differences in the rise between 2012 and 2013.
There was no change in the mean reading achievement for Year 3 students with a language background other than English (LBOTE) over the period from 2008 to 2014 or from 2013 to 2014. There was a small increase in the mean reading achievement of non-LBOTE students from 2008 to 2014. There had been no significant difference in mean reading scores of non-LBOTE compared with LBOTE students in 2008, 2009 and 2010, a small difference of about four scale points in 2011, 2012 and 2013 and an increase to six scale points in 2014. There was a small decline between 2013 and 2014 in the percentages of Year 3 students performing at or above the national minimum standard evident for LBOTE and non-LBOTE students.
Tables TS.R14 through TS.R21 contain Year 3 achievement data for each jurisdiction. Over the period from 2008 to 2014, there were increases in mean reading achievement in Queensland (38 points), Western Australia (20 points) and the ACT (18 points). However, in these jurisdictions, and in other jurisdictions, there were no improvements in mean reading achievement between 2013 and 2014. There had been small declines of two to three percentage points between 2013 and 2014 in the percentages of students performing at or above the national minimum standard in New South Wales, Western Australia, South Australia and Tasmania. In Queensland, there had been an increase of about six percentage points in the percentage of students performing at or above the national minimum standard from 2008 to 2014.
Year 5 Reading Table TS.R1 shows an improvement of 16 scale points in the mean reading achievement for Year 5 students over the period from 2008 to 2014 but no change between 2013 and 2014. The table also shows no change in the percentage of students working at or above the national minimum standard from 2008 to 2014. There was a small decline in the percentage of students working at or above the national minimum standard between 2013 and 2014. This was of similar magnitude to the increase that had been observed between 2012 and 2013.
As shown in Table TS.R3, there were similar improvements in mean reading achievement from 2008 to 2014 for male and female students. For female students, there was an increase of two percentage points between 2008 and 2014 in the percentage of students working at or above the national minimum standard. However, for both male and female students there was a small decline between 2013 and 2014 in the percentage of students working at or above the national minimum standard: of similar magnitudes to the increases that had been observed between 2012 and 2013.
Table TS.R7 shows that there was a moderate improvement (of 19 scale points) in the mean reading score for Year 5 Indigenous students between 2008 and 2014 but a decline between 2013 and 2014 (of 17 scale points). For non-Indigenous students there was an improvement of 16 scale points between 2008 and 2014 but no change between 2013 and 2014. The decline in the percentages of Indigenous students working at or above the national minimum standard between 2013 and 2014 (from 83 to 70 percent) reduced the increase (of 19 percentage points) that had been observed between 2012 and 2013.
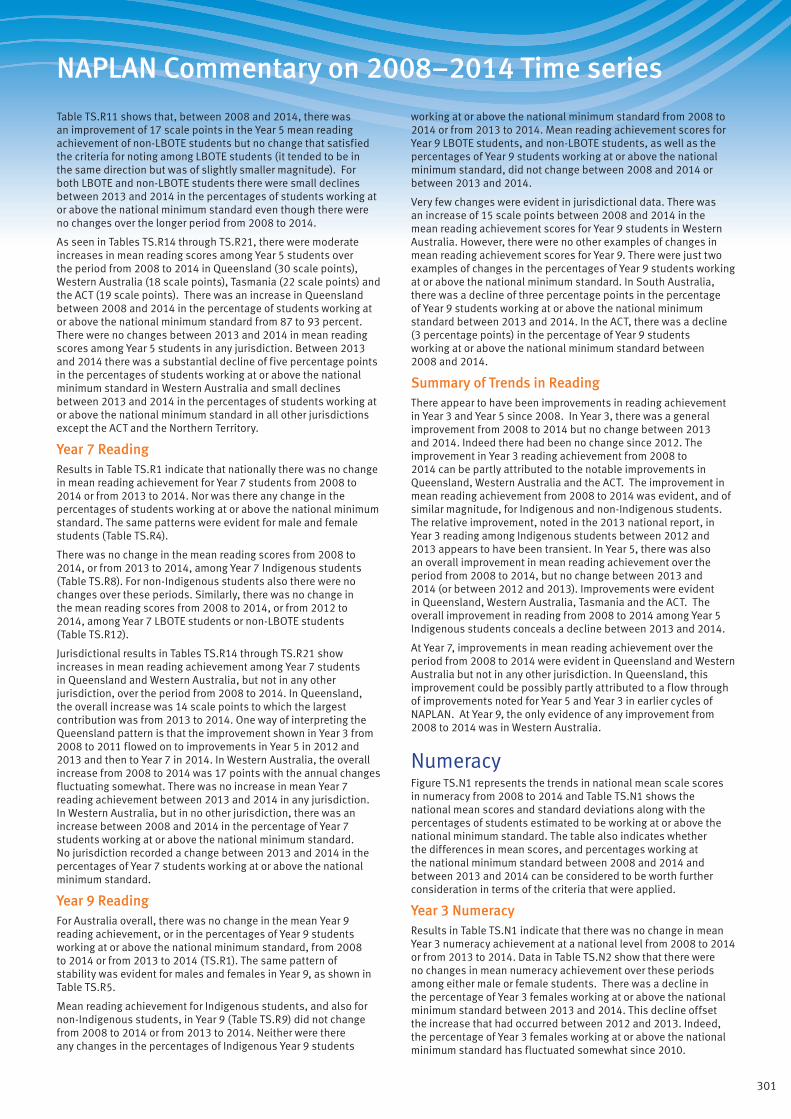
301
NAPLAN Commentary on 2008–2014 Time series
Table TS.R11 shows that, between 2008 and 2014, there was an improvement of 17 scale points in the Year 5 mean reading achievement of non-LBOTE students but no change that satisfied the criteria for noting among LBOTE students (it tended to be in the same direction but was of slightly smaller magnitude). For both LBOTE and non-LBOTE students there were small declines between 2013 and 2014 in the percentages of students working at or above the national minimum standard even though there were no changes over the longer period from 2008 to 2014.
As seen in Tables TS.R14 through TS.R21, there were moderate increases in mean reading scores among Year 5 students over the period from 2008 to 2014 in Queensland (30 scale points), Western Australia (18 scale points), Tasmania (22 scale points) and the ACT (19 scale points). There was an increase in Queensland between 2008 and 2014 in the percentage of students working at or above the national minimum standard from 87 to 93 percent. There were no changes between 2013 and 2014 in mean reading scores among Year 5 students in any jurisdiction. Between 2013 and 2014 there was a substantial decline of five percentage points in the percentages of students working at or above the national minimum standard in Western Australia and small declines between 2013 and 2014 in the percentages of students working at or above the national minimum standard in all other jurisdictions except the ACT and the Northern Territory.
Year 7 Reading Results in Table TS.R1 indicate that nationally there was no change in mean reading achievement for Year 7 students from 2008 to 2014 or from 2013 to 2014. Nor was there any change in the percentages of students working at or above the national minimum standard. The same patterns were evident for male and female students (Table TS.R4).
There was no change in the mean reading scores from 2008 to 2014, or from 2013 to 2014, among Year 7 Indigenous students (Table TS.R8). For non-Indigenous students also there were no changes over these periods. Similarly, there was no change in the mean reading scores from 2008 to 2014, or from 2012 to 2014, among Year 7 LBOTE students or non-LBOTE students (Table TS.R12).
Jurisdictional results in Tables TS.R14 through TS.R21 show increases in mean reading achievement among Year 7 students in Queensland and Western Australia, but not in any other jurisdiction, over the period from 2008 to 2014. In Queensland, the overall increase was 14 scale points to which the largest contribution was from 2013 to 2014. One way of interpreting the Queensland pattern is that the improvement shown in Year 3 from 2008 to 2011 flowed on to improvements in Year 5 in 2012 and 2013 and then to Year 7 in 2014. In Western Australia, the overall increase from 2008 to 2014 was 17 points with the annual changes fluctuating somewhat. There was no increase in mean Year 7 reading achievement between 2013 and 2014 in any jurisdiction. In Western Australia, but in no other jurisdiction, there was an increase between 2008 and 2014 in the percentage of Year 7 students working at or above the national minimum standard. No jurisdiction recorded a change between 2013 and 2014 in the percentages of Year 7 students working at or above the national minimum standard.
Year 9 Reading For Australia overall, there was no change in the mean Year 9 reading achievement, or in the percentages of Year 9 students working at or above the national minimum standard, from 2008 to 2014 or from 2013 to 2014 (TS.R1). The same pattern of stability was evident for males and females in Year 9, as shown in Table TS.R5.
Mean reading achievement for Indigenous students, and also for non-Indigenous students, in Year 9 (Table TS.R9) did not change from 2008 to 2014 or from 2013 to 2014. Neither were there any changes in the percentages of Indigenous Year 9 students
working at or above the national minimum standard from 2008 to 2014 or from 2013 to 2014. Mean reading achievement scores for Year 9 LBOTE students, and non-LBOTE students, as well as the percentages of Year 9 students working at or above the national minimum standard, did not change between 2008 and 2014 or between 2013 and 2014.
Very few changes were evident in jurisdictional data. There was an increase of 15 scale points between 2008 and 2014 in the mean reading achievement scores for Year 9 students in Western Australia. However, there were no other examples of changes in mean reading achievement scores for Year 9. There were just two examples of changes in the percentages of Year 9 students working at or above the national minimum standard. In South Australia, there was a decline of three percentage points in the percentage of Year 9 students working at or above the national minimum standard between 2013 and 2014. In the ACT, there was a decline (3 percentage points) in the percentage of Year 9 students working at or above the national minimum standard between 2008 and 2014.
Summary of Trends in Reading There appear to have been improvements in reading achievement in Year 3 and Year 5 since 2008. In Year 3, there was a general improvement from 2008 to 2014 but no change between 2013 and 2014. Indeed there had been no change since 2012. The improvement in Year 3 reading achievement from 2008 to 2014 can be partly attributed to the notable improvements in Queensland, Western Australia and the ACT. The improvement in mean reading achievement from 2008 to 2014 was evident, and of similar magnitude, for Indigenous and non-Indigenous students. The relative improvement, noted in the 2013 national report, in Year 3 reading among Indigenous students between 2012 and 2013 appears to have been transient. In Year 5, there was also an overall improvement in mean reading achievement over the period from 2008 to 2014, but no change between 2013 and 2014 (or between 2012 and 2013). Improvements were evident in Queensland, Western Australia, Tasmania and the ACT. The overall improvement in reading from 2008 to 2014 among Year 5 Indigenous students conceals a decline between 2013 and 2014.
At Year 7, improvements in mean reading achievement over the period from 2008 to 2014 were evident in Queensland and Western Australia but not in any other jurisdiction. In Queensland, this improvement could be possibly partly attributed to a flow through of improvements noted for Year 5 and Year 3 in earlier cycles of NAPLAN. At Year 9, the only evidence of any improvement from 2008 to 2014 was in Western Australia.
Numeracy Figure TS.N1 represents the trends in national mean scale scores in numeracy from 2008 to 2014 and Table TS.N1 shows the national mean scores and standard deviations along with the percentages of students estimated to be working at or above the national minimum standard. The table also indicates whether the differences in mean scores, and percentages working at the national minimum standard between 2008 and 2014 and between 2013 and 2014 can be considered to be worth further consideration in terms of the criteria that were applied.
Year 3 Numeracy Results in Table TS.N1 indicate that there was no change in mean Year 3 numeracy achievement at a national level from 2008 to 2014 or from 2013 to 2014. Data in Table TS.N2 show that there were no changes in mean numeracy achievement over these periods among either male or female students. There was a decline in the percentage of Year 3 females working at or above the national minimum standard between 2013 and 2014. This decline offset the increase that had occurred between 2012 and 2013. Indeed, the percentage of Year 3 females working at or above the national minimum standard has fluctuated somewhat since 2010.
302
NAPLAN Commentary on 2008–2014 Time series
There was no change in mean numeracy achievement for Year 3 Indigenous students between 2008 and 2014, or between 2013 and 2014 (Table TS.N6). Nor were there any changes in the percentages of Indigenous Year 3 students working at or above the national minimum standard between 2008 and 2014 or between 2013 and 2014. This lack of change was the same as for non-Indigenous students. The mean numeracy achievement for Year 3 LBOTE students, as for Year 3 non-LBOTE students, did not change over the period from 2008 to 2014 or between 2013 and 2014 (Table TS.N10).
Among the eight jurisdictions, only Queensland recorded an increase in Year 3 mean numeracy achievement over the period from 2008 to 2014 (by 26 points). In Queensland, there was also an increase (3 percentage points) from 2008 to 2014 in the percentage of Year 3 students working at or above the national minimum standard. In two jurisdictions (New South Wales and Tasmania), there were declines between 2008 and 2014 in the percentages of Year 3 students working at or above the national minimum standard. No jurisdiction showed a change from 2013 to 2014 in the mean Year 3 numeracy achievement or the percentage of Year 3 students working at or above the national minimum standard.
Year 5 Numeracy There was no change in mean Year 5 numeracy achievement at a national level from 2008 to 2014 or from 2013 to 2014 (Table TS.N1). Nor was there any change over either time period in the percentage of students working at or above the national minimum standard. There was also no change in the mean numeracy achievements of either male or female students in Year 5 between 2008 and 2014 or between 2013 and 2014 (Table TS.N3).
The data in Table TS.N7 show that there was no change in the mean numeracy achievement among Indigenous students in Year 5 over the full period from 2008 to 2014 or from 2013 to 2014. Neither were there any corresponding changes for non-Indigenous students. Similarly, there were no changes in the percentages of Year 5 Indigenous students, or non-Indigenous students, working at or above the national minimum standard. Table TS.N11 shows that there were no changes in the mean numeracy achievements, or the percentages working at or above the national minimum standard, of Year 5 LBOTE students or non-LBOTE students, either from 2008 to 2014 or from 2013 to 2014.
Jurisdictional results for Year 5 numeracy achievement (Tables TS.N14 through TS.N21) indicate that in four jurisdictions there were improvements between 2008 and 2014 in the mean numeracy achievement for Year 5 students: Queensland (24 scale points), Western Australia (20 scale points), Tasmania (13 scale points) and the ACT (14 points). In Queensland, there was also an increase (3 percentage points) in the percentage of students working at or above the national minimum standard. In no jurisdiction was there a change in mean Year 5 numeracy achievement, or the percentage of students working at or above the national minimum standard, between 2013 and 2014.
Year 7 Numeracy Results in Table TS.N1 show that, at a national level, there was no change in mean Year 7 numeracy achievement, or in the percentage of students working at or above the national minimum standard, from 2008 to 2014 or from 2013 to 2014. Table TS.N4 indicates that there were no changes in any of these statistics for male and female students separately.
There were no changes in the mean numeracy scores or the percentages of students working at or above the national minimum standard, for Indigenous students either over seven years from 2008 to 2014 or over one year from 2013 to 2014 (Table TS.N8). This pattern was the same as for non-Indigenous students. The same picture of no change in any of the indicators of numeracy achievement is evident for LBOTE students as well as non-LBOTE students (Table TS.N12).
Jurisdictional means for numeracy achievement in Year 7, along with the percentages of students working at or above the national minimum standard, are shown in Tables TS.N14 through TS.N21. There were no changes in mean scores, or the percentages of students working at or above the national minimum standard, over either the seven-year time span from 2008 to 2014 or the one-year time span from 2013 to 2014 in any of the eight jurisdictions.
Year 9 NumeracyResults in Table TS.N1 show no change in mean Year 9 numeracy achievement from 2008 to 2014 or from 2013 to 2014. However, there was an increase (four percentage points) in the percentages of students working at or above the national minimum standard between 2013 and 2014. However, the increase in this statistic between 2013 and 2014 follows a decline of similar magnitude between 2012 and 2013. No changes in mean numeracy achievement are evident for male or female students (Table TS.N5). However, the increases between 2013 and 2014 in the percentages of students working at or above the national minimum standard were evident for both male and female students.
There was no change in the mean Year 9 numeracy achievement from 2008 to 2014 for Indigenous students (Table TS.N9) or for non-Indigenous students. However, there was an improvement of 15 scale points in the mean Year 9 numeracy achievement for Indigenous students, together with an increase of 11 percentage points in the percentage of those students working at or above the national minimum standard, from 2013 to 2014. These increases offset the declines that had occurred between 2012 and 2013. For non-Indigenous students there was no change in mean Year 9 numeracy between 2013 and 2014 but a small increase of three percentage points in the percentage working at or above the national minimum standard.
Data for Year 9 LBOTE students are shown in Table TS.N13. Those trends match the trends for non-LBOTE students and those for the population overall: no change in mean numeracy achievement but increases in the percentages working at or above the national minimum standard.
The only jurisdiction in which there was an improvement in mean Year 9 numeracy achievement from 2008 to 2014 was Western Australia (by 20 scale points) and none showed an improvement in mean numeracy achievement from 2013 to 2014. In several jurisdictions, there were increases in the percentages by three to six percentage points of Year 9 students working at or above the national minimum standard between 2013 and 2014: New South Wales, Victoria, Queensland, Western Australia and Tasmania. In several of these jurisdictions, these increases compensated for declines in the corresponding statistic that had been evident between 2012 and 2013. However, in Western Australia there was an increase of two percentage points between 2008 and 2014 in the percentage of Year 9 students working at or above the national minimum standard.
Summary of Trends in NumeracyNumeracy achievement at the national level in Years 3, Year 5, Year 7 and Year 9 has remained unchanged from 2008 to 2014. This stability at the national level was also evident among sub-groups based on sex, Indigenous status and language background. There were instances of change in some jurisdictions. In Queensland, there were improvements in numeracy in Year 3 and Year 5 similar to the improvements observed in reading for that jurisdiction. In Western Australia, there was an improvement in numeracy in Year 9. However, across jurisdictions there are few instances of changes in numeracy over the period from 2008 to 2014.
303
NAPLAN Participation
Notes on reporting of participation
Notes for Table CP1 (all students)Exempt students are deemed not to have met the national minimum standard and are included in the calculation of participation rates.
For 2008:
• The participation (%) rates are taken from Tables *.A1 in the 2008 National Report. These participation rates count both students who sat the test and exempt students, and are correct to one decimal place.
• The exempt (%) rates are taken from Tables *.R1 and *.N1 in the 2008 National Report. These exempt rates are correct to one decimal place.
• The absent (%) rates are taken from Tables *.A3 in the 2008 National Report, and are for absent and withdrawn students combined. These absent rates are correct to the nearest integer.
For 2008 and 2009:
• Absent and withdrawn rates were reported combined, as one category, in the 2008 and 2009 NAPLAN National Reports. The absent rates for 2008 and 2009 thus include both absent and withdrawn students and the withdrawn (%) rates have been left blank in this table.
Notes for Table CP2 (by Indigenous Status)Exempt students are deemed not to have met the national minimum standard and are included in the calculation of participation rates.
For 2008:
• The participation (%) rates for Indigenous students are taken from Tables *.A2 in the 2008 National Report. These participation rates count both students who sat the test and exempt students, and are correct to one decimal place.
• The exempt (%) rates for Indigenous students are taken from Tables *.R3 and *.N3 in the 2008 National Report. These exempt rates are correct to one decimal place.
• The absent (%) rates for Indigenous students are taken from Tables *.A4 of the 2008 National Report, and are for absent and withdrawn students combined. These absent rates are correct to the nearest integer.
• Participation rates for non-Indigenous students were not reported in the 2008 NAPLAN National Report and have been left blank in this table.
For 2008 and 2009:
• Absent and withdrawn rates were reported combined, as one category, in the 2008 and 2009 NAPLAN National Reports. The absent rates for 2008 and 2009 thus include both absent and withdrawn students and the withdrawn (%) rates have been left blank in this table.

304
NAPLAN Participation
Table 3.CP1: Year 3 Student Participation in Assessment, by State and Territory, 2008–2014.
State/ Territory
Year
Reading Numeracy
Num
ber
Part
icip
ated
Part
icip
atio
n ra
te (%
)
Abs
ent
(%)
Wit
hdra
wn
(%)
Exem
pt(%
)
Num
ber
Part
icip
ated
Part
icip
atio
n ra
te (%
)
Abs
ent
(%)
Wit
hdra
wn
(%)
Exem
pt(%
)
NSW
2008 85682 97.2 3 0.9 85364 96.9 3 0.9
2009 85762 97.4 2.6 1.3 85459 97.1 2.9 1.3
2010 84964 97.2 1.7 1.1 1.8 84756 97.0 2.0 1.0 1.7
2011 85336 97.3 1.8 0.9 1.6 85115 97.0 2.1 0.9 1.6
2012 86315 97.0 2.0 1.0 1.7 85981 96.6 2.4 1.0 1.7
2013 87333 97.2 1.6 1.1 1.6 87078 96.9 2.0 1.1 1.6
2014 90831 97.1 1.6 1.3 1.6 90599 96.8 1.9 1.2 1.6
Vic
2008 62230 96.0 4 2.7 62133 95.8 4 2.7
2009 61827 95.0 5.0 3.0 61457 94.4 5.6 2.9
2010 60742 93.8 3.5 2.7 2.9 60559 93.5 3.9 2.6 2.9
2011 62392 94.6 3.3 2.1 2.8 62300 94.4 3.6 2.0 2.8
2012 63715 94.7 2.7 2.6 2.8 63616 94.6 3.0 2.4 2.8
2013 64053 94.4 2.9 2.7 2.8 63813 94.1 3.4 2.6 2.8
2014 67292 94.4 2.7 2.9 3.1 67241 94.3 3.0 2.7 3.0
Qld
2008 55770 97.6 2 1.9 55507 97.1 3 1.8
2009 54726 97.1 2.9 1.8 54464 96.6 3.4 1.6
2010 36813 96.1 2.2 1.7 2.3 36714 95.9 2.6 1.6 2.2
2011 53530 96.0 2.3 1.6 1.7 53273 95.6 2.9 1.5 1.6
2012 55629 94.8 2.7 2.6 1.5 55405 94.4 3.2 2.4 1.5
2013 57364 94.2 2.4 3.4 1.5 57125 93.9 2.9 3.2 1.4
2014 59295 93.3 2.4 4.4 1.5 59079 92.9 2.9 4.2 1.4
WA
2008 26635 95.2 5 1.0 26591 95.1 5 1.0
2009 26962 96.3 3.7 1.3 26879 96.0 4.0 1.3
2010 27108 95.5 3.4 1.0 1.5 26986 95.1 4.0 0.9 1.5
2011 27195 95.4 3.5 1.1 1.4 27154 95.3 3.7 1.0 1.3
2012 28197 95.1 3.5 1.4 1.4 28061 94.7 4.0 1.3 1.4
2013 29286 95.1 3.2 1.7 1.2 29185 94.7 3.6 1.7 1.2
2014 30804 95.0 3.0 1.9 1.3 30677 94.6 3.5 1.9 1.2
SA
2008 18717 96.9 3 3.1 18698 96.8 3 3.1
2009 17599 94.8 5.2 1.7 17568 94.7 5.3 1.6
2010 17728 93.7 3.3 3.1 2.1 17696 93.5 3.6 2.9 2.0
2011 17375 93.5 3.3 3.3 2.4 17310 93.1 3.8 3.1 2.3
2012 17941 93.7 2.8 3.5 2.3 17871 93.4 3.4 3.3 2.3
2013 17589 93.3 2.9 3.8 2.3 17561 93.2 3.2 3.6 2.2
2014 18680 92.8 3.1 4.1 2.3 18618 92.5 3.6 3.9 2.3
Tas
2008 6377 96.8 3 1.0 6356 96.5 4 1.0
2009 6290 97.6 2.4 1.4 6258 97.1 2.9 1.3
2010 5942 96.0 2.4 1.5 1.3 5912 95.6 3.0 1.5 1.3
2011 6035 96.5 2.3 1.2 1.6 6004 96.0 2.8 1.2 1.6
2012 5725 95.2 3.2 1.6 1.4 5707 94.9 3.5 1.6 1.4
2013 5690 95.8 2.5 1.8 1.5 5678 95.6 2.7 1.8 1.5
2014 6107 95.5 2.7 1.8 1.9 6073 94.9 3.3 1.8 1.9
Note: Exempt students are deemed not to have met the NMS and are included in the calculation of participation rates.
Refer to page 303 for notes on the Participation tables. Refer to the introduction for explanatory notes.

305
NAPLAN Participation
Table 3.CP1 (cont.): Year 3 Student Participation in Assessment, by State and Territory, 2008–2014.
State/ Territory
Year
Reading Numeracy
Num
ber
Part
icip
ated
Part
icip
atio
n ra
te (%
)
Abs
ent
(%)
Wit
hdra
wn
(%)
Exem
pt(%
)
Num
ber
Part
icip
ated
Part
icip
atio
n ra
te (%
)
Abs
ent
(%)
Wit
hdra
wn
(%)
Exem
pt(%
)
ACT
2008 4174 95.6 4 2.1 4148 95.0 5 2.1
2009 4252 95.4 4.6 2.9 4233 95.0 5.0 2.8
2010 4029 94.9 1.7 3.4 2.2 4021 94.7 2.0 3.3 2.2
2011 4109 93.2 2.3 4.5 2.2 4099 93.0 2.5 4.4 2.1
2012 4414 93.4 2.6 4.0 1.7 4407 93.3 2.8 4.0 1.6
2013 4338 93.1 2.5 4.4 2.3 4336 93.1 2.7 4.2 2.2
2014 4657 93.0 2.1 4.9 1.8 4658 93.0 2.2 4.7 1.7
NT
2008 2787 82.7 17 1.6 2800 83.1 17 1.6
2009 3120 93.5 6.5 1.7 3075 92.2 7.8 1.6
2010 3023 88.0 10.7 1.2 2.0 3013 87.7 11.0 1.2 2.0
2011 3087 88.1 10.4 1.5 2.2 3058 87.2 11.3 1.5 2.2
2012 2882 87.6 10.8 1.6 2.1 2831 86.0 12.3 1.7 2.0
2013 2829 86.6 11.3 2.1 1.7 2817 86.3 11.6 2.1 1.7
2014 3045 88.4 8.2 3.4 2.5 3056 88.7 9.3 2.1 2.5
Aust
2008 262372 96.6 3 1.7 261597 96.3 4 1.7
2009 260538 96.4 3.6 1.9 259393 96.0 4.0 1.8
2010 240349 95.5 2.7 1.8 2.1 239657 95.3 3.1 1.7 2.1
2011 259059 95.7 2.7 1.6 2.0 258313 95.4 3.1 1.5 1.9
2012 264818 95.3 2.7 2.0 2.0 263879 95.0 3.1 1.9 1.9
2013 268482 95.2 2.5 2.3 1.9 267593 94.9 2.9 2.2 1.9
2014 280711 94.9 2.4 2.7 2.0 280001 94.6 2.8 2.5 1.9
Note: Exempt students are deemed not to have met the NMS and are included in the calculation of participation rates.
Refer to page 303 for notes on the Participation tables. Refer to the introduction for explanatory notes.
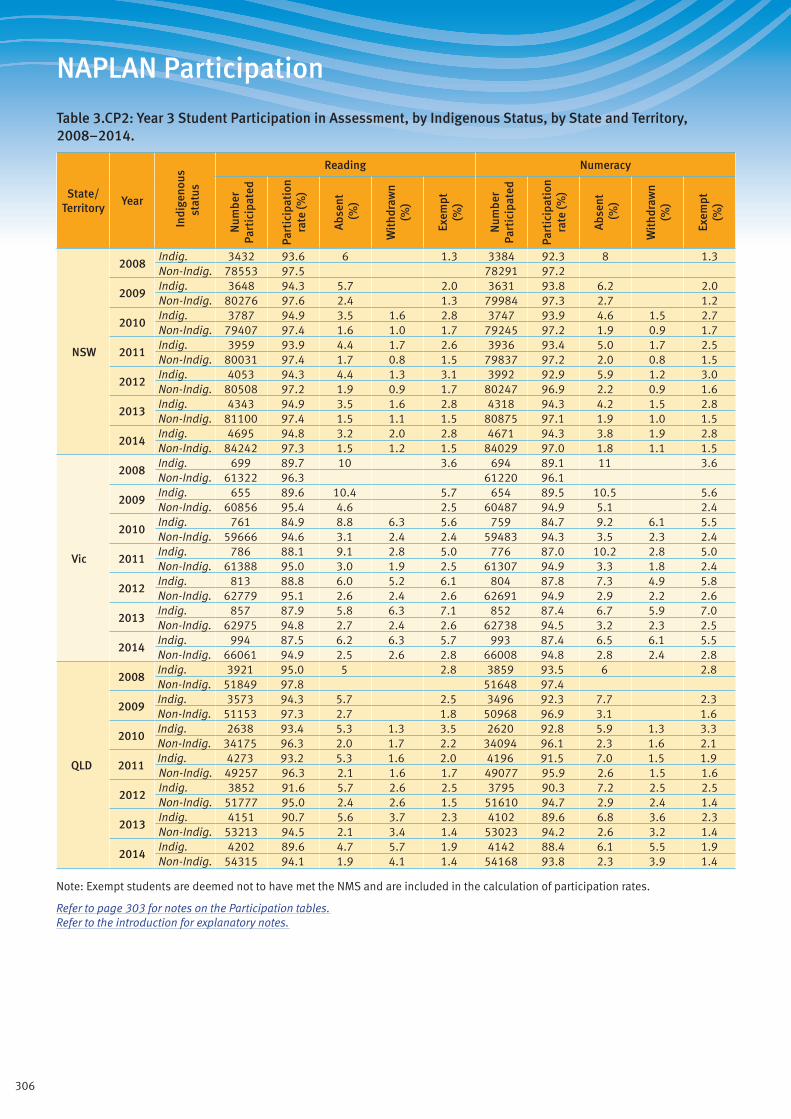
306
NAPLAN Participation
Table 3.CP2: Year 3 Student Participation in Assessment, by Indigenous Status, by State and Territory, 2008–2014.
State/ Territory
Year
Indi
geno
us
stat
us
Reading Numeracy
Num
ber
Part
icip
ated
Part
icip
atio
n ra
te (%
)
Abs
ent
(%)
Wit
hdra
wn
(%)
Exem
pt(%
)
Num
ber
Part
icip
ated
Part
icip
atio
n ra
te (%
)
Abs
ent
(%)
Wit
hdra
wn
(%)
Exem
pt(%
)
NSW
2008Indig. 3432 93.6 6 1.3 3384 92.3 8 1.3Non-Indig. 78553 97.5 78291 97.2
2009Indig. 3648 94.3 5.7 2.0 3631 93.8 6.2 2.0Non-Indig. 80276 97.6 2.4 1.3 79984 97.3 2.7 1.2
2010Indig. 3787 94.9 3.5 1.6 2.8 3747 93.9 4.6 1.5 2.7Non-Indig. 79407 97.4 1.6 1.0 1.7 79245 97.2 1.9 0.9 1.7
2011Indig. 3959 93.9 4.4 1.7 2.6 3936 93.4 5.0 1.7 2.5Non-Indig. 80031 97.4 1.7 0.8 1.5 79837 97.2 2.0 0.8 1.5
2012Indig. 4053 94.3 4.4 1.3 3.1 3992 92.9 5.9 1.2 3.0Non-Indig. 80508 97.2 1.9 0.9 1.7 80247 96.9 2.2 0.9 1.6
2013Indig. 4343 94.9 3.5 1.6 2.8 4318 94.3 4.2 1.5 2.8Non-Indig. 81100 97.4 1.5 1.1 1.5 80875 97.1 1.9 1.0 1.5
2014Indig. 4695 94.8 3.2 2.0 2.8 4671 94.3 3.8 1.9 2.8Non-Indig. 84242 97.3 1.5 1.2 1.5 84029 97.0 1.8 1.1 1.5
Vic
2008Indig. 699 89.7 10 3.6 694 89.1 11 3.6Non-Indig. 61322 96.3 61220 96.1
2009Indig. 655 89.6 10.4 5.7 654 89.5 10.5 5.6Non-Indig. 60856 95.4 4.6 2.5 60487 94.9 5.1 2.4
2010Indig. 761 84.9 8.8 6.3 5.6 759 84.7 9.2 6.1 5.5Non-Indig. 59666 94.6 3.1 2.4 2.4 59483 94.3 3.5 2.3 2.4
2011Indig. 786 88.1 9.1 2.8 5.0 776 87.0 10.2 2.8 5.0Non-Indig. 61388 95.0 3.0 1.9 2.5 61307 94.9 3.3 1.8 2.4
2012Indig. 813 88.8 6.0 5.2 6.1 804 87.8 7.3 4.9 5.8Non-Indig. 62779 95.1 2.6 2.4 2.6 62691 94.9 2.9 2.2 2.6
2013Indig. 857 87.9 5.8 6.3 7.1 852 87.4 6.7 5.9 7.0Non-Indig. 62975 94.8 2.7 2.4 2.6 62738 94.5 3.2 2.3 2.5
2014Indig. 994 87.5 6.2 6.3 5.7 993 87.4 6.5 6.1 5.5Non-Indig. 66061 94.9 2.5 2.6 2.8 66008 94.8 2.8 2.4 2.8
QLD
2008Indig. 3921 95.0 5 2.8 3859 93.5 6 2.8Non-Indig. 51849 97.8 51648 97.4
2009Indig. 3573 94.3 5.7 2.5 3496 92.3 7.7 2.3Non-Indig. 51153 97.3 2.7 1.8 50968 96.9 3.1 1.6
2010Indig. 2638 93.4 5.3 1.3 3.5 2620 92.8 5.9 1.3 3.3Non-Indig. 34175 96.3 2.0 1.7 2.2 34094 96.1 2.3 1.6 2.1
2011Indig. 4273 93.2 5.3 1.6 2.0 4196 91.5 7.0 1.5 1.9Non-Indig. 49257 96.3 2.1 1.6 1.7 49077 95.9 2.6 1.5 1.6
2012Indig. 3852 91.6 5.7 2.6 2.5 3795 90.3 7.2 2.5 2.5Non-Indig. 51777 95.0 2.4 2.6 1.5 51610 94.7 2.9 2.4 1.4
2013Indig. 4151 90.7 5.6 3.7 2.3 4102 89.6 6.8 3.6 2.3Non-Indig. 53213 94.5 2.1 3.4 1.4 53023 94.2 2.6 3.2 1.4
2014Indig. 4202 89.6 4.7 5.7 1.9 4142 88.4 6.1 5.5 1.9Non-Indig. 54315 94.1 1.9 4.1 1.4 54168 93.8 2.3 3.9 1.4
Note: Exempt students are deemed not to have met the NMS and are included in the calculation of participation rates.
Refer to page 303 for notes on the Participation tables. Refer to the introduction for explanatory notes.

307
NAPLAN Participation
Table 3.CP2 (cont.): Year 3 Student Participation in Assessment, by Indigenous Status, by State and Territory, 2008–2014.
State/ Territory
Year
Indi
geno
us
stat
us
Reading Numeracy
Num
ber
Part
icip
ated
Part
icip
atio
n ra
te (%
)
Abs
ent
(%)
Wit
hdra
wn
(%)
Exem
pt(%
)
Num
ber
Part
icip
ated
Part
icip
atio
n ra
te (%
)
Abs
ent
(%)
Wit
hdra
wn
(%)
Exem
pt(%
)
WA
2008Indig. 1635 84.6 15 0.9 1625 84.1 16 0.9Non-Indig. 23359 96.8 23328 96.7
2009Indig. 1505 85.9 14.1 1.1 1461 83.4 16.6 1.1Non-Indig. 23484 97.1 2.9 1.3 23458 97.0 3.0 1.2
2010Indig. 1789 86.6 12.8 0.6 1.4 1768 85.6 13.8 0.6 1.4Non-Indig. 23984 96.8 2.4 0.8 1.4 23885 96.4 2.9 0.8 1.4
2011Indig. 1673 85.0 14.3 0.7 1.2 1658 84.2 15.1 0.6 1.3Non-Indig. 24802 96.2 2.7 1.1 1.4 24777 96.1 2.9 1.0 1.3
2012Indig. 1647 85.4 13.5 1.1 1.2 1601 83.0 15.9 1.1 1.2Non-Indig. 26037 95.9 2.7 1.4 1.4 25956 95.6 3.1 1.3 1.4
2013Indig. 1807 85.6 13.0 1.4 1.6 1776 84.1 14.5 1.3 1.6Non-Indig. 26651 96.0 2.3 1.7 1.2 26583 95.7 2.6 1.6 1.2
2014Indig. 1903 84.8 13.1 2.0 1.1 1885 84.0 13.9 2.0 1.2Non-Indig. 28089 96.0 2.1 1.9 1.3 27984 95.6 2.5 1.8 1.2
SA
2008Indig. 666 95.6 4 5.2 674 96.7 3 5.2Non-Indig. 17689 98.7 17664 98.5
2009Indig. 570 82.0 18.0 2.2 575 82.7 17.3 2.2Non-Indig. 16888 95.4 4.6 1.7 16854 95.2 4.8 1.6
2010Indig. 600 82.9 10.6 6.5 3.9 595 82.2 12.0 5.8 3.9Non-Indig. 16896 94.2 2.9 2.9 2.0 16866 94.0 3.2 2.7 1.9
2011Indig. 577 80.8 13.9 5.3 5.2 579 81.1 14.1 4.8 5.0Non-Indig. 16392 94.3 2.6 3.0 2.2 16323 93.9 3.2 2.9 2.1
2012Indig. 617 84.3 8.5 7.2 5.7 621 84.8 8.5 6.7 5.6Non-Indig. 16780 94.2 2.5 3.4 2.1 16706 93.7 3.1 3.1 2.1
2013Indig. 624 83.2 9.3 7.5 4.4 617 82.3 10.3 7.5 4.4Non-Indig. 16537 93.9 2.5 3.5 2.1 16510 93.8 2.9 3.4 2.0
2014Indig. 694 81.3 11.1 7.6 4.6 686 80.3 12.4 7.3 4.6Non-Indig. 17594 93.5 2.6 3.9 2.2 17544 93.3 3.1 3.6 2.1
Tas
2008Indig. 430 96.6 3 0.7 425 95.5 4 0.7Non-Indig. 4717 97.6 4703 97.3
2009Indig. 435 95.6 4.4 2.9 436 95.8 4.2 2.9Non-Indig. 5072 97.7 2.3 1.3 5045 97.2 2.8 1.3
2010Indig. 414 96.5 3.0 0.5 1.2 410 95.6 4.0 0.5 1.2Non-Indig. 5314 96.7 2.4 0.9 1.2 5294 96.3 2.8 0.8 1.2
2011Indig. 414 95.2 4.1 0.7 1.8 410 94.3 5.1 0.7 1.8Non-Indig. 5429 97.5 2.1 0.5 1.6 5402 97.0 2.6 0.4 1.5
2012Indig. 389 95.6 3.7 0.7 1.7 387 95.1 4.2 0.7 1.5Non-Indig. 5181 96.1 3.2 0.7 1.4 5167 95.8 3.5 0.7 1.4
2013Indig. 385 94.8 3.9 1.2 1.7 386 95.1 3.9 1.0 1.7Non-Indig. 5118 96.8 2.4 0.8 1.5 5106 96.6 2.6 0.8 1.5
2014Indig. 471 95.3 2.8 1.8 1.2 468 94.7 3.4 1.8 1.2Non-Indig. 5474 96.4 2.7 0.8 2.0 5447 95.9 3.2 0.8 2.0
Note: Exempt students are deemed not to have met the NMS and are included in the calculation of participation rates.
Refer to page 303 for notes on the Participation tables. Refer to the introduction for explanatory notes.
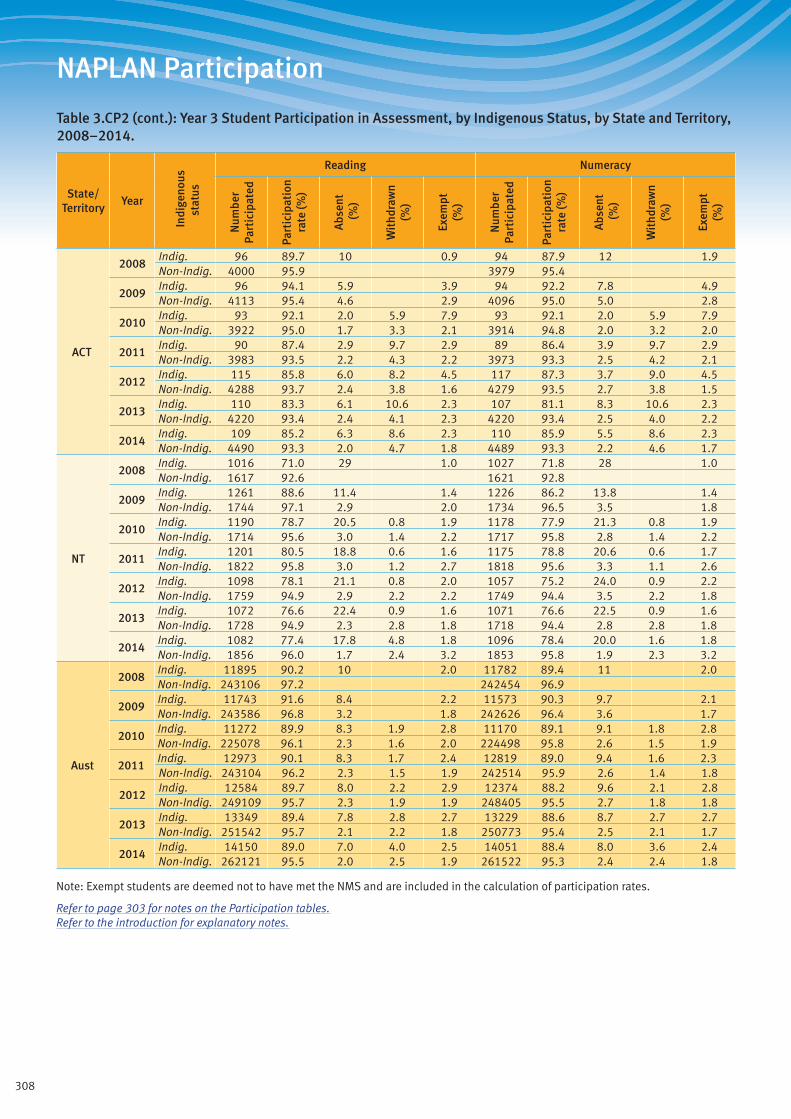
308
NAPLAN Participation
Table 3.CP2 (cont.): Year 3 Student Participation in Assessment, by Indigenous Status, by State and Territory, 2008–2014.
State/ Territory
Year
Indi
geno
us
stat
us
Reading Numeracy
Num
ber
Part
icip
ated
Part
icip
atio
n ra
te (%
)
Abs
ent
(%)
Wit
hdra
wn
(%)
Exem
pt(%
)
Num
ber
Part
icip
ated
Part
icip
atio
n ra
te (%
)
Abs
ent
(%)
Wit
hdra
wn
(%)
Exem
pt(%
)
ACT
2008Indig. 96 89.7 10 0.9 94 87.9 12 1.9Non-Indig. 4000 95.9 3979 95.4
2009Indig. 96 94.1 5.9 3.9 94 92.2 7.8 4.9Non-Indig. 4113 95.4 4.6 2.9 4096 95.0 5.0 2.8
2010Indig. 93 92.1 2.0 5.9 7.9 93 92.1 2.0 5.9 7.9Non-Indig. 3922 95.0 1.7 3.3 2.1 3914 94.8 2.0 3.2 2.0
2011Indig. 90 87.4 2.9 9.7 2.9 89 86.4 3.9 9.7 2.9Non-Indig. 3983 93.5 2.2 4.3 2.2 3973 93.3 2.5 4.2 2.1
2012Indig. 115 85.8 6.0 8.2 4.5 117 87.3 3.7 9.0 4.5Non-Indig. 4288 93.7 2.4 3.8 1.6 4279 93.5 2.7 3.8 1.5
2013Indig. 110 83.3 6.1 10.6 2.3 107 81.1 8.3 10.6 2.3Non-Indig. 4220 93.4 2.4 4.1 2.3 4220 93.4 2.5 4.0 2.2
2014Indig. 109 85.2 6.3 8.6 2.3 110 85.9 5.5 8.6 2.3Non-Indig. 4490 93.3 2.0 4.7 1.8 4489 93.3 2.2 4.6 1.7
NT
2008Indig. 1016 71.0 29 1.0 1027 71.8 28 1.0Non-Indig. 1617 92.6 1621 92.8
2009Indig. 1261 88.6 11.4 1.4 1226 86.2 13.8 1.4Non-Indig. 1744 97.1 2.9 2.0 1734 96.5 3.5 1.8
2010Indig. 1190 78.7 20.5 0.8 1.9 1178 77.9 21.3 0.8 1.9Non-Indig. 1714 95.6 3.0 1.4 2.2 1717 95.8 2.8 1.4 2.2
2011Indig. 1201 80.5 18.8 0.6 1.6 1175 78.8 20.6 0.6 1.7Non-Indig. 1822 95.8 3.0 1.2 2.7 1818 95.6 3.3 1.1 2.6
2012Indig. 1098 78.1 21.1 0.8 2.0 1057 75.2 24.0 0.9 2.2Non-Indig. 1759 94.9 2.9 2.2 2.2 1749 94.4 3.5 2.2 1.8
2013Indig. 1072 76.6 22.4 0.9 1.6 1071 76.6 22.5 0.9 1.6Non-Indig. 1728 94.9 2.3 2.8 1.8 1718 94.4 2.8 2.8 1.8
2014Indig. 1082 77.4 17.8 4.8 1.8 1096 78.4 20.0 1.6 1.8Non-Indig. 1856 96.0 1.7 2.4 3.2 1853 95.8 1.9 2.3 3.2
Aust
2008Indig. 11895 90.2 10 2.0 11782 89.4 11 2.0Non-Indig. 243106 97.2 242454 96.9
2009Indig. 11743 91.6 8.4 2.2 11573 90.3 9.7 2.1Non-Indig. 243586 96.8 3.2 1.8 242626 96.4 3.6 1.7
2010Indig. 11272 89.9 8.3 1.9 2.8 11170 89.1 9.1 1.8 2.8Non-Indig. 225078 96.1 2.3 1.6 2.0 224498 95.8 2.6 1.5 1.9
2011Indig. 12973 90.1 8.3 1.7 2.4 12819 89.0 9.4 1.6 2.3Non-Indig. 243104 96.2 2.3 1.5 1.9 242514 95.9 2.6 1.4 1.8
2012Indig. 12584 89.7 8.0 2.2 2.9 12374 88.2 9.6 2.1 2.8Non-Indig. 249109 95.7 2.3 1.9 1.9 248405 95.5 2.7 1.8 1.8
2013Indig. 13349 89.4 7.8 2.8 2.7 13229 88.6 8.7 2.7 2.7Non-Indig. 251542 95.7 2.1 2.2 1.8 250773 95.4 2.5 2.1 1.7
2014Indig. 14150 89.0 7.0 4.0 2.5 14051 88.4 8.0 3.6 2.4Non-Indig. 262121 95.5 2.0 2.5 1.9 261522 95.3 2.4 2.4 1.8
Note: Exempt students are deemed not to have met the NMS and are included in the calculation of participation rates.
Refer to page 303 for notes on the Participation tables. Refer to the introduction for explanatory notes.
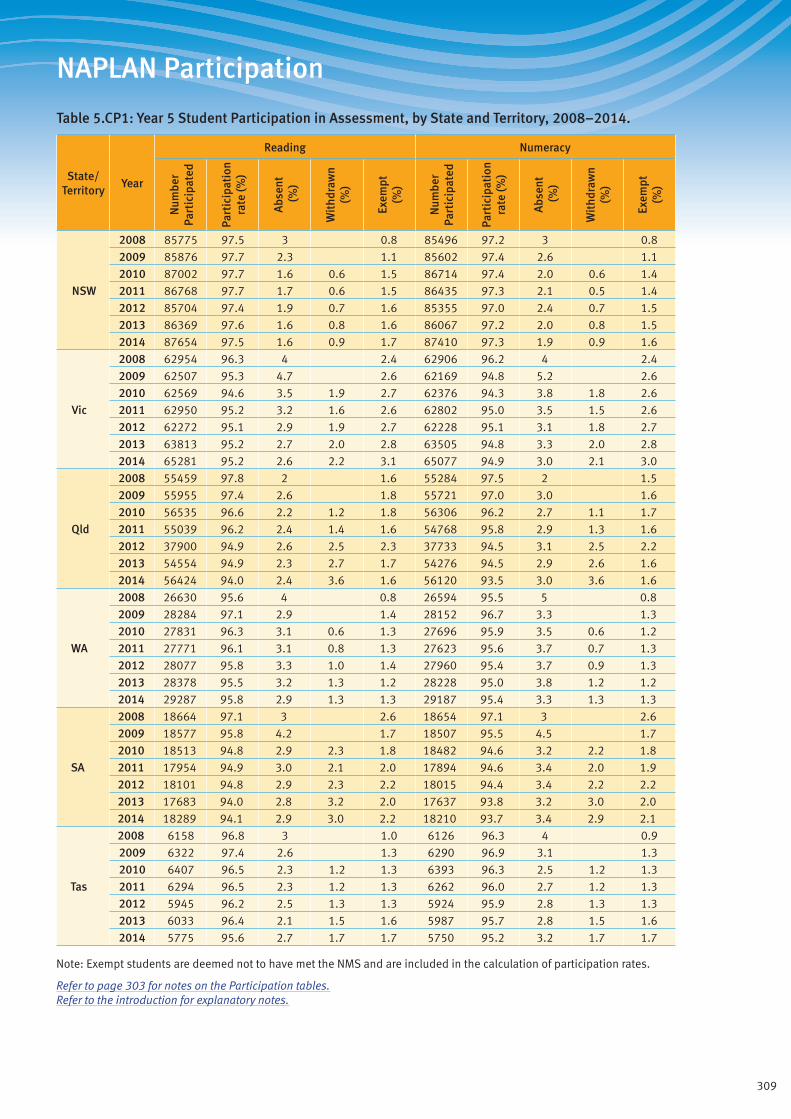
309
NAPLAN Participation
Table 5.CP1: Year 5 Student Participation in Assessment, by State and Territory, 2008–2014.
State/ Territory
Year
Reading Numeracy
Num
ber
Part
icip
ated
Part
icip
atio
n ra
te (%
)
Abs
ent
(%)
Wit
hdra
wn
(%)
Exem
pt(%
)
Num
ber
Part
icip
ated
Part
icip
atio
n ra
te (%
)
Abs
ent
(%)
Wit
hdra
wn
(%)
Exem
pt(%
)
NSW
2008 85775 97.5 3 0.8 85496 97.2 3 0.8
2009 85876 97.7 2.3 1.1 85602 97.4 2.6 1.1
2010 87002 97.7 1.6 0.6 1.5 86714 97.4 2.0 0.6 1.4
2011 86768 97.7 1.7 0.6 1.5 86435 97.3 2.1 0.5 1.4
2012 85704 97.4 1.9 0.7 1.6 85355 97.0 2.4 0.7 1.5
2013 86369 97.6 1.6 0.8 1.6 86067 97.2 2.0 0.8 1.5
2014 87654 97.5 1.6 0.9 1.7 87410 97.3 1.9 0.9 1.6
Vic
2008 62954 96.3 4 2.4 62906 96.2 4 2.4
2009 62507 95.3 4.7 2.6 62169 94.8 5.2 2.6
2010 62569 94.6 3.5 1.9 2.7 62376 94.3 3.8 1.8 2.6
2011 62950 95.2 3.2 1.6 2.6 62802 95.0 3.5 1.5 2.6
2012 62272 95.1 2.9 1.9 2.7 62228 95.1 3.1 1.8 2.7
2013 63813 95.2 2.7 2.0 2.8 63505 94.8 3.3 2.0 2.8
2014 65281 95.2 2.6 2.2 3.1 65077 94.9 3.0 2.1 3.0
Qld
2008 55459 97.8 2 1.6 55284 97.5 2 1.5
2009 55955 97.4 2.6 1.8 55721 97.0 3.0 1.6
2010 56535 96.6 2.2 1.2 1.8 56306 96.2 2.7 1.1 1.7
2011 55039 96.2 2.4 1.4 1.6 54768 95.8 2.9 1.3 1.6
2012 37900 94.9 2.6 2.5 2.3 37733 94.5 3.1 2.5 2.2
2013 54554 94.9 2.3 2.7 1.7 54276 94.5 2.9 2.6 1.6
2014 56424 94.0 2.4 3.6 1.6 56120 93.5 3.0 3.6 1.6
WA
2008 26630 95.6 4 0.8 26594 95.5 5 0.8
2009 28284 97.1 2.9 1.4 28152 96.7 3.3 1.3
2010 27831 96.3 3.1 0.6 1.3 27696 95.9 3.5 0.6 1.2
2011 27771 96.1 3.1 0.8 1.3 27623 95.6 3.7 0.7 1.3
2012 28077 95.8 3.3 1.0 1.4 27960 95.4 3.7 0.9 1.3
2013 28378 95.5 3.2 1.3 1.2 28228 95.0 3.8 1.2 1.2
2014 29287 95.8 2.9 1.3 1.3 29187 95.4 3.3 1.3 1.3
SA
2008 18664 97.1 3 2.6 18654 97.1 3 2.6
2009 18577 95.8 4.2 1.7 18507 95.5 4.5 1.7
2010 18513 94.8 2.9 2.3 1.8 18482 94.6 3.2 2.2 1.8
2011 17954 94.9 3.0 2.1 2.0 17894 94.6 3.4 2.0 1.9
2012 18101 94.8 2.9 2.3 2.2 18015 94.4 3.4 2.2 2.2
2013 17683 94.0 2.8 3.2 2.0 17637 93.8 3.2 3.0 2.0
2014 18289 94.1 2.9 3.0 2.2 18210 93.7 3.4 2.9 2.1
Tas
2008 6158 96.8 3 1.0 6126 96.3 4 0.9
2009 6322 97.4 2.6 1.3 6290 96.9 3.1 1.3
2010 6407 96.5 2.3 1.2 1.3 6393 96.3 2.5 1.2 1.3
2011 6294 96.5 2.3 1.2 1.3 6262 96.0 2.7 1.2 1.3
2012 5945 96.2 2.5 1.3 1.3 5924 95.9 2.8 1.3 1.3
2013 6033 96.4 2.1 1.5 1.6 5987 95.7 2.8 1.5 1.6
2014 5775 95.6 2.7 1.7 1.7 5750 95.2 3.2 1.7 1.7
Note: Exempt students are deemed not to have met the NMS and are included in the calculation of participation rates.
Refer to page 303 for notes on the Participation tables. Refer to the introduction for explanatory notes.
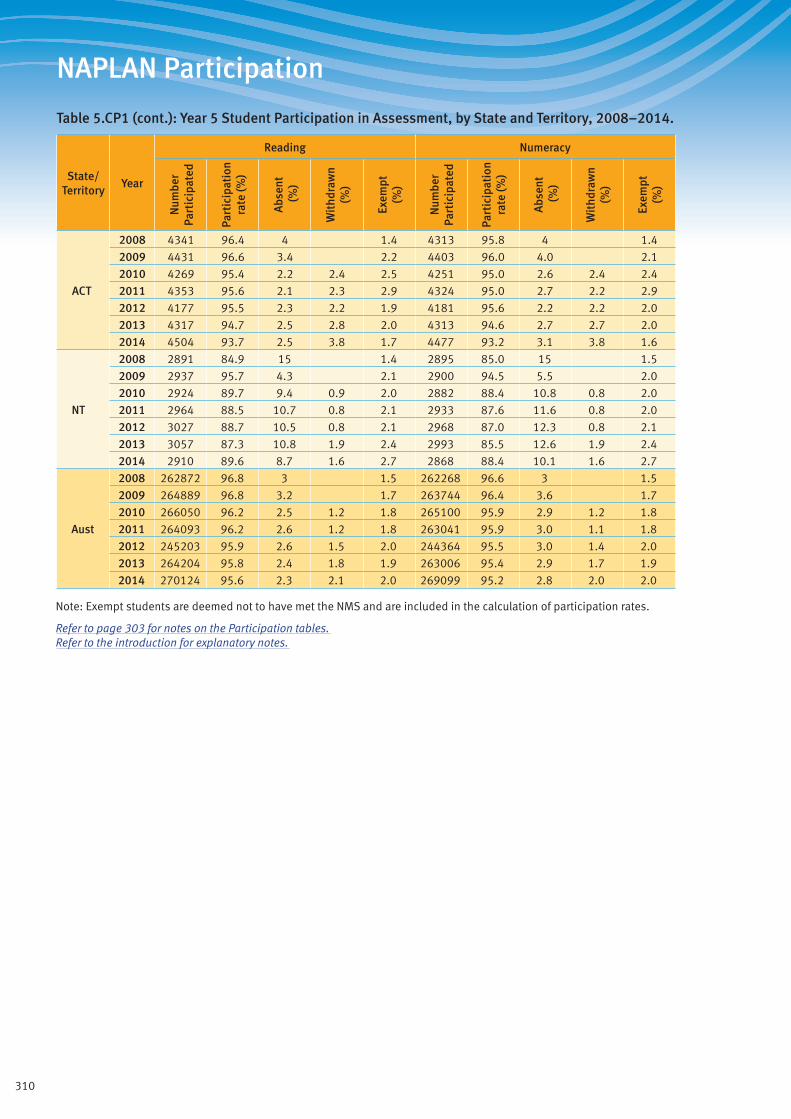
310
NAPLAN Participation
Table 5.CP1 (cont.): Year 5 Student Participation in Assessment, by State and Territory, 2008–2014.
State/ Territory
Year
Reading Numeracy
Num
ber
Part
icip
ated
Part
icip
atio
n ra
te (%
)
Abs
ent
(%)
Wit
hdra
wn
(%)
Exem
pt(%
)
Num
ber
Part
icip
ated
Part
icip
atio
n ra
te (%
)
Abs
ent
(%)
Wit
hdra
wn
(%)
Exem
pt(%
)
ACT
2008 4341 96.4 4 1.4 4313 95.8 4 1.4
2009 4431 96.6 3.4 2.2 4403 96.0 4.0 2.1
2010 4269 95.4 2.2 2.4 2.5 4251 95.0 2.6 2.4 2.4
2011 4353 95.6 2.1 2.3 2.9 4324 95.0 2.7 2.2 2.9
2012 4177 95.5 2.3 2.2 1.9 4181 95.6 2.2 2.2 2.0
2013 4317 94.7 2.5 2.8 2.0 4313 94.6 2.7 2.7 2.0
2014 4504 93.7 2.5 3.8 1.7 4477 93.2 3.1 3.8 1.6
NT
2008 2891 84.9 15 1.4 2895 85.0 15 1.5
2009 2937 95.7 4.3 2.1 2900 94.5 5.5 2.0
2010 2924 89.7 9.4 0.9 2.0 2882 88.4 10.8 0.8 2.0
2011 2964 88.5 10.7 0.8 2.1 2933 87.6 11.6 0.8 2.0
2012 3027 88.7 10.5 0.8 2.1 2968 87.0 12.3 0.8 2.1
2013 3057 87.3 10.8 1.9 2.4 2993 85.5 12.6 1.9 2.4
2014 2910 89.6 8.7 1.6 2.7 2868 88.4 10.1 1.6 2.7
Aust
2008 262872 96.8 3 1.5 262268 96.6 3 1.5
2009 264889 96.8 3.2 1.7 263744 96.4 3.6 1.7
2010 266050 96.2 2.5 1.2 1.8 265100 95.9 2.9 1.2 1.8
2011 264093 96.2 2.6 1.2 1.8 263041 95.9 3.0 1.1 1.8
2012 245203 95.9 2.6 1.5 2.0 244364 95.5 3.0 1.4 2.0
2013 264204 95.8 2.4 1.8 1.9 263006 95.4 2.9 1.7 1.9
2014 270124 95.6 2.3 2.1 2.0 269099 95.2 2.8 2.0 2.0
Note: Exempt students are deemed not to have met the NMS and are included in the calculation of participation rates.
Refer to page 303 for notes on the Participation tables. Refer to the introduction for explanatory notes.
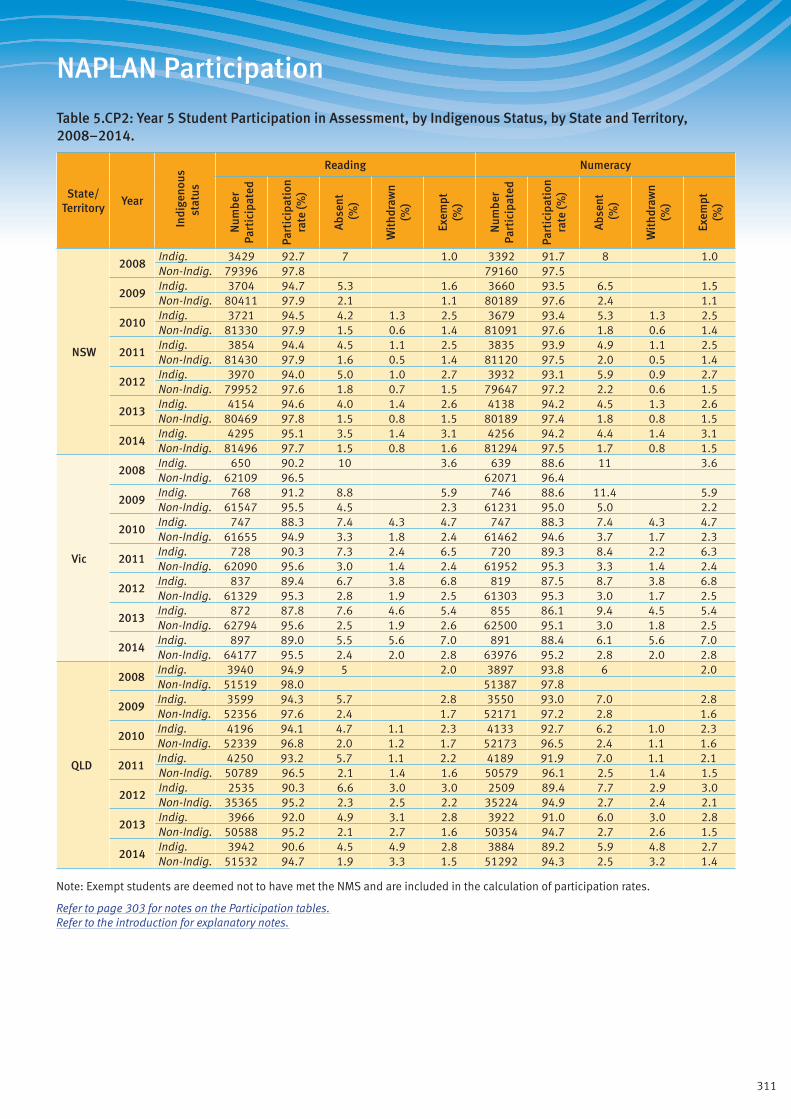
311
NAPLAN Participation
Table 5.CP2: Year 5 Student Participation in Assessment, by Indigenous Status, by State and Territory, 2008–2014.
State/ Territory
Year
Indi
geno
us
stat
us
Reading Numeracy
Num
ber
Part
icip
ated
Part
icip
atio
n ra
te (%
)
Abs
ent
(%)
Wit
hdra
wn
(%)
Exem
pt(%
)
Num
ber
Part
icip
ated
Part
icip
atio
n ra
te (%
)
Abs
ent
(%)
Wit
hdra
wn
(%)
Exem
pt(%
)
NSW
2008Indig. 3429 92.7 7 1.0 3392 91.7 8 1.0Non-Indig. 79396 97.8 79160 97.5
2009Indig. 3704 94.7 5.3 1.6 3660 93.5 6.5 1.5Non-Indig. 80411 97.9 2.1 1.1 80189 97.6 2.4 1.1
2010Indig. 3721 94.5 4.2 1.3 2.5 3679 93.4 5.3 1.3 2.5Non-Indig. 81330 97.9 1.5 0.6 1.4 81091 97.6 1.8 0.6 1.4
2011Indig. 3854 94.4 4.5 1.1 2.5 3835 93.9 4.9 1.1 2.5Non-Indig. 81430 97.9 1.6 0.5 1.4 81120 97.5 2.0 0.5 1.4
2012Indig. 3970 94.0 5.0 1.0 2.7 3932 93.1 5.9 0.9 2.7Non-Indig. 79952 97.6 1.8 0.7 1.5 79647 97.2 2.2 0.6 1.5
2013Indig. 4154 94.6 4.0 1.4 2.6 4138 94.2 4.5 1.3 2.6Non-Indig. 80469 97.8 1.5 0.8 1.5 80189 97.4 1.8 0.8 1.5
2014Indig. 4295 95.1 3.5 1.4 3.1 4256 94.2 4.4 1.4 3.1Non-Indig. 81496 97.7 1.5 0.8 1.6 81294 97.5 1.7 0.8 1.5
Vic
2008Indig. 650 90.2 10 3.6 639 88.6 11 3.6Non-Indig. 62109 96.5 62071 96.4
2009Indig. 768 91.2 8.8 5.9 746 88.6 11.4 5.9Non-Indig. 61547 95.5 4.5 2.3 61231 95.0 5.0 2.2
2010Indig. 747 88.3 7.4 4.3 4.7 747 88.3 7.4 4.3 4.7Non-Indig. 61655 94.9 3.3 1.8 2.4 61462 94.6 3.7 1.7 2.3
2011Indig. 728 90.3 7.3 2.4 6.5 720 89.3 8.4 2.2 6.3Non-Indig. 62090 95.6 3.0 1.4 2.4 61952 95.3 3.3 1.4 2.4
2012Indig. 837 89.4 6.7 3.8 6.8 819 87.5 8.7 3.8 6.8Non-Indig. 61329 95.3 2.8 1.9 2.5 61303 95.3 3.0 1.7 2.5
2013Indig. 872 87.8 7.6 4.6 5.4 855 86.1 9.4 4.5 5.4Non-Indig. 62794 95.6 2.5 1.9 2.6 62500 95.1 3.0 1.8 2.5
2014Indig. 897 89.0 5.5 5.6 7.0 891 88.4 6.1 5.6 7.0Non-Indig. 64177 95.5 2.4 2.0 2.8 63976 95.2 2.8 2.0 2.8
QLD
2008Indig. 3940 94.9 5 2.0 3897 93.8 6 2.0Non-Indig. 51519 98.0 51387 97.8
2009Indig. 3599 94.3 5.7 2.8 3550 93.0 7.0 2.8Non-Indig. 52356 97.6 2.4 1.7 52171 97.2 2.8 1.6
2010Indig. 4196 94.1 4.7 1.1 2.3 4133 92.7 6.2 1.0 2.3Non-Indig. 52339 96.8 2.0 1.2 1.7 52173 96.5 2.4 1.1 1.6
2011Indig. 4250 93.2 5.7 1.1 2.2 4189 91.9 7.0 1.1 2.1Non-Indig. 50789 96.5 2.1 1.4 1.6 50579 96.1 2.5 1.4 1.5
2012Indig. 2535 90.3 6.6 3.0 3.0 2509 89.4 7.7 2.9 3.0Non-Indig. 35365 95.2 2.3 2.5 2.2 35224 94.9 2.7 2.4 2.1
2013Indig. 3966 92.0 4.9 3.1 2.8 3922 91.0 6.0 3.0 2.8Non-Indig. 50588 95.2 2.1 2.7 1.6 50354 94.7 2.7 2.6 1.5
2014Indig. 3942 90.6 4.5 4.9 2.8 3884 89.2 5.9 4.8 2.7Non-Indig. 51532 94.7 1.9 3.3 1.5 51292 94.3 2.5 3.2 1.4
Note: Exempt students are deemed not to have met the NMS and are included in the calculation of participation rates.
Refer to page 303 for notes on the Participation tables. Refer to the introduction for explanatory notes.
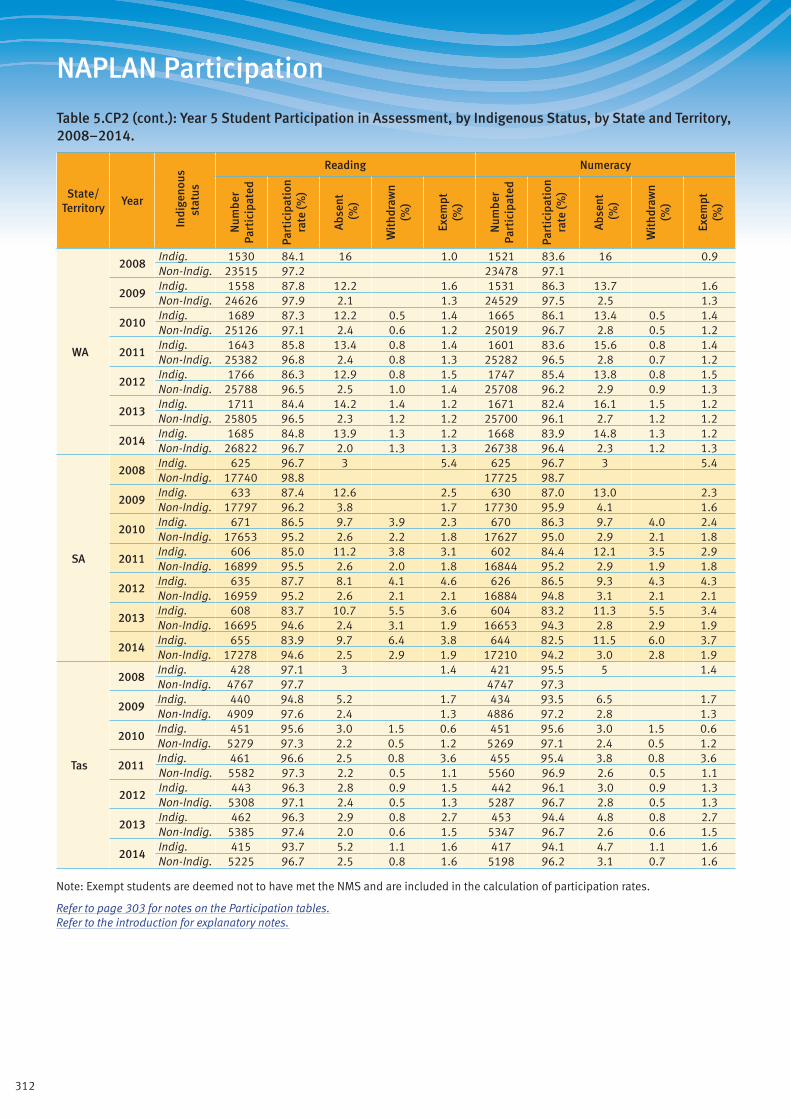
312
NAPLAN Participation
Table 5.CP2 (cont.): Year 5 Student Participation in Assessment, by Indigenous Status, by State and Territory, 2008–2014.
State/ Territory
Year
Indi
geno
us
stat
us
Reading Numeracy
Num
ber
Part
icip
ated
Part
icip
atio
n ra
te (%
)
Abs
ent
(%)
Wit
hdra
wn
(%)
Exem
pt(%
)
Num
ber
Part
icip
ated
Part
icip
atio
n ra
te (%
)
Abs
ent
(%)
Wit
hdra
wn
(%)
Exem
pt(%
)
WA
2008Indig. 1530 84.1 16 1.0 1521 83.6 16 0.9Non-Indig. 23515 97.2 23478 97.1
2009Indig. 1558 87.8 12.2 1.6 1531 86.3 13.7 1.6Non-Indig. 24626 97.9 2.1 1.3 24529 97.5 2.5 1.3
2010Indig. 1689 87.3 12.2 0.5 1.4 1665 86.1 13.4 0.5 1.4Non-Indig. 25126 97.1 2.4 0.6 1.2 25019 96.7 2.8 0.5 1.2
2011Indig. 1643 85.8 13.4 0.8 1.4 1601 83.6 15.6 0.8 1.4Non-Indig. 25382 96.8 2.4 0.8 1.3 25282 96.5 2.8 0.7 1.2
2012Indig. 1766 86.3 12.9 0.8 1.5 1747 85.4 13.8 0.8 1.5Non-Indig. 25788 96.5 2.5 1.0 1.4 25708 96.2 2.9 0.9 1.3
2013Indig. 1711 84.4 14.2 1.4 1.2 1671 82.4 16.1 1.5 1.2Non-Indig. 25805 96.5 2.3 1.2 1.2 25700 96.1 2.7 1.2 1.2
2014Indig. 1685 84.8 13.9 1.3 1.2 1668 83.9 14.8 1.3 1.2Non-Indig. 26822 96.7 2.0 1.3 1.3 26738 96.4 2.3 1.2 1.3
SA
2008Indig. 625 96.7 3 5.4 625 96.7 3 5.4Non-Indig. 17740 98.8 17725 98.7
2009Indig. 633 87.4 12.6 2.5 630 87.0 13.0 2.3Non-Indig. 17797 96.2 3.8 1.7 17730 95.9 4.1 1.6
2010Indig. 671 86.5 9.7 3.9 2.3 670 86.3 9.7 4.0 2.4Non-Indig. 17653 95.2 2.6 2.2 1.8 17627 95.0 2.9 2.1 1.8
2011Indig. 606 85.0 11.2 3.8 3.1 602 84.4 12.1 3.5 2.9Non-Indig. 16899 95.5 2.6 2.0 1.8 16844 95.2 2.9 1.9 1.8
2012Indig. 635 87.7 8.1 4.1 4.6 626 86.5 9.3 4.3 4.3Non-Indig. 16959 95.2 2.6 2.1 2.1 16884 94.8 3.1 2.1 2.1
2013Indig. 608 83.7 10.7 5.5 3.6 604 83.2 11.3 5.5 3.4Non-Indig. 16695 94.6 2.4 3.1 1.9 16653 94.3 2.8 2.9 1.9
2014Indig. 655 83.9 9.7 6.4 3.8 644 82.5 11.5 6.0 3.7Non-Indig. 17278 94.6 2.5 2.9 1.9 17210 94.2 3.0 2.8 1.9
Tas
2008Indig. 428 97.1 3 1.4 421 95.5 5 1.4Non-Indig. 4767 97.7 4747 97.3
2009Indig. 440 94.8 5.2 1.7 434 93.5 6.5 1.7Non-Indig. 4909 97.6 2.4 1.3 4886 97.2 2.8 1.3
2010Indig. 451 95.6 3.0 1.5 0.6 451 95.6 3.0 1.5 0.6Non-Indig. 5279 97.3 2.2 0.5 1.2 5269 97.1 2.4 0.5 1.2
2011Indig. 461 96.6 2.5 0.8 3.6 455 95.4 3.8 0.8 3.6Non-Indig. 5582 97.3 2.2 0.5 1.1 5560 96.9 2.6 0.5 1.1
2012Indig. 443 96.3 2.8 0.9 1.5 442 96.1 3.0 0.9 1.3Non-Indig. 5308 97.1 2.4 0.5 1.3 5287 96.7 2.8 0.5 1.3
2013Indig. 462 96.3 2.9 0.8 2.7 453 94.4 4.8 0.8 2.7Non-Indig. 5385 97.4 2.0 0.6 1.5 5347 96.7 2.6 0.6 1.5
2014Indig. 415 93.7 5.2 1.1 1.6 417 94.1 4.7 1.1 1.6Non-Indig. 5225 96.7 2.5 0.8 1.6 5198 96.2 3.1 0.7 1.6
Note: Exempt students are deemed not to have met the NMS and are included in the calculation of participation rates.
Refer to page 303 for notes on the Participation tables. Refer to the introduction for explanatory notes.
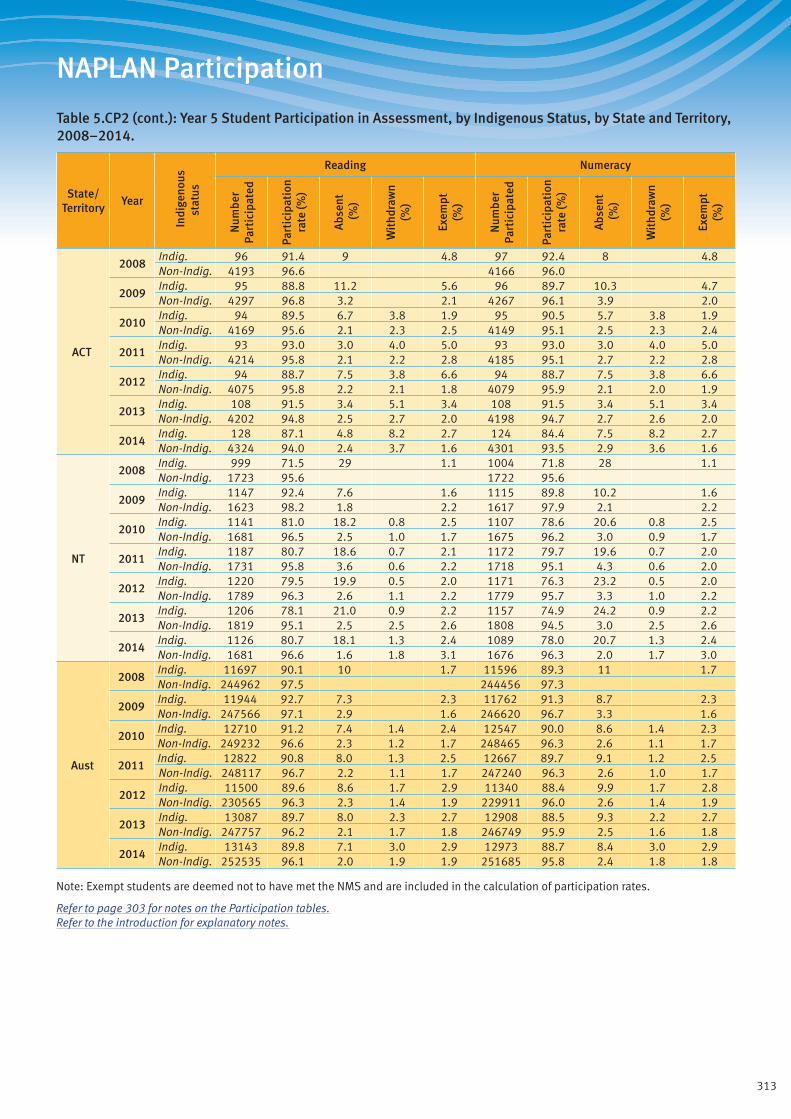
313
NAPLAN Participation
Table 5.CP2 (cont.): Year 5 Student Participation in Assessment, by Indigenous Status, by State and Territory, 2008–2014.
State/ Territory
Year
Indi
geno
us
stat
us
Reading Numeracy
Num
ber
Part
icip
ated
Part
icip
atio
n ra
te (%
)
Abs
ent
(%)
Wit
hdra
wn
(%)
Exem
pt(%
)
Num
ber
Part
icip
ated
Part
icip
atio
n ra
te (%
)
Abs
ent
(%)
Wit
hdra
wn
(%)
Exem
pt(%
)
ACT
2008Indig. 96 91.4 9 4.8 97 92.4 8 4.8Non-Indig. 4193 96.6 4166 96.0
2009Indig. 95 88.8 11.2 5.6 96 89.7 10.3 4.7Non-Indig. 4297 96.8 3.2 2.1 4267 96.1 3.9 2.0
2010Indig. 94 89.5 6.7 3.8 1.9 95 90.5 5.7 3.8 1.9Non-Indig. 4169 95.6 2.1 2.3 2.5 4149 95.1 2.5 2.3 2.4
2011Indig. 93 93.0 3.0 4.0 5.0 93 93.0 3.0 4.0 5.0Non-Indig. 4214 95.8 2.1 2.2 2.8 4185 95.1 2.7 2.2 2.8
2012Indig. 94 88.7 7.5 3.8 6.6 94 88.7 7.5 3.8 6.6Non-Indig. 4075 95.8 2.2 2.1 1.8 4079 95.9 2.1 2.0 1.9
2013Indig. 108 91.5 3.4 5.1 3.4 108 91.5 3.4 5.1 3.4Non-Indig. 4202 94.8 2.5 2.7 2.0 4198 94.7 2.7 2.6 2.0
2014Indig. 128 87.1 4.8 8.2 2.7 124 84.4 7.5 8.2 2.7Non-Indig. 4324 94.0 2.4 3.7 1.6 4301 93.5 2.9 3.6 1.6
NT
2008Indig. 999 71.5 29 1.1 1004 71.8 28 1.1Non-Indig. 1723 95.6 1722 95.6
2009Indig. 1147 92.4 7.6 1.6 1115 89.8 10.2 1.6Non-Indig. 1623 98.2 1.8 2.2 1617 97.9 2.1 2.2
2010Indig. 1141 81.0 18.2 0.8 2.5 1107 78.6 20.6 0.8 2.5Non-Indig. 1681 96.5 2.5 1.0 1.7 1675 96.2 3.0 0.9 1.7
2011Indig. 1187 80.7 18.6 0.7 2.1 1172 79.7 19.6 0.7 2.0Non-Indig. 1731 95.8 3.6 0.6 2.2 1718 95.1 4.3 0.6 2.0
2012Indig. 1220 79.5 19.9 0.5 2.0 1171 76.3 23.2 0.5 2.0Non-Indig. 1789 96.3 2.6 1.1 2.2 1779 95.7 3.3 1.0 2.2
2013Indig. 1206 78.1 21.0 0.9 2.2 1157 74.9 24.2 0.9 2.2Non-Indig. 1819 95.1 2.5 2.5 2.6 1808 94.5 3.0 2.5 2.6
2014Indig. 1126 80.7 18.1 1.3 2.4 1089 78.0 20.7 1.3 2.4Non-Indig. 1681 96.6 1.6 1.8 3.1 1676 96.3 2.0 1.7 3.0
Aust
2008Indig. 11697 90.1 10 1.7 11596 89.3 11 1.7Non-Indig. 244962 97.5 244456 97.3
2009Indig. 11944 92.7 7.3 2.3 11762 91.3 8.7 2.3Non-Indig. 247566 97.1 2.9 1.6 246620 96.7 3.3 1.6
2010Indig. 12710 91.2 7.4 1.4 2.4 12547 90.0 8.6 1.4 2.3Non-Indig. 249232 96.6 2.3 1.2 1.7 248465 96.3 2.6 1.1 1.7
2011Indig. 12822 90.8 8.0 1.3 2.5 12667 89.7 9.1 1.2 2.5Non-Indig. 248117 96.7 2.2 1.1 1.7 247240 96.3 2.6 1.0 1.7
2012Indig. 11500 89.6 8.6 1.7 2.9 11340 88.4 9.9 1.7 2.8Non-Indig. 230565 96.3 2.3 1.4 1.9 229911 96.0 2.6 1.4 1.9
2013Indig. 13087 89.7 8.0 2.3 2.7 12908 88.5 9.3 2.2 2.7Non-Indig. 247757 96.2 2.1 1.7 1.8 246749 95.9 2.5 1.6 1.8
2014Indig. 13143 89.8 7.1 3.0 2.9 12973 88.7 8.4 3.0 2.9Non-Indig. 252535 96.1 2.0 1.9 1.9 251685 95.8 2.4 1.8 1.8
Note: Exempt students are deemed not to have met the NMS and are included in the calculation of participation rates.
Refer to page 303 for notes on the Participation tables. Refer to the introduction for explanatory notes.
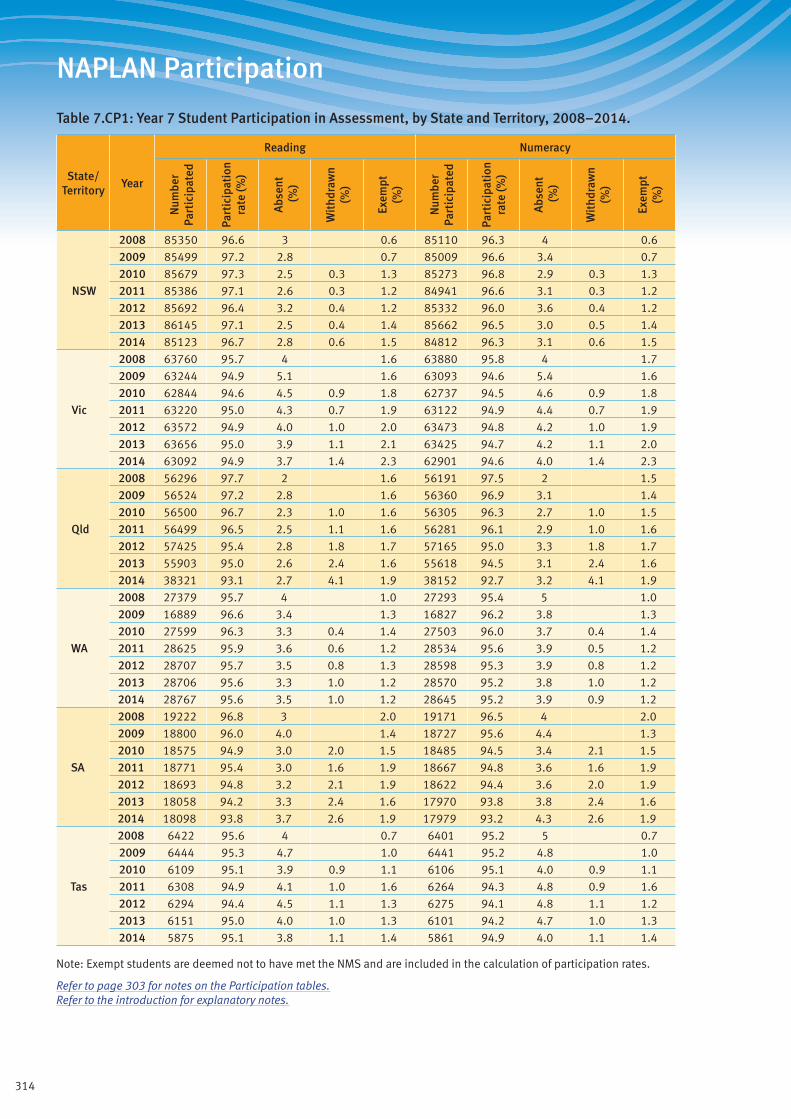
314
NAPLAN Participation
Table 7.CP1: Year 7 Student Participation in Assessment, by State and Territory, 2008–2014.
State/ Territory
Year
Reading Numeracy
Num
ber
Part
icip
ated
Part
icip
atio
n ra
te (%
)
Abs
ent
(%)
Wit
hdra
wn
(%)
Exem
pt(%
)
Num
ber
Part
icip
ated
Part
icip
atio
n ra
te (%
)
Abs
ent
(%)
Wit
hdra
wn
(%)
Exem
pt(%
)
NSW
2008 85350 96.6 3 0.6 85110 96.3 4 0.6
2009 85499 97.2 2.8 0.7 85009 96.6 3.4 0.7
2010 85679 97.3 2.5 0.3 1.3 85273 96.8 2.9 0.3 1.3
2011 85386 97.1 2.6 0.3 1.2 84941 96.6 3.1 0.3 1.2
2012 85692 96.4 3.2 0.4 1.2 85332 96.0 3.6 0.4 1.2
2013 86145 97.1 2.5 0.4 1.4 85662 96.5 3.0 0.5 1.4
2014 85123 96.7 2.8 0.6 1.5 84812 96.3 3.1 0.6 1.5
Vic
2008 63760 95.7 4 1.6 63880 95.8 4 1.7
2009 63244 94.9 5.1 1.6 63093 94.6 5.4 1.6
2010 62844 94.6 4.5 0.9 1.8 62737 94.5 4.6 0.9 1.8
2011 63220 95.0 4.3 0.7 1.9 63122 94.9 4.4 0.7 1.9
2012 63572 94.9 4.0 1.0 2.0 63473 94.8 4.2 1.0 1.9
2013 63656 95.0 3.9 1.1 2.1 63425 94.7 4.2 1.1 2.0
2014 63092 94.9 3.7 1.4 2.3 62901 94.6 4.0 1.4 2.3
Qld
2008 56296 97.7 2 1.6 56191 97.5 2 1.5
2009 56524 97.2 2.8 1.6 56360 96.9 3.1 1.4
2010 56500 96.7 2.3 1.0 1.6 56305 96.3 2.7 1.0 1.5
2011 56499 96.5 2.5 1.1 1.6 56281 96.1 2.9 1.0 1.6
2012 57425 95.4 2.8 1.8 1.7 57165 95.0 3.3 1.8 1.7
2013 55903 95.0 2.6 2.4 1.6 55618 94.5 3.1 2.4 1.6
2014 38321 93.1 2.7 4.1 1.9 38152 92.7 3.2 4.1 1.9
WA
2008 27379 95.7 4 1.0 27293 95.4 5 1.0
2009 16889 96.6 3.4 1.3 16827 96.2 3.8 1.3
2010 27599 96.3 3.3 0.4 1.4 27503 96.0 3.7 0.4 1.4
2011 28625 95.9 3.6 0.6 1.2 28534 95.6 3.9 0.5 1.2
2012 28707 95.7 3.5 0.8 1.3 28598 95.3 3.9 0.8 1.2
2013 28706 95.6 3.3 1.0 1.2 28570 95.2 3.8 1.0 1.2
2014 28767 95.6 3.5 1.0 1.2 28645 95.2 3.9 0.9 1.2
SA
2008 19222 96.8 3 2.0 19171 96.5 4 2.0
2009 18800 96.0 4.0 1.4 18727 95.6 4.4 1.3
2010 18575 94.9 3.0 2.0 1.5 18485 94.5 3.4 2.1 1.5
2011 18771 95.4 3.0 1.6 1.9 18667 94.8 3.6 1.6 1.9
2012 18693 94.8 3.2 2.1 1.9 18622 94.4 3.6 2.0 1.9
2013 18058 94.2 3.3 2.4 1.6 17970 93.8 3.8 2.4 1.6
2014 18098 93.8 3.7 2.6 1.9 17979 93.2 4.3 2.6 1.9
Tas
2008 6422 95.6 4 0.7 6401 95.2 5 0.7
2009 6444 95.3 4.7 1.0 6441 95.2 4.8 1.0
2010 6109 95.1 3.9 0.9 1.1 6106 95.1 4.0 0.9 1.1
2011 6308 94.9 4.1 1.0 1.6 6264 94.3 4.8 0.9 1.6
2012 6294 94.4 4.5 1.1 1.3 6275 94.1 4.8 1.1 1.2
2013 6151 95.0 4.0 1.0 1.3 6101 94.2 4.7 1.0 1.3
2014 5875 95.1 3.8 1.1 1.4 5861 94.9 4.0 1.1 1.4
Note: Exempt students are deemed not to have met the NMS and are included in the calculation of participation rates.
Refer to page 303 for notes on the Participation tables. Refer to the introduction for explanatory notes.
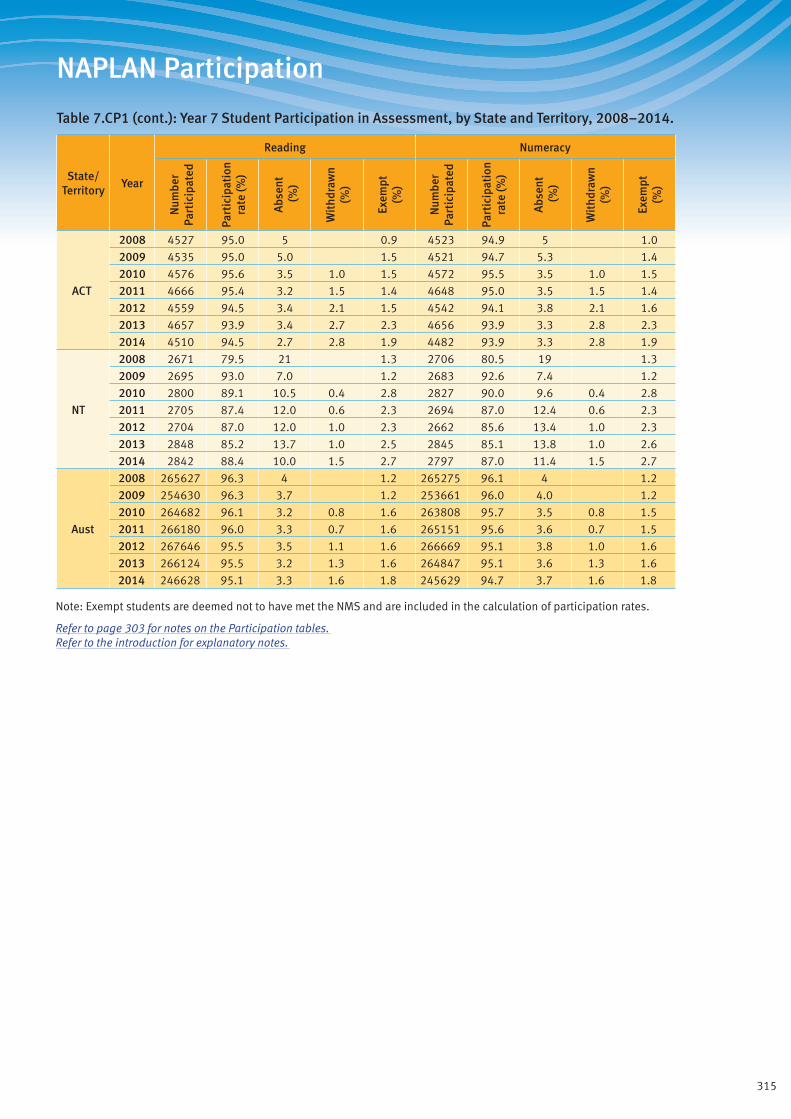
315
NAPLAN Participation
Table 7.CP1 (cont.): Year 7 Student Participation in Assessment, by State and Territory, 2008–2014.
State/ Territory
Year
Reading Numeracy
Num
ber
Part
icip
ated
Part
icip
atio
n ra
te (%
)
Abs
ent
(%)
Wit
hdra
wn
(%)
Exem
pt(%
)
Num
ber
Part
icip
ated
Part
icip
atio
n ra
te (%
)
Abs
ent
(%)
Wit
hdra
wn
(%)
Exem
pt(%
)
ACT
2008 4527 95.0 5 0.9 4523 94.9 5 1.0
2009 4535 95.0 5.0 1.5 4521 94.7 5.3 1.4
2010 4576 95.6 3.5 1.0 1.5 4572 95.5 3.5 1.0 1.5
2011 4666 95.4 3.2 1.5 1.4 4648 95.0 3.5 1.5 1.4
2012 4559 94.5 3.4 2.1 1.5 4542 94.1 3.8 2.1 1.6
2013 4657 93.9 3.4 2.7 2.3 4656 93.9 3.3 2.8 2.3
2014 4510 94.5 2.7 2.8 1.9 4482 93.9 3.3 2.8 1.9
NT
2008 2671 79.5 21 1.3 2706 80.5 19 1.3
2009 2695 93.0 7.0 1.2 2683 92.6 7.4 1.2
2010 2800 89.1 10.5 0.4 2.8 2827 90.0 9.6 0.4 2.8
2011 2705 87.4 12.0 0.6 2.3 2694 87.0 12.4 0.6 2.3
2012 2704 87.0 12.0 1.0 2.3 2662 85.6 13.4 1.0 2.3
2013 2848 85.2 13.7 1.0 2.5 2845 85.1 13.8 1.0 2.6
2014 2842 88.4 10.0 1.5 2.7 2797 87.0 11.4 1.5 2.7
Aust
2008 265627 96.3 4 1.2 265275 96.1 4 1.2
2009 254630 96.3 3.7 1.2 253661 96.0 4.0 1.2
2010 264682 96.1 3.2 0.8 1.6 263808 95.7 3.5 0.8 1.5
2011 266180 96.0 3.3 0.7 1.6 265151 95.6 3.6 0.7 1.5
2012 267646 95.5 3.5 1.1 1.6 266669 95.1 3.8 1.0 1.6
2013 266124 95.5 3.2 1.3 1.6 264847 95.1 3.6 1.3 1.6
2014 246628 95.1 3.3 1.6 1.8 245629 94.7 3.7 1.6 1.8
Note: Exempt students are deemed not to have met the NMS and are included in the calculation of participation rates.
Refer to page 303 for notes on the Participation tables. Refer to the introduction for explanatory notes.
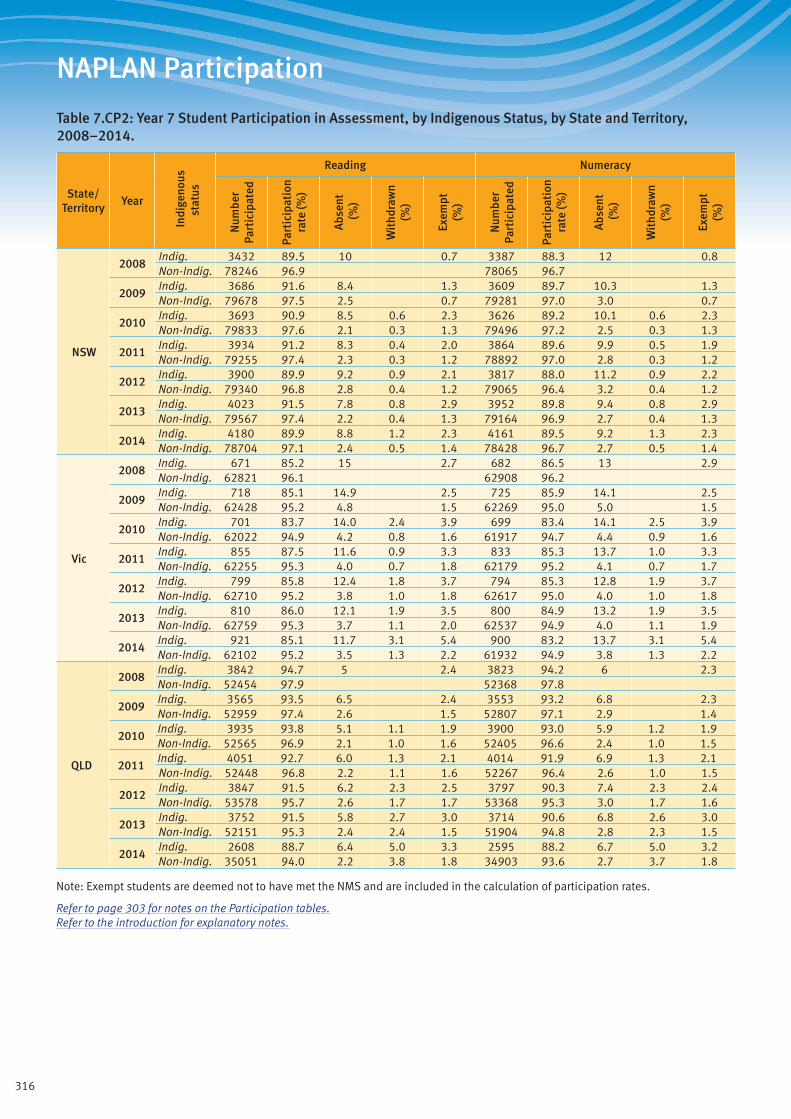
316
NAPLAN Participation
Table 7.CP2: Year 7 Student Participation in Assessment, by Indigenous Status, by State and Territory, 2008–2014.
State/ Territory
Year
Indi
geno
us
stat
us
Reading Numeracy
Num
ber
Part
icip
ated
Part
icip
atio
n ra
te (%
)
Abs
ent
(%)
Wit
hdra
wn
(%)
Exem
pt(%
)
Num
ber
Part
icip
ated
Part
icip
atio
n ra
te (%
)
Abs
ent
(%)
Wit
hdra
wn
(%)
Exem
pt(%
)
NSW
2008Indig. 3432 89.5 10 0.7 3387 88.3 12 0.8Non-Indig. 78246 96.9 78065 96.7
2009Indig. 3686 91.6 8.4 1.3 3609 89.7 10.3 1.3Non-Indig. 79678 97.5 2.5 0.7 79281 97.0 3.0 0.7
2010Indig. 3693 90.9 8.5 0.6 2.3 3626 89.2 10.1 0.6 2.3Non-Indig. 79833 97.6 2.1 0.3 1.3 79496 97.2 2.5 0.3 1.3
2011Indig. 3934 91.2 8.3 0.4 2.0 3864 89.6 9.9 0.5 1.9Non-Indig. 79255 97.4 2.3 0.3 1.2 78892 97.0 2.8 0.3 1.2
2012Indig. 3900 89.9 9.2 0.9 2.1 3817 88.0 11.2 0.9 2.2Non-Indig. 79340 96.8 2.8 0.4 1.2 79065 96.4 3.2 0.4 1.2
2013Indig. 4023 91.5 7.8 0.8 2.9 3952 89.8 9.4 0.8 2.9Non-Indig. 79567 97.4 2.2 0.4 1.3 79164 96.9 2.7 0.4 1.3
2014Indig. 4180 89.9 8.8 1.2 2.3 4161 89.5 9.2 1.3 2.3Non-Indig. 78704 97.1 2.4 0.5 1.4 78428 96.7 2.7 0.5 1.4
Vic
2008Indig. 671 85.2 15 2.7 682 86.5 13 2.9Non-Indig. 62821 96.1 62908 96.2
2009Indig. 718 85.1 14.9 2.5 725 85.9 14.1 2.5Non-Indig. 62428 95.2 4.8 1.5 62269 95.0 5.0 1.5
2010Indig. 701 83.7 14.0 2.4 3.9 699 83.4 14.1 2.5 3.9Non-Indig. 62022 94.9 4.2 0.8 1.6 61917 94.7 4.4 0.9 1.6
2011Indig. 855 87.5 11.6 0.9 3.3 833 85.3 13.7 1.0 3.3Non-Indig. 62255 95.3 4.0 0.7 1.8 62179 95.2 4.1 0.7 1.7
2012Indig. 799 85.8 12.4 1.8 3.7 794 85.3 12.8 1.9 3.7Non-Indig. 62710 95.2 3.8 1.0 1.8 62617 95.0 4.0 1.0 1.8
2013Indig. 810 86.0 12.1 1.9 3.5 800 84.9 13.2 1.9 3.5Non-Indig. 62759 95.3 3.7 1.1 2.0 62537 94.9 4.0 1.1 1.9
2014Indig. 921 85.1 11.7 3.1 5.4 900 83.2 13.7 3.1 5.4Non-Indig. 62102 95.2 3.5 1.3 2.2 61932 94.9 3.8 1.3 2.2
QLD
2008Indig. 3842 94.7 5 2.4 3823 94.2 6 2.3Non-Indig. 52454 97.9 52368 97.8
2009Indig. 3565 93.5 6.5 2.4 3553 93.2 6.8 2.3Non-Indig. 52959 97.4 2.6 1.5 52807 97.1 2.9 1.4
2010Indig. 3935 93.8 5.1 1.1 1.9 3900 93.0 5.9 1.2 1.9Non-Indig. 52565 96.9 2.1 1.0 1.6 52405 96.6 2.4 1.0 1.5
2011Indig. 4051 92.7 6.0 1.3 2.1 4014 91.9 6.9 1.3 2.1Non-Indig. 52448 96.8 2.2 1.1 1.6 52267 96.4 2.6 1.0 1.5
2012Indig. 3847 91.5 6.2 2.3 2.5 3797 90.3 7.4 2.3 2.4Non-Indig. 53578 95.7 2.6 1.7 1.7 53368 95.3 3.0 1.7 1.6
2013Indig. 3752 91.5 5.8 2.7 3.0 3714 90.6 6.8 2.6 3.0Non-Indig. 52151 95.3 2.4 2.4 1.5 51904 94.8 2.8 2.3 1.5
2014Indig. 2608 88.7 6.4 5.0 3.3 2595 88.2 6.7 5.0 3.2Non-Indig. 35051 94.0 2.2 3.8 1.8 34903 93.6 2.7 3.7 1.8
Note: Exempt students are deemed not to have met the NMS and are included in the calculation of participation rates.
Refer to page 303 for notes on the Participation tables. Refer to the introduction for explanatory notes.

317
NAPLAN Participation
Table 7.CP2 (cont.): Year 7 Student Participation in Assessment, by Indigenous Status, by State and Territory, 2008–2014.
State/ Territory
Year
Indi
geno
us
stat
us
Reading Numeracy
Num
ber
Part
icip
ated
Part
icip
atio
n ra
te (%
)
Abs
ent
(%)
Wit
hdra
wn
(%)
Exem
pt(%
)
Num
ber
Part
icip
ated
Part
icip
atio
n ra
te (%
)
Abs
ent
(%)
Wit
hdra
wn
(%)
Exem
pt(%
)
WA
2008Indig. 1559 86.3 14 1.1 1515 83.8 16 1.1Non-Indig. 24166 97.2 24119 97.0
2009Indig. 819 85.4 14.6 1.5 809 84.4 15.6 1.5Non-Indig. 14822 97.5 2.5 1.3 14781 97.2 2.8 1.3
2010Indig. 1530 85.3 14.4 0.2 1.7 1524 85.0 14.8 0.2 1.6Non-Indig. 25093 97.0 2.6 0.4 1.4 25003 96.7 3.0 0.4 1.3
2011Indig. 1621 83.5 15.9 0.6 1.9 1601 82.5 17.0 0.5 1.8Non-Indig. 26185 96.7 2.7 0.6 1.1 26120 96.5 2.9 0.5 1.1
2012Indig. 1616 84.8 14.1 1.1 1.4 1595 83.7 15.2 1.1 1.4Non-Indig. 26440 96.5 2.7 0.7 1.3 26355 96.2 3.1 0.7 1.3
2013Indig. 1610 82.9 15.7 1.4 1.7 1589 81.8 16.8 1.4 1.7Non-Indig. 26077 96.7 2.3 1.0 1.2 25964 96.3 2.7 0.9 1.2
2014Indig. 1726 82.3 16.6 1.0 1.6 1716 81.8 17.1 1.0 1.6Non-Indig. 26333 96.8 2.3 0.9 1.2 26229 96.4 2.7 0.9 1.2
SA
2008Indig. 581 95.7 4 4.0 569 93.7 6 4.0Non-Indig. 18354 98.6 18318 98.4
2009Indig. 592 87.1 12.9 2.6 594 87.4 12.6 2.8Non-Indig. 18012 96.4 3.6 1.3 17937 96.0 4.0 1.3
2010Indig. 601 85.9 10.3 3.9 2.9 589 84.1 12.0 3.9 2.9Non-Indig. 17762 95.3 2.8 2.0 1.5 17685 94.9 3.1 2.0 1.5
2011Indig. 662 88.5 8.8 2.7 3.9 648 86.6 10.8 2.5 3.7Non-Indig. 17686 95.9 2.6 1.5 1.8 17601 95.4 3.1 1.5 1.8
2012Indig. 662 86.0 9.2 4.8 2.5 642 83.4 11.9 4.7 2.5Non-Indig. 17523 95.2 2.9 2.0 1.8 17469 94.9 3.2 1.9 1.8
2013Indig. 639 86.0 9.2 4.8 2.8 623 83.8 11.3 4.8 3.1Non-Indig. 17122 94.7 3.0 2.3 1.6 17054 94.3 3.4 2.3 1.6
2014Indig. 620 82.7 11.9 5.5 2.1 612 81.6 12.9 5.5 2.1Non-Indig. 17206 94.4 3.2 2.4 1.8 17098 93.8 3.8 2.4 1.8
Tas
2008Indig. 439 93.0 7 0.2 442 93.6 6 0.2Non-Indig. 4903 96.6 4880 96.1
2009Indig. 393 89.1 10.9 0.9 390 88.4 11.6 0.9Non-Indig. 4957 95.8 4.2 0.9 4962 95.9 4.1 0.9
2010Indig. 430 93.7 5.9 0.4 1.7 427 93.0 6.5 0.4 2.0Non-Indig. 5240 95.9 3.6 0.5 1.0 5235 95.8 3.7 0.5 0.9
2011Indig. 417 89.1 10.3 0.6 1.9 418 89.3 10.0 0.6 1.9Non-Indig. 5511 96.5 3.1 0.3 1.6 5472 95.8 3.9 0.3 1.5
2012Indig. 456 93.4 6.1 0.4 1.0 445 91.2 8.4 0.4 1.0Non-Indig. 5352 95.4 4.2 0.4 1.2 5352 95.4 4.2 0.4 1.2
2013Indig. 459 93.7 5.7 0.6 3.3 452 92.2 7.1 0.6 3.3Non-Indig. 5367 95.9 3.8 0.3 1.0 5322 95.1 4.6 0.4 1.1
2014Indig. 449 92.8 6.6 0.6 1.7 449 92.8 6.6 0.6 1.7Non-Indig. 5102 95.9 3.6 0.5 1.4 5088 95.6 3.8 0.6 1.4
Note: Exempt students are deemed not to have met the NMS and are included in the calculation of participation rates.
Refer to page 303 for notes on the Participation tables. Refer to the introduction for explanatory notes.
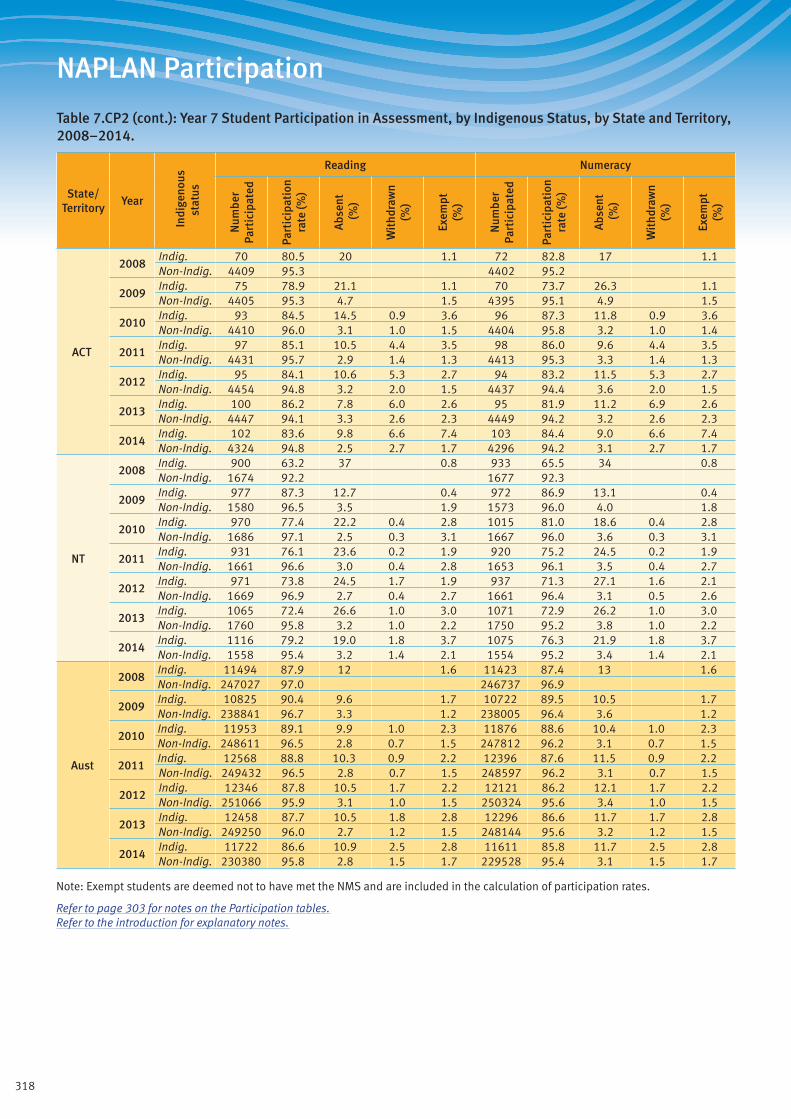
318
NAPLAN Participation
Table 7.CP2 (cont.): Year 7 Student Participation in Assessment, by Indigenous Status, by State and Territory, 2008–2014.
State/ Territory
Year
Indi
geno
us
stat
us
Reading Numeracy
Num
ber
Part
icip
ated
Part
icip
atio
n ra
te (%
)
Abs
ent
(%)
Wit
hdra
wn
(%)
Exem
pt(%
)
Num
ber
Part
icip
ated
Part
icip
atio
n ra
te (%
)
Abs
ent
(%)
Wit
hdra
wn
(%)
Exem
pt(%
)
ACT
2008Indig. 70 80.5 20 1.1 72 82.8 17 1.1Non-Indig. 4409 95.3 4402 95.2
2009Indig. 75 78.9 21.1 1.1 70 73.7 26.3 1.1Non-Indig. 4405 95.3 4.7 1.5 4395 95.1 4.9 1.5
2010Indig. 93 84.5 14.5 0.9 3.6 96 87.3 11.8 0.9 3.6Non-Indig. 4410 96.0 3.1 1.0 1.5 4404 95.8 3.2 1.0 1.4
2011Indig. 97 85.1 10.5 4.4 3.5 98 86.0 9.6 4.4 3.5Non-Indig. 4431 95.7 2.9 1.4 1.3 4413 95.3 3.3 1.4 1.3
2012Indig. 95 84.1 10.6 5.3 2.7 94 83.2 11.5 5.3 2.7Non-Indig. 4454 94.8 3.2 2.0 1.5 4437 94.4 3.6 2.0 1.5
2013Indig. 100 86.2 7.8 6.0 2.6 95 81.9 11.2 6.9 2.6Non-Indig. 4447 94.1 3.3 2.6 2.3 4449 94.2 3.2 2.6 2.3
2014Indig. 102 83.6 9.8 6.6 7.4 103 84.4 9.0 6.6 7.4Non-Indig. 4324 94.8 2.5 2.7 1.7 4296 94.2 3.1 2.7 1.7
NT
2008Indig. 900 63.2 37 0.8 933 65.5 34 0.8Non-Indig. 1674 92.2 1677 92.3
2009Indig. 977 87.3 12.7 0.4 972 86.9 13.1 0.4Non-Indig. 1580 96.5 3.5 1.9 1573 96.0 4.0 1.8
2010Indig. 970 77.4 22.2 0.4 2.8 1015 81.0 18.6 0.4 2.8Non-Indig. 1686 97.1 2.5 0.3 3.1 1667 96.0 3.6 0.3 3.1
2011Indig. 931 76.1 23.6 0.2 1.9 920 75.2 24.5 0.2 1.9Non-Indig. 1661 96.6 3.0 0.4 2.8 1653 96.1 3.5 0.4 2.7
2012Indig. 971 73.8 24.5 1.7 1.9 937 71.3 27.1 1.6 2.1Non-Indig. 1669 96.9 2.7 0.4 2.7 1661 96.4 3.1 0.5 2.6
2013Indig. 1065 72.4 26.6 1.0 3.0 1071 72.9 26.2 1.0 3.0Non-Indig. 1760 95.8 3.2 1.0 2.2 1750 95.2 3.8 1.0 2.2
2014Indig. 1116 79.2 19.0 1.8 3.7 1075 76.3 21.9 1.8 3.7Non-Indig. 1558 95.4 3.2 1.4 2.1 1554 95.2 3.4 1.4 2.1
Aust
2008Indig. 11494 87.9 12 1.6 11423 87.4 13 1.6Non-Indig. 247027 97.0 246737 96.9
2009Indig. 10825 90.4 9.6 1.7 10722 89.5 10.5 1.7Non-Indig. 238841 96.7 3.3 1.2 238005 96.4 3.6 1.2
2010Indig. 11953 89.1 9.9 1.0 2.3 11876 88.6 10.4 1.0 2.3Non-Indig. 248611 96.5 2.8 0.7 1.5 247812 96.2 3.1 0.7 1.5
2011Indig. 12568 88.8 10.3 0.9 2.2 12396 87.6 11.5 0.9 2.2Non-Indig. 249432 96.5 2.8 0.7 1.5 248597 96.2 3.1 0.7 1.5
2012Indig. 12346 87.8 10.5 1.7 2.2 12121 86.2 12.1 1.7 2.2Non-Indig. 251066 95.9 3.1 1.0 1.5 250324 95.6 3.4 1.0 1.5
2013Indig. 12458 87.7 10.5 1.8 2.8 12296 86.6 11.7 1.7 2.8Non-Indig. 249250 96.0 2.7 1.2 1.5 248144 95.6 3.2 1.2 1.5
2014Indig. 11722 86.6 10.9 2.5 2.8 11611 85.8 11.7 2.5 2.8Non-Indig. 230380 95.8 2.8 1.5 1.7 229528 95.4 3.1 1.5 1.7
Note: Exempt students are deemed not to have met the NMS and are included in the calculation of participation rates.
Refer to page 303 for notes on the Participation tables. Refer to the introduction for explanatory notes.
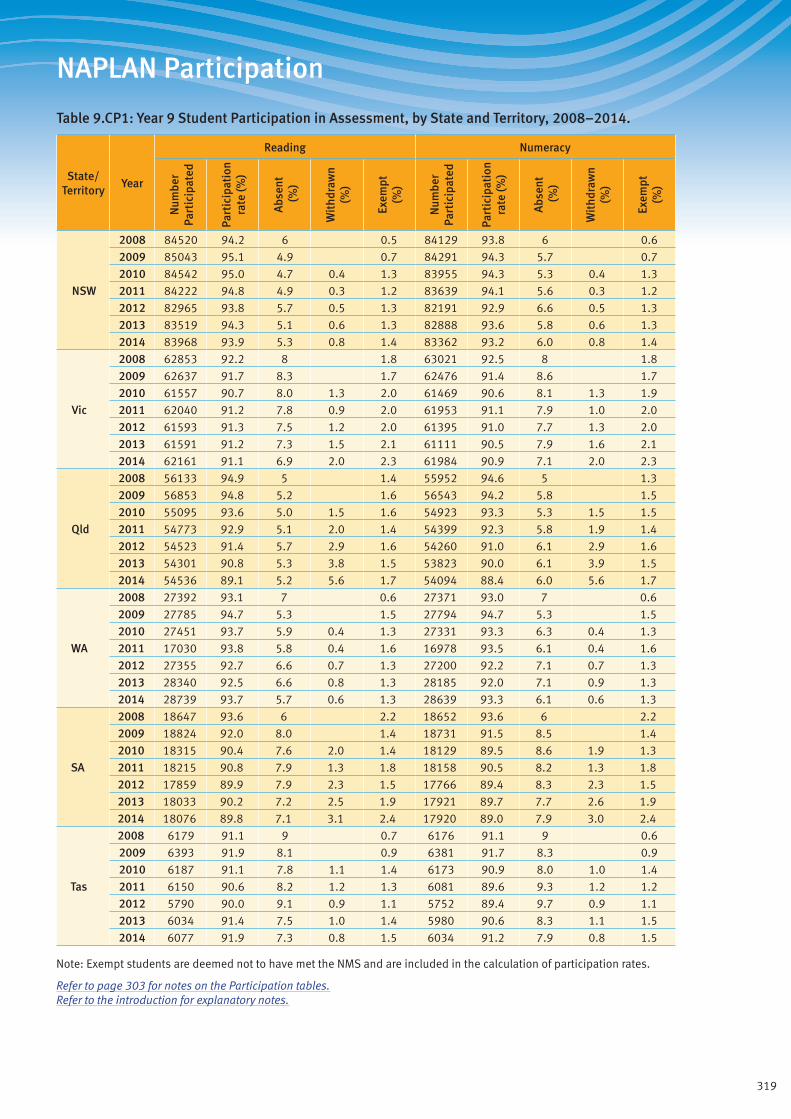
319
NAPLAN Participation
Table 9.CP1: Year 9 Student Participation in Assessment, by State and Territory, 2008–2014.
State/ Territory
Year
Reading Numeracy
Num
ber
Part
icip
ated
Part
icip
atio
n ra
te (%
)
Abs
ent
(%)
Wit
hdra
wn
(%)
Exem
pt(%
)
Num
ber
Part
icip
ated
Part
icip
atio
n ra
te (%
)
Abs
ent
(%)
Wit
hdra
wn
(%)
Exem
pt(%
)
NSW
2008 84520 94.2 6 0.5 84129 93.8 6 0.6
2009 85043 95.1 4.9 0.7 84291 94.3 5.7 0.7
2010 84542 95.0 4.7 0.4 1.3 83955 94.3 5.3 0.4 1.3
2011 84222 94.8 4.9 0.3 1.2 83639 94.1 5.6 0.3 1.2
2012 82965 93.8 5.7 0.5 1.3 82191 92.9 6.6 0.5 1.3
2013 83519 94.3 5.1 0.6 1.3 82888 93.6 5.8 0.6 1.3
2014 83968 93.9 5.3 0.8 1.4 83362 93.2 6.0 0.8 1.4
Vic
2008 62853 92.2 8 1.8 63021 92.5 8 1.8
2009 62637 91.7 8.3 1.7 62476 91.4 8.6 1.7
2010 61557 90.7 8.0 1.3 2.0 61469 90.6 8.1 1.3 1.9
2011 62040 91.2 7.8 0.9 2.0 61953 91.1 7.9 1.0 2.0
2012 61593 91.3 7.5 1.2 2.0 61395 91.0 7.7 1.3 2.0
2013 61591 91.2 7.3 1.5 2.1 61111 90.5 7.9 1.6 2.1
2014 62161 91.1 6.9 2.0 2.3 61984 90.9 7.1 2.0 2.3
Qld
2008 56133 94.9 5 1.4 55952 94.6 5 1.3
2009 56853 94.8 5.2 1.6 56543 94.2 5.8 1.5
2010 55095 93.6 5.0 1.5 1.6 54923 93.3 5.3 1.5 1.5
2011 54773 92.9 5.1 2.0 1.4 54399 92.3 5.8 1.9 1.4
2012 54523 91.4 5.7 2.9 1.6 54260 91.0 6.1 2.9 1.6
2013 54301 90.8 5.3 3.8 1.5 53823 90.0 6.1 3.9 1.5
2014 54536 89.1 5.2 5.6 1.7 54094 88.4 6.0 5.6 1.7
WA
2008 27392 93.1 7 0.6 27371 93.0 7 0.6
2009 27785 94.7 5.3 1.5 27794 94.7 5.3 1.5
2010 27451 93.7 5.9 0.4 1.3 27331 93.3 6.3 0.4 1.3
2011 17030 93.8 5.8 0.4 1.6 16978 93.5 6.1 0.4 1.6
2012 27355 92.7 6.6 0.7 1.3 27200 92.2 7.1 0.7 1.3
2013 28340 92.5 6.6 0.8 1.3 28185 92.0 7.1 0.9 1.3
2014 28739 93.7 5.7 0.6 1.3 28639 93.3 6.1 0.6 1.3
SA
2008 18647 93.6 6 2.2 18652 93.6 6 2.2
2009 18824 92.0 8.0 1.4 18731 91.5 8.5 1.4
2010 18315 90.4 7.6 2.0 1.4 18129 89.5 8.6 1.9 1.3
2011 18215 90.8 7.9 1.3 1.8 18158 90.5 8.2 1.3 1.8
2012 17859 89.9 7.9 2.3 1.5 17766 89.4 8.3 2.3 1.5
2013 18033 90.2 7.2 2.5 1.9 17921 89.7 7.7 2.6 1.9
2014 18076 89.8 7.1 3.1 2.4 17920 89.0 7.9 3.0 2.4
Tas
2008 6179 91.1 9 0.7 6176 91.1 9 0.6
2009 6393 91.9 8.1 0.9 6381 91.7 8.3 0.9
2010 6187 91.1 7.8 1.1 1.4 6173 90.9 8.0 1.0 1.4
2011 6150 90.6 8.2 1.2 1.3 6081 89.6 9.3 1.2 1.2
2012 5790 90.0 9.1 0.9 1.1 5752 89.4 9.7 0.9 1.1
2013 6034 91.4 7.5 1.0 1.4 5980 90.6 8.3 1.1 1.5
2014 6077 91.9 7.3 0.8 1.5 6034 91.2 7.9 0.8 1.5
Note: Exempt students are deemed not to have met the NMS and are included in the calculation of participation rates.
Refer to page 303 for notes on the Participation tables. Refer to the introduction for explanatory notes.

320
NAPLAN Participation
Table 9.CP1 (cont.): Year 9 Student Participation in Assessment, by State and Territory, 2008–2014.
State/ Territory
Year
Reading Numeracy
Num
ber
Part
icip
ated
Part
icip
atio
n ra
te (%
)
Abs
ent
(%)
Wit
hdra
wn
(%)
Exem
pt(%
)
Num
ber
Part
icip
ated
Part
icip
atio
n ra
te (%
)
Abs
ent
(%)
Wit
hdra
wn
(%)
Exem
pt(%
)
ACT
2008 4439 92.4 8 0.3 4452 92.7 7 0.3
2009 4599 91.6 8.4 1.9 4634 92.3 7.7 2.0
2010 4443 91.8 7.0 1.3 1.6 4438 91.7 7.1 1.3 1.6
2011 4460 91.9 6.5 1.6 1.4 4451 91.7 6.6 1.7 1.3
2012 4441 92.2 5.5 2.2 1.3 4396 91.3 6.5 2.2 1.3
2013 4463 90.5 6.0 3.6 1.5 4455 90.3 6.2 3.5 1.5
2014 4382 89.4 5.8 4.8 1.7 4353 88.8 6.4 4.8 1.7
NT
2008 2386 79.9 20 1.9 2369 79.3 21 1.9
2009 2455 87.6 12.4 2.0 2453 87.5 12.5 2.0
2010 2456 84.3 15.5 0.2 2.2 2409 82.7 17.1 0.2 2.2
2011 2354 85.5 13.9 0.6 2.2 2337 84.9 14.5 0.6 2.2
2012 2477 84.4 15.2 0.4 2.4 2443 83.2 16.3 0.5 2.0
2013 2377 80.5 18.3 1.2 2.6 2369 80.3 18.6 1.2 2.6
2014 2414 84.6 13.2 2.2 2.1 2389 83.7 14.0 2.3 2.2
Aust
2008 262549 93.5 7 1.2 262122 93.3 7 1.1
2009 264589 93.7 6.3 1.3 263303 93.3 6.7 1.3
2010 260046 92.9 6.1 1.0 1.6 258827 92.5 6.5 1.0 1.5
2011 249244 92.9 6.2 1.0 1.5 247996 92.4 6.6 1.0 1.5
2012 257003 92.1 6.6 1.4 1.6 255403 91.5 7.1 1.4 1.6
2013 258658 92.1 6.2 1.7 1.6 256732 91.4 6.9 1.8 1.6
2014 260353 91.7 6.0 2.4 1.8 258775 91.1 6.5 2.4 1.8
Note: Exempt students are deemed not to have met the NMS and are included in the calculation of participation rates.
Refer to page 303 for notes on the Participation tables. Refer to the introduction for explanatory notes.
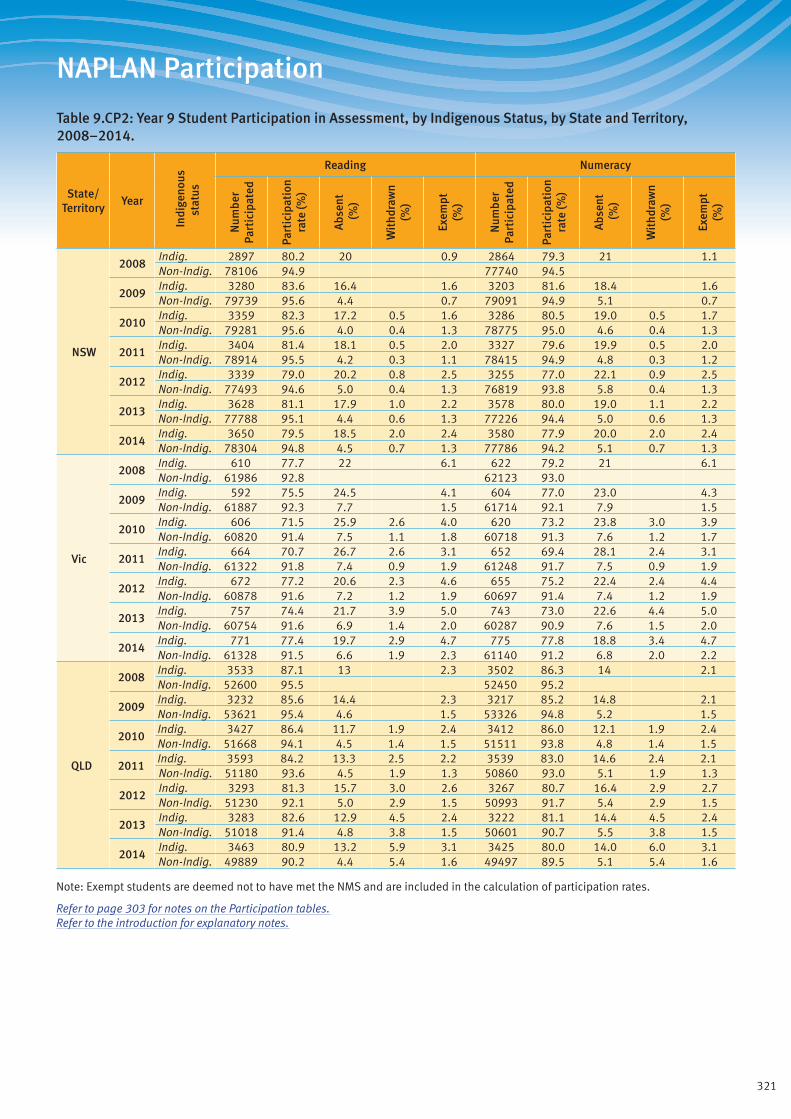
321
NAPLAN Participation
Table 9.CP2: Year 9 Student Participation in Assessment, by Indigenous Status, by State and Territory, 2008–2014.
State/ Territory
Year
Indi
geno
us
stat
us
Reading Numeracy
Num
ber
Part
icip
ated
Part
icip
atio
n ra
te (%
)
Abs
ent
(%)
Wit
hdra
wn
(%)
Exem
pt(%
)
Num
ber
Part
icip
ated
Part
icip
atio
n ra
te (%
)
Abs
ent
(%)
Wit
hdra
wn
(%)
Exem
pt(%
)
NSW
2008Indig. 2897 80.2 20 0.9 2864 79.3 21 1.1Non-Indig. 78106 94.9 77740 94.5
2009Indig. 3280 83.6 16.4 1.6 3203 81.6 18.4 1.6Non-Indig. 79739 95.6 4.4 0.7 79091 94.9 5.1 0.7
2010Indig. 3359 82.3 17.2 0.5 1.6 3286 80.5 19.0 0.5 1.7Non-Indig. 79281 95.6 4.0 0.4 1.3 78775 95.0 4.6 0.4 1.3
2011Indig. 3404 81.4 18.1 0.5 2.0 3327 79.6 19.9 0.5 2.0Non-Indig. 78914 95.5 4.2 0.3 1.1 78415 94.9 4.8 0.3 1.2
2012Indig. 3339 79.0 20.2 0.8 2.5 3255 77.0 22.1 0.9 2.5Non-Indig. 77493 94.6 5.0 0.4 1.3 76819 93.8 5.8 0.4 1.3
2013Indig. 3628 81.1 17.9 1.0 2.2 3578 80.0 19.0 1.1 2.2Non-Indig. 77788 95.1 4.4 0.6 1.3 77226 94.4 5.0 0.6 1.3
2014Indig. 3650 79.5 18.5 2.0 2.4 3580 77.9 20.0 2.0 2.4Non-Indig. 78304 94.8 4.5 0.7 1.3 77786 94.2 5.1 0.7 1.3
Vic
2008Indig. 610 77.7 22 6.1 622 79.2 21 6.1Non-Indig. 61986 92.8 62123 93.0
2009Indig. 592 75.5 24.5 4.1 604 77.0 23.0 4.3Non-Indig. 61887 92.3 7.7 1.5 61714 92.1 7.9 1.5
2010Indig. 606 71.5 25.9 2.6 4.0 620 73.2 23.8 3.0 3.9Non-Indig. 60820 91.4 7.5 1.1 1.8 60718 91.3 7.6 1.2 1.7
2011Indig. 664 70.7 26.7 2.6 3.1 652 69.4 28.1 2.4 3.1Non-Indig. 61322 91.8 7.4 0.9 1.9 61248 91.7 7.5 0.9 1.9
2012Indig. 672 77.2 20.6 2.3 4.6 655 75.2 22.4 2.4 4.4Non-Indig. 60878 91.6 7.2 1.2 1.9 60697 91.4 7.4 1.2 1.9
2013Indig. 757 74.4 21.7 3.9 5.0 743 73.0 22.6 4.4 5.0Non-Indig. 60754 91.6 6.9 1.4 2.0 60287 90.9 7.6 1.5 2.0
2014Indig. 771 77.4 19.7 2.9 4.7 775 77.8 18.8 3.4 4.7Non-Indig. 61328 91.5 6.6 1.9 2.3 61140 91.2 6.8 2.0 2.2
QLD
2008Indig. 3533 87.1 13 2.3 3502 86.3 14 2.1Non-Indig. 52600 95.5 52450 95.2
2009Indig. 3232 85.6 14.4 2.3 3217 85.2 14.8 2.1Non-Indig. 53621 95.4 4.6 1.5 53326 94.8 5.2 1.5
2010Indig. 3427 86.4 11.7 1.9 2.4 3412 86.0 12.1 1.9 2.4Non-Indig. 51668 94.1 4.5 1.4 1.5 51511 93.8 4.8 1.4 1.5
2011Indig. 3593 84.2 13.3 2.5 2.2 3539 83.0 14.6 2.4 2.1Non-Indig. 51180 93.6 4.5 1.9 1.3 50860 93.0 5.1 1.9 1.3
2012Indig. 3293 81.3 15.7 3.0 2.6 3267 80.7 16.4 2.9 2.7Non-Indig. 51230 92.1 5.0 2.9 1.5 50993 91.7 5.4 2.9 1.5
2013Indig. 3283 82.6 12.9 4.5 2.4 3222 81.1 14.4 4.5 2.4Non-Indig. 51018 91.4 4.8 3.8 1.5 50601 90.7 5.5 3.8 1.5
2014Indig. 3463 80.9 13.2 5.9 3.1 3425 80.0 14.0 6.0 3.1Non-Indig. 49889 90.2 4.4 5.4 1.6 49497 89.5 5.1 5.4 1.6
Note: Exempt students are deemed not to have met the NMS and are included in the calculation of participation rates.
Refer to page 303 for notes on the Participation tables. Refer to the introduction for explanatory notes.
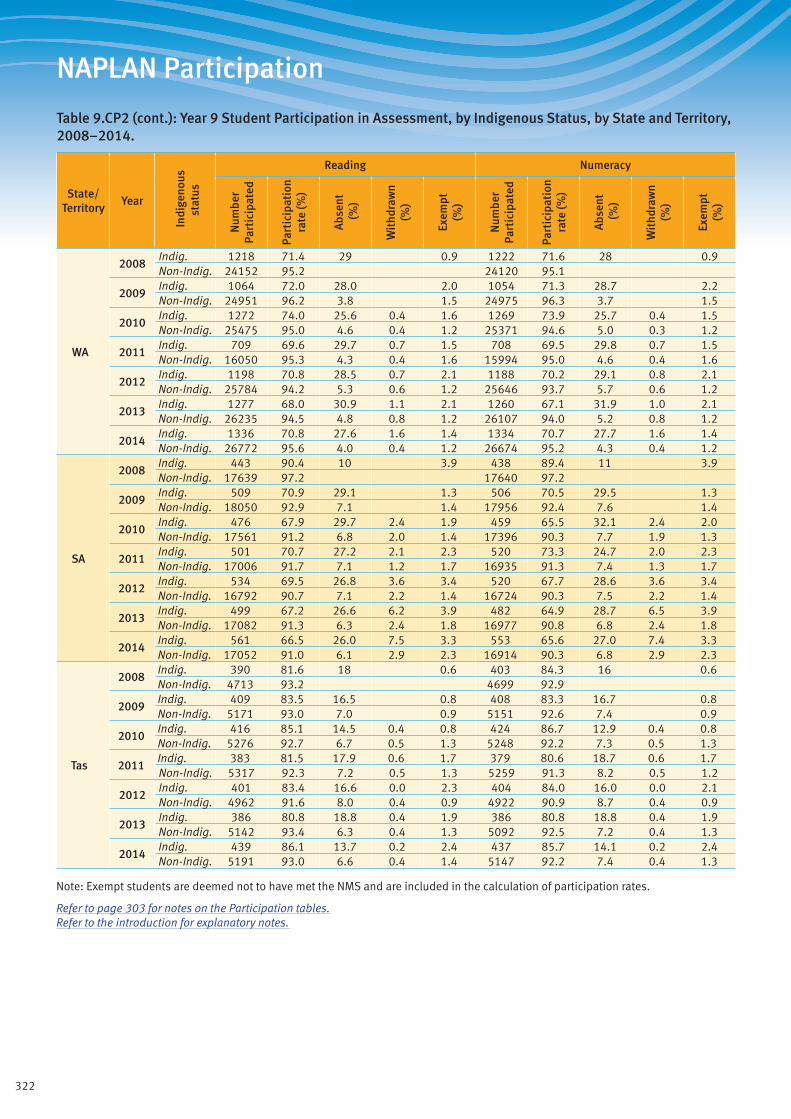
322
NAPLAN Participation
Table 9.CP2 (cont.): Year 9 Student Participation in Assessment, by Indigenous Status, by State and Territory, 2008–2014.
State/ Territory
Year
Indi
geno
us
stat
us
Reading Numeracy
Num
ber
Part
icip
ated
Part
icip
atio
n ra
te (%
)
Abs
ent
(%)
Wit
hdra
wn
(%)
Exem
pt(%
)
Num
ber
Part
icip
ated
Part
icip
atio
n ra
te (%
)
Abs
ent
(%)
Wit
hdra
wn
(%)
Exem
pt(%
)
WA
2008Indig. 1218 71.4 29 0.9 1222 71.6 28 0.9Non-Indig. 24152 95.2 24120 95.1
2009Indig. 1064 72.0 28.0 2.0 1054 71.3 28.7 2.2Non-Indig. 24951 96.2 3.8 1.5 24975 96.3 3.7 1.5
2010Indig. 1272 74.0 25.6 0.4 1.6 1269 73.9 25.7 0.4 1.5Non-Indig. 25475 95.0 4.6 0.4 1.2 25371 94.6 5.0 0.3 1.2
2011Indig. 709 69.6 29.7 0.7 1.5 708 69.5 29.8 0.7 1.5Non-Indig. 16050 95.3 4.3 0.4 1.6 15994 95.0 4.6 0.4 1.6
2012Indig. 1198 70.8 28.5 0.7 2.1 1188 70.2 29.1 0.8 2.1Non-Indig. 25784 94.2 5.3 0.6 1.2 25646 93.7 5.7 0.6 1.2
2013Indig. 1277 68.0 30.9 1.1 2.1 1260 67.1 31.9 1.0 2.1Non-Indig. 26235 94.5 4.8 0.8 1.2 26107 94.0 5.2 0.8 1.2
2014Indig. 1336 70.8 27.6 1.6 1.4 1334 70.7 27.7 1.6 1.4Non-Indig. 26772 95.6 4.0 0.4 1.2 26674 95.2 4.3 0.4 1.2
SA
2008Indig. 443 90.4 10 3.9 438 89.4 11 3.9Non-Indig. 17639 97.2 17640 97.2
2009Indig. 509 70.9 29.1 1.3 506 70.5 29.5 1.3Non-Indig. 18050 92.9 7.1 1.4 17956 92.4 7.6 1.4
2010Indig. 476 67.9 29.7 2.4 1.9 459 65.5 32.1 2.4 2.0Non-Indig. 17561 91.2 6.8 2.0 1.4 17396 90.3 7.7 1.9 1.3
2011Indig. 501 70.7 27.2 2.1 2.3 520 73.3 24.7 2.0 2.3Non-Indig. 17006 91.7 7.1 1.2 1.7 16935 91.3 7.4 1.3 1.7
2012Indig. 534 69.5 26.8 3.6 3.4 520 67.7 28.6 3.6 3.4Non-Indig. 16792 90.7 7.1 2.2 1.4 16724 90.3 7.5 2.2 1.4
2013Indig. 499 67.2 26.6 6.2 3.9 482 64.9 28.7 6.5 3.9Non-Indig. 17082 91.3 6.3 2.4 1.8 16977 90.8 6.8 2.4 1.8
2014Indig. 561 66.5 26.0 7.5 3.3 553 65.6 27.0 7.4 3.3Non-Indig. 17052 91.0 6.1 2.9 2.3 16914 90.3 6.8 2.9 2.3
Tas
2008Indig. 390 81.6 18 0.6 403 84.3 16 0.6Non-Indig. 4713 93.2 4699 92.9
2009Indig. 409 83.5 16.5 0.8 408 83.3 16.7 0.8Non-Indig. 5171 93.0 7.0 0.9 5151 92.6 7.4 0.9
2010Indig. 416 85.1 14.5 0.4 0.8 424 86.7 12.9 0.4 0.8Non-Indig. 5276 92.7 6.7 0.5 1.3 5248 92.2 7.3 0.5 1.3
2011Indig. 383 81.5 17.9 0.6 1.7 379 80.6 18.7 0.6 1.7Non-Indig. 5317 92.3 7.2 0.5 1.3 5259 91.3 8.2 0.5 1.2
2012Indig. 401 83.4 16.6 0.0 2.3 404 84.0 16.0 0.0 2.1Non-Indig. 4962 91.6 8.0 0.4 0.9 4922 90.9 8.7 0.4 0.9
2013Indig. 386 80.8 18.8 0.4 1.9 386 80.8 18.8 0.4 1.9Non-Indig. 5142 93.4 6.3 0.4 1.3 5092 92.5 7.2 0.4 1.3
2014Indig. 439 86.1 13.7 0.2 2.4 437 85.7 14.1 0.2 2.4Non-Indig. 5191 93.0 6.6 0.4 1.4 5147 92.2 7.4 0.4 1.3
Note: Exempt students are deemed not to have met the NMS and are included in the calculation of participation rates.
Refer to page 303 for notes on the Participation tables. Refer to the introduction for explanatory notes.
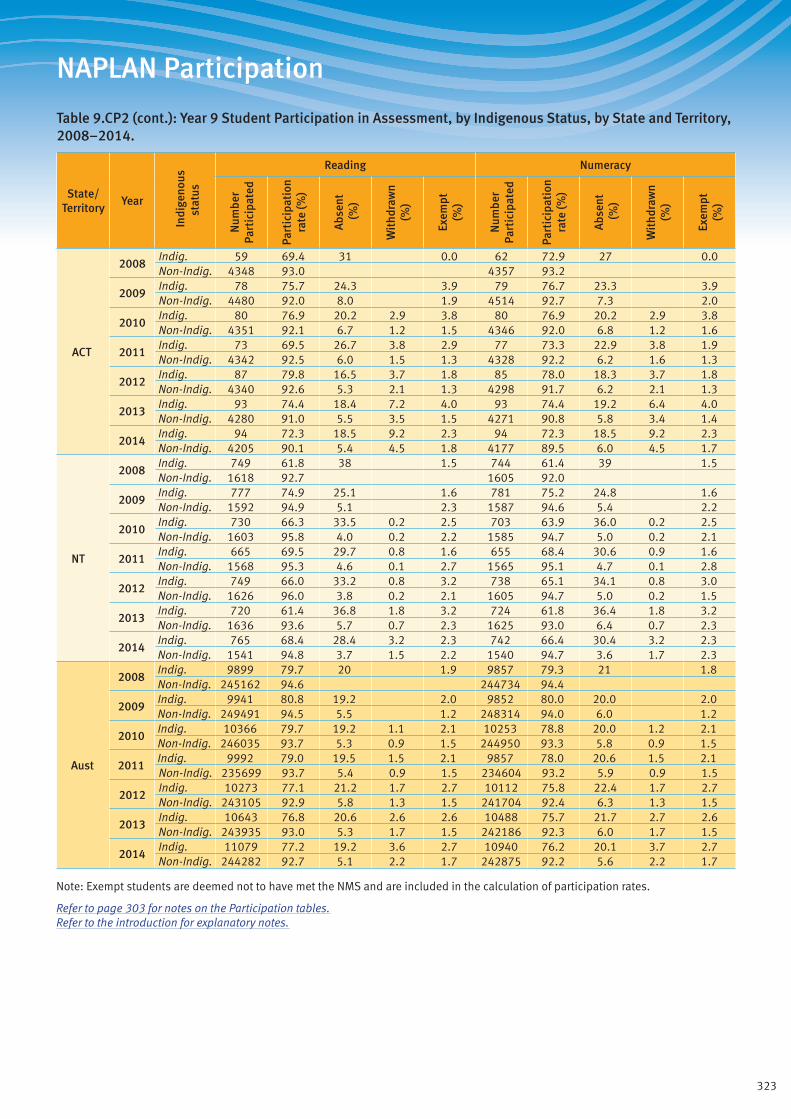
323
NAPLAN Participation
Table 9.CP2 (cont.): Year 9 Student Participation in Assessment, by Indigenous Status, by State and Territory, 2008–2014.
State/ Territory
Year
Indi
geno
us
stat
us
Reading Numeracy
Num
ber
Part
icip
ated
Part
icip
atio
n ra
te (%
)
Abs
ent
(%)
Wit
hdra
wn
(%)
Exem
pt(%
)
Num
ber
Part
icip
ated
Part
icip
atio
n ra
te (%
)
Abs
ent
(%)
Wit
hdra
wn
(%)
Exem
pt(%
)
ACT
2008Indig. 59 69.4 31 0.0 62 72.9 27 0.0Non-Indig. 4348 93.0 4357 93.2
2009Indig. 78 75.7 24.3 3.9 79 76.7 23.3 3.9Non-Indig. 4480 92.0 8.0 1.9 4514 92.7 7.3 2.0
2010Indig. 80 76.9 20.2 2.9 3.8 80 76.9 20.2 2.9 3.8Non-Indig. 4351 92.1 6.7 1.2 1.5 4346 92.0 6.8 1.2 1.6
2011Indig. 73 69.5 26.7 3.8 2.9 77 73.3 22.9 3.8 1.9Non-Indig. 4342 92.5 6.0 1.5 1.3 4328 92.2 6.2 1.6 1.3
2012Indig. 87 79.8 16.5 3.7 1.8 85 78.0 18.3 3.7 1.8Non-Indig. 4340 92.6 5.3 2.1 1.3 4298 91.7 6.2 2.1 1.3
2013Indig. 93 74.4 18.4 7.2 4.0 93 74.4 19.2 6.4 4.0Non-Indig. 4280 91.0 5.5 3.5 1.5 4271 90.8 5.8 3.4 1.4
2014Indig. 94 72.3 18.5 9.2 2.3 94 72.3 18.5 9.2 2.3Non-Indig. 4205 90.1 5.4 4.5 1.8 4177 89.5 6.0 4.5 1.7
NT
2008Indig. 749 61.8 38 1.5 744 61.4 39 1.5Non-Indig. 1618 92.7 1605 92.0
2009Indig. 777 74.9 25.1 1.6 781 75.2 24.8 1.6Non-Indig. 1592 94.9 5.1 2.3 1587 94.6 5.4 2.2
2010Indig. 730 66.3 33.5 0.2 2.5 703 63.9 36.0 0.2 2.5Non-Indig. 1603 95.8 4.0 0.2 2.2 1585 94.7 5.0 0.2 2.1
2011Indig. 665 69.5 29.7 0.8 1.6 655 68.4 30.6 0.9 1.6Non-Indig. 1568 95.3 4.6 0.1 2.7 1565 95.1 4.7 0.1 2.8
2012Indig. 749 66.0 33.2 0.8 3.2 738 65.1 34.1 0.8 3.0Non-Indig. 1626 96.0 3.8 0.2 2.1 1605 94.7 5.0 0.2 1.5
2013Indig. 720 61.4 36.8 1.8 3.2 724 61.8 36.4 1.8 3.2Non-Indig. 1636 93.6 5.7 0.7 2.3 1625 93.0 6.4 0.7 2.3
2014Indig. 765 68.4 28.4 3.2 2.3 742 66.4 30.4 3.2 2.3Non-Indig. 1541 94.8 3.7 1.5 2.2 1540 94.7 3.6 1.7 2.3
Aust
2008Indig. 9899 79.7 20 1.9 9857 79.3 21 1.8Non-Indig. 245162 94.6 244734 94.4
2009Indig. 9941 80.8 19.2 2.0 9852 80.0 20.0 2.0Non-Indig. 249491 94.5 5.5 1.2 248314 94.0 6.0 1.2
2010Indig. 10366 79.7 19.2 1.1 2.1 10253 78.8 20.0 1.2 2.1Non-Indig. 246035 93.7 5.3 0.9 1.5 244950 93.3 5.8 0.9 1.5
2011Indig. 9992 79.0 19.5 1.5 2.1 9857 78.0 20.6 1.5 2.1Non-Indig. 235699 93.7 5.4 0.9 1.5 234604 93.2 5.9 0.9 1.5
2012Indig. 10273 77.1 21.2 1.7 2.7 10112 75.8 22.4 1.7 2.7Non-Indig. 243105 92.9 5.8 1.3 1.5 241704 92.4 6.3 1.3 1.5
2013Indig. 10643 76.8 20.6 2.6 2.6 10488 75.7 21.7 2.7 2.6Non-Indig. 243935 93.0 5.3 1.7 1.5 242186 92.3 6.0 1.7 1.5
2014Indig. 11079 77.2 19.2 3.6 2.7 10940 76.2 20.1 3.7 2.7Non-Indig. 244282 92.7 5.1 2.2 1.7 242875 92.2 5.6 2.2 1.7
Note: Exempt students are deemed not to have met the NMS and are included in the calculation of participation rates.
Refer to page 303 for notes on the Participation tables. Refer to the introduction for explanatory notes.
324
NAPLAN Commentary on Participation
ParticipationStudent participation in NAPLAN, overall or for groups of students, is monitored to ensure that any potential for bias in estimates of achievement resulting from differential participation is minimised. To limit this source of potential bias participation needs to be high and uniform across groups. It is important to note, however, that the relationship between non-participation and achievement has not been established, so it is not possible to comment explicitly on the effect that differences in participation rates might have on achievement. Participation rates are calculated as the sum of present and exempt students expressed as a percentage of the total number of students in the year level, including those absent and withdrawn. Nationally, the percentages of students who are exempt have been 2.1% or less since 2008 and have not changed appreciably since 2010 for any year level.
Student participation data for NAPLAN over the period from 2008 to 2014 are provided in Tables 3.CP1, 5.CP1, 7.CP1 and 9.CP1. These tables provide information about overall participation rates and the percentages of students who were absent, withdrawn and exempt for the assessments in reading and numeracy. Tables 3.CP2, 5.CP2, 7.CP2 and 9.CP2 provide these data separately for Indigenous and non-Indigenous students.
Year 3 and Year 5Tables 3.CP1 and 5.CP1 record the participation rates for Year 3 and Year 5, respectively. The national participation rates in 2014 for Years 3 and 5 were very similar. In reading the participation rates were 94.9% and 95.6% for Years 3 and 5, respectively; in numeracy the rates were 94.6% and 95.2% for Years 3 and 5, respectively. These participation rates have not changed to any appreciable extent from year to year since 2008, but there have been overall decreases of 1.7 percentage points in both reading and numeracy for Year 3 and 1.2 percentage points in reading and 1.4 percentage points in numeracy for Year 5.
In 2014, the national absence rates in reading were 2.4% and 2.3% for Year 3 and Year 5, respectively, and in numeracy were 2.8% for both Years 3 and 5. For Year 3, absence rates had dropped from 2009 to 2010, when withdrawn rates were first reported separately, remained largely constant from 2010 to 2012 and then dropped a little in 2013 and again in 2014. For Year 5, absence rates followed a similar pattern, with small drops in 2013 and 2014. Withdrawn rates, which were first recorded in 2010, declined from 2010 to 2011 in Year 3 reading and numeracy, then increased each year from 2011 to 2014. For Year 5, in both reading and numeracy, there was also little change to the withdrawn rate from 2010 to 2011, followed by increases each year from 2011 to 2014. In 2014, the withdrawn rates for Year 5 were 2.1% in reading, and 2.0% in numeracy.
Participation rates are reported for each jurisdiction, as well as all of Australia, in Tables 3.CP1 and 5.CP1. From 2008 to 2014, participation rates have been steady for New South Wales and Western Australia in reading and numeracy for both year levels. For Tasmania, participation rates were fairly steady in reading and numeracy for both year levels until 2011; by 2014 they were approximately 1.0 percentage point lower. In Year 3 and Year 5 reading and numeracy, participation rates declined by more than 1.0 percentage point from 2008 to 2014 for Victoria, Queensland, South Australia and the ACT. For Victoria, the participation rates for 2014 are similar to the rates for 2013. For the Northern Territory, participation rates for Year 3 and Year 5 in reading and numeracy had decreased from 2009 to 2013; for 2014, participation rates increased by 1.8 percentage points in Year 3 reading, 2.4 percentage points in Year 3 numeracy, 2.3 percentage points in Year 5 reading and 2.9 percentage points in Year 5 numeracy.
In most jurisdictions, absence rates for Year 3 and Year 5 reading and numeracy in 2014 were similar to those in 2013, with a decrease of 0.1 percentage point in the national absence rate for both reading and numeracy for both year levels. For the Northern
Territory, absence rates decreased by 2.1 to 3.1 percentage points between 2013 and 2014 in reading and numeracy for Years 3 and 5.
Table 3.CP2 indicates that participation by Indigenous students for Year 3 in 2014 was lower than participation by non-Indigenous students nationally by 6.5 percentage points in reading and 6.9 percentage points in numeracy. For Year 5, these differences were 6.3 percentage points in reading and 7.1 percentage points in numeracy (Table 5.CP2). For Year 3, absence rates for Indigenous students in 2014 were 7.0% in reading—a decrease of 0.8 percentage points from 2013—and 8.0% in numeracy—a decrease of 0.7 percentage points from 2013. For Year 5, absence rates for Indigenous students dropped by 0.9 percentage points in both reading and numeracy between 2013 and 2014.
Year 7Table 7.CP1 indicates that the national participation rates in 2014 for Year 7 were similar to those for Years 3 and 5. In reading, the participation rate was 95.1% and in numeracy the rate was 94.7%. Each represents a decrease of 0.4 percentage points from the corresponding rate in 2013 and more than 1.0 percentage point from 2008.
Participation rates have been fairly stable between 2008 and 2014 for New South Wales, Victoria, Western Australia, Tasmania and the ACT, with differences of approximately 1.0 percentage point or less in both reading and numeracy. For Queensland, participation rates have decreased by 4.6 percentage points in reading and 4.8 percentage points in numeracy since 2008, with the largest decreases occurring between 2013 and 2014. For South Australia, the participation rate has decreased by 3 percentage points or more since 2008. For the Northern Territory, the participation rate increased by 3.2 percentage points between 2013 and 2014 in reading and by 1.9 percentage points in numeracy.
Table 7.CP2 shows that for Year 7, as for Years 3 and 5, participation by Indigenous students was lower than participation by non-Indigenous students in both reading and numeracy. Among Year 7 students, the differences in the participation rates were 9.2 percentage points in reading and 9.6 percentage points in numeracy. These differences are largely explained by differences in the absence rates. In reading and numeracy, the absence rates of 10.9% and 11.7% for Indigenous students are substantially greater than the corresponding absence rates of 2.8% and 3.1% for non-Indigenous students.
Year 9Table 9.CP1 indicates that the national participation rates in 2014 for Year 9 were lower than those for Years 3, 5 and 7, as they have been in previous years. In reading the participation rate was 91.7%, lower than in any previous year; in numeracy the rate was 91.1%, which was also lower than in any previous year. Changes in participation rates reflect changes in the absence and withdrawn rates. In reading, between 2013 and 2014, the absence rate decreased by 0.2 percentage points and the withdrawn rate increased by 0.7 percentage points; in numeracy between 2013 and 2014, the absence rate decreased by 0.4 percentage points and the withdrawn rate increased by 0.6 percentage points. As a result, the participation rates decreased between 2013 and 2014.
Participation rates in reading ranged across jurisdictions from 84.6% in the Northern Territory to 93.9% in New South Wales, and in numeracy from 83.7% in the Northern Territory to 93.3% in Western Australia. In Queensland, there has been a steady decrease in participation rates in reading and numeracy since 2008 totalling approximately 6 percentage points, with the greatest decrease between 2013 and 2014. In the ACT, participation rates in reading and numeracy decreased by more than 1.0 percentage point in both reading and numeracy between 2013 and 2014. In the Northern Territory, participation rates increased between 2013 and 2014 by 4.1 percentage points in reading and 3.4 percentage points in numeracy. These increases are associated with decreases

325
NAPLAN Commentary on Participation
in the absence rate of 5.1 percentage points for reading and 4.6 percentage points in numeracy.
Table 9.CP2 shows that in Year 9, as for Years 3, 5 and 7, participation by Indigenous students was lower than participation by non-Indigenous students in both reading (77.2% compared to 92.7%) and numeracy (76.2% compared to 92.2%). The participation rates for Indigenous students represent increases over the rates for 2013. The differences in participation rates between Indigenous and non-Indigenous students are greater in Year 9 than in other year levels. In Year 9, the contribution to non-participation by Indigenous students arising from absence is quite large: 19.2% in reading and 20.1% in numeracy, but these absence rates are lower than the absence rates in 2013 and are among the lowest rates for Indigenous students in all years of NAPLAN testing. In Western Australia, South Australia and the Northern Territory, although the absence rates for Indigenous students were greater than 25% in both reading and numeracy, they represent decreases from 2013 to 2014.
SummaryThere has been a steady decrease in participation rates in NAPLAN over the period from 2008 to 2014, with the average total decrease across the four year levels and two domains approximately 1.6 percentage points, or an average of 0.2 to 0.3 percentage points per year. Since 2010, when withdrawals were first reported, there has been an increase in the withdrawn rate, with 2014 the highest across all year levels in both reading and numeracy.
Participation rates are similar across Years 3, 5 and 7, and somewhat lower in Year 9 by 3 to 4 percentage points. In all year levels, participation rates in reading are a little higher than in numeracy. In Year 9, compared to other year levels, absence is a substantial contribution to non-participation, with absence rates at 6.0% in reading and 6.5% in numeracy. In all year levels, participation rates for Indigenous students are lower than for non-Indigenous students; the difference is greatest in Year 9, where absence contributes substantially to non-participation by Indigenous students.
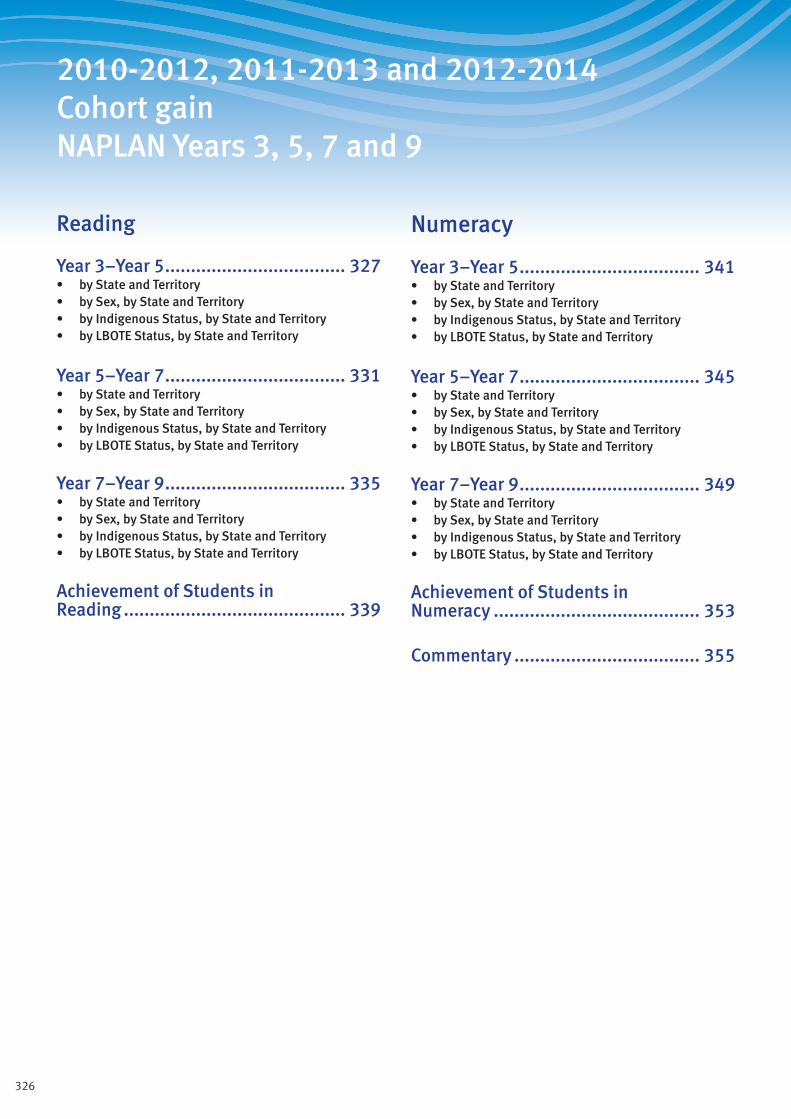
326
2010-2012, 2011-2013 and 2012-2014 Cohort gain NAPLAN Years 3, 5, 7 and 9
Reading
Year 3–Year 5 ................................... 327• by State and Territory• by Sex, by State and Territory• by Indigenous Status, by State and Territory• by LBOTE Status, by State and Territory
Year 5–Year 7 ................................... 331• by State and Territory• by Sex, by State and Territory• by Indigenous Status, by State and Territory• by LBOTE Status, by State and Territory
Year 7–Year 9 ................................... 335• by State and Territory• by Sex, by State and Territory• by Indigenous Status, by State and Territory• by LBOTE Status, by State and Territory
Achievement of Students in Reading ........................................... 339
Numeracy
Year 3–Year 5 ................................... 341• by State and Territory• by Sex, by State and Territory• by Indigenous Status, by State and Territory• by LBOTE Status, by State and Territory
Year 5–Year 7 ................................... 345• by State and Territory• by Sex, by State and Territory• by Indigenous Status, by State and Territory• by LBOTE Status, by State and Territory
Year 7–Year 9 ................................... 349• by State and Territory• by Sex, by State and Territory• by Indigenous Status, by State and Territory• by LBOTE Status, by State and Territory
Achievement of Students in Numeracy ........................................ 353
Commentary .................................... 355
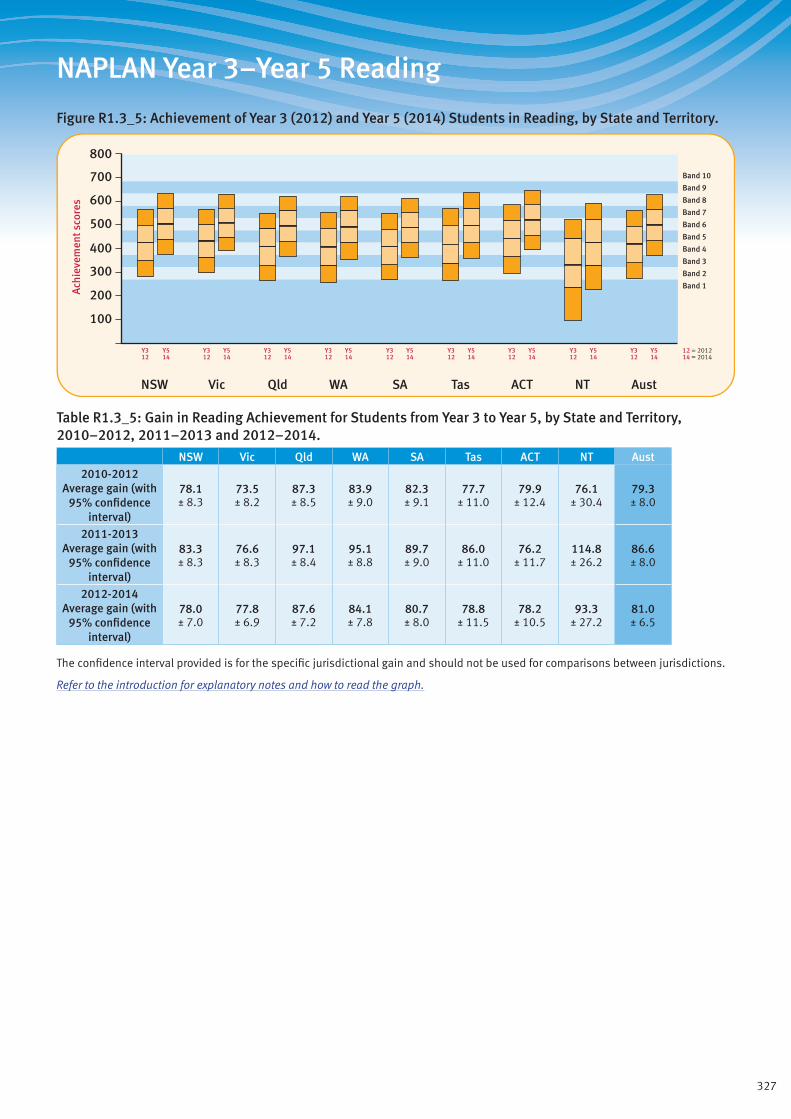
327
NAPLAN Year 3–Year 5 Reading
Figure R1.3_5: Achievement of Year 3 (2012) and Year 5 (2014) Students in Reading, by State and Territory.
Band 1
Band 2
Band 3
Band 4
Band 5
Band 6
Band 7
Band 8
Band 9
Band 10
600
700
800
500
400
300
200
100
Ach
ieve
men
t sco
res
ACTQld SAWA TasVicNSW NT Aust
Y312
Y514
Y312
Y514
Y312
Y514
Y312
Y514
Y312
Y514
Y312
Y514
Y312
Y514
Y312
Y514
Y312
Y514
12 = 201214 = 2014
Table R1.3_5: Gain in Reading Achievement for Students from Year 3 to Year 5, by State and Territory, 2010–2012, 2011–2013 and 2012–2014.
NSW Vic Qld WA SA Tas ACT NT Aust2010-2012
Average gain (with 95% confidence
interval)
78.1 ± 8.3
73.5 ± 8.2
87.3 ± 8.5
83.9 ± 9.0
82.3 ± 9.1
77.7 ± 11.0
79.9 ± 12.4
76.1 ± 30.4
79.3 ± 8.0
2011-2013 Average gain (with
95% confidence interval)
83.3 ± 8.3
76.6 ± 8.3
97.1 ± 8.4
95.1 ± 8.8
89.7 ± 9.0
86.0 ± 11.0
76.2 ± 11.7
114.8 ± 26.2
86.6 ± 8.0
2012-2014 Average gain (with
95% confidence interval)
78.0 ± 7.0
77.8 ± 6.9
87.6 ± 7.2
84.1 ± 7.8
80.7 ± 8.0
78.8 ± 11.5
78.2 ± 10.5
93.3 ± 27.2
81.0 ± 6.5
The confidence interval provided is for the specific jurisdictional gain and should not be used for comparisons between jurisdictions.
Refer to the introduction for explanatory notes and how to read the graph.
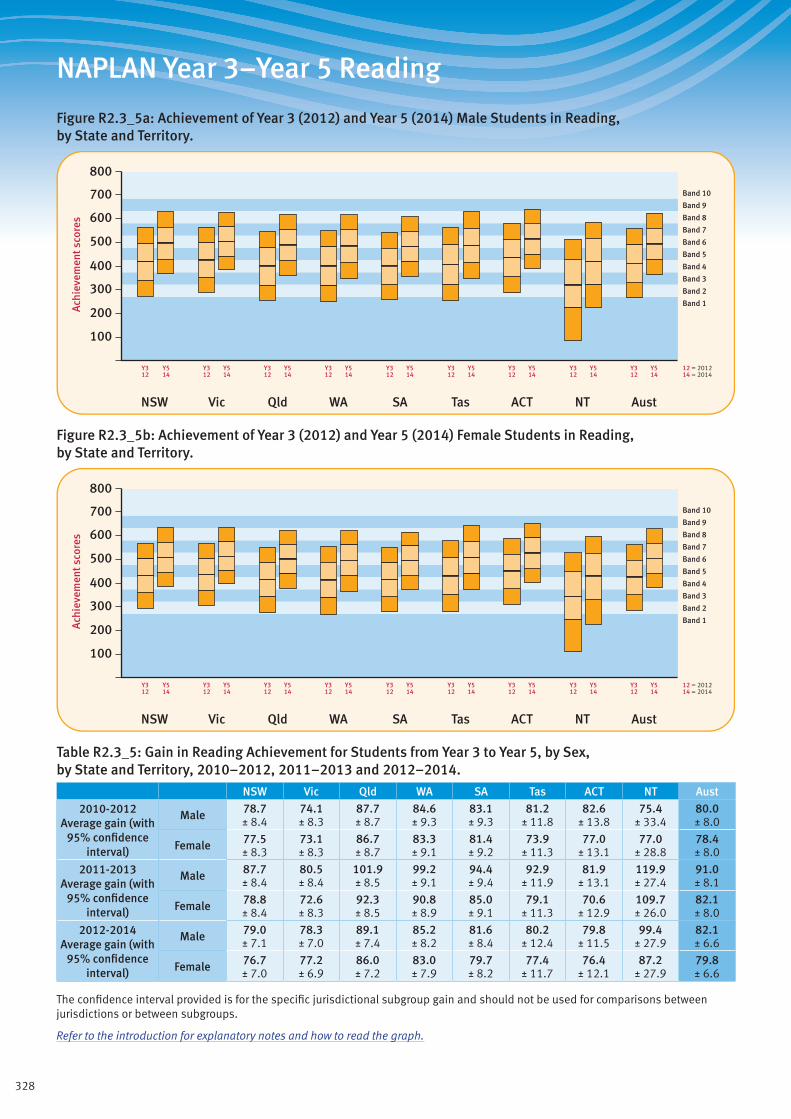
328
NAPLAN Year 3–Year 5 Reading
Figure R2.3_5a: Achievement of Year 3 (2012) and Year 5 (2014) Male Students in Reading, by State and Territory.
Band 1
Band 2
Band 3
Band 4
Band 5
Band 6
Band 7
Band 8
Band 9
Band 10
600
700
800
500
400
300
200
100
Ach
ieve
men
t sco
res
ACTQld SAWA TasVicNSW NT Aust
Y312
Y514
Y312
Y514
Y312
Y514
Y312
Y514
Y312
Y514
Y312
Y514
Y312
Y514
Y312
Y514
Y312
Y514
12 = 201214 = 2014
Figure R2.3_5b: Achievement of Year 3 (2012) and Year 5 (2014) Female Students in Reading, by State and Territory.
Band 1
Band 2
Band 3
Band 4
Band 5
Band 6
Band 7
Band 8
Band 9
Band 10
600
700
800
500
400
300
200
100
Ach
ieve
men
t sco
res
ACTQld SAWA TasVicNSW NT Aust
Y312
Y514
Y312
Y514
Y312
Y514
Y312
Y514
Y312
Y514
Y312
Y514
Y312
Y514
Y312
Y514
Y312
Y514
12 = 201214 = 2014
Table R2.3_5: Gain in Reading Achievement for Students from Year 3 to Year 5, by Sex, by State and Territory, 2010–2012, 2011–2013 and 2012–2014.
NSW Vic Qld WA SA Tas ACT NT Aust
2010-2012 Average gain (with
95% confidence interval)
Male 78.7 ± 8.4
74.1 ± 8.3
87.7 ± 8.7
84.6 ± 9.3
83.1 ± 9.3
81.2 ± 11.8
82.6 ± 13.8
75.4 ± 33.4
80.0 ± 8.0
Female 77.5 ± 8.3
73.1 ± 8.3
86.7 ± 8.7
83.3 ± 9.1
81.4 ± 9.2
73.9 ± 11.3
77.0 ± 13.1
77.0 ± 28.8
78.4 ± 8.0
2011-2013 Average gain (with
95% confidence interval)
Male 87.7 ± 8.4
80.5 ± 8.4
101.9 ± 8.5
99.2 ± 9.1
94.4 ± 9.4
92.9 ± 11.9
81.9 ± 13.1
119.9 ± 27.4
91.0 ± 8.1
Female 78.8 ± 8.4
72.6 ± 8.3
92.3 ± 8.5
90.8 ± 8.9
85.0 ± 9.1
79.1 ± 11.3
70.6 ± 12.9
109.7 ± 26.0
82.1 ± 8.0
2012-2014 Average gain (with
95% confidence interval)
Male 79.0 ± 7.1
78.3 ± 7.0
89.1 ± 7.4
85.2 ± 8.2
81.6 ± 8.4
80.2 ± 12.4
79.8 ± 11.5
99.4 ± 27.9
82.1 ± 6.6
Female 76.7 ± 7.0
77.2 ± 6.9
86.0 ± 7.2
83.0 ± 7.9
79.7 ± 8.2
77.4 ± 11.7
76.4 ± 12.1
87.2 ± 27.9
79.8 ± 6.6
The confidence interval provided is for the specific jurisdictional subgroup gain and should not be used for comparisons between jurisdictions or between subgroups.
Refer to the introduction for explanatory notes and how to read the graph.
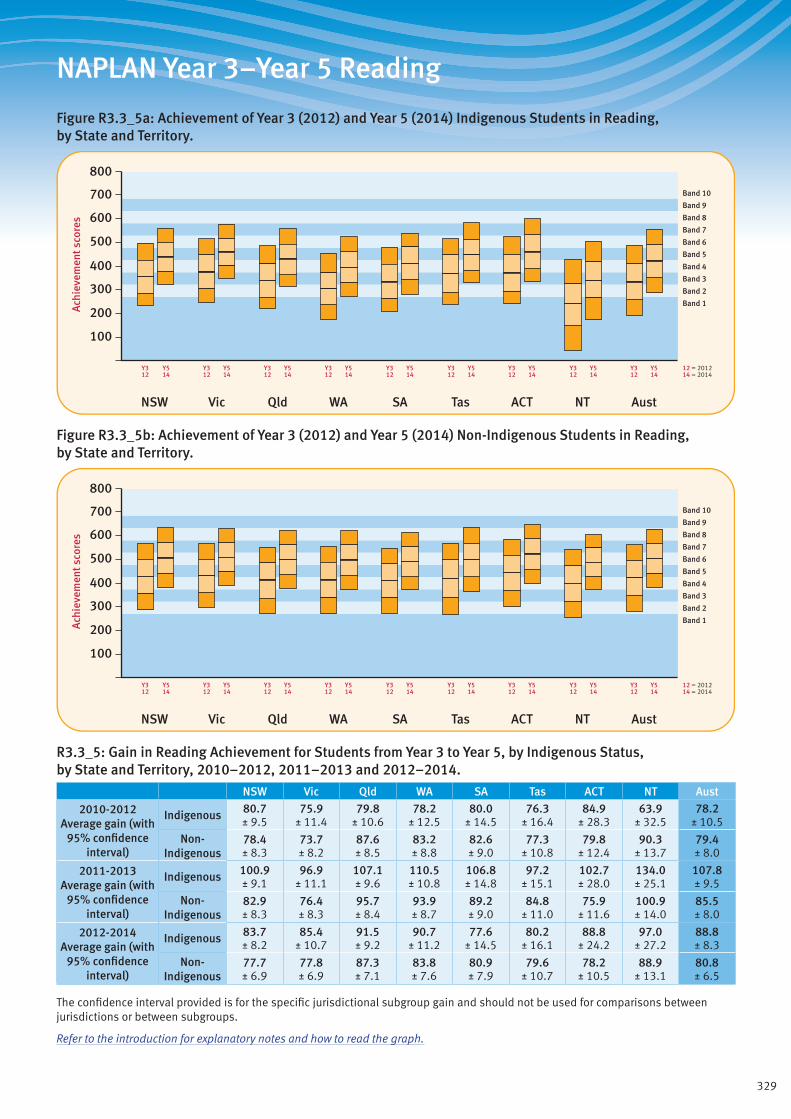
329
NAPLAN Year 3–Year 5 Reading
Figure R3.3_5a: Achievement of Year 3 (2012) and Year 5 (2014) Indigenous Students in Reading, by State and Territory.
Band 1
Band 2
Band 3
Band 4
Band 5
Band 6
Band 7
Band 8
Band 9
Band 10
600
700
800
500
400
300
200
100
Ach
ieve
men
t sco
res
ACTQld SAWA TasVicNSW NT Aust
Y312
Y514
Y312
Y514
Y312
Y514
Y312
Y514
Y312
Y514
Y312
Y514
Y312
Y514
Y312
Y514
Y312
Y514
12 = 201214 = 2014
Figure R3.3_5b: Achievement of Year 3 (2012) and Year 5 (2014) Non-Indigenous Students in Reading, by State and Territory.
Band 1
Band 2
Band 3
Band 4
Band 5
Band 6
Band 7
Band 8
Band 9
Band 10
600
700
800
500
400
300
200
100
Ach
ieve
men
t sco
res
ACTQld SAWA TasVicNSW NT Aust
Y312
Y514
Y312
Y514
Y312
Y514
Y312
Y514
Y312
Y514
Y312
Y514
Y312
Y514
Y312
Y514
Y312
Y514
12 = 201214 = 2014
R3.3_5: Gain in Reading Achievement for Students from Year 3 to Year 5, by Indigenous Status, by State and Territory, 2010–2012, 2011–2013 and 2012–2014.
NSW Vic Qld WA SA Tas ACT NT Aust
2010-2012 Average gain (with
95% confidence interval)
Indigenous 80.7 ± 9.5
75.9 ± 11.4
79.8 ± 10.6
78.2 ± 12.5
80.0 ± 14.5
76.3 ± 16.4
84.9 ± 28.3
63.9 ± 32.5
78.2 ± 10.5
Non- Indigenous
78.4 ± 8.3
73.7 ± 8.2
87.6 ± 8.5
83.2 ± 8.8
82.6 ± 9.0
77.3 ± 10.8
79.8 ± 12.4
90.3 ± 13.7
79.4 ± 8.0
2011-2013 Average gain (with
95% confidence interval)
Indigenous 100.9 ± 9.1
96.9 ± 11.1
107.1 ± 9.6
110.5 ± 10.8
106.8 ± 14.8
97.2 ± 15.1
102.7 ± 28.0
134.0 ± 25.1
107.8 ± 9.5
Non- Indigenous
82.9 ± 8.3
76.4 ± 8.3
95.7 ± 8.4
93.9 ± 8.7
89.2 ± 9.0
84.8 ± 11.0
75.9 ± 11.6
100.9 ± 14.0
85.5 ± 8.0
2012-2014 Average gain (with
95% confidence interval)
Indigenous 83.7 ± 8.2
85.4 ± 10.7
91.5 ± 9.2
90.7 ± 11.2
77.6 ± 14.5
80.2 ± 16.1
88.8 ± 24.2
97.0 ± 27.2
88.8 ± 8.3
Non- Indigenous
77.7 ± 6.9
77.8 ± 6.9
87.3 ± 7.1
83.8 ± 7.6
80.9 ± 7.9
79.6 ± 10.7
78.2 ± 10.5
88.9 ± 13.1
80.8 ± 6.5
The confidence interval provided is for the specific jurisdictional subgroup gain and should not be used for comparisons between jurisdictions or between subgroups.
Refer to the introduction for explanatory notes and how to read the graph.

330
NAPLAN Year 3–Year 5 Reading
Figure R4.3_5a: Achievement of Year 3 (2012) and Year 5 (2014) LBOTE Students in Reading, by State and Territory.
Band 1
Band 2
Band 3
Band 4
Band 5
Band 6
Band 7
Band 8
Band 9
Band 10
600
700
800
500
400
300
200
100
Ach
ieve
men
t sco
res
ACTQld SAWA TasVicNSW NT Aust
Y312
Y514
Y312
Y514
Y312
Y514
Y312
Y514
Y312
Y514
Y312
Y514
Y312
Y514
Y312
Y514
Y312
Y514
12 = 201214 = 2014
Figure R4.3_5b: Achievement of Year 3 (2012) and Year 5 (2014) Non-LBOTE Students in Reading, by State and Territory.
Band 1
Band 2
Band 3
Band 4
Band 5
Band 6
Band 7
Band 8
Band 9
Band 10
600
700
800
500
400
300
200
100
Ach
ieve
men
t sco
res
ACTQld SAWA TasVicNSW NT Aust
Y312
Y514
Y312
Y514
Y312
Y514
Y312
Y514
Y312
Y514
Y312
Y514
Y312
Y514
Y312
Y514
Y312
Y514
12 = 201214 = 2014
Table R4.3_5: Gain in Reading Achievement for Students from Year 3 to Year 5, by LBOTE Status, by State and Territory, 2010–2012, 2011–2013 and 2012–2014.
NSW Vic Qld WA SA Tas ACT NT Aust
2010-2012 Average gain (with
95% confidence interval)
LBOTE 75.9 ± 9.1
67.2 ± 8.8
87.1 ± 14.0
77.2 ± 10.8
79.8 ± 12.4
67.9 ± 19.8
73.9 ± 16.4
75.1 ± 37.3
72.9 ± 8.5
Non-LBOTE 78.7 ± 8.3
75.7 ± 8.3
87.4 ± 8.5
84.4 ± 9.1
83.2 ± 9.0
77.9 ± 10.8
81.4 ± 12.3
100.2 ± 16.9
80.9 ± 8.0
2011-2013 Average gain (with
95% confidence interval)
LBOTE 84.4 ± 9.1
78.0 ± 8.8
96.4 ± 12.1
91.4 ± 10.1
86.5 ± 11.1
83.3 ± 19.5
72.9 ± 15.4
125.5 ± 31.4
85.8 ± 8.4
Non-LBOTE 83.0 ± 8.3
76.3 ± 8.3
97.1 ± 8.4
95.8 ± 9.0
90.0 ± 9.0
86.3 ± 11.0
77.6 ± 11.8
105.8 ± 16.5
86.5 ± 8.0
2012-2014 Average gain (with
95% confidence interval)
LBOTE 75.7 ± 8.0
74.1 ± 7.6
85.1 ± 11.8
77.5 ± 9.7
74.0 ± 11.6
69.3 ± 20.4
70.4 ± 13.2
89.4 ± 33.4
76.5 ± 7.1
Non-LBOTE 79.0 ± 7.0
79.2 ± 6.9
88.5 ± 7.1
85.7 ± 8.0
81.4 ± 7.9
79.8 ± 10.9
80.2 ± 10.9
93.2 ± 16.0
82.4 ± 6.5
The confidence interval provided is for the specific jurisdictional subgroup gain and should not be used for comparisons between jurisdictions or between subgroups.
Refer to the introduction for explanatory notes and how to read the graph.

331
NAPLAN Year 5–Year 7 Reading
Figure R1.5_7: Achievement of Year 5 (2012) and Year 7 (2014) Students in Reading, by State and Territory.
Band 1
Band 2
Band 3
Band 4
Band 5
Band 6
Band 7
Band 8
Band 9
Band 10
600
700
800
500
400
300
200
100
Ach
ieve
men
t sco
res
ACTQld SAWA TasVicNSW NT Aust
Y512
Y714
Y512
Y714
Y512
Y714
Y512
Y714
Y512
Y714
Y512
Y714
Y512
Y714
Y512
Y714
Y512
Y714
12 = 201214 = 2014
Table R1.5_7: Gain in Reading Achievement for Students from Year 5 to Year 7, by State and Territory, 2010–2012, 2011–2013 and 2012–2014.
NSW Vic Qld WA SA Tas ACT NT Aust2010-2012
Average gain (with 95% confidence
interval)
49.9 ± 7.8
46.1 ± 7.6
64.0 ± 7.5
60.3 ± 8.1
60.5 ± 8.1
56.0 ± 11.6
50.0 ± 12.1
62.2 ± 29.5
54.1 ± 7.1
2011-2013 Average gain (with
95% confidence interval)
48.7 ± 6.8
43.2 ± 6.6
64.1 ± 6.6
58.2 ± 7.3
57.9 ± 7.3
50.4 ± 10.5
44.3 ± 11.9
65.3 ± 30.0
52.5 ± 6.1
2012-2014 Average gain (with
95% confidence interval)
48.5 ± 7.9
46.2 ± 7.7
61.3 ± 7.8
61.5 ± 8.4
57.2 ± 8.2
51.2 ± 11.1
48.3 ± 13.2
73.7 ± 33.2
52.5 ± 7.3
The confidence interval provided is for the specific jurisdictional gain and should not be used for comparisons between jurisdictions.
Refer to the introduction for explanatory notes and how to read the graph.
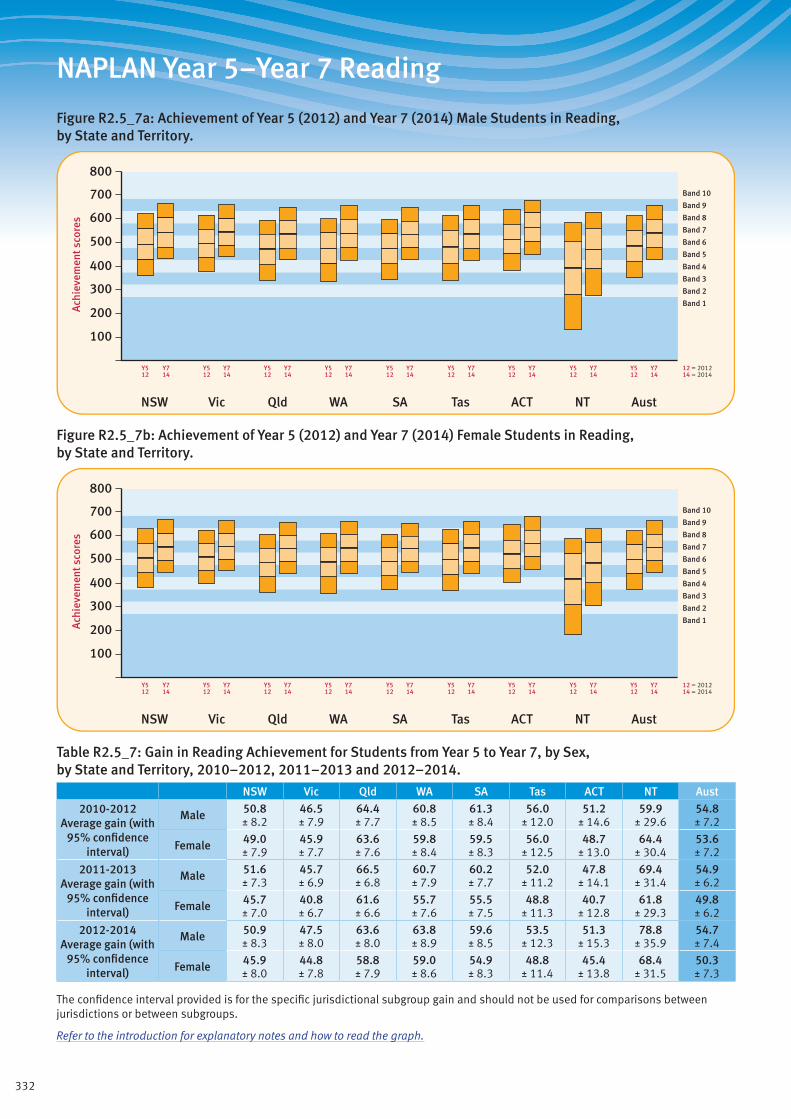
332
NAPLAN Year 5–Year 7 Reading
Figure R2.5_7a: Achievement of Year 5 (2012) and Year 7 (2014) Male Students in Reading, by State and Territory.
Band 1
Band 2
Band 3
Band 4
Band 5
Band 6
Band 7
Band 8
Band 9
Band 10
600
700
800
500
400
300
200
100
Ach
ieve
men
t sco
res
ACTQld SAWA TasVicNSW NT Aust
Y512
Y714
Y512
Y714
Y512
Y714
Y512
Y714
Y512
Y714
Y512
Y714
Y512
Y714
Y512
Y714
Y512
Y714
12 = 201214 = 2014
Figure R2.5_7b: Achievement of Year 5 (2012) and Year 7 (2014) Female Students in Reading, by State and Territory.
Band 1
Band 2
Band 3
Band 4
Band 5
Band 6
Band 7
Band 8
Band 9
Band 10
600
700
800
500
400
300
200
100
Ach
ieve
men
t sco
res
ACTQld SAWA TasVicNSW NT Aust
Y512
Y714
Y512
Y714
Y512
Y714
Y512
Y714
Y512
Y714
Y512
Y714
Y512
Y714
Y512
Y714
Y512
Y714
12 = 201214 = 2014
Table R2.5_7: Gain in Reading Achievement for Students from Year 5 to Year 7, by Sex, by State and Territory, 2010–2012, 2011–2013 and 2012–2014.
NSW Vic Qld WA SA Tas ACT NT Aust
2010-2012 Average gain (with
95% confidence interval)
Male 50.8 ± 8.2
46.5 ± 7.9
64.4 ± 7.7
60.8 ± 8.5
61.3 ± 8.4
56.0 ± 12.0
51.2 ± 14.6
59.9 ± 29.6
54.8 ± 7.2
Female 49.0 ± 7.9
45.9 ± 7.7
63.6 ± 7.6
59.8 ± 8.4
59.5 ± 8.3
56.0 ± 12.5
48.7 ± 13.0
64.4 ± 30.4
53.6 ± 7.2
2011-2013 Average gain (with
95% confidence interval)
Male 51.6 ± 7.3
45.7 ± 6.9
66.5 ± 6.8
60.7 ± 7.9
60.2 ± 7.7
52.0 ± 11.2
47.8 ± 14.1
69.4 ± 31.4
54.9 ± 6.2
Female 45.7 ± 7.0
40.8 ± 6.7
61.6 ± 6.6
55.7 ± 7.6
55.5 ± 7.5
48.8 ± 11.3
40.7 ± 12.8
61.8 ± 29.3
49.8 ± 6.2
2012-2014 Average gain (with
95% confidence interval)
Male 50.9 ± 8.3
47.5 ± 8.0
63.6 ± 8.0
63.8 ± 8.9
59.6 ± 8.5
53.5 ± 12.3
51.3 ± 15.3
78.8 ± 35.9
54.7 ± 7.4
Female 45.9 ± 8.0
44.8 ± 7.8
58.8 ± 7.9
59.0 ± 8.6
54.9 ± 8.3
48.8 ± 11.4
45.4 ± 13.8
68.4 ± 31.5
50.3 ± 7.3
The confidence interval provided is for the specific jurisdictional subgroup gain and should not be used for comparisons between jurisdictions or between subgroups.
Refer to the introduction for explanatory notes and how to read the graph.

333
NAPLAN Year 5–Year 7 Reading
Figure R3.5_7a: Achievement of Year 5 (2012) and Year 7 (2014) Indigenous Students in Reading, by State and Territory.
Band 1
Band 2
Band 3
Band 4
Band 5
Band 6
Band 7
Band 8
Band 9
Band 10
600
700
800
500
400
300
200
100
Ach
ieve
men
t sco
res
ACTQld SAWA TasVicNSW NT Aust
Y512
Y714
Y512
Y714
Y512
Y714
Y512
Y714
Y512
Y714
Y512
Y714
Y512
Y714
Y512
Y714
Y512
Y714
12 = 201214 = 2014
Figure R3.5_7b: Achievement of Year 5 (2012) and Year 7 (2014) Non-Indigenous Students in Reading, by State and Territory.
Band 1
Band 2
Band 3
Band 4
Band 5
Band 6
Band 7
Band 8
Band 9
Band 10
600
700
800
500
400
300
200
100
Ach
ieve
men
t sco
res
ACTQld SAWA TasVicNSW NT Aust
Y512
Y714
Y512
Y714
Y512
Y714
Y512
Y714
Y512
Y714
Y512
Y714
Y512
Y714
Y512
Y714
Y512
Y714
12 = 201214 = 2014
Table R3.5_7: Gain in Reading Achievement for Students from Year 5 to Year 7, by Indigenous Status, by State and Territory, 2010–2012, 2011–2013 and 2012–2014.
NSW Vic Qld WA SA Tas ACT NT Aust
2010-2012 Average gain (with
95% confidence interval)
Indigenous 56.6 ± 8.4
49.9 ± 11.0
66.7 ± 9.3
74.7 ± 10.6
69.6 ± 12.8
53.1 ± 13.7
76.8 ± 21.6
70.6 ± 30.3
65.2 ± 8.6
Non- Indigenous
50.0 ± 7.8
46.4 ± 7.6
63.4 ± 7.4
58.8 ± 7.9
60.4 ± 8.0
54.8 ± 11.1
49.4 ± 12.1
55.4 ± 16.1
53.6 ± 7.1
2011-2013 Average gain (with
95% confidence interval)
Indigenous 53.0 ± 7.6
44.6 ± 10.8
65.9 ± 8.2
72.4 ± 10.0
62.6 ± 11.7
52.9 ± 11.8
62.2 ± 24.1
73.5 ± 29.4
62.6 ± 8.0
Non- Indigenous
49.1 ± 6.8
43.3 ± 6.6
63.3 ± 6.5
57.3 ± 7.1
58.1 ± 7.2
49.6 ± 10.2
44.2 ± 11.8
57.1 ± 14.3
52.0 ± 6.1
2012-2014 Average gain (with
95% confidence interval)
Indigenous 56.9 ± 8.5
46.5 ± 10.3
73.1 ± 10.0
79.5 ± 11.3
70.2 ± 13.4
55.6 ± 13.3
56.5 ± 25.8
91.0 ± 33.5
70.0 ± 9.7
Non- Indigenous
48.3 ± 7.9
46.4 ± 7.7
60.4 ± 7.7
60.3 ± 8.2
56.9 ± 8.1
51.6 ± 11.0
48.6 ± 13.1
53.2 ± 16.7
51.8 ± 7.2
The confidence interval provided is for the specific jurisdictional subgroup gain and should not be used for comparisons between jurisdictions or between subgroups.
Refer to the introduction for explanatory notes and how to read the graph.

334
NAPLAN Year 5–Year 7 Reading
Figure R4.5_7a: Achievement of Year 5 (2012) and Year 7 (2014) LBOTE Students in Reading, by State and Territory.
Band 1
Band 2
Band 3
Band 4
Band 5
Band 6
Band 7
Band 8
Band 9
Band 10
600
700
800
500
400
300
200
100
Ach
ieve
men
t sco
res
ACTQld SAWA TasVicNSW NT Aust
Y512
Y714
Y512
Y714
Y512
Y714
Y512
Y714
Y512
Y714
Y512
Y714
Y512
Y714
Y512
Y714
Y512
Y714
12 = 201214 = 2014
Figure R4.5_7b: Achievement of Year 5 (2012) and Year 7 (2014) Non-LBOTE Students in Reading, by State and Territory.
Band 1
Band 2
Band 3
Band 4
Band 5
Band 6
Band 7
Band 8
Band 9
Band 10
600
700
800
500
400
300
200
100
Ach
ieve
men
t sco
res
ACTQld SAWA TasVicNSW NT Aust
Y512
Y714
Y512
Y714
Y512
Y714
Y512
Y714
Y512
Y714
Y512
Y714
Y512
Y714
Y512
Y714
Y512
Y714
12 = 201214 = 2014
Table R4.5_7: Gain in Reading Achievement for Students from Year 5 to Year 7, by LBOTE Status, by State and Territory, 2010–2012, 2011–2013 and 2012–2014.
NSW Vic Qld WA SA Tas ACT NT Aust
2010-2012 Average gain (with
95% confidence interval)
LBOTE 47.0 ± 9.8
39.9 ± 8.6
66.0 ± 11.9
56.2 ± 9.6
63.1 ± 10.6
46.1 ± 24.6
48.7 ± 17.5
78.6 ± 38.0
48.1 ± 8.0
Non-LBOTE 50.7 ± 7.7
47.9 ± 7.6
63.9 ± 7.5
61.3 ± 8.2
60.3 ± 8.1
56.1 ± 11.2
50.4 ± 12.0
61.5 ± 17.0
55.5 ± 7.1
2011-2013 Average gain (with
95% confidence interval)
LBOTE 53.7 ± 8.9
48.0 ± 7.7
66.7 ± 11.2
59.7 ± 9.1
57.2 ± 9.5
46.6 ± 21.5
46.2 ± 17.2
68.6 ± 37.5
54.6 ± 7.0
Non-LBOTE 46.5 ± 6.7
41.4 ± 6.6
63.5 ± 6.5
57.7 ± 7.5
58.6 ± 7.3
50.3 ± 10.2
43.9 ± 11.8
56.3 ± 16.7
51.6 ± 6.1
2012-2014 Average gain (with
95% confidence interval)
LBOTE 53.5 ± 10.0
49.8 ± 8.8
70.3 ± 12.1
64.4 ± 9.8
63.0 ± 11.8
51.4 ± 22.6
50.4 ± 16.6
77.0 ± 40.6
56.1 ± 8.1
Non-LBOTE 46.4 ± 7.8
44.8 ± 7.7
60.9 ± 7.7
61.6 ± 8.6
56.0 ± 8.1
51.5 ± 11.0
48.0 ± 13.4
49.0 ± 17.5
51.2 ± 7.2
The confidence interval provided is for the specific jurisdictional subgroup gain and should not be used for comparisons between jurisdictions or between subgroups.
Refer to the introduction for explanatory notes and how to read the graph.
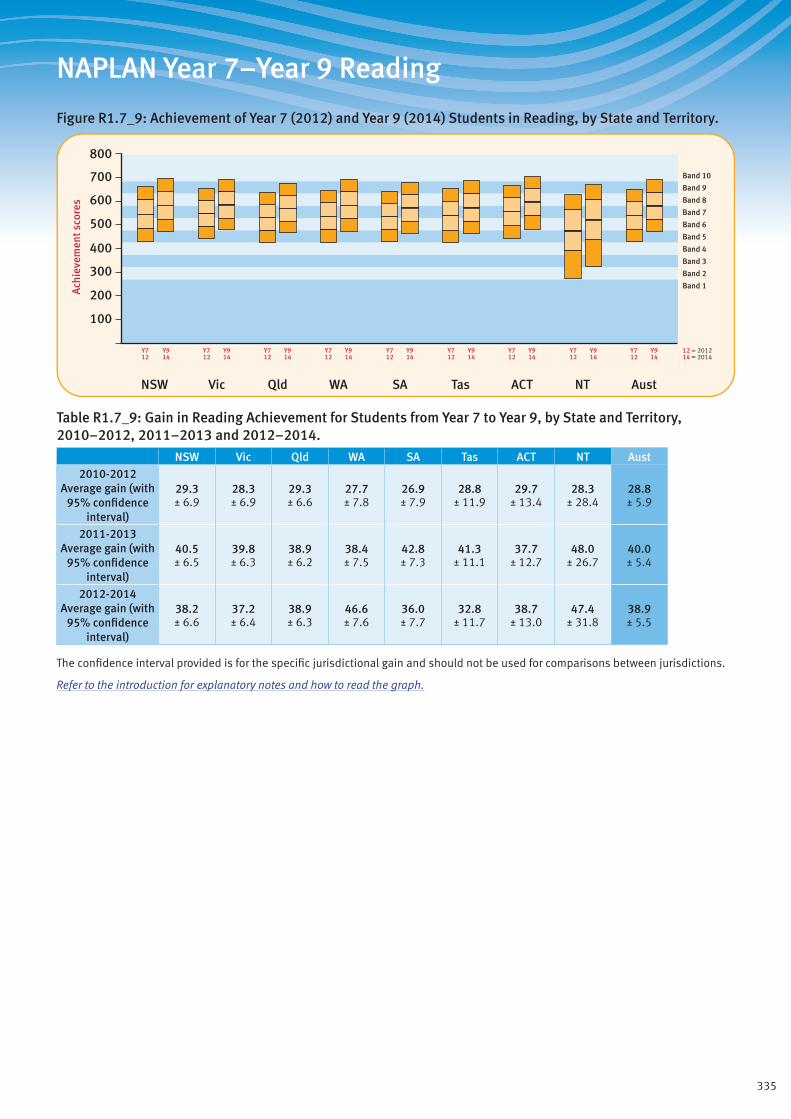
335
NAPLAN Year 7–Year 9 Reading
Figure R1.7_9: Achievement of Year 7 (2012) and Year 9 (2014) Students in Reading, by State and Territory.
Band 1
Band 2
Band 3
Band 4
Band 5
Band 6
Band 7
Band 8
Band 9
Band 10
600
700
800
500
400
300
200
100
Ach
ieve
men
t sco
res
ACTQld SAWA TasVicNSW NT Aust
Y712
Y914
Y712
Y914
Y712
Y914
Y712
Y914
Y712
Y914
Y712
Y914
Y712
Y914
Y712
Y914
Y712
Y914
12 = 201214 = 2014
Table R1.7_9: Gain in Reading Achievement for Students from Year 7 to Year 9, by State and Territory, 2010–2012, 2011–2013 and 2012–2014.
NSW Vic Qld WA SA Tas ACT NT Aust2010-2012
Average gain (with 95% confidence
interval)
29.3 ± 6.9
28.3 ± 6.9
29.3 ± 6.6
27.7 ± 7.8
26.9 ± 7.9
28.8 ± 11.9
29.7 ± 13.4
28.3 ± 28.4
28.8 ± 5.9
2011-2013 Average gain (with
95% confidence interval)
40.5 ± 6.5
39.8 ± 6.3
38.9 ± 6.2
38.4 ± 7.5
42.8 ± 7.3
41.3 ± 11.1
37.7 ± 12.7
48.0 ± 26.7
40.0 ± 5.4
2012-2014 Average gain (with
95% confidence interval)
38.2 ± 6.6
37.2 ± 6.4
38.9 ± 6.3
46.6 ± 7.6
36.0 ± 7.7
32.8 ± 11.7
38.7 ± 13.0
47.4 ± 31.8
38.9 ± 5.5
The confidence interval provided is for the specific jurisdictional gain and should not be used for comparisons between jurisdictions.
Refer to the introduction for explanatory notes and how to read the graph.

336
NAPLAN Year 7–Year 9 Reading
Figure R2.7_9a: Achievement of Year 7 (2012) and Year 9 (2014) Male Students in Reading, by State and Territory.
Band 1
Band 2
Band 3
Band 4
Band 5
Band 6
Band 7
Band 8
Band 9
Band 10
600
700
800
500
400
300
200
100
Ach
ieve
men
t sco
res
ACTQld SAWA TasVicNSW NT Aust
Y712
Y914
Y712
Y914
Y712
Y914
Y712
Y914
Y712
Y914
Y712
Y914
Y712
Y914
Y712
Y914
Y712
Y914
12 = 201214 = 2014
Figure R2.7_9b: Achievement of Year 7 (2012) and Year 9 (2014) Female Students in Reading, by State and Territory.
Band 1
Band 2
Band 3
Band 4
Band 5
Band 6
Band 7
Band 8
Band 9
Band 10
600
700
800
500
400
300
200
100
Ach
ieve
men
t sco
res
ACTQld SAWA TasVicNSW NT Aust
Y712
Y914
Y712
Y914
Y712
Y914
Y712
Y914
Y712
Y914
Y712
Y914
Y712
Y914
Y712
Y914
Y712
Y914
12 = 201214 = 2014
Table R2.7_9: Gain in Reading Achievement for Students from Year 7 to Year 9, by Sex, by State and Territory, 2010–2012, 2011–2013 and 2012–2014.
NSW Vic Qld WA SA Tas ACT NT Aust
2010-2012 Average gain (with
95% confidence interval)
Male 27.1 ± 7.5
27.0 ± 7.5
26.9 ± 7.0
25.3 ± 8.5
25.4 ± 8.3
29.6 ± 13.1
28.4 ± 16.0
25.3 ± 28.3
26.8 ± 6.1
Female 31.6 ± 7.3
29.6 ± 7.1
31.9 ± 6.8
30.2 ± 8.2
28.5 ± 8.2
28.0 ± 12.3
31.2 ± 14.4
31.6 ± 29.3
30.7 ± 6.0
2011-2013 Average gain (with
95% confidence interval)
Male 40.6 ± 7.2
39.9 ± 6.9
37.8 ± 6.5
37.8 ± 8.3
42.3 ± 7.7
41.8 ± 11.9
37.6 ± 14.3
48.0 ± 28.0
39.8 ± 5.6
Female 40.4 ± 6.7
39.8 ± 6.4
40.2 ± 6.4
39.2 ± 7.8
43.4 ± 7.5
40.8 ± 11.6
37.7 ± 14.2
48.0 ± 26.9
40.4 ± 5.5
2012-2014 Average gain (with
95% confidence interval)
Male 37.3 ± 7.4
36.5 ± 7.2
37.6 ± 6.6
46.8 ± 8.2
34.6 ± 8.2
33.9 ± 12.1
37.1 ± 16.5
46.7 ± 32.3
38.0 ± 5.7
Female 39.2 ± 6.9
37.8 ± 6.6
40.3 ± 6.4
46.4 ± 8.0
37.6 ± 7.9
31.7 ± 12.7
40.3 ± 13.7
48.4 ± 32.3
39.7 ± 5.6
The confidence interval provided is for the specific jurisdictional subgroup gain and should not be used for comparisons between jurisdictions or between subgroups.
Refer to the introduction for explanatory notes and how to read the graph.

337
NAPLAN Year 7–Year 9 Reading
Figure R3.7_9a: Achievement of Year 7 (2012) and Year 9 (2014) Indigenous Students in Reading, by State and Territory.
Band 1
Band 2
Band 3
Band 4
Band 5
Band 6
Band 7
Band 8
Band 9
Band 10
600
700
800
500
400
300
200
100
Ach
ieve
men
t sco
res
ACTQld SAWA TasVicNSW NT Aust
Y712
Y914
Y712
Y914
Y712
Y914
Y712
Y914
Y712
Y914
Y712
Y914
Y712
Y914
Y712
Y914
Y712
Y914
12 = 201214 = 2014
Figure R3.7_9b: Achievement of Year 7 (2012) and Year 9 (2014) Non-Indigenous Students in Reading, by State and Territory.
Band 1
Band 2
Band 3
Band 4
Band 5
Band 6
Band 7
Band 8
Band 9
Band 10
600
700
800
500
400
300
200
100
Ach
ieve
men
t sco
res
ACTQld SAWA TasVicNSW NT Aust
Y712
Y914
Y712
Y914
Y712
Y914
Y712
Y914
Y712
Y914
Y712
Y914
Y712
Y914
Y712
Y914
Y712
Y914
12 = 201214 = 2014
Table R3.7_9: Gain in Reading Achievement for Students from Year 7 to Year 9, by Indigenous Status, by State and Territory, 2010–2012, 2011–2013 and 2012–2014.
NSW Vic Qld WA SA Tas ACT NT Aust
2010-2012 Average gain (with
95% confidence interval)
Indigenous 33.9 ± 7.2
34.3 ± 10.1
33.0 ± 8.1
31.3 ± 10.7
29.6 ± 12.3
33.9 ± 13.8
28.2 ± 21.4
21.1 ± 26.0
32.8 ± 7.0
Non- Indigenous
29.5 ± 6.9
28.3 ± 6.8
28.7 ± 6.5
26.5 ± 7.5
26.8 ± 7.8
26.9 ± 11.4
29.7 ± 13.4
27.7 ± 18.4
28.4 ± 5.9
2011-2013 Average gain (with
95% confidence interval)
Indigenous 45.4 ± 6.7
48.2 ± 8.5
43.2 ± 7.5
40.3 ± 9.2
48.3 ± 9.8
41.5 ± 11.8
34.3 ± 23.4
47.5 ± 24.1
44.8 ± 6.3
Non- Indigenous
41.1 ± 6.4
40.0 ± 6.2
38.1 ± 6.1
38.2 ± 7.3
42.5 ± 7.1
40.8 ± 10.4
37.9 ± 12.4
41.3 ± 17.8
39.9 ± 5.4
2012-2014 Average gain (with
95% confidence interval)
Indigenous 39.3 ± 6.8
36.0 ± 9.0
43.3 ± 7.8
46.4 ± 10.5
38.3 ± 11.3
34.7 ± 12.0
32.9 ± 20.9
40.5 ± 32.6
42.6 ± 6.9
Non- Indigenous
38.8 ± 6.6
37.2 ± 6.4
38.6 ± 6.2
46.7 ± 7.4
36.0 ± 7.5
33.0 ± 11.1
39.3 ± 12.9
41.6 ± 18.6
38.9 ± 5.5
The confidence interval provided is for the specific jurisdictional subgroup gain and should not be used for comparisons between jurisdictions or between subgroups.
Refer to the introduction for explanatory notes and how to read the graph.
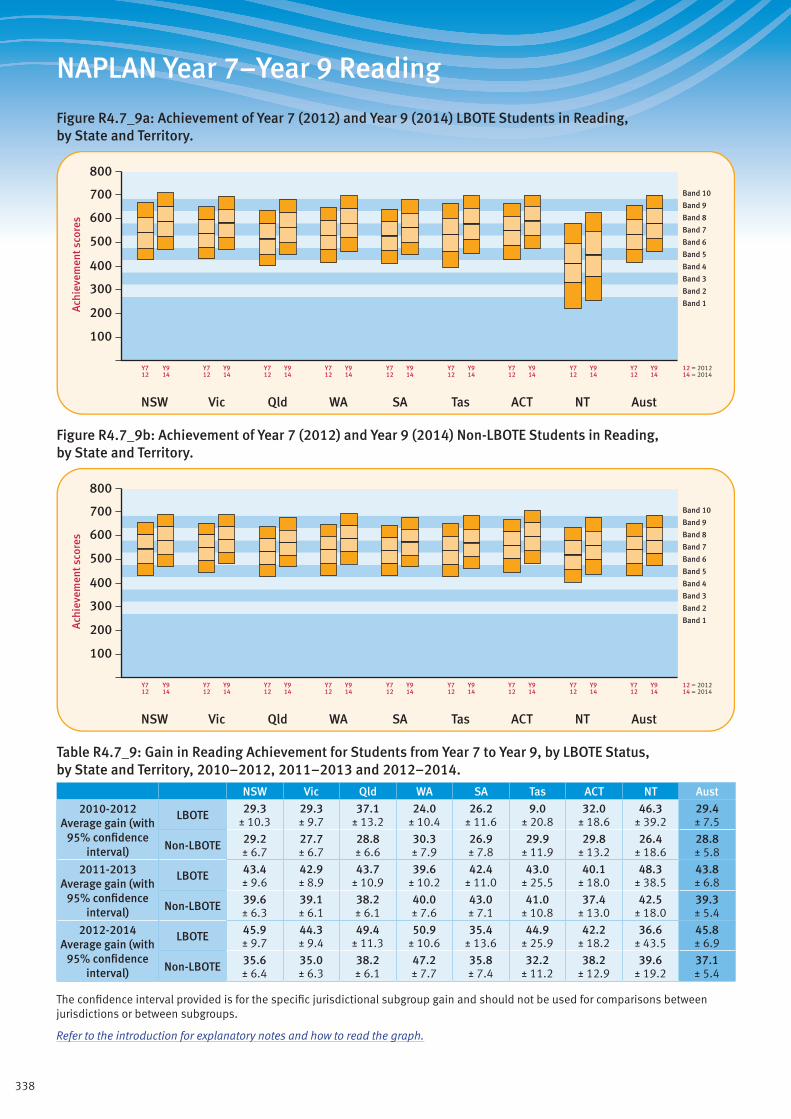
338
NAPLAN Year 7–Year 9 Reading
Figure R4.7_9a: Achievement of Year 7 (2012) and Year 9 (2014) LBOTE Students in Reading, by State and Territory.
Band 1
Band 2
Band 3
Band 4
Band 5
Band 6
Band 7
Band 8
Band 9
Band 10
600
700
800
500
400
300
200
100
Ach
ieve
men
t sco
res
ACTQld SAWA TasVicNSW NT Aust
Y712
Y914
Y712
Y914
Y712
Y914
Y712
Y914
Y712
Y914
Y712
Y914
Y712
Y914
Y712
Y914
Y712
Y914
12 = 201214 = 2014
Figure R4.7_9b: Achievement of Year 7 (2012) and Year 9 (2014) Non-LBOTE Students in Reading, by State and Territory.
Band 1
Band 2
Band 3
Band 4
Band 5
Band 6
Band 7
Band 8
Band 9
Band 10
600
700
800
500
400
300
200
100
Ach
ieve
men
t sco
res
ACTQld SAWA TasVicNSW NT Aust
Y712
Y914
Y712
Y914
Y712
Y914
Y712
Y914
Y712
Y914
Y712
Y914
Y712
Y914
Y712
Y914
Y712
Y914
12 = 201214 = 2014
Table R4.7_9: Gain in Reading Achievement for Students from Year 7 to Year 9, by LBOTE Status, by State and Territory, 2010–2012, 2011–2013 and 2012–2014.
NSW Vic Qld WA SA Tas ACT NT Aust
2010-2012 Average gain (with
95% confidence interval)
LBOTE 29.3 ± 10.3
29.3 ± 9.7
37.1 ± 13.2
24.0 ± 10.4
26.2 ± 11.6
9.0 ± 20.8
32.0 ± 18.6
46.3 ± 39.2
29.4 ± 7.5
Non-LBOTE 29.2 ± 6.7
27.7 ± 6.7
28.8 ± 6.6
30.3 ± 7.9
26.9 ± 7.8
29.9 ± 11.9
29.8 ± 13.2
26.4 ± 18.6
28.8 ± 5.8
2011-2013 Average gain (with
95% confidence interval)
LBOTE 43.4 ± 9.6
42.9 ± 8.9
43.7 ± 10.9
39.6 ± 10.2
42.4 ± 11.0
43.0 ± 25.5
40.1 ± 18.0
48.3 ± 38.5
43.8 ± 6.8
Non-LBOTE 39.6 ± 6.3
39.1 ± 6.1
38.2 ± 6.1
40.0 ± 7.6
43.0 ± 7.1
41.0 ± 10.8
37.4 ± 13.0
42.5 ± 18.0
39.3 ± 5.4
2012-2014 Average gain (with
95% confidence interval)
LBOTE 45.9 ± 9.7
44.3 ± 9.4
49.4 ± 11.3
50.9 ± 10.6
35.4 ± 13.6
44.9 ± 25.9
42.2 ± 18.2
36.6 ± 43.5
45.8 ± 6.9
Non-LBOTE 35.6 ± 6.4
35.0 ± 6.3
38.2 ± 6.1
47.2 ± 7.7
35.8 ± 7.4
32.2 ± 11.2
38.2 ± 12.9
39.6 ± 19.2
37.1 ± 5.4
The confidence interval provided is for the specific jurisdictional subgroup gain and should not be used for comparisons between jurisdictions or between subgroups.
Refer to the introduction for explanatory notes and how to read the graph.
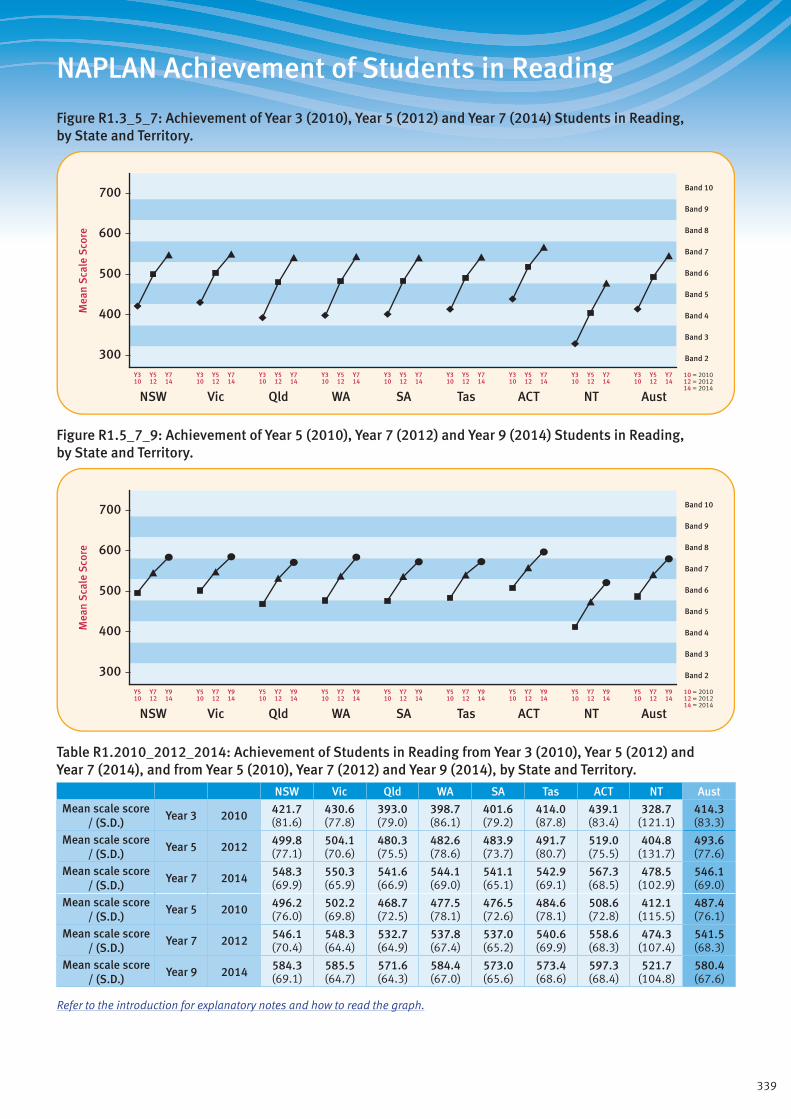
339
NAPLAN Achievement of Students in Reading
Figure R1.3_5_7: Achievement of Year 3 (2010), Year 5 (2012) and Year 7 (2014) Students in Reading, by State and Territory.
Band 2
Band 3
Band 4
Band 5
Band 6
Band 7
Band 8
Band 9
Band 10
Mea
n S
cale
Sco
re
ACTQld SAWA TasVicNSW NT Aust
300
400
500
600
700
Y714
Y512
Y310
Y714
Y512
Y310
Y714
Y512
Y310
Y714
Y512
Y310
Y714
Y512
Y310
Y714
Y512
Y310
Y714
Y512
Y310
Y714
Y512
Y310
Y714
Y512
Y310
10 = 201012 = 201214 = 2014
Figure R1.5_7_9: Achievement of Year 5 (2010), Year 7 (2012) and Year 9 (2014) Students in Reading, by State and Territory.
Band 2
Band 3
Band 4
Band 5
Band 6
Band 7
Band 8
Band 9
Band 10
Mea
n S
cale
Sco
re
ACTQld SAWA TasVicNSW NT Aust
300
400
500
600
700
Y914
Y712
Y510
Y914
Y712
Y510
Y914
Y712
Y510
Y914
Y712
Y510
Y914
Y712
Y510
Y914
Y712
Y510
Y914
Y712
Y510
Y914
Y712
Y510
Y914
Y712
Y510
10 = 201012 = 201214 = 2014
Table R1.2010_2012_2014: Achievement of Students in Reading from Year 3 (2010), Year 5 (2012) and Year 7 (2014), and from Year 5 (2010), Year 7 (2012) and Year 9 (2014), by State and Territory.
NSW Vic Qld WA SA Tas ACT NT AustMean scale score
/ (S.D.)Year 3 2010 421.7
(81.6)430.6 (77.8)
393.0 (79.0)
398.7 (86.1)
401.6 (79.2)
414.0 (87.8)
439.1 (83.4)
328.7 (121.1)
414.3 (83.3)
Mean scale score / (S.D.)
Year 5 2012 499.8 (77.1)
504.1 (70.6)
480.3 (75.5)
482.6 (78.6)
483.9 (73.7)
491.7 (80.7)
519.0 (75.5)
404.8 (131.7)
493.6 (77.6)
Mean scale score / (S.D.)
Year 7 2014 548.3 (69.9)
550.3 (65.9)
541.6 (66.9)
544.1 (69.0)
541.1 (65.1)
542.9 (69.1)
567.3 (68.5)
478.5 (102.9)
546.1 (69.0)
Mean scale score / (S.D.)
Year 5 2010 496.2 (76.0)
502.2 (69.8)
468.7 (72.5)
477.5 (78.1)
476.5 (72.6)
484.6 (78.1)
508.6 (72.8)
412.1 (115.5)
487.4 (76.1)
Mean scale score / (S.D.)
Year 7 2012 546.1 (70.4)
548.3 (64.4)
532.7 (64.9)
537.8 (67.4)
537.0 (65.2)
540.6 (69.9)
558.6 (68.3)
474.3 (107.4)
541.5 (68.3)
Mean scale score / (S.D.)
Year 9 2014 584.3 (69.1)
585.5 (64.7)
571.6 (64.3)
584.4 (67.0)
573.0 (65.6)
573.4 (68.6)
597.3 (68.4)
521.7 (104.8)
580.4 (67.6)
Refer to the introduction for explanatory notes and how to read the graph.

340
NAPLAN Achievement of Students in ReadingFi
gure
R1.
3_5_
7_9:
Ach
ieve
men
t of Y
ear 3
(200
8), Y
ear 5
(201
0), Y
ear 7
(201
2) a
nd Y
ear 9
(201
4) S
tude
nts
in R
eadi
ng, b
y S
tate
and
Ter
rito
ry. Ban
d 2
Ban
d 3
Ban
d 4
Ban
d 5
Ban
d 6
Ban
d 7
Ban
d 8
Ban
d 9
Ban
d 10
Mean Scale Score
ACT
Qld
SAW
ATa
sVi
cN
SW
NT
Aus
t
300
400
500
600
700
Y9 14Y7 12
Y5 10Y3 08
Y9 14Y7 12
Y5 10Y3 08
Y9 14Y7 12
Y5 10Y3 08
Y9 14Y7 12
Y5 10Y3 08
Y9 14Y7 12
Y5 10Y3 08
Y9 14Y7 12
Y5 10Y3 08
Y9 14Y7 12
Y5 10Y3 08
Y9 14Y7 12
Y5 10Y3 08
Y9 14Y7 12
Y5 10Y3 08
08 =
200
810
= 2
010
12 =
201
214
= 2
014
Refe
r to
the
intr
oduc
tion
for e
xpla
nato
ry n
otes
and
how
to re
ad th
e gr
aph.

341
NAPLAN Year 3–Year 5 Numeracy
Figure N1.3_5: Achievement of Year 3 (2012) and Year 5 (2014) Students in Numeracy, by State and Territory.
Band 1
Band 2
Band 3
Band 4
Band 5
Band 6
Band 7
Band 8
Band 9
Band 10
600
700
800
500
400
300
200
100
Ach
ieve
men
t sco
res
ACTQld SAWA TasVicNSW NT Aust
Y312
Y514
Y312
Y514
Y312
Y514
Y312
Y514
Y312
Y514
Y312
Y514
Y312
Y514
Y312
Y514
Y312
Y514
12 = 201214 = 2014
Table N1.3_5: Gain in Numeracy Achievement for Students from Year 3 to Year 5, by State and Territory, 2010–2012, 2011–2013 and 2012–2014.
NSW Vic Qld WA SA Tas ACT NT Aust2010-2012
Average gain (with 95% confidence
interval)
96.7 ± 7.8
87.1 ± 7.8
97.6 ± 8.0
94.7 ± 8.3
92.0 ± 8.4
87.0 ± 9.9
91.8 ± 11.3
88.2 ± 22.4
93.3 ± 7.5
2011-2013 Average gain (with
95% confidence interval)
87.6 ± 7.0
80.2 ± 6.9
96.5 ± 7.0
91.0 ± 7.5
88.0 ± 7.6
78.7 ± 9.2
83.5 ± 11.1
84.1 ± 19.7
87.7 ± 6.6
2012-2014 Average gain (with
95% confidence interval)
88.4 ± 7.6
87.7 ± 7.5
100.8 ± 7.8
96.7 ± 8.2
93.5 ± 8.3
85.8 ± 10.1
87.3 ± 10.0
99.5 ± 21.5
92.1 ± 7.3
The confidence interval provided is for the specific jurisdictional gain and should not be used for comparisons between jurisdictions.
Refer to the introduction for explanatory notes and how to read the graph.

342
NAPLAN Year 3–Year 5 Numeracy
Figure N2.3_5a: Achievement of Year 3 (2012) and Year 5 (2014) Male Students in Numeracy, by State and Territory.
Band 1
Band 2
Band 3
Band 4
Band 5
Band 6
Band 7
Band 8
Band 9
Band 10
600
700
800
500
400
300
200
100
Ach
ieve
men
t sco
res
ACTQld SAWA TasVicNSW NT Aust
Y312
Y514
Y312
Y514
Y312
Y514
Y312
Y514
Y312
Y514
Y312
Y514
Y312
Y514
Y312
Y514
Y312
Y514
12 = 201214 = 2014
Figure N2.3_5b: Achievement of Year 3 (2012) and Year 5 (2014) Female Students in Numeracy, by State and Territory.
Band 1
Band 2
Band 3
Band 4
Band 5
Band 6
Band 7
Band 8
Band 9
Band 10
600
700
800
500
400
300
200
100
Ach
ieve
men
t sco
res
ACTQld SAWA TasVicNSW NT Aust
Y312
Y514
Y312
Y514
Y312
Y514
Y312
Y514
Y312
Y514
Y312
Y514
Y312
Y514
Y312
Y514
Y312
Y514
12 = 201214 = 2014
Table N2.3_5: Gain in Numeracy Achievement for Students from Year 3 to Year 5, by Sex, by State and Territory, 2010–2012, 2011–2013 and 2012–2014.
NSW Vic Qld WA SA Tas ACT NT Aust
2010-2012 Average gain (with
95% confidence interval)
Male 97.5 ± 7.9
87.6 ± 7.9
99.3 ± 8.1
95.6 ± 8.6
92.9 ± 8.7
88.1 ± 10.6
93.9 ± 12.6
88.5 ± 24.8
94.3 ± 7.6
Female 95.8 ± 7.8
86.6 ± 7.8
95.5 ± 8.1
93.7 ± 8.5
90.9 ± 8.6
86.0 ± 10.4
89.3 ± 11.8
88.0 ± 21.0
92.2 ± 7.5
2011-2013 Average gain (with
95% confidence interval)
Male 89.6 ± 7.1
82.0 ± 7.0
98.6 ± 7.1
92.7 ± 7.8
89.9 ± 7.9
80.9 ± 9.9
84.5 ± 12.7
85.7 ± 21.2
89.6 ± 6.6
Female 85.5 ± 7.0
78.5 ± 6.9
94.1 ± 7.0
89.1 ± 7.5
86.2 ± 7.7
76.4 ± 9.6
82.7 ± 12.3
82.7 ± 19.1
85.7 ± 6.6
2012-2014 Average gain (with
95% confidence interval)
Male 90.2 ± 7.8
88.8 ± 7.6
102.7 ± 7.9
98.5 ± 8.5
94.8 ± 8.6
89.0 ± 10.7
87.7 ± 10.8
104.2 ± 22.3
93.8 ± 7.4
Female 86.6 ± 7.6
86.6 ± 7.6
98.7 ± 7.8
94.6 ± 8.2
92.1 ± 8.4
82.5 ± 10.5
86.9 ± 10.7
95.0 ± 21.7
90.5 ± 7.3
The confidence interval provided is for the specific jurisdictional subgroup gain and should not be used for comparisons between jurisdictions or between subgroups.
Refer to the introduction for explanatory notes and how to read the graph.
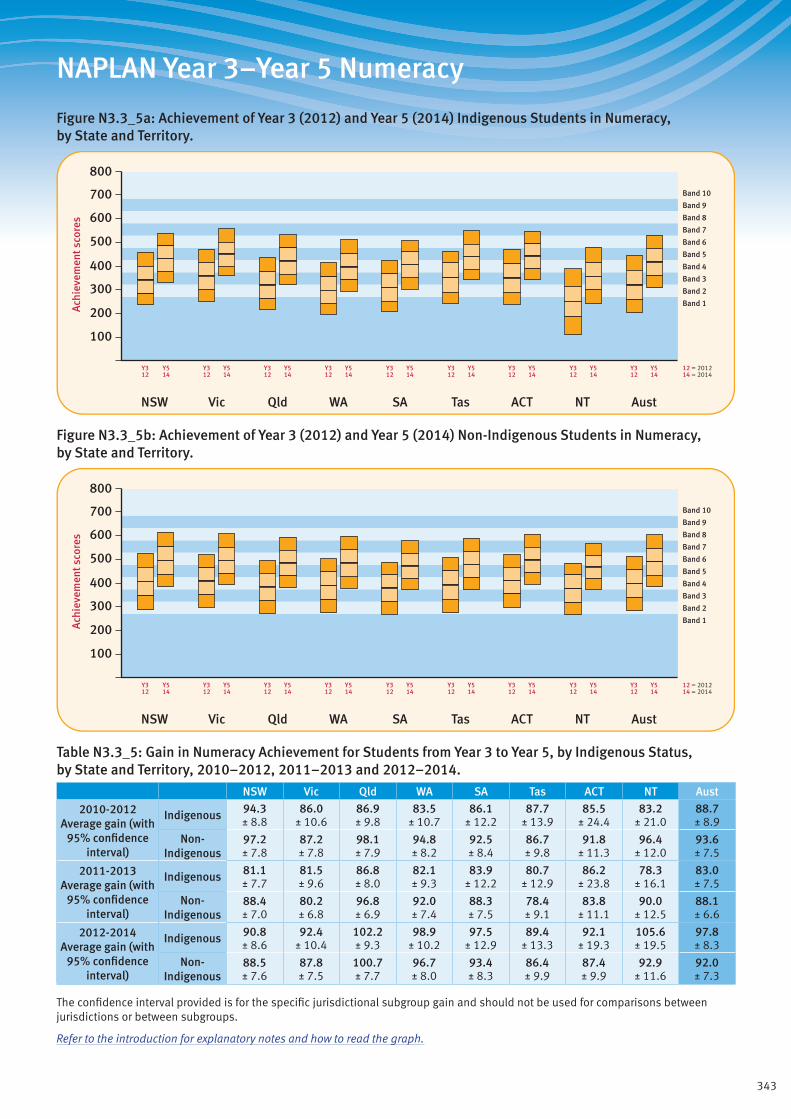
343
NAPLAN Year 3–Year 5 Numeracy
Figure N3.3_5a: Achievement of Year 3 (2012) and Year 5 (2014) Indigenous Students in Numeracy, by State and Territory.
Band 1
Band 2
Band 3
Band 4
Band 5
Band 6
Band 7
Band 8
Band 9
Band 10
600
700
800
500
400
300
200
100
Ach
ieve
men
t sco
res
ACTQld SAWA TasVicNSW NT Aust
Y312
Y514
Y312
Y514
Y312
Y514
Y312
Y514
Y312
Y514
Y312
Y514
Y312
Y514
Y312
Y514
Y312
Y514
12 = 201214 = 2014
Figure N3.3_5b: Achievement of Year 3 (2012) and Year 5 (2014) Non-Indigenous Students in Numeracy, by State and Territory.
Band 1
Band 2
Band 3
Band 4
Band 5
Band 6
Band 7
Band 8
Band 9
Band 10
600
700
800
500
400
300
200
100
Ach
ieve
men
t sco
res
ACTQld SAWA TasVicNSW NT Aust
Y312
Y514
Y312
Y514
Y312
Y514
Y312
Y514
Y312
Y514
Y312
Y514
Y312
Y514
Y312
Y514
Y312
Y514
12 = 201214 = 2014
Table N3.3_5: Gain in Numeracy Achievement for Students from Year 3 to Year 5, by Indigenous Status, by State and Territory, 2010–2012, 2011–2013 and 2012–2014.
NSW Vic Qld WA SA Tas ACT NT Aust
2010-2012 Average gain (with
95% confidence interval)
Indigenous 94.3 ± 8.8
86.0 ± 10.6
86.9 ± 9.8
83.5 ± 10.7
86.1 ± 12.2
87.7 ± 13.9
85.5 ± 24.4
83.2 ± 21.0
88.7 ± 8.9
Non- Indigenous
97.2 ± 7.8
87.2 ± 7.8
98.1 ± 7.9
94.8 ± 8.2
92.5 ± 8.4
86.7 ± 9.8
91.8 ± 11.3
96.4 ± 12.0
93.6 ± 7.5
2011-2013 Average gain (with
95% confidence interval)
Indigenous 81.1 ± 7.7
81.5 ± 9.6
86.8 ± 8.0
82.1 ± 9.3
83.9 ± 12.2
80.7 ± 12.9
86.2 ± 23.8
78.3 ± 16.1
83.0 ± 7.5
Non- Indigenous
88.4 ± 7.0
80.2 ± 6.8
96.8 ± 6.9
92.0 ± 7.4
88.3 ± 7.5
78.4 ± 9.1
83.8 ± 11.1
90.0 ± 12.5
88.1 ± 6.6
2012-2014 Average gain (with
95% confidence interval)
Indigenous 90.8 ± 8.6
92.4 ± 10.4
102.2 ± 9.3
98.9 ± 10.2
97.5 ± 12.9
89.4 ± 13.3
92.1 ± 19.3
105.6 ± 19.5
97.8 ± 8.3
Non- Indigenous
88.5 ± 7.6
87.8 ± 7.5
100.7 ± 7.7
96.7 ± 8.0
93.4 ± 8.3
86.4 ± 9.9
87.4 ± 9.9
92.9 ± 11.6
92.0 ± 7.3
The confidence interval provided is for the specific jurisdictional subgroup gain and should not be used for comparisons between jurisdictions or between subgroups.
Refer to the introduction for explanatory notes and how to read the graph.
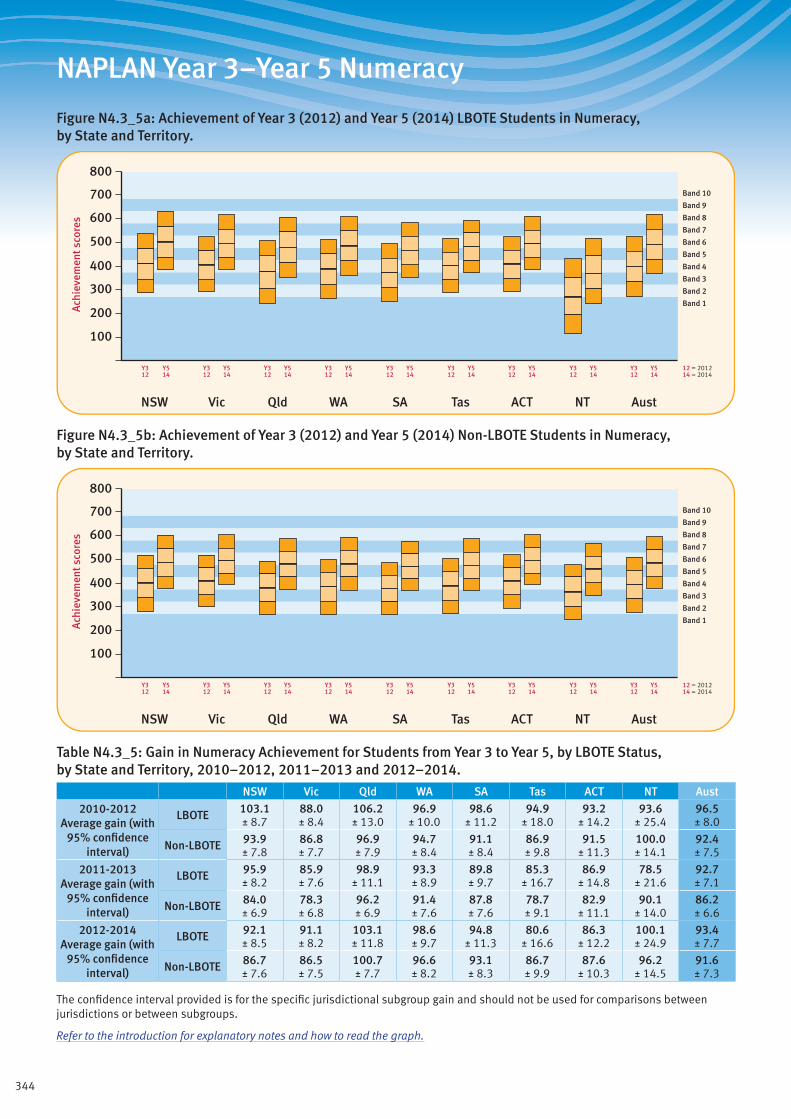
344
NAPLAN Year 3–Year 5 Numeracy
Figure N4.3_5a: Achievement of Year 3 (2012) and Year 5 (2014) LBOTE Students in Numeracy, by State and Territory.
Band 1
Band 2
Band 3
Band 4
Band 5
Band 6
Band 7
Band 8
Band 9
Band 10
600
700
800
500
400
300
200
100
Ach
ieve
men
t sco
res
ACTQld SAWA TasVicNSW NT Aust
Y312
Y514
Y312
Y514
Y312
Y514
Y312
Y514
Y312
Y514
Y312
Y514
Y312
Y514
Y312
Y514
Y312
Y514
12 = 201214 = 2014
Figure N4.3_5b: Achievement of Year 3 (2012) and Year 5 (2014) Non-LBOTE Students in Numeracy, by State and Territory.
Band 1
Band 2
Band 3
Band 4
Band 5
Band 6
Band 7
Band 8
Band 9
Band 10
600
700
800
500
400
300
200
100
Ach
ieve
men
t sco
res
ACTQld SAWA TasVicNSW NT Aust
Y312
Y514
Y312
Y514
Y312
Y514
Y312
Y514
Y312
Y514
Y312
Y514
Y312
Y514
Y312
Y514
Y312
Y514
12 = 201214 = 2014
Table N4.3_5: Gain in Numeracy Achievement for Students from Year 3 to Year 5, by LBOTE Status, by State and Territory, 2010–2012, 2011–2013 and 2012–2014.
NSW Vic Qld WA SA Tas ACT NT Aust
2010-2012 Average gain (with
95% confidence interval)
LBOTE 103.1 ± 8.7
88.0 ± 8.4
106.2 ± 13.0
96.9 ± 10.0
98.6 ± 11.2
94.9 ± 18.0
93.2 ± 14.2
93.6 ± 25.4
96.5 ± 8.0
Non-LBOTE 93.9 ± 7.8
86.8 ± 7.7
96.9 ± 7.9
94.7 ± 8.4
91.1 ± 8.4
86.9 ± 9.8
91.5 ± 11.3
100.0 ± 14.1
92.4 ± 7.5
2011-2013 Average gain (with
95% confidence interval)
LBOTE 95.9 ± 8.2
85.9 ± 7.6
98.9 ± 11.1
93.3 ± 8.9
89.8 ± 9.7
85.3 ± 16.7
86.9 ± 14.8
78.5 ± 21.6
92.7 ± 7.1
Non-LBOTE 84.0 ± 6.9
78.3 ± 6.8
96.2 ± 6.9
91.4 ± 7.6
87.8 ± 7.6
78.7 ± 9.1
82.9 ± 11.1
90.1 ± 14.0
86.2 ± 6.6
2012-2014 Average gain (with
95% confidence interval)
LBOTE 92.1 ± 8.5
91.1 ± 8.2
103.1 ± 11.8
98.6 ± 9.7
94.8 ± 11.3
80.6 ± 16.6
86.3 ± 12.2
100.1 ± 24.9
93.4 ± 7.7
Non-LBOTE 86.7 ± 7.6
86.5 ± 7.5
100.7 ± 7.7
96.6 ± 8.2
93.1 ± 8.3
86.7 ± 9.9
87.6 ± 10.3
96.2 ± 14.5
91.6 ± 7.3
The confidence interval provided is for the specific jurisdictional subgroup gain and should not be used for comparisons between jurisdictions or between subgroups.
Refer to the introduction for explanatory notes and how to read the graph.
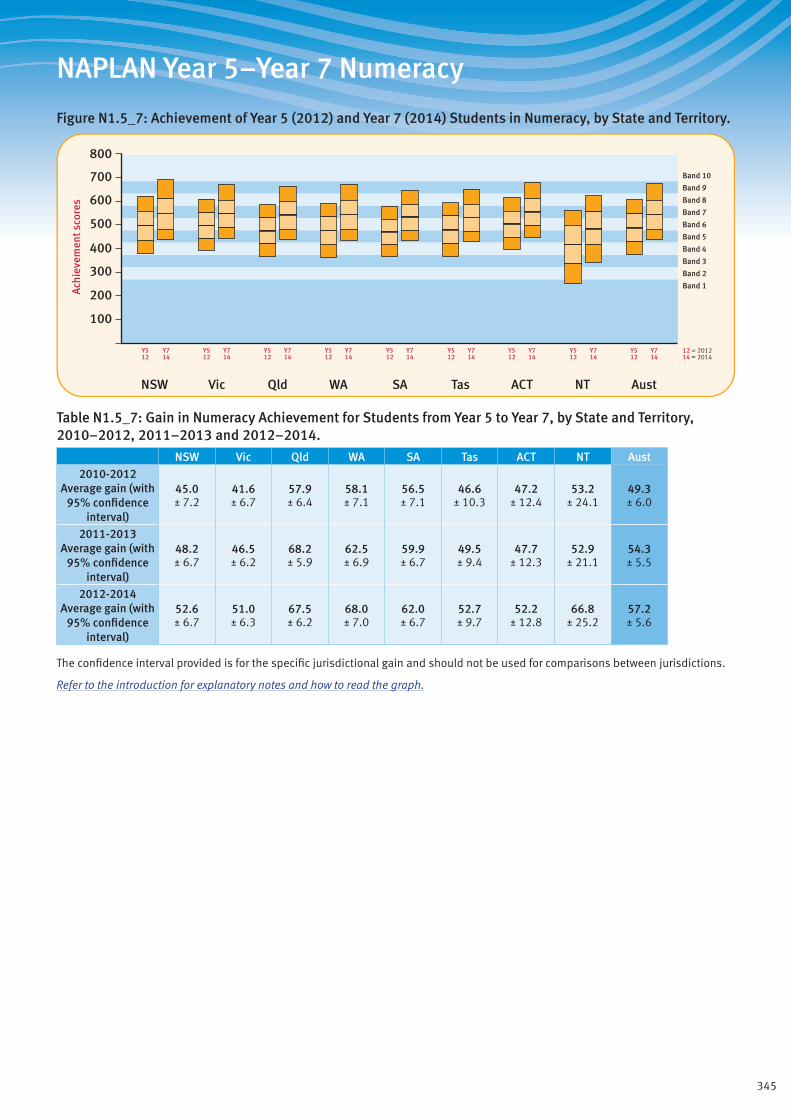
345
NAPLAN Year 5–Year 7 Numeracy
Figure N1.5_7: Achievement of Year 5 (2012) and Year 7 (2014) Students in Numeracy, by State and Territory.
Band 1
Band 2
Band 3
Band 4
Band 5
Band 6
Band 7
Band 8
Band 9
Band 10
600
700
800
500
400
300
200
100
Ach
ieve
men
t sco
res
ACTQld SAWA TasVicNSW NT Aust
Y512
Y714
Y512
Y714
Y512
Y714
Y512
Y714
Y512
Y714
Y512
Y714
Y512
Y714
Y512
Y714
Y512
Y714
12 = 201214 = 2014
Table N1.5_7: Gain in Numeracy Achievement for Students from Year 5 to Year 7, by State and Territory, 2010–2012, 2011–2013 and 2012–2014.
NSW Vic Qld WA SA Tas ACT NT Aust2010-2012
Average gain (with 95% confidence
interval)
45.0 ± 7.2
41.6 ± 6.7
57.9 ± 6.4
58.1 ± 7.1
56.5 ± 7.1
46.6 ± 10.3
47.2 ± 12.4
53.2 ± 24.1
49.3 ± 6.0
2011-2013 Average gain (with
95% confidence interval)
48.2 ± 6.7
46.5 ± 6.2
68.2 ± 5.9
62.5 ± 6.9
59.9 ± 6.7
49.5 ± 9.4
47.7 ± 12.3
52.9 ± 21.1
54.3 ± 5.5
2012-2014 Average gain (with
95% confidence interval)
52.6 ± 6.7
51.0 ± 6.3
67.5 ± 6.2
68.0 ± 7.0
62.0 ± 6.7
52.7 ± 9.7
52.2 ± 12.8
66.8 ± 25.2
57.2 ± 5.6
The confidence interval provided is for the specific jurisdictional gain and should not be used for comparisons between jurisdictions.
Refer to the introduction for explanatory notes and how to read the graph.
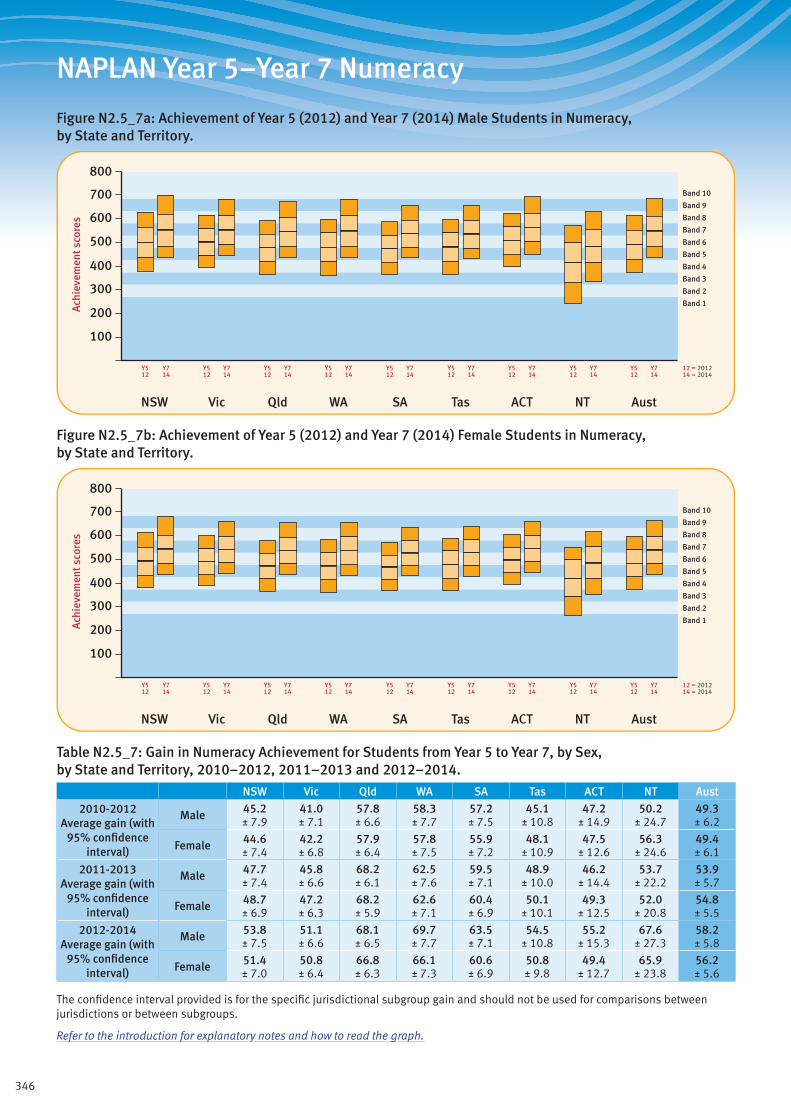
346
NAPLAN Year 5–Year 7 Numeracy
Figure N2.5_7a: Achievement of Year 5 (2012) and Year 7 (2014) Male Students in Numeracy, by State and Territory.
Band 1
Band 2
Band 3
Band 4
Band 5
Band 6
Band 7
Band 8
Band 9
Band 10
600
700
800
500
400
300
200
100
Ach
ieve
men
t sco
res
ACTQld SAWA TasVicNSW NT Aust
Y512
Y714
Y512
Y714
Y512
Y714
Y512
Y714
Y512
Y714
Y512
Y714
Y512
Y714
Y512
Y714
Y512
Y714
12 = 201214 = 2014
Figure N2.5_7b: Achievement of Year 5 (2012) and Year 7 (2014) Female Students in Numeracy, by State and Territory.
Band 1
Band 2
Band 3
Band 4
Band 5
Band 6
Band 7
Band 8
Band 9
Band 10
600
700
800
500
400
300
200
100
Ach
ieve
men
t sco
res
ACTQld SAWA TasVicNSW NT Aust
Y512
Y714
Y512
Y714
Y512
Y714
Y512
Y714
Y512
Y714
Y512
Y714
Y512
Y714
Y512
Y714
Y512
Y714
12 = 201214 = 2014
Table N2.5_7: Gain in Numeracy Achievement for Students from Year 5 to Year 7, by Sex, by State and Territory, 2010–2012, 2011–2013 and 2012–2014.
NSW Vic Qld WA SA Tas ACT NT Aust
2010-2012 Average gain (with
95% confidence interval)
Male 45.2 ± 7.9
41.0 ± 7.1
57.8 ± 6.6
58.3 ± 7.7
57.2 ± 7.5
45.1 ± 10.8
47.2 ± 14.9
50.2 ± 24.7
49.3 ± 6.2
Female 44.6 ± 7.4
42.2 ± 6.8
57.9 ± 6.4
57.8 ± 7.5
55.9 ± 7.2
48.1 ± 10.9
47.5 ± 12.6
56.3 ± 24.6
49.4 ± 6.1
2011-2013 Average gain (with
95% confidence interval)
Male 47.7 ± 7.4
45.8 ± 6.6
68.2 ± 6.1
62.5 ± 7.6
59.5 ± 7.1
48.9 ± 10.0
46.2 ± 14.4
53.7 ± 22.2
53.9 ± 5.7
Female 48.7 ± 6.9
47.2 ± 6.3
68.2 ± 5.9
62.6 ± 7.1
60.4 ± 6.9
50.1 ± 10.1
49.3 ± 12.5
52.0 ± 20.8
54.8 ± 5.5
2012-2014 Average gain (with
95% confidence interval)
Male 53.8 ± 7.5
51.1 ± 6.6
68.1 ± 6.5
69.7 ± 7.7
63.5 ± 7.1
54.5 ± 10.8
55.2 ± 15.3
67.6 ± 27.3
58.2 ± 5.8
Female 51.4 ± 7.0
50.8 ± 6.4
66.8 ± 6.3
66.1 ± 7.3
60.6 ± 6.9
50.8 ± 9.8
49.4 ± 12.7
65.9 ± 23.8
56.2 ± 5.6
The confidence interval provided is for the specific jurisdictional subgroup gain and should not be used for comparisons between jurisdictions or between subgroups.
Refer to the introduction for explanatory notes and how to read the graph.

347
NAPLAN Year 5–Year 7 Numeracy
Figure N3.5_7a: Achievement of Year 5 (2012) and Year 7 (2014) Indigenous Students in Numeracy, by State and Territory.
Band 1
Band 2
Band 3
Band 4
Band 5
Band 6
Band 7
Band 8
Band 9
Band 10
600
700
800
500
400
300
200
100
Ach
ieve
men
t sco
res
ACTQld SAWA TasVicNSW NT Aust
Y512
Y714
Y512
Y714
Y512
Y714
Y512
Y714
Y512
Y714
Y512
Y714
Y512
Y714
Y512
Y714
Y512
Y714
12 = 201214 = 2014
Figure N3.5_7b: Achievement of Year 5 (2012) and Year 7 (2014) Non-Indigenous Students in Numeracy, by State and Territory.
Band 1
Band 2
Band 3
Band 4
Band 5
Band 6
Band 7
Band 8
Band 9
Band 10
600
700
800
500
400
300
200
100
Ach
ieve
men
t sco
res
ACTQld SAWA TasVicNSW NT Aust
Y512
Y714
Y512
Y714
Y512
Y714
Y512
Y714
Y512
Y714
Y512
Y714
Y512
Y714
Y512
Y714
Y512
Y714
12 = 201214 = 2014
Table N3.5_7: Gain in Numeracy Achievement for Students from Year 5 to Year 7, by Indigenous Status, by State and Territory, 2010–2012, 2011–2013 and 2012–2014.
NSW Vic Qld WA SA Tas ACT NT Aust
2010-2012 Average gain (with
95% confidence interval)
Indigenous 41.6 ± 7.2
37.6 ± 9.7
56.4 ± 8.2
63.0 ± 9.7
57.9 ± 10.9
41.0 ± 12.3
58.4 ± 18.6
58.5 ± 20.6
52.5 ± 7.1
Non- Indigenous
45.6 ± 7.2
42.1 ± 6.7
57.6 ± 6.3
57.3 ± 7.0
56.6 ± 7.1
45.8 ± 9.9
47.0 ± 12.3
50.0 ± 15.2
49.2 ± 6.0
2011-2013 Average gain (with
95% confidence interval)
Indigenous 45.7 ± 6.8
38.2 ± 9.7
63.0 ± 7.0
62.4 ± 9.0
56.9 ± 10.1
46.5 ± 10.5
54.0 ± 21.6
50.9 ± 18.3
54.6 ± 6.4
Non- Indigenous
48.9 ± 6.7
46.7 ± 6.2
68.0 ± 5.8
62.6 ± 6.7
60.5 ± 6.6
49.9 ± 9.1
48.3 ± 12.2
53.9 ± 12.6
54.5 ± 5.5
2012-2014 Average gain (with
95% confidence interval)
Indigenous 52.4 ± 6.9
45.2 ± 8.8
73.5 ± 8.2
74.0 ± 9.1
65.5 ± 10.9
51.2 ± 11.8
56.8 ± 24.6
73.3 ± 21.1
64.5 ± 7.0
Non- Indigenous
52.9 ± 6.7
51.2 ± 6.2
67.1 ± 6.1
67.8 ± 6.9
62.0 ± 6.7
53.7 ± 9.6
52.7 ± 12.6
54.4 ± 15.0
57.1 ± 5.6
The confidence interval provided is for the specific jurisdictional subgroup gain and should not be used for comparisons between jurisdictions or between subgroups.
Refer to the introduction for explanatory notes and how to read the graph.

348
NAPLAN Year 5–Year 7 Numeracy
Figure N4.5_7a: Achievement of Year 5 (2012) and Year 7 (2014) LBOTE Students in Numeracy, by State and Territory.
Band 1
Band 2
Band 3
Band 4
Band 5
Band 6
Band 7
Band 8
Band 9
Band 10
600
700
800
500
400
300
200
100
Ach
ieve
men
t sco
res
ACTQld SAWA TasVicNSW NT Aust
Y512
Y714
Y512
Y714
Y512
Y714
Y512
Y714
Y512
Y714
Y512
Y714
Y512
Y714
Y512
Y714
Y512
Y714
12 = 201214 = 2014
Figure N4.5_7b: Achievement of Year 5 (2012) and Year 7 (2014) Non-LBOTE Students in Numeracy, by State and Territory.
Band 1
Band 2
Band 3
Band 4
Band 5
Band 6
Band 7
Band 8
Band 9
Band 10
600
700
800
500
400
300
200
100
Ach
ieve
men
t sco
res
ACTQld SAWA TasVicNSW NT Aust
Y512
Y714
Y512
Y714
Y512
Y714
Y512
Y714
Y512
Y714
Y512
Y714
Y512
Y714
Y512
Y714
Y512
Y714
12 = 201214 = 2014
Table N4.5_7: Gain in Numeracy Achievement for Students from Year 5 to Year 7, by LBOTE Status, by State and Territory, 2010–2012, 2011–2013 and 2012–2014.
NSW Vic Qld WA SA Tas ACT NT Aust
2010-2012 Average gain (with
95% confidence interval)
LBOTE 51.0 ± 10.9
42.5 ± 8.7
69.1 ± 11.9
60.8 ± 9.1
63.5 ± 10.4
43.5 ± 22.8
50.3 ± 18.8
69.4 ± 29.7
51.2 ± 7.6
Non-LBOTE 42.7 ± 6.7
41.6 ± 6.6
56.9 ± 6.3
57.2 ± 7.3
55.4 ± 7.0
46.8 ± 10.0
46.7 ± 12.0
47.1 ± 14.9
48.8 ± 6.0
2011-2013 Average gain (with
95% confidence interval)
LBOTE 53.9 ± 10.4
52.6 ± 8.1
74.8 ± 11.3
68.3 ± 9.1
64.0 ± 9.4
47.0 ± 19.7
53.5 ± 18.5
49.2 ± 26.0
57.6 ± 7.0
Non-LBOTE 45.6 ± 6.2
44.5 ± 6.1
67.5 ± 5.8
61.4 ± 7.0
59.9 ± 6.6
49.5 ± 9.1
46.5 ± 11.6
53.0 ± 14.2
53.4 ± 5.4
2012-2014 Average gain (with
95% confidence interval)
LBOTE 61.4 ± 10.4
59.4 ± 8.1
76.4 ± 11.1
75.6 ± 8.9
68.9 ± 11.1
50.3 ± 21.4
54.3 ± 16.1
67.5 ± 28.9
63.8 ± 7.1
Non-LBOTE 49.2 ± 6.3
48.3 ± 6.1
66.5 ± 6.1
66.8 ± 7.2
61.0 ± 6.7
52.8 ± 9.6
51.7 ± 12.9
51.3 ± 16.9
55.1 ± 5.5
The confidence interval provided is for the specific jurisdictional subgroup gain and should not be used for comparisons between jurisdictions or between subgroups.
Refer to the introduction for explanatory notes and how to read the graph.

349
NAPLAN Year 7–Year 9 Numeracy
Figure N1.7_9: Achievement of Year 7 (2012) and Year 9 (2014) Students in Numeracy, by State and Territory.
Band 1
Band 2
Band 3
Band 4
Band 5
Band 6
Band 7
Band 8
Band 9
Band 10
600
700
800
500
400
300
200
100
Ach
ieve
men
t sco
res
ACTQld SAWA TasVicNSW NT Aust
Y712
Y914
Y712
Y914
Y712
Y914
Y712
Y914
Y712
Y914
Y712
Y914
Y712
Y914
Y712
Y914
Y712
Y914
12 = 201214 = 2014
Table N1.7_9: Gain in Numeracy Achievement for Students from Year 7 to Year 9, by State and Territory, 2010–2012, 2011–2013 and 2012–2014.
NSW Vic Qld WA SA Tas ACT NT Aust2010-2012
Average gain (with 95% confidence
interval)
41.0 ± 7.1
37.1 ± 6.8
28.4 ± 6.1
36.2 ± 7.9
34.8 ± 8.0
36.9 ± 11.1
40.3 ± 13.9
45.5 ± 23.6
36.4 ± 5.3
2011-2013 Average gain (with
95% confidence interval)
43.3 ± 7.4
37.5 ± 6.8
34.5 ± 6.3
39.8 ± 8.6
36.8 ± 8.3
33.3 ± 11.3
41.4 ± 16.6
42.0 ± 25.4
39.0 ± 5.2
2012-2014 Average gain (with
95% confidence interval)
50.9 ± 6.7
48.0 ± 6.3
47.8 ± 5.6
56.2 ± 7.6
44.5 ± 7.3
46.8 ± 10.8
48.5 ± 14.3
57.3 ± 25.5
49.7 ± 4.7
The confidence interval provided is for the specific jurisdictional gain and should not be used for comparisons between jurisdictions.
Refer to the introduction for explanatory notes and how to read the graph.
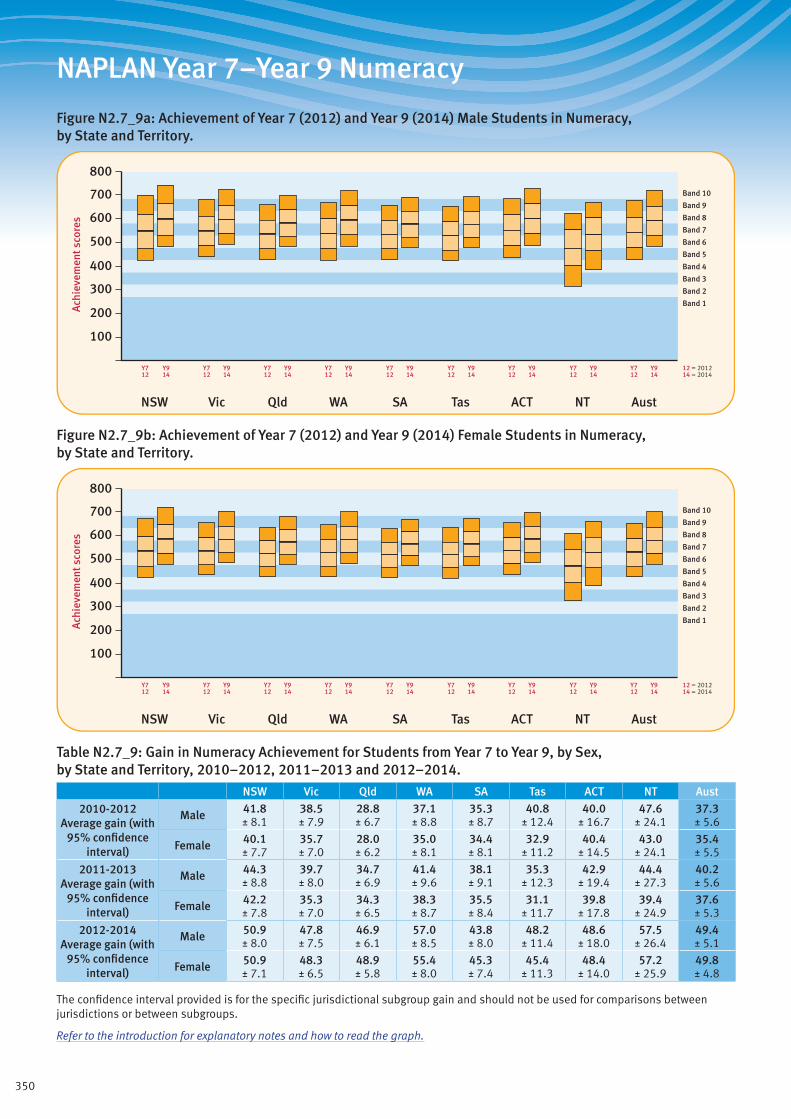
350
NAPLAN Year 7–Year 9 Numeracy
Figure N2.7_9a: Achievement of Year 7 (2012) and Year 9 (2014) Male Students in Numeracy, by State and Territory.
Band 1
Band 2
Band 3
Band 4
Band 5
Band 6
Band 7
Band 8
Band 9
Band 10
600
700
800
500
400
300
200
100
Ach
ieve
men
t sco
res
ACTQld SAWA TasVicNSW NT Aust
Y712
Y914
Y712
Y914
Y712
Y914
Y712
Y914
Y712
Y914
Y712
Y914
Y712
Y914
Y712
Y914
Y712
Y914
12 = 201214 = 2014
Figure N2.7_9b: Achievement of Year 7 (2012) and Year 9 (2014) Female Students in Numeracy, by State and Territory.
Band 1
Band 2
Band 3
Band 4
Band 5
Band 6
Band 7
Band 8
Band 9
Band 10
600
700
800
500
400
300
200
100
Ach
ieve
men
t sco
res
ACTQld SAWA TasVicNSW NT Aust
Y712
Y914
Y712
Y914
Y712
Y914
Y712
Y914
Y712
Y914
Y712
Y914
Y712
Y914
Y712
Y914
Y712
Y914
12 = 201214 = 2014
Table N2.7_9: Gain in Numeracy Achievement for Students from Year 7 to Year 9, by Sex, by State and Territory, 2010–2012, 2011–2013 and 2012–2014.
NSW Vic Qld WA SA Tas ACT NT Aust
2010-2012 Average gain (with
95% confidence interval)
Male 41.8 ± 8.1
38.5 ± 7.9
28.8 ± 6.7
37.1 ± 8.8
35.3 ± 8.7
40.8 ± 12.4
40.0 ± 16.7
47.6 ± 24.1
37.3 ± 5.6
Female 40.1 ± 7.7
35.7 ± 7.0
28.0 ± 6.2
35.0 ± 8.1
34.4 ± 8.1
32.9 ± 11.2
40.4 ± 14.5
43.0 ± 24.1
35.4 ± 5.5
2011-2013 Average gain (with
95% confidence interval)
Male 44.3 ± 8.8
39.7 ± 8.0
34.7 ± 6.9
41.4 ± 9.6
38.1 ± 9.1
35.3 ± 12.3
42.9 ± 19.4
44.4 ± 27.3
40.2 ± 5.6
Female 42.2 ± 7.8
35.3 ± 7.0
34.3 ± 6.5
38.3 ± 8.7
35.5 ± 8.4
31.1 ± 11.7
39.8 ± 17.8
39.4 ± 24.9
37.6 ± 5.3
2012-2014 Average gain (with
95% confidence interval)
Male 50.9 ± 8.0
47.8 ± 7.5
46.9 ± 6.1
57.0 ± 8.5
43.8 ± 8.0
48.2 ± 11.4
48.6 ± 18.0
57.5 ± 26.4
49.4 ± 5.1
Female 50.9 ± 7.1
48.3 ± 6.5
48.9 ± 5.8
55.4 ± 8.0
45.3 ± 7.4
45.4 ± 11.3
48.4 ± 14.0
57.2 ± 25.9
49.8 ± 4.8
The confidence interval provided is for the specific jurisdictional subgroup gain and should not be used for comparisons between jurisdictions or between subgroups.
Refer to the introduction for explanatory notes and how to read the graph.
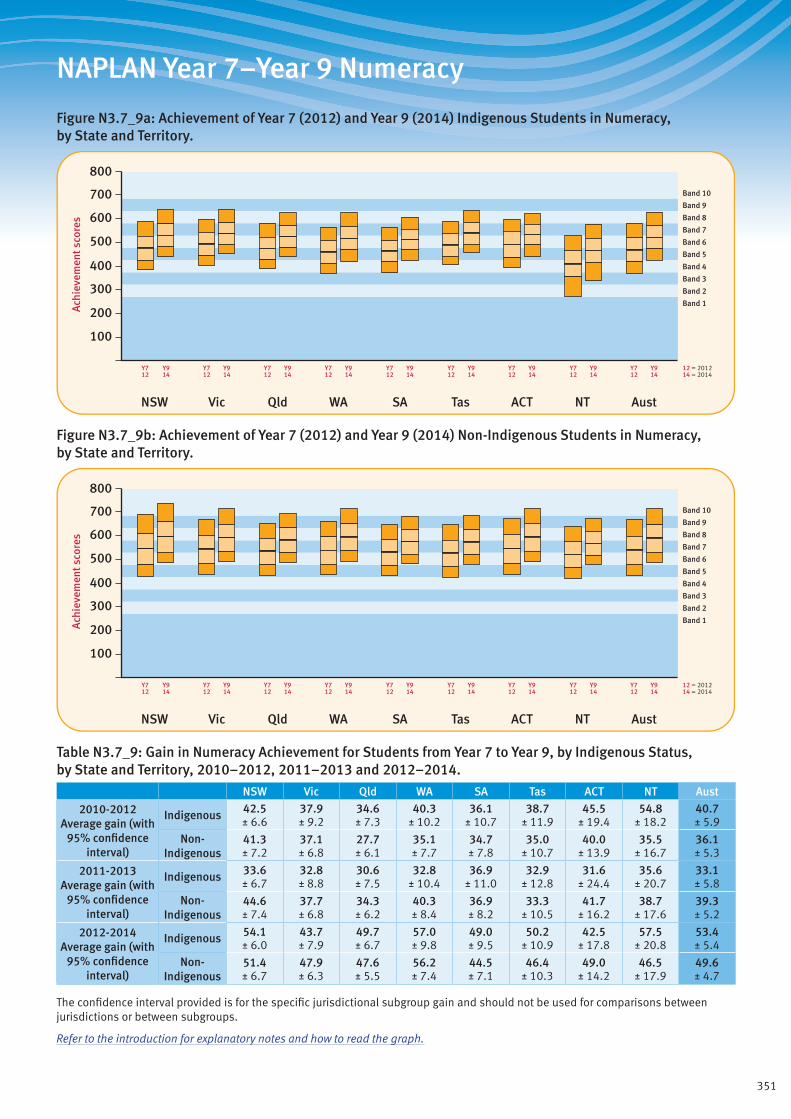
351
NAPLAN Year 7–Year 9 Numeracy
Figure N3.7_9a: Achievement of Year 7 (2012) and Year 9 (2014) Indigenous Students in Numeracy, by State and Territory.
Band 1
Band 2
Band 3
Band 4
Band 5
Band 6
Band 7
Band 8
Band 9
Band 10
600
700
800
500
400
300
200
100
Ach
ieve
men
t sco
res
ACTQld SAWA TasVicNSW NT Aust
Y712
Y914
Y712
Y914
Y712
Y914
Y712
Y914
Y712
Y914
Y712
Y914
Y712
Y914
Y712
Y914
Y712
Y914
12 = 201214 = 2014
Figure N3.7_9b: Achievement of Year 7 (2012) and Year 9 (2014) Non-Indigenous Students in Numeracy, by State and Territory.
Band 1
Band 2
Band 3
Band 4
Band 5
Band 6
Band 7
Band 8
Band 9
Band 10
600
700
800
500
400
300
200
100
Ach
ieve
men
t sco
res
ACTQld SAWA TasVicNSW NT Aust
Y712
Y914
Y712
Y914
Y712
Y914
Y712
Y914
Y712
Y914
Y712
Y914
Y712
Y914
Y712
Y914
Y712
Y914
12 = 201214 = 2014
Table N3.7_9: Gain in Numeracy Achievement for Students from Year 7 to Year 9, by Indigenous Status, by State and Territory, 2010–2012, 2011–2013 and 2012–2014.
NSW Vic Qld WA SA Tas ACT NT Aust
2010-2012 Average gain (with
95% confidence interval)
Indigenous 42.5 ± 6.6
37.9 ± 9.2
34.6 ± 7.3
40.3 ± 10.2
36.1 ± 10.7
38.7 ± 11.9
45.5 ± 19.4
54.8 ± 18.2
40.7 ± 5.9
Non- Indigenous
41.3 ± 7.2
37.1 ± 6.8
27.7 ± 6.1
35.1 ± 7.7
34.7 ± 7.8
35.0 ± 10.7
40.0 ± 13.9
35.5 ± 16.7
36.1 ± 5.3
2011-2013 Average gain (with
95% confidence interval)
Indigenous 33.6 ± 6.7
32.8 ± 8.8
30.6 ± 7.5
32.8 ± 10.4
36.9 ± 11.0
32.9 ± 12.8
31.6 ± 24.4
35.6 ± 20.7
33.1 ± 5.8
Non- Indigenous
44.6 ± 7.4
37.7 ± 6.8
34.3 ± 6.2
40.3 ± 8.4
36.9 ± 8.2
33.3 ± 10.5
41.7 ± 16.2
38.7 ± 17.6
39.3 ± 5.2
2012-2014 Average gain (with
95% confidence interval)
Indigenous 54.1 ± 6.0
43.7 ± 7.9
49.7 ± 6.7
57.0 ± 9.8
49.0 ± 9.5
50.2 ± 10.9
42.5 ± 17.8
57.5 ± 20.8
53.4 ± 5.4
Non- Indigenous
51.4 ± 6.7
47.9 ± 6.3
47.6 ± 5.5
56.2 ± 7.4
44.5 ± 7.1
46.4 ± 10.3
49.0 ± 14.2
46.5 ± 17.9
49.6 ± 4.7
The confidence interval provided is for the specific jurisdictional subgroup gain and should not be used for comparisons between jurisdictions or between subgroups.
Refer to the introduction for explanatory notes and how to read the graph.
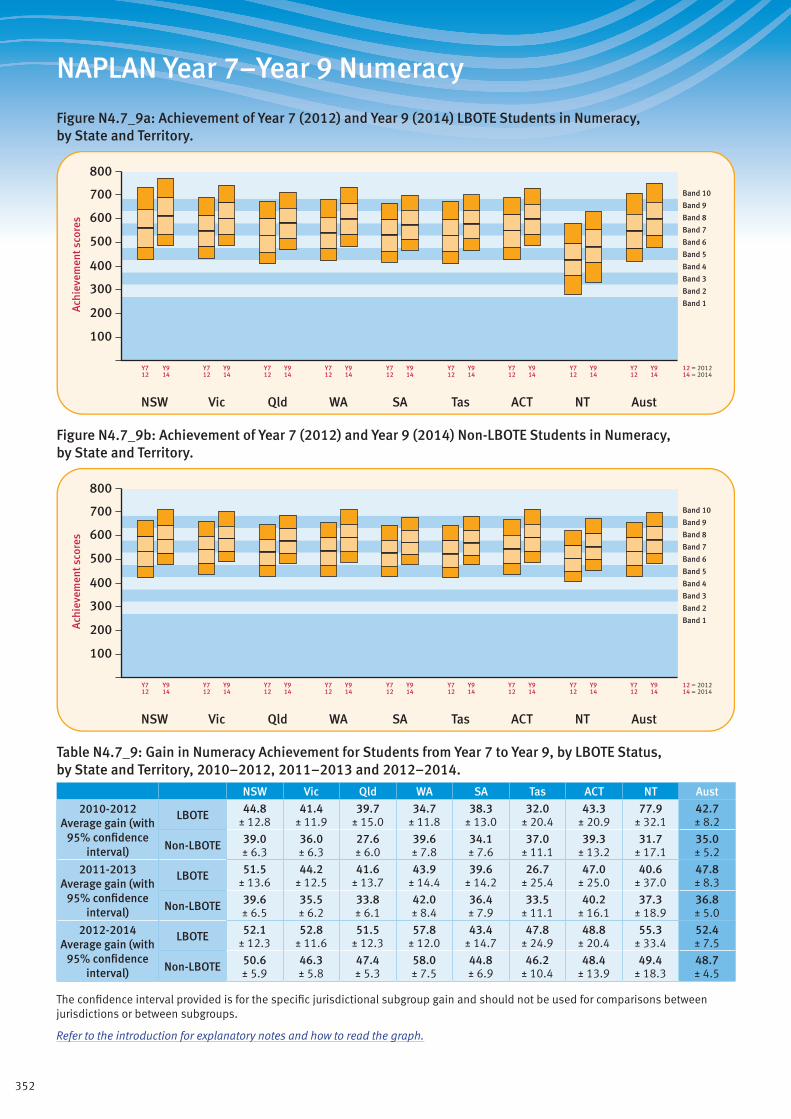
352
NAPLAN Year 7–Year 9 Numeracy
Figure N4.7_9a: Achievement of Year 7 (2012) and Year 9 (2014) LBOTE Students in Numeracy, by State and Territory.
Band 1
Band 2
Band 3
Band 4
Band 5
Band 6
Band 7
Band 8
Band 9
Band 10
600
700
800
500
400
300
200
100
Ach
ieve
men
t sco
res
ACTQld SAWA TasVicNSW NT Aust
Y712
Y914
Y712
Y914
Y712
Y914
Y712
Y914
Y712
Y914
Y712
Y914
Y712
Y914
Y712
Y914
Y712
Y914
12 = 201214 = 2014
Figure N4.7_9b: Achievement of Year 7 (2012) and Year 9 (2014) Non-LBOTE Students in Numeracy, by State and Territory.
Band 1
Band 2
Band 3
Band 4
Band 5
Band 6
Band 7
Band 8
Band 9
Band 10
600
700
800
500
400
300
200
100
Ach
ieve
men
t sco
res
ACTQld SAWA TasVicNSW NT Aust
Y712
Y914
Y712
Y914
Y712
Y914
Y712
Y914
Y712
Y914
Y712
Y914
Y712
Y914
Y712
Y914
Y712
Y914
12 = 201214 = 2014
Table N4.7_9: Gain in Numeracy Achievement for Students from Year 7 to Year 9, by LBOTE Status, by State and Territory, 2010–2012, 2011–2013 and 2012–2014.
NSW Vic Qld WA SA Tas ACT NT Aust
2010-2012 Average gain (with
95% confidence interval)
LBOTE 44.8 ± 12.8
41.4 ± 11.9
39.7 ± 15.0
34.7 ± 11.8
38.3 ± 13.0
32.0 ± 20.4
43.3 ± 20.9
77.9 ± 32.1
42.7 ± 8.2
Non-LBOTE 39.0 ± 6.3
36.0 ± 6.3
27.6 ± 6.0
39.6 ± 7.8
34.1 ± 7.6
37.0 ± 11.1
39.3 ± 13.2
31.7 ± 17.1
35.0 ± 5.2
2011-2013 Average gain (with
95% confidence interval)
LBOTE 51.5 ± 13.6
44.2 ± 12.5
41.6 ± 13.7
43.9 ± 14.4
39.6 ± 14.2
26.7 ± 25.4
47.0 ± 25.0
40.6 ± 37.0
47.8 ± 8.3
Non-LBOTE 39.6 ± 6.5
35.5 ± 6.2
33.8 ± 6.1
42.0 ± 8.4
36.4 ± 7.9
33.5 ± 11.1
40.2 ± 16.1
37.3 ± 18.9
36.8 ± 5.0
2012-2014 Average gain (with
95% confidence interval)
LBOTE 52.1 ± 12.3
52.8 ± 11.6
51.5 ± 12.3
57.8 ± 12.0
43.4 ± 14.7
47.8 ± 24.9
48.8 ± 20.4
55.3 ± 33.4
52.4 ± 7.5
Non-LBOTE 50.6 ± 5.9
46.3 ± 5.8
47.4 ± 5.3
58.0 ± 7.5
44.8 ± 6.9
46.2 ± 10.4
48.4 ± 13.9
49.4 ± 18.3
48.7 ± 4.5
The confidence interval provided is for the specific jurisdictional subgroup gain and should not be used for comparisons between jurisdictions or between subgroups.
Refer to the introduction for explanatory notes and how to read the graph.

353
NAPLAN Achievement of Students in Numeracy
Figure N1.3_5_7: Achievement of Year 3 (2010), Year 5 (2012) and Year 7 (2014) Students in Numeracy, by State and Territory.
Band 2
Band 3
Band 4
Band 5
Band 6
Band 7
Band 8
Band 9
Band 10
Mea
n S
cale
Sco
re
ACTQld SAWA TasVicNSW NT Aust
300
400
500
600
700
Y714
Y512
Y310
Y714
Y512
Y310
Y714
Y512
Y310
Y714
Y512
Y310
Y714
Y512
Y310
Y714
Y512
Y310
Y714
Y512
Y310
Y714
Y512
Y310
Y714
Y512
Y310
10 = 201012 = 201214 = 2014
Figure N1.5_7_9: Achievement of Year 5 (2010), Year 7 (2012) and Year 9 (2014) Students in Numeracy, by State and Territory.
Band 2
Band 3
Band 4
Band 5
Band 6
Band 7
Band 8
Band 9
Band 10
Mea
n S
cale
Sco
re
ACTQld SAWA TasVicNSW NT Aust
300
400
500
600
700
Y914
Y712
Y510
Y914
Y712
Y510
Y914
Y712
Y510
Y914
Y712
Y510
Y914
Y712
Y510
Y914
Y712
Y510
Y914
Y712
Y510
Y914
Y712
Y510
Y914
Y712
Y510
10 = 201012 = 201214 = 2014
Table N1.2010_2012_2014: Achievement of Students in Numeracy from Year 3 (2010), Year 5 (2012) and Year 7 (2014), and from Year 5 (2010), Year 7 (2012) and Year 9 (2014), by State and Territory.
NSW Vic Qld WA SA Tas ACT NT AustMean scale score
/ (S.D.)Year 3 2010 401.0
(73.0)410.5 (69.0)
378.5 (65.9)
382.8 (69.8)
379.9 (66.8)
393.4 (72.4)
412.6 (68.0)
329.4 (90.8)
395.4 (71.8)
Mean scale score / (S.D.)
Year 5 2012 497.7 (73.5)
497.6 (65.6)
476.1 (66.7)
477.5 (70.3)
471.9 (64.7)
480.4 (69.0)
504.4 (66.6)
417.6 (94.4)
488.7 (70.9)
Mean scale score / (S.D.)
Year 7 2014 550.3 (77.7)
548.6 (69.4)
543.6 (69.1)
545.5 (72.1)
533.9 (65.0)
533.1 (66.7)
556.6 (69.1)
484.4 (84.5)
545.9 (73.0)
Mean scale score / (S.D.)
Year 5 2010 498.4 (73.6)
502.7 (65.2)
474.1 (63.8)
476.8 (68.1)
472.6 (64.2)
479.4 (67.2)
498.7 (65.0)
421.5 (92.1)
488.8 (69.9)
Mean scale score / (S.D.)
Year 7 2012 543.4 (80.4)
544.3 (70.8)
532.0 (67.5)
534.9 (70.9)
529.1 (67.0)
526.0 (67.8)
545.9 (72.0)
474.7 (90.2)
538.1 (73.9)
Mean scale score / (S.D.)
Year 9 2014 594.3 (77.2)
592.3 (68.7)
579.8 (64.1)
591.1 (69.8)
573.6 (62.8)
572.8 (63.0)
594.4 (69.8)
532.0 (83.5)
587.8 (70.9)
Refer to the introduction for explanatory notes and how to read the graph.
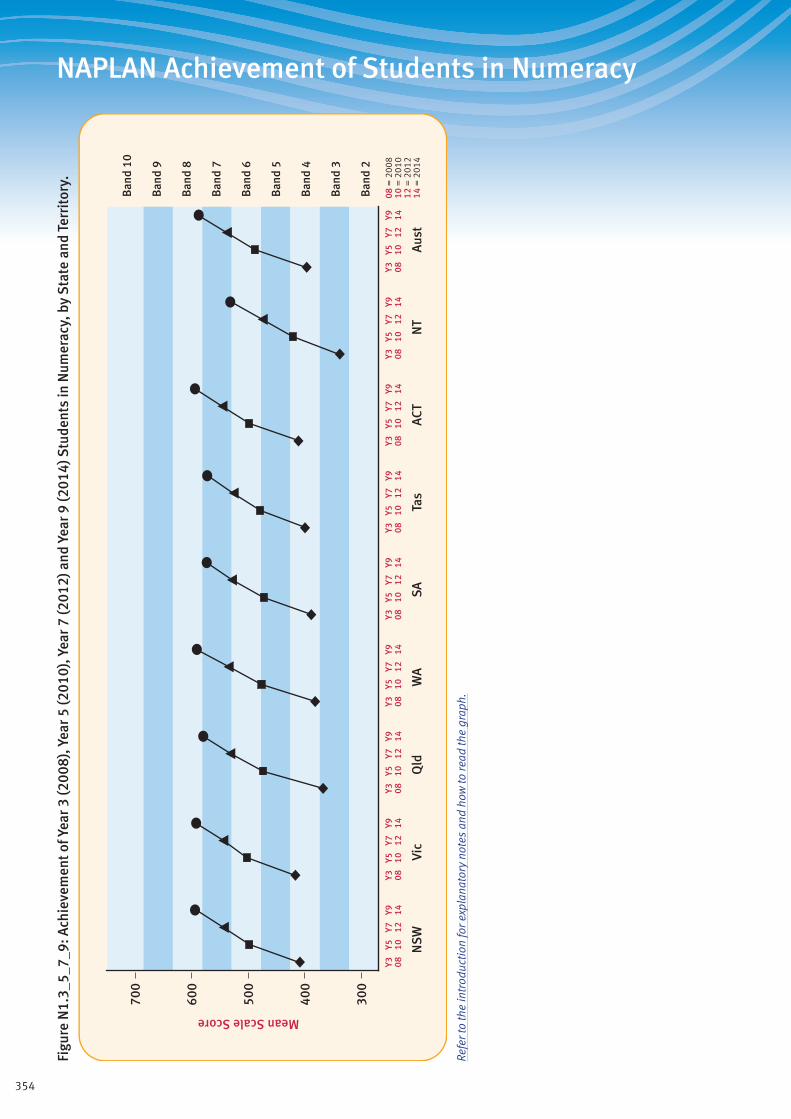
354
NAPLAN Achievement of Students in NumeracyFi
gure
N1.
3_5_
7_9:
Ach
ieve
men
t of Y
ear 3
(200
8), Y
ear 5
(201
0), Y
ear 7
(201
2) a
nd Y
ear 9
(201
4) S
tude
nts
in N
umer
acy,
by
Sta
te a
nd T
erri
tory
.
Ban
d 2
Ban
d 3
Ban
d 4
Ban
d 5
Ban
d 6
Ban
d 7
Ban
d 8
Ban
d 9
Ban
d 10
Mean Scale Score
ACT
Qld
SAW
ATa
sVi
cN
SW
NT
Aus
t
300
400
500
600
700
Y9 14Y7 12
Y5 10Y3 08
Y9 14Y7 12
Y5 10Y3 08
Y9 14Y7 12
Y5 10Y3 08
Y9 14Y7 12
Y5 10Y3 08
Y9 14Y7 12
Y5 10Y3 08
Y9 14Y7 12
Y5 10Y3 08
Y9 14Y7 12
Y5 10Y3 08
Y9 14Y7 12
Y5 10Y3 08
Y9 14Y7 12
Y5 10Y3 08
08 =
200
810
= 2
010
12 =
201
214
= 2
014
Refe
r to
the
intr
oduc
tion
for e
xpla
nato
ry n
otes
and
how
to re
ad th
e gr
aph.
355
NAPLAN Commentary
Gains in Reading and Numeracy achievementAs students progress through school they develop greater proficiency in the learning areas they study as a result of the teaching they experience and as a result of their general development. NAPLAN results provide the opportunity to examine these changes in student proficiency because the NAPLAN achievement scales are equated over year levels (the same scales apply to Years 3, 5, 7 and 9) and successive cycles (the same scales apply in 2008, 2009, 2010, 2011, 2012, 2013 and 2014).
In this NAPLAN report, two-year, four-year and six-year gains for reading and numeracy achievements are discussed. Two-year gains refer to the difference in mean scores in NAPLAN cycles two years apart for the same cohorts of students: from Year 3 to Year 5, Year 5 to Year 7 and Year 7 to Year 9. Data based on two-year gains for 2010 to 2012, 2011 to 2013 and 2012 to 2014 are discussed. Thus there are three estimates for each two-year progression. Four-year gains refer to the progression of cohorts over four years or two NAPLAN cycles; from Year 3 to Year 7 and from Year 5 to Year 9. These four-year gains are discussed for the period from 2010 to 2014. Six-year gains refer to the progression of cohorts over three NAPLAN cycles from Year 3 to Year 9. The six-year gains from Year 3 in 2008 to Year 9 in 2014 are also discussed.
About the figures and tablesTable R1.3_5 provides the average two-year gains in reading achievement from Year 3 to Year 5 for three cohorts: those who were in Year 3 in 2010, those who were in Year 3 in 2011 and those who were in Year 3 in 2012. Table R1.5_7 and Table R1.7_9 provide the corresponding average gains in reading achievement from Year 5 to Year 7 and Year 7 to Year 9 for each of these three cohorts. The commentary discusses differences in the gains among the three cohorts. Figures N1.3_5, N1.5_7 and N1.7_9, together with Tables N1.3_5, N1.5_7 and N1.7_9, provide representations of the corresponding data for gains in numeracy achievement.
In addition, Figure R1.3_5_7, together with Table R1.3_5_7, and Figure R1.5_7_9, together with Table R1.5_7_9, provide representations of the four-year gains in reading achievement for the 2010 Year 3 cohort and the 2010 Year 5 cohort. Corresponding data for numeracy achievement are represented in Figure N1.3_5_7 (Table N1.3_5_7) and Figure N1.5_7_9 (Table N1.5_7_9). Figure R1.3_5_7_9 and Figure N1.3_5_7_9 provide representations of the six-year gains in reading and numeracy for the cohort that was in Year 3 in 2008 and Year 9 in 2014.
The commentaryIn this commentary the focus is on differences among the two-year gains that are statistically significant (in other words, are unlikely to have arisen by chance). Where the commentary states that there was no difference in a set of gain scores it means that the difference did not satisfy this criterion. The commentary focuses on two aspects of the gain scores among the multitude of possible comparisons that could be made. The first is whether the national gain scores for each progression are similar, or consistent, across cohorts. The second is whether there are differences in gain scores for different jurisdictions and groups of students.
Gains in readingFrom Year 3 to Year 5Nationally the gains in reading achievement from Year 3 to Year 5 ranged from 79 to 87 scale points and averaged 82 points over the three cohorts. There were no differences among the cycles (Table R1.3_5 and Figure R1.3_5). None of the jurisdictional gains from Year 3 in 2012 to Year 5 in 2014 was different from the national gain of 81 points. In the previous national report, it was noted that only in the Northern Territory was the jurisdictional
gain different from the national gain (115 points compared to 87 points). This difference was not evident in the gain for the Northern Territory from Year 3 in 2012 to Year 5 in 2014.
Nationally the gains for male students were not different from the gains for female students in the cohort that progressed from Year 3 in 2012 to Year 5 in 2014. In addition, there were no significant differences for that cohort between the gains for male and female students in any of the jurisdictions (Table R2.3_5).
The gains from Year 3 in 2012 to Year 5 in 2014 for Indigenous students were greater than the gains for non-Indigenous students nationally (the difference was eight points) and in New South Wales (the difference was six points) (Table R3.3_5). By way of comparison, it can be noted that for the cohort from Year 3 in 2011 to Year 5 in 2013 there had also been a greater gain in reading achievement nationally for Indigenous than for non-Indigenous students (the difference was 22 points). The gains from Year 3 in 2012 to Year 5 in 2014 for LBOTE students were less than the gains for non-LBOTE students nationally (the difference was six points) as well as in Victoria (the difference was five points) and Western Australia (the difference was eight points) (Table R4.3_5).
From Year 5 to Year 7Table R1.5_7 and Figure R1.5_7 show the average gains in reading achievement from Year 5 to Year 7 for 2012 to 2014, 2011 to 2013 and 2010 to 2012. The Year 5 to Year 7 gain in reading averaged 53 points over the three cohorts and there were no appreciable differences between cohorts. For the 2012 to 2014 cohort, the jurisdictional gains in Queensland (61 points), Western Australia (62 points) and South Australia (57 points) were greater than the national gain (53 points). The gains in New South Wales (49 points) and Victoria (46 points) were less than the national gain.
Nationally, the gains in reading achievement from Year 5 to Year 7 in the 2012 to 2014 cohort were greater for male students than female students (by four points) but there were no differences within jurisdictions (Table R2.5_7 and Figure R2.5_7). The gains for LBOTE were greater than those for non-LBOTE students (by five points) nationally but not within any jurisdiction (Table R4.5_7 and Figure R4.5_7).
Nationally, the gains for Indigenous students (70 points) were greater than those for non-Indigenous students (52 points) (Table R3.5_7 and Figure R3.5_7). In addition, for this cohort, the gains for Indigenous students were significantly greater than those for non-Indigenous students in New South Wales (57 compared to 48 points), Queensland (73 compared to 60 points), Western Australia (80 compared to 60 points), South Australia (70 compared to 57 points) and the Northern Territory (91 compared to 53 points).
From Year 7 to Year 9Table R1.7_9 and Figure R1.7_9 show, nationally and for each jurisdiction, the average gains in reading achievement from Year 7 to Year 9. These data reference the 2012 to 2014, 2011 to 2013 and 2010 to 2012 cohorts. Over the three cohorts the average gain was 36 points. Even though the gain for the 2010 to 2012 cohort appeared smaller (29 scale points) than the other two cohorts (which were 39 and 40 scale points respectively) none of the differences were statistically significant.
For the 2012 to 2014 cohort, none of the jurisdictional gains differed significantly from the national gain. For the 2012 to 2014 cohort, the gain scores for male students were no different from those for female students, at either a national level or in any jurisdiction (Table R2.7_9 and Figure R2.7_9).
There were no differences between Indigenous and non-Indigenous students in reading gains from Year 7 to Year 9 for Australia overall or for any of the jurisdictions in the 2012 to 2014 cohort (Table R3.7_9 and Figure R3.7_9). The gains for LBOTE students were greater than for non-LBOTE nationally (by 9 points) and in New South Wales (10 points), Victoria (9 points) and Queensland (11 points) (Table R4.7_9 and Figure R4.7_9).
356
NAPLAN Commentary
From Year 3 to Year 7 and Year 5 to Year 9For the four-year progressions the focus is on differences that appear worthy of comment in a general sense. Table R1.2010_2012_2014 (and the corresponding Figure R1.3_5_7 and Figure R1.5_7_9) records the mean reading achievement scores across a four-year period from Year 3 to Year 7 for the cohorts that were in Year 3 in 2010, in Year 5 in 2012 and Year 7 in 2014.
The span from Year 3 through Year 5 to Year 7 reference the primary school years since even where Year 7 is part of secondary school, the NAPLAN assessment occurs early in the school year. It was evident that, nationally, the gain from Year 3 to Year 5 was 79 points and the gain from Year 5 to Year 7 was 53 points, making a total four-year gain of 132 points. The overall-gain scores range from Victoria (120 points) to Queensland (149 points) and the Northern Territory (150 points).
For the cohort that was in Year 5 in 2010 it appears that, nationally, the gain from Year 5 to Year 9 was 93 points. Nationally the gain from Year 5 to Year 7 was 54 points (which was almost the same as that for the cohort above that was in Year 5 in 2012) and the gain from Year 7 to Year 9 was 39 points. The largest gains over four years were evident in the Northern Territory (110 points), Western Australia (107 points) and Queensland (103 points) and the smallest four-year gain was in Victoria (83 points).
From Year 3 to Year 9The 2014 data for NAPLAN reading made it possible to examine the gain in reading achievement over six years from Year 3 in 2008 to Year 9 in 2014. These data are shown in Figure R1.3_5_7_9. For this cohort nationally there was a gain of 87 points from Year 3 to Year 5, a gain of 54 points from Year 5 to Year 7 and a gain of 39 points from Year 7 to Year 9. This pattern of improved reading amounted to a total increase of 180 scale points with the rate of increase becoming progressively smaller across year levels. The data in Figure R1.3_5_7_9 show differences among jurisdictions in the total change from Year 3 to Year 9. These ranged from 166 points in Victoria to 198, 201 and 215 points in Western Australia, Queensland and the Northern Territory respectively. There was a strong negative association between mean scores in Year 3 and the gain from Year 3 to Year 9 (the correlation coefficient was -0.90). In other words, there were greater gains in those jurisdictions where initial reading achievement was lower. Of course, these observations are based on jurisdictional means and the issue would benefit from more detailed analyses of individual and school level data.
Gains in NumeracyFrom Year 3 to Year 5Table N1.3_5 (and Figure N1.3_5) provides data regarding the Year 3 to Year 5 gains in numeracy between 2012 and 2014, between 2011 and 2013 and between 2010 and 2012. There were no differences between the three cohorts in terms of the gain in numeracy between Year 3 and Year 5, nationally, or in any jurisdiction. Nationally the average gain over three cohorts was 91 scale points.
For the 2012 to 2014 cohort, the gains in Queensland (101 points) and Western Australia (97 points) were greater than the national average gain score (92 points). The gains in New South Wales (88 points) and Victoria (88 points) were less than the national average gain score.
The national gains in numeracy were greater for male students (94 points) than female students (91 points) but there were no differences in gains within jurisdictions (Table N2.3_5). Nationally, the gain scores for Indigenous students (98 points) were greater than those for non-Indigenous (92 points) students. (Table N3.3_5). There were no differences in the average gain scores for LBOTE and non-LBOTE students nationally, but in New
South Wales and Victoria there were greater gains for LBOTE than non-LBOTE students (the differences in the gains were five points for each) (Table N4.3_5).
From Year 5 to Year 7Table N1.5_7 (and Figure N1.5_7) provides data regarding the Year 5 to Year 7 gains in numeracy between 2012 and 2014, between 2011 and 2013 and between 2010 and 2012. Nationally, the numeracy gain between Year 5 and Year 7 for the 2012 cohort was not significantly different from that for the 2010 cohort or the 2011 cohort. Nationally, the average gain was 54 scale points.
For the 2012 to 2014 (Year 5 to Year 7) cohort, the gain was greater in Queensland (68 points) and Western Australia (68 points) than the national gain score of 57 points. The gains in these two jurisdictions were significantly greater than the gains in New South Wales (53 points), Victoria (51 points), Tasmania (53 points) and the ACT (52 points).
The Year 5 to Year 7 average gains in numeracy in the 2012 to 2014 cohort were the same for male and female students nationally and within each jurisdiction (Table N2.5_7). At a national level, the gains for Indigenous students (65 points) were greater than those for non-Indigenous students (57 points) in the 2012 to 2014 cohort, but no difference was evident within any jurisdiction (Table N3.5_7). The gains for LBOTE students across Australia (64 points) were greater than those for non-LBOTE students (55 points) (Table N4.5_7). Differences were also evident within New South Wales (12 points), Victoria (11 points) and Queensland (10 points).
From Year 7 to Year 9Table N1.7_9 (and Figure N1.7_9) provides data regarding the Year 7 to Year 9 gains in numeracy between 2012 and 2014, 2011 and 2013 and between 2010 and 2012. Nationally, the gain in numeracy between Year 7 and Year 9 for the 2012 to 2014 cohort (50 points), was greater than the gains for either the 2010 to 2012 cohort (36 points), or the 2011 to 2013 cohort (39 points). For the 2012 to 2014 cohort, none of the jurisdictional gain scores differed significantly from the national gain score.
For the 2012 to 2014 cohort, there were no differences in the Year 7 to Year 9 numeracy gains between male and female students (Table N2.7_9). There was no difference between Indigenous and non-Indigenous students nationally or within any jurisdiction (Table N3.7_9). Nationally, the gains for LBOTE students were not different from the gains for non-LBOTE students (Table N4.7_9). In addition, there were no differences in the gains for LBOTE and non-LBOTE students within jurisdictions.
From Year 3 to Year 7 and Year 5 to Year 9Table N1.2010_2012_2014 (and the corresponding Figures N1.3_5_7 and N1.5_7_9) records the mean numeracy achievement scores across a four-year period from Year 3 to Year 7 for the cohorts that were in Year 3 in 2010 (progressing to Year 7 in 2014) and in Year 5 in 2010 (progressing to Year 9 in 2014). From these data it was possible to compute gain scores for the two relevant four-year periods.
It was evident from the gain scores that nationally, the four-year gain in numeracy achievement over Year 3 to Year 7 was 151 points and this was made up of an average gain of 93 points between Year 3 and Year 5 and 57 points between Year 5 and Year 7. Figure N1.3_5_7 illustrates the decline in gain scores with successive progressions through school nationally and in every jurisdiction. The data also indicate that the average gain scores over four years ranged from 138 points in Victoria to 163 points in Western Australia and 165 points in Queensland.
Nationally, the average numeracy gain from Year 5 to Year 9 was 99 points and the data also indicate that the average gain scores over four years ranged from 90 points in Victoria to 106 points in Queensland, 111 points in the Northern Territory and 114 points in Western Australia. Figure N1.5_7_9 shows that in this case
357
NAPLAN Commentary
the changes in national gain scores were similar between Year 5 and Year 7 and between Year 7 and Year 9 nationally and in most jurisdictions. Nationally, the overall gain consisted of an average gain of 50 points between Year 5 and Year 7 and 50 points between Year 7 and Year 9.
From Year 3 to Year 9The 2014 data for NAPLAN numeracy made it possible to examine the gain in numeracy achievement over six years from Year 3 in 2008 to Year 9 in 2014. These data are shown in Figure N1.3_5_7_9. The national improvement in numeracy as students progressed through school over six years amounted to a total increase of 191 scale points. For this cohort, there was a gain of 92 points from Year 3 to Year 5, a gain of 49 points from Year 5 to Year 7 and a gain of 50 points from Year 7 to Year 9. In other words, following a substantial increase between Year 3 and Year 5 the changes between Year 5 and Year 7 and Year 7 and Year 9 were the same. This pattern differs from that observed for reading where the increase from Year 7 to Year 9 was less than that between Year 5 and Year 7 (and between Year 3 and Year 5). Apparently the rate of increase in numeracy did not slow beyond Year 7 in the manner observed for reading. The data in Figure N1.3_5_7_9 also show differences among jurisdictions in the total change from Year 3 to Year 9. These differences ranged from 173 points in Tasmania and 175 points in Victoria to 209 points in Western Australia and 212 points in Queensland. The negative association between mean scores in Year 3 and the gain from Year 3 to Year 9 was less strong than that observed for reading (the correlation coefficient was -0.60). In other words, the relationship between jurisdictional numeracy gains and initial numeracy achievement was evident, but less strong than had been observed for reading. Once again the data suggest the need for more detailed analyses of individual and school level data.