nasdaq: cmcsa comcast corporation · 1 comcast corporation analyst: joshua bernath fisher college...
TRANSCRIPT
1
Comcast Corporation
Analyst: Joshua Bernath Fisher College of Business The Ohio State University Columbus, OH
Contact: (419) 551-8321 [email protected]
Fund: OSU SIM Class (BUS-FIN 724) Fund Manager: Chris Henneforth, CFA
Sector: Consumer Discretionary
Industry: Cable & Satellite TV
Recommendation: BUY
Current Share Price: $12.50 Target Share Price: $19.97
$10.00
$12.50
$15.00
$17.50
$20.00
$22.50
$25.00
$27.50
$30.00
Feb-04 Nov-04 Jul-05 Apr-06 Jan-07 Sep-07 Jun-08 Feb-09
CMCSA Consumer Discretionary Indexed S&P 500 Indexed
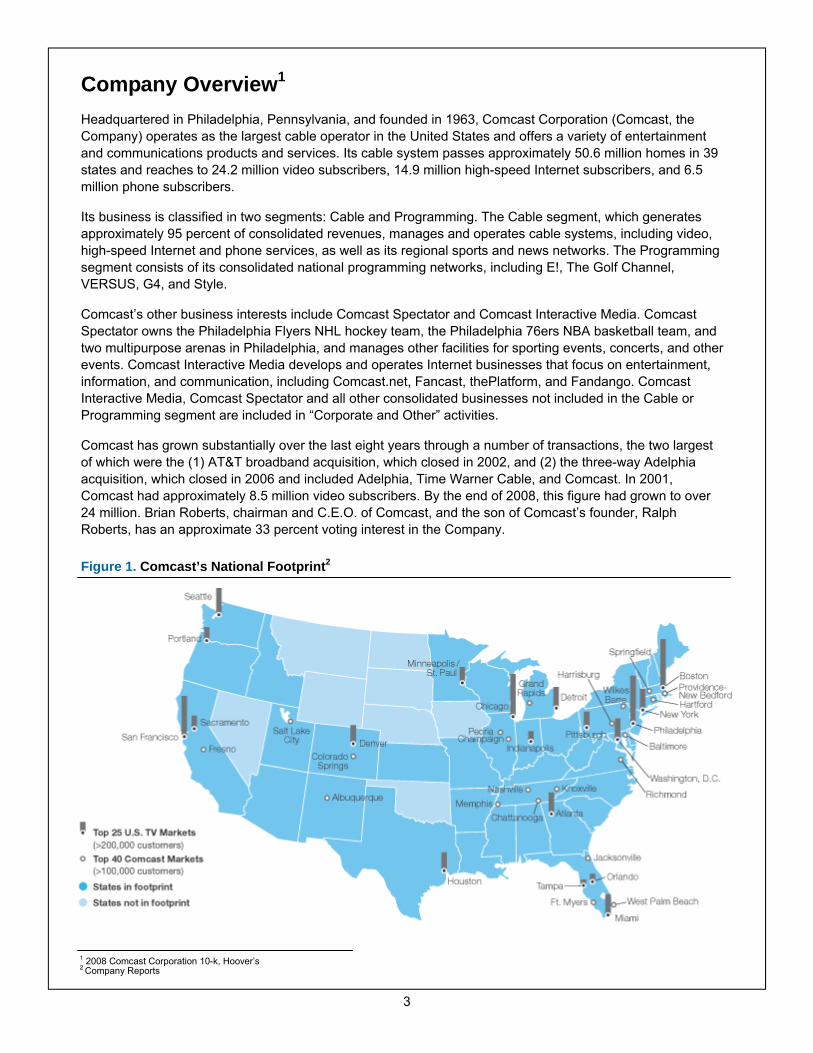
Share Price Performance Financial and Valuation Metrics
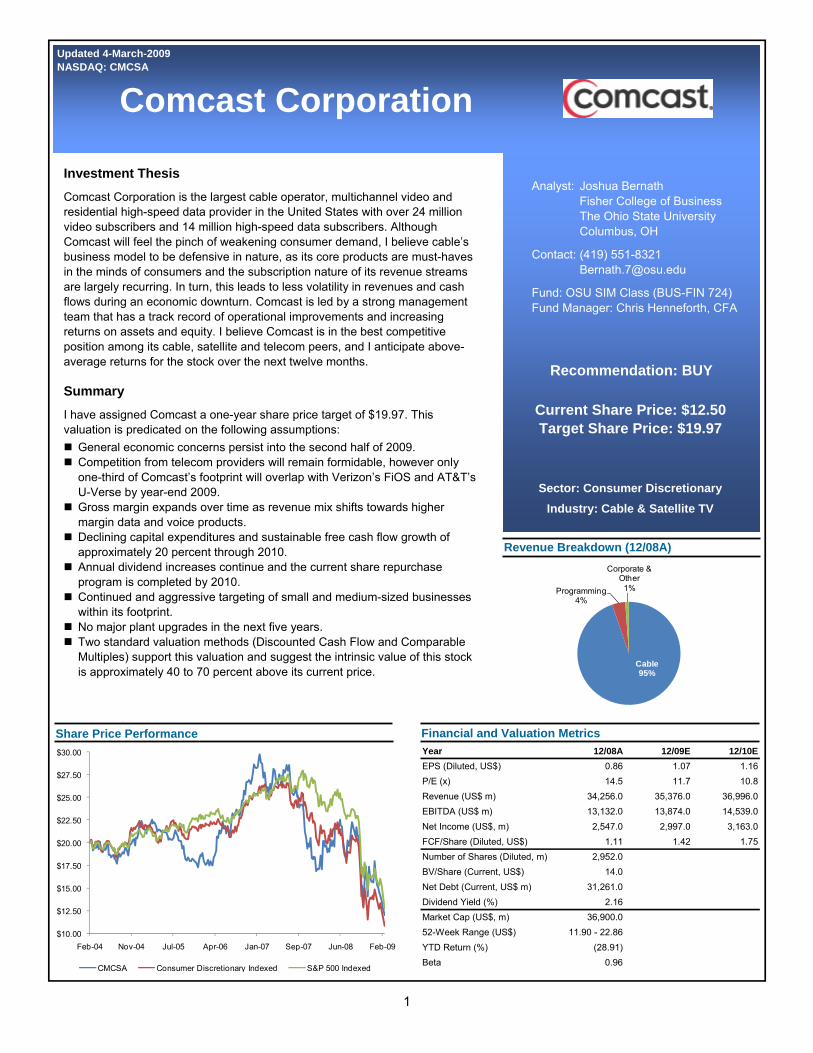
Revenue Breakdown (12/08A)
Cable95%
Programming4%
Corporate & Other
1%
Updated 4-March-2009 NASDAQ: CMCSA
Investment Thesis Comcast Corporation is the largest cable operator, multichannel video and residential high-speed data provider in the United States with over 24 million video subscribers and 14 million high-speed data subscribers. Although Comcast will feel the pinch of weakening consumer demand, I believe cable’s business model to be defensive in nature, as its core products are must-haves in the minds of consumers and the subscription nature of its revenue streams are largely recurring. In turn, this leads to less volatility in revenues and cash flows during an economic downturn. Comcast is led by a strong management team that has a track record of operational improvements and increasing returns on assets and equity. I believe Comcast is in the best competitive position among its cable, satellite and telecom peers, and I anticipate above-average returns for the stock over the next twelve months.
Summary I have assigned Comcast a one-year share price target of $19.97. This valuation is predicated on the following assumptions: General economic concerns persist into the second half of 2009. Competition from telecom providers will remain formidable, however only one-third of Comcast’s footprint will overlap with Verizon’s FiOS and AT&T’s U-Verse by year-end 2009. Gross margin expands over time as revenue mix shifts towards higher margin data and voice products. Declining capital expenditures and sustainable free cash flow growth of approximately 20 percent through 2010. Annual dividend increases continue and the current share repurchase program is completed by 2010. Continued and aggressive targeting of small and medium-sized businesses within its footprint. No major plant upgrades in the next five years. Two standard valuation methods (Discounted Cash Flow and Comparable Multiples) support this valuation and suggest the intrinsic value of this stock is approximately 40 to 70 percent above its current price.
Year 12/08A 12/09E 12/10EEPS (Diluted, US$) 0.86 1.07 1.16P/E (x) 14.5 11.7 10.8Revenue (US$ m) 34,256.0 35,376.0 36,996.0EBITDA (US$ m) 13,132.0 13,874.0 14,539.0Net Income (US$, m) 2,547.0 2,997.0 3,163.0FCF/Share (Diluted, US$) 1.11 1.42 1.75Number of Shares (Diluted, m) 2,952.0BV/Share (Current, US$) 14.0Net Debt (Current, US$ m) 31,261.0Dividend Yield (%) 2.16Market Cap (US$, m) 36,900.052-Week Range (US$) 11.90 - 22.86YTD Return (%) (28.91)Beta 0.96
2
Table of Contents
Investment Thesis 1
Summary 1
Company Overview 3
Business Overview 4
Video 4
Data 5
Voice 5
Macroeconomic Analysis 6
Drivers 6
Outlook 7
Industry Analysis 8
Current Life Cycle 8
Historical & Recent Performance 8
Recent Trends 9
Competition 10
Pricing 11
Regulatory Environment 11
Investment Thesis 11
Valuation 12
Company Analysis 13
Competitive Advantages 13
Financial Statements Analysis 13
Equity Valuation: Multiples 15
Equity Valuation: Discounted Cash Flow 17
Summary 20
Strengths and Opportunities 20
Risks and Concerns 20
Conclusions 21
Appendix 1 Comcast Financial Statements from Company 10-k 23
Appendix 2 Comcast Discounted Cash Flow Model: Base Case Scenario 26
Appendix 3 Comcast Discounted Cash Flow Model: Plant Upgrade Scenario 27
3
Company Overview1
Headquartered in Philadelphia, Pennsylvania, and founded in 1963, Comcast Corporation (Comcast, the Company) operates as the largest cable operator in the United States and offers a variety of entertainment and communications products and services. Its cable system passes approximately 50.6 million homes in 39 states and reaches to 24.2 million video subscribers, 14.9 million high-speed Internet subscribers, and 6.5 million phone subscribers.
Its business is classified in two segments: Cable and Programming. The Cable segment, which generates approximately 95 percent of consolidated revenues, manages and operates cable systems, including video, high-speed Internet and phone services, as well as its regional sports and news networks. The Programming segment consists of its consolidated national programming networks, including E!, The Golf Channel, VERSUS, G4, and Style.
Comcast’s other business interests include Comcast Spectator and Comcast Interactive Media. Comcast Spectator owns the Philadelphia Flyers NHL hockey team, the Philadelphia 76ers NBA basketball team, and two multipurpose arenas in Philadelphia, and manages other facilities for sporting events, concerts, and other events. Comcast Interactive Media develops and operates Internet businesses that focus on entertainment, information, and communication, including Comcast.net, Fancast, thePlatform, and Fandango. Comcast Interactive Media, Comcast Spectator and all other consolidated businesses not included in the Cable or Programming segment are included in “Corporate and Other” activities.
Comcast has grown substantially over the last eight years through a number of transactions, the two largest of which were the (1) AT&T broadband acquisition, which closed in 2002, and (2) the three-way Adelphia acquisition, which closed in 2006 and included Adelphia, Time Warner Cable, and Comcast. In 2001, Comcast had approximately 8.5 million video subscribers. By the end of 2008, this figure had grown to over 24 million. Brian Roberts, chairman and C.E.O. of Comcast, and the son of Comcast’s founder, Ralph Roberts, has an approximate 33 percent voting interest in the Company.
Figure 1. Comcast’s National Footprint2
1 2008 Comcast Corporation 10-k, Hoover’s 2 Company Reports
4
Business Overview It is important to understand the industry and business constituents for the sake of this report and the analysis it includes. The competitive landscape has undergone some recent changes which will be explained later in the report. Below is a list of Comcast’s major competitors and their respective business category:
Multi-System Operators (MSO) — Companies that operate multiple cable systems, usually across several markets. MSOs and cable companies are used interchangeably in this report. Companies include: Comcast, Time Warner Cable, Cablevision.
Direct Broadcast Satellite (DBS) — Companies that provide video service by means of satellites. Companies include: DirecTV, DISH Network.
Regional Bell Operating Company (RBOC) — These companies originally provided telephone services. Because of overlapping technologies, they have moved into video and data. RBOCs and telecom companies are used interchangeably in this report. Companies include: Verizon, AT&T. Verizon’s service is FiOS and AT&T’s service is marketed as U-Verse.
MSOs such as Comcast and Time Warner Cable generally offer the same services, with the majority of revenue coming from video, data, and voice. More often that not, video, data, and voice are bundled together providing the consumer with a package or bundle of services from one source. In the following section, I provide an overview of the products and services these companies provide:
Video Basic Cable — This is the current standard cable offering consisting of a small or large package of analog channels. This is the basis for most of the cable industry’s business, as the MSOs sell data and voice primarily to this customer base.3 Cable companies are currently transitioning most of their customers to digital and away from analog based channels in accordance with government regulation and for bandwidth expansion.
Digital Cable — Customers wishing to upgrade service have the option of receiving channels in digital format. I believe digital penetration is central to customer retention, as it offers the ability for MSOs to up-sell customers with interactive services, such as Video on Demand (VOD), which DBS competitors cannot fully replicate, as well as high-definition (HD) and digital-video recording (DVR) capabilities.
Video on Demand (VOD) — This is one of the most compelling products offered by the MSOs and is one of the biggest differentiators relative to the DBS providers. Currently, the MSOs typically offer over several
thousand programs per month and over several hundred hours of high-definition VOD programming.
Subscription Video on Demand — This service provides customers with access to on demand content from subscription
video services.
High-Definition Television — Television signals are broadcast in high-definition. Comcast charges customers an additional monthly fee to receive HD programming with essentially no incremental cost.
Digital Video Recorder (DVR) — This service allows customers to record programs and watch them at a later date or time. DVRs are rented to the customer for monthly fees of $7 to $15. Overall, approximately 30 percent of Comcast’s and Time Warner Cable’s customers take an HD/DVR box.
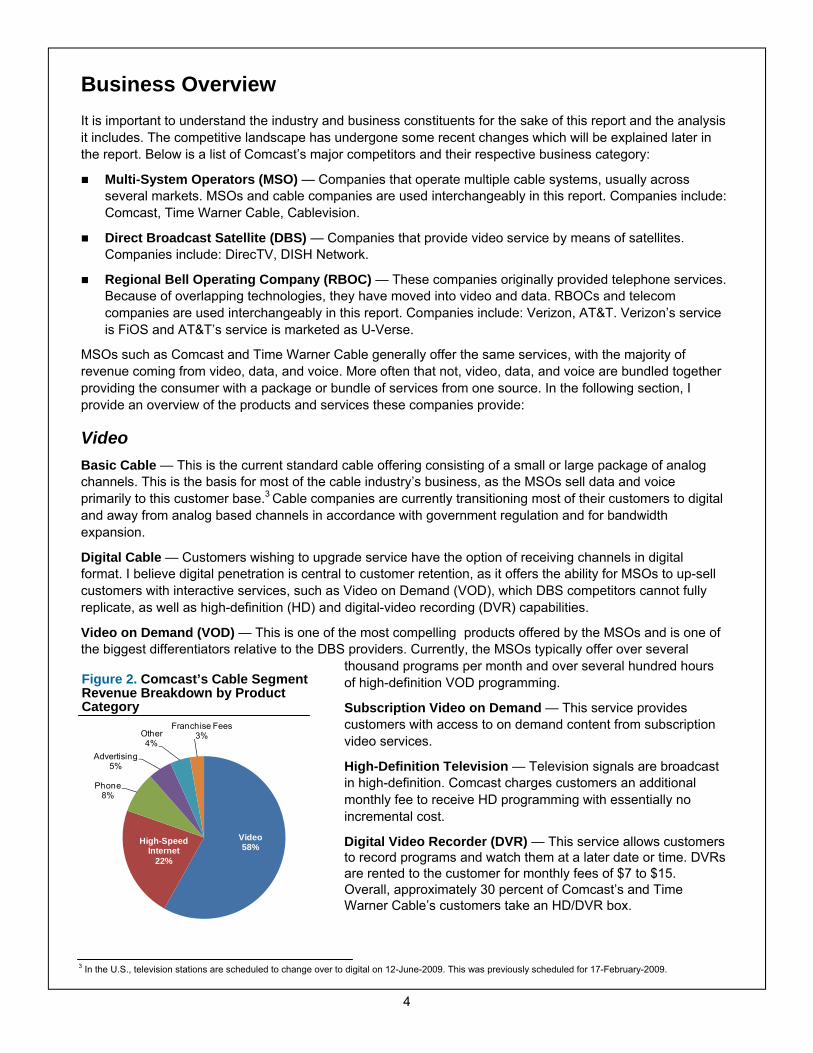
Figure 2. Comcast’s Cable Segment Revenue Breakdown by Product Category
3 In the U.S., television stations are scheduled to change over to digital on 12-June-2009. This was previously scheduled for 17-February-2009.
Video58%
High-Speed Internet
22%
Phone8%
Advertising5%
Other4%
Franchise Fees3%
5
Premium Channel Programming — Video customers have the option to pay additional monthly fees for premium channels, which generally include HBO, Cinemax, STARZ, and Showtime.
Pay-Per-View Programming — This programming primarily includes sports and music events broadcast live to customers for a one-time fee. These features are only available to digital customers, increasing the attractiveness of taking a digital package and driving higher revenue.
Data High-Speed Internet Service — This is broadband Internet access via cable, with downstream speeds generally from 6 Mbps up to 16 Mbps. Comcast is currently introducing DOCSIS 3.0, which will increase speeds to 100+ Mbps. I believe this will keep them competitive with Verizon’s FiOS broadband service (the highest speeds to date) and generally ahead of consumer demand. Over time, cable’s ability to handle more bandwidth intensive applications should drive application development to utilize the additional capacity and spur additional demand for the higher tiered and more expensive broadband options.
In order to capitalize on demand for lower speed Internet service, some MSOs are offering users a lower priced economy tier of broadband service at 768 Kbps, which is more competitive with the DSL offering from Verizon and AT&T. My view is that this new option is an attempt to prevent customers from disconnecting completely in a tough economic environment and will provide customers with an alternative to more cheaply priced DSL and dial-up Internet services.
Voice Phone service — The MSOs are employing an Internet Protocol based voice product, which includes local, long distance, and a variety of calling features such as caller ID, call waiting, and voicemail. The calls are routed over a private network and do not use the public Internet, which results in higher quality.
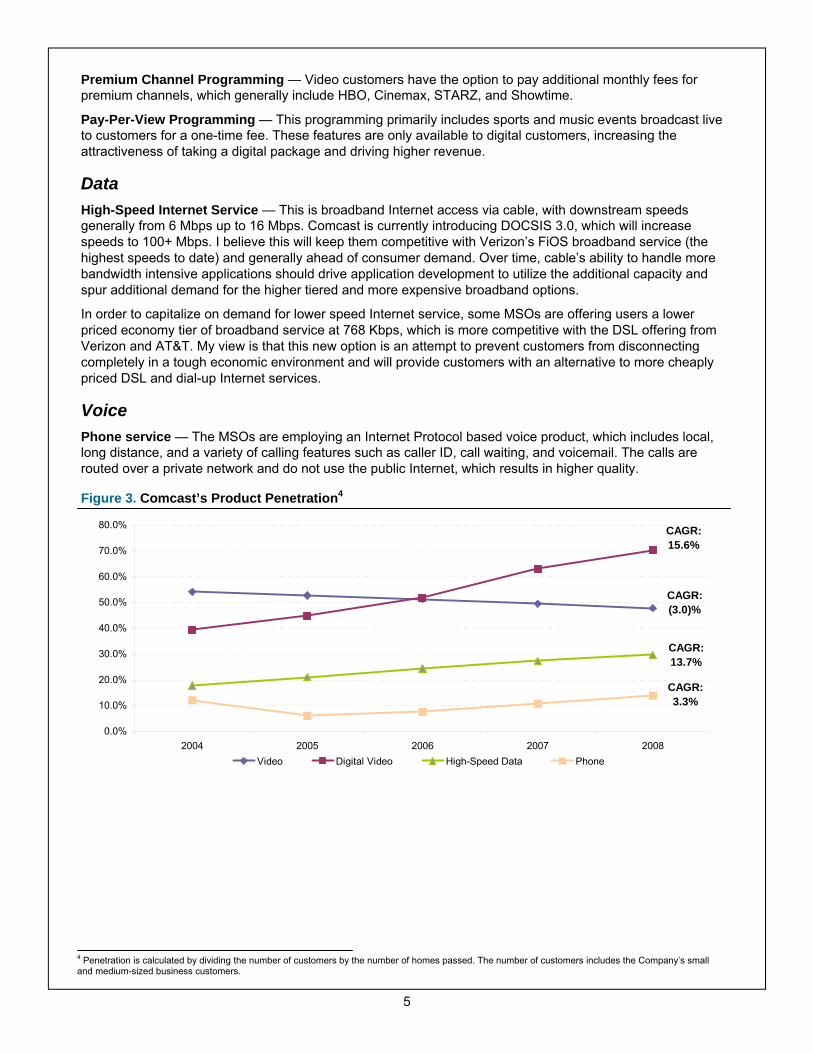
Figure 3. Comcast’s Product Penetration4
4 Penetration is calculated by dividing the number of customers by the number of homes passed. The number of customers includes the Company’s small and medium-sized business customers.
0.0%
10.0%
20.0%
30.0%
40.0%
50.0%
60.0%
70.0%
80.0%
2004 2005 2006 2007 2008Video Digital Video High-Speed Data Phone
CAGR:15.6%
CAGR:(3.0)%
CAGR:13.7%
CAGR:3.3%
6
Macroeconomic Analysis Comcast and the Cable and Satellite TV industry as a whole have run into the macroeconomic headwinds facing many of the companies in the country. I believe the higher-priced bundle packages represent a growing portion of consumers’ income, and with a weakening economy, these consumers are less likely to migrate to higher tiers and also more likely to trim down features or services when their household budgets come under pressure. Ultimately, I believe video is one of the last items to go after power and cell phone. Considering that if one cannot afford to eat out or go out for entertainment, then one has to stay at home, making television an attractive option for entertainment, in my opinion. Therefore, consumers may not be upgrading services, but they are still watching television and paying the cable, broadband, and phone bill.
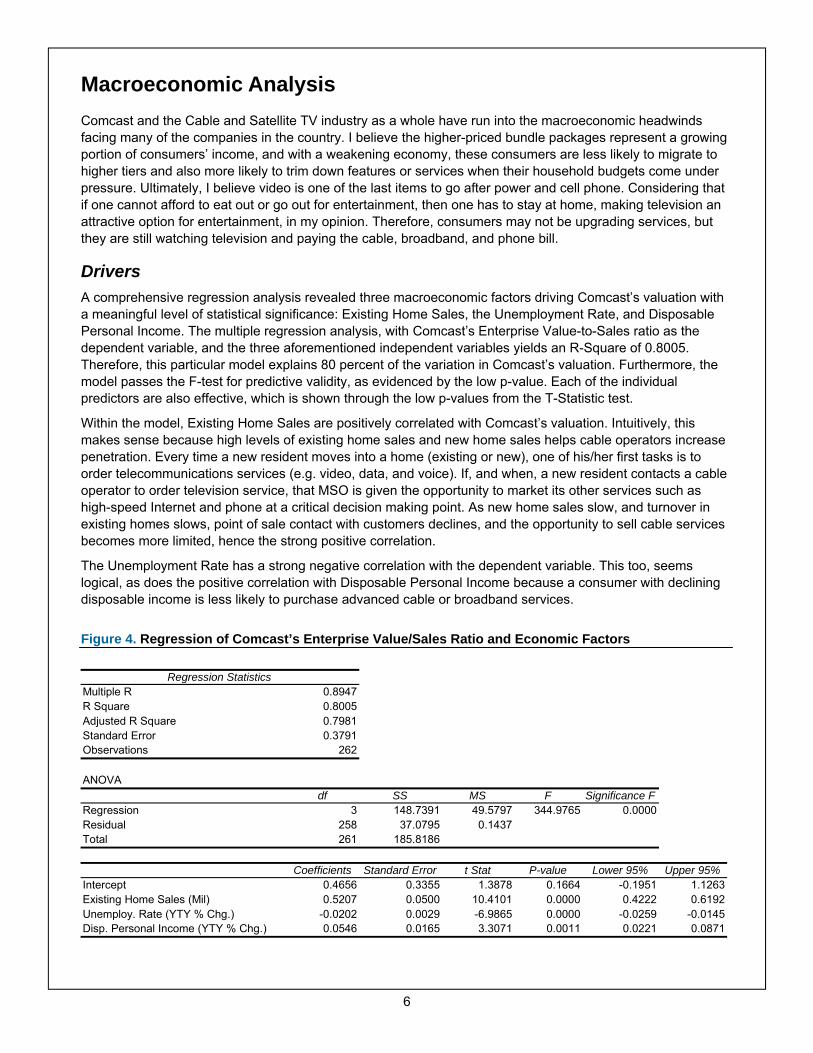
Drivers A comprehensive regression analysis revealed three macroeconomic factors driving Comcast’s valuation with a meaningful level of statistical significance: Existing Home Sales, the Unemployment Rate, and Disposable Personal Income. The multiple regression analysis, with Comcast’s Enterprise Value-to-Sales ratio as the dependent variable, and the three aforementioned independent variables yields an R-Square of 0.8005. Therefore, this particular model explains 80 percent of the variation in Comcast’s valuation. Furthermore, the model passes the F-test for predictive validity, as evidenced by the low p-value. Each of the individual predictors are also effective, which is shown through the low p-values from the T-Statistic test.
Within the model, Existing Home Sales are positively correlated with Comcast’s valuation. Intuitively, this makes sense because high levels of existing home sales and new home sales helps cable operators increase penetration. Every time a new resident moves into a home (existing or new), one of his/her first tasks is to order telecommunications services (e.g. video, data, and voice). If, and when, a new resident contacts a cable operator to order television service, that MSO is given the opportunity to market its other services such as high-speed Internet and phone at a critical decision making point. As new home sales slow, and turnover in existing homes slows, point of sale contact with customers declines, and the opportunity to sell cable services becomes more limited, hence the strong positive correlation.
The Unemployment Rate has a strong negative correlation with the dependent variable. This too, seems logical, as does the positive correlation with Disposable Personal Income because a consumer with declining disposable income is less likely to purchase advanced cable or broadband services.
Figure 4. Regression of Comcast’s Enterprise Value/Sales Ratio and Economic Factors
Regression StatisticsMultiple R 0.8947R Square 0.8005Adjusted R Square 0.7981Standard Error 0.3791Observations 262
ANOVAdf SS MS F Significance F
Regression 3 148.7391 49.5797 344.9765 0.0000Residual 258 37.0795 0.1437Total 261 185.8186
Coefficients Standard Error t Stat P-value Lower 95% Upper 95%Intercept 0.4656 0.3355 1.3878 0.1664 -0.1951 1.1263Existing Home Sales (Mil) 0.5207 0.0500 10.4101 0.0000 0.4222 0.6192Unemploy. Rate (YTY % Chg.) -0.0202 0.0029 -6.9865 0.0000 -0.0259 -0.0145Disp. Personal Income (YTY % Chg.) 0.0546 0.0165 3.3071 0.0011 0.0221 0.0871
7
Outlook My outlook for the general economy over the next twelve months is bleak. Perhaps the sole bright spot in the past several months for consumers has been a sharp retreat in oil prices to below $40 a barrel (versus a $148/barrel peak in July 2008), which should help ease consumers’ outlays for gasoline and home energy. A number of Cable and Satellite TV providers have recently cited the slowdown in the economy as having an impact on subscriber growth and advanced service purchases (HD, VOD, DVR, Pay-per-view).5 However, history has shown that share prices will likely bottom before the economic fundamentals start to improve, this bodes well for stocks. Since 1949, bear markets have bottomed a median of five months before recessions have ended, and eight months before corporate earnings have troughed.6 While this bodes well for stocks, it also implies that the economic fundamentals will be depressing for some time in the future.
With respect to the predictors in the model, Existing Home Sales are currently at their lowest levels in nearly twelve years. The most recent decline was 5.3 percent in January and I am expecting the number of units sold to decline into the second half of 2009, before picking up at the end of this year.7 Housing prices are returning to reasonable or normal levels, however they most likely have to become subnormal for a period to eliminate the excess supply. Therefore, over the next six months I expect this predictor to keep downward pressure on valuation multiples. I expect that in the fourth quarter of 2009 housing prices will get to extremely attractive levels and consumers will jump on bargains, in turn helping cable companies get in front of potential customers once again.
The Unemployment Rate currently stands at a 16-year high of 7.6 percent. The Federal Reserve projects that the Unemployment Rate could climb as high as 8.8 percent by the end of this year.8 The negative correlation this variable has with the model and the dismal figures that likely lie ahead will be forcing multiples to maintain their current low levels. There is certainly no way to spin this positively for Comcast or the Cable and Satellite TV industry, however I do not feel this will push valuations lower because I believe the higher unemployment expectations are already priced in to equity valuations.
Lastly, Disposable Personal Income increased in January by 1.7 percent after declining 0.2 percent in December.9 Low gasoline prices may be leaving some more cash in consumers pockets, however this excess cash may be saved rather than being spent on goods and services. I expect Disposable Personal Income to stay flat for the rest of 2009, before picking up momentum in 2010.
There are two things I would like to make a note of regarding these economic predictions—(1) these expectations are most likely priced in to equity valuations, therefore valuation levels may not depress further, but rather stay at low levels until there is a string of promising economic news; (2) the reduction in housing growth and turnover does have a silver lining for cable companies. When housing growth slows, cable line extension slows, and in turn, line extension capital expenditures are reduced and free cash flow increases. Even more, slowing housing growth and turnover reduces the churn associated with subscribers changing residences. Churn is the monthly customer disconnect rate. When move churn wanes, cable companies see decreasing costs from fewer trucks going out for maintenance and labor installation costs also decline.
With that said, I like the Comcast story within the context of a weakening economy. Although Comcast will feel some of the pinch in declining consumer demand, I believe cable’s business model produces stable and recurring revenues because of its ingrained position in the lifestyle of many consumers. Also, if stock prices bottom before the economy rebounds as history has shown, I think investors will be looking for investments with solid long-term investment characteristics, which will mean growth. I believe cable will maintain a better near and longer-term growth outlook than telecom, thus attracting additional capital as investors flow back in to the market.
5 Comcast Corporation and Time Warner Cable, Inc. Q4 2008 Earnings Conference Call 6 Standard and Poor’s Industry Surveys: Trends and Predictions, February 2009 7 Bater, Jeff and Brian Blackstone. “Continuing Jobless Claims Top 5 Million: New-Home Sales, Durable-Goods Orders Drop.” The Wall Street Journal On-Line Edition. 26-February-2009. 8 Bater, Jeff and Brian Blackstone. “Continuing Jobless Claims Top 5 Million: New-Home Sales, Durable-Goods Orders Drop.” The Wall Street Journal On-Line Edition. 26-February-2009. 9 Evans, Kelly. “Shoppers’ New Frugality Hurts Business.” The Wall Street Journal On-Line Edition. 3-March-2009.
8
Industry Analysis Comcast is part of the Cable and Satellite TV industry within the Consumer Discretionary sector. Over the past several years, the previously distinct cable and telecommunication industries have moved closer together as they begin to cross over into each other’s core competencies. The reasons for this are many, but the main drivers appear to be technological advancement and the need for continued growth. I believe over the next several years, the two industries will begin to converge and look more and more alike.
Current Life Cycle I believe the Cable and Satellite TV industry has moved from a mature to a growth phase of its life cycle and will continue to grow over my forecasting horizon, largely due to technological changes. The mature to growth transition is highlighted by the fact that basic or analog cable services are being replaced by all-digital platforms that will open up a significant amount of bandwidth previously tied up in the analog based system. In turn, this unlocked bandwidth will provide the capabilities for faster Internet, advanced viewing options, such as high-definition channels, video-on-demand, and digital-video-recording, as well as more interactive applications. This transition has been taking place since the late-1990s when industry participants placed significant investments in a hybrid cable plant flexible enough to support multiple systems, such as video, data, and voice.10 I believe the industry will have an array of new growth opportunities present themselves as the transition to all-digital progresses.
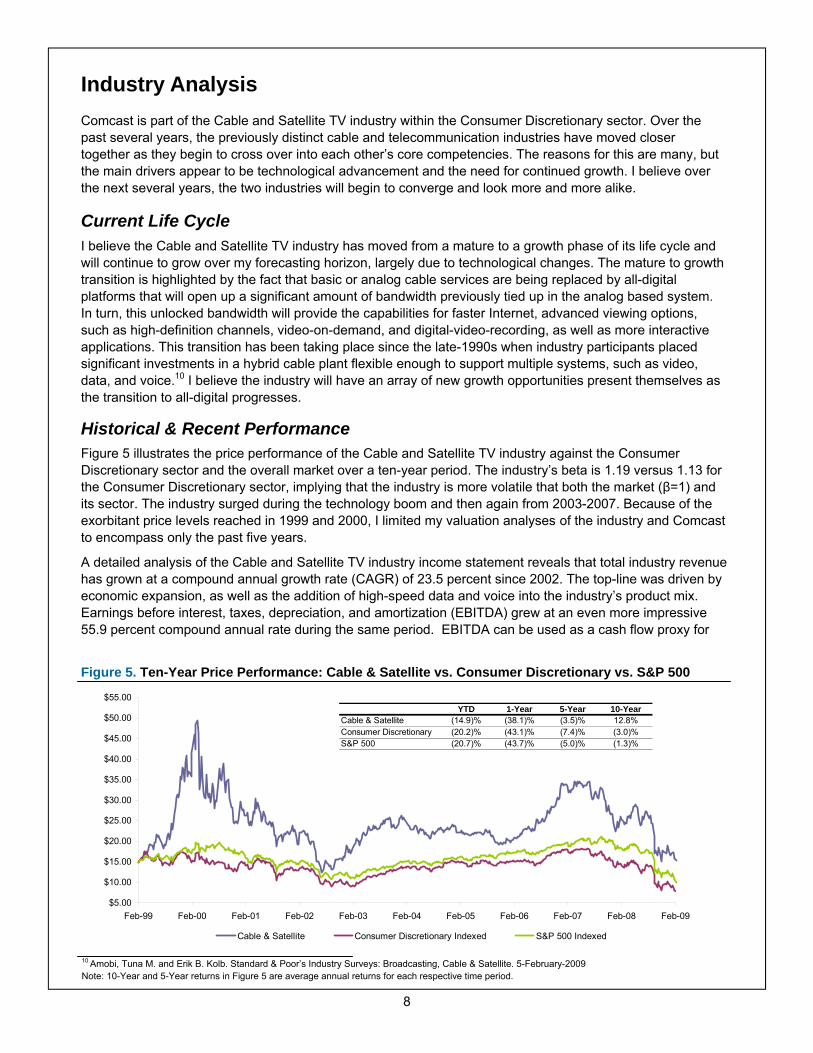
Historical & Recent Performance Figure 5 illustrates the price performance of the Cable and Satellite TV industry against the Consumer Discretionary sector and the overall market over a ten-year period. The industry’s beta is 1.19 versus 1.13 for the Consumer Discretionary sector, implying that the industry is more volatile that both the market (β=1) and its sector. The industry surged during the technology boom and then again from 2003-2007. Because of the exorbitant price levels reached in 1999 and 2000, I limited my valuation analyses of the industry and Comcast to encompass only the past five years.
A detailed analysis of the Cable and Satellite TV industry income statement reveals that total industry revenue has grown at a compound annual growth rate (CAGR) of 23.5 percent since 2002. The top-line was driven by economic expansion, as well as the addition of high-speed data and voice into the industry’s product mix. Earnings before interest, taxes, depreciation, and amortization (EBITDA) grew at an even more impressive 55.9 percent compound annual rate during the same period. EBITDA can be used as a cash flow proxy for
Figure 5. Ten-Year Price Performance: Cable & Satellite vs. Consumer Discretionary vs. S&P 500
10 Amobi, Tuna M. and Erik B. Kolb. Standard & Poor’s Industry Surveys: Broadcasting, Cable & Satellite. 5-February-2009 Note: 10-Year and 5-Year returns in Figure 5 are average annual returns for each respective time period.
$5.00
$10.00
$15.00
$20.00
$25.00
$30.00
$35.00
$40.00
$45.00
$50.00
$55.00
Feb-99 Feb-00 Feb-01 Feb-02 Feb-03 Feb-04 Feb-05 Feb-06 Feb-07 Feb-08 Feb-09
Cable & Satellite Consumer Discretionary Indexed S&P 500 Indexed
YTD 1-Year 5-Year 10-YearCable & Satellite (14.9)% (38.1)% (3.5)% 12.8%Consumer Discretionary (20.2)% (43.1)% (7.4)% (3.0)%S&P 500 (20.7)% (43.7)% (5.0)% (1.3)%
9
any company so long as the figure is positive; it is particularly relevant for Cable and Satellite companies because they have large amounts of depreciation due to the capital intensive nature of the business. Depreciation and amortization are non-cash expenses, therefore they are added back to operating income. EBITDA can be used to assess a company’s profitability and their ability to generate cash flow that excludes the impact of financing decisions. Gross margins stood at 45 percent in 2002, and they have since grown to 51 percent. Furthermore, earnings-per-share for the industry has grown at a 27 percent CAGR since 2003.
In 2008, Cable and Satellite TV companies’ profitability came under pressure due to fewer than expected subscriber additions and fewer customers purchasing advanced entertainment options. However, both Comcast and Time Warner Cable stated in their 4Q 2008 earnings calls that they are seeing the phones ring more in the first quarter of 2009 than they were in October and November of 2008, which is a positive near-term outlook for the industry. Comcast also stated that they are not seeing large numbers of people dropping their television service due to either financial hardship or the fact that they can get video increasingly over the Internet.
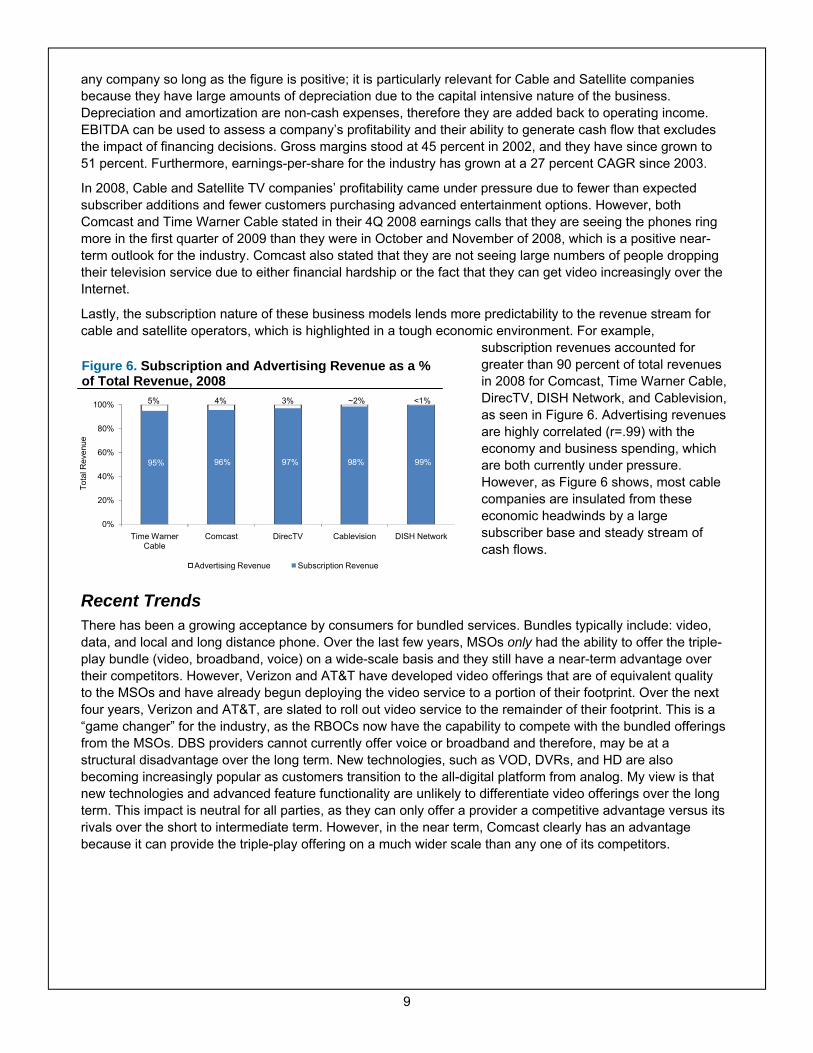
Lastly, the subscription nature of these business models lends more predictability to the revenue stream for cable and satellite operators, which is highlighted in a tough economic environment. For example,
subscription revenues accounted for greater than 90 percent of total revenues in 2008 for Comcast, Time Warner Cable, DirecTV, DISH Network, and Cablevision, as seen in Figure 6. Advertising revenues are highly correlated (r=.99) with the economy and business spending, which are both currently under pressure. However, as Figure 6 shows, most cable companies are insulated from these economic headwinds by a large subscriber base and steady stream of cash flows.
Recent Trends There has been a growing acceptance by consumers for bundled services. Bundles typically include: video, data, and local and long distance phone. Over the last few years, MSOs only had the ability to offer the triple-play bundle (video, broadband, voice) on a wide-scale basis and they still have a near-term advantage over their competitors. However, Verizon and AT&T have developed video offerings that are of equivalent quality to the MSOs and have already begun deploying the video service to a portion of their footprint. Over the next four years, Verizon and AT&T, are slated to roll out video service to the remainder of their footprint. This is a “game changer” for the industry, as the RBOCs now have the capability to compete with the bundled offerings from the MSOs. DBS providers cannot currently offer voice or broadband and therefore, may be at a structural disadvantage over the long term. New technologies, such as VOD, DVRs, and HD are also becoming increasingly popular as customers transition to the all-digital platform from analog. My view is that new technologies and advanced feature functionality are unlikely to differentiate video offerings over the long term. This impact is neutral for all parties, as they can only offer a provider a competitive advantage versus its rivals over the short to intermediate term. However, in the near term, Comcast clearly has an advantage because it can provide the triple-play offering on a much wider scale than any one of its competitors.
Figure 6. Subscription and Advertising Revenue as a % of Total Revenue, 2008
95% 96% 97% 98% 99%
0%
20%
40%
60%
80%
100%
Time Warner Cable
Comcast DirecTV Cablevision DISH Network
Tota
l Rev
enue
Advertising Revenue Subscription Revenue
5% 4% 3% ~2% <1%
10
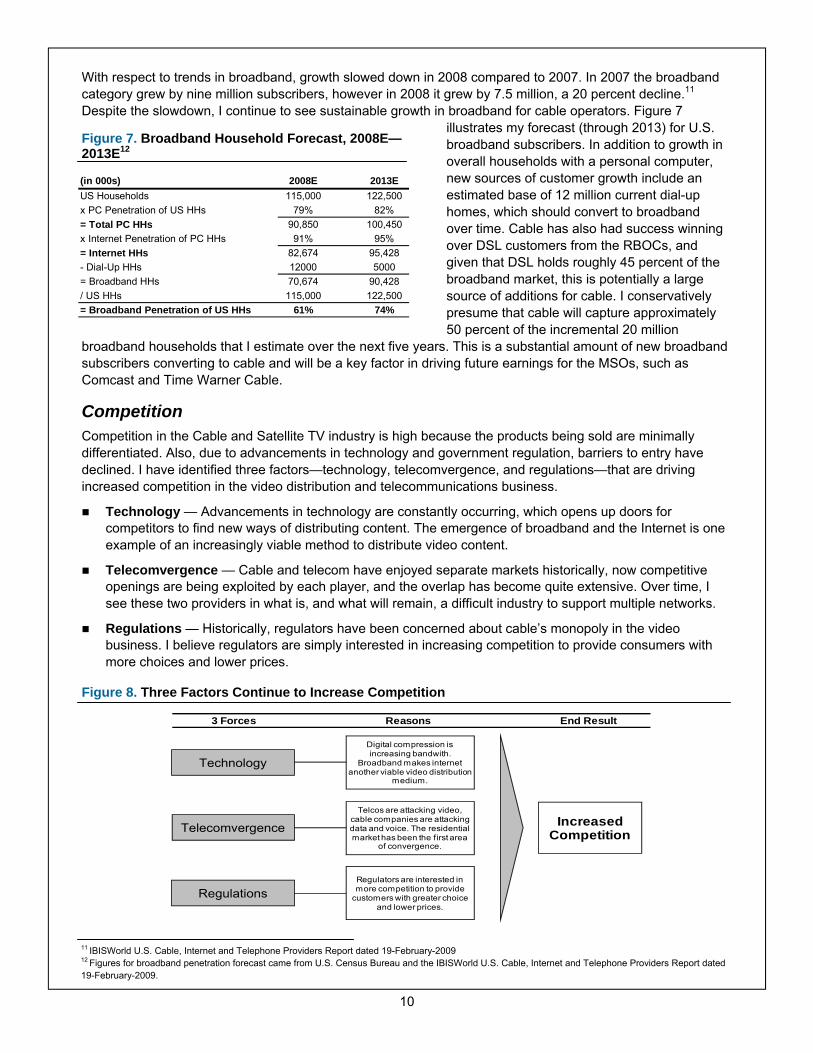
With respect to trends in broadband, growth slowed down in 2008 compared to 2007. In 2007 the broadband category grew by nine million subscribers, however in 2008 it grew by 7.5 million, a 20 percent decline.11
Despite the slowdown, I continue to see sustainable growth in broadband for cable operators. Figure 7 illustrates my forecast (through 2013) for U.S. broadband subscribers. In addition to growth in overall households with a personal computer, new sources of customer growth include an estimated base of 12 million current dial-up homes, which should convert to broadband over time. Cable has also had success winning over DSL customers from the RBOCs, and given that DSL holds roughly 45 percent of the broadband market, this is potentially a large source of additions for cable. I conservatively presume that cable will capture approximately
50 percent of the incremental 20 million broadband households that I estimate over the next five years. This is a substantial amount of new broadband subscribers converting to cable and will be a key factor in driving future earnings for the MSOs, such as Comcast and Time Warner Cable.
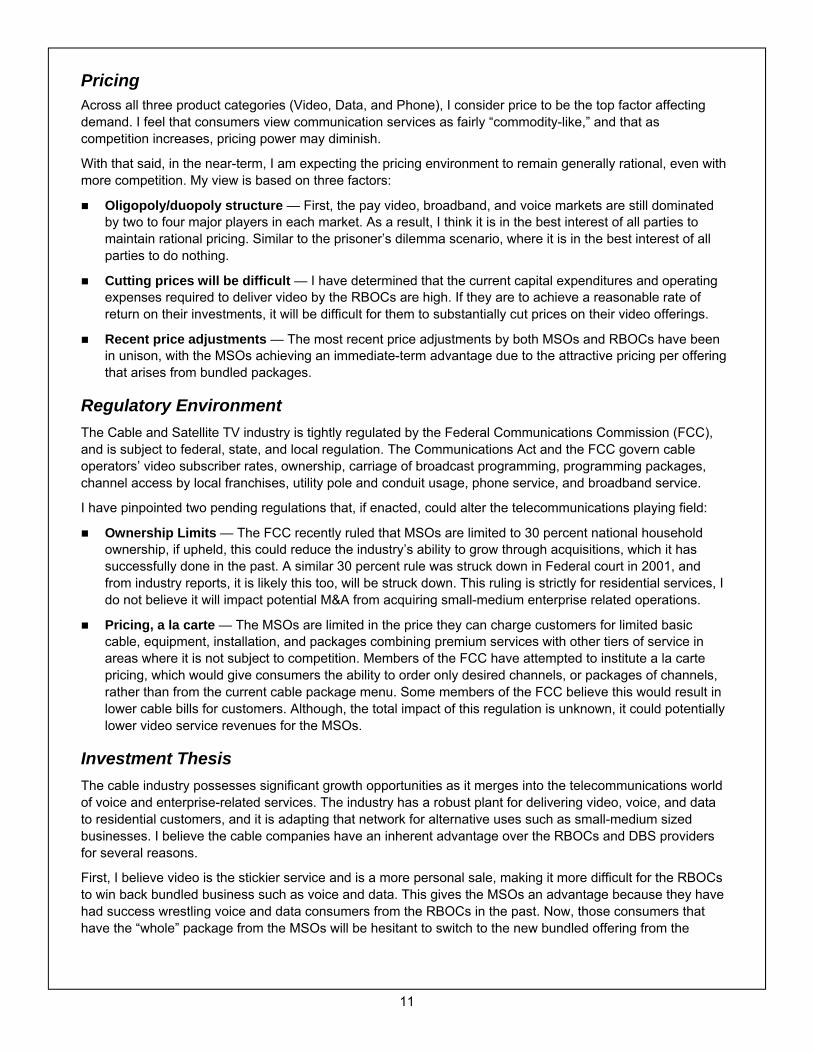
Competition Competition in the Cable and Satellite TV industry is high because the products being sold are minimally differentiated. Also, due to advancements in technology and government regulation, barriers to entry have declined. I have identified three factors—technology, telecomvergence, and regulations—that are driving increased competition in the video distribution and telecommunications business.
Technology — Advancements in technology are constantly occurring, which opens up doors for competitors to find new ways of distributing content. The emergence of broadband and the Internet is one example of an increasingly viable method to distribute video content.
Telecomvergence — Cable and telecom have enjoyed separate markets historically, now competitive openings are being exploited by each player, and the overlap has become quite extensive. Over time, I see these two providers in what is, and what will remain, a difficult industry to support multiple networks.
Regulations — Historically, regulators have been concerned about cable’s monopoly in the video business. I believe regulators are simply interested in increasing competition to provide consumers with more choices and lower prices.
Figure 8. Three Factors Continue to Increase Competition
3 Forces Reasons End Result
Technology
Telecomvergence
Regulations
Digital compression is increasing bandwith.
Broadband makes internet another viable video distribution
medium.
Telcos are attacking video, cable companies are attacking data and voice. The residential market has been the first area
of convergence.
Regulators are interested in more competition to provide
customers with greater choice and lower prices.
IncreasedCompetition
(in 000s) 2008E 2013EUS Households 115,000 122,500x PC Penetration of US HHs 79% 82%= Total PC HHs 90,850 100,450x Internet Penetration of PC HHs 91% 95%= Internet HHs 82,674 95,428- Dial-Up HHs 12000 5000= Broadband HHs 70,674 90,428/ US HHs 115,000 122,500= Broadband Penetration of US HHs 61% 74%
Figure 7. Broadband Household Forecast, 2008E—2013E12
11 IBISWorld U.S. Cable, Internet and Telephone Providers Report dated 19-February-2009 12 Figures for broadband penetration forecast came from U.S. Census Bureau and the IBISWorld U.S. Cable, Internet and Telephone Providers Report dated 19-February-2009.
11
Pricing Across all three product categories (Video, Data, and Phone), I consider price to be the top factor affecting demand. I feel that consumers view communication services as fairly “commodity-like,” and that as competition increases, pricing power may diminish.
With that said, in the near-term, I am expecting the pricing environment to remain generally rational, even with more competition. My view is based on three factors:
Oligopoly/duopoly structure — First, the pay video, broadband, and voice markets are still dominated by two to four major players in each market. As a result, I think it is in the best interest of all parties to maintain rational pricing. Similar to the prisoner’s dilemma scenario, where it is in the best interest of all parties to do nothing.
Cutting prices will be difficult — I have determined that the current capital expenditures and operating expenses required to deliver video by the RBOCs are high. If they are to achieve a reasonable rate of return on their investments, it will be difficult for them to substantially cut prices on their video offerings.
Recent price adjustments — The most recent price adjustments by both MSOs and RBOCs have been in unison, with the MSOs achieving an immediate-term advantage due to the attractive pricing per offering that arises from bundled packages.
Regulatory Environment The Cable and Satellite TV industry is tightly regulated by the Federal Communications Commission (FCC), and is subject to federal, state, and local regulation. The Communications Act and the FCC govern cable operators’ video subscriber rates, ownership, carriage of broadcast programming, programming packages, channel access by local franchises, utility pole and conduit usage, phone service, and broadband service.
I have pinpointed two pending regulations that, if enacted, could alter the telecommunications playing field:
Ownership Limits — The FCC recently ruled that MSOs are limited to 30 percent national household ownership, if upheld, this could reduce the industry’s ability to grow through acquisitions, which it has successfully done in the past. A similar 30 percent rule was struck down in Federal court in 2001, and from industry reports, it is likely this too, will be struck down. This ruling is strictly for residential services, I do not believe it will impact potential M&A from acquiring small-medium enterprise related operations.
Pricing, a la carte — The MSOs are limited in the price they can charge customers for limited basic cable, equipment, installation, and packages combining premium services with other tiers of service in areas where it is not subject to competition. Members of the FCC have attempted to institute a la carte pricing, which would give consumers the ability to order only desired channels, or packages of channels, rather than from the current cable package menu. Some members of the FCC believe this would result in lower cable bills for customers. Although, the total impact of this regulation is unknown, it could potentially lower video service revenues for the MSOs.
Investment Thesis The cable industry possesses significant growth opportunities as it merges into the telecommunications world of voice and enterprise-related services. The industry has a robust plant for delivering video, voice, and data to residential customers, and it is adapting that network for alternative uses such as small-medium sized businesses. I believe the cable companies have an inherent advantage over the RBOCs and DBS providers for several reasons.
First, I believe video is the stickier service and is a more personal sale, making it more difficult for the RBOCs to win back bundled business such as voice and data. This gives the MSOs an advantage because they have had success wrestling voice and data consumers from the RBOCs in the past. Now, those consumers that have the “whole” package from the MSOs will be hesitant to switch to the new bundled offering from the
12
RBOCs. Furthermore, the MSOs can offer consumers their bundled packages across their entire footprint, whereas the RBOCs are in the early stages of rolling out their respective packages. I also believe video is one of the highest priorities for consumers when they purchase or relocate to a new house or apartment, giving a natural advantage to the cable companies in selling video, data, and voice all at once because DBS providers are incapable of providing data and voice, and the RBOCs do not have as extensive of a footprint.
Second, cable’s ability to drive broadband additions over the last two years has been impressive. Comcast grew broadband penetration by 13 percent and 8 percent, respectively in 2007 and 2008. Furthermore, Comcast grew phone penetration by 42 percent in 2007 and 29 percent in 2008. The broadband and phone penetration levels are coming to the MSOs even when the competing RBOC phone and DSL products are heavily discounted. On its full year 2008 conference call, Comcast noted that 66 percent of its HSD net additions in the 2008 were DSL subscribers switching over to cable HSD versus 44 percent of net additions two years ago. Furthermore, the introduction of higher-speed offerings, specifically through DOCSIS 3.0, will drive incremental market share for MSOs over the next five years.
Third, I believe MSOs are on the first few years of a ramp to taking small-medium enterprise (SME) customers from the RBOCs. Comcast, for example, noted this expansion in their 4th Quarter and Full Year 2008 earnings call. The MSOs do not have the plant to provide telecommunication services to sophisticated customers at this point, but there is ample “low-hanging fruit” that can be captured in the current marketplace. I feel this market represents the biggest growth opportunity for the MSOs.
This investment thesis lays out the reasons I prefer cable over the RBOCs and DBS providers in the Cable and Satellite TV industry. This is largely driven by the fact that consumers indicate a preference for bundling and cable has the only platform capable of providing the desirable triple-play bundle on a wide-scale basis. The thesis is also supported by the MSOs recent success in obtaining small-medium enterprise customers away from the RBOCs.
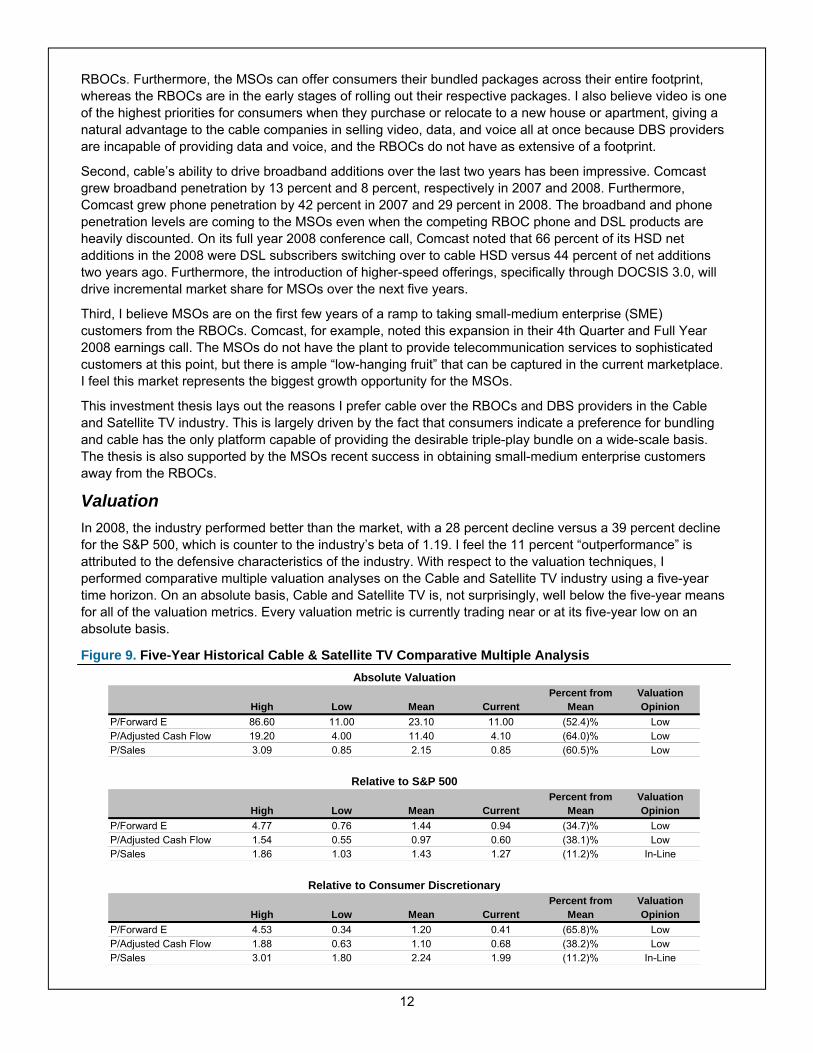
Valuation In 2008, the industry performed better than the market, with a 28 percent decline versus a 39 percent decline for the S&P 500, which is counter to the industry’s beta of 1.19. I feel the 11 percent “outperformance” is attributed to the defensive characteristics of the industry. With respect to the valuation techniques, I performed comparative multiple valuation analyses on the Cable and Satellite TV industry using a five-year time horizon. On an absolute basis, Cable and Satellite TV is, not surprisingly, well below the five-year means for all of the valuation metrics. Every valuation metric is currently trading near or at its five-year low on an absolute basis.
Figure 9. Five-Year Historical Cable & Satellite TV Comparative Multiple Analysis Absolute Valuation
Percent from ValuationHigh Low Mean Current Mean Opinion
P/Forward E 86.60 11.00 23.10 11.00 (52.4)% LowP/Adjusted Cash Flow 19.20 4.00 11.40 4.10 (64.0)% LowP/Sales 3.09 0.85 2.15 0.85 (60.5)% Low
Relative to S&P 500Percent from Valuation
High Low Mean Current Mean OpinionP/Forward E 4.77 0.76 1.44 0.94 (34.7)% LowP/Adjusted Cash Flow 1.54 0.55 0.97 0.60 (38.1)% LowP/Sales 1.86 1.03 1.43 1.27 (11.2)% In-Line
Relative to Consumer DiscretionaryPercent from Valuation
High Low Mean Current Mean OpinionP/Forward E 4.53 0.34 1.20 0.41 (65.8)% LowP/Adjusted Cash Flow 1.88 0.63 1.10 0.68 (38.2)% LowP/Sales 3.01 1.80 2.24 1.99 (11.2)% In-Line
13
Referring back to Figure 9, the current Price-to-Year Forward Earnings and Price-to-Adjusted Cash Flow for the industry relative to the Consumer Discretionary sector are well below 1, indicating they are trading below the sector. One would think this particular industry would be one of the few shelters among Consumer Discretionary stocks during a recession because of cable, Internet, and phone’s important positions in the every day lives of consumers. I view this is as an oversold signal for the Cable and Satellite TV industry. The comparative analysis confirms my opinion that there is considerable upside for the industry, and more specifically, the cable MSOs, over the next twelve months.
Company Analysis
Competitive Advantages The Cable and Satellite TV industry is highly competitive. Competitive advantages are not static due to advancements in technology and government regulation fueling new product offerings and waves of competition. I have identified four competitive advantages for Comcast within the current environment:
Infrastructure Size and Location — Comcast has built and acquired the largest hybrid fiber-coaxial network that passes over 50 million U.S. households (see Figure 1) and is flexible enough to support video, data, and voice. Economies of scale count for something in this business. Once a base plant has been laid and the associated capital expenditures are incurred, subscription revenues are generated and free cash flow increases commensurately, which is what Comcast is experiencing.
Technological Position — Comcast is upgrading its network to offer faster speeds and more content to better compete with the satellite and phone companies. A major network initiative is the migration to DOCSIS 3.0, which will significantly increase bandwidth for high-speed data. Customers will have the possibility of download speeds in excess of 100 Mbps. DOCSIS 3.0 should be virtually as strong in terms of speed and reliability as what FiOS and U-Verse can offer. The Company is also completely transitioning to digital video and eliminating analog channels in its lineup, which will give Comcast the ability to (1) Offer essentially an unlimited number of channels, (2) Offer higher-quality HD channels, (3) Offer more phone lines and higher data speeds, and (4) Offer other applications that have yet to be developed or deployed.
Phone Service — In my view, phone service lacks the ability to be differentiated in the way that HSD service can via speed, implying that phone service pricing will remain an important driver for subscriber retention and growth. The technology Comcast uses to deliver phone service (VoIP), gives it the ability to continue to discount phone service while maintaining product profitability. Comcast’s phone service gross margins are in the range of 70-85 percent, well above its competitors. Price wars that lead to major retail price declines are not good for any competitor, but Comcast can continue to reduce the price of its phone service over time and maintain solid profitability on its voice product.
High Speed Data Service — I feel HSD is the least commoditized product within the triple-play bundle because consumers care as much about the speed and reliability of their HSD product as they do about its price. Comcast’s HSD product is superior to the RBOC’s wide-scale DSL offering in terms of its speed, and is also viewed as more reliable. As Internet applications become increasingly bandwidth-intensive (e.g. Website graphics and data, software downloads), and consumers become more dependent on the Internet for multimedia use, I expect consumers to continue to place a high value on the speed and reliability of their Internet connection. The DOCSIS 3.0 roll out, which is in progress, will support this advantage even further.
Financial Statements Analysis Income Statement
There are two primary factors driving Comcast’s rising earnings: (1) increased high-speed data and voice penetration and (2) customers switching to all-digital platforms. First, I believe the gross margins for data and voice are roughly 95 percent, and 70-85 percent, respectively, which is expanding overall margins as
14
Comcast’s revenue mix shifts toward its data and voice services. Second, as customers transition to digital from analog platforms, they can purchase advanced services, such as video on demand and digital video recording. Comcast cites that 45 percent of customers take these advanced services, generating average monthly revenue of $80-$85.
From 2005-2008, free cash flow (FCF) grew at a compound annual growth rate of 22 percent. In an effort to return this FCF to shareholders, the Company instituted a share buyback program in 2007 and a 25 cent dividend for 2008. The buyback program has been halted for the time being, while the Company increased the annual dividend to 27 cents for 2009.
Balance Sheet
The status of a company’s balance sheet is crucial, especially in the midst of these tough economic times. Comcast has $32.5 billion of debt and $1.2 billion of cash and short-term investments as of the end of 2008. This capital structure implies the Company is sitting on a 2.8x leverage ratio (Total Assets/Total Shareholder’s Equity). The industry average is ~4.0x, therefore I believe this gives the Company sufficient flexibility to invest in new initiatives.
In the fourth quarter of 2008, Comcast used FCF to de-lever as opposed to paying it back to shareholders. This will likely continue into 2009 as well. Moody’s is considering upgrading their credit rating, citing the Company’s financial flexibility and strong free cash flow generation, which is a positive for the Company because in the event it does need to access the capital markets, it will be able to borrow at a lower rate. I believe the decision to de-lever is driven by the desire to maintain a conservative capital structure, and is not a signal that the Company is preparing for an acquisition in the near term, for that would require someone willing to sell cable assets. Someone who does not have to sell at the moment is likely to remain on the sidelines, given the scarcity of potential buyers.
An alternative to deleveraging would have been to return more capital to shareholders, which clearly would have been preferable. With that said, I explain the outlook for FCF below and it is undoubtedly bright, therefore shareholder returns through increased dividends and share buybacks are going to occur sooner rather than later. The Company’s balance sheet will be in an extremely strong position when the economy turns around, which I view as a positive catalyst for the stock.
Capital Expenditures & Free Cash Flow
Comcast’s asset base generates relatively predictable and stable cash flows, and the one big variable limiting the conversion to FCF is capital expenditures. Management has said that capital expenditures will decline over the next two years. Therefore, I believe Comcast can continue to grow its FCF at approximately 20 percent annually through 2010. Beyond this point, FCF growth should slow, but remain in the 5-10 percent range per year.
Technological advancements and competition will determine whether Comcast needs to pursue another major upgrade cycle in 5-10 years. At this point, I feel Comcast has a number of economical bandwidth expansion options available without incurring huge capital outlays. Nevertheless, in my discounted cash flow equity valuation I included a scenario where competition heightens to unanticipated levels and a major plant upgrade is necessary to contend with the incumbents. This will be explained in the Equity Valuation: Discounted Cash Flow section of this report.
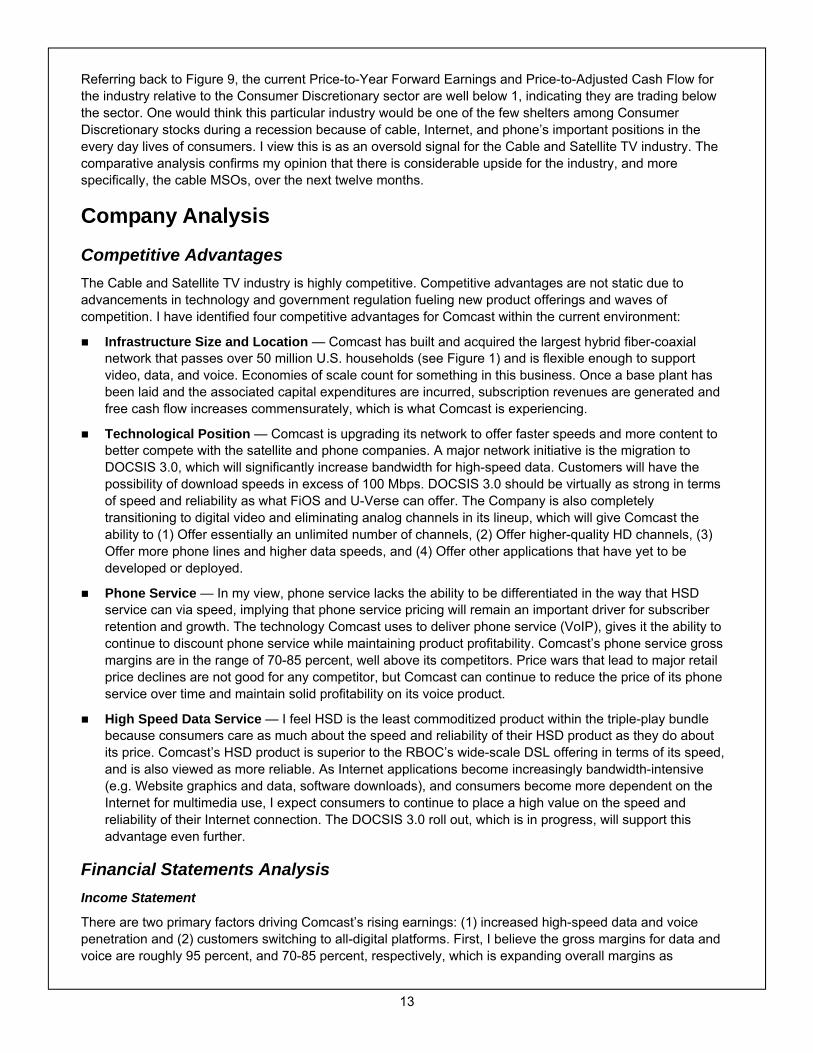
DuPont Analysis
I performed a DuPont analysis over the past five years to illustrate Comcast’s profitability and operational efficiency over time and relative to the industry (see Figure 10 on page 15).
Profit Margin (EBIT / Total Revenue) measures operational efficiency. When this ratio is positive and rising over time, as is the case with Comcast, it is a good sign that operating management is going well. Comcast is producing sales and controlling costs and as a result is earning more per dollar of sales. The margin is also sitting well above the industry median, implying the Company is better at managing costs than its competitors.
15
Asset Turnover (Total Revenue / Average Total Assets) measures how efficiently a company is using assets to generate sales, as higher asset turnover implies better asset management. Comcast is showing a rising asset turnover over time, but is currently below the median of its Cable and Satellite peers. The industry median is being skewed by the satellite TV providers because they do not have near the asset requirements that an MSO, such as Comcast or Time Warner Cable does. Satellite providers do not need to build a plant on the ground across the entire country like the MSOs. They have satellites that cover an enormous area, therefore their assets are lower, which skews the industry’s asset turnover higher.
Figure 10. DuPont Analysis for Comcast
Return on Investment (Profit Margin * Total Asset Turnover) measures the profitability of the assets used by the firm. This ratio should be rising over time. This ratio is unique because it can compare companies with different strategies. For example, the same levels of ROI can be achieved by either a high profit margin, low turnover strategy or by a low profit margin, high turnover strategy. In this case, profit on sales and asset turnover can be thought of as a strategic tradeoff. Comcast has a low turnover strategy because of the huge capital investment necessary to generate revenues in the cable industry, but this is offset with well above average profit margins.
Leverage Multiplier (Average Total Assets / Average Total Equity) is a representation of capital structure. This ratio typically should not be rising over time because an increase means that more debt is being used to finance the firm. There is a capital structure trade off associated with debt and equity, debt has a lower cost than equity, provides an interest tax shield and amplifies return on equity. Equity is a more expensive choice, but lowers the threat of bankruptcy. Comcast is currently in an enviable position as it is almost a complete turn below the industry median with respect to this metric. Although this metric is rising over time, as I mentioned in the Balance Sheet subsection above—Comcast has a conservative capital structure in place, which is imperative when capital markets are as volatile as they are currently.
Return on Equity (Return on Investment * Leverage Multiplier) is a measure of the profitability of funds invested by the owners of the firm, and should be as high as possible over time. It is important to discern what ROE is being driven by. Increasing ROI implies operational improvement whereas increasing leverage suggests higher debt levels and increased risk. Comcast’s ROE is being driven by increases in both metrics, but more so by ROI than leverage.
In summary, Comcast ranks above average in Profit Margin, ROI, Leverage Multiplier and ROE, and is also seeing positive trends over the past five years in most of these metrics. Over time, I am expecting Comcast’s ROI to increase as capital expenditures wane and as I mentioned earlier, the leverage multiplier will decline in 2009 due to the Company’s deleveraging initiative. In regards to ROE, going forward the increased ROI should offset any decline in profit margin and/or leverage. Overall, this analysis reveals that Comcast is a prudent and transparent investment with a track record of improving efficiencies and returns that should yield sustainable growth over the near and longer term.
Equity Valuation: Multiples I used several five-year comparative multiple valuation methods to determine the relative value of Comcast. I used five years of historical data versus ten years because as I mentioned in the Historical and Recent Performance section, trading levels for the industry hit irrational highs in the early part of this decade. I do not see the industry returning to these levels over my forecasting horizon. In an effort to discern the reasonableness of my multiples evaluation, I also examined Comcast’s share price relative to the S&P 500, Consumer Discretionary sector, and the Cable and Satellite TV industry.
LTM2004 2005 2006 2007 2008 Industry Median
Profit Margin (EBIT / Total Revenue) 14.72% 16.71% 18.50% 18.05% 19.65% 4.67% x Total Asset Turnover (Total Revenue / Avg. Total Assets) 0.18x 0.20x 0.23x 0.28x 0.30x 0.60x
= Return on Investment 2.65% 3.38% 4.32% 4.98% 5.95% 2.80% x Leverage Multiplier (Avg. Total Assets / Avg. Total Equity) 2.57x 2.55x 2.63x 2.71x 2.77x 3.68x
= Return on Equity 6.81% 8.63% 11.35% 13.52% 16.46% 10.30%
16
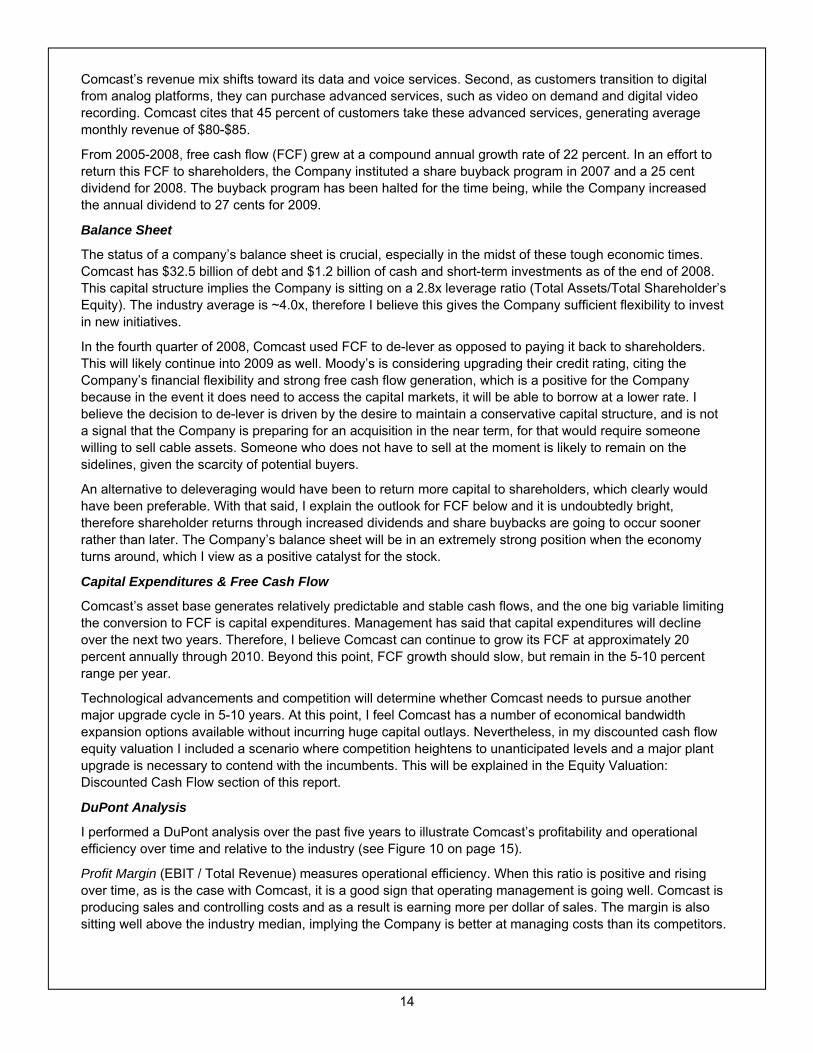
Absolute Valuation
Comcast is currently trading at a five-year low on every one of these valuation metrics. Over the past five years, the Cable and Satellite TV industry has undergone a transformation mainly driven by the convergence of cable MSOs and the telecommunication RBOCs. This increase in competition combined with the economy’s bleak outlook for 2009 served as the basis for my decision to revert the target multiples back to 50 percent of the five-year mean. The fair value this analysis reported for Comcast was $18.95 per share, or 51 percent above the current $12.50 share price.
Figure 11. CMCSA Absolute Valuation
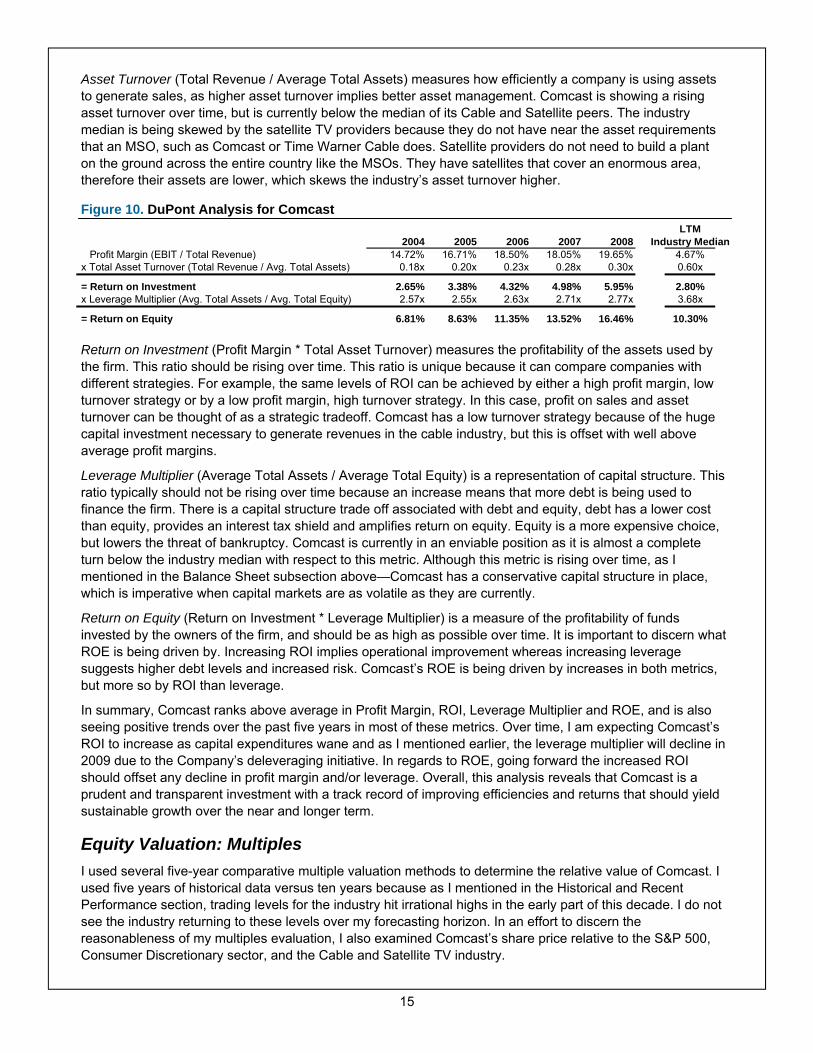
Comparable Valuation: S&P 500 My valuation opinion on each relative multiple is based on the current trading level relative to the respective group and the magnitude of the percentage differential to the mean. Because I do not foresee multiples reaching five-year mean levels in the next twelve months, my valuation opinion is more heavily weighted towards current relative trading levels. When comparing Comcast to the S&P 500, a similar undervaluation story is formed. Comcast is currently trading above the S&P 500 on a Price-to-Forward Earnings and Price-to-Sales basis, but below the market index in terms of Price-to-Adjusted Cash Flow and Price-to-EBITDA. Not surprisingly, all of the valuation metrics are currently near their five-year lows versus the S&P 500, indicating ample room on the upside. I view this analysis as a confirmation of my positive opinion on Comcast’s stock.
Figure 12. CMCSA Relative to the S&P 500
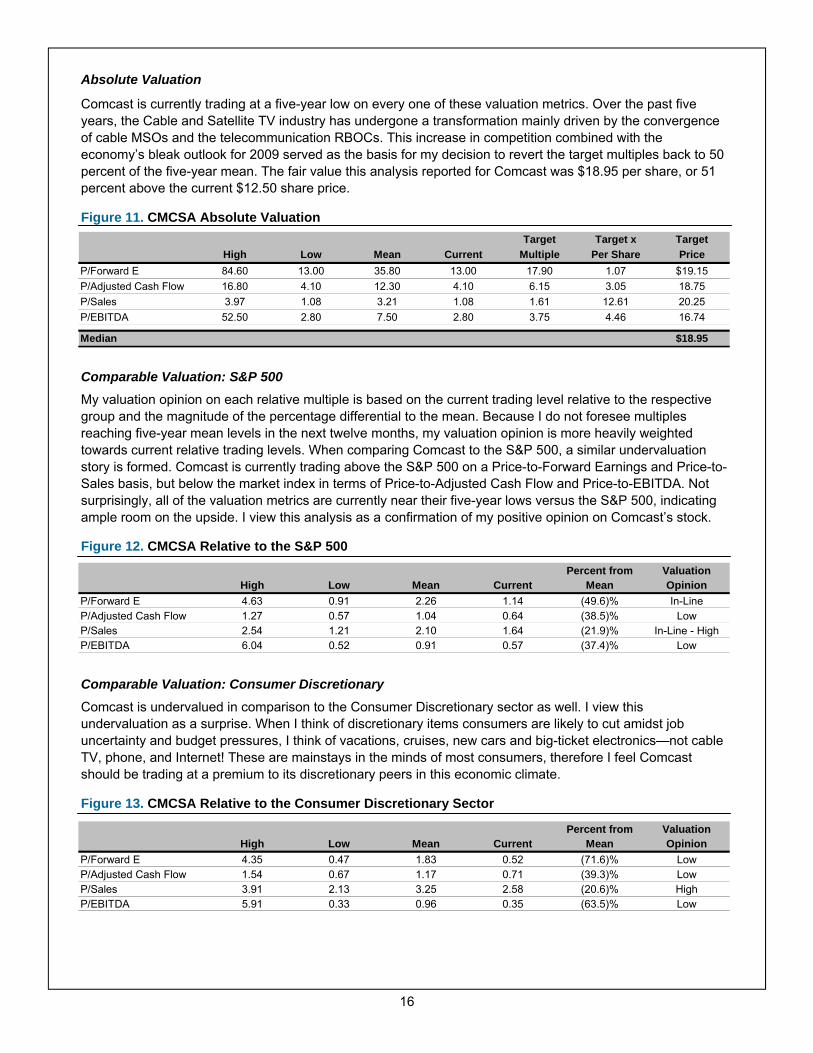
Comparable Valuation: Consumer Discretionary Comcast is undervalued in comparison to the Consumer Discretionary sector as well. I view this undervaluation as a surprise. When I think of discretionary items consumers are likely to cut amidst job uncertainty and budget pressures, I think of vacations, cruises, new cars and big-ticket electronics—not cable TV, phone, and Internet! These are mainstays in the minds of most consumers, therefore I feel Comcast should be trading at a premium to its discretionary peers in this economic climate.
Figure 13. CMCSA Relative to the Consumer Discretionary Sector
Target Target x TargetHigh Low Mean Current Multiple Per Share Price
P/Forward E 84.60 13.00 35.80 13.00 17.90 1.07 $19.15P/Adjusted Cash Flow 16.80 4.10 12.30 4.10 6.15 3.05 18.75P/Sales 3.97 1.08 3.21 1.08 1.61 12.61 20.25P/EBITDA 52.50 2.80 7.50 2.80 3.75 4.46 16.74
Median $18.95
Percent from ValuationHigh Low Mean Current Mean Opinion
P/Forward E 4.63 0.91 2.26 1.14 (49.6)% In-LineP/Adjusted Cash Flow 1.27 0.57 1.04 0.64 (38.5)% LowP/Sales 2.54 1.21 2.10 1.64 (21.9)% In-Line - HighP/EBITDA 6.04 0.52 0.91 0.57 (37.4)% Low
Percent from ValuationHigh Low Mean Current Mean Opinion
P/Forward E 4.35 0.47 1.83 0.52 (71.6)% LowP/Adjusted Cash Flow 1.54 0.67 1.17 0.71 (39.3)% LowP/Sales 3.91 2.13 3.25 2.58 (20.6)% HighP/EBITDA 5.91 0.33 0.96 0.35 (63.5)% Low
17
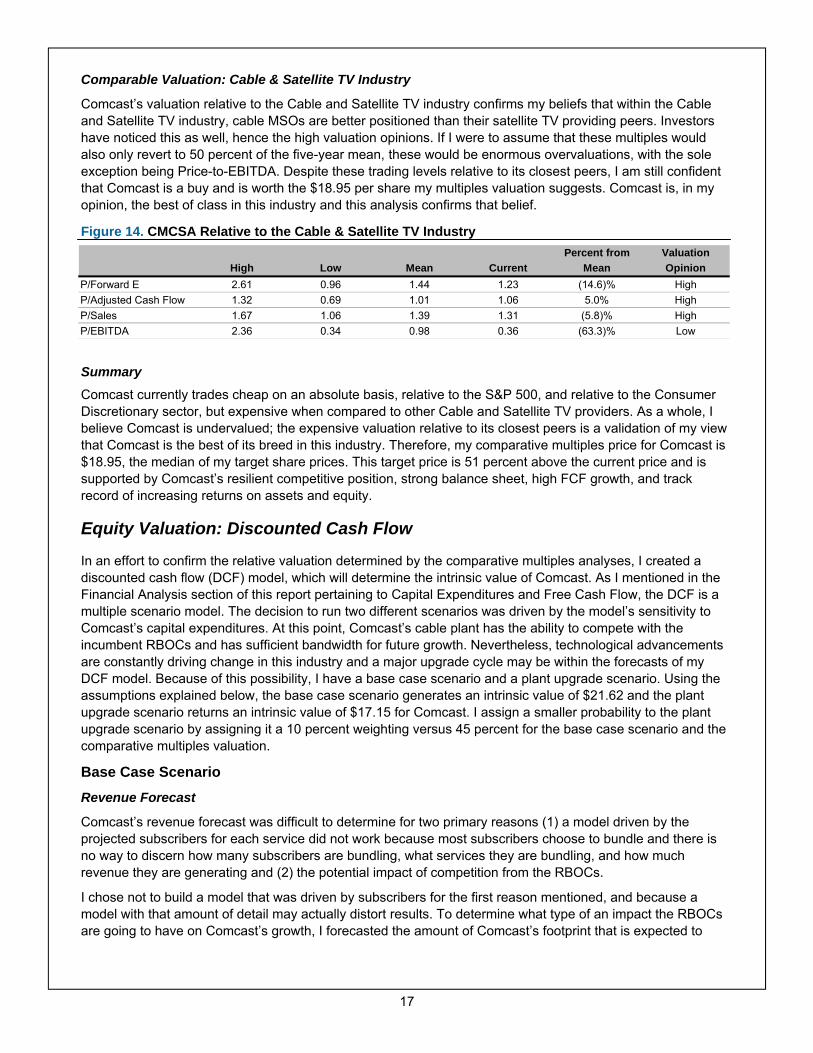
Comparable Valuation: Cable & Satellite TV Industry
Comcast’s valuation relative to the Cable and Satellite TV industry confirms my beliefs that within the Cable and Satellite TV industry, cable MSOs are better positioned than their satellite TV providing peers. Investors have noticed this as well, hence the high valuation opinions. If I were to assume that these multiples would also only revert to 50 percent of the five-year mean, these would be enormous overvaluations, with the sole exception being Price-to-EBITDA. Despite these trading levels relative to its closest peers, I am still confident that Comcast is a buy and is worth the $18.95 per share my multiples valuation suggests. Comcast is, in my opinion, the best of class in this industry and this analysis confirms that belief.
Figure 14. CMCSA Relative to the Cable & Satellite TV Industry
Summary Comcast currently trades cheap on an absolute basis, relative to the S&P 500, and relative to the Consumer Discretionary sector, but expensive when compared to other Cable and Satellite TV providers. As a whole, I believe Comcast is undervalued; the expensive valuation relative to its closest peers is a validation of my view that Comcast is the best of its breed in this industry. Therefore, my comparative multiples price for Comcast is $18.95, the median of my target share prices. This target price is 51 percent above the current price and is supported by Comcast’s resilient competitive position, strong balance sheet, high FCF growth, and track record of increasing returns on assets and equity.
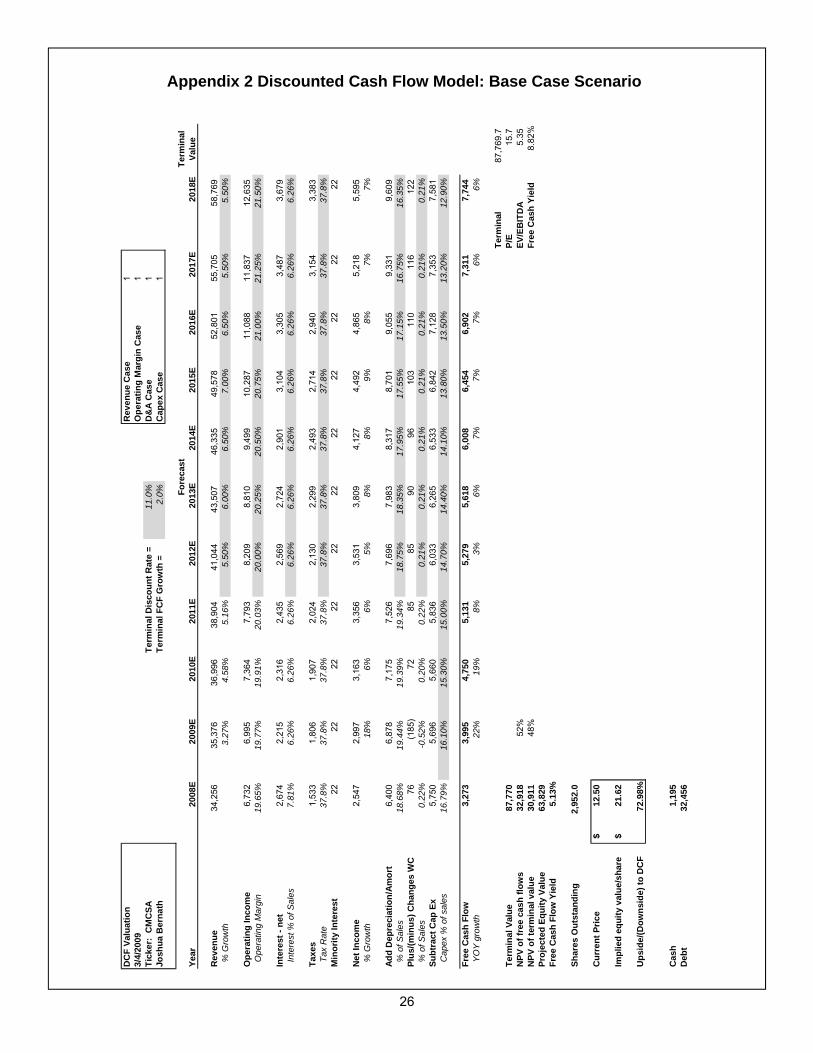
Equity Valuation: Discounted Cash Flow
In an effort to confirm the relative valuation determined by the comparative multiples analyses, I created a discounted cash flow (DCF) model, which will determine the intrinsic value of Comcast. As I mentioned in the Financial Analysis section of this report pertaining to Capital Expenditures and Free Cash Flow, the DCF is a multiple scenario model. The decision to run two different scenarios was driven by the model’s sensitivity to Comcast’s capital expenditures. At this point, Comcast’s cable plant has the ability to compete with the incumbent RBOCs and has sufficient bandwidth for future growth. Nevertheless, technological advancements are constantly driving change in this industry and a major upgrade cycle may be within the forecasts of my DCF model. Because of this possibility, I have a base case scenario and a plant upgrade scenario. Using the assumptions explained below, the base case scenario generates an intrinsic value of $21.62 and the plant upgrade scenario returns an intrinsic value of $17.15 for Comcast. I assign a smaller probability to the plant upgrade scenario by assigning it a 10 percent weighting versus 45 percent for the base case scenario and the comparative multiples valuation.
Base Case Scenario Revenue Forecast
Comcast’s revenue forecast was difficult to determine for two primary reasons (1) a model driven by the projected subscribers for each service did not work because most subscribers choose to bundle and there is no way to discern how many subscribers are bundling, what services they are bundling, and how much revenue they are generating and (2) the potential impact of competition from the RBOCs.
I chose not to build a model that was driven by subscribers for the first reason mentioned, and because a model with that amount of detail may actually distort results. To determine what type of an impact the RBOCs are going to have on Comcast’s growth, I forecasted the amount of Comcast’s footprint that is expected to
Percent from ValuationHigh Low Mean Current Mean Opinion
P/Forward E 2.61 0.96 1.44 1.23 (14.6)% HighP/Adjusted Cash Flow 1.32 0.69 1.01 1.06 5.0% HighP/Sales 1.67 1.06 1.39 1.31 (5.8)% HighP/EBITDA 2.36 0.34 0.98 0.36 (63.3)% Low
18
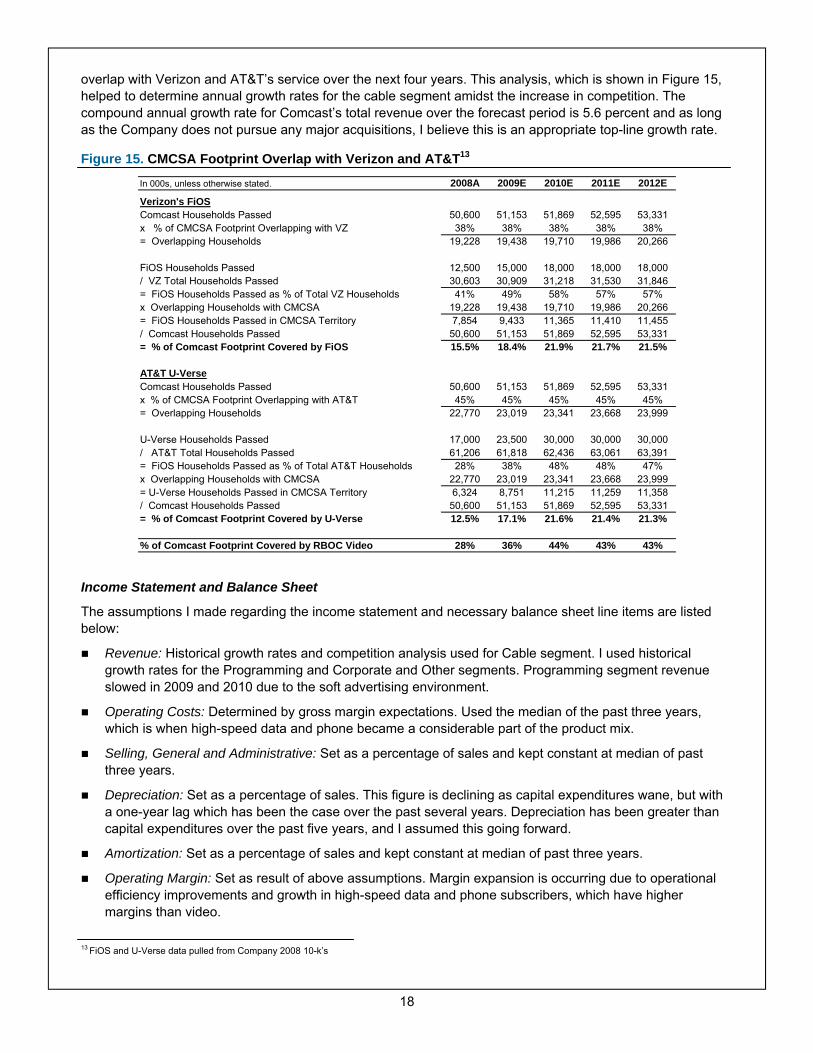
overlap with Verizon and AT&T’s service over the next four years. This analysis, which is shown in Figure 15, helped to determine annual growth rates for the cable segment amidst the increase in competition. The compound annual growth rate for Comcast’s total revenue over the forecast period is 5.6 percent and as long as the Company does not pursue any major acquisitions, I believe this is an appropriate top-line growth rate.
Figure 15. CMCSA Footprint Overlap with Verizon and AT&T13 Income Statement and Balance Sheet
The assumptions I made regarding the income statement and necessary balance sheet line items are listed below:
Revenue: Historical growth rates and competition analysis used for Cable segment. I used historical growth rates for the Programming and Corporate and Other segments. Programming segment revenue slowed in 2009 and 2010 due to the soft advertising environment.
Operating Costs: Determined by gross margin expectations. Used the median of the past three years, which is when high-speed data and phone became a considerable part of the product mix.
Selling, General and Administrative: Set as a percentage of sales and kept constant at median of past three years.
Depreciation: Set as a percentage of sales. This figure is declining as capital expenditures wane, but with a one-year lag which has been the case over the past several years. Depreciation has been greater than capital expenditures over the past five years, and I assumed this going forward.
Amortization: Set as a percentage of sales and kept constant at median of past three years.
Operating Margin: Set as result of above assumptions. Margin expansion is occurring due to operational efficiency improvements and growth in high-speed data and phone subscribers, which have higher margins than video.
In 000s, unless otherwise stated. 2008A 2009E 2010E 2011E 2012E
Verizon's FiOSComcast Households Passed 50,600 51,153 51,869 52,595 53,331x % of CMCSA Footprint Overlapping with VZ 38% 38% 38% 38% 38%= Overlapping Households 19,228 19,438 19,710 19,986 20,266
FiOS Households Passed 12,500 15,000 18,000 18,000 18,000/ VZ Total Households Passed 30,603 30,909 31,218 31,530 31,846= FiOS Households Passed as % of Total VZ Households 41% 49% 58% 57% 57%x Overlapping Households with CMCSA 19,228 19,438 19,710 19,986 20,266= FiOS Households Passed in CMCSA Territory 7,854 9,433 11,365 11,410 11,455/ Comcast Households Passed 50,600 51,153 51,869 52,595 53,331= % of Comcast Footprint Covered by FiOS 15.5% 18.4% 21.9% 21.7% 21.5%
AT&T U-VerseComcast Households Passed 50,600 51,153 51,869 52,595 53,331x % of CMCSA Footprint Overlapping with AT&T 45% 45% 45% 45% 45%= Overlapping Households 22,770 23,019 23,341 23,668 23,999
U-Verse Households Passed 17,000 23,500 30,000 30,000 30,000/ AT&T Total Households Passed 61,206 61,818 62,436 63,061 63,391= FiOS Households Passed as % of Total AT&T Households 28% 38% 48% 48% 47%x Overlapping Households with CMCSA 22,770 23,019 23,341 23,668 23,999= U-Verse Households Passed in CMCSA Territory 6,324 8,751 11,215 11,259 11,358/ Comcast Households Passed 50,600 51,153 51,869 52,595 53,331= % of Comcast Footprint Covered by U-Verse 12.5% 17.1% 21.6% 21.4% 21.3%
% of Comcast Footprint Covered by RBOC Video 28% 36% 44% 43% 43%
13 FiOS and U-Verse data pulled from Company 2008 10-k’s
19
Interest Expense: Set as a percentage of sales based on the median of the past three years. Implicit in
this assumption is that Comcast’s capital structure remains conservative and leverage ratios stay within 2.5x to 3.0x, which management has pledged.
Income Tax Expense: Assumed a 37.8 percent tax rate. Other income statement line items were modeled based on an extrapolation of past levels. Accounts Receivable: Set as a percentage of sales based on median of past three years and kept
constant going forward. Accounts Payable: Set as a percentage of sales and kept at the 2008 level of 9.9 percent of sales due to
a declining trend over the past six years.
Discount Rate and Terminal Value
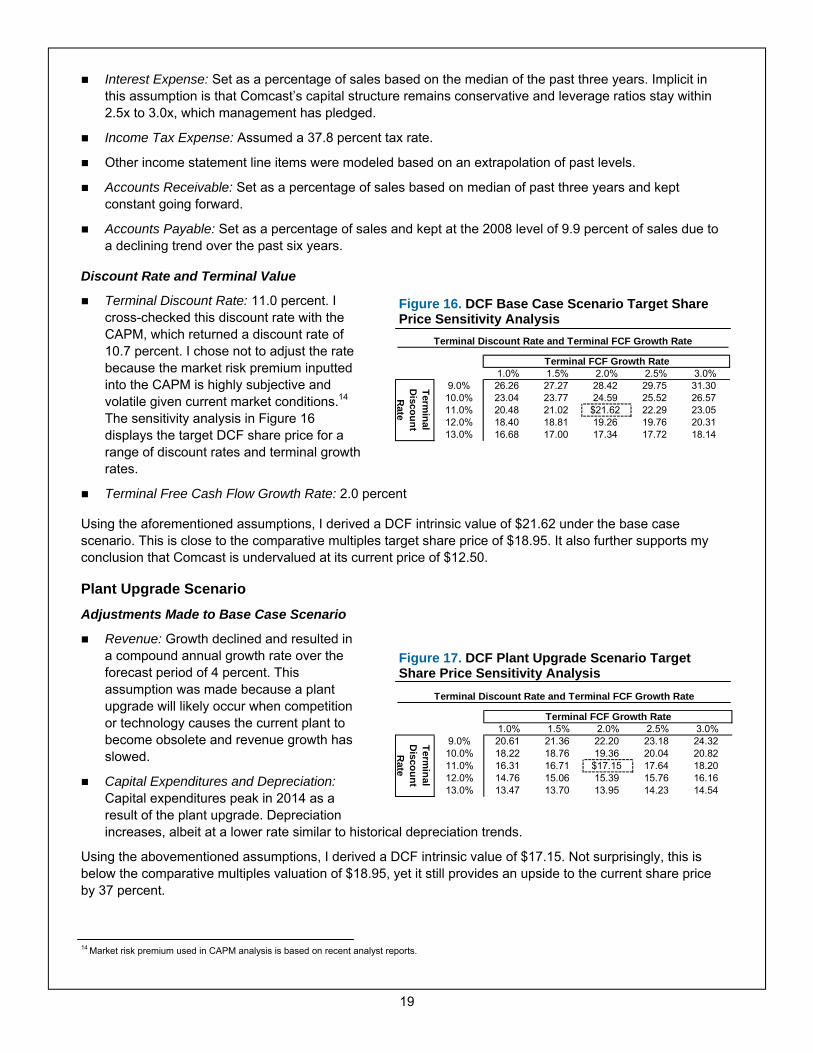
Terminal Discount Rate: 11.0 percent. I cross-checked this discount rate with the CAPM, which returned a discount rate of 10.7 percent. I chose not to adjust the rate because the market risk premium inputted into the CAPM is highly subjective and volatile given current market conditions.14 The sensitivity analysis in Figure 16 displays the target DCF share price for a range of discount rates and terminal growth rates.
Terminal Free Cash Flow Growth Rate: 2.0 percent
Using the aforementioned assumptions, I derived a DCF intrinsic value of $21.62 under the base case scenario. This is close to the comparative multiples target share price of $18.95. It also further supports my conclusion that Comcast is undervalued at its current price of $12.50.
Plant Upgrade Scenario Adjustments Made to Base Case Scenario
Revenue: Growth declined and resulted in a compound annual growth rate over the forecast period of 4 percent. This assumption was made because a plant upgrade will likely occur when competition or technology causes the current plant to become obsolete and revenue growth has slowed.
Capital Expenditures and Depreciation: Capital expenditures peak in 2014 as a result of the plant upgrade. Depreciation increases, albeit at a lower rate similar to historical depreciation trends.
Using the abovementioned assumptions, I derived a DCF intrinsic value of $17.15. Not surprisingly, this is below the comparative multiples valuation of $18.95, yet it still provides an upside to the current share price by 37 percent.
Terminal Discount Rate and Terminal FCF Growth Rate
Terminal FCF Growth Rate21.6 1.0% 1.5% 2.0% 2.5% 3.0%9.0% 26.26 27.27 28.42 29.75 31.3010.0% 23.04 23.77 24.59 25.52 26.5711.0% 20.48 21.02 $21.62 22.29 23.0512.0% 18.40 18.81 19.26 19.76 20.3113.0% 16.68 17.00 17.34 17.72 18.14
Terminal
Discount R
ate
Terminal Discount Rate and Terminal FCF Growth Rate
Terminal FCF Growth Rate17.2 1.0% 1.5% 2.0% 2.5% 3.0%9.0% 20.61 21.36 22.20 23.18 24.3210.0% 18.22 18.76 19.36 20.04 20.8211.0% 16.31 16.71 $17.15 17.64 18.2012.0% 14.76 15.06 15.39 15.76 16.1613.0% 13.47 13.70 13.95 14.23 14.54
Terminal
Discount R
ate
Figure 16. DCF Base Case Scenario Target Share Price Sensitivity Analysis
Figure 17. DCF Plant Upgrade Scenario Target Share Price Sensitivity Analysis
14 Market risk premium used in CAPM analysis is based on recent analyst reports.

20
Summary Strengths and Opportunities Comcast has several strengths and opportunities in the current market. The Company enjoys a diverse and recurring revenue stream, and subscription based products that are a regular part of most consumers’ lives. These characteristics shield the Company from large fluctuations in cash flow, which is increasingly favorable in turbulent economic times such as these. Comcast has built and acquired a base cable plant that is technologically competitive and economically upgradeable. As a result capital expenditures are expected to decline as a percentage of sales and on an absolute basis over the next two years, which will drive free cash flow growth. The subsequent increases in free cash flow will enable the Company to maintain its commitment of returning capital to shareholders through dividends and share buybacks. Furthermore, as the DuPont analysis pointed out, Comcast’s financials reveal strong, well-managed growth and show bright prospects for growth in the future. The comprehensive valuation analyses performed for Comcast suggests an intrinsic value well above the current share price, which in combination with increasing dividends and share repurchases, will deliver strong returns to shareholders.
Comcast’s robust financial position and conservative capital allocation strategy provides the Company with the flexibility necessary to take advantage of positive-NPV opportunities as they arise. Comcast is ramping up their offerings for small-medium sized businesses and has experienced recent success with a 41 percent increase in revenue from this market in 2008. I believe the Company will continue to see momentum in this business even during a tough economic climate because of its low telephone penetration and competitive pricing tactics. Comcast is also in the process of migrating its high-speed data service to DOCSIS 3.0, which will significantly increase bandwidth, creating faster internet speeds and enabling the Company to provide more advanced entertainment services.
Risks and Concerns There are several risks to my thesis, including execution of the voice rollout and increased competition from satellite and telecom companies. The economy remains another wild card in terms of future subscriber growth. Phone service is the most highly correlated cable product with housing growth, and the slowdown may threaten voice penetration in the near-term. Also, the slowing economy may lead more consumers to forgo land lines entirely, in favor of their cell phones.15 Moreover, if Comcast experiences higher than projected capital expenditures and pursues the build-out of an expansive wireless network or plant upgrade, my free cash flow estimates will be affected. Finally, a large acquisition or investment with uncertain returns (such as in to the wireless business) could have a negative impact on the stock. I feel that these risks were appropriately accounted for in my valuation methods through the terminal discount rate in the DCF valuations, and also by calculating the target multiple prices using a 50 percent mean reversion rule.
There are two concerns I have identified regarding Comcast that could have an effect on shareholder returns. First, as I mentioned in the Regulatory Environment section of the Industry Analysis, Comcast is tightly regulated by the FCC and could be negatively impacted by new legislation, FCC rules, or ownership caps. Second, Comcast’s voting structure contains non-dilutable Class B shares, all of which are beneficially owned by the C.E.O., Brian Roberts. The structure of the shares allows the C.E.O. to maintain effective control of the Company even if Comcast uses equity to fund a large acquisition. In order to override the C.E.O, three quarters of the Class A shareholders would have to vote against him. I believe it would be hard to gather that many votes against the C.E.O., which essentially limits any shareholder attempt to enact change.
15 Credit Suisse research report dated 18-February-2009
21
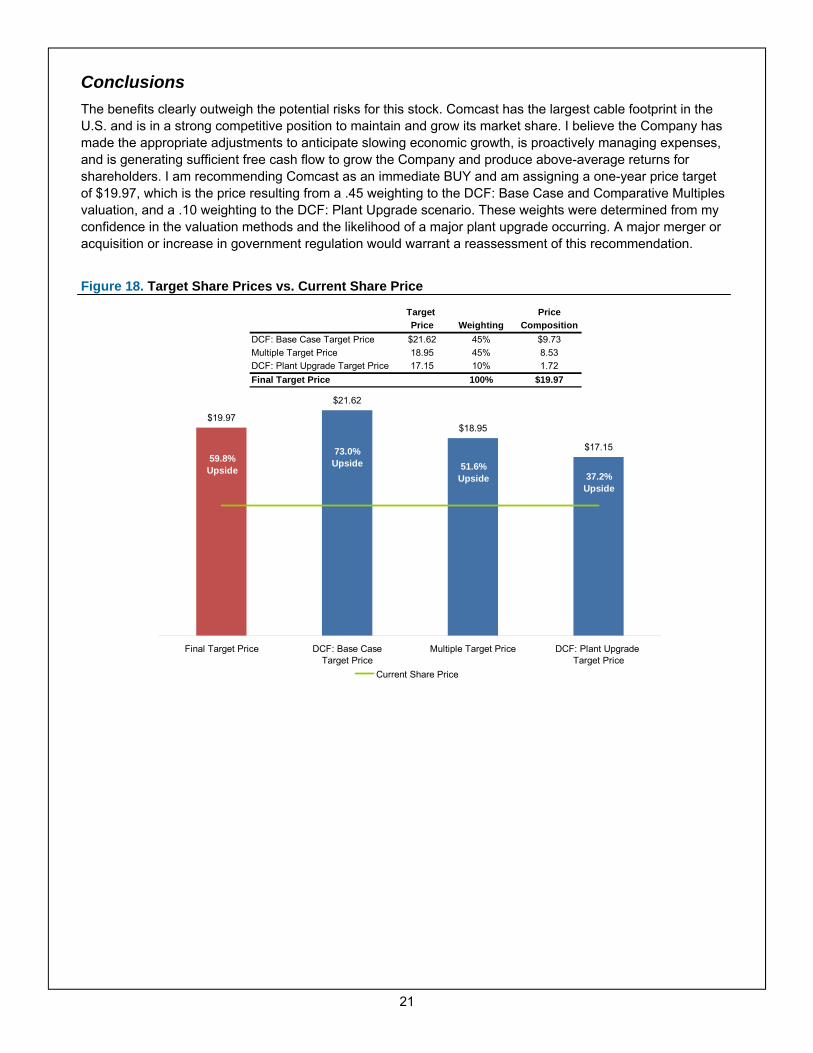
Conclusions The benefits clearly outweigh the potential risks for this stock. Comcast has the largest cable footprint in the U.S. and is in a strong competitive position to maintain and grow its market share. I believe the Company has made the appropriate adjustments to anticipate slowing economic growth, is proactively managing expenses, and is generating sufficient free cash flow to grow the Company and produce above-average returns for shareholders. I am recommending Comcast as an immediate BUY and am assigning a one-year price target of $19.97, which is the price resulting from a .45 weighting to the DCF: Base Case and Comparative Multiples valuation, and a .10 weighting to the DCF: Plant Upgrade scenario. These weights were determined from my confidence in the valuation methods and the likelihood of a major plant upgrade occurring. A major merger or acquisition or increase in government regulation would warrant a reassessment of this recommendation.
Figure 18. Target Share Prices vs. Current Share Price
$19.97
$21.62
$18.95
$17.15
Final Target Price DCF: Base CaseTarget Price
Multiple Target Price DCF: Plant Upgrade Target Price
Current Share Price
59.8% Upside
73.0% Upside 51.6%
Upside 37.2% Upside
Target PricePrice Weighting Composition
DCF: Base Case Target Price $21.62 45% $9.73Multiple Target Price 18.95 45% 8.53DCF: Plant Upgrade Target Price 17.15 10% 1.72Final Target Price 100% $19.97
22
Table of Figures
Figure 1. Comcast’s National Footprint 3 Figure 2. Comcast’s Cable Segment Revenue Breakdown by Product Category 4 Figure 3. Comcast’s Product Penetration 5 Figure 4. Regression of Comcast’s Enterprise Value/Sales Ratio and Economic Factors 6 Figure 5. Ten-Year Price Performance: Cable & Satellite vs. Consumer Discretionary vs. S&P 500 8 Figure 6. Subscription and Advertising Revenue as a % of Total Revenue, 2008 9 Figure 7. Broadband Household Forecast, 2008E—2013E 10 Figure 8. Three Factors Continue to Increase Competition 10 Figure 9. Five-Year Historical Cable & Satellite TV Comparative Multiples Analysis 12 Figure 10. DuPont Analysis for Comcast 15 Figure 11. CMCSA Absolute Valuation 16 Figure 12. CMCSA Relative to the S&P 500 16 Figure 13. CMCSA Relative to the Consumer Discretionary Sector 16 Figure 14. CMCSA Relative to the Cable & Satellite TV Industry 17 Figure 15. CMCSA Footprint Overlap with Verizon and AT&T 18 Figure 16. DCF Base Case Scenario Target Share Price Sensitivity Analysis 19 Figure 17. DCF Plant Upgrade Scenario Target Share Price Sensitivity Analysis 19 Figure 18. Target Share Prices vs. Current Share Price 21
23
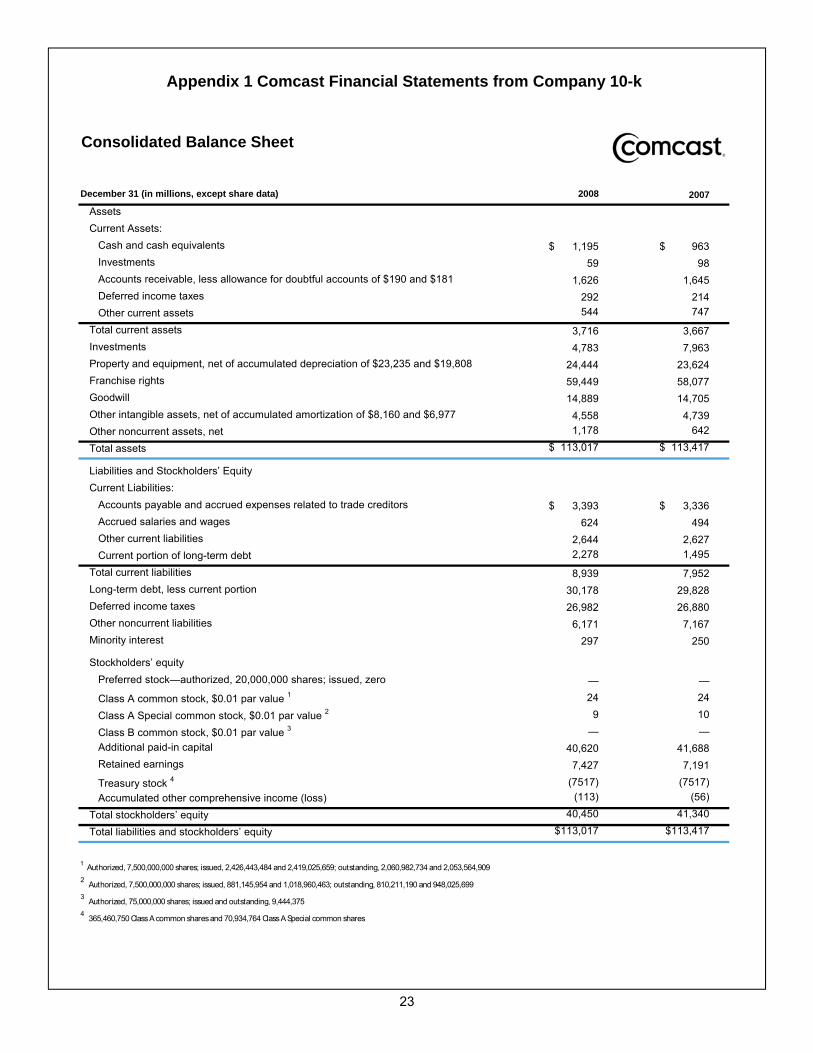
Appendix 1 Comcast Financial Statements from Company 10-k
Consolidated Balance Sheet
December 31 (in millions, except share data) 2008
AssetsCurrent Assets:
Cash and cash equivalents $ 1,195 $ 963 Investments 59 98Accounts receivable, less allowance for doubtful accounts of $190 and $181 1,626 1,645Deferred income taxes 292 214Other current assets 544 747
Total current assets 3,716 3,667Investments 4,783 7,963Property and equipment, net of accumulated depreciation of $23,235 and $19,808 24,444 23,624Franchise rights 59,449 58,077Goodwill 14,889 14,705Other intangible assets, net of accumulated amortization of $8,160 and $6,977 4,558 4,739Other noncurrent assets, net 1,178 642
Total assets $ 113,017 $ 113,417
Liabilities and Stockholders’ EquityCurrent Liabilities:
Accounts payable and accrued expenses related to trade creditors $ 3,393 $ 3,336 Accrued salaries and wages 624 494Other current liabilities 2,644 2,627Current portion of long-term debt 2,278 1,495
Total current liabilities 8,939 7,952Long-term debt, less current portion 30,178 29,828Deferred income taxes 26,982 26,880Other noncurrent liabilities 6,171 7,167Minority interest 297 250
Stockholders’ equityPreferred stock—authorized, 20,000,000 shares; issued, zero — —
Class A common stock, $0.01 par value 1 24 24
Class A Special common stock, $0.01 par value 2 9 10
Class B common stock, $0.01 par value 3 — —Additional paid-in capital 40,620 41,688Retained earnings 7,427 7,191
Treasury stock 4 (7517) (7517)Accumulated other comprehensive income (loss) (113) (56)
Total stockholders’ equity 40,450 41,340
Total liabilities and stockholders’ equity $113,017 $113,417
1 Authorized, 7,500,000,000 shares; issued, 2,426,443,484 and 2,419,025,659; outstanding, 2,060,982,734 and 2,053,564,9092 Authorized, 7,500,000,000 shares; issued, 881,145,954 and 1,018,960,463; outstanding, 810,211,190 and 948,025,6993 Authorized, 75,000,000 shares; issued and outstanding, 9,444,3754 365,460,750 Class A common shares and 70,934,764 Class A Special common shares
2007
24
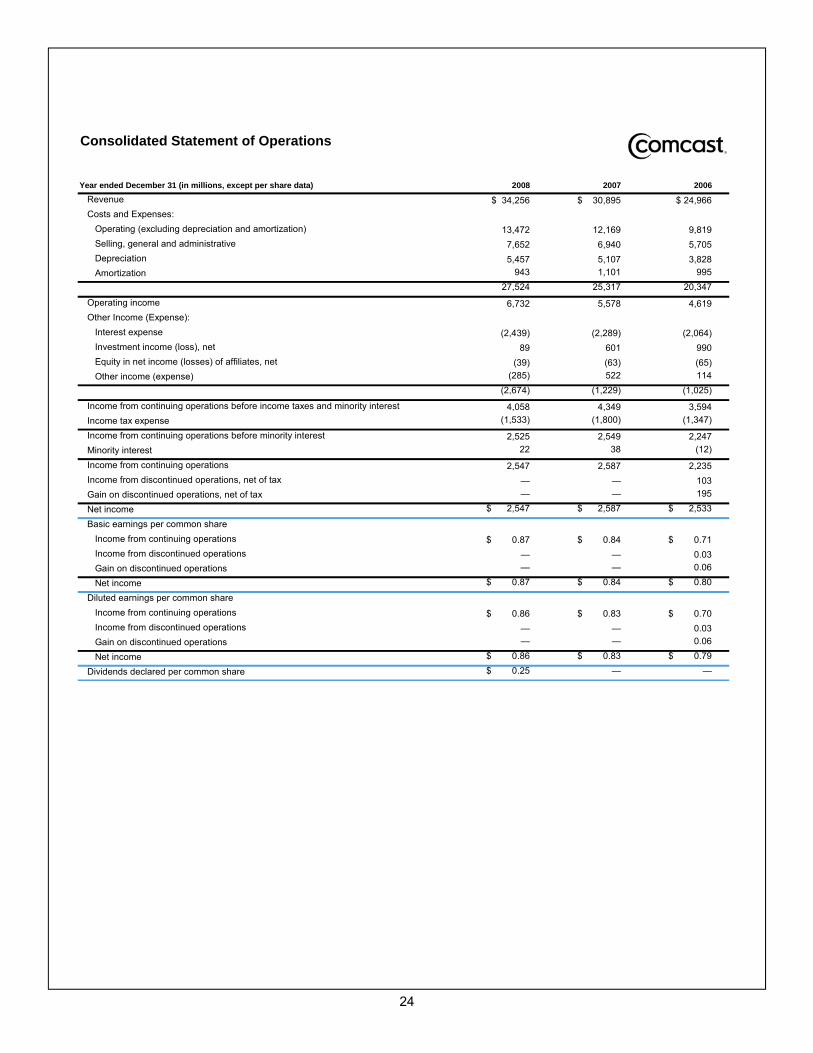
Consolidated Statement of Operations
Year ended December 31 (in millions, except per share data) 2008 2007 2006
Revenue $ 34,256 $ 30,895 $ 24,966 Costs and Expenses:
Operating (excluding depreciation and amortization) 13,472 12,169 9,819Selling, general and administrative 7,652 6,940 5,705Depreciation 5,457 5,107 3,828Amortization 943 1,101 995
27,524 25,317 20,347
Operating income 6,732 5,578 4,619Other Income (Expense):
Interest expense (2,439) (2,289) (2,064)Investment income (loss), net 89 601 990 Equity in net income (losses) of affiliates, net (39) (63) (65)Other income (expense) (285) 522 114
(2,674) (1,229) (1,025)
Income from continuing operations before income taxes and minority interest 4,058 4,349 3,594 Income tax expense (1,533) (1,800) (1,347)
Income from continuing operations before minority interest 2,525 2,549 2,247Minority interest 22 38 (12)
Income from continuing operations 2,547 2,587 2,235Income from discontinued operations, net of tax — — 103Gain on discontinued operations, net of tax — — 195
Net income $ 2,547 $ 2,587 $ 2,533
Basic earnings per common share Income from continuing operations $ 0.87 $ 0.84 $ 0.71 Income from discontinued operations — — 0.03Gain on discontinued operations — — 0.06
Net income $ 0.87 $ 0.84 $ 0.80
Diluted earnings per common share Income from continuing operations $ 0.86 $ 0.83 $ 0.70 Income from discontinued operations — — 0.03Gain on discontinued operations — — 0.06
Net income $ 0.86 $ 0.83 $ 0.79
Dividends declared per common share $ 0.25 — —
25
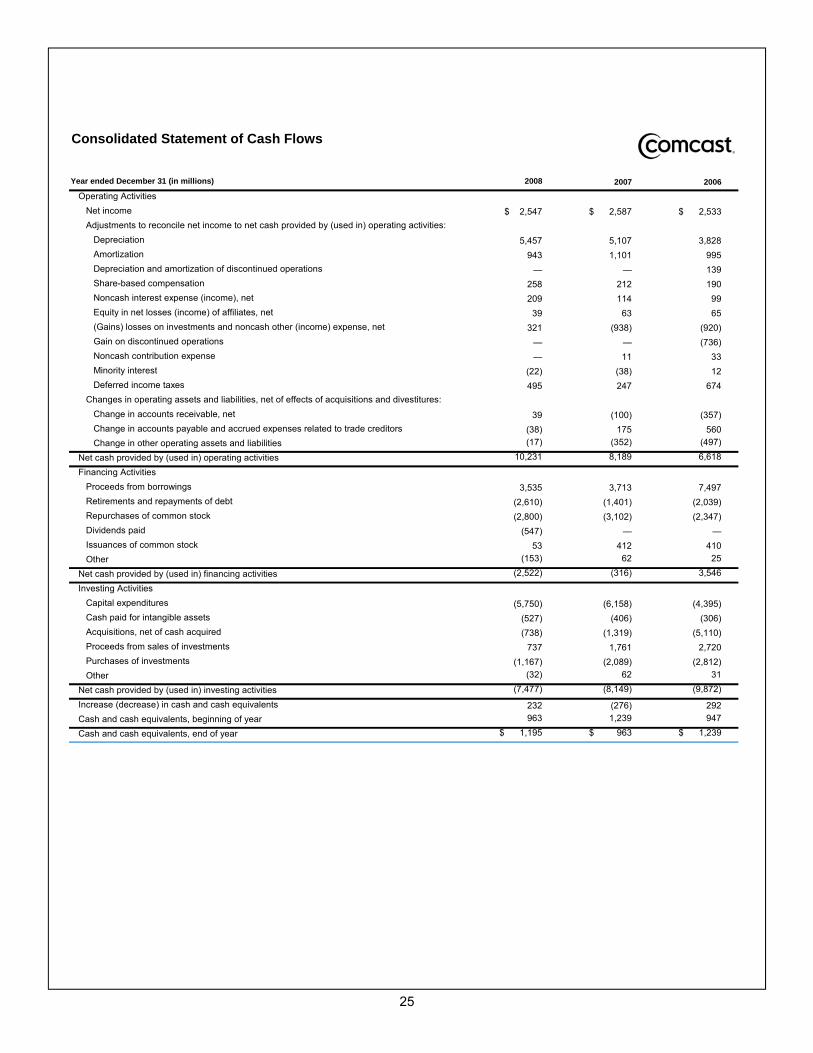
Consolidated Statement of Cash Flows
Year ended December 31 (in millions) 2008
Operating ActivitiesNet income $ 2,547 $ 2,587 $ 2,533 Adjustments to reconcile net income to net cash provided by (used in) operating activities:
Depreciation 5,457 5,107 3,828Amortization 943 1,101 995Depreciation and amortization of discontinued operations — — 139Share-based compensation 258 212 190Noncash interest expense (income), net 209 114 99Equity in net losses (income) of affiliates, net 39 63 65(Gains) losses on investments and noncash other (income) expense, net 321 (938) (920)Gain on discontinued operations — — (736)Noncash contribution expense — 11 33 Minority interest (22) (38) 12 Deferred income taxes 495 247 674
Changes in operating assets and liabilities, net of effects of acquisitions and divestitures:Change in accounts receivable, net 39 (100) (357)Change in accounts payable and accrued expenses related to trade creditors (38) 175 560 Change in other operating assets and liabilities (17) (352) (497)
Net cash provided by (used in) operating activities 10,231 8,189 6,618
Financing ActivitiesProceeds from borrowings 3,535 3,713 7,497 Retirements and repayments of debt (2,610) (1,401) (2,039)Repurchases of common stock (2,800) (3,102) (2,347)Dividends paid (547) — —Issuances of common stock 53 412 410 Other (153) 62 25
Net cash provided by (used in) financing activities (2,522) (316) 3,546
Investing ActivitiesCapital expenditures (5,750) (6,158) (4,395)Cash paid for intangible assets (527) (406) (306)Acquisitions, net of cash acquired (738) (1,319) (5,110)Proceeds from sales of investments 737 1,761 2,720 Purchases of investments (1,167) (2,089) (2,812)Other (32) 62 31
Net cash provided by (used in) investing activities (7,477) (8,149) (9,872)
Increase (decrease) in cash and cash equivalents 232 (276) 292Cash and cash equivalents, beginning of year 963 1,239 947
Cash and cash equivalents, end of year $ 1,195 $ 963 $ 1,239
2007 2006
26
Appendix 2 Discounted Cash Flow Model: Base Case Scenario
DC
F Va
luat
ion
Rev
enue
Cas
e1
3/4/
2009
Ope
ratin
g M
argi
n C
ase
1Ti
cker
: C
MC
S ATe
rmin
al D
isco
unt R
ate
=11
.0%
D&
A C
ase
1Jo
shua
Ber
nath
Term
inal
FC
F G
row
th =
2.0%
Cap
ex C
ase
1
Fore
cast
Term
inal
Year
2008
E20
09E
2010
E20
11E
2012
E20
13E
2014
E20
15E
2016
E20
17E
2018
EVa
lue
Rev
enue
34,2
56
35
,376
36,9
96
38
,904
41
,044
43
,507
46
,335
49
,578
52
,801
55
,705
58
,769
% G
row
th3.
27%
4.58
%5.
16%
5.50
%6.
00%
6.50
%7.
00%
6.50
%5.
50%
5.50
%
Ope
ratin
g In
com
e6,
732
6,
995
7,
364
7,
793
8,20
9
8,
810
9,49
9
10
,287
11
,088
11
,837
12
,635
Ope
ratin
g M
argi
n19
.65%
19.7
7%19
.91%
20.0
3%20
.00%
20.2
5%20
.50%
20.7
5%21
.00%
21.2
5%21
.50%
Inte
rest
- ne
t2,
674
2,
215
2,
316
2,
435
2,56
9
2,
724
2,90
1
3,
104
3,30
5
3,
487
3,67
9
Int
eres
t % o
f Sal
es7.
81%
6.26
%6.
26%
6.26
%6.
26%
6.26
%6.
26%
6.26
%6.
26%
6.26
%6.
26%
Taxe
s1,
533
1,
806
1,
907
2,
024
2,13
0
2,
299
2,49
3
2,
714
2,94
0
3,
154
3,38
3
Tax
Rat
e37
.8%
37.8
%37
.8%
37.8
%37
.8%
37.8
%37
.8%
37.8
%37
.8%
37.8
%37
.8%
Min
ority
Inte
rest
22
22
22
22
22
22
22
22
22
22
22
Net
Inco
me
2,54
7
2,99
7
3,16
3
3,35
6
3,
531
3,80
9
4,
127
4,49
2
4,
865
5,21
8
5,
595
%
Gro
wth
18%
6%6%
5%8%
8%9%
8%7%
7%
Add
Dep
reci
atio
n/Am
ort
6,40
06,
878
7,17
57,
526
7,69
67,
983
8,31
78,
701
9,05
59,
331
9,60
9 %
of S
ales
18.6
8%19
.44%
19.3
9%19
.34%
18.7
5%18
.35%
17.9
5%17
.55%
17.1
5%16
.75%
16.3
5%Pl
us/(m
inus
) Cha
nges
WC
76(1
85)
7285
8590
9610
311
011
612
2 %
of S
ales
0.22
%-0
.52%
0.20
%0.
22%
0.21
%0.
21%
0.21
%0.
21%
0.21
%0.
21%
0.21
%Su
btra
ct C
ap E
x5,
750
5,69
65,
660
5,83
66,
033
6,26
56,
533
6,84
27,
128
7,35
37,
581
Cap
ex %
of s
ales
16.7
9%16
.10%
15.3
0%15
.00%
14.7
0%14
.40%
14.1
0%13
.80%
13.5
0%13
.20%
12.9
0%
Free
Cas
h Fl
ow3,
273
3,99
54,
750
5,13
15,
279
5,61
86,
008
6,45
46,
902
7,31
17,
744
YO
Y gr
owth
22%
19%
8%3%
6%7%
7%7%
6%6%
Term
inal
87,7
69.7
Term
inal
Val
ue87
,770
P/E
15.7
NPV
of f
ree
cash
flow
s32
,918
52%
EV/E
BIT
DA
5.35
NPV
of t
erm
inal
val
ue30
,911
48%
Free
Cas
h Yi
eld
8.82
%Pr
ojec
ted
Equi
ty V
alue
63,8
29
Fr
ee C
ash
Flow
Yie
ld5.
13%
Shar
es O
utst
andi
ng2,
952.
0
Cur
rent
Pric
e12
.50
$
Impl
ied
equi
ty v
alue
/sha
re21
.62
$
Ups
ide/
(Dow
nsid
e) to
DC
F 72
.98%
Cas
h1,
195
Deb
t32
,456
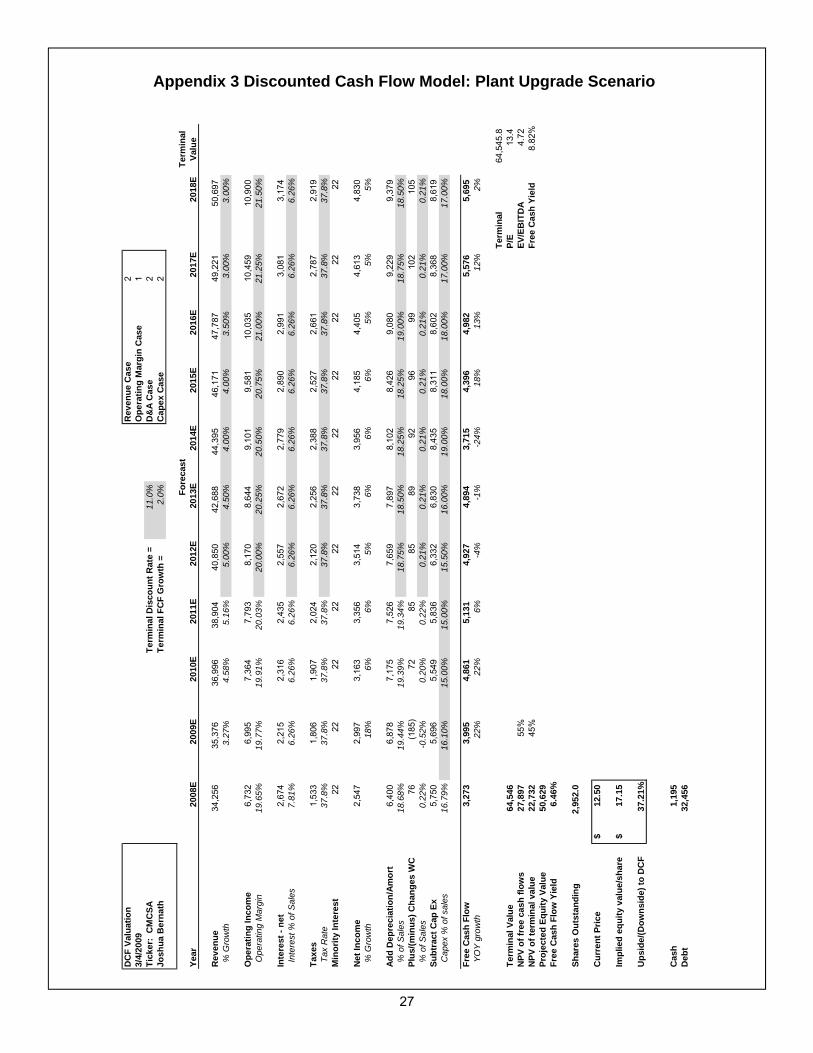
27
Appendix 3 Discounted Cash Flow Model: Plant Upgrade Scenario
DC
F Va
luat
ion
Rev
enue
Cas
e2
3/4/
2009
Ope
ratin
g M
argi
n C
ase
1Ti
cker
: C
MC
S ATe
rmin
al D
isco
unt R
ate
=11
.0%
D&
A C
ase
2Jo
shua
Ber
nath
Term
inal
FC
F G
row
th =
2.0%
Cap
ex C
ase
2
Fore
cast
Term
inal
Year
2008
E20
09E
2010
E20
11E
2012
E20
13E
2014
E20
15E
2016
E20
17E
2018
EVa
lue
Rev
enue
34,2
56
35
,376
36,9
96
38
,904
40
,850
42
,688
44
,395
46
,171
47
,787
49
,221
50
,697
% G
row
th3.
27%
4.58
%5.
16%
5.00
%4.
50%
4.00
%4.
00%
3.50
%3.
00%
3.00
%
Ope
ratin
g In
com
e6,
732
6,
995
7,
364
7,
793
8,17
0
8,
644
9,10
1
9,
581
10,0
35
10,4
59
10,9
00
O
pera
ting
Mar
gin
19.6
5%19
.77%
19.9
1%20
.03%
20.0
0%20
.25%
20.5
0%20
.75%
21.0
0%21
.25%
21.5
0%
Inte
rest
- ne
t2,
674
2,
215
2,
316
2,
435
2,55
7
2,
672
2,77
9
2,
890
2,99
1
3,
081
3,17
4
Int
eres
t % o
f Sal
es7.
81%
6.26
%6.
26%
6.26
%6.
26%
6.26
%6.
26%
6.26
%6.
26%
6.26
%6.
26%
Taxe
s1,
533
1,
806
1,
907
2,
024
2,12
0
2,
256
2,38
8
2,
527
2,66
1
2,
787
2,91
9
Tax
Rat
e37
.8%
37.8
%37
.8%
37.8
%37
.8%
37.8
%37
.8%
37.8
%37
.8%
37.8
%37
.8%
Min
ority
Inte
rest
22
22
22
22
22
22
22
22
22
22
22
Net
Inco
me
2,54
7
2,99
7
3,16
3
3,35
6
3,
514
3,73
8
3,
956
4,18
5
4,
405
4,61
3
4,
830
%
Gro
wth
18%
6%6%
5%6%
6%6%
5%5%
5%
Add
Dep
reci
atio
n/Am
ort
6,40
06,
878
7,17
57,
526
7,65
97,
897
8,10
28,
426
9,08
09,
229
9,37
9 %
of S
ales
18.6
8%19
.44%
19.3
9%19
.34%
18.7
5%18
.50%
18.2
5%18
.25%
19.0
0%18
.75%
18.5
0%Pl
us/(m
inus
) Cha
nges
WC
76(1
85)
7285
8589
9296
9910
210
5 %
of S
ales
0.22
%-0
.52%
0.20
%0.
22%
0.21
%0.
21%
0.21
%0.
21%
0.21
%0.
21%
0.21
%Su
btra
ct C
ap E
x5,
750
5,69
65,
549
5,83
66,
332
6,83
08,
435
8,31
18,
602
8,36
88,
619
Cap
ex %
of s
ales
16.7
9%16
.10%
15.0
0%15
.00%
15.5
0%16
.00%
19.0
0%18
.00%
18.0
0%17
.00%
17.0
0%
Free
Cas
h Fl
ow3,
273
3,99
54,
861
5,13
14,
927
4,89
43,
715
4,39
64,
982
5,57
65,
695
YO
Y gr
owth
22%
22%
6%-4
%-1
%-2
4%18
%13
%12
%2%
Term
inal
64,5
45.8
Term
inal
Val
ue64
,546
P/E
13.4
NPV
of f
ree
cash
flow
s27
,897
55%
EV/E
BIT
DA
4.72
NPV
of t
erm
inal
val
ue22
,732
45%
Free
Cas
h Yi
eld
8.82
%Pr
ojec
ted
Equi
ty V
alue
50,6
29
Fr
ee C
ash
Flow
Yie
ld6.
46%
Shar
es O
utst
andi
ng2,
952.
0
Cur
rent
Pric
e12
.50
$
Impl
ied
equi
ty v
alue
/sha
re17
.15
$
Ups
ide/
(Dow
nsid
e) to
DC
F 37
.21%
Cas
h1,
195
Deb
t32
,456