nasa airborne science program 2014 annual report · nasa airborne science program national...
TRANSCRIPT

NASA Airborne Science Program
2014 ANNUAL REPORT

(Front Cover: View from C-130 during ARISE)

NASA Airborne Science Program
National Aeronautics and Space Administration
2014 ANNUAL REPORT


Table of Contents
Leadership Comments 1
Program Overview 3
Structure of the Program 3
New Program Capabilities 4
Flight Request System 5
Fiscal Year 2014 Flight Requests 5
Funded Flight Hours (Flown) 7
Science 9
Major Mission highlights 10
Operation Ice Bridge 10
ARISE 13
Earth Venture Suborbital - 1 15
SABOR 22
UAVSAR 24
Support to ESD Satellite Missions, including Decadal Survey Missions 25
Integrated Precipitation and Hydrology Experiment (IPHEX) 26
HyspIRI Preparatory Airborne Studies 27
MABEL Alaska 2014 Campaign 28
Support to Instrument Development 29
ASCENDS 30
Geostationary Trace gas and Aerosol Sensor Optimiztion
(GEO-TASO) instrument 30
CarbonHawk 31
Upcoming Activities 32
Aircraft 33
ASP-Supported Aircraft 34
Other NASA Earth Science Aircraft 41
The NASA ASP Small Unmanned Systems Projects 47
SIERRA UAS 47
DragonEye UAS 48
Viking-400 49

Aircraft Cross-Cutting Support and IT Infrastructure 50
ASP Facility Science Infrastructure 50
Facility Instrumentation 50
Sensor Network IT Infrastructure 50
NASA Airborne science Data and Telemetry (NASDAT) System 52
Satellite Communications Systems 50
Payload Management 52
Mission Tool Suite 53
Advanced Planning 56
Requirements update 56
5-yr plan 57
Education, Training, Outreach and Partnerships 58
Student Airborne Research Program 2014 58
Mission Tools Suite for Education (MTSE) 60
Partnerships 62
Appendices 63
Appendix A: Historical Perspective, Jeffrey Myers 63
Appendix B: Five-Year Plan 68
Appendix C: Acronyms 72

LEADERSHIP COMMENTS
This year we again flew over 4,000 Earth Science
flight hours and collected data from a variety of
missions around the world. For the sixth time
we flew the Arctic and Antarctic for Operation
IceBridge, and we wrapped up the data collection
for two of the five Earth Venture Suborbital-1 (EVS-1)
investigations. It was a record year for multi-aircraft
missions with DISCOVER-AQ (P-3, B-200, HU-25C
and NSF/NCAR C-130), HS3 (Global Hawk, NOAA
G-IV, and the WB-57), COMEX (CIRPAS Twin Otter,
ER-2, Twin Otter International, Alpha Jet), and
IPHEX (ER-2, UND Citation). As
reported by airborne science
investigators, twelve NASA Earth
satellite missions were supported,
including GPM and OCO-2
that launched this year. The
DC-8 completed a major depot
inspection that is expected to
prolong its operational life another
10 years and the P-3 went in for
re-winging that should extend
its operational life by decades.
We also took our newest (to us
anyway) ASP aircraft addition,
the WFF C-130, to the Arctic and
Alaska for a sea ice and cloud
interaction mission called ARISE.
The program’s Mission Tool Suite for Education
(MTSE) had another very busy year as well. MTSE
allows students and teachers to track the progress
of the ASP aircraft and provides a web portal
through which classrooms can participate in live,
online text chats with NASA scientists, educators
and crew members during the missions. During
FY2014, a total of 133 classrooms connected to
ATTREX, HS3 and OIB mission teams through
MTSE with a total of 3,127 K-12 students and their
teachers participating. In the sixth ASP Student
Airborne Research Program (SARP) class, thirty-
two undergraduate students from a like number of
colleges and universities graduated from an eight-
week field experience designed to immerse them
Welcome to the 2014 edition of the Airborne Science Program (ASP) Annual Report.
Bruce TaggProgram Manager, Airborne Science Program
ASP Vision
Building on our Airborne Science Program foundation, to continually
improve our relevance and responsiveness to provide airborne access to
the Earth Science community.
Program Mission Statement
ASP enables Earth Science researchers and scientists to improve
society’s understanding of Earth system science by providing a pre-
eminent suite of airborne capabilities that meet NASA Earth science
requirements. ASP accomplishes its mission by:
• Fosteringateamofenergetic,safetyconscious,andcustomer-
focused experts;
• Ensuringthecapabilitiesitoffersaresafe,affordable,robust,
modern, and meet the needs of the Earth science community;
• Continuouslyimprovingtherelevanceandresponsivenessof
airborne capabilities it makes available to the Earth Science
community.

A I R B O R N E S C I E N C E P R O G R A M 2 0 1 3 A N N U A L R E P O R T | 2
in NASA’s Earth Science research and train the next
generation of engineers and scientists.
For 2015, we look to conclude the remaining EVS-
1 missions and start the five new EVS-2 missions.
Operation IceBridge is expected to continue at its
current pace through 2018. The year looks to continue
support of NASA Earth Science space missions, both
operational and in development, as well as ESTO
technology maturation projects including HyTES, PRISM,
and many others. We look forward to the return of the
P-3 after re-winging, and inspiring the next generation of
scientists and engineers with SARP and MTSE activities.
As always, Randy and I hope you enjoy reading about
the program and we look forward to a productive 2015.

PROGRAM OVERVIEW
ASP supports NASA Earth Science in the following
capacities:
• Process studies
• Satellite mission instrument development,
algorithm development and calibration and
validation activities
• Instrument test
• Workforce development / next generation
scientists
ASP is an important element of the NASA Science Directorate and the Earth Science program.
Acting Associate Administrator (AA)
Deputy AA for Programs
Chief ScientistScience Office for Mission Assessments
Earth Science Division
Earth Science R&A Flight Programs Applied Science ESTO
Airborne Science Program
Joint Agency Satellite Division
Heliophysics Division
Planetary Science Division
Astrophysics Division
Resource Management Division
Strategic Integration &Management Division
JWST ProgramOffice
Deputy AA for Management
Strategic & Intl Planning Director
We accomplish these support goals by providing
both aircraft systems modified and adapted
for science, along with aviation services to the
science community. The NASA aircraft and mission
infrastructure are described in this report. ASP also
facilitates use of non-NASA aircraft and equipment
for Earth Science, as needed.
Structure of the Program
Figure 1 shows the role of the Airborne Science
Program within SMD. Figure 2 shows the
components of the Airborne Science Program. The
aircraft responsibilities are distributed among the
NASA centers where the aircraft are based.
Fig. 1: SMD Organization Chart

A I R B O R N E S C I E N C E P R O G R A M 2 0 1 3 A N N U A L R E P O R T | 4
Airborne Science
Program Director: Bruce Tagg
Deputy Director: Randy Albertson
ARC ASP Lead
Matt FladelandFunctions:
SIERRA, Earth Science Project Office, Studies and Reports,
Airborne Sensor Facility,
Science Mission Mgmt.
GRC ASP Lead
Alan MicklewrightS-3
Twin OtterLear Jet
LaRC ASP Lead
Frank JonesB-200UC-12
Cessna 205HU-25A
AFRC ASP Lead
Mike ThomsonFunctions:
DC-8, ER2, C-20, Global Hawk, Dryden Aircraft
Operations Facility
WFF ASP Lead
Shane DoverFunctions:
P-3, C-23, Mission Mgmt. Reports, Budget Mgmt
support
JSC ASP Lead
Scott Gahring
Ken CockrellFunctions:
WB-57, GIII, Mission Support
ASP provides limited
support to GRC and LaRC
Fig. 2: Airborne Science Organization Chart
New Program Capabilities
The NASA Goddard Space Flight Center’s Wallops Flight
Facility activated a C-130 Hercules research aircraft
in 2013, and it flew its first airborne science missions
in 2014. The C-130 is a self-sufficient aircraft that can
operate from short field civilian and military airports
to remote areas of the world in support of scientific
studies and other operations. The C-130 is a four-engine
turboprop aircraft designed for maximum payload
capacity. The C-130 has been extensively modified to
support airborne science related activities.
Other acquisitions and upgrades in 2014 include
delivery of Viking-400 UAS, a new SIERRA-B UAS
airframe, INMARSAT capability on the ER-2 aircraft and
extensive new functions of the Mission Tool Suite.

A I R B O R N E S C I E N C E P R O G R A M 2 0 1 3 A N N U A L R E P O R T | 5
Fig. 3: C-130 in Alaska during ARISE mission
Flight Request System
The Science Operations Flight Request System (SOFRS)
is a web-based tool used to track and facilitate the
review and approval process for every airborne science
mission using NASA SMD funds, instruments, personnel
or aircraft. The system is also used to validate funding
and confirm personnel resources to meet a request. The
only way to schedule the use of NASA SMD platforms
and instrument assets is to submit a Flight Request for
approval through SOFRS (https://airbornescience.nasa.
gov/sofrs).
The SOFRS team strives for continuous improvement
by refining the user interface and reports produced. In
2014, the focus was on creating additional reporting
capabilities and on the continual refinement of the Flight
Request System.
Fiscal Year 2014 Flight Requests
Several large campaigns were successfully conducted
this year, including: ATTREX, HS3, and Operation ICE
Bridge (OIB).
There were 206 Flight Requests submitted in 2014. A
total of 89 were completed, some were deferred and
the rest were canceled depending upon the availability
of resources at the time of the request. Flight Requests
were submitted for 15 Airborne Science supported
aircraft and 11 “other” platforms. Together they flew a
total of 4600 flight hours, as shown in Table 1.

A I R B O R N E S C I E N C E P R O G R A M 2 0 1 3 A N N U A L R E P O R T | 6
Aircraft Total FRsTotal Approved
Total Partial
Total Completed Total Hrs Flown
DC-8 8 6 0 5 88.8
ER-2 25 18 8 7 359.8
P-3 13 6 0 5 610.2
WB-57 9 7 2 5 46.1
Twin Otter 31 17 3 13 509.7
B-200 13 9 1 7 352.4
G-III Class 48 31 0 27 771.6
Global Hawk 7 3 0 3 444.7
C-130 Hercules 2 2 1 1 231.0
C-23 Sherpa 6 4 1 2 316.0
Dragon Eye 1 0 0 0 0.0
Falcon - HU-25 4 2 0 2 69.2
S-3 Viking 1 1 0 1 37.0
SIERRA 4 0 0 0 0.0
T-34 2 1 0 1 29.2
Other 32 16 1 11 734.4
TOTALS: 206 123 17 89 4600.1
Table 1: Summary of FY14 Flight Request Status and Flight Hours Flown by Aircraft
• These totals are based on the Flight Request’s log
number, and therefore include Flight Requests
whose log number starts with “14”.
• The “Total FRs” column includes Flight Requests
that were submitted and whose log number starts
with “14”.
• The “Total FRs Approved” column includes Flight
Requests that were approved but may or may not
have flown during FY14.
• The “Total Partial FRs” column includes Flight
Requests in which the total approved hours were
not fully expended during FY14 and have been
rolled over to the following year.
Notes on Tables 1 and 2:
• The “Total FRs Completed” column includes only
Flight Requests whose final status is “Completed”.
• The “Total Hours Flown” column includes all “Flight
Hours Flown” for Flight Requests with a status of
“Completed” or “Partial” for 2014.
• Other aircraft include: Basler BT-67 (DC-3T), Alpha
Jet, Twin Otter International, Contract Helicopter,
Bussmann Helicopter, Piper Navajo, Cessna-208B,
CIRPAS- Twin Otter, Cessna Citation, USDA-
Cessna 206 and Learjet 25-Ice Niner.

A I R B O R N E S C I E N C E P R O G R A M 2 0 1 3 A N N U A L R E P O R T | 7
AircraftTotal ESD FRs
Total ESD FRs Approved
Partial ESD FRs
Total ESD FRs Completed
Total ESD Hours Flown
DC-8 5 4 0 4 61.7
ER-2 20 15 8 6 359.8
P-3 12 6 0 4 610.2
WB-57 2 2 1 1 4.4
Twin Otter 23 14 3 10 431.8
B-200 11 9 1 7 352.4
G-III Class 46 31 0 27 771.6
Global Hawk 7 3 0 3 444.7
C-130 Hercules 2 2 1 1 231.0
C-23 Sherpa 5 4 1 2 316.0
Dragon Eye 0 0 0 0 0.0
Falcon - HU-25 4 2 0 2 69.2
S-3 Viking 0 1 0 1 37.0
SIERRA 4 0 0 0 0.0
T-34 1 1 0 1 29.2
Other 20 11 1 7 457.3
TOTALS: 158 103 16 74 4069.4
Table 2: Summary of ESD funded FY14 Flight Request Status and Flight Hours Flown by Aircraft*
Table 3: Funded flight hours over the past 2 years.
Table 2 indicates the flights funded by NASA’s Earth
Science Division (ESD). Table 3 distinguishes between
funding sources ESD, NASA Science Mission
Directorate (SMD), and non-NASA funding.
Fiscal Year
ESD Flight Hours
SMD (Non-ESD) Flight Hours**
Other NASA Flight Hours
Non-NASA Flight Hours
Funding Sources Not Listed in FR
Total Funded Flight Hours
2013 4,392.4 88.7 129.6 93.5 124.9 4,829.1
2014 4,069.4 28.5 419.5 12.8 69.9 4,600.1
Funded Flight Hours (Flown)
*The NASA Earth Sciences Division (ESD) is under the Science Mission Directorate SMD. “SMD (Non-
ESD) Flight Hours” are for those hours funded by SMD Program Managers not within ESD.

A I R B O R N E S C I E N C E P R O G R A M 2 0 1 3 A N N U A L R E P O R T | 8
Fig. 4: ASP flight hours over the past 17 years
Fig. 5: Locations of airborne campaigns in FY2014
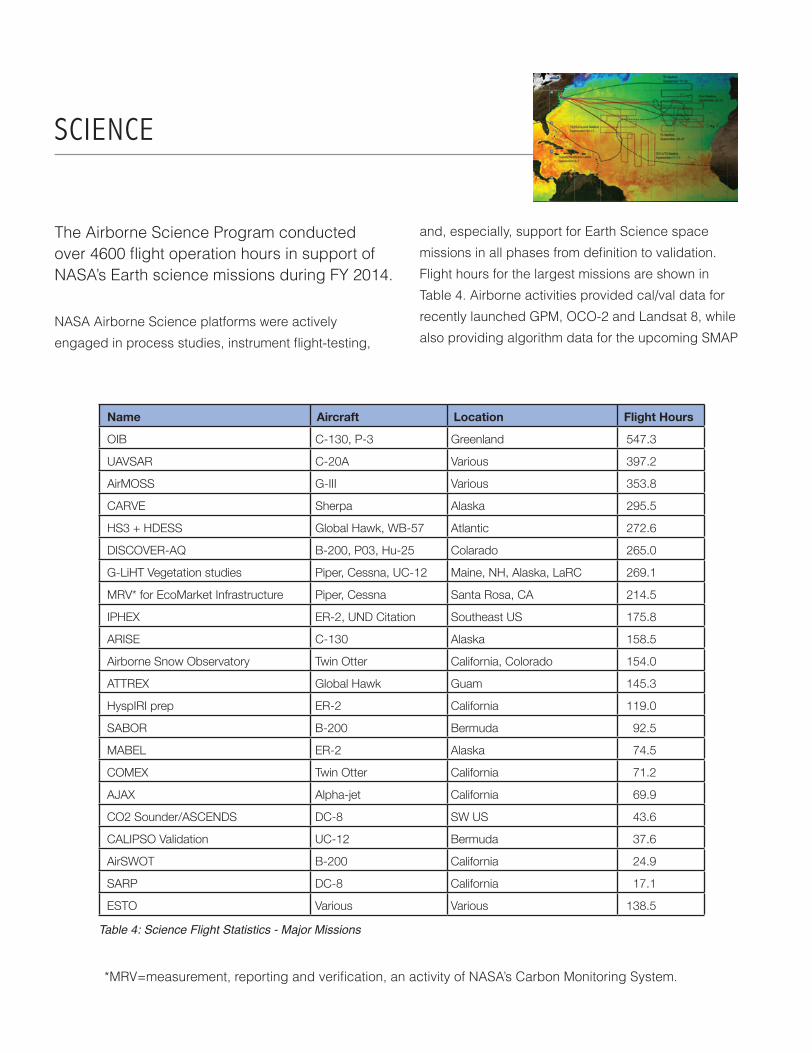
Table 4: Science Flight Statistics - Major Missions
SCIENCE
The Airborne Science Program conducted over 4600 flight operation hours in support of NASA’s Earth science missions during FY 2014.
NASA Airborne Science platforms were actively
engaged in process studies, instrument flight-testing,
Name Aircraft Location Flight Hours
OIB C-130, P-3 Greenland 547.3
UAVSAR C-20A Various 397.2
AirMOSS G-III Various 353.8
CARVE Sherpa Alaska 295.5
HS3 + HDESS Global Hawk, WB-57 Atlantic 272.6
DISCOVER-AQ B-200, P03, Hu-25 Colarado 265.0
G-LiHT Vegetation studies Piper, Cessna, UC-12 Maine, NH, Alaska, LaRC 269.1
MRV* for EcoMarket Infrastructure Piper, Cessna Santa Rosa, CA 214.5
IPHEX ER-2, UND Citation Southeast US 175.8
ARISE C-130 Alaska 158.5
Airborne Snow Observatory Twin Otter California, Colorado 154.0
ATTREX Global Hawk Guam 145.3
HyspIRI prep ER-2 California 119.0
SABOR B-200 Bermuda 92.5
MABEL ER-2 Alaska 74.5
COMEX Twin Otter California 71.2
AJAX Alpha-jet California 69.9
CO2 Sounder/ASCENDS DC-8 SW US 43.6
CALIPSO Validation UC-12 Bermuda 37.6
AirSWOT B-200 California 24.9
SARP DC-8 California 17.1
ESTO Various Various 138.5
*MRV=measurement, reporting and verification, an activity of NASA’s Carbon Monitoring System.
and, especially, support for Earth Science space
missions in all phases from definition to validation.
Flight hours for the largest missions are shown in
Table 4. Airborne activities provided cal/val data for
recently launched GPM, OCO-2 and Landsat 8, while
also providing algorithm data for the upcoming SMAP

A I R B O R N E S C I E N C E P R O G R A M 2 0 1 3 A N N U A L R E P O R T | 1 0
Ecosystems, Climate Variability and Change, Weather,
Water and Energy Cycle, and Earth Surface and
Interior). The program also involved students in many
activities, from student-led flight projects to graduate
student researchers.
and HyspIRI missions. The Airborne Science Program
conducted over 40 missions and deployed field
campaigns, utilizing more than 14 NASA-supported
aircraft and UASs to support science and technology
investigations across the six Earth science focus
areas (Atmospheric Composition, Carbon Cycle and
Major Mission highlights
Major accomplishments of the FY 2014 Airborne Science
Program include airborne science again platforms
supporting the Operation IceBridge and other arctic
and snow-related missions the Earth Venture-1 (EV-1)
Projects, cal/val for the recently launched GPM satellite
and preparation for SMAP, ICESat-II, and HyspIRI and
multiple uses of SAR imagery from the UAVSAR system
on the Armstrong C20-A.
Operation Ice Bridge (OIB) and ARISE
Operation IceBridge is the largest airborne survey of
the Earth’s polar ice ever flown. It is yielding a three-
dimensional view of the Arctic and Antarctic ice sheets,
ice shelves and sea ice. These flights provide a yearly,
multi-instrument look at the behavior of the polar ice
sheets to determine their contributions to current and
future global sea level rise and help understand the
connections between changes in sea ice cover
and the Earth system.
Data collected during Operation IceBridge helps
scientists bridge the gap in polar observations
between NASA’s Ice, Cloud and Land Elevation
Satellite (ICESat) -- which stopped collecting
science data in 2009 after operating for twice
its design lifetime-- and ICESat-2 planned for
launch in 2018. Operation IceBridge is critical to
ensuring a sustained series of observations of the
most dynamic portions of the great Greenland
and Antarctic ice sheets. The Airborne Science
Program and the Earth Science Directorate Cryosphere
Program jointly sponsor operation IceBridge.
During FY2014, the Airborne Science Program
conducted two major OIB campaigns including the first
ever landing of the P-3 at McMurdo Station in Antarctica,
Fig. 6: P-3 Orion at McMurdo Station for Operation IceBridge (Fall 2013)

A I R B O R N E S C I E N C E P R O G R A M 2 0 1 3 A N N U A L R E P O R T | 1 1
Fig. 7: IceBridge data products and how they are measured
OIB Antarctic Campaign: November 2013
The NASA P-3 Orion, based at the Wallops Flight Facility
(WFF), deployed to McMurdo Station, Antarctica on
November 11, 2013 for a 22-day mission in support
of the Operation IceBridge (OIB) campaign. This
deployment marked the first NASA aircraft to be based
from the Antarctic continent and the first wheeled
aircraft operation based from McMurdo Station. To
reach McMurdo, the P-3 flew via New Zealand, rather
than via south Chile, which is the route to the Antarctic
Peninsula and Pine Island Glacier, as flown by the DC-8.
Future missions will alternate deployment between Punta
Arenas and McMurdo. See Figure 8.
Planning for the McMurdo campaign began a year and
a half prior to deployment. WFF and OIB personnel
worked closely with the National Science Foundation
(NSF) and the U.S. Air Force (USAF) Air National
Guard (ANG) 109th Airlift Wing Polar Operations Office
located in Schenectady, NY. NSF and the USAF ANG
personnel partnered with NASA to develop operational
concepts, provided ice runway training opportunities,
and supported site visits to McMurdo Station as well as
and 6th season of P-3 and other aircraft in the arctic.
See Figure 6. Together the IceBridge missions flew over
500 hours.
Operation IceBridge has developed into a major data
mission, collecting more than 60 data products related
to land and sea ice, in addition to snow, as illustrated in
Figure 7.
Fig. 8: Antarctic observation areas

A I R B O R N E S C I E N C E P R O G R A M 2 0 1 3 A N N U A L R E P O R T | 1 2
logistical airlift and surface vessel support to and from
Antarctica.
In preparation for deployment, an avionics upgrade was
performed on the P-3 flight station to include new Flight
Management Systems, Iridium satellite communication
capability (text, data and voice), synthetic vision
capability, installation of a Terrain Awareness Warning
System (TAWS), and new flight displays. P-3 flight crews
performed simulated ice runway training at the U.S.
Navy P-3 simulator at NAS Jacksonville, FL as well as the
109th C-130 simulator at Tampa, FL.
WFF and the P-3 Orion supported 128.2 flight hours,
flew 5 of the available 7 science flight days (two down
days due to weather), and collected over 20,000 km
of science data. The payload consisted of four radars
from the University of Kansas, two LiDARs and a GPS
navigation aid from the NASA Wallops Flight Facility, a
Digital Camera System from the NASA Ames Research
Center, and a gravimeter and magnetometer instrument
managed by Columbia University. The mission
demonstrated the feasibility of conducting NASA aircraft
operations from the Antarctica continent and allowed
data to be collected over longer durations and more area
than previously accessible to other scientific research
aircraft.
2014 IceBridge Arctic Campaign
From Mar. 12 to May 23, 2014, Operation IceBridge
carried out its 2014 Arctic field campaign. Researchers
flew aboard NASA’s P-3 research aircraft out of bases in
Thule and Kangerlussuaq, Greenland, and Fairbanks,
Alaska, to study changes to land and sea ice in the
Arctic. The mission also conducted a pair of flights
designed to help verify future measurements from
ICESat-2, which is slated to launch in 2017.
During this 11-week-long deployment, IceBridge
collected data on changing ice surface elevation and ice
thickness and measured snow depth on sea ice. Several
of these surveys were repeats of flights from previous
years. Repeating measurements from years to year
means IceBridge is able to build a long-term time series
of changes to polar ice, continuing a data record started
by NASA’s Ice, Cloud and Land Elevation Satellite, or
ICESat.
The campaign started with flights over Arctic sea ice
from Thule Air Base in northern Greenland, with a week-
long temporary deployment to Fairbanks, Alaska. During
these flights, IceBridge measured sea ice thickness and
snow depth, producing a quick look dataset before the
end of the campaign that would be of use to scientists
making forecasts of summer sea ice melt. Several of
IceBridge’s sea ice flights were in coordination with other
research groups, such as the European Space Agency’s
CryoVEx satellite validation team.
After several weeks in Thule, IceBridge headed south to
Kangerlussuaq to study coastal glaciers in the southern
half of the country. These flights included measurements
of Jakobshavn Glacier, which drains more than seven
percent of the Greenland Ice Sheet and is one of the
fastest moving glaciers in the world.
While in Kangerlussuaq, IceBridge once again hosted
high school science teachers from the United States,
Greenland and Denmark, giving them a first-hand look
at polar airborne research. In addition, the mission was
visited by a crew from the Al Jazeera America television
program TechKnow, who produced a half-hour episode
about IceBridge.
IceBridge finished the campaign with a return to Thule.
From there, IceBridge finished the campaign’s remaining
high-priority sea ice surveys and collected data on
glaciers in northern Greenland. Arctic flight lines are
shown in Figure 9.

A I R B O R N E S C I E N C E P R O G R A M 2 0 1 3 A N N U A L R E P O R T | 1 3
Fig. 9: Combined Arctic flight lines for 2009 through 2014 show extensive coverage.
ARISE (Arctic Radiation - IceBridge Sea and Ice Experiment)
The Arctic Radiation-IceBridge Sea and Ice Experiment.
(ARISE) mission was a supplement to Operation
IceBridge in 2014, making use of the newly instrumented
C-130. ARISE also provided some preparation for the
C-130, which will fly the spring 2015 IceBridge Arctic
mission while the P-3 is being re-winged. ARISE featured
a very broad instrument suite because of the spacious
accommodations of the C-130. (See Figure 10.) The
variety of instruments provided a large number of options
for interesting science flights, but somewhat ironically,
posed challenges as each instrument required different
meteorological conditions, in conflict with each other.

A I R B O R N E S C I E N C E P R O G R A M 2 0 1 3 A N N U A L R E P O R T | 1 4
Fig. 10: Inside the C-130 during ARISE.
ARISE was the first NASA airborne science mission of
its kind, combining a unique instrument suite that would
have been unlikely to fly together on the same airborne
platform in missions past. New data sets are currently
in the process of being studied and analyzed, and the
ARISE science team will meet in June for their first post-
mission science and data results workshop. A complete
data set will be free and available for analysis in late
Spring/early Fall of 2015 at NSIDC and the LaRC DAAC.
A few of ARISE’s in-field accomplishments include:
• Conducting 17 Science flight (132 hours flown)
• Conducting 6 grid box experiments for CERES
• Conducting numerous sea-ice lines and Alaskan
glaciers characterized for IceBridge
• Observing the sea-ice transition (melting early,
then refreezing), and characterized by wide
range of sea-ice conditions and associated
cloud properties and radiative effects
• Observing that low clouds were geometrically
and optically thin, often multi-layered with fog at
the surface at times
• Conducting numerous focused low cloud
radiative closure experiments
• Observing a significant amount of haze
• Conducting first ever melt season under-flight of
Cryosat-2 with the LVIS laser altimeter (used for
IceBridge objectives)
• Conducting calibration flight for radiometers
including 4STAR, maneuvers to characterize
airframe effects, and to calibrate the MET data
system
A cloud flight line in Figure 11 highlights many features
observed during ARISE.

A I R B O R N E S C I E N C E P R O G R A M 2 0 1 3 A N N U A L R E P O R T | 1 5
Fig. 11: ARISE cloud flight profile. Note the underpass of satellites AQUA, SNPP and TERRA.
Earth Venture Suborbital - 1
The Earth Science Division established Earth Venture
(EV) as an element within the Earth System Science
Pathfinder (ESSP) Program. The first project of the
Earth Venture series, EVS-1, consists of a portfolio of
five competitively selected suborbital Earth Science
investigations to conduct innovative, integrated,
hypothesis or scientific question-driven approaches
to Earth system science. During FY 2014, all five of
the EV-1 missions made significant progress and two
– DISCOVER-AQ and HS3 – completed their airborne
activities.
Hurricane and Severe Storm Sentinel (HS3) - NASA GSFC/ARC
The HS3 (Hurricane and Severe Storm Sentinel) Mission
recently completed its third and final deployment at
NASA’s Wallops Flight Facility (WFF). A NASA Armstrong
Flight Research Center (ARFC)-based Global Hawk
deployed to WFF on August 26, 2014 and flew 10
science flights in the Atlantic before retuning to AFRC on
September 30, 2014.
One goal of the science team was to learn more
about rapid storm intensification by following severe
storms through their entire life cycle, from inception
to dissipation. HS3 was able to do just that, with four
flights over Hurricane Edouard. All of the instruments
on HS3’s environmental Global Hawk (NASA 872, also
known as AV-6), including the Scanning High-Resolution
Interferometer Sounder (S-HIS), Cloud Physics Lidar
(CPL) and Advanced Vertical Atmospheric Profiling
System (AVAPS), performed well and collected data
throughout the deployment. AVAPS dropped a total 649
sondes this year for a 3-year total of 1425.
The series of four flights covered almost the entire
life cycle of the storm, beginning with Edouard as a
newly formed tropical storm during the first flight. The
second flight provided an opportunity to observe rapid
intensification from a weak category 1 hurricane into a
strong category 2. The third flight provided great data
with some well-placed dropsondes in the eye and eye
wall of the storm when it was near maximum intensity.
The final flight provided sampling of a rapidly weakening
hurricane.

A I R B O R N E S C I E N C E P R O G R A M 2 0 1 3 A N N U A L R E P O R T | 1 6
Other areas of scientific interest that HS3 addressed
during this deployment were the structure of the Saharan
Air Layer (SAL) and its effects on storm formation, and
the extra-tropical transition of a storm as it moved to
higher latitudes. HS3 also included 2 flights to the Main
Development Region (MDR) in the central Atlantic.
(See Figure 12.) The MDR is the birthplace of many
hurricanes, and an inter-comparison flight with a NOAA
G-IV over the Gulf of Mexico. Additional highlights for
this year included flights to three different named storms,
Cristobal and Dolly, in addition to Edouard. A total of 10
science flights and 236 science hours were flown. That
brings the three-year total for HS3 to 8 different named
storms, 30 science flights and 642 hours flown.
Principal Investigator Scott Braun of NASA GSFC and
Project Manager Marilyn Vasques of NASA ARC led the
HS3 mission with collaborative efforts by nearly all the
NASA centers, the National Oceanic and Atmospheric
Administration, the National Center for Atmospheric
Research, the Naval Research Laboratory, the Naval
Postgraduate School, the University of Wisconsin, State
University of New York at Albany, University of Utah,
University of Maryland–Baltimore County, Penn State
University and other organizations. Over 300 people
made up the HS3 team and contributed to the success
of the project.
Fig. 12: The flight plan for HS3 Science Flight #10, flown September 28-29, into the main developmenmt region (MDR) where most Atlantic hurricanes form. Screenshot: NASA.
Carbon in Arctic Reservoirs Vulnerability Experiement (CARVE) - JPL
The Carbon in Arctic Reservoirs Vulnerability Experiment
(CARVE) quantifies correlations between atmospheric
and surface state variables for the Alaskan terrestrial
ecosystems through intensive seasonal aircraft
campaigns, ground-based observations, analysis and
modeling sustained over its 5-year mission. The data will

A I R B O R N E S C I E N C E P R O G R A M 2 0 1 3 A N N U A L R E P O R T | 1 7
Fig. 13: Sonde drop and WB-57 flight tracks over hurricane Gonzalo.
Fig. 14: CARVE observations of CH4 (top) and CO2 (bottom) along the 4 September 2014 flight to Bethel and the Yukon/Kuskowim Delta. Enhanced CH4 and CO2 values were observed over a ~300 km region extending from the Lower Yukon River Valley to the Bering Sea. Data gaps are internal calibration periods.
be used in a multidisciplinary investigation to determine
spatial and temporal patterns, sensitivity to change,
and potential responses of Arctic carbon budgets to
observed and projected climate change.
The 2014 CARVE instrument system includes CARVE’s
custom navigation and logging system, which time tags
and geolocates data from the following probes and
instruments: outside air temperature, relative humidity
probes and ozone sensor, two Picarros real time gas
analyzers which measures: Methane (CH4) Carbon
dioxide (CO2), Carbon monoxide (CO) and water vapor
(H2O), a Fourier Transformation Spectrometer (FTS),
two Programmable Flask Packages (PFP) and a nadir
looking, (1024 x 1024) Thermal Infrared camera.
The CARVE aircraft was deployed to Fairbanks, Alaska
from May to November 2014. During this entire period,
once a month, for a two week period, the CARVE flight
crew observed enhanced CH4, and CO2 over various
locations, including the North Slope, Barrow, Prudhoe
bay, Nome, Unalakleet, Innoko, Minto Flats, Fort Yukon,
Bethel, Bettles, Kotzebue, and Kuskokwin valley.
Representative measurements are shown in Figure 14.

A I R B O R N E S C I E N C E P R O G R A M 2 0 1 3 A N N U A L R E P O R T | 1 8
Fig. 15: Example of AirMOSS radar imagery taken at Metolius, OR. (Biome IV). Mosaic of 4 flight lines is shown as false-color overlay of HH/HV/VV in R/G/B/ channels.
noise ratio are achieved for measuring backscattering
cross sections. AirMOSS seeks to study how dynamics
and heterogeneities of root zone soil moisture (RZSM)
control ecosystem carbon fluxes in North America. The
RZSM information is used in hydrologic and ecosystem
process models to determine how much carbon North
American ecosystems are sequestering and releasing,
depending on the available water at their roots. The
difference, also called the Net Ecosystem Exchange
(NEE) of carbon into the atmosphere, is essential for a
better understanding of global climate change.
Each flyover generates roughly half a million pixels
of high-resolution digital imagery, with each pixel
representing an area of 30 to 100 meters squared. For
retrieving soil moisture profiles, these measurements
are run through complex numerical algorithms, using
computer clusters at NASA Ames and
at the USC HPCC, providing the first
temporally and spatially sustained direct
observations of RZSM from a remote sensing
observation. An example is shown in Figure
15. Hydrologic and ecosystem models then
use these RZSM snapshots to simulate
Airborne Microwave Observatory of Subcanopy and Subsurface (AirMOSS) - JPL, USC
The Airborne Microwave Observatory of Subcanoy
and Subsurface (AirMOSS) EV-1 mission completed its
second full campaign year in October 2014. AirMOSS
has flown well over 800 hours and more than 40 flight
campaigns since August 2012. The P-band synthetic
aperture radar (SAR), which is the principal instrument
of the AirMOSS mission, operates in the 420-440
MHz band aboard the NASA Johnson Space Center
Gulfstream 3 (G-3) airplane, and is used to retrieve maps
of soil moisture profiles under the surface and under
vegetation canopies. The flights are flown at 41,000 ft
(12,5 km) altitude. The radar, built and operated by JPL,
has a 2 kW transmitter to ensure high levels of signal-to-
In 2014, CARVE achieved the following major
milestones: all 2013 level-2 data were released to the
public, CARVE flew over 266 Alaskan science flight
hours in 47 flight days, and on 29 May 2014 the CARVE
team flew its 500th science flight hour, successfully
completing its Program-Level Baseline Science
Investigation Requirements. This is a major milestone for
the CARVE team and for NASA’s EV-1 program.
CARVE achieved its 500 Science Flight hour goal,
utilizing CARVE Science payload version 2.0, while
maintaining a 100 % hardware dispatch rate from May
2012 to November 2014. Currently CARVE’s combined
science flight hours for 2012 to 2014 are 732 hours or
232 hours above Baseline. The CARVE team is looking
forward to making these measurements again in Alaska
in 2015.

A I R B O R N E S C I E N C E P R O G R A M 2 0 1 3 A N N U A L R E P O R T | 1 9
Airborne Tropical Tropopause Experiment (ATREX) - NASA/ARC
Water vapor in the stratosphere has a large impact on
Earth’s climate, the ozone layer and how much solar
energy the Earth retains. To improve our understanding
of the processes that control the flow of atmospheric
gases into this region, ATTREX investigators have used
the Global Hawk Unmanned Aircraft Systems (UAS) to
study chemical and physical processes occurring in the
tropical tropopause layer (TTL; ~14-19 km).
hourly maps of soil moisture
and NEE, and will ultimately
provide an up-scaled estimate
of NEE at the north American
continental scale.
The campaign plan is
designed to optimize seasonal
coverage at the wide range of
ecosystems in North America,
while also ensuring that the
G-3 primary Astronaut Direct
Return Mission is intact. All
of the AirMOSS imagery is
available at the ASF DAAC,
and the science products are
available publicly at the USGS
LP-DAAC.
Science flights began on Feb. 13, 2014 from Andersen
Air Force Base on Guam in the western Pacific region.
Global Hawk was on a mission to track changes in the
upper atmosphere and help researchers understand
how these changes affect Earth’s climate. The western
Pacific region is critical for establishing the humidity
of the air entering the stratosphere. ATTREX scientists
installed 13 research instruments on NASA’s Global
Fig. 16: Corresponding maps of soil moisture at various depths at Metolius. The color scale shows the volumetric soil moisture content in units of m3/m3.
AirMOSS, led by Mahta Moghaddam at University of Southern California, managed by Yunling Lou of JPL, and
with flight operations based in JSC, is a multidisciplinary collaboration also involving the Massachusetts Institute of
Technology, Harvard University, Purdue University, Oregon State University, NASA Goddard Space Flight Center, U.S.
Department of Agriculture, and U.S. Geological Survey.

A I R B O R N E S C I E N C E P R O G R A M 2 0 1 3 A N N U A L R E P O R T | 2 0
Hawk 872, also known as AV-6 (Air vehicle 6 is shown
in Figure 17). Some of these instruments capture air
samples while others use remote sensing to analyze
clouds, temperature, water vapor, gases and solar
radiation.
In 2014, ATTREX conducted seven long-duration
science flights (Figure 18) totaling 121 hours, averaging
more than 17 hours per flight. In order to acquire the
needed measurements, the aircraft must fly vertical
profiles, as shown in Figure 19. This year’s flights
bring the total hours flown in support of ATTREX to 297
hours since 2011. AV-6 returned to Armstrong Flight
Research Center on March 14. ATTREX was coordinated
with several other related missions, including NCAR’s
Convective Transport of Active Species in the Tropics
(CONTRAST) and the UK-sponsored Coordinated
Airborne Studies in the Tropics (CAST). In 2015,
ATTREX will complete with a joint CAST mission out of
Southern California. CAST is sponsored by the Natural
Environment Research Council (NERC), the UK’s leading
public funder of environmental science.
The sampling strategy has primarily involved repeated
ascents and descents through the depth of the TTL
(about 13-19 km). Over 100 TTL profiles were obtained
on each flight series. The ATTREX dataset includes
TTL water vapor measurements with unprecedented
accuracy, ice crystal size distributions and habits.
The cloud and water measurements provide unique
information about TTL cloud formation, the persistence
of supersaturation with respect to ice, and dehydration.
The plethora of tracers measured on the Global Hawk
flights are providing unique information about TTL
transport pathways and time scales. The meteorological
measurements are revealing dynamical phenomena
controlling the TTL thermal structure, and the radiation
measurements are providing information about heating
rates associated with TTL clouds and water vapor.
Fig. 18: ATTREX flights from Andersen AFB, Guam. Mission included six Guam local flights, 1.5 transits, 100 hours of TTL sampling, and 180 TTL vertical profiles..
Fig. 19: ATTREX profiles.
Fig. 17: Global Hawk UAS AV-6 in Guam.

A I R B O R N E S C I E N C E P R O G R A M 2 0 1 3 A N N U A L R E P O R T | 2 1
Deriving Information on Surface Conditions from COlumn and VERtically Resolved Air Quality
DISCOVER-AQ recently completed its fourth and final
deployment in a series of field studies to improve the
interpretation of satellite observations to diagnose
surface air quality. Conducted over Colorado’s Northern
Front Range/Denver Metropolitan Area in July and
August 2014, this was the largest concentration of
observations yet, as NASA’s core DISCOVER-AQ team
was joined by an impressive set of collaborators, in
addition to longstanding partners from EPA and NOAA.
Many of these collaborators were part of the Front
Range Air Pollution and Photochemistry Experiment
(FRAPPÉ) jointly sponsored by NCAR/NSF and the State
of Colorado.
Fig. 20: This graphic depicts the DISCOVER-AQ/FRAPPÉ observing strategy employed during the Colorado study. The red line traces the P-3B flight path with recurring spirals over monitoring sites. This flight path is repeated three times on each flight day. The actual flight path for the higher flying King Air is not shown but closely follows that of the P-3B. The NSF C-130 shown over the mountains samples more freely and can explore conditions upwind and downwind of the Northern Front Range area. Tripod sensors represent locations of sun-tracking remote sensors. Trailers are shown at sites where additional in situ measurements were added to a monitoring location. Balloon pairs represent tethered balloon and ozonesonde operations. Lidar observations are shown as vertical traces in light green. Other activities, such as mobile labs are not represented. Image credit: Tim Marvel/NASA
Dr. Jensen and Project Manager Dave Jordan of Ames
lead the ATTREX mission. It includes investigators
from Ames and three other NASA facilities: Langley
Research Center, Goddard Space Flight Center,
and the Jet Propulsion Laboratory. The team also
includes investigators from the National Oceanic and
Atmospheric Administration, the National Center for
Atmospheric Research, the University of California at
Los Angeles, the University of Miami, the University of
Heidelberg, and private industry.

A I R B O R N E S C I E N C E P R O G R A M 2 0 1 3 A N N U A L R E P O R T | 2 2
SABOR
A major collaboration of air and sea measurements
took place this summer (July-August) in the Ship-
Aircraft Bio-Optical Research (SABOR) mission. With
funding provided by NASA’s Ocean Biology and
Biogeochemistry Program, the SABOR experiment
brought together marine and atmospheric scientists
to tackle the optical issues associated with satellite
observations of phytoplankton. Flying on the NASA
Langley UC-12B, the payload consisted of NASA
A total of four aircraft collected observations during
joint flights over a network of surface sites across the
region. NASA’s P-3B from NASA Wallops Flight Facility
and B-200 King Air from NASA Langley Research Center
were the main platforms supporting DISCOVER-AQ.
The P-3B provided in situ profiles of chemical species,
aerosols and radiation over air quality ground monitoring
sites and the B-200 provided remote sensing of gaseous
and particulate pollution from high overhead.
The NCAR C-130 was fielded by the FRAPPÉ team
to serve as a second in situ aircraft to map pollutant
emission sources and chemistry and to sample more
freely upwind and downwind of the DISCOVER-AQ
study region. The overlap in payloads for the two in situ
aircraft required one of the research flights to include a
formation flight to compare the measurements on both
aircraft. A second remote sensing aircraft, the NASA
Langley HU-25C Falcon, was sponsored by NASA’s
GEO-CAPE science team. This plane joined the B-200
flying high overhead with GeoTASO onboard, a UV-
spectrometer instrument developed at Ball Aerospace
to demonstrate the technology that will be used in future
geostationary satellite observations of air quality.
Beneath these four aircraft, the ground network
was also populated with an unprecedented array of
observations to augment the local air quality network
maintained by the Colorado Department of Public Health
and Environment. This included 10 lidars (measuring
ozone, aerosols, and winds), 16 Pandora spectrometers
for remote sensing of trace gases, 20 AERONET
sunphotometers for aerosol remote sensing, 4 in situ
trailers, 6 mobile labs, 2 tethered balloon operations,
and instrumentation on a 300 meter tower at NOAA’s
Boulder Atmospheric Observatory. During the campaign,
two flight days documented conditions for ozone that
exceeded federal air quality standards. On many other
days, ozone production was interrupted by afternoon
storms, avoiding the potential for additional violations.
Clearly identifiable chemical signatures associated
with urban emissions, oil and gas exploration, and
feedlot operations across the area will provide critical
information on the contribution of these sources to
local air quality conditions. More information on all of
the DISCOVER-AQ deployments can be found on the
project website at: http://discover-aq.larc.nasa.gov/
Langley’s High Spectral Resolution Lidar Version 1.1
(HSRL 1.1) and the Research Scanning Polarimeter
(RSP) from the NASA Goddard Institute for Space
Studies (GISS), with the goal of monitoring microscopic
plants that form the base of the marine food chain.
The National Science Foundation’s Research Vessel
“Endeavor”, operated by the University of Rhode Island,
was the floating laboratory that scientists used for the

A I R B O R N E S C I E N C E P R O G R A M 2 0 1 3 A N N U A L R E P O R T | 2 3
ocean-going portion of the SABOR field campaign.
Scientists on the “Endeavor” studied ocean ecosystems
from the Gulf of Maine to the Bahamas.
The airborne portion of the campaign consisted of a
total of 30 flights, constituting 92.5 flight hours. The
Fig. 21: SABOR Experiment concept showing the use of the UC-12B aircraft.
research flights were conducted from Pease Air Force
Base (Portsmouth, NH), Bermuda, and NASA Langley.
Flight operations from the Research Services Directorate
at LaRC were able to support the mission with multiple
flights per day and multiple days in a row.

A I R B O R N E S C I E N C E P R O G R A M 2 0 1 3 A N N U A L R E P O R T | 2 4
Table 5: Major UAVSAR Deployments in 2014.
Fig. 22: Napa Earthquake region.
UAVSAR
The JPL UAVSAR, flying on NASA’s C20-A, accounted
for nearly 400 hours of science flight time in 2014.
UAVSAR is a reconfigurable, polarimetric L-band
synthetic aperture radar (SAR), specifically designed to
acquire airborne repeat track SAR data for differential
interferometric measurements. Most of the work in 2014
is immediately relevant to terrestrial ecology, vegetation
interests, soil moisture, and vulcanology, in addition to
Earth Surface and Interior interests in land movements
and faults. In addition, much of the work of the UAVSAR
is supportive of the upcoming NASA-ISRO SAR (NISAR)
mission.
Many of the missions were flown from the home base of
the C20-A at the Palmdale Aircraft Operations Facility,
but there were also several deployments to other bases
and international facilities, as shown in Table 5.
Location Science Flight Hours
Hawaii / Japan Volcano studies 53.7
New Orleans Gulf coast studies 18.0
South America Vegetation and Volcano studies 80.2
Iceland Ice studies 46.6
Mexico Land movement 25.2
JPL’s UAVSAR, flying on NASA Armstrong C-20A,
surveyed fault displacements in the area of the August
24, 2014 Napa Valley earthquake. UAVSAR flew a five-
hour data collection mission on August 29th. Collecting
data shortly after the earthquake will be valuable to
scientists as they compare with earlier, pre-earthquake
data from the same area.

A I R B O R N E S C I E N C E P R O G R A M 2 0 1 3 A N N U A L R E P O R T | 2 5
Support to ESD Satellite Missions, including Decadal Survey Missions
A primary purpose of the Airborne Science Program is
to support Earth Science satellite missions. This support
includes airborne campaigns to collect data for algorithm
development prior to launch, to test instrument concepts
for satellite payloads or airborne simulators, and to
provide data for calibration or validation of satellite
algorithms, measurements or observations once in orbit.
In 2014, ASP provided support to Earth Science missions
as listed in Table 6. This included significant flight hours
for upcoming Decadal Survey missions.
Satellite Campaign or Instrument Flight Hours
ICESat-2 IceBridge, ARISE 705.8
ICESat-2 MABEL, Alaska 74.5
SMAP UAVSAR, SLAP, AirMOSS 456.5
NISAR UAVSAR missions 314.9
Landsat 8 G-LiHT, HyspIRI airborne 208.1
GPM IPHEX Mission 175.8
GEO-CAPE GEO-TASO, DISCOVER-AQ 157.0
OCO-2 CARVE, COMEX, AJAX, TCCON 141.2
CALIPSO SABOR mission, HSRL cal/val 130.1
HyspIRI HyspIRI Prep; AVIRIS & MASTER 129.1
ASCENDS ASCENDS Accelerator, CarbonHawk 63.9
ACE / PACE PRISM, EXRAD, AirMSPI testing 48.4
SWOT AirSWOT, HAMMR 39.1
Suomi NPP SNPP cal/val 4.6
Table 6: Support to ESD Satellite Missions, including Decadal Survey Missions

A I R B O R N E S C I E N C E P R O G R A M 2 0 1 3 A N N U A L R E P O R T | 2 6
Fig. 23. Extended IPHEx domain showing the river basins under study. In clockwise direction: Upper Tennessee (purple, 56,573 km2), Yadkin-Peedee (pink, 46,310 km2), Catwaba-Santee (blue, 39,862 km2), and Savannah (green, 27,110 km2). The yellow rectangle denotes the Core Observing Area where ground validation efforts concentrated from May 1 to June 15, 2014.
At the ground, an extensive array of NASA and NOAA multi-
parameter radars (NASA/WFF NPOL and D3R radars, NOAA
NOXP radar), disdrometers, rain and stream gauge networks
were deployed and operated on a 24/7 basis to complete
observations of precipitation formation and movement through
the coupled atmosphere-hydrologic system. IPHEx scientists
successfully collected 113 hours of ER-2 and 78 hours of
Citation airborne data and six full weeks of ground-based
science data over a wide variety of storm types ranging from
heavy raining mountain cloud systems that produced strong
hydrologic response, severe hail storms, to smaller and
more lightly raining maritime clouds. Collectively the IPHEx
observations will provide a comprehensive view of orographic
precipitation processes, what those processes actually “look
like” as viewed from GPM spaceborne instrumentation, and
subsequently how to better estimate precipitation rates over
complex terrain.
Integrated Precipitation and Hydrology Experiment (IPHEX)
The NASA Global Precipitation Measurement
(GPM) Mission Integrated Precipitation and
Hydrology Experiment (IPHEx) took place in
the Appalachian Mountains of southwestern
North Carolina from May 1 – June 15, 2014.
Flight region is shown in Figure 23. GPM
IPHEx partners included Duke University and
the NOAA Hydrometeorological Testbed.
Overarching campaign objectives included
the improvement of satellite-based remote
sensing algorithms of clouds and precipitation
over mountainous terrain, and evaluation
and further development of associated data
products for use in hydrologic applications
such as flood prediction.
To achieve these objectives an extensive set
of airborne and ground-based instruments
were deployed and operated under occasional
overpasses of GPM constellation satellite
platforms. Participating aircraft included the
NASA ER-2 and University of North Dakota
Citation. At high altitude, the ER-2 served
as a “proxy” satellite platform carrying the
AMPR and CoSMIR radiometers spanning
frequencies from 10-183 GHz, and the CRS,
HIWRAP, and EXRAD radars covering the W,
Ka, Ku, and X bands. Indeed, IPHEx was
the first NASA field effort to ever deploy and
operate four cloud and precipitation radar
frequencies from the same high-altitude
airplane. The University of North Dakota
Citation aircraft carried a suite of in situ cloud
microphysics probes to sample cloud and
precipitation processes within the field of view
of ER-2 and ground-based instruments.

A I R B O R N E S C I E N C E P R O G R A M 2 0 1 3 A N N U A L R E P O R T | 2 7
Fig. 24: (Top) NASA NPOL and D3R radars move to sample a strong storm. (Bottom left) ER-2 view of a severe storm sampled during a GPM overpass. (Bottom right) UND Citation penetrating complex strtiform cloud and precipitation layers.
HyspIRI Preparatory Airborne Studies
In 2013-2014, to support the development of the
HyspIRI mission and to prepare the community for
HyspIRI-enabled science and applications research,
NASA is flying the Airborne Visible/Infrared Imaging
Spectrometer (AVIRIS) and the MODIS/ASTER Airborne
Simulator (MASTER) instruments on the NASA high-
altitude ER-2 aircraft to collect data sets for precursor
science and applications research and to test the
processing pipeline. The flights cover six large areas in
California spanning a range of diverse environmental
zones that capture significant climatic and ecological
gradients. (See Figure 25.) The airborne data collection
campaigns cover the designated areas at three
separate seasons over two years in order to capture
data from multiple seasons. The areas selected are of
sufficient size to simulate HyspIRI data sets while also
providing opportunities for a broad array of science
and applications research relevant to this mission and
Fig. 25: Map of HyuspIRI Preparatory Airborne Study Flight Boxes in California and Nevada.
A I R B O R N E S C I E N C E P R O G R A M 2 0 1 3 A N N U A L R E P O R T | 2 8
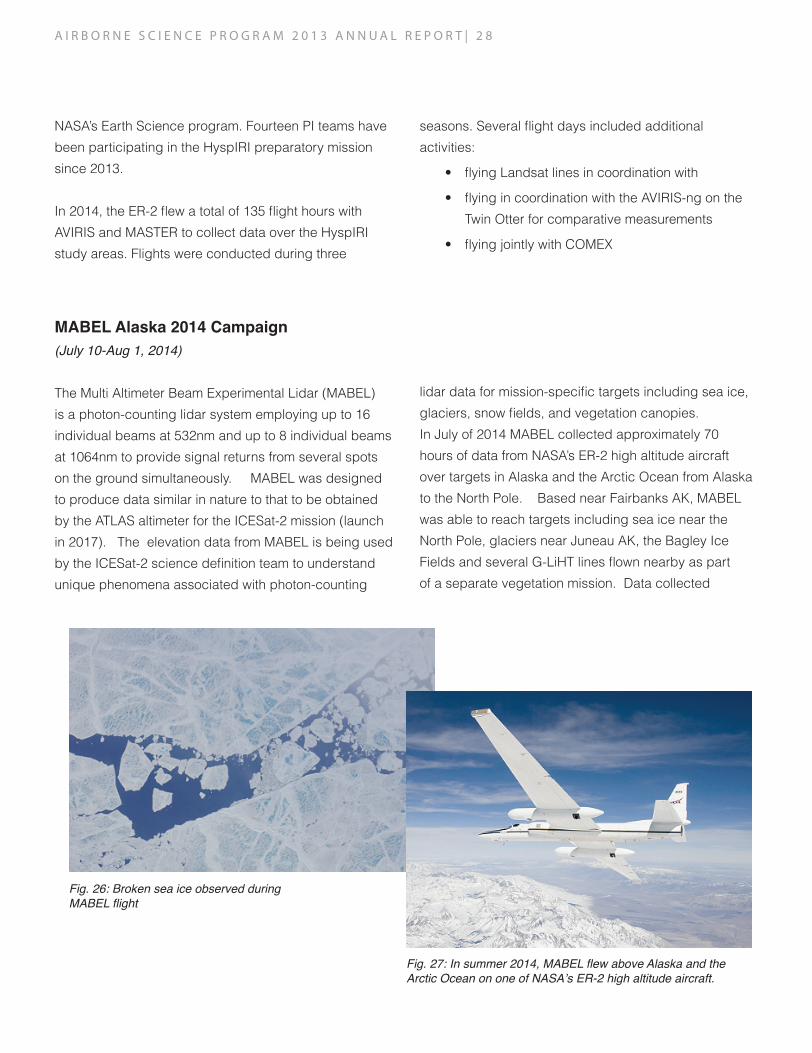
MABEL Alaska 2014 Campaign(July 10-Aug 1, 2014)
The Multi Altimeter Beam Experimental Lidar (MABEL)
is a photon-counting lidar system employing up to 16
individual beams at 532nm and up to 8 individual beams
at 1064nm to provide signal returns from several spots
on the ground simultaneously. MABEL was designed
to produce data similar in nature to that to be obtained
by the ATLAS altimeter for the ICESat-2 mission (launch
in 2017). The elevation data from MABEL is being used
by the ICESat-2 science definition team to understand
unique phenomena associated with photon-counting
lidar data for mission-specific targets including sea ice,
glaciers, snow fields, and vegetation canopies.
In July of 2014 MABEL collected approximately 70
hours of data from NASA’s ER-2 high altitude aircraft
over targets in Alaska and the Arctic Ocean from Alaska
to the North Pole. Based near Fairbanks AK, MABEL
was able to reach targets including sea ice near the
North Pole, glaciers near Juneau AK, the Bagley Ice
Fields and several G-LiHT lines flown nearby as part
of a separate vegetation mission. Data collected
Fig. 26: Broken sea ice observed during MABEL flight
Fig. 27: In summer 2014, MABEL flew above Alaska and the Arctic Ocean on one of NASA’s ER-2 high altitude aircraft.
NASA’s Earth Science program. Fourteen PI teams have
been participating in the HyspIRI preparatory mission
since 2013.
In 2014, the ER-2 flew a total of 135 flight hours with
AVIRIS and MASTER to collect data over the HyspIRI
study areas. Flights were conducted during three
seasons. Several flight days included additional
activities:
• flying Landsat lines in coordination with
• flying in coordination with the AVIRIS-ng on the
Twin Otter for comparative measurements
• flying jointly with COMEX

A I R B O R N E S C I E N C E P R O G R A M 2 0 1 3 A N N U A L R E P O R T | 2 9
will enable the ICESat-2 team to better develop their
algorithms by including any potential unique effects
from photon counting found in partially melted ice and
snow targets, melt ponds, etc. Along with MABEL,
supporting instruments providing information on the local
atmospheric effects were flown: the Cloud Physics Lidar
(CPL) and the Cloud Aerosol Transport System (CATS).
Figure 26 shows a region of broken sea ice very near the
North Pole taken from an imaging CCD camera added to
MABEL and used for the first time on this mission.
Table 7: ASP Support to Instrument Development
Support to Instrument Development
Another major element of the ASP program is the
support of instrument development for Earth Science.
Some instruments are developed specifically for
airborne or UAS utilization, while many are developed
as precursors or simulators for satellite instruments.
In 2014, ASP aircraft flew all of the instruments listed
in Table 7. Many of these instruments have been
developed under sponsorship of NASA’s Earth Science
Technology Office (ESTO).
Instrument Sponsor Aircraft Flight Hours
CO2 sounder ESTO DC-8 43.6
UAVSAR ESTO Global Hawk 26.8
2-micron IPDA Lidar ESTO B-200 24.9
CarbonHawk ESTO HU-25C 20.3
HAMMR ESTO Twin Otter 14.2
EXRAD ESTO ER-2 5.9
Intelligent Payload Monitor ESTO Hellicopter 2.8
AVIRIS-ng TE Twin Otter 38.0
PRISM OBB Twin Otter 71.4
HyTES R&A Twin Otter 48.2
SLAP Entin UC-12B 43.1
eMAS, SHIS EOS ER-2 6.0
HDSS NRL WB-57 12.8
OCS-ICOS ARC WB-57 5.1
Ice Penetrating Radar Planetary Science BT-67 13.6
TOTAL 376.7

A I R B O R N E S C I E N C E P R O G R A M 2 0 1 3 A N N U A L R E P O R T | 3 0
ASCENDS
The 2014 ASCENDS airborne campaign utilized the
NASA DC-8 based out of Palmdale, CA. The campaign
started on August 8 and completed successfully on
September 3rd. The five science flights measured
column CO2 absorption and range from the aircraft
to ground with three different lidar candidates for the
ASCENDS mission. Flights have successfully measured
column CO2 over forests in California, around an urban
area, and over various vegetation cover types in Iowa
at both dusk and dawn. The lidar approach allows
measurements under these conditions that are difficult
for passive sensors. Two flights targeted under flights of
the OCO-2 satellite, one in north western Nevada, and
the other in the central valley of California. These will
allow inter-comparisons once the respective data sets
are processed. Participants in the campaign include the
AVOCET team and MFFL lidar team from LaRC, the CO2
Sounder team from GSFC, and the LAS lidar team from
JPL
Fig. 28 – (Left) Graham Allan supporting ground testing of the lidar. (Right) Wallace Harrison (rear), and Bill Hasselbrack and Stewart Wu operating the CO2 Sounder lidar on the DC-8.
Geostationary Trace gas and Aerosol Sensor Optimiztion (GEO-TASO) instrument
The ESTO-funded Geo-TASO airborne sensor (Figure
29) is an airborne spectrometer flying on the NASA
Langley Research Center HU-25C Falcon. The sensor
system advances retrieval algorithm development and
mission readiness for the upcoming TEMPO and GEMS
air quality measurement space missions. GeoTASO
stands for Geostationary Trace gas and Aerosol Sensor
Optimization. Its main objective is to assess and improve
the performance of the full sensor-algorithm system. The
UV-Visible multi-order spectrometer gives high spectral
and spatial resolution measurements that feed both trace
gas and aerosol retrieval algorithms to test algorithm
performance with real-world scene data. Flying on the

A I R B O R N E S C I E N C E P R O G R A M 2 0 1 3 A N N U A L R E P O R T | 3 1
Fig. 30: ASCENDS Carbon Hawk Experiment on the HU-25C.
Fig. 29: GEO-TASO on the HU-25C.
CarbonHawk
Another instrument, the ASCENDS CarbonHawk
Experiment Simulator (ACES), is an intensity-modulated
continuous-wave lidar system recently developed at
NASA Langley Research Center (LaRC) that seeks
to advance technologies and techniques critical to
measuring atmospheric column CO2 mixing ratios.
Full instrument development concluded in the spring
of 2014 after 3.5 years of effort funded by LaRC and
NASA’s Earth Science Technology Office (ESTO)
Instrument Incubator Program (IIP). Following ground
tests of the instrument, ACES successfully completed
its first test flights in July 2014, flying six times (17.4
hours) with the NASA Langley HU-25C Falcon as the
sampling platform. (Figure 30) The research flights were
conducted from the LaRC Flight Research Hangar and
recorded data at multiple altitudes over land and ocean
surfaces with and without intervening clouds, which are
all important situations to understand for future space-
based measurements. Measurements of CO2 were
simultaneously gathered in situ on the aircraft to validate
the ACES measurements.
Falcon at 32 kft provides a space-like vantage point of
the atmosphere’s boundary layer where the air quality
measurements are needed. Figure 30 shows the sensor
on the Falcon.

A I R B O R N E S C I E N C E P R O G R A M 2 0 1 3 A N N U A L R E P O R T | 3 2
Fig. 31: Map of new EVS-2 mission locations
Upcoming Activities
In FY15 three Earth Venture-1 missions will complete
the airborne portions of their programs. These include
ATTREX, AirMOSS and CARVE. The final ATTREX
campaign will be joint with the UK Natural Environment
Research Council. In 2015, Operation IceBridge
continues in the Arctic with the C-130, while the DC-8
returns to Antarctica. The five new Earth Venture
Suborbital (EVS-2) projects will begin their 5-year
programs in late 2015 (Figure 31).

Aircraft
NASA maintains a fleet of aircraft for scientific activities,
primarily for Earth Science. The aircraft are based at
various NASA Centers. Some of the platforms have
direct support from ASP for flight hours and personnel.
These are the “ASP-supported Aircraft.” NASA catalog
aircraft are also available for science missions. More
information about using the aircraft can be found on the
ASP website at airbornescience.nasa.gov. The annual
“call letter” is an excellent source of information and can
be found on the website.
The capabilities of the ASP fleet range from low and
slow to high and fast, with a wide variety of payload
capacities. The aircraft and their performance
characteristics are listed in Table 8. The altitude /
endurance characteristics are also shown in Figure 32.
Airborne Science Program Resources Platform Name Center
Duration (Hours)
Useful Payload (lbs.)
GTOW (lbs.)
Max Altitude (ft.)
Airspeed (knots)
Range (Nmi) Internet and Document References
ASP Supported Aircraft DC-8 NASA-DFRC 12 30,000 340,000 41,000 450 5,400
http://airbornescience.nasa.gov/aircraft/DC-8
ER-2 NASA-DFRC 12 2,900 40,000 >70,000 410 >5,000http://airbornescience.nasa.gov/aircraft/ER-2
Gulfstream III (G-III) (C-20A) NASA-DFRC 7 2,610 69,700 45,000 460 3,400
http://airbornescience.nasa.gov/aircraft/G-III_C-20A_-_Dryden
Gulfstream III (G-III) NASA-JSC 7 2,610 69,700 45,000 460 3,400
http://airbornescience.nasa.gov/aircraft/G-III_-_JSC
Global Hawk NASA-DFRC 30 1900 25,600 65,000 345 11,000http://airbornescience.nasa.gov/aircraft/Global_Hawk
P-3B NASA-WFF 14 14,700 135,000 32,000 400 3,800http://airbornescience.nasa.gov/aircraft/P-3_Orion
Other NASA Aircraft B-200 (UC-12B) NASA-LARC 6.2 4,100 13,500 31,000 260 1,250
http://airbornescience.nasa.gov/aircraft/B-200_UC-12B_-_LARC
B-200 NASA-DFRC 6 1,850 12,500 30,000 272 1,490http://airbornescience.nasa.gov/aircraft/B-200_-_DFRC
B-200NASA-ARC/DOE 6.75 2,000 14,000 32,000 250 1,883
http://airbornescience.nasa.gov/aircraft/B-200_-_DOE
B-200 NASA-LARC 6.2 4,100 13,500 35,000 260 1,250http://airbornescience.nasa.gov/aircraft/B-200_-_LARC
C-23 Sherpa NASA-WFF 6 7,000 27,100 20,000 190 1,000http://airbornescience.nasa.gov/aircraft/C-23_Sherpa
Cessna 206H NASA-LARC 5.7 1,175 3,600 15,700 150 700http://airbornescience.nasa.gov/aircraft/Cessna_206H
Dragon Eye NASA-ARC 1 1 6 500+ 34 3http://airbornescience.nasa.gov/aircraft/B-200_-_LARC
HU-25C Falcon NASA-LARC 5 3,000 32,000 42,000 430 1,900http://airbornescience.nasa.gov/aircraft/HU-25C_Falcon
Ikhana NASA-DFRC 24 2,000 10,000 40,000 171 3,500http://airbornescience.nasa.gov/aircraft/Ikhana
Learjet 25 NASA-GRC 3 3,200 1,500 45,000 350 1,200http://airbornescience.nasa.gov/aircraft/Learjet_25
S-3B Viking NASA/GRC 6 12,000 52,500 40,000 450 2,300http://airbornescience.nasa.gov/aircraft/S-3B
SIERRA NASA-ARC 10 100 400 12,000 60 600http://airbornescience.nasa.gov/platforms/aircraft/sierra.html
T-34C NASA-GRC 3 500 4,400 25,000 75 700http://airbornescience.nasa.gov/aircraft/T-34C
Twin Otter NASA-GRC 3 3,600 11,000 25,000 140 450http://airbornescience.nasa.gov/aircraft/Twin_Otter_-_GRC
WB-57 NASA-JSC 6 6,000 63,000 60,000+ 410 2,500http://airbornescience.nasa.gov/aircraft/WB-57
Table 8: Airborne Science Program aircraft and their performance capabilities

A I R B O R N E S C I E N C E P R O G R A M 2 0 1 3 A N N U A L R E P O R T | 3 4
Fig. 32: Flight characteristics of NASA aircraft
ASP-Supported Aircraft
The six aircraft directly supported (subsidized flight
hours) by the Airborne Science Program are the DC-8
flying laboratory, (2) ER-2 high altitude aircraft, P-3
Orion, C-20A G-III, JSC G-III, and (2) Global Hawk
unmanned aircraft systems (UAS).
DC-8 Airborne Laboratory
Operating center: Armstrong Flight Research Center
Aircraft description:
The DC-8 is a four-engine jet aircraft with a range in
excess of 5,000 nmi, a ceiling of 41,000 ft and an
experiment payload of 30,000 lb (13,600 kg). This
aircraft, extensively modified as a flying laboratory, is
operated for the benefit of airborne science researchers.
Science flight hours: 60.7

A I R B O R N E S C I E N C E P R O G R A M 2 0 1 3 A N N U A L R E P O R T | 3 5
Mission Location Flight Hours
SARP California Training
ASCENDS accelerator California
Atmospheric Composition
and Chemistry
Modification Impact
Iridium multi-channel modems upgrade.Better reliability in providing science satellite communications capability.
Data servers updateBetter reliability and capacity upgrade to servers for science data handling
Upgrades to cabin ethernet switches Better reliability for science data handling
Updated cabin emergency escape lightingMeets escape lighting standards at far less cost than maintaining original system and with higher system reliability
Established Low Utilization Maintenance Program (LUMP)
Incorporated into Heavy Check that provides more efficient process for maintaining the DC-8 based on how it is utilized. Reduces overall maintenance costs and makes the aircraft more available to support science operations.
Landing gear wheels antiskid valves upgrade. Enhances flight operations safety, maintainability, and reliability.
DC-8 FY14 missions
Fig. 33: Stewart Wu (GSFC) stands watch during ground-based laser testing outside hangar 703 of NASA Armstrong’s Science Aircraft and Integration Facility in Palmdale, CA. The laser beam in emitted nadir from the DC-8 aircraft and is redirected by the circular mirror atop the blue box. These tests ensure alignment of the transmit beam and receiver optics before the rigors of flight.
Modifications made in FY14 and impacts on performance and science:
Significant upcoming maintenance periods:
Due to the incorporation of the new Low Utilization
Maintenance Program (LUMP), there are no long-term
maintenance periods planned for this aircraft. All
planned maintenance will be accomplished around
science activities keeping the aircraft highly available to
science.
Website: http://airbornescience.nasa.gov/aircraft/DC-8

A I R B O R N E S C I E N C E P R O G R A M 2 0 1 3 A N N U A L R E P O R T | 3 6
Mission Location Science program area
IPHEX Georgia Weather
ACOCO California Water and Energy
HyspIRI prep California Terrestrial Ecology
AVIRIS Cal California Carbon Cycle
eMAS California EOS
RADEX-14 California Radiation Science Program
MABEL Alaska Cryosphere
Landsat 8 California Terrestrial Ecology
Ocean Aerosol California Radiation Science Program
ER-2 FY14 missions
Fig. 34: The ER-2 crew rolls the aircraft’s nose, containing MABEL, away from its body, so engineers can work on the instrument. (Credit: Kate Ramsayer, NASA)
ER-2
Operating center: Armstrong Flight Research Center
Aircraft description:
The ER-2 is a civilian version of the Air Force’s U2-S
reconnaissance platform. NASA operates two ER-2
aircraft. These high-altitude aircraft are used as
platforms for investigations at the edge of space.
Science flight hours: 360.3
Modifications made in FY14 and impacts on performance and science:
Inmarsat satellite communication systems became
operational on both aircraft in FY14. This provides
higher-bandwidth downlink and uplink capability for
the science teams.
Significant upcoming maintenance periods:
A cabin altitude reduction effort will be performed
on NASA #806 during August 2015 through April
2016. A similar cabin altitude reduction effort will be
performed on NASA #809 from May 2016 through
January 2017. Only one platform will be available
during the consecutive period from August 2015
through January 2017.
Website: http://airbornescience.nasa.gov/aircraft/ER-2

A I R B O R N E S C I E N C E P R O G R A M 2 0 1 3 A N N U A L R E P O R T | 3 7
P-3 Orion
Operating center: Goddard Space Flight Center’s
Wallops Flight Facility (WFF)
Aircraft description:
The P-3 is a four-engine turboprop aircraft designed for
endurance and range and is capable of long duration
flights. The WFF P-3 has been extensively modified
to support airborne science-related payloads and
activities.
Science flight hours: 610.2
Fig. 35: NASA P-3B as viewed from the cockpit of the NCAR C-130 during a joint flight to compare observations. (Credit: Patrick J. Reddy)
Mission Location Science program area
Operation IceBridge: Antarctica
McMurdo Station,
Antarctica Cryosphere
Operation IceBridge: Arctic
Thule and Kangarlussuaq,
Greenland Cryosphere
DISCOVER-AQ Colorado
Atmospheric Composition
and Chemistry
P-3FY14 missions
Modifications made in FY14 and impacts on performance and science:
The P-3 Orion began the re-wing process in August
2014. This process includes removing the existing set of
wings and replacing with a new set of wings along with
replacement of material in the horizontal stabilizers and
aft pressure bulkhead. Once completed in August 2015
the P-3 Orion’s fatigue life limits will be reset and the
aircraft will be available for NASA missions for another
20-30 years.
Significant upcoming maintenance periods:
Aircraft unavailable due to re-wing and other
maintenance until April 2016.
Website: http://airbornescience.nasa.gov/aircraft/P-3_
Orion

A I R B O R N E S C I E N C E P R O G R A M 2 0 1 3 A N N U A L R E P O R T | 3 8
Fig. 36: G-III carrying SAR pod
G-III FY14 missions
Mission Location Science program area
UAVSAR
AZ, CA, CO, HI, LA, WY,
Japan, South America,
Mexico Earth surface and interior
UAVSAR Iceland, South America Cryosphere
UAVSAR CONUS, South America Water and energy cycle
UAVSAR South America
Carbon cycle / Terrestrial
ecology
UAVSAR California Applied science
AirMOSS
AZ, CA, OK, OR, ME, MA,
NC, Canada, Mexico, Costa
Rica Water and Energy Cycle
AirMOSS Alaska Permafrost Alaska Water and Energy Cycle
G-III Class Aircraft
Operating centers: C20-A Armstrong Flight Research
Center, G-III Johnson Space Center
Aircraft description:
The Gulfstream III is a business jet with routine flight at
40,000 feet. Both the AFRC and JSC platforms have
been structurally modified and instrumented to serve as
multi-role cooperative platforms for the earth science
research community. Each can carry a payload pod for
the various versions of JPL’s UAVSAR instrument.
Science flight hours: C20-A: 397.2; JSC G-II: 369.2

A I R B O R N E S C I E N C E P R O G R A M 2 0 1 3 A N N U A L R E P O R T | 3 9
Fig. 37: Regions of North and Central America flown by G-III for AirMOSS
Modifications made in FY14 and impacts on performance and science: None
Significant upcoming maintenance periods:
In addition to routine maintenance in 2015, the C20-A
will be down from July 7 – August 31, 2015 to replace
engines and to perform a cockpit upgrade.
The JSC aircraft is in Maintenance from November 2014
through January 2015. Both engines completed engine
calendar extension in 2014. Engine husk kit installation
will be complete by Jan 2015, which will reduce engine
noise and allow greater operational flexibility.
Websites: http://airbornescience.nasa.gov/aircraft/G-
III_C-20A_-_Armstrong
https://airbornescience.nasa.gov/aircraft/G-III_-_JSC

A I R B O R N E S C I E N C E P R O G R A M 2 0 1 3 A N N U A L R E P O R T | 4 0
Global Hawk
Operating center: Armstrong
Flight Research Center
Aircraft description:
The Global Hawk is a high-
altitude long-endurance
Unmanned Aircraft System.
With capability to fly more than
24 hours at altitudes up to
65,000 ft, the Global Hawk is
ideal for long duration science
missions. NASA’s two Global
Hawks can be operated from
either AFRC or WFF.
Science flight hours: 444.7
Significant upcoming maintenance periods: None in
FY15
Website: http://
airbornescience.nasa.gov/
aircraft/Global_Hawk
Fig. 38: NASA Global Hawk 872 lands at WFF just after sunrise on September 29 during HS3, as viewed from the T-34 chase aircraft (Credit: NASA)
Global Hawk FY14 missions
Mission Location Science program area
UAVSAR California ESTO
ATTREX Guam
Atmospheric Composition and Chemistry; Atmospheric Dynamics
HS3 WFF Weather
Modification Impact
Wing rack installationProvides ability to support external wing-mounted instruments
Low resolution camera upgrades Improved picture quality
High definition daylight camera Installation
Provides real-time views of weather phenomena to adjust flight paths
Modifications made in FY14 and impacts on performance and science:

A I R B O R N E S C I E N C E P R O G R A M 2 0 1 3 A N N U A L R E P O R T | 4 1
Other NASA Earth Science Aircraft
Other NASA aircraft, as described here, on the Airborne
Science website and in the annual ASP Call Letter, are
those platforms operated by NASA centers, but not
subsidized by the ASP program. These are available for
science through direct coordination with the operating
center.
Aircraft Operating Center
C-130 Hercules WFF
B-200 King Air; UC-12B LaRC, AFRC, WFF
C-23 Sherpa WFF
HU-25C Falcon LaRC
Dragon Eye UAS ARC
Ikhana UAS AFRC
Learjet 25 GRC
S-3B Viking GRC
SIERRA UAS ARC
T-34C GRC
Twin Otter GRC, also can be contracted through JPL
Viking-400 UAS ARC
WB-57 JSC
AlphaJet Can be accessed through ARC
C-130 Class Aircraft
Operating center: Wallops Flight Facility
Aircraft Description:
The C-130 is a four-engine turboprop aircraft designed
for maximum payload capacity. WFF operates two
C-130 aircraft. One has been extensively modified to
support airborne science-related activities. The second
is currently being modified to support future airborne
science research needs. A third C-130 may be brought
up in 2015.
Science flight hours: 231
C-130 FY14 missions
Table 9: Other NASA Earth Science Aircraft
Mission Location Science program area
Operation IceBridge Thule, Greenland Cryosphere
ARISE Fairbanks, Alaska Cryosphere

A I R B O R N E S C I E N C E P R O G R A M 2 0 1 3 A N N U A L R E P O R T | 4 2
Modifications made in FY14 and impacts on performance and science:
FY14 marked the first science mission flights for the
NASA C-130. The existing 55” diameter nadir port was
divided into two 16” diameter and two 8” diameter
nadir ports to support multiple science instruments
simultaneously. Two zenith ports were created in the
flight station. Portable GPS units were added to the flight
station to allow for precision flight lines to be flown by
the pilots. An Airborne Science Program data system,
cabin interphone, and Iridium phone were added to
provide flight data and improve internal and external
communications for the experimenters. Cargo pallets
were modified to support instrument racks and seats
Fig. 39: ARISE Team with C-130
to allow for quick installation and removal of science
equipment from the cabin. A lavatory and galley pallet
was also manufactured to improve in-flight comfort.
The experimenter power load center was modified to
increase power output to each of the experimenter
stations.
Significant upcoming maintenance periods:
NASA#426 begins modifications January 2015
Website: http://airbornescience.nasa.gov/aircraft/C-130_
Hercules
B-200 Class Aircraft
Operating centers: Langley Research Center, Armstrong
Flight Research Center
Aircraft description: The Beechcraft B-200 King Air is
a twin-turboprop aircraft capable of mid-altitude flight
(>30,000 ft) with up to 1000 pounds of payload for up
to 6 hours. Three NASA centers operate B-200 aircraft
with varying modifications for science.
NASA Langley Research Center operates both a
conventional B-200 and a UC-12 (military version). Both
have been extensively modified for remote sensing

A I R B O R N E S C I E N C E P R O G R A M 2 0 1 3 A N N U A L R E P O R T | 4 3
Fig. 40: (Left) LaRC UC-12 during SABOR; (Right) AFRC B-200 flying AirSWOT
B-200 FY14 missions
Fig. 41: On the UC-12B during SABOR
Mission LocationScience program area
AirSWOT CaliforniaWater and energy; Ocean science
SABORLaRC; Bermuda; Portsmouth, NH
Ocean Biology and Biochemistry
SLAP LaRC Water and energy
G-LiHT and HyPlant LaRC Technology
CALIPSO Cal/ValLaRC and Bermuda
Atmospheric Composition and Chemistry
2-micron IPDA Lidar LaRC ESTO
DISCOVER-AQ ColoradoRadiation Science Program
research. NASA Armstrong also operates a Super King
Air B-200, which has been modified for downward
looking payloads. Wallops Flight Facility operates a
B-200 primarily for mission management operations.
Science flight hours: 352.4
Modifications made in FY14 and impacts on performance and science:
The LaRC UC-12B received upgraded ship’s starter
generators from 250 A to 300 A, thereby increasing
research power capacity by a factor of two, from 4200
to 8400 W @28 VDC. The aircraft is not presently wired
to harness all that power, but will be when additional
contactors, fuses and wiring are added. This upgrade
doubles the amount of research power available.
Significant upcoming maintenance periods:
The AFRC B-200 will be in phase maintenance from
November 25, 2014 through February 25, 2015.
The ship’s starter generators on the LaRC
B-200 aircraft will be upgraded to match the
corresponding upgrades on the UC-12B aircraft on
a non-interference basis (sometime in FY15).
Websites:http://airbornescience.nasa.gov/aircraft/B200_-_LARChttp://airbornescience.nasa.gov/aircraft/B-200_UC-12B_-_LARChttp://airbornescience.nasa.gov/aircraft/B200_-_AFRChttp://airbornescience.nasa.gov/aircraft/B-200_
King_Air_-_WFF

A I R B O R N E S C I E N C E P R O G R A M 2 0 1 3 A N N U A L R E P O R T | 4 4
C-23 Sherpa
Operating center: Wallops Flight Facility
Aircraft description:
The C-23 Sherpa is a two-engine turboprop aircraft
designed to operate efficiently under the most arduous
conditions, in a wide range of mission configurations.
The C-23 is a self-sufficient aircraft that can operate
from short field civilian and military airports in support of
scientific studies.
Science flight hours: 316
Fig. 42: Sherpa heading out for CARVE mission
Sherpa FY14 missions
Mission Locartion Science program
CARVE Alaska, Canada Climate change
Modifications made in FY14 and impacts on performance and science: None
Significant upcoming maintenance periods: None
Website: http://airbornescience.nasa.gov/aircraft/C-23_
Sherpa
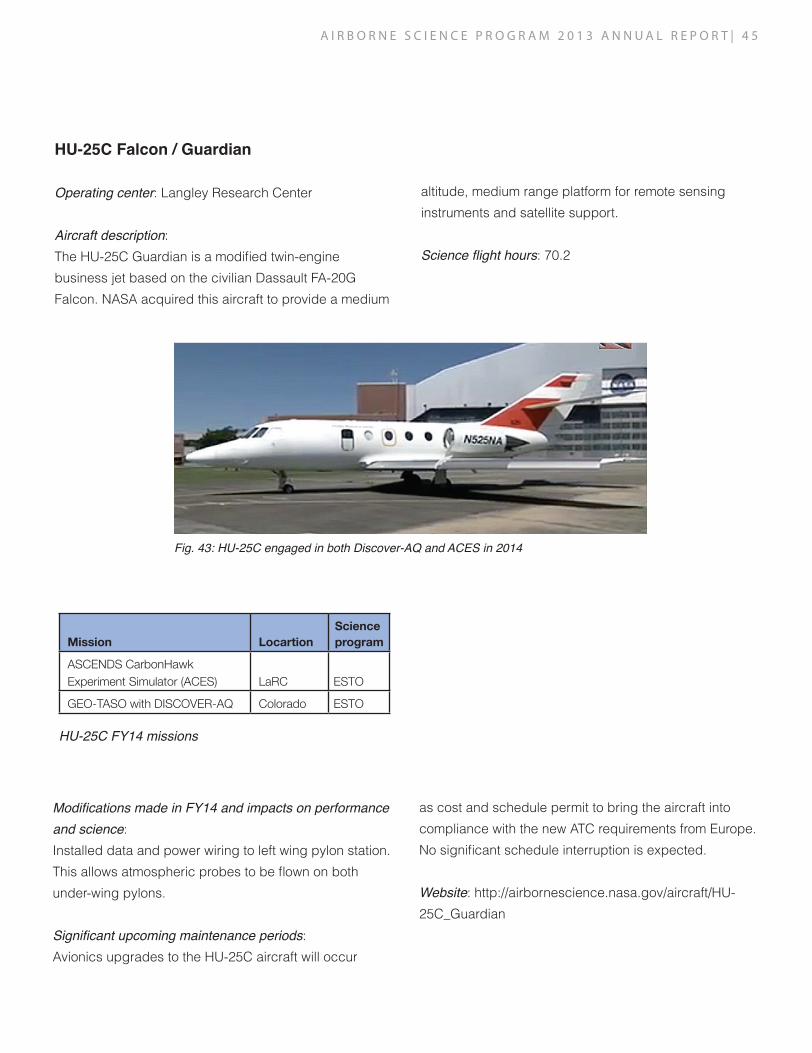
A I R B O R N E S C I E N C E P R O G R A M 2 0 1 3 A N N U A L R E P O R T | 4 5
Fig. 43: HU-25C engaged in both Discover-AQ and ACES in 2014
HU-25C FY14 missions
HU-25C Falcon / Guardian
Operating center: Langley Research Center
Aircraft description:
The HU-25C Guardian is a modified twin-engine
business jet based on the civilian Dassault FA-20G
Falcon. NASA acquired this aircraft to provide a medium
Mission LocartionScience program
ASCENDS CarbonHawk Experiment Simulator (ACES) LaRC ESTO
GEO-TASO with DISCOVER-AQ Colorado ESTO
Modifications made in FY14 and impacts on performance and science:
Installed data and power wiring to left wing pylon station.
This allows atmospheric probes to be flown on both
under-wing pylons.
Significant upcoming maintenance periods:
Avionics upgrades to the HU-25C aircraft will occur
as cost and schedule permit to bring the aircraft into
compliance with the new ATC requirements from Europe.
No significant schedule interruption is expected.
Website: http://airbornescience.nasa.gov/aircraft/HU-
25C_Guardian
altitude, medium range platform for remote sensing
instruments and satellite support.
Science flight hours: 70.2

A I R B O R N E S C I E N C E P R O G R A M 2 0 1 3 A N N U A L R E P O R T | 4 6
WB-57
Operating center: Johnson Space Center
Aircraft description:
The WB-57 is a mid-wing, long-range
aircraft capable of operation for extended
periods of time from sea level to altitudes
in excess of 60,000 feet. The sensor
equipment operator (SEO) station
contains both navigational equipment and
controls for the operation of the payloads
located throughout the aircraft. The WB-57
can carry up to 8800 pounds of payload.
JSC maintains three WB-57 aircraft.
Science flight hours: 46.1
Modifications made in FY14 and impacts on performance and science:
The WB-57 fleet completed upgrade
to ACES II ejection seats this year,
enhancing safety, reliability, sustainability,
and crew comfort over the legacy
ESCAPAC ejection seats. FY14 also saw
new canopies for all three aircraft, and
flight testing of a new digital autopilot
conducted on NASA 927. Once testing
is complete in early FY15, the other
two aircraft will be retrofitted with the
new digital autopilot. This will make
a significant improvement to reliability
and sustainability, as the legacy
MC-1 autopilot is the most common
maintenance/logistics issue with the
aircraft. Similarly, a new communications
system was tested on NASA 927
this year and will be retrofitted to the
other two aircraft in FY15, enhancing
Fig. 44: WB-57 in Florida for HS3 / HDSS mission
WB-57 FY14 missions
Mission Locartion Science program
HDSS / Tropical Cyclone Intensity Program TX Weather
Propulsive Decelerator Technologies Project FL Technology
HS3 TX Weather
OCS-1COS TXAtmospheric Chemistry
Cosmic Dust TX Technology
communications quality and system sustainability. Additional
plans for the fleet in FY15 include a re-engining study
to enhance aircraft performance and fuel economy, a
complete upgrade to the SEO suite in the rear cockpit, new
standardized pallet bay rails, and a new navigation data
system.
Significant upcoming maintenance periods:
NASA 926 due for 12-week Major Inspection beginning in
March 2015.
Website: http://airbornescience.nasa.gov/aircraft/WB-57

A I R B O R N E S C I E N C E P R O G R A M 2 0 1 3 A N N U A L R E P O R T | 4 7
The NASA ASP Small Unmanned Systems Projects
Small and Medium Class UAVs are flown by Ames
Research Center with an overarching goal of
demonstrating and exploiting small-scale, sometimes
Fig. 45: SIERRA-B Carbon Composite Fuselage/Wings/Empennage manufactured in Mojave and ready for component installation.
SIERRA UAS
The Sensor Integrated Environmental Remote Research
Aircraft (SIERRA) is a medium-class, unmanned aircraft
system (UAS) that can perform remote sensing and
atmospheric sampling missions in isolated and often
inaccessible regions, such as over mountain ranges, the
open ocean, or the Arctic/Antarctic.
A new SIERRA-B (Scientific Instrumentation Evaluation
Remote Research Aircraft-B) is under development with
the final assembly almost completed by the end of 2014.
(See Figure 45.) The upgraded SIERRA CAT III UAS will
provide approximately 80-100 lbs of payload capability
to researchers. The SIERRA-B adds enhanced
capabilities including a longer carbon composite
fuselage and bigger center wing tank for increased
range, a fuel-injected Zanzottera engine for better fuel
efficiency, changed angle of incidence providing less
drag, enhanced structural and vehicle analysis and
testing for greater reliability, more electrical power for
investigators, and enhanced DGPS capabilities. A
new mini-NASDAT (NASA Airborne Science Data And
Telemetry) system will provide additional capabilities
for investigators. A flight scheduled for the fall of 2015
is currently in planning to utilize the SIERRA UAS in
expendable aircraft for science. In FY2014 Ames
continued activities with several UAVs in support of
NASA science.
conjunction with the DragonEyes as a platform to
perform instrumented atmospheric sampling with SO2
sensors and mass spectrometry of emissions from the
Salton Sea mud pots.

A I R B O R N E S C I E N C E P R O G R A M 2 0 1 3 A N N U A L R E P O R T | 4 8
Fig. 46: DragonEye UAS
DragonEye Activity in FY14
DragonEye UAS
The DragonEye (Figure 46) is a small (6 lb) UAS
developed originally by the Naval Research
Laboratory and later optimized for mass production
by AeroVironment. These dual electric engine aircraft
are used for local area remote sensing and in situ gas
sampling. 70 units were obtained from the Marine Corp
in 2013.
FY14 Dragon Eye
flight hours 7.3
locations
Three series of test flights @ Site 300 (Lawrence Livermore Lab); 3 series of test
flights at Moffett Field with Autopilot equipped DE’s; 1 series test flights at Crows
Landing of 2 versions of the stretch wing DE variant known as Franken Eye
upgrades / modifications
Commercial Autopilot (revisions A & B ) check out and flight control tuning; 2
versions of the stretch wing DE variant known as Franken Eye built and flight tested;
1 version of Ardupliot (revision C) built and flight tested; 6 more rev C variants in
production for use in FY15; de-icing equipped DE prototype development initiated
with completion expected Mar 2015;3D printing of wing sections successfully
proven
planned maintenance
Ongoing efforts to replace military autopilots and radio hardware in stock DE’s with
equivalent COTS products; each aircraft takes about 5 days to convert;

A I R B O R N E S C I E N C E P R O G R A M 2 0 1 3 A N N U A L R E P O R T | 4 9
Fig. 47: Viking-400 on display at Ames 75th anniversary open house
Viking-400
A total of eight Viking-400 CAT III UAS were transferred
to Ames Research Center from the DoD for research
purposes. Authorization was provided to bring 4 of the
Vikings up to flight status. Current plans are to modify
the Viking engine ignition system and autopilot to match
the SIERRA-B configuration with initial flight testing in
2015. Two aircraft will be operated by Ames Research
Center and the other 2 will be operated in partnership
by Goddard Space Flight Center’s Wallops Flight
Facility. One of the Viking-400 was put on display at the
NASA ARC 75th anniversary open house. (See Figure
47.)
A number of partnerships were formed in 2014 and
ongoing including: Building a partnership with NAVAIR
China Lake for use of their TigerShark UAS with a
payload capability of 50 lbs and 10 hour endurance,
supporting a Norwegian PhD candidate doing deicing
research using previous UAS test data from cold
condition flights and future piggyback flights on the
UASs, supported an SBIR Phase III partnership with
GSE Inc. and Aerojet Rocketdyne for development of a
unique 38HP engine providing enhanced performance
over existing 2-stroke engines for testing on the
SIERRA-B/Viking vehicles.

Aircraft Cross-Cutting Suppor t and IT Infrastructure
Cross-cutting support for ASP missions is managed at Ames Research Center and is supported by the University of California Santa Cruz Airborne Sensor Facility and University of North Dakota NSERC. Specific activities include providing facility instruments, satellite telemetry and mission tools data services, and assistance with payload integration engineering.
Further support for mission management and real-time flight tracking is provided by Ames Research Center
through the Mission Tools Suite (MTS).
Aircraft support entails aircraft facility instrument operations and management, engineering support for payload integration, flight planning and mission management tools, flight navigation data hardware and software support, in addition to flight data archiving and distribution.
ASP Facility Science Infrastructure
Facility Instrumentation
The Airborne Science Program provides a suite of facility instrumentation and data communications systems for community use by approved NASA investigators. Currently available ASP instrumentation (listed in Table 10) includes stand-alone precision navigation systems, and a suite of digital tracking cameras and video systems. Real-time data communications capabilities, which differ from platform to platform, are also described below, and are integral to a wider Sensor Network architecture. In addition, the NASA Earth Science Division, through the Research and Analysis Program and the EOS Project Science Office, maintains a suite of advanced imaging systems that are made available to support multidisciplinary research applications. These
are supported at various NASA field centers including JPL, and the Ames and Langley Research Centers. The Ames ASF also maintains a spectral and radiometric instrument calibration facility, which supports the wider NASA airborne remote sensing community. Access to any of these assets is initiated through the ASP Flight Request process.
Sensor Network IT Infrastructure
A state-of-the-art real-time data communications network is being progressively implemented across the Airborne Science Program core platforms. Utilizing onboard Ethernet networks linked through airborne satellite communications systems to the web-based Mission Tools Suite, the Sensor Network is intended to maximize the science return from both single-platform missions and complex multi-aircraft science campaigns. It leverages data visualization tools developed for the NASA DC-8, remote instrument control protocols developed for the Global Hawk aircraft, and standard data formats devised by the Interagency Working Group for Airborne Data and Telecommunication Systems (IWGADTS.) The Sensor Network architecture includes standardized electrical interfaces for payload instruments, using a common Experimenter Interface Panel; and an airborne network server and satellite communications gateway known as the NASDAT (NASA Airborne Science Data and Telemetry system) These capabilities are now operational on the Global Hawk
UAS, DC-8, P-3B, both ER-2s, and one WB-57F.

A I R B O R N E S C I E N C E P R O G R A M 2 0 1 3 A N N U A L R E P O R T | 5 1
Airborne Science Program Facility Equipment
Instrument/Description Supported Platforms Support group/location
DCS (Digital Camera System) 16 MP color infrared cameras
DC-8, ER-2, Twin Otter, WB-57, B200 Airborne Sensor Facility / ARC
DMS (Digital Mapping System) 21 MP natural color cameras DC-8, P-3 Airborne Sensor Facility / ARC
POS AV 510 (3) Applanix Position and Orientation Systems DGPS w/ precision IMU DC-8, ER-2, P-3, B200 Airborne Sensor Facility / ARC
POS AV 610 (2) Applanix Position and Orientation Systems DGPS w/ precision IMU DC-8, P-3 2 at Airborne Sensor Facility / ARC 2 at WFF
DyNAMITE (Day/Night Airborne Motion Imagery for Terrestrial Environments) Full Color High Definition and Mid-Wave IR High Resolution Full Motion Video System WB-57 JSC
Hygrometers DC-8, P-3, C-130 Airborne Sensor Facility / ARC
IR surface temperature instruments DC-8, P-3, C-130 Airborne Sensor Facility / ARC
High-speed 3D winds and aircraft attitude instruments DC-8, P-3, C-130 Airborne Sensor Facility / ARC
Static air temperature instruments DC-8, P-3, C-130 Airborne Sensor Facility / ARC
HDVIS High Def Time-lapse Video System Global Hawk UAS Airborne Sensor Facility / ARC
LowLight VIS Low Light Time-lapse Video System Global Hawk UAS Airborne Sensor Facility / ARC
EOS and R&A Program Facility Instruments
Instrument/Description Supported Platforms Support group/location
MASTER (MODIS/ASTER Airborne Simulator) 50 ch multispectral line scanner V/SWIR-MW/LWIR
B200, DC-8, ER-2, P-3, WB-57 Airborne Sensor Facility / ARC
Enhanced MAS (MODIS Airborne Simulator) 38 ch multispectral scanner + VSWIR imaging spectrometer ER-2 Airborne Sensor Facility / ARC
AVIRIS-ng Imaging Spectrometer (380 - 2510nm range, Dl 5nm) Twin Otter JPL / JPL
AVIRIS Classic Imaging Spectrometer (400 – 2500nm range, Dl 10nm) ER-2, Twin Otter JPL / JPL
UAV-SAR Polarimetric L-band synthetic aperture radar, capable of Differential interferometry ER-2, Twin Otter JPL / JPL
NAST-I Infrared imaging interferometer (3.5 – 16mm range) ER-2 U Wisconsin / LaRC
Table 10: Facility equipment

A I R B O R N E S C I E N C E P R O G R A M 2 0 1 3 A N N U A L R E P O R T | 5 2
NASA Airborne Science Data and Telemetry (NASDAT) System
The NASDAT provides experiments with:
• Platform navigation and air data
• Highly accurate time-stamping
• Baseline Satcom, Ethernet network, & Sensor-
Web communications
• Legacy navigation interfaces for the ER-2 (RS-
232, RS-422, ARINC-429, Synchro, IRIG-B.)
• Recorded cockpit switch states on ER-2 and WB-
57 aircraft
• Optional mass storage for payload data
Satellite Communications Systems
Several types of airborne satellite communications
systems are currently operational on the core science
platforms (Table 11). High bandwidth Ku- and Ka-Band
systems, which use large steerable dish antennas, are
installed on the Global Hawk and Ikhana UAS, and the
WB-57F.New Inmarsat BGAN (Broadband Global Area
Network) multi-channel systems, using electronically-
steered flat panel antennas, are now installed on many
of the core aircraft. Data-enabled Iridium satellite
Sat-Com System Type/Data Rate (nominal) Supported Platforms Support group/location
Ku-Band (single channel) / > 1 Mb/sec
Global Hawk & Ikhana UAS;
WB-57 NSERC / DFRC / JSC
Inmarsat BGAN (two channel systems) / 432 Kb/
sec per channel
DC-8, WB-57, P-3, S-3B,
DFRC B200, ER-2, Global
Hawk Airborne Sensor Facility / DFRC
Iridium (1 – 4 channel systems) / 2.8 Kb/sec per
channel
Global Hawk, DC-8, P-3,
ER-2, WB-57, G-III, SIERRA,
C-130, others Airborne Sensor Facility, NSERC /ARC
Payload Management
The Airborne Science Program provides a variety of
engineering support services to instrument teams
across all of the program platforms. These include
mechanical engineering, electrical and network interface
support, and general consulting on the operational
issues associated with specific aircraft. The services
are provided jointly by personnel from the National
Suborbital Education and Research Center (NSERC),
University of North Dakota at the NASA Palmdale facility;
and the Airborne Sensor Facility (ASF), University of
California, Santa Cruz at Ames Research Center and
Palmdale.
NSERC staff provides instrument integration services for
the NASA DC-8 aircraft. Instrument investigators provide
a Payload Information Form that includes instrument
requirements for space, power, aircraft data, and
location of the instruments and any applicable inlet or
window access needs. The staff then uses the provided
information to complete engineering design and analysis
Table 11: Satellite Communications systems on ASP aircraft
phone modems are also in use on most of the science
platforms as well. Although Iridium has a relatively low
data rate, unlike the larger systems, it operates at high
polar latitudes and is light weight and inexpensive to
operate.

A I R B O R N E S C I E N C E P R O G R A M 2 0 1 3 A N N U A L R E P O R T | 5 3
of instrument and probe installations on the aircraft and
wiring data and display feeds to instrument operators.
NSERC also provides data display, aircraft video, facility
instruments and satcom services on the DC-8, P-3B,
and C-130 aircraft. A high speed data network (both
wired and wireless) is maintained on each of the aircraft
so on board investigators have access to display data
available on the aircraft. Video, aircraft state parameters,
and permanent facility instrument data are recorded,
quality controlled, and posted on the science mission
and Airborne Science Program data archives. Satcom
services are provided with multichannel Iridium and high
bandwidth INMARSAT services. These services allow
for real time chat with scientists on the ground and other
aircraft. NSERC engineers also work with investigators to
send appropriate data up to and down from the aircraft
to allow for real time situational awareness to scientists
on the ground and in flight.
Along with general payload engineering services, the
ASF designs and builds custom flight hardware for
the ASP real-time Sensor Network, e.g. the NASDAT
(network host and navigation data server), and the
standardized Experiment Interface Panels; as well as
payload data systems for the Global Hawk,
including the Telemetry Link Module and the
MPCS (Master Power Control System). Together
with NSERC, they also support payload IT
operations on the Global Hawks, as well as other
aircraft equipped with payload satcom systems.
The ASF personnel also support the ER-2
program, providing payload integration support
as required.
Fig. 48: The many functions of MTS
Mission Tool Suite
The utilization of airborne assets to conduct Earth
Science research provide unique opportunities to better
understand our Planet and the environmental systems
that impact our lives. Earth Science research in the
airborne domain requires the collective contribution
of many individuals, and this orchestration requires
solutions that can quickly propagate the current
mission context and constraints to help participants
operate independently yet be in-the-loop to enable
fast and efficient decision making. A consequence to
the contrary may result in increased monetary costs
and, more importantly, lost opportunities for observing
rare natural phenomena. To this end, the primary
objectives of the Mission Tools Suite (MTS) are (a) to
support tactical decision-making and distributed team
situational awareness during a flight; (b) to facilitate
team communication and collaboration throughout the
mission lifecycle; and (c) to both consume and produce
visualization products that can be viewed in conjunction
with the real-time position of aircraft and airborne
instrument status data. The many aspects of MTS are
shown in Figure 48.

A I R B O R N E S C I E N C E P R O G R A M 2 0 1 3 A N N U A L R E P O R T | 5 4
MTS represents the ground complement to the
NASA SensorNet project, which is developing the
airborne networking infrastructure to enable satellite
communication of aircraft parameter and instrument
data during flight missions. Taken together, the intent
of the system is to encourage more responsive and
collaborative measurements between instruments on
multiple aircraft, satellites, and on the surface in order
to increase the scientific value of the measurements,
and improve the efficiency and effectiveness of
flight missions. To that end, Dr. Aaron Duley has
been presenting the use and utility of MTS to various
constituencies. An example of his presentation opening
is shown in Figure 49.
Fig. 49: Presenting the MTS to new users
2014 MTS accomplishments include:
• a number of important architectural,
performance, and end-user enhancements to
the software,
• the addition of mobile-friendly tracking option,
• an improved platform for public education and
outreach through the Mission Tools for Education
(MTSE) initiative,
• a host of customized instrument, satellite, and
other data product visualizations to support real-
time mission activities,

A I R B O R N E S C I E N C E P R O G R A M 2 0 1 3 A N N U A L R E P O R T | 5 5
• the management and dissemination of low-
cost tracking solutions supporting multi-asset
tracking and mission situational awareness,
• widespread use of the Airborne Science
Program’s public asset tracker, mobile tracker,
MTS, and MTSE.
MTS supported the following projects: Hurricane
and Severe Storm Sentinel (HS3), Airborne Tropical
Tropopause Experiment (ATTREX), Integrated
Precipitation and Hydrology EXperiment (IPHEX),
Ship-Aircraft Bio-Optical Research (SABOR), Tropical
Cyclone Initiative/HS3, CO2 and Methane Experiment
(COMEX), Arctic Radiation - IceBridge Sea & Ice
Experiment (ARISE), Operation Ice Bridge (OIB),
Deriving Information on Surface conditions from Column
and Vertically Resolved Observations Relevant to Air
Quality (DISCOVER-AQ), Carbon in Arctic Reservoirs
Vulnerability Experiment (CARVE). Looking forward into
FY15, the MTS team plans to continue its operational
support role and will feature the next major software
release.

A I R B O R N E S C I E N C E P R O G R A M 2 0 1 3 A N N U A L R E P O R T | 5 6
Advanced Planning
The Airborne Science Program maintains and operates
a diverse fleet of aircraft, people and infrastructure that
support a diverse and evolving stakeholder community.
ASP leadership conduct a yearly strategic planning
meeting in order to ensure the program maintains
currently required capabilities, renews these assets
and, as new technologies become available, extends
the observational envelope to enable new earth science
measurements. The program also plans strategically by
looking at past experiences through formal meetings to
discuss lessons learned following all major campaigns.
Requirements for Program assets are collected and
communicated through the program flight request
system (http://airbornescience.nasa.gov/sofrs), the
annual 5-yr schedule update, and through ongoing
discussions with Mission and Program managers and
scientists.
Strategic planning in the program is focused on the
following areas:
• ASP-supported (core) Aircraft – maintenance,
upgrades, determining future composition of the
fleet
• Observatory management - improved tools
for managing assets and requirements while
improving the service to science investigators
• New Technology – bringing new technologies to
observational challenges including application
of advanced telemetry systems, on-board data
processing, IT mission tools, and new platforms
• Education opportunities
Requirements update
ASP personnel monitor upcoming Earth Science space
missions for potential airborne needs to support:
• Algorithm development
• Instrument test
• Calibration and validation activities.
In recent years, much attention has been focused on
planning for the “Decadal Survey” missions defined
in the 2007 NRC report. The first up will be SMAP and
IceSAT-2. However, ASP also supports existing space
missions (e.g., A-Train satellites), as well as recently
launched “foundational” missions such as GPM, OCO-
2, and Suomi NPP. Once launched, these missions
require mandatory cal/val, often making use of airborne
capabilities.
Upcoming new space missions are planned for the
International Space Station, several small sats, and
collaborations with ESA and other space agencies.
Several airborne experiments have already been
identified to support these activities. Furthermore, the
next NRC Decadal Survey for Earth Science is expected
in 2017 and new airborne support missions should be
anticipated.
Participation in science team meetings and program
reviews in 2014 to describe ASP capabilities and collect
requirements information are listed in Table 12.

A I R B O R N E S C I E N C E P R O G R A M 2 0 1 3 A N N U A L R E P O R T | 5 7
Activity
Applied Science Decadal Survey Mission update – ASP presentation
Member of Terrestrial Ecology Airborne Science Working Group (Intermediate participation in HyspIRI Science team and
Steering Group monthly telecons)
Participation in 2014 ESTO review Forum
Participation in 2014 NASA SMAP cal/val meeting
Participation in 2014 NASA SWOT science team meeting
Participation in 2014 PARCA meeting
Participation in 2014 OBB AVIRIS-ng update
Planning for the next Decadal Survey – Atmospheric Composition and Chemistry mission at ARC
Presentation at 2014 IGARRS meeting
Table 12: Activities to support ASP requirements information gathering
5-yr plan
A five-year plan is also maintained by the Program for
out-year planning and scheduling. A graphical copy is
shown in Appendix 2, depicting plans by science area
and aircraft platform. Significant maintenance periods
for the various aircraft are also indicated.
A I R B O R N E S C I E N C E P R O G R A M 2 0 1 3 A N N U A L R E P O R T | 5 8
Education, Training, Outreach and Par tnerships
Student Airborne Research Program 2014
Thirty-two undergraduate students from a like number
of colleges and universities participated in an eight-
week NASA Airborne Science Program field experience
designed to train and inspire future scientists by
immersing them in the agency’s Earth Science research.
The students are shown in Figure 50. The locations of
their colleges are shown in Figure 51.
Flying aboard NASA’s DC-8 airborne laboratory, students
measured pollution, aerosols, and air quality in the Los
Angeles basin and California’s central valley. They also
used remote sensing instruments to study forest ecology
in the Sierra Nevada and ocean biology along the
California coast.
NASA’s Student Airborne Research Program (SARP)
provides a unique opportunity for undergraduate
students majoring in the sciences, mathematics and
engineering to participate in all aspects of a NASA
Airborne Science research campaign. 2014 was the 6th
summer the program has been offered.
SARP began June 16, 2014 at NASA Armstrong Flight
Research Center’s facility in Palmdale, California, with
lectures by university faculty members, NASA scientists
and NASA program managers. The students flew aboard
the DC-8 on five flights during the week of June 23. They
acquired multi-spectral images of kelp beds in the Santa
Barbara Channel and of forests in the Sierra Nevada.
In addition, the students flew over dairies and oil fields
in the San Joaquin Valley, parts of the Los Angeles basin
and the Salton Sea at altitudes as low as 1,000 feet in
order to collect air samples, measure aerosols and air
quality. During the final flight, half of the students were
in the field taking ground validation or complementary
measurements while the DC-8 flew overhead.
The final six weeks of the program took place at the
University of California, Irvine where students analyzed
and interpreted the data they collected from science
instruments on the aircraft. At the conclusion of the
program, the students each delivered final presentations
about their results and conclusions in front of an
audience of NASA scientists and administrators,
university faculty members and their fellow SARP
students. Eight students will present their SARP research
projects at the 2014 Fall AGU Meeting in San Francisco.
SARP is managed by NASA’s Ames Research Center
at Moffett Field, California, through the National
Suborbital Education and Research Center (NSERC)
at the University of North Dakota. As part of the
Ames Cooperative for Research in Earth Science and
Technology, NSERC receives funding and support from
NASA’s Earth Science Division.

A I R B O R N E S C I E N C E P R O G R A M 2 0 1 3 A N N U A L R E P O R T | 5 9
Fig. 50: SARP 2014 participants pose in front of the NASA DC-8 on June 20, 2014. (Photo: NASA)
Fig. 51: Colleges and universities represented in SARP 2014

A I R B O R N E S C I E N C E P R O G R A M 2 0 1 3 A N N U A L R E P O R T | 6 0
Mission Tools Suite for Education (MTSE)
A number of Airborne Science Program missions (OIB 2013
Antarctica, ATTREX 2014, OIB 2014 Greenland, and HS3
2014) used the NASA Mission Tools Suite for Education
(MTSE) to directly connect to K-12 classrooms.
The MTSE website allows students and teachers to track the
progress of the ASP aircraft and provides a portal through
which classrooms can participate in live, online text chats
with NASA scientists, educators and crew members during
the missions. During FY2014, a total of 133 classrooms
connected to ATTREX, HS3 and OIB through MTSE with a
total of 3,127 K-12 students and their teachers (Figure 53).
MTS for Education Website Features:
• Live flight following: Students and teachers can
track the position of ASP aircraft on a map (2D or
3D) in real-time
• Live camera feeds from the aircraft (on select
missions)
• Real-time satellite data products
• Environmental data from the aircraft: Allows
students to plot aircraft altitude, speed,
temperature, wind speed, etc in real-time
• Live text chats between classrooms and mission
scientists, pilots, and others onboard the aircraft or
on the ground
- Students and teachers can ask questions
directly through the website with login
information provided to them
- Multiple classrooms can log in during the same
flight
- Chat scheduling and organization coordinated
before and during the flights by NSERC
Fig. 52: Fifth grade students in Sanger, CA and their teacher, Janell Miller, during an online chat with OIB personnel on April 9, 2014.
Ms. Miller has connected these students
to OIB 2013 in McMurdo, ATTREX 2014 in
Guam, and OIB 2014 in Greenland. Before
connecting with OIB in Greenland she
commented: “My class is so excited for this
Fig. 53: Student participation

A I R B O R N E S C I E N C E P R O G R A M 2 0 1 3 A N N U A L R E P O R T | 6 1
Fig. 54: Top left: 6th grade teacher Nichol Anderson introduces the NASA Mission Tools Suite for Education (MTSE). Bottom left: Tioga, ND 6th grad students view a live online chat while the NASA p-3 flies over Greenland.
Top right: 32 Central Elementary 6th graders and their teacher pose with the MTSE flight tracker.Bottom right: Tioga, ND 6th grade students point at the NASA P-3 flight path over Greenland.
Figure 54 shows 6th graders and their teacher, Nichol
Anderson, participating in an online chat from their
classroom at Central Elementary in Tioga, North Dakota
with scientists onboard the P-3 aircraft over Greenland
(5/12/2014).
next adventure! Thank you so much for the opportunity
this year. My students will remember this for the rest
of their lives. We chatted with NASA at the South Pole,
Equator, and soon the North Pole!”
Figure 54. Twenty-one educators visited NASA Wallops Flight Facility on 9/11/14 to learn about the HS3 mission, tour the Global Hawk, the Global Hawk Operations Center and meet with HS3 mission personnel.
Additional outreach is part of most major ASP
missions. For example, a media/education day for
HS3 was held on September 11 with presentations
of the project and tours of the aircraft and operations
center. (See Figure 55.)

A I R B O R N E S C I E N C E P R O G R A M 2 0 1 3 A N N U A L R E P O R T | 6 2
Partnerships
The Airborne Science Program, through its field
centers, continued to maintain a significant and
growing collabo¬ration with the National Oceanic and
Atmospheric Administration (NOAA).
Through memorandums of agreement, NASA and
NOAA have been collaborating in aircraft operations,
primar¬ily training and using NOAA pilots. NOAA pilot
Lt Commander Jon Neuhaus augmented NASA B200
pilots flying AirSWOT engineering missions. NASA
and NOAA also collaborated in nearly all aspects of
the Global Hawk unmanned aircraft system project and
its associated missions, Hurricane and Severe Storm
Sentinel and Airborne Tropical Tropopause Experiment.
Lt Commander Jonathan Neuhaus continued as the
embedded NOAA GH liaison.
The Airborne Science Program also remained active in
the Interagency Coordinating Committee on Airborne
Geoscience Research and Applications (ICCAGRA)
representing NASA. Other ICCAGRA organizations
include NOAA, National Science Foundation,
Department of Energy, US Geological Survey, US
Forest Service, Naval Research Laboratory, and Office
of Naval Research along with participation from the
National Center for Atmospheric Research, National
Suborbital Education and Research Center and Center
for Interdisciplinary Remotely-Piloted Aircraft Studies.
ICCAGRA’s role is to share information about activities
and capabilities and facilitate collaboration between
members. Examples of the collaboration this past
year included the integration of NRL supported new
dropsonde technology on the WB-57 and flying a
coordinated mission with NOAA. NASA assumed the
chairmanship of ICCAGRA this year.
The Airborne Science Program has also re-initiated
contact with the European Fleet for Airborne Research
(EUFAR), also in coordination with ICCAGRA, to look
into future collaboration opportunities. A collaborative
airborne science mission took place in Guam this year
during ATTREX between the United Kingdom’s National
Environmental Council Bae-146 and NASA GH. Also
participating was NSF’s G-V, HIAPER.

Historical Perspective: Jeffrey Myers
Jeff Myers is the manager of the Airborne Sensor Facility
(ASF) at NASA Ames Research Center, which provides
remote sensing and payload engineering services for the
NASA Airborne Science Program and the EOS Project
Science Office. The ASF supports facility sensors, instrument
and payload systems development, and sensor calibration.
The ASF is operated under contract to the University of
California-Santa Cruz.
The following is based on an interview which took place
during the Fall 2012 AGU conference held in San Francisco,
California.
I started at Ames in October of 1976, fresh out of UC-
Berkeley. I was working toward an aviation A&P mechanics
license in high school before I decided to go to Berkeley,
earning a bachelor’s degree in Physical Geography. (The
A&P experience would later come in handy, when I started
working around aircraft.) I came to Ames in 1976 to analyze
lunar photography from the Apollo program. While two
astronauts were on the moon’s surface, a third crew member
was running large-format mapping cameras on the orbiting
Service Module. They acquired many spectacular rolls
Appendix A
of 5-inch stereo film of the surface of the moon. Because I’d studied aerial photography at Berkeley under Bob
Caldwell in the Forestry Department, the lunar mapping job was a natural fit.
The NASA U-2 program that was then at Ames ran mostly cameras, until John Arvesen, who was a scientist
associated with the program, developed a thermal infrared scanner to fly on that aircraft. It was a surplus HRB-454
film-recording line scanner of the type that the Air Force had used in Vietnam. John converted it to record on an
analog tape recorder instead of 70mm film, and he needed somebody to help him with the data processing. It was
a two-channel system, with a broadband visible band in addition to the one in the thermal infrared, and somehow
Jeff Myers in 1985

A I R B O R N E S C I E N C E P R O G R A M 2 0 1 4 A N N U A L R E P O R T | 6 4
I volunteered to help, actually knowing nothing about
electronic data, and having no idea what I was
getting into. At that time, there was a data facility, the
precursor to the Airborne Sensor Facility, called the
U-2 Operational Support Section. It was geared to film
processing because the NASA U-2Cs were flying mainly
cameras, supporting early earth science remote sensing
research and laying the groundwork for the Landsat
program.
Electromagnetic Systems Laboratory (ESL) was
subcontracted to run the U-2 OSS by the Lockheed
Skunk Works, which ran the U-2 program for NASA, from
aircraft maintenance and camera technicians, through
the pilots. (The one exception was Marty Knutson, who
ran the overall program for NASA and was, of course,
a pilot.) There were literally miles of optical film going
through that lab, but they needed someone to process
the infrared imagery, so they hired me.
The analog flight tapes from the HRB-454 had to be first
digitized, which was done in a vault over at ESL, before
they could be put into a computer compatible form. The
scanner flew in the Q-Bay of the old C-model U-2 and
collected some of the first thermal infrared data ever
seen by the earth science community. The early flights
revealed some really interesting things, including cold
water upwelling off the Pacific coast and a forest fire
in Sequoia National Park. Heavy smoke obscured the
park in the visible band, but the fire perimeter itself was
clearly apparent in the IR band. It was one of the early
examples of IR fire mapping from a civilian aircraft and
people were very excited about the possibilities.
The HRB-454 was replaced with an all-digital AADS-
1260 multispectral scanner from Daedalus Enterprises
in 1979, and John figured out that we could hook the
scanner output to a 915-megahertz transmitter on the
plane, and broadcast the data in real time, line-of-sight.
They put a 30-watt transmitter in the back of the plane
and started flying. We wanted to see how far we could
go and still get the data signal. The link sustained a
megabit-per-second and worked out to a 400-mile radius
from Ames: not too bad even by today’s standards. We
had put a big antenna on the roof of the building that
we could spin using a Radio Shack TV antenna rotor
to follow the aircraft as best we could. We couldn’t see
it but we vaguely knew its location. It was definitely a
human in-the-loop tracking system. We later moved the
antenna to a nearby mountain top for better reception. It
was a pretty good system and the forestry people were
quite excited to see it in action. Broadcasting with 30
watts over southern California did cause a few problems
though, and I believe we accidentally jammed a Navy
cruise missile test on San Clemente Island. We were on
an authorized frequency, but John somehow managed
to keep the peace, and the system went on to fly over
multiple fires in California.
In July of 1981, the first ER-2, NASA 706, was delivered
to Moffett Field. There was a big ceremony and a VIP
tour of the data facility. I spent 10 minutes showing
Kelly Johnson [renowned aeronautical engineer] some
of our growing collection of thermal imagery. He looked
at color IR photography of California, as well. I think
he was pleased to see some U-2 data that wasn’t of a
missile silo somewhere.
In the early 1980s, NASA started to conceive of the
Thematic Mapper instrument for the next generation of
Landsat. The U-2Cs had enabled the simulation of the
early Landsat Multi-Spectral System with multispectral
cameras, so it was the logical platform for this new
project. Ames contracted with Daedalus Enterprises
in Ann Arbor, MI (a spin-off from the old Willow Run
Labs) to build the airborne Thematic Mapper Simulator
(TMS.) This new system had modular spectrometers
that included one for ocean color imaging (the AOCI)

A I R B O R N E S C I E N C E P R O G R A M 2 0 1 4 A N N U A L R E P O R T | 6 5
and one for weather satellite simulation (the MAMS.)
The new system was delivered in 1983, with first flights
on the new ER-2. (NASA also acquired a TM simulator
called the NS-001 that flew on the JSC C-130B, and later
came to Ames with the aircraft’s transfer.) During the
ER-2 TMS’s first flight down the central Sierra we noticed
that all the snow appeared black in the new shortwave
IR bands. No one was very familiar with this spectral
region at the time. Clouds were white, and everything
else looked like it should, but the snow was black in this
solar-reflective band. Was there a problem with this
channel, or a problem with the digitizer? John called
Vince Salomonson, who was one of the chief scientists at
Goddard’s Earth Sciences. After thinking it over, Vince
called back and said that indeed, snow should be black
in this spectral region because of the size and geometry
of the ice crystals relative to those wavelengths. These
SWIR bands later proved useful for distinguishing
between snow and cloud, a continual problem in
remote sensing. The TMS was also connected to the
ER-2’s transmitter and it was used to map the gigantic
Yellowstone fires of 1988 in real-time, with a ground
station, staffed by the data facility, located in the park
headquarters.
By now I started going to Alaska every summer to be the
TMS technician and data analyst. I would preflight the
instrument in the morning, pouring the liquid nitrogen
into the dewars, and then take the tapes off the plane
and into hangar to analyze them at day’s end. They were
operating from what they called the Russian Hangar
at Eielson AFB, near Fairbanks. It was a decrepit old
hangar at the far end of the field that had been used to
ferry Lend-Lease airplanes to the USSR in World War
II. There had been little maintainance since then. Over
the course of nine summers, the NASA U-2Cs and
ER-2s imaged nearly the entire state of Alaska. The
hardest area to cover was the Aleutians because of
nearly constant cloud-cover. Also, the aircraft operated
out of King Salmon in the south for aseveral summers
trying to image those last sections of land, as well as
the Aleutians and the panhandle. All of the Alaska
photography and digital scanner data are archived at
the EROS data center in Anchorage and Sioux Falls, SD.
They represent a unique cloud-free data set to this day.
Aerial photography remained a big part of the program
and the sensor facility cataloged and distributed all of
it. For years the NASA U-2s were the biggest provider of
aerial photography for the U. S. Forest Service, covering
the national forests, and helping to track the Gypsy Moth
infestations in the Appalachians. This resulted in literally
miles of 9” and 5” color film. Gary Shelton had joined
the project and was actively marketing the program,
resulting in the loan of a third ER-2 (NASA 708) from
the Air Force to accommodate all the flight requests.
Besides supporting several classified instrument
development projects, the ER-2s also flew the National
Wetlands Inventory for USGS and the EPA, another big
program that included TMS digital data.
In 1982 the C-130B arrived at Ames from Johnson
Space Center, together with some Zeiss cameras, a low-
altitude TM simulator (the NS-001,) and a new instrument
called TIMS that JPL and NASA SSC had acquired. TIMS
was a six-channel thermal IR imager, and Anne Kahle
at JPL was the PI. It was probably the first multispectral
thermal sensor that wasn’t classified. The Sensor
Facility was responsible for the data from these systems,
as well. The C-130 flew a lot of NASA earth science
missions for geologic mapping and forestry studies
and we processed all the data. One of the instruments
flown on the C-130 was the JPL Airborne Imaging
Spectrometer (AIS), the precursor to AVIRIS. Because
we were set up to decommutate the big 1” 14-track PCM
data tapes that recorded its data, we performed some of
the data reduction for that, as well.

A I R B O R N E S C I E N C E P R O G R A M 2 0 1 4 A N N U A L R E P O R T | 6 6
These were busy years, with two deployments a year
to Wallops alone, just to cover east coast requirements.
Gary Shelton was very instrumental in keeping the ER-2s
booked-up, as he seemed to know everybody in the
government aerial business.
In 1989, when I became manager, the Airborne Sensor
Facility produced more and more digital imagery and
less film. Simultaneously, NASA was developing the
Earth Observing System (EOS). Michael King and Jim
Spinhirne at Goddard were interested in having an
airborne MODIS instrument on the ER-2. Led by John
Arvesen, with Michael as the science PI, and working
with Daedalus, they developed a conversion of the
TMS into the MODIS Airborne Simulator (MAS.) Mainly
supporting the MODIS science team at Goddard, the
MAS would go on to participate in over 30 major science
field campaigns, from 1991 to the present, in locations
ranging from Brazil to Alaska, and Australia to South
Africa. It would become the mainstay of the facility
sensor systems operated by the ASF. The MASTER
instrument (the MODIS/ASTER Airborne Simulator)
was subsequently developed with Daedalus, along the
same design, to serve the ASTER science community.
It started operations in 1998, flying on both the ER-2
and a variety of lower-altitude NASA aircraft. Over the
years, the multi-spectral IR and VSWIR data from these
two instruments has been heavily utilized by various
research disciplines in the NASA Earth Science Division.
When the science aircraft relocated to Dryden (now
Armstrong) in late 1997, the ASF transferred several
technicians and engineers there to support daily
flight operations for the facility instruments. The main
engineering and data processing functions remained
at Ames. Besides the instrument operations, the ASF
was increasingly tasked with other engineering support
for the Airborne Science Program, largely because
of their group of highly experienced engineers. This
included the development of a standardized Experiment
Interface Panel, to ease the integration of instruments
across multiple platforms, and the development of a new
navigation data recorder and network server to be called
the NASDAT.
In 2005 the ASF was tasked with building up a science
sensor for the new Altair/Predator-B UAS at Dryden.
This led to the conversion of the old TMS into the
Autonomous Modular Sensor system (AMS) that later
flew on the Ikhana UAS. Leveraging lessons-learned
from the earlier STARLink TDRSS system on the ER-2,
it incorporated onboard data processing and real-time
data networking that was particularly useful for forest
fire mapping. The AMS was the core sensor for the
highly successful Western States Fire Missions, before
its eventual transfer to the U.S. Forest Service for their
operational use.
The real-time data systems design work for the AMS
project would become the basis for the payload systems
later developed by the ASF for the larger Global Hawk
UAS. This required networking multiple sensors with
instrument teams on the ground, as well as providing
command and control mechanisms, to maximize the
science return from these very expensive and complex
missions. The real-time sensor networking concepts
developed for the Global Hawk in turn led to extending
the capability to the other principle science aircraft in
the ASP fleet, including the DC-8, P-3B, and ER-2, as
sat-com systems became available on those platforms.
The software for these extended sensor networks was
jointly developed with UND-NSERC and other Ames
engineers, including Don Sullivan at Ames. The end
result has been to greatly enhance the effectiveness of

A I R B O R N E S C I E N C E P R O G R A M 2 0 1 4 A N N U A L R E P O R T | 6 7
the science platforms, especially during large multiple
aircraft campaigns. Putting real-time science data and
situational awareness into the hands of the investigators
has now become a de facto requirement for many of the
PIs.
Over the years, the ASF, together with their partners
at UND-NSERC, has become a valuable engineering
resource to the instrument community, partly because
the staff has accumulated decades of practical
experience in the design and operations of airborne
science instrumentation.
Jeff concluded the interview with these remarks: “There
is a core of dedicated people in the program that really
just love what they’re doing. I couldn’t imagine a better
job for myself. I could not have invented this job if I had
thought of it years ago. The satisfaction in the end is
when you see some of the really important science that
is made possible by the program and all of its great
people, some of which we’re seeing here today at the
AGU Conference, and that makes it all seem incredibly
worthwhile.”

A I R B O R N E S C I E N C E P R O G R A M 2 0 1 4 A N N U A L R E P O R T | 6 8A I R B O R N E S C I E N C E P R O G R A M 2 0 1 3 A N N U A L R E P O R T | 6 8
Appendix B: Five-Year Plan

A I R B O R N E S C I E N C E P R O G R A M 2 0 1 4 A N N U A L R E P O R T | 6 9

A I R B O R N E S C I E N C E P R O G R A M 2 0 1 4 A N N U A L R E P O R T | 7 0

A I R B O R N E S C I E N C E P R O G R A M 2 0 1 4 A N N U A L R E P O R T | 7 1

A I R B O R N E S C I E N C E P R O G R A M 2 0 1 4 A N N U A L R E P O R T | 7 2
Appendix C: Acronyms
4STAR Spectrometers for Sky-Scanning, Sun-Tracking Atmospheric Research
A
ACES ASCENDSCarbonHawkExperimentSimulator
ACOCO AtmosphericCorrectionOverCoastalOceans
AFRC ArmstrongFlightResearchCenter
AERONET AerosolRoboticNetwork
AirMOSS AirborneMicrowaveObservatoryofSubcanopyandSubsurface
AMIGACarb AMericanIcesatGlasAssessmentofCarbon
AMPR AirborneMicrowaveRadiometer
AMS Autonomous Modular Sensor
ANG Air National Guard
ARC AmesResearchCenter
ARRISE Arctic Radiation-IceBridge Sea and Ice Experiment
ASCENDS ActiveSensingofCO2EmissionsoverNights,Days,andSeasons
ASP Airborne Science Program
ASPRS Aviation Safety Reporting System
ASTER AdvancedSpaceborneThermalEmissionandReflectionRadiometer
ATM Airborne Topographic Mapper
ATTREX The Airborne Tropical TRopopause EXperiment
AVAPS AdvancedVerticalAtmosphericProfilingSystem
AVIRIS Airborne Visible/Infrared Imaging Spectrometer
AVOCET AtmosphericVerticalObservationofCO2intheEarth’sTroposphere
BBGAN BroadbandGlobalAreaNetwork

A I R B O R N E S C I E N C E P R O G R A M 2 0 1 4 A N N U A L R E P O R T | 7 3
CCALIPSO Cloud-AerosolLidarandInfraredPathfinderSatelliteObservations
CAMEX ConvectionAndMoistureEXperiment
CARVE TheCarboninArcticReservoirsVulnerabilityExperiment
CAST CoordinatedAirborneStudiesintheTropics
CATS CloudAerosolTransportSystem
CCD Charge-coupleddevice
CERES CloudsandtheEarth’sRadiantEnergySystem
CH4 methane
CO Carbonmonoxide
CO2 Carbondioxide
COA CertificateofAuthorization
CONUS ContinentalUnitedStates
CONTRAST ConvectiveTransportofActiveSpeciesintheTropics
CoSMIR ConicalScanningMillimeter-waveImagingRadiometer
CPDLC Controller-PilotDataLinkCommmunications
CPL CloudPhysicsLidar
CRS CloudRadarSystem
DDAOF DrydenAircraftOperationsFacility
DCS DigitalCameraSystem
DFRC DrydenFlightResearchCenter
DISCOVER-AQ Deriving Information on Surface conditions from Column and Vertically Resolved
Observations Relevant to Air Quality
DMS DigitalMappingSystem
DOE DepartmentofEnergy(U.S.)
DyNAMITE Day/NightAirborneMotionImageryforTerrestrialEnvironments

A I R B O R N E S C I E N C E P R O G R A M 2 0 1 3 A N N U A L R E P O R T | 7 4
EeMAS EnhancedMODISAirborneSimulator
EOS EarthObservingSystem
EPA Environmental Protection Agency
ERAST Environmental Research and Sensor Technology
ESD EarthScienceDivision
ESFL ElectronicallySteerableFlashLidar
ESSP EarthSystemSciencePathfinder
ESTO EarthScienceTechnologyOffice
EV,EV-1,EVS-2 EarthVenture,EarthVenture-1,EarthVentureSuborbital-2
EXRAD ER-2X-bandRadar
FFAA FederalAviationAdministration
FRAPPE FrontRangeAirPollutionandPhotochemistryExperiment
FTS FourierTransformationSpectrometer
GGEO-CAPE GEOstationaryCoastalandAirPollutionEvents
GeoTASO Geostationary Trace gas and Aerosol Sensor Optimization
GEMS Geostationary Environment Monitoring Spectrometer
GH GlobalHawk
GISS Goddard Institute for Space Studies
G-LiHT Goddard’sLidar,HyperspectralandThermalImager
GPS Global Positioning System
GRC GlennResearchCenter
GSFC GoddardSpaceFlightCenter

A I R B O R N E S C I E N C E P R O G R A M 2 0 1 3 A N N U A L R E P O R T | 7 5
HH2O water
HDSS HighDefinitionSoundingSystem
HDVIS HighDefinitionTime-lapseVideoSystem
HiWRAP High-AltitudeImagingWindandRainAirborneProfiler
HQ Headquarters
HS3 HurricaneandSevereStormSentinel
HSRL HighSpectralResolutionLidar
HyspIRI HyperspectralInfraredImager
HyTES HyperspectralThermalEmissionSpectrometer
IICCAGRA InteragencyCoordinatingCommitteeforAirborneGeoscienceResearchand
Applications
ICESat Ice,Cloud,andlandElevationSatellite
IGARSS International Geoscience and Remote Sensing Symposium
IIP Instrument Incubator Program
IPDA integrated path differential absorption
IPHEX IntegratedPrecipitationandHydrologyExperiment
IRIS Interface Region Imaging Spectrograph
IWGADTS InteragencyWorkingGroupforAirborneDataandTelecommunication
Systems
JJPL JetPropulsionLaboratory
JSC NASAJohnsonSpaceCenter
LLaRC LangleyResearchCenter
LiDAR LighDetectionandRanging
LP-DAAC LandVegetationandIceSensor

A I R B O R N E S C I E N C E P R O G R A M 2 0 1 4 A N N U A L R E P O R T | 7 6
LUMP LowUtilizationMaintenancePlan
MMABEL MultipleAltimeterBeamExperimentalLidar
MAS MODISAirborneSimulator
MASTER MODIS/ASTERAirborneSimulator
MFFL Multi-FunctionalFiberLaser
MIZOPEX TheMarginalIceZoneOceanandIceObservationsandProcesses
Experiment
MODIS Moderate Resolution Imaging Spectroradiometer
MPCS MasterPowerControlSystem
MSFC MarshallSpaceFlightCenter
MTS; MTS-E Mission Tools Suite; Mission Tools Suite for Education
MX Maintenance
NNAMMA NASA African Monsoon Multidisciplinary Analyses
NASDAT NASAAirborneScienceDataandTelemetry
NAVAIR NavalAirSystemsCommand
NCAR NationalCenterforAtmosphericResearch
NEE net ecosystem carbon exchange
NISAR NASA-ISROSAR
NOAA NationalOceanographicandAtmosphericAdministration
NSF NationalScienceFoundation
NSERC NationalSuborbitalEducationandResearchCenter
OOCO-2 OrbitingCarbonObservatory-2
OIB OperationIceBridge

A I R B O R N E S C I E N C E P R O G R A M 2 0 1 4 A N N U A L R E P O R T | 7 7
PPARCA ProgramforArcticRegionalClimateAssessment
PFP ProgrammableFlaskPackages
PI Principal Investigator
PNNL PacificNorthwestNationalLaboratory
POS PositionandOrientationSystems
PRISM Portable Remote Imaging Spectrometer
RRADEX-14 Radiation Experiment-14
RSP Research Scanning Polarimeter
RZSM Root Zone Soil Moisture
SSABOR Ship-AircraftBio-OpticalResearch
SAL SaharanAirLayer
SAR synthetic aperture radar
SARP Student Airborne Research Program
SCAR-B Smoke/Sulfates,CloudsandRadiation-Brazil
SEAC4RS StudiesofEmissionsandAtmosphericComposition,CloudsandClimate
CouplingbyRegionalSurveys
SEO sensor equipment operator
S-HIS ScanningHigh-resolutionInterferometerSounder
SIERRA Sensor Integrated Environmental Remote Research Aircraft
SLAP ScanningL-bandActivePassive
SMAP Soil Moisture Active Passive
SMD ScienceMissionDirectorate
SO2 Sulfur dioxide
SOFRS ScienceOperationsFlightRequestSystem

A I R B O R N E S C I E N C E P R O G R A M 2 0 1 4 A N N U A L R E P O R T | 7 8
TTAWS TerrainAwarenessWarningSystem
TIR Thermal Infrared Radiometer
TRMM Tropical Rainfall Measuring Mission
TTL TropicalTropopauseLayer
UUAS UnmannedAircraftSystems
UAV UnmannedAerialVehicles
UAVSAR UninhabitedAerialVehicleSyntheticApertureRadar
UND UniversityofNorthDakota
USAF U.S.AirForce
USC UniversityofSouthernCalifornia
USFS U.S.ForestService
WWFF WallopsFlightFacility
XXSCAV eXperimentalSensor-ControlledAerialVehicle

