nancy creek watershed improvement plan...city of brookhaven nancy creek watershed improvement plan...
TRANSCRIPT
Nancy Creek Watershed Improvement Plan
SUMMER 2016
Prepared for the City of Brookhaven, Georgia
City of Brookhaven Nancy Creek Watershed Improvement Plan
August 2016 Page 2
TABLE OF CONTENTS
List of Tables .................................................................................................................................................................. 4
List of Figures ................................................................................................................................................................ 5
Acknowledgements ........................................................................................................................................................ 7
Executive Summary ....................................................................................................................................................... 8
Chapter 1: Background ................................................................................................................................................ 12
1.1. Objectives ......................................................................................................................................................... 12
1.2. Watershed Description ..................................................................................................................................... 12
1.2.1. Subwatersheds .......................................................................................................................................... 13
1.3. Land Use .......................................................................................................................................................... 17
1.4. Water Quality Concerns .................................................................................................................................... 19
1.4.1. State 303(d) List of Impaired Waters ......................................................................................................... 19
1.4.2. Total Maximum Daily Loads ...................................................................................................................... 20
1.4.3. Other Watershed Concerns ....................................................................................................................... 20
1.4.4. Murphey Candler Lake .............................................................................................................................. 23
1.5. Regulatory Framework ..................................................................................................................................... 24
1.5.1. Municipal Separate Storm Sewer System (MS4) Permit ........................................................................... 24
1.5.2. Metropolitan North Georgia Water Planning District (MNGWPD) .............................................................. 24
1.5.3. DeKalb County Watershed Protection Plan ............................................................................................... 25
1.5.4. Georgia Rules for Dam Safety................................................................................................................... 25
1.6. Watershed Improvement Plan Development Process ...................................................................................... 26
1.7. Watershed Improvement Plan Overview .......................................................................................................... 26
Chapter 2: Watershed Investigation and Analysis ........................................................................................................ 27
2.1. Assessment of Available Water Quality Data ................................................................................................... 27
2.2. Watershed Modeling of Baseline Conditions .................................................................................................... 31
2.2.1 Model Inputs ............................................................................................................................................... 33
2.2.2. Model Calibration and Results ................................................................................................................... 33
2.3. Stream Walk Methodology and Results ............................................................................................................ 36
2.3.1. Stream Walk Methodology ........................................................................................................................ 36
2.3.2. Results ...................................................................................................................................................... 38
2.4. Murphey Candler Lake Sampling ..................................................................................................................... 40
2.4.1. Murphey Candler Lake Water Chemistry Sampling Results ...................................................................... 40

City of Brookhaven Nancy Creek Watershed Improvement Plan
August 2016 Page 3
2.4.2. Murphey Candler Lake Water and Sediment Depth Measurements ......................................................... 42
2.4.3. Murphey Candler Lake Shoreline Conditions ............................................................................................ 44
2.4.4. Overall Lake Health for Murphey Candler Lake ........................................................................................ 47
2.5. Limited Upland Conditions Assessment ........................................................................................................... 48
2.6. Summary of Findings ........................................................................................................................................ 50
Chapter 3. Watershed Improvement Projects and Programs ....................................................................................... 51
3.1. Watershed Improvement Goals ........................................................................................................................ 51
3.2 Process to Identify Projects ............................................................................................................................... 52
3.3. Recommended Watershed Improvement Projects ........................................................................................... 53
3.3.1. Stream Enhancement Projects .................................................................................................................. 53
3.3.2. BMP and BMP Retrofit Projects ................................................................................................................ 56
3.3.3. Murphey Candler Lake Recommended Projects ....................................................................................... 61
3.4. Future Conditions Model Results ...................................................................................................................... 66
3.4.1. Future Conditions Model Results .............................................................................................................. 66
3.5. Impervious Retrofit Assessment Areas ............................................................................................................. 67
3.6 Existing Watershed Programs and Recommendations ..................................................................................... 71
3.6.1. Enforcement of Existing Ordinances ......................................................................................................... 71
3.6.2. Public Education and Outreach and Public Involvement ........................................................................... 72
3.6.3. Infrastructure Inventory and Condition Assessment .................................................................................. 73
3.6.4. Inspection of Stormwater Management Facilities ...................................................................................... 73
3.6.5. City Maintenance Activities........................................................................................................................ 74
3.6.6. Regional Watershed Coordination ............................................................................................................. 74
3.6.7. Implementation Tracking ........................................................................................................................... 74
Chapter 4: Implementation Plan ................................................................................................................................... 75
4.1. Implementation Costs ....................................................................................................................................... 75
4.1.2. Recommended Project Cost Estimation Methodology and Assumptions .................................................. 75
4.1.2. Planning Level Costs for the Recommended Projects .............................................................................. 77
4.1.3. Recommended Retrofit Assessment Cost Estimation Methodology and Assumptions ............................. 78
4.2. Grant Funding and Financing ........................................................................................................................... 79
4.2.1. Grant Funding ........................................................................................................................................... 79
4.2.2. Funding and Financing Options................................................................................................................. 81
4.3. Project Ranking Methodology ........................................................................................................................... 83
4.4 Initial Project Ranking ........................................................................................................................................ 84
City of Brookhaven Nancy Creek Watershed Improvement Plan
August 2016 Page 4
4.5. Implementation Plan ......................................................................................................................................... 87
4.6. Short-Term Work Plan ...................................................................................................................................... 89
4.7. Measuring Progress Toward Goals .................................................................................................................. 90
Appendix A: Murphey Candler State of the Lake Report 2015 ....................................................................................
Appendix B: Project Sheets .........................................................................................................................................
Appendix C: Subwatershed Summaries ......................................................................................................................
Appendix D: Standard Operating Procedures ..............................................................................................................
Definitions .................................................................................................................................................................... 91
References ................................................................................................................................................................... 93
LIST OF TABLES
Table 1-1. Drainage Areas within the Study Area Subwatersheds ................................................................................................ 13
Table 2-1. Summary of DeKalb County Long-Term Water Quality Monitoring Results in the Study Area ..................................... 29
Table 2-2. WTM Baseline Conditions Model Inputs ....................................................................................................................... 33
Table 2-3. Reference Pollutant Loading Rates for TN, TP, and TSS ............................................................................................ 34
Table 2-4. Total Annual Loads within the Nancy Creek Watershed .............................................................................................. 36
Table 2-5. Habitat Assessment Condition Categories ................................................................................................................... 38
Table 2-6. Murphey Candler Lake Water Chemistry Sample Results ............................................................................................ 40
Table 2-7. Shoreline Rating Component Scores ............................................................................................................................ 44
Table 2-8. Shoreline Condition Scores and Ranking by Reach ..................................................................................................... 45
Table 3-1. Recommended Stream Enhancement Projects ............................................................................................................. 54
Table 3-2 Example BMP and BMP Retrofit Projects ....................................................................................................................... 56
Table 3-3. Recommended BMP and BMP Retrofit Projects ........................................................................................................... 58
Table 3-4 Example BMP and BMP Retrofit Projects ....................................................................................................................... 61
Table 3-5. Recommended BMP and BMP Retrofit Projects ........................................................................................................... 61
Table 3-6. Future Conditions Model Pollutant Removal Reductions by Subwatershed ................................................................. 66
Table 3-7. Recommended Impervious Area Retrofit Assessments ................................................................................................ 68
Table 4-1. Unit Costs for Capital Construction of New and Retrofit BMPs by Land Use and Soil Type ......................................... 76
Table 4-2. Unit Costs for Capital Construction of Stream-Related Projects ................................................................................... 76
City of Brookhaven Nancy Creek Watershed Improvement Plan
August 2016 Page 5
Table 4-3. Basis for Planning Level Operation and Maintenance Costs by Project Type ............................................................... 77
Table 4-4. Summary of Total Fixed Cost by Project Type .............................................................................................................. 78
Table 4-5. Summary of Impervious Area Retrofit Assessment Costs by Subwatershed ................................................................ 79
Table 4-6. Grant Funding Sources and Potential Project Eligibility ................................................................................................ 80
Table 4-7. May 2016 GEFA Loan Program Interest Rates ............................................................................................................. 82
Table 4-8. Ranking Criteria for Watershed Improvement Projects ................................................................................................. 83
Table 4-9. Initial Project Ranking Based on Ranking Criteria ......................................................................................................... 85
Table 4-10. Implementation Plan .................................................................................................................................................... 88
Table 4-11. Example Short-term Work Plan ................................................................................................................................... 89
LIST OF FIGURES
Figure ES-1: Nancy Creek Watershed and Study Area .................................................................................................................... 9
Figure ES-2: Recommended Projects and Studies ........................................................................................................................ 11
Figure 1-1. Nancy Creek Watershed .............................................................................................................................................. 14
Figure 1-2. Study Area .................................................................................................................................................................... 15
Figure 1-3. Study Area Subwatersheds .......................................................................................................................................... 16
Figure 1-5. Distribution of Land Use for the Study Area ................................................................................................................. 17
Figure 1-4. Land Use for the Study Area ........................................................................................................................................ 18
Figure 1-6. Study Area Land Use and Impervious Area by Subwatershed .................................................................................... 19
Figure 1-7. Study Area Land Use and Impervious Area by Subwatershed within Brookhaven ...................................................... 19
Figure 1-8. Streams Classified as Impaired by State ...................................................................................................................... 21
Figure 1-9. Drainage Complaints Received by the City of Brookhaven (2014 to June 2015)......................................................... 22
Figure 1-10. Murphey Candler Lake Historical Timeline ................................................................................................................. 23
Figure 1-11. Cross Sectional Rendering of the Lowering of the Water Level at Murphey Candler Lake ........................................ 23
Figure 1-12. Watershed Improvement Plan Development Timeline ............................................................................................... 26
Figure 2-1. DeKalb County Long-Term Water Quality Monitoring Stations in the Study Area ........................................................ 28
Figure 2-2. Nancy Creek at Chamblee Dunwoody Road Fecal Coliform Bacteria Data (Station A) ............................................... 30
Figure 2-3. Nancy Creek at Chamblee Dunwoody Fecal Coliform Bacteria (Station B) ................................................................. 30
City of Brookhaven Nancy Creek Watershed Improvement Plan
August 2016 Page 6
Figure 2-4. Bubbling Creek at Harts Mill Road Fecal Coliform Bacteria (Station I) ........................................................................ 31
Figure 2-5. Modeled Subwatershed Areas ..................................................................................................................................... 32
Figure 2-6 through 2-10. Existing Conditions Watershed Model Results for TN, TP, TSS, Fecal Coliform, and Runoff Volume ... 34
Figure 2-11. Habitat Assessment Streams ..................................................................................................................................... 37
Figure 2-13. Example of a Healthy Stream with Bedrock and Protected Stream Buffer ................................................................. 38
Figure 2-14. Example of a Stream with a Compromised Stream Buffer ......................................................................................... 38
Figure 2-15. Example of a Stream Buffer Overrun with Invasive Species ...................................................................................... 38
Figure 2-12. Stream Habitat Assessment Results .......................................................................................................................... 39
Figure 2-16. Water Chemistry Sampling and Lake Depth Locations in Murphey Candler Lake ..................................................... 41
Figure 2-17. Lake and Sediment Depth Results for Murphey Candler Lake .................................................................................. 43
Figure 2-18. Typical Shoreline Zones ............................................................................................................................................. 44
Figure 2-19. Lake Shoreline Ratings around Murphey Candler Lake ............................................................................................. 46
Figure 2-20. Four Level Trophic Scale and Murphey Candler Lake Score ..................................................................................... 47
Figure 2-22. Example of a Functional and Well-Maintained Stormwater Management Structure .................................................. 48
Figure 2-23. Example of a Non-Functional Stormwater Management Structure Needing Maintenance ........................................ 48
Figure 2-21. Known Stormwater Management Structures .............................................................................................................. 49
Figure 3-1. Comparison of a Vegetated Riparian Buffer (left) and an Impacted Riparian Buffer (right) ......................................... 52
Figure 3-2. Example of a Stream Restoration Project with Floodplain Reconnection .................................................................... 53
Figure 3-3. Example of a Buffer Restoration Project ...................................................................................................................... 53
Figure 3-4. Recommended Stream Enhancement Projects ........................................................................................................... 55
Figure 3-5. Recommended BMP and BMP Retrofit Projects .......................................................................................................... 60
Figure 3-6. Recommended Murphey Candler Lake Projects .......................................................................................................... 64
Figure 3-7. Example Murphey Candler Lake Shoreline Restoration Renderings of “the Beach” .................................................... 65
Figure 3-8. Example Murphey Candler Lake Shoreline Restoration Renderings of “the Pavillion” ................................................ 65
Figure 3-9. Future Conditions Model Pollutant Removal Reductions by Project Type ................................................................... 66
Figure 3-10. Recommended Impervious Retrofit Study Areas ....................................................................................................... 70
Figure 3-11. Stormwater Drainage Issue Contributing TSS to the Study Area ............................................................................... 73
Figure 4-1. Total Fixed Cost by Project Type ................................................................................................................................. 78
City of Brookhaven Nancy Creek Watershed Improvement Plan
August 2016 Page 7
ACKNOWLEDGEMENTS
The following stakeholders were instrumental and provided information and guidance throughout the development of the Nancy
Creek Watershed Plan. Their time and efforts on this project were greatly appreciated and yielded a stronger, more
implementable Plan. These stakeholders included:
Jim Bradford
Shane Boyer
John Duffy
Rudy Fernandez
Father Harhager
Jennifer Harper
Eric Hovdevsen
Ted Krug
Mary Storm
Karen Whitehead
Kay Evanovich (City staff)
Gary Schussler (City staff)
Additionally, we would like to thank the current and former Mayor and City Council members for the direction provided throughout
the process to ensure that the Watershed Improvement Plan met the interests and needs of the City.
Mayor John Arthur Ernst Jr.
Councilwoman Linley Jones, District 1
Councilman John Park, District 2
Councilman Bates Mattison, District 3
Councilman Joe Gebbia, District 4
Honorable Rebecca Chase Williams
Finally, we would like to thank the City staff who provided critical information and guidance throughout the development of this
Watershed Improvement Plan. The staff members included:
Bennett White
Gregory Anderson
Kay Evanovich
Brian Borden
Gary Schussler
Jerry Kinsey (former staff)
The consulting team included representatives from the following two firms.
Sustainable Water Planning and Engineering
Horsley Witten Group
City of Brookhaven Nancy Creek Watershed Improvement Plan
August 2016 Page 8
EXECUTIVE SUMMARY
Nancy Creek is a perennial stream that originates near the DeKalb County Scott Candler Water Treatment Plant and flows
southwest through six jurisdictions to its confluence with Peachtree Creek and then the Chattahoochee River in Atlanta. This
Watershed Improvement Plan (Plan) focuses on the upper Nancy Creek watershed which is delineated from the downstream
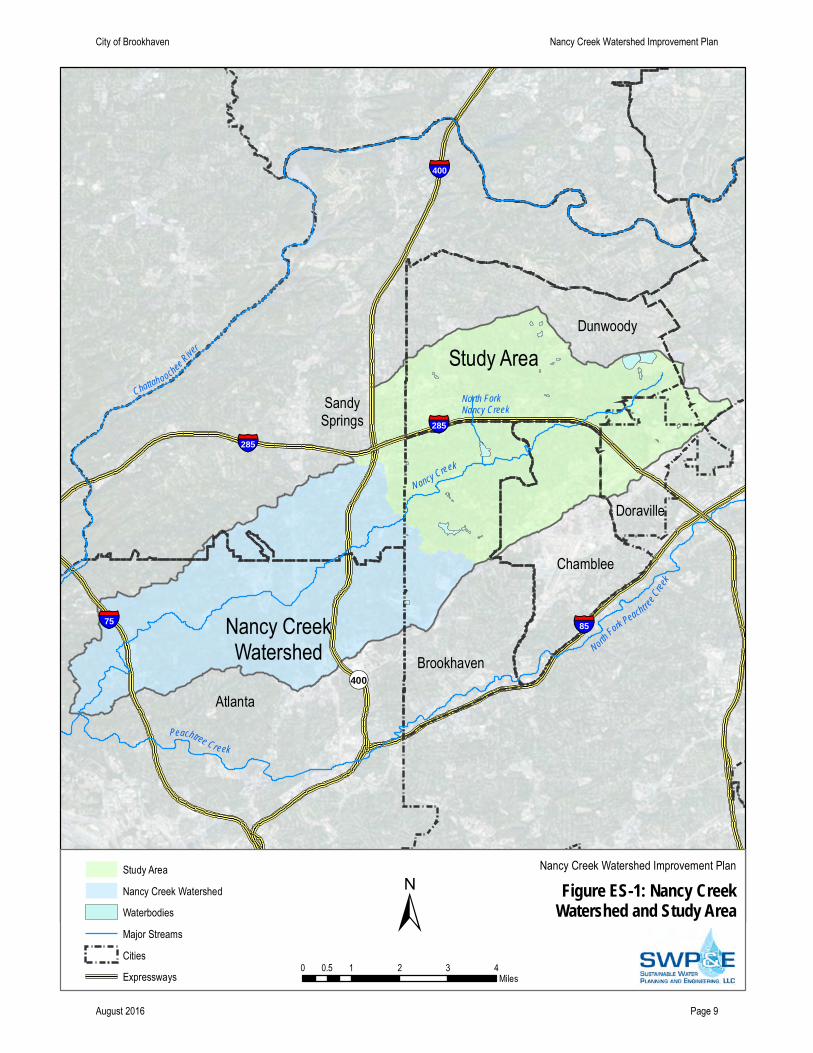
boundary of Brookhaven where Nancy Creek exits the City, as shown in Figure ES-1. The Study Area is approximately 19.3
square miles (12,300 acres) and includes drainage from Dunwoody, Doraville, Chamblee, and Brookhaven with a small area
draining into the watershed from Sandy Springs. Nancy Creek and Bubbling Creek, a tributary to Nancy Creek, are considered
“impaired” by the State of Georgia. Nancy Creek does not meet state standards for fecal coliform bacteria and fish biota (habitat
and total suspended solids concerns) and Bubbling Creek does not meet state standards for fecal coliform bacteria.
City leaders commissioned this Plan to evaluate watershed conditions in Nancy Creek on a regional scale with a special focus on
evaluating the health of Murphey Candler Lake, as it is the focal point of the City-owned Murphey Candler Park. Based on the
regional evaluation, the City wanted a prioritized list of projects within the city limits that when implemented would improve
watershed conditions. Another important driver for this Plan was increasing Brookhaven’s eligibility for grant funds; therefore, the
Plan is consistent with the US Environmental Protection Agency’s “Nine Elements of Watershed Planning” guidance. The City
also wanted to leverage this Plan to stay compliant with the Metropolitan North Georgia Water Planning District (MNGWPD)
2009 Watershed Management Plan requirements. Finally, the City leaders wanted to ensure that the Plan reflected the
community; therefore stakeholder and community input played an important role throughout the development process.
The recommendations in this Plan are designed to meet a set of four goals, established by a group of stakeholders and City
staff. These goals include to:
1. meet state water quality standards;
2. restore stream buffers to prevent the loss of soil/ stream buffer;
3. improve streams to “sub-optimal” habitat condition or better; and
4. support projects that promote wildlife diversity and aesthetics.
The dominant land use in the Nancy Creek Study Area is medium density residential (40 percent) but the sum of multi-family,
commercial, and roadway adds up to be nearly equal to the residential area (37 percent). The overall impervious cover across
the Study Area is 39 percent due to the presence of these higher intensity land uses. This level of impervious area is well above
the generally accepted threshold of when water quality starts to decline. Based on the in-stream habitat assessments, the overall
stream habitat conditions are considered “marginal” within the Brookhaven portion of the Study Area. The watershed is mostly
developed, and most of this development occurred prior to more recent stormwater requirements. Based on the results of the
field assessments of known stormwater facilities, few would meet current standards and many showed evidence of not being
properly maintained. Analysis of the water quality data and results from the stream habitat assessments confirm that water
quality is impacted in the Nancy Creek Study Area.
A watershed model of the Study Area divides the 19.3 square miles into eight different subwatersheds, shown in Figure ES-2.
The subwatershed boundaries are influenced by the existing DeKalb County Watershed Management Department water quality
sampling stations and the location of major tributaries that flow into Nancy Creek. Brookhaven has a significant land presence in
five of the subwatersheds including: North Fork Nancy Creek (NC4), Bubbling Creek (NC5), Perimeter Creek (NC6), Nancy
Creek Mainstem (NC7), and Silver Creek (NC8). The baseline conditions model indicates that the pollutant loads in the Study
Area are higher than those typically found in suburban watersheds throughout the Southeast.
Atlanta
SandySprings
Dunwoody
Brookhaven
Chamblee
Doraville
Study Area
§̈¦75
§̈¦285
¬«400
§̈¦285
§̈¦I-75 Ramp NW
§̈¦400
§̈¦85
N ancy Creek
Chattahoochee
River
Peachtree Creek
North Fork Peacht reeCree
k
Indian Creek
North Fork Nancy Creek
Source: Esri, DigitalGlobe, GeoEye, i-cubed, Earthstar Geographics,CNES/Airbus DS, USDA, USGS, AEX, Getmapping, Aerogrid, IGN, IGP,swisstopo, and the GIS User Community
Figure ES-1: Nancy CreekWatershed and Study Area
Nancy Creek Watershed Improvement Plan
±0 1 2 3 40.5
Miles
Study Area
Nancy Creek Watershed
Waterbodies
Major Streams
Cities
Expressways
Nancy CreekWatershed
City of Brookhaven Nancy Creek Watershed Improvement Plan
August 2016 Page 9
City of Brookhaven Nancy Creek Watershed Improvement Plan
August 2016 Page 10
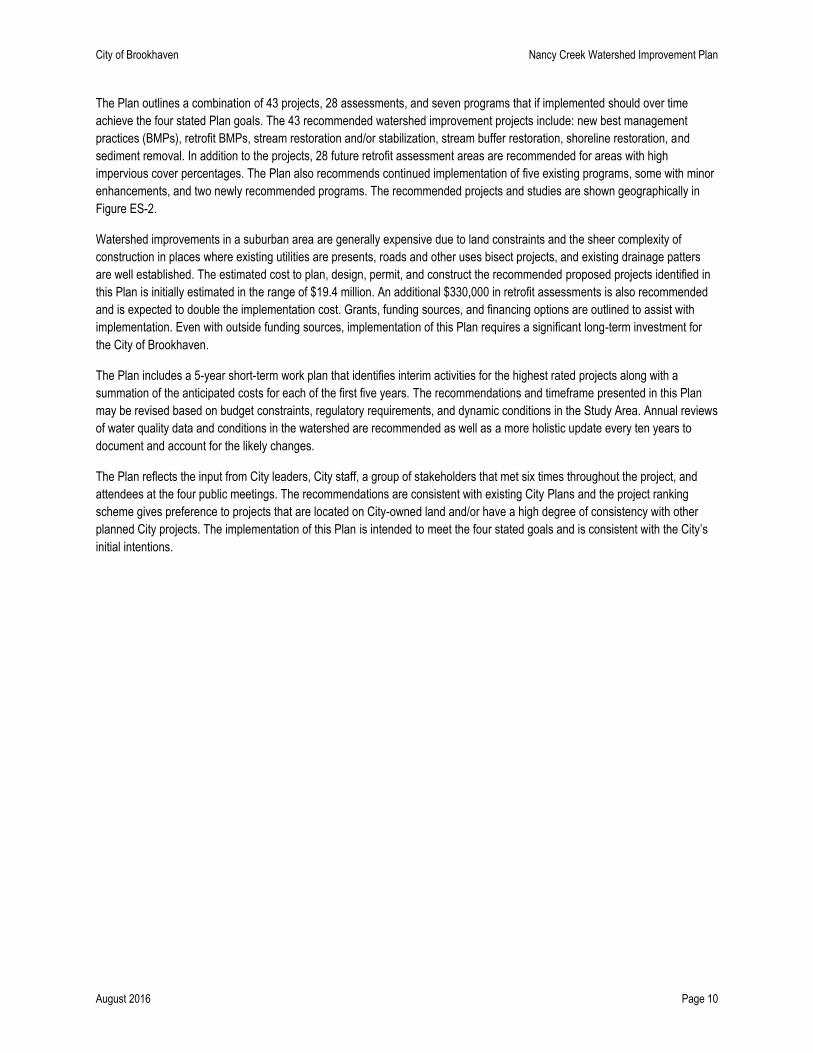
The Plan outlines a combination of 43 projects, 28 assessments, and seven programs that if implemented should over time
achieve the four stated Plan goals. The 43 recommended watershed improvement projects include: new best management
practices (BMPs), retrofit BMPs, stream restoration and/or stabilization, stream buffer restoration, shoreline restoration, and
sediment removal. In addition to the projects, 28 future retrofit assessment areas are recommended for areas with high
impervious cover percentages. The Plan also recommends continued implementation of five existing programs, some with minor
enhancements, and two newly recommended programs. The recommended projects and studies are shown geographically in
Figure ES-2.
Watershed improvements in a suburban area are generally expensive due to land constraints and the sheer complexity of
construction in places where existing utilities are presents, roads and other uses bisect projects, and existing drainage patters
are well established. The estimated cost to plan, design, permit, and construct the recommended proposed projects identified in
this Plan is initially estimated in the range of $19.4 million. An additional $330,000 in retrofit assessments is also recommended
and is expected to double the implementation cost. Grants, funding sources, and financing options are outlined to assist with
implementation. Even with outside funding sources, implementation of this Plan requires a significant long-term investment for
the City of Brookhaven.
The Plan includes a 5-year short-term work plan that identifies interim activities for the highest rated projects along with a
summation of the anticipated costs for each of the first five years. The recommendations and timeframe presented in this Plan
may be revised based on budget constraints, regulatory requirements, and dynamic conditions in the Study Area. Annual reviews
of water quality data and conditions in the watershed are recommended as well as a more holistic update every ten years to
document and account for the likely changes.
The Plan reflects the input from City leaders, City staff, a group of stakeholders that met six times throughout the project, and
attendees at the four public meetings. The recommendations are consistent with existing City Plans and the project ranking
scheme gives preference to projects that are located on City-owned land and/or have a high degree of consistency with other
planned City projects. The implementation of this Plan is intended to meet the four stated goals and is consistent with the City’s
initial intentions.
!(!( !(!(
!(
!(
!(
!(
!(
!(
!(
!(
!(
!(!(!(!(
!(
!(
!(
!(!(
!(
!(
!(
!(
Brookhaven
Perimeter Creek
Bubbling Creek
Dunwoody
Silver Creek
Chamblee
Nancy Creek
North Fork
Nancy Creek
Source: Esri, DigitalGlobe, GeoEye, i-cubed, Earthstar Geographics,CNES/Airbus DS, USDA, USGS, AEX, Getmapping, Aerogrid, IGN, IGP,swisstopo, and the GIS User Community
Figure ES-2: Recommended WatershedProjects and Studies
Nancy Creek Watershed Improvement Plan
±0 0.2 0.4 0.6 0.80.1
Miles
Recommended Stream Projects!( BMP Retrofit!( New BMP!( Trash Rack!( Sediment Removal
Retrofit Assessments
WaterbodyStreamsStudy AreaCities
City of Brookhaven Draft Nancy Creek Watershed Improvement Plan
May 2016 Page 11
City of Brookhaven Nancy Creek Watershed Improvement Plan
August 2016 Page 12
CHAPTER 1: BACKGROUND
This Chapter presents background information as a foundation for the technical information presented in subsequent Chapters of
the Nancy Creek Watershed Improvement Plan (Plan). Contents include plan objectives, known watershed concerns, and a
summary of relevant regulations. This section also includes an overview of the Plan development process including actions to
engage the public throughout the Plan development and an outline of the contents of the Chapters that comprise this Plan.
1.1. OBJECTIVES
The overall objective of the Plan is to examine the watershed health on a regional scale and identify projects to improve
watershed conditions within the City of Brookhaven limits. The City hopes that the Plan will foster dialogue and regional
cooperation that will result in improved water quality and habitat conditions throughout the Nancy Creek watershed. Regional
cooperation may yield benefits such as eligibility for regional grant funding, coordination on development activities within the
Study Area, and consistent application of watershed policies.
In addition to identifying actions to improve overall watershed health, the Plan includes a focused assessment of Murphey
Candler Lake, which is the focal point of Murphey Candler Park, a regional park known for the wide variety of recreational
opportunities. Sediment accumulation in Murphey Candler Lake is a concern to park stakeholders, who support dredging and
implementation of other projects to protect and improve water quality in the Lake.
The City values stakeholder and community input. The type of recommended projects and the project evaluation methodology
reflect this stakeholder and public input. City leaders appointed 12 stakeholders to provide input on the Plan’s recommendations
during six stakeholder meetings. Stakeholder input is augmented by input from the four public meetings. The selection of the
Plan’s four long-term goals is one of many important contributions provided by the stakeholders group. These goals are to:
1. meet state water quality standards
2. restore stream buffers to prevent the loss of soil/ stream buffer
3. improve streams to “sub-optimal” habitat condition or better; and
4. support projects that promote wildlife diversity and aesthetics.
Achieving these four goals is a complicated and expensive endeavor. The stakeholders want this Plan to reflect their future
vision and accept that the timeline to achieve some of these goals may be longer than anticipated and that some goals may not
be fully attainable. Based on the availability of funding, this Plan may take 50 years or more to implement. Implementation may
be expedited if outside funding is secured or as the result of upstream improvement projects in neighboring jurisdictions.
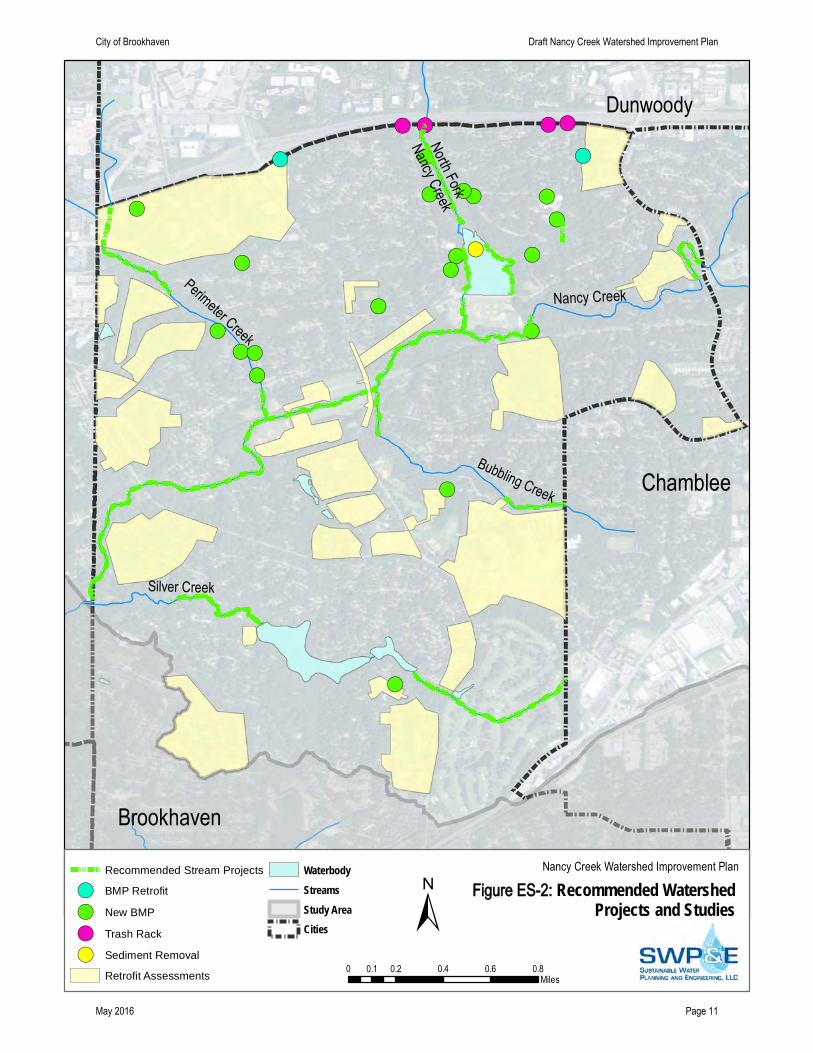
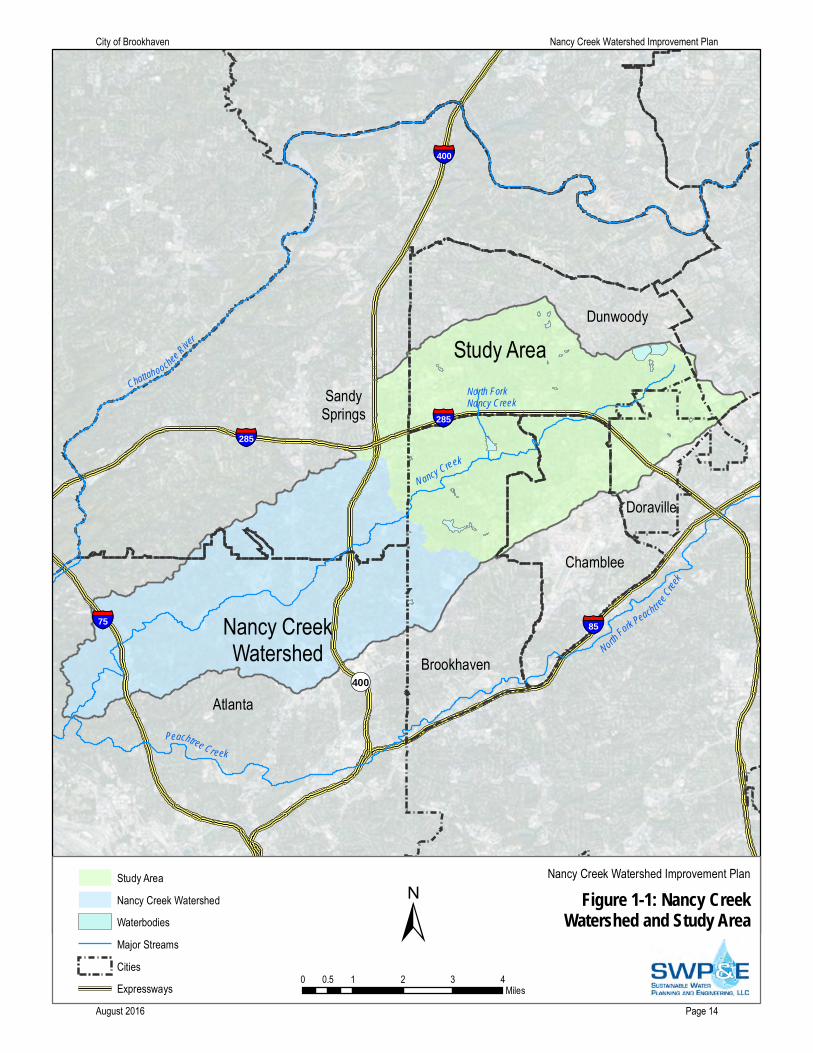
1.2. WATERSHED DESCRIPTION
The Nancy Creek Watershed originates near the DeKalb County Scott Candler Water Treatment Plant in the City of Dunwoody.
The upstream portion of the watershed includes portions of the cities of Dunwoody, Doraville, Chamblee, and Sandy Springs, as
well as Brookhaven. From Brookhaven, Nancy Creek continues to flow southwest through Sandy Springs and Atlanta before it
joins Peachtree Creek and then the Chattahoochee River. Water from the Nancy Creek Watershed eventually reaches the Gulf
of Mexico. The 12-digit Hydrologic Unit Code (HUC) for Nancy Creek is 031300011203. The HUC code is used by the US
Geologic Survey (USGS) and other federal agencies and describes the entire Nancy Creek watershed.
The focus of this Plan is the upper Nancy Creek watershed (Study Area) as bounded by the City of Brookhaven’s western
border, Figure 1-1. The Study Area encompasses approximately 19.3 square miles (12,300 acres) of land, of which
approximately 25 percent (3,023 acres) is within the City of Brookhaven with the remaining 75 percent within one of the adjacent
cities.

City of Brookhaven Nancy Creek Watershed Improvement Plan
August 2016 Page 13
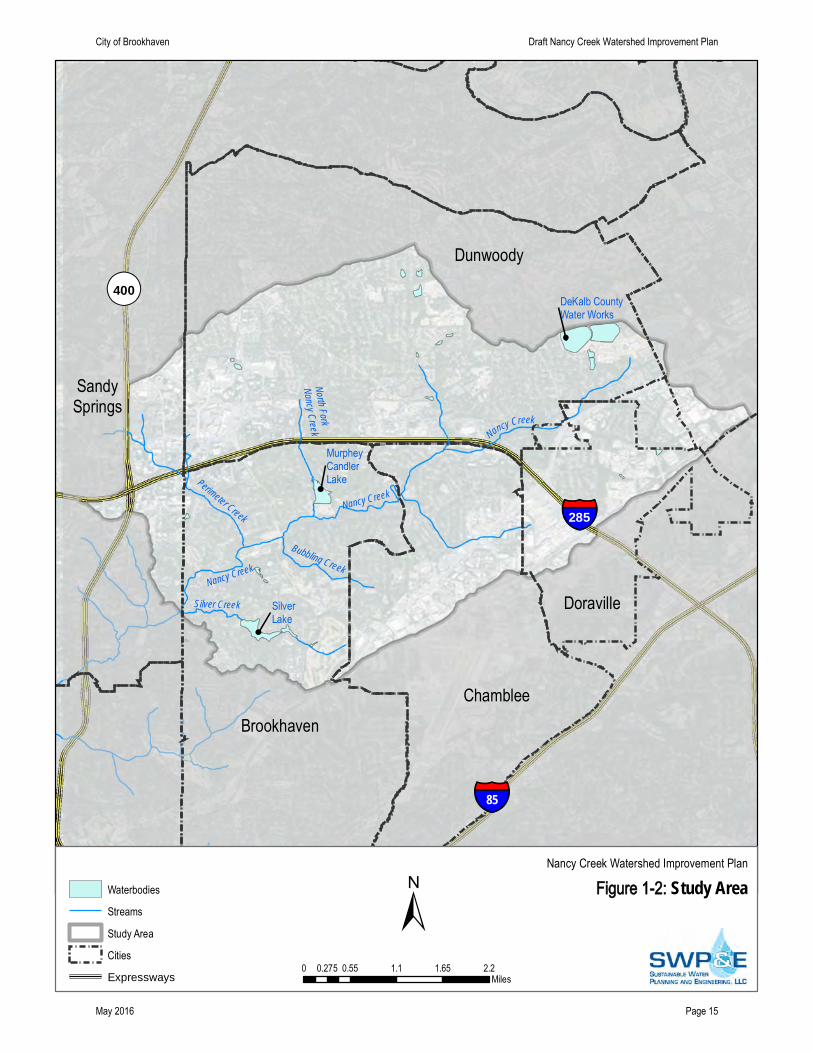
Figure 1-2 shows the major tributaries and streams within the Study Area. Named tributaries to Nancy Creek within the Study
Area include North Fork Nancy Creek, Bubbling Creek, Perimeter Creek, and Silver Creek. A summary of these streams are
outlined below:
North Fork Nancy Creek flows south from Dunwoody and is located to the east of the Perimeter Mall area. The dam
on North Fork Nancy Creek at West Nancy Creek Drive creates Murphey Candler Lake. The Lake is just upstream of
the confluence of North Fork Nancy Creek with the Nancy Creek mainstem.
Bubbling Creek originates in Chamblee and flows northwest to the confluence with Nancy Creek.
Perimeter Creek originates in Dunwoody to the west of Perimeter Mall and receives most of the drainage from the
Perimeter Mall area. A major tributary of Perimeter Creek flows southeast from Sandy Springs near Northside Hospital
and joins Perimeter Creek just inside Brookhaven. Perimeter Creek flows south and west to the confluence with Nancy
Creek.
Silver Creek is the name assigned to this unnamed tributary stream for the purposes of this report. This stream
includes Silver Lake and Little Silver Lake.
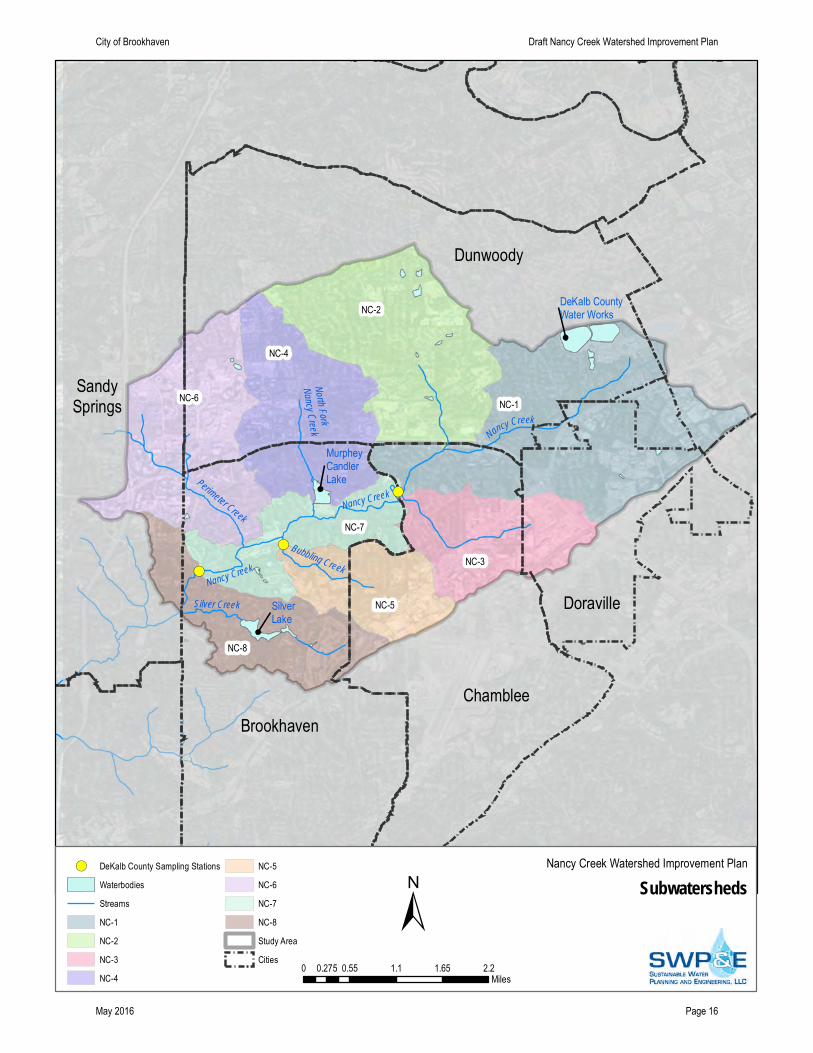
1.2.1. SUBWATERSHEDS
The Study Area is subdivided into 8 different subwatershed areas to analyze water quality. Figure 1-3 shows these
subwatershed areas and Table 1-1 shows the area by subwatershed both within and outside of the City. Most of the
subwatersheds cross jurisdictional boundaries.
The subwatershed delineations align with the three existing DeKalb County water quality sampling locations in order to correlate
model results with historical water quality data. Additional delineations are based on logical termination points where major
streams flow into Nancy Creek. The water quality modeling analysis (Chapter 2) uses these subwatershed delineations.
Table 1-1. Drainage Areas within the Study Area Subwatersheds
Subwatershed
Drainage Area (acres) Drainage Area (percent)
Within Brookhaven
Outside of Brookhaven Total
Within Brookhaven
Outside of Brookhaven
NC-1 0 2,940 2,940 0 100 %
NC-2 0 1,990 1,990 0 100 %
NC-3 3 1,110 1,113 0.2 % 99.8 %
NC-4 470 1,070 1,540 30.5 % 69.5 %
NC-5 280 560 840 33.4 % 66.6 %
NC-6 440 1,360 1,800 24.4 % 75.6 %
NC-7 890 10 900 98.8 % 1.2 %
NC-8 940 280 1,220 76.9 % 23.1 %
Total 3,023 9,320 12,343 24.5% 75.5%
Atlanta
SandySprings
Dunwoody
Brookhaven
Chamblee
Doraville
Study Area
§̈¦75
§̈¦285
¬«400
§̈¦285
§̈¦I-75 Ramp NW
§̈¦400
§̈¦85
N ancy Creek
Chattahoochee
River
Peachtree Creek
North Fork Peacht reeCree
k
Indian Creek
North Fork Nancy Creek
Source: Esri, DigitalGlobe, GeoEye, i-cubed, Earthstar Geographics,CNES/Airbus DS, USDA, USGS, AEX, Getmapping, Aerogrid, IGN, IGP,swisstopo, and the GIS User Community
Figure 1-1: Nancy CreekWatershed and Study Area
Nancy Creek Watershed Improvement Plan
±0 1 2 3 40.5
Miles
Study Area
Nancy Creek Watershed
Waterbodies
Major Streams
Cities
Expressways
Nancy CreekWatershed
City of Brookhaven Nancy Creek Watershed Improvement Plan
August 2016 Page 14
Nancy Creek
North ForkNancy Creek
Silver Creek
SandySprings
Dunwoody
BrookhavenChamblee
Doraville
¬«400
§̈¦285
§̈¦85
SilverLake
DeKalb CountyWater Works
MurpheyCandlerLake
Bubbling Creek
Perimeter Creek
Nancy Creek
Nancy Creek
Source: Esri, DigitalGlobe, GeoEye, i-cubed, Earthstar Geographics,CNES/Airbus DS, USDA, USGS, AEX, Getmapping, Aerogrid, IGN, IGP,swisstopo, and the GIS User Community Figure 1-2: Study Area
Nancy Creek Watershed Improvement Plan
±0 0.55 1.1 1.65 2.20.275
Miles
Waterbodies
Streams
Study Area
Cities
Expressways
City of Brookhaven Draft Nancy Creek Watershed Improvement Plan
May 2016 Page 15
!(
!(
!(
Nancy Creek
North ForkNancy Creek
Silver Creek
SandySprings
Dunwoody
BrookhavenChamblee
DoravilleSilverLake
DeKalb CountyWater Works
MurpheyCandlerLake
Bubbling Creek
Perimeter Creek
Nancy Creek
Nancy Creek
NC-1
NC-2
NC-6
NC-4
NC-8
NC-3
NC-7
NC-5
Source: Esri, DigitalGlobe, GeoEye, i-cubed, Earthstar Geographics,CNES/Airbus DS, USDA, USGS, AEX, Getmapping, Aerogrid, IGN, IGP,swisstopo, and the GIS User Community Subwatersheds
Nancy Creek Watershed Improvement Plan
±0 0.55 1.1 1.65 2.20.275
Miles
!( DeKalb County Sampling Stations
Waterbodies
Streams
NC-1
NC-2
NC-3
NC-4
NC-5
NC-6
NC-7
NC-8
Study Area
Cities
City of Brookhaven Draft Nancy Creek Watershed Improvement Plan
May 2016 Page 16
City of Brookhaven Nancy Creek Watershed Improvement Plan
August 2016 Page 17
1.3. LAND USE
Land use influences water quality. The cumulative amount of impervious cover is a strong indicator of watershed health.
Impervious areas include surfaces that do not allow rainfall to infiltrate, such as rooftops, driveways, and parking lots. Rainfall
runs off of these surfaces at much higher levels than off of pervious surfaces (i.e., grass, forest), resulting in a range of negative
impacts to streams, lakes and rivers, including increased flooding and pollution delivery, and decreased low stream flows.
Several studies evaluating the effects of urbanization on stream ecosystems indicate that water quality and habitat conditions
decline when impervious area is greater than 10 percent of the watershed, and severe degradation is expected when impervious
cover exceeds 25 percent of a watershediii.
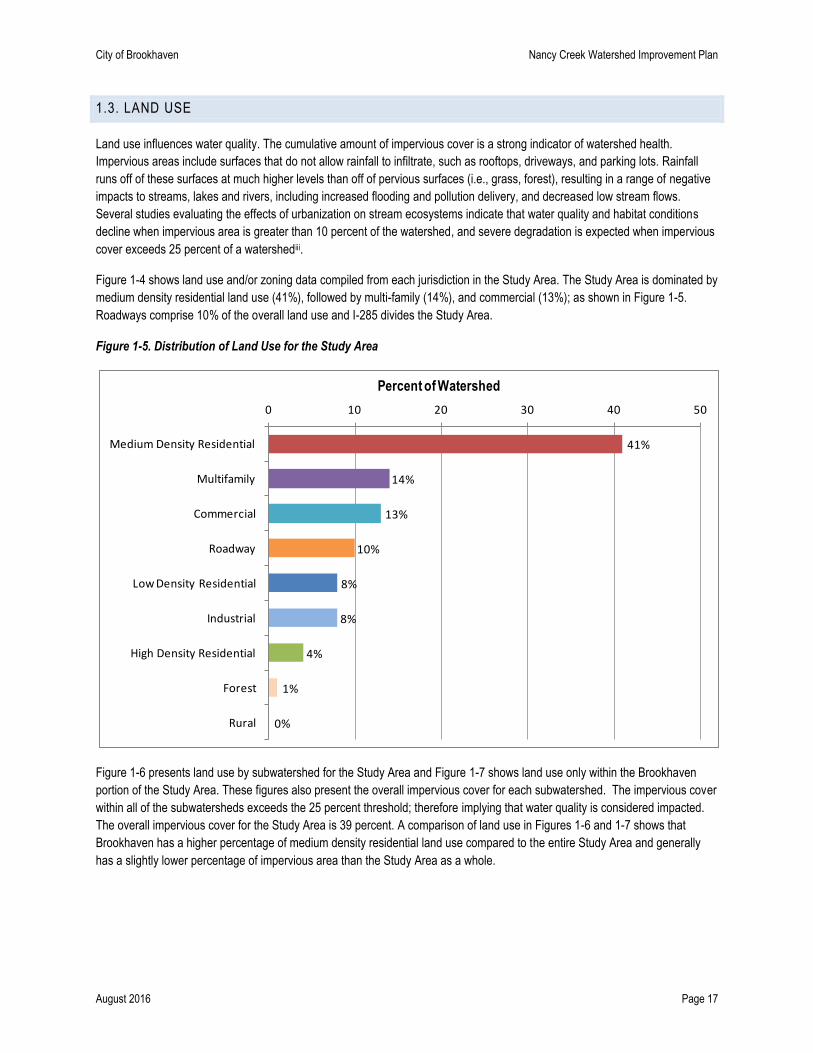
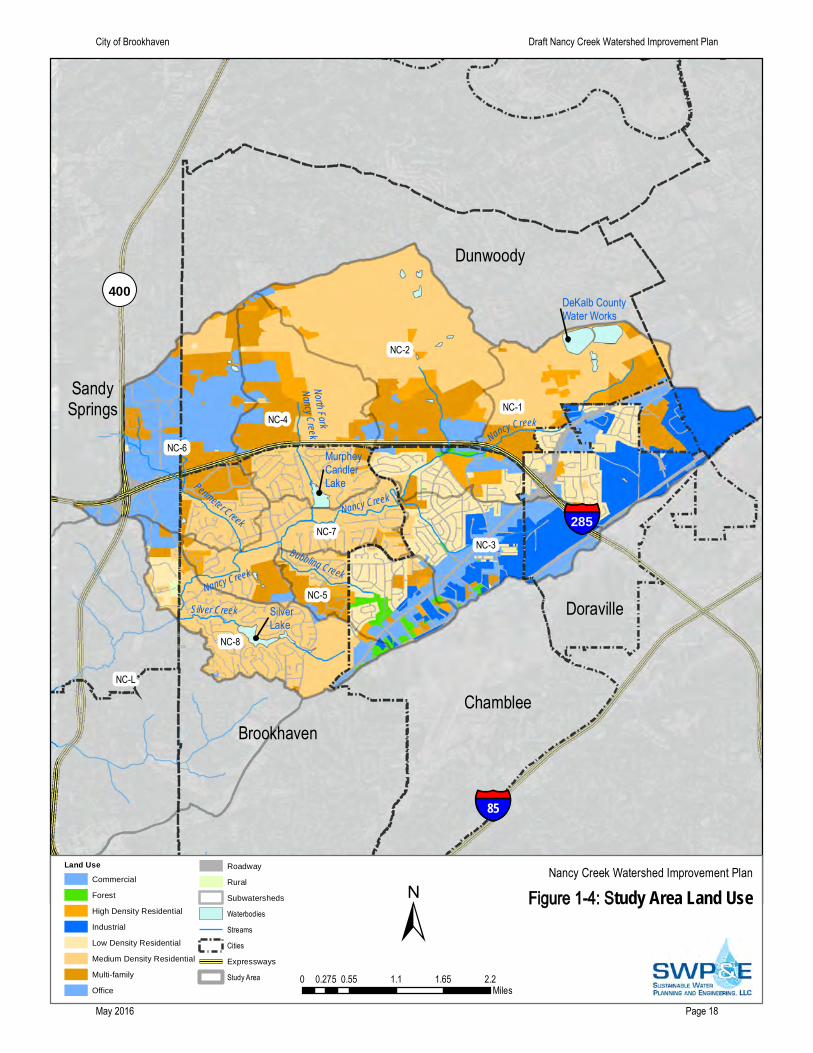
Figure 1-4 shows land use and/or zoning data compiled from each jurisdiction in the Study Area. The Study Area is dominated by
medium density residential land use (41%), followed by multi-family (14%), and commercial (13%); as shown in Figure 1-5.
Roadways comprise 10% of the overall land use and I-285 divides the Study Area.
Figure 1-5. Distribution of Land Use for the Study Area
Figure 1-6 presents land use by subwatershed for the Study Area and Figure 1-7 shows land use only within the Brookhaven
portion of the Study Area. These figures also present the overall impervious cover for each subwatershed. The impervious cover
within all of the subwatersheds exceeds the 25 percent threshold; therefore implying that water quality is considered impacted.
The overall impervious cover for the Study Area is 39 percent. A comparison of land use in Figures 1-6 and 1-7 shows that
Brookhaven has a higher percentage of medium density residential land use compared to the entire Study Area and generally
has a slightly lower percentage of impervious area than the Study Area as a whole.
41%
14%
13%
10%
8%
8%
4%
1%
0%
0 10 20 30 40 50
Medium Density Residential
Multifamily
Commercial
Roadway
Low Density Residential
Industrial
High Density Residential
Forest
Rural
Percent of Watershed
Nancy Creek
North ForkNancy Creek
Silver Creek
SandySprings
Dunwoody
BrookhavenChamblee
Doraville
¬«400
§̈¦285
§̈¦85
SilverLake
DeKalb CountyWater Works
MurpheyCandlerLake
Bubbling Creek
Perimeter Creek
Nancy Creek
Nancy Creek
NC-L
NC-1
NC-2
NC-6
NC-4
NC-8
NC-3NC-7
NC-5
Source: Esri, DigitalGlobe, GeoEye, i-cubed, Earthstar Geographics,CNES/Airbus DS, USDA, USGS, AEX, Getmapping, Aerogrid, IGN, IGP,swis Figure 1-4: Study Area Land Use
Nancy Creek Watershed Improvement Plan
±0 0.55 1.1 1.65 2.20.275
Miles
Land UseCommercialForestHigh Density ResidentialIndustrialLow Density ResidentialMedium Density ResidentialMulti-familyOffice
RoadwayRuralSubwatershedsWaterbodies
Streams
Cities
ExpresswaysStudy Area
City of Brookhaven Draft Nancy Creek Watershed Improvement Plan
May 2016 Page 18

City of Brookhaven Nancy Creek Watershed Improvement Plan
August 2016 Page 19
Figure 1-6. Study Area Land Use and Impervious Area by Subwatershed
Figure 1-7. Study Area Land Use and Impervious Area by Subwatershed within Brookhaven
1.4. WATER QUALITY CONCERNS
The City commissioned this Plan, in part, to better understand and to address several existing water quality concerns in Nancy
Creek and Murphey Candler Lake. One important driver of these concerns is the fact that Nancy Creek and Bubbling Creek are
classified as “impaired” by the State of Georgia. In addition, the community has identified Murphey Candler Lake as a key focal
point of the City’s Murphey Candler Park and is concerned about its overall health. This section provides an overview of these
water quality concerns as a basis for the analysis presented in the next two Chapters of this report.
1.4.1. STATE 303(D) LIST OF IMPAIRED WATERS
The state sets water quality standards for streams and for lakes with surface area greater than 1,000 acres. Two streams in the
Study Area, Nancy Creek and Bubbling Creek, were sampled by Georgia EPD and the DeKalb County Watershed Management
Department. These streams did not meet state water quality standards and therefore; are classified as “impaired” and identified
on the state’s 303(d) list.
Nancy Creek exceeds the standards for fecal coliform bacteria and for fish biota. Bubbling Creek exceeds the fecal coliform
bacteria standard. Fish biota impairment is often correlated to sedimentation that results from too much impervious cover and the
consequent loss of fish habitat. Sources of sedimentation include instream bank erosion, runoff from areas with insufficient
stormwater controls, and runoff from active construction sites. Fecal coliform bacteria are found in the large intestines of all
warm blooded animals, and typical sources include sanitary sewer overflows, pet waste, and wildlife waste.
39%28%
52%
35% 38%
63% 63%
41%
0%
20%
40%
60%
80%
100%
NC-1 NC-2 NC-3 NC-4 NC-5 NC-6 NC-7 NC-8
Roadway
Commercial
Industrial
Multifamily
HDR
MDR
LDR
Rural
Forest
Impervious Area
23%30%
38% 36% 31% 28%
0%
20%
40%
60%
80%
100%
NC-1 NC-2 NC-3 NC-4 NC-5 NC-6 NC-7 NC-8
Roadway
Commercial
Industrial
Multifamily
HDR
MDR
LDR
Rural
Forest
Impervious Area
City of Brookhaven Nancy Creek Watershed Improvement Plan
August 2016 Page 20
It is important to note that Nancy Creek and Bubbling Creek are the only two streams in the Study Area that are monitored by the
state. Other streams in the watershed have not been sampled by the state to determine if they are meeting state standards, and
therefore have not been classified. Consequently, given that the land uses are similar in the other parts of the watershed it is
logical to assume that these tributaries are similarly impaired. The lakes in Brookhaven are all much smaller than 1,000 acres,
thus there are no specific numerical state water quality standards and no historic sampling data is available.
1.4.2. TOTAL MAXIMUM DAILY LOADS
The federal Clean Water Act requires further study and investigation for streams that do not meet state standards. The results of
these investigations are known as a Total Maximum Daily Load (TMDL). The TMDL outlines likely sources of pollution as well as
the reductions that are needed from current loads in order to meet state standards. To meet state standards, Bubbling Creek
requires a 93% reduction in fecal coliform and Nancy Creek requires an 84% reduction in fecal coliform according to the TMDL
Implementation Planiii. The TMDL for fish biota indicates that a 35.45% reduction in sediment load is needed in Nancy Creek to
meet water quality standardsiv.
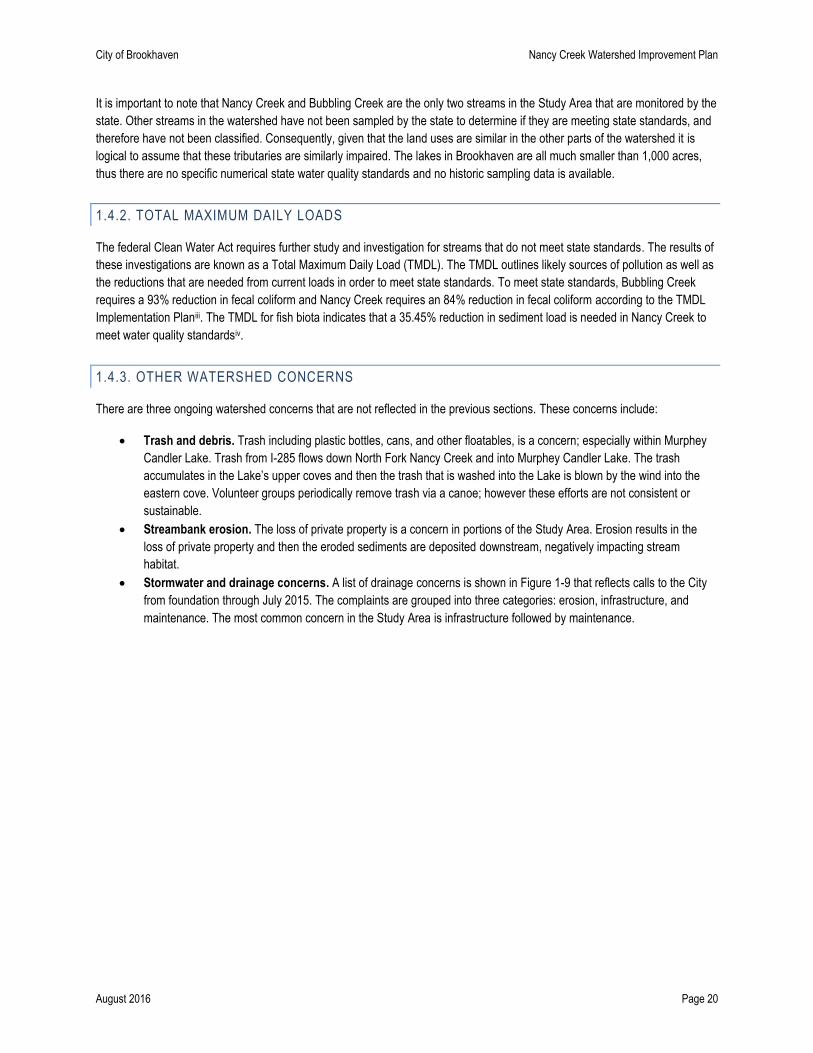
1.4.3. OTHER WATERSHED CONCERNS
There are three ongoing watershed concerns that are not reflected in the previous sections. These concerns include:
Trash and debris. Trash including plastic bottles, cans, and other floatables, is a concern; especially within Murphey
Candler Lake. Trash from I-285 flows down North Fork Nancy Creek and into Murphey Candler Lake. The trash
accumulates in the Lake’s upper coves and then the trash that is washed into the Lake is blown by the wind into the
eastern cove. Volunteer groups periodically remove trash via a canoe; however these efforts are not consistent or
sustainable.
Streambank erosion. The loss of private property is a concern in portions of the Study Area. Erosion results in the
loss of private property and then the eroded sediments are deposited downstream, negatively impacting stream
habitat.
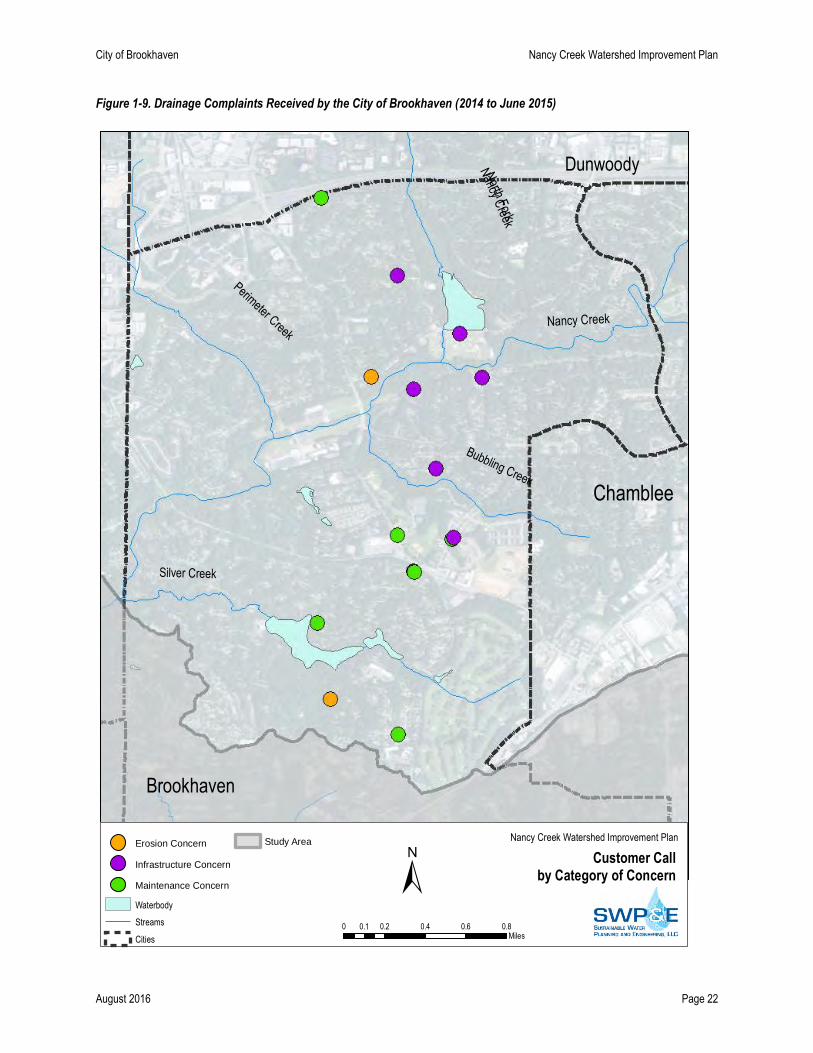
Stormwater and drainage concerns. A list of drainage concerns is shown in Figure 1-9 that reflects calls to the City
from foundation through July 2015. The complaints are grouped into three categories: erosion, infrastructure, and
maintenance. The most common concern in the Study Area is infrastructure followed by maintenance.

City of Brookhaven Nancy Creek Watershed Improvement Plan
August 2016 Page 21
Figure 1-8. Streams Classified as Impaired by State
Nancy Creek
No
rth F
orkN
ancy C
reek
Silver Creek
SandySprings
Dunwoody
Brookhaven
Chamblee
DoravilleSilverLake
DeKalb CountyWater Works
MurpheyCandlerLake
Bubbling Creek
Perimeter Creek
Nancy Creek
Nancy Creek
Source: Esri, DigitalGlobe, GeoEye, i-cubed, Earthstar Geographics,
CNES/Airbus DS, USDA, USGS, AEX, Getmapping, Aerogrid, IGN, IGP,swisstopo, and the GIS User Community Impaired Streams
on the 303(d) List
Nancy Creek Watershed Improvement Plan
±0 0.55 1.1 1.65 2.20.275
Miles
Impaired Streams
Waterbodies
Streams
Cities
Study Area
City of Brookhaven Nancy Creek Watershed Improvement Plan
August 2016 Page 22
Figure 1-9. Drainage Complaints Received by the City of Brookhaven (2014 to June 2015)
Brookhaven
Perimeter Creek
Bubbling Creek
Dunwoody
Silver Creek
Chamblee
Nancy CreekN
orth Fork
Nancy C
reek
Source: Esri, DigitalGlobe, GeoEye, i-cubed, Earthstar Geographics,
CNES/Airbus DS, USDA, USGS, AEX, Getmapping, Aerogrid, IGN, IGP,swisstopo, and the GIS User Community
Customer Callby Category of Concern
Nancy Creek Watershed Improvement Plan
±0 0.2 0.4 0.6 0.80.1
Miles
Erosion Concern
Infrastructure Concern
Maintenance Concern
Waterbody
Streams
Cities
Study Area
City of Brookhaven Nancy Creek Watershed Improvement Plan
August 2016 Page 23
1.4.4. MURPHEY CANDLER LAKE
Murphey Candler Lake sits in the 135-acre Murphey Candler Park and is given special attention within this Plan because it is
owned and operated by the City of Brookhaven. This section provides an overview of the Lake, its history, and the known
concerns. Chapter 2 presents the field data collected as part of this Plan to better characterize lake health.
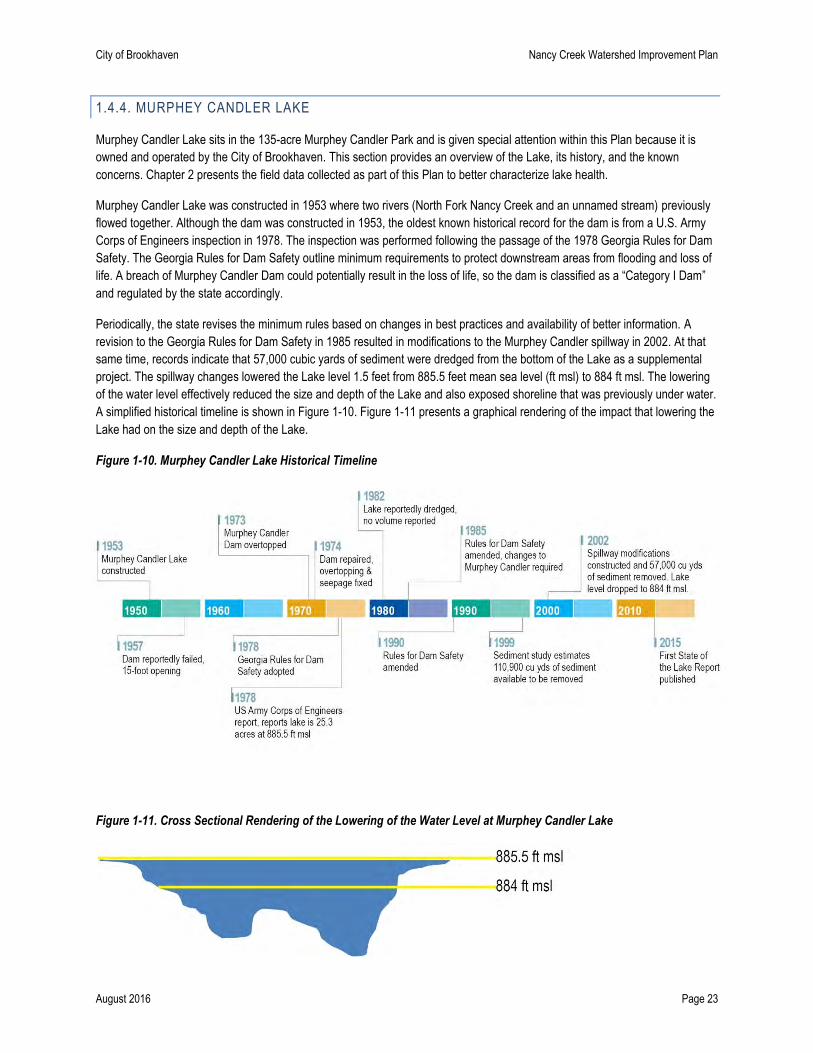
Murphey Candler Lake was constructed in 1953 where two rivers (North Fork Nancy Creek and an unnamed stream) previously
flowed together. Although the dam was constructed in 1953, the oldest known historical record for the dam is from a U.S. Army
Corps of Engineers inspection in 1978. The inspection was performed following the passage of the 1978 Georgia Rules for Dam
Safety. The Georgia Rules for Dam Safety outline minimum requirements to protect downstream areas from flooding and loss of
life. A breach of Murphey Candler Dam could potentially result in the loss of life, so the dam is classified as a “Category I Dam”
and regulated by the state accordingly.
Periodically, the state revises the minimum rules based on changes in best practices and availability of better information. A
revision to the Georgia Rules for Dam Safety in 1985 resulted in modifications to the Murphey Candler spillway in 2002. At that
same time, records indicate that 57,000 cubic yards of sediment were dredged from the bottom of the Lake as a supplemental
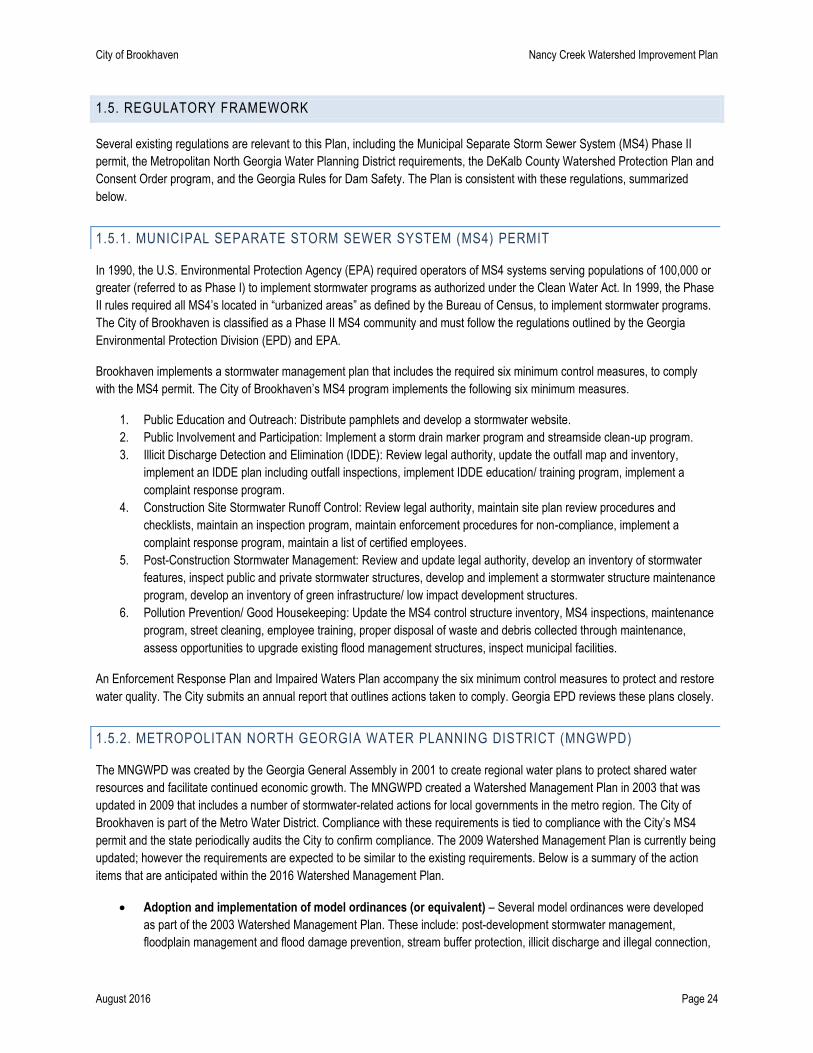
project. The spillway changes lowered the Lake level 1.5 feet from 885.5 feet mean sea level (ft msl) to 884 ft msl. The lowering
of the water level effectively reduced the size and depth of the Lake and also exposed shoreline that was previously under water.
A simplified historical timeline is shown in Figure 1-10. Figure 1-11 presents a graphical rendering of the impact that lowering the
Lake had on the size and depth of the Lake.
Figure 1-10. Murphey Candler Lake Historical Timeline
Figure 1-11. Cross Sectional Rendering of the Lowering of the Water Level at Murphey Candler Lake
City of Brookhaven Nancy Creek Watershed Improvement Plan
August 2016 Page 24
1.5. REGULATORY FRAMEWORK
Several existing regulations are relevant to this Plan, including the Municipal Separate Storm Sewer System (MS4) Phase II
permit, the Metropolitan North Georgia Water Planning District requirements, the DeKalb County Watershed Protection Plan and
Consent Order program, and the Georgia Rules for Dam Safety. The Plan is consistent with these regulations, summarized
below.
1.5.1. MUNICIPAL SEPARATE STORM SEWER SYSTEM (MS4) PERMIT
In 1990, the U.S. Environmental Protection Agency (EPA) required operators of MS4 systems serving populations of 100,000 or
greater (referred to as Phase I) to implement stormwater programs as authorized under the Clean Water Act. In 1999, the Phase
II rules required all MS4’s located in “urbanized areas” as defined by the Bureau of Census, to implement stormwater programs.
The City of Brookhaven is classified as a Phase II MS4 community and must follow the regulations outlined by the Georgia
Environmental Protection Division (EPD) and EPA.
Brookhaven implements a stormwater management plan that includes the required six minimum control measures, to comply
with the MS4 permit. The City of Brookhaven’s MS4 program implements the following six minimum measures.
1. Public Education and Outreach: Distribute pamphlets and develop a stormwater website.
2. Public Involvement and Participation: Implement a storm drain marker program and streamside clean-up program.
3. Illicit Discharge Detection and Elimination (IDDE): Review legal authority, update the outfall map and inventory,
implement an IDDE plan including outfall inspections, implement IDDE education/ training program, implement a
complaint response program.
4. Construction Site Stormwater Runoff Control: Review legal authority, maintain site plan review procedures and
checklists, maintain an inspection program, maintain enforcement procedures for non-compliance, implement a
complaint response program, maintain a list of certified employees.
5. Post-Construction Stormwater Management: Review and update legal authority, develop an inventory of stormwater
features, inspect public and private stormwater structures, develop and implement a stormwater structure maintenance
program, develop an inventory of green infrastructure/ low impact development structures.
6. Pollution Prevention/ Good Housekeeping: Update the MS4 control structure inventory, MS4 inspections, maintenance
program, street cleaning, employee training, proper disposal of waste and debris collected through maintenance,
assess opportunities to upgrade existing flood management structures, inspect municipal facilities.
An Enforcement Response Plan and Impaired Waters Plan accompany the six minimum control measures to protect and restore
water quality. The City submits an annual report that outlines actions taken to comply. Georgia EPD reviews these plans closely.
1.5.2. METROPOLITAN NORTH GEORGIA WATER PLANNING DISTRICT (MNGWPD)
The MNGWPD was created by the Georgia General Assembly in 2001 to create regional water plans to protect shared water
resources and facilitate continued economic growth. The MNGWPD created a Watershed Management Plan in 2003 that was
updated in 2009 that includes a number of stormwater-related actions for local governments in the metro region. The City of
Brookhaven is part of the Metro Water District. Compliance with these requirements is tied to compliance with the City’s MS4
permit and the state periodically audits the City to confirm compliance. The 2009 Watershed Management Plan is currently being
updated; however the requirements are expected to be similar to the existing requirements. Below is a summary of the action
items that are anticipated within the 2016 Watershed Management Plan.
Adoption and implementation of model ordinances (or equivalent) – Several model ordinances were developed
as part of the 2003 Watershed Management Plan. These include: post-development stormwater management,
floodplain management and flood damage prevention, stream buffer protection, illicit discharge and illegal connection,

City of Brookhaven Nancy Creek Watershed Improvement Plan
August 2016 Page 25
and litter control. The City has adopted ordinances to meet this requirement. Continued implementation of these
ordinances is expected to be an action item.
On-going stormwater system management – The 2003 and 2009 Plans required specific stormwater infrastructure
maintenance activities that complemented asset management practices and MS4 permit requirements. The District’s
2016 Watershed Management Plan will continue to encourage local governments to better manage their assets
throughout the life cycle.
Monitoring – The 2003 and 2009 Plans required long-term ambient trend monitoring and macroinvertebrate
bioassessment monitoring. The requirements for the 2016 Plan are in progress. Currently, DeKalb County Watershed
Department performs long-term trend monitoring and biological assessments on a number of stations throughout the
county, including several in Brookhaven. No additional sampling is anticipated.
Watershed improvement planning – The specific requirements for the watershed improvement planning and project
implementation are in progress but the goal is to encourage communities to undertake efforts such as this Plan with
subsequent implementation of recommended projects over time.
Coordination with intergovernmental agencies – The goal of this requirement is to facilitate a minimum of one
conversation annually between stormwater managers, water/wastewater managers, environmental health
professionals who oversee septic systems, and community development managers who approve land development
projects. The goal of the coordination is to improve the effectiveness and outcome of related programs.
Promoting a green infrastructure approach – Green infrastructure refers to stormwater controls that infiltrate water
versus the traditional grey infrastructure (i.e., pipes, detention ponds) which capture, store, and release stormwater.
Green infrastructure has a number of ancillary benefits compared to traditional grey infrastructure. The goal of this
measure is to promote use, where appropriate.
The recommendations included in this Plan are consistent with the 2009 MNGWPD Watershed Management Plan and are
expected to support implementation of the requirements in the 2016 update to the MNGWPD Watershed Management Plan.
1.5.3. DEKALB COUNTY WATERSHED PROTECTION PLAN
DeKalb County developed a Watershed Protection Plan in 2008 to comply with NPDES permit requirements to operate the
County’s wastewater system that also serves city residents. The Watershed Protection Plan requirement is unique to Georgia.
The goal of the Watershed Protection Plan is to ensure that water quality does not decline as a result of sewer service or sewer
expansions that often facilitate denser development patterns. As part of the Watershed Protection Plan, last revised in July 2010,
DeKalb County performs routine water quality sampling of Nancy Creek and Bubbling Creek.
1.5.4. GEORGIA RULES FOR DAM SAFETY
The Georgia Safe Dams Act of 1978 was passed after the failure of the Kelley Barnes Lake in Stephens County as the dam
breach resulted in the loss of 39 lives and millions of dollars in property damage. The Act resulted in the creation of the Rules for
Dam Safety that govern the minimum criteria that larger dams in Georgia must meet in order to protect downstream loss of life
and property. The state regulates dams above the stated threshold, or dams 25 feet or greater in height or that impound 100
acre-feet or more of water. The Safe Dams Act groups dams into two categories; Category I dams are those in which improper
operations or a dam failure could result in the loss of life and Category II dams are those that meet the size threshold but would
not result in loss of life if they failed. Murphey Candler Lake is a Category I dam. The regulations outline provisions for design,
operations, inspections, and maintenance.
The original 1978 Act was amended in 1985 and 1990. The 1985 amendment changed the spillway size criteria and shifted the
responsibility of the safe dam program from the Georgia Soil and Water Conservation Commission (GSWCC) to the Georgia
EPD. The 1990 amendment added criteria that require local governments to provide information on proposed developments
below dams, as these developments may result in a Category II dam being re-categorized as a Category I dam. The 1985 Safe
City of Brookhaven Nancy Creek Watershed Improvement Plan
August 2016 Page 26
Dam Act changes resulted in the 2002 modifications to the Murphey Candler Lake spillway that effectively lowered the Lake level
1.5 feet, as previously described.
1.6. WATERSHED IMPROVEMENT PLAN DEVELOPMENT PROCESS
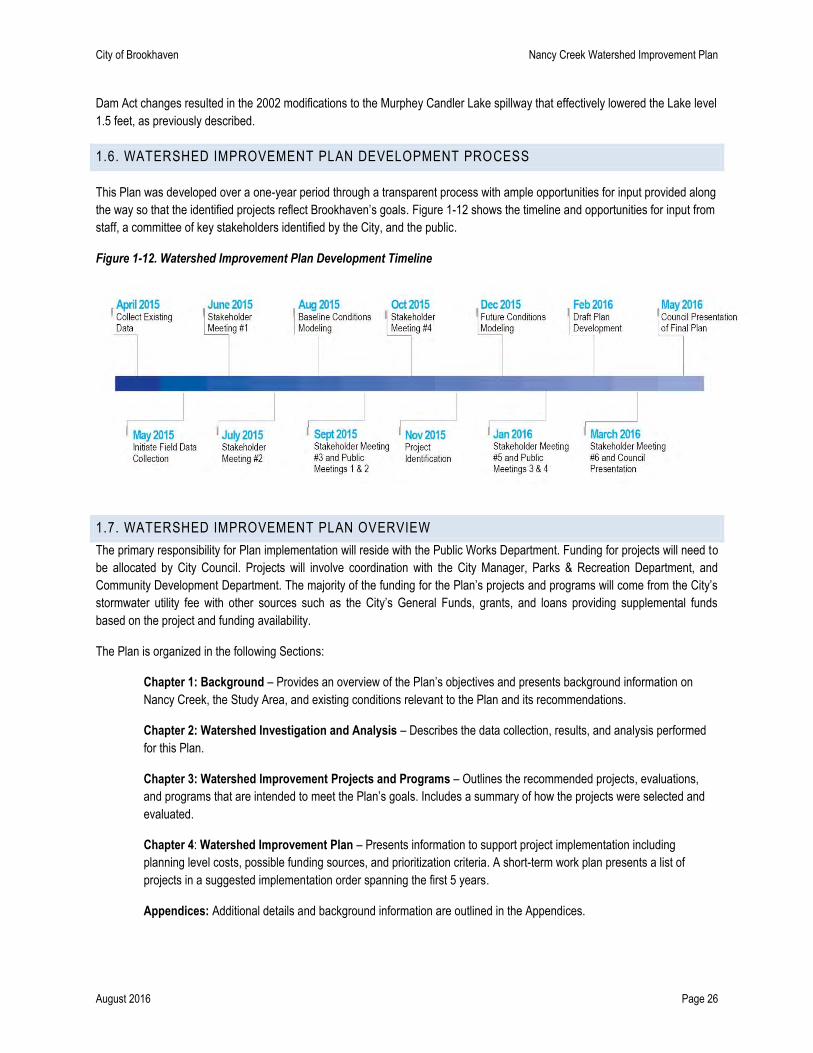
This Plan was developed over a one-year period through a transparent process with ample opportunities for input provided along
the way so that the identified projects reflect Brookhaven’s goals. Figure 1-12 shows the timeline and opportunities for input from
staff, a committee of key stakeholders identified by the City, and the public.
Figure 1-12. Watershed Improvement Plan Development Timeline
1.7. WATERSHED IMPROVEMENT PLAN OVERVIEW
The primary responsibility for Plan implementation will reside with the Public Works Department. Funding for projects will need to
be allocated by City Council. Projects will involve coordination with the City Manager, Parks & Recreation Department, and
Community Development Department. The majority of the funding for the Plan’s projects and programs will come from the City’s
stormwater utility fee with other sources such as the City’s General Funds, grants, and loans providing supplemental funds
based on the project and funding availability.
The Plan is organized in the following Sections:
Chapter 1: Background – Provides an overview of the Plan’s objectives and presents background information on
Nancy Creek, the Study Area, and existing conditions relevant to the Plan and its recommendations.
Chapter 2: Watershed Investigation and Analysis – Describes the data collection, results, and analysis performed
for this Plan.
Chapter 3: Watershed Improvement Projects and Programs – Outlines the recommended projects, evaluations,
and programs that are intended to meet the Plan’s goals. Includes a summary of how the projects were selected and
evaluated.
Chapter 4: Watershed Improvement Plan – Presents information to support project implementation including
planning level costs, possible funding sources, and prioritization criteria. A short-term work plan presents a list of
projects in a suggested implementation order spanning the first 5 years.
Appendices: Additional details and background information are outlined in the Appendices.
City of Brookhaven Nancy Creek Watershed Improvement Plan
August 2016 Page 27
CHAPTER 2: WATERSHED INVESTIGATION AND ANALYSIS
This Chapter presents an overview of the existing conditions within the Study Area. The existing conditions assessment
summarizes available water quality sampling data, as well as data collected throughout the development of the Plan. This
section provides an overview of available water quality data, habitat conditions as determined during stream walks, assessments
of potential pollutant sources, and new water quality sampling data. This section also includes the baseline water quality
modeling results that assign a relative contribution to different pollutant sources within the Study Area.
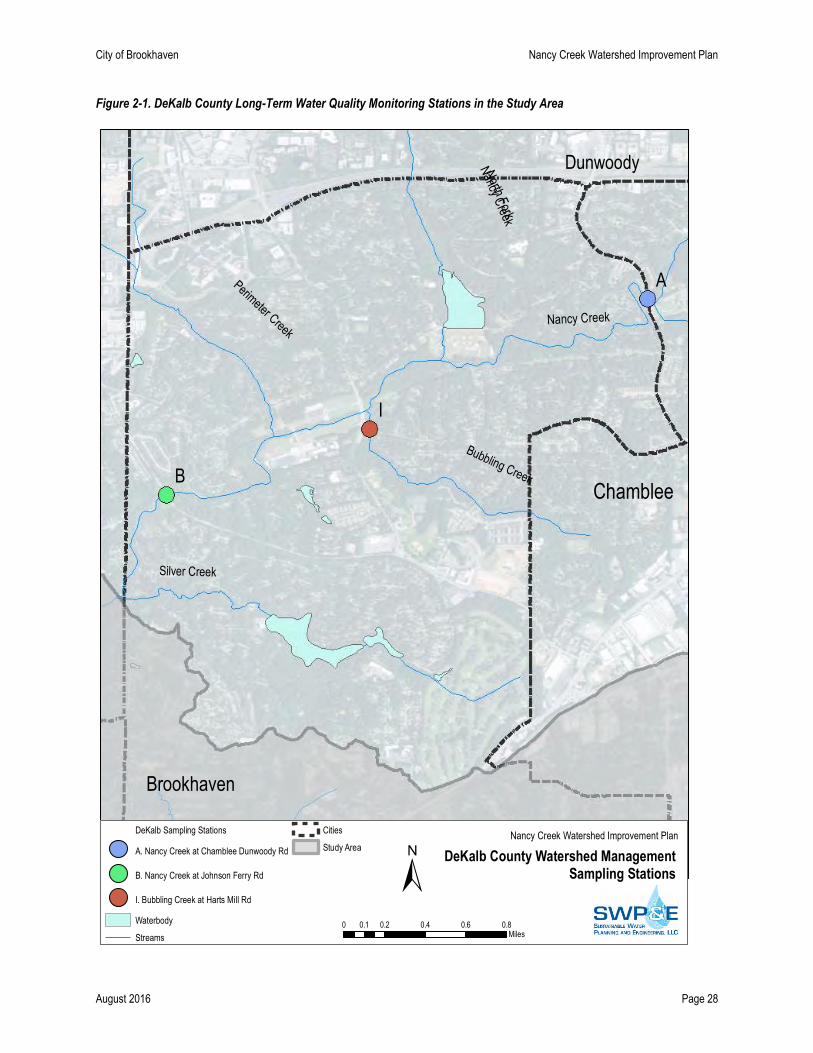
2.1. ASSESSMENT OF AVAILABLE WATER QUALITY DATA
The DeKalb County Watershed Management Department collects water quality samples for major streams throughout the
county, as part of their Watershed Protection Plan. There are three sites that fall within the Study Area: Nancy Creek at
Chamblee Dunwoody Road (A), Nancy Creek at Johnson Ferry Road (B), and Bubbling Creek at Harts Mill Road (I). These
locations are shown in Figure 2-1.
DeKalb County provided data from 2003 through June 2015 that reflected between 138 and 147 sampling events, depending on
the station. This sampling was performed on a routine schedule and was not tied to weather conditions (wet versus dry weather
samples). Data could not be statistically correlated to weather conditions, but the median of the data can be considered “normal”
for that station.
The parameters monitored at these three stations include:
pH
Dissolved Oxygen (DO)
Temperature
Conductivity
Turbidity
5-day Biological Oxygen Demand (BOD5)
Total Kjeldahl Nitrogen (NTKN)
Ammonia (NH3)
Nitrite-Nitrate (NO2NO3)
Total Phosphorus
Fecal Coliform Bacteria
E-coli
Solid Total Suspended Solids
Total Cadmium
Total Copper
Total Lead
Total Zinc
Hardness
Alkalinity
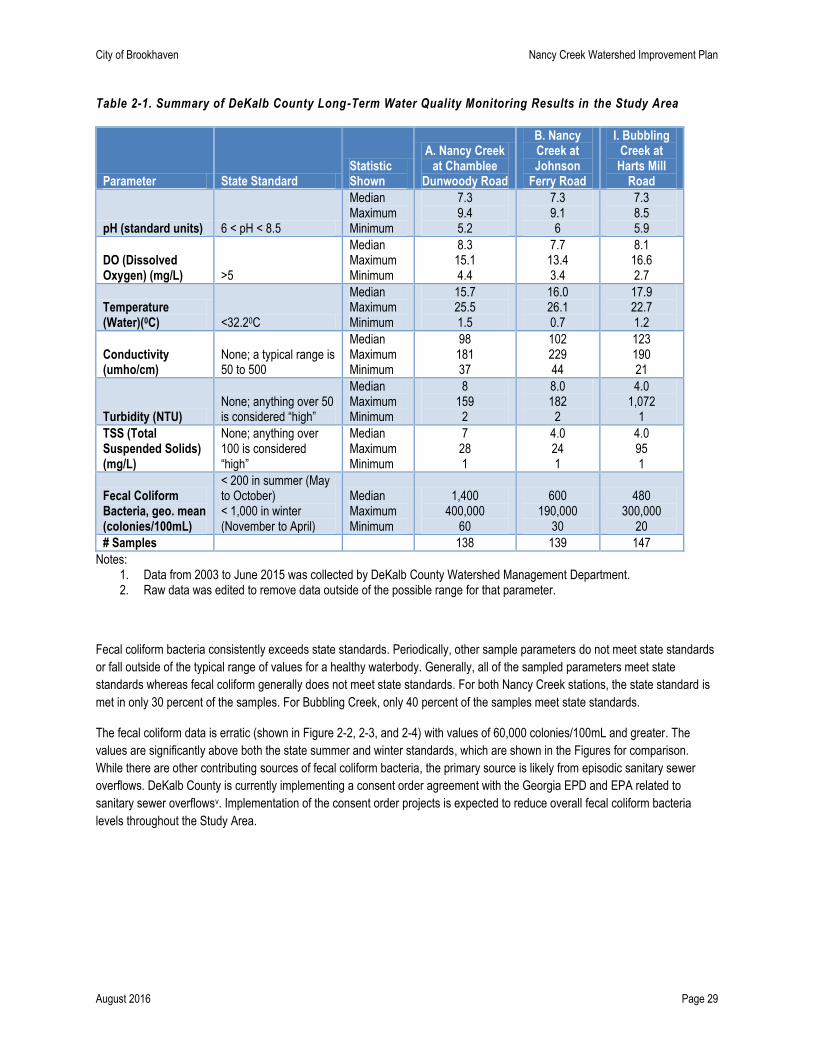
Table 2-1 outlines parameters of interest to this Plan and summarizes the median, maximum, and minimum results for each for
the three sample stations.
City of Brookhaven Nancy Creek Watershed Improvement Plan
August 2016 Page 28
Figure 2-1. DeKalb County Long-Term Water Quality Monitoring Stations in the Study Area
Brookhaven
Perimeter Creek
Bubbling Creek
Dunwoody
Silver Creek
Chamblee
Nancy CreekN
orth Fork
Nancy C
reek
I
B
A
Source: Esri, DigitalGlobe, GeoEye, i-cubed, Earthstar Geographics,
CNES/Airbus DS, USDA, USGS, AEX, Getmapping, Aerogrid, IGN, IGP,swisstopo, and the GIS User Community
DeKalb County Watershed ManagementSampling Stations
Nancy Creek Watershed Improvement Plan
±0 0.2 0.4 0.6 0.80.1
Miles
DeKalb Sampling Stations
A. Nancy Creek at Chamblee Dunwoody Rd
B. Nancy Creek at Johnson Ferry Rd
I. Bubbling Creek at Harts Mill Rd
Waterbody
Streams
Cities
Study Area
City of Brookhaven Nancy Creek Watershed Improvement Plan
August 2016 Page 29
Table 2-1. Summary of DeKalb County Long-Term Water Quality Monitoring Results in the Study Area
Parameter State Standard Statistic Shown
A. Nancy Creek at Chamblee
Dunwoody Road
B. Nancy Creek at Johnson
Ferry Road
I. Bubbling Creek at
Harts Mill Road
pH (standard units) 6 < pH < 8.5
Median Maximum Minimum
7.3 9.4 5.2
7.3 9.1 6
7.3 8.5 5.9
DO (Dissolved Oxygen) (mg/L) >5
Median Maximum Minimum
8.3 15.1 4.4
7.7 13.4 3.4
8.1 16.6 2.7
Temperature (Water)(0C) <32.20C
Median Maximum Minimum
15.7 25.5 1.5
16.0 26.1 0.7
17.9 22.7 1.2
Conductivity (umho/cm)
None; a typical range is 50 to 500
Median Maximum Minimum
98 181 37
102 229 44
123 190 21
Turbidity (NTU) None; anything over 50 is considered “high”
Median Maximum Minimum
8 159
2
8.0 182
2
4.0 1,072
1
TSS (Total Suspended Solids) (mg/L)
None; anything over 100 is considered “high”
Median Maximum Minimum
7 28 1
4.0 24 1
4.0 95 1
Fecal Coliform Bacteria, geo. mean (colonies/100mL)
< 200 in summer (May to October) < 1,000 in winter (November to April)
Median Maximum Minimum
1,400 400,000
60
600 190,000
30
480 300,000
20
# Samples 138 139 147
Notes: 1. Data from 2003 to June 2015 was collected by DeKalb County Watershed Management Department. 2. Raw data was edited to remove data outside of the possible range for that parameter.
Fecal coliform bacteria consistently exceeds state standards. Periodically, other sample parameters do not meet state standards
or fall outside of the typical range of values for a healthy waterbody. Generally, all of the sampled parameters meet state
standards whereas fecal coliform generally does not meet state standards. For both Nancy Creek stations, the state standard is
met in only 30 percent of the samples. For Bubbling Creek, only 40 percent of the samples meet state standards.
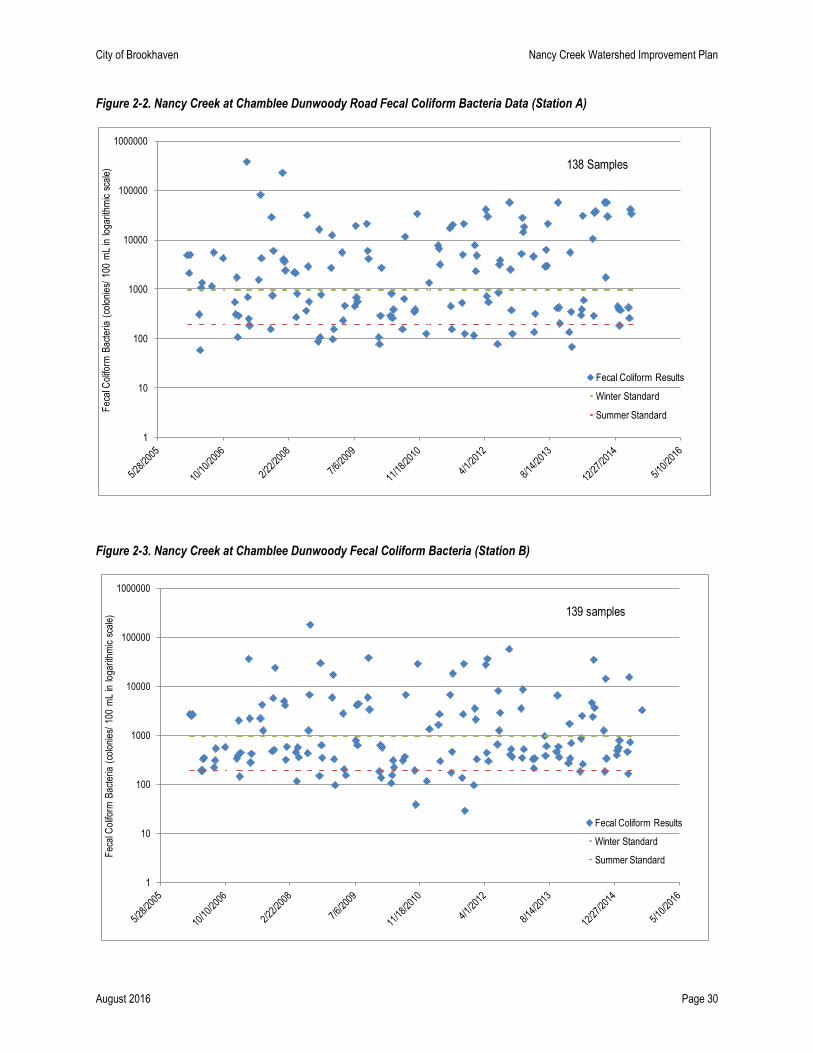
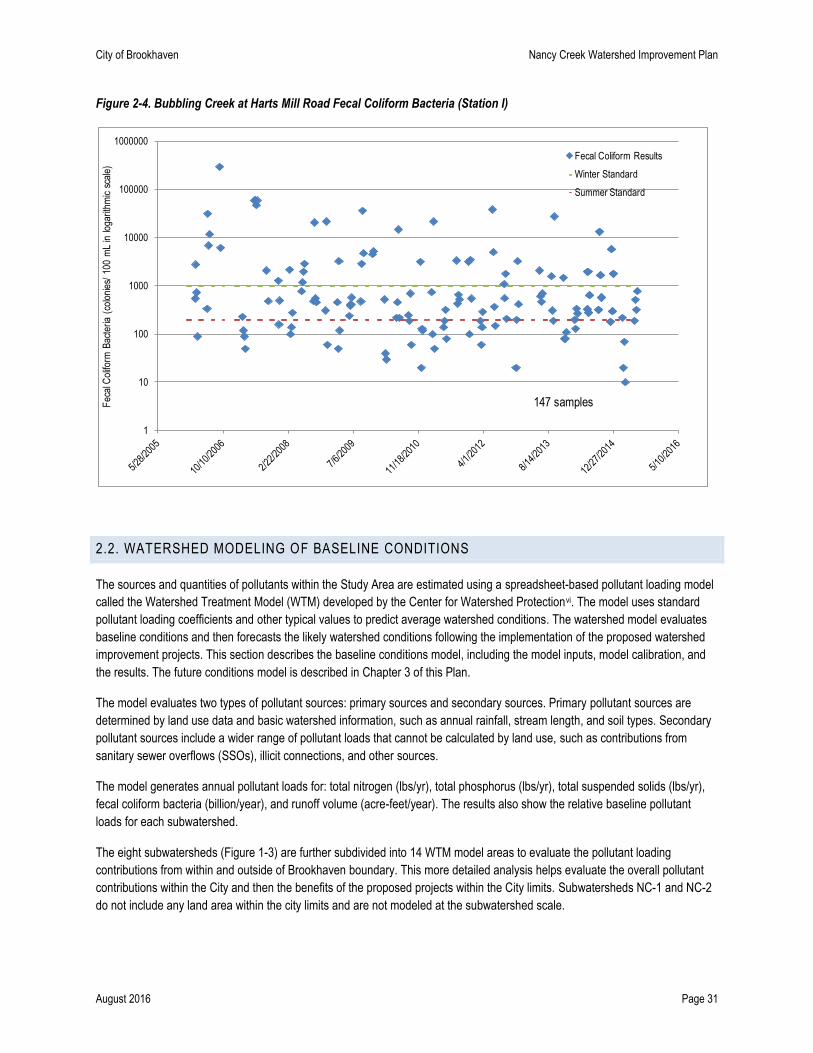
The fecal coliform data is erratic (shown in Figure 2-2, 2-3, and 2-4) with values of 60,000 colonies/100mL and greater. The
values are significantly above both the state summer and winter standards, which are shown in the Figures for comparison.
While there are other contributing sources of fecal coliform bacteria, the primary source is likely from episodic sanitary sewer
overflows. DeKalb County is currently implementing a consent order agreement with the Georgia EPD and EPA related to
sanitary sewer overflowsv. Implementation of the consent order projects is expected to reduce overall fecal coliform bacteria
levels throughout the Study Area.
City of Brookhaven Nancy Creek Watershed Improvement Plan
August 2016 Page 30
Figure 2-2. Nancy Creek at Chamblee Dunwoody Road Fecal Coliform Bacteria Data (Station A)
Figure 2-3. Nancy Creek at Chamblee Dunwoody Fecal Coliform Bacteria (Station B)
1
10
100
1000
10000
100000
1000000
Fec
al C
olifo
rm B
acte
ria (
colo
nies
/ 10
0 m
L in
loga
rithm
ic s
cale
) 138 Samples
Fecal Coliform Results
Winter Standard
Summer Standard
1
10
100
1000
10000
100000
1000000
Fec
al C
olifo
rm B
acte
ria (
colo
nies
/ 10
0 m
L in
loga
rithm
ic s
cale
) 139 samples
Fecal Coliform Results
Winter Standard
Summer Standard
City of Brookhaven Nancy Creek Watershed Improvement Plan
August 2016 Page 31
Figure 2-4. Bubbling Creek at Harts Mill Road Fecal Coliform Bacteria (Station I)
2.2. WATERSHED MODELING OF BASELINE CONDITIONS
The sources and quantities of pollutants within the Study Area are estimated using a spreadsheet-based pollutant loading model
called the Watershed Treatment Model (WTM) developed by the Center for Watershed Protectionvi. The model uses standard
pollutant loading coefficients and other typical values to predict average watershed conditions. The watershed model evaluates
baseline conditions and then forecasts the likely watershed conditions following the implementation of the proposed watershed
improvement projects. This section describes the baseline conditions model, including the model inputs, model calibration, and
the results. The future conditions model is described in Chapter 3 of this Plan.
The model evaluates two types of pollutant sources: primary sources and secondary sources. Primary pollutant sources are
determined by land use data and basic watershed information, such as annual rainfall, stream length, and soil types. Secondary
pollutant sources include a wider range of pollutant loads that cannot be calculated by land use, such as contributions from
sanitary sewer overflows (SSOs), illicit connections, and other sources.
The model generates annual pollutant loads for: total nitrogen (lbs/yr), total phosphorus (lbs/yr), total suspended solids (lbs/yr),
fecal coliform bacteria (billion/year), and runoff volume (acre-feet/year). The results also show the relative baseline pollutant
loads for each subwatershed.
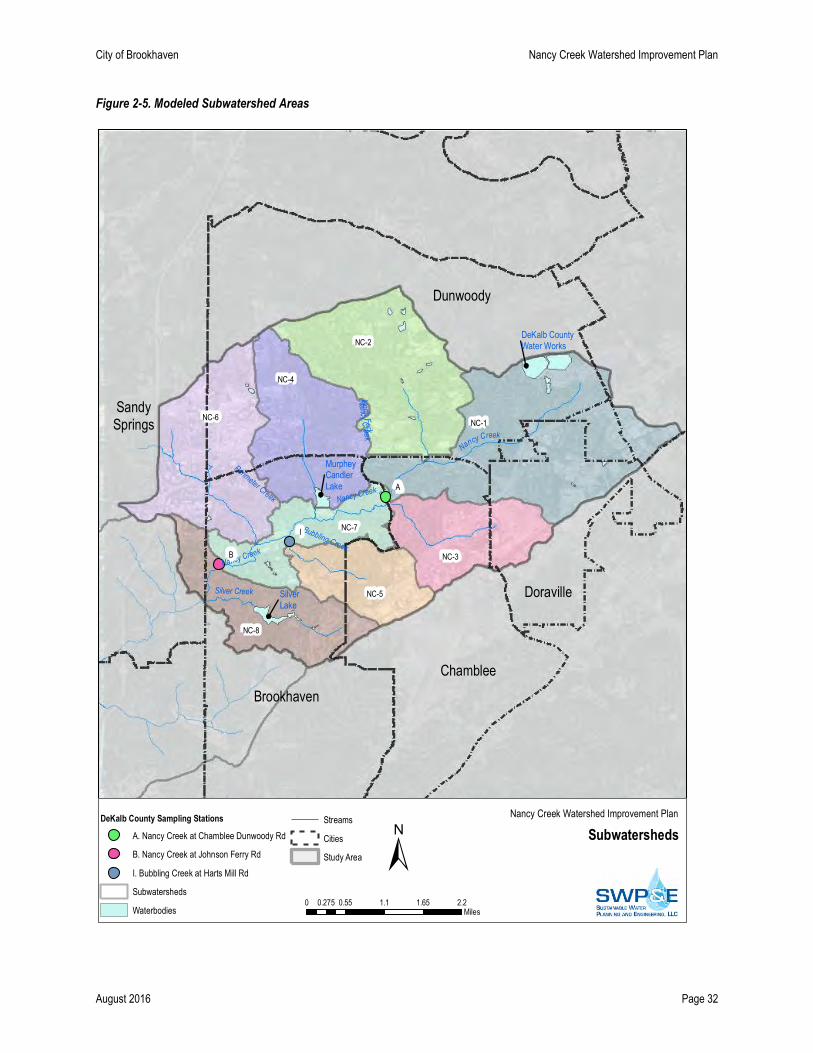
The eight subwatersheds (Figure 1-3) are further subdivided into 14 WTM model areas to evaluate the pollutant loading
contributions from within and outside of Brookhaven boundary. This more detailed analysis helps evaluate the overall pollutant
contributions within the City and then the benefits of the proposed projects within the City limits. Subwatersheds NC-1 and NC-2
do not include any land area within the city limits and are not modeled at the subwatershed scale.
1
10
100
1000
10000
100000
1000000
Fec
al C
olifo
rm B
acte
ria (
colo
nies
/ 10
0 m
L in
loga
rithm
ic s
cale
)
147 samples
Fecal Coliform Results
Winter Standard
Summer Standard
City of Brookhaven Nancy Creek Watershed Improvement Plan
August 2016 Page 32
Figure 2-5. Modeled Subwatershed Areas
Nancy Creek
No
rth F
orkN
ancy C
reek
Silver Creek
SandySprings
Dunwoody
Brookhaven
Chamblee
DoravilleSilverLake
DeKalb CountyWater Works
MurpheyCandlerLake
Bubbling Creek
Perimeter Creek
Nancy Creek
Nancy Creek
NC-1
NC-2
NC-6
NC-4
NC-8
NC-3
NC-7
NC-5
I
B
A
Source: Esri, DigitalGlobe, GeoEye, i-cubed, Earthstar Geographics,
CNES/Airbus DS, USDA, USGS, AEX, Getmapping, Aerogrid, IGN, IGP,swisstopo, and the GIS User Community Subwatersheds
Nancy Creek Watershed Improvement Plan
±0 0.55 1.1 1.65 2.20.275
Miles
DeKalb County Sampling Stations
A. Nancy Creek at Chamblee Dunwoody Rd
B. Nancy Creek at Johnson Ferry Rd
I. Bubbling Creek at Harts Mill Rd
Subwatersheds
Waterbodies
Streams
Cities
Study Area
City of Brookhaven Nancy Creek Watershed Improvement Plan
August 2016 Page 33
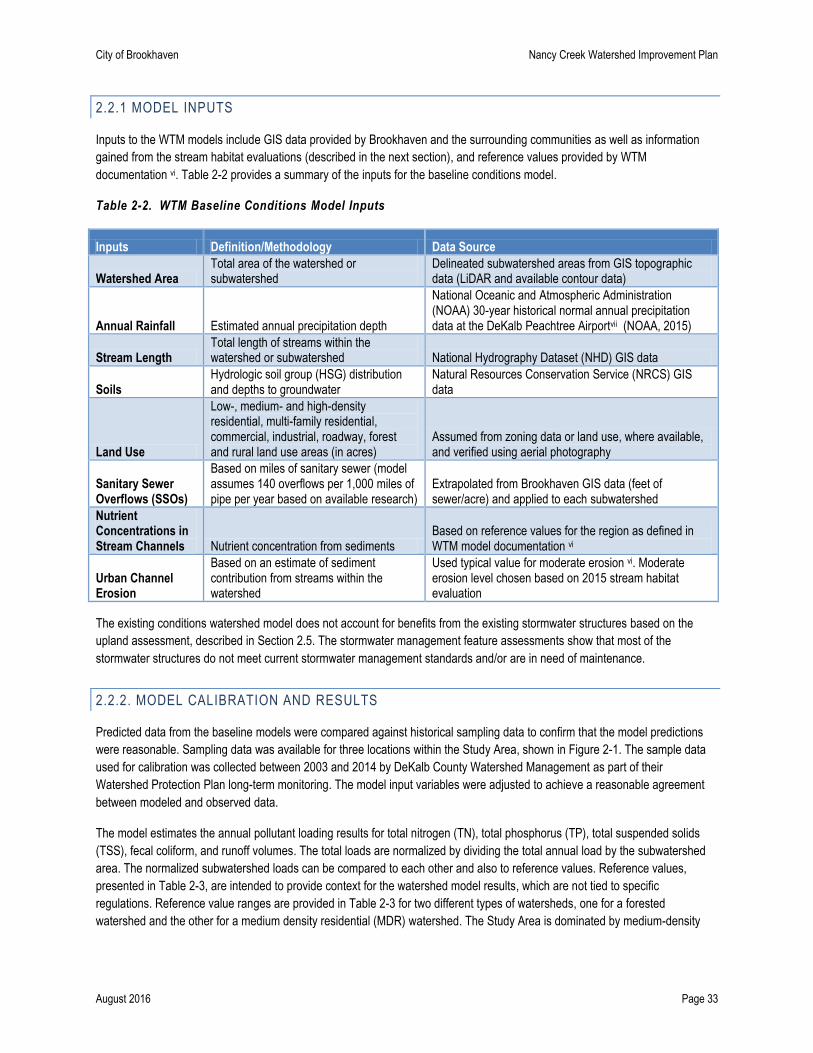
2.2.1 MODEL INPUTS
Inputs to the WTM models include GIS data provided by Brookhaven and the surrounding communities as well as information
gained from the stream habitat evaluations (described in the next section), and reference values provided by WTM
documentation vi. Table 2-2 provides a summary of the inputs for the baseline conditions model.
Table 2-2. WTM Baseline Conditions Model Inputs
Inputs Definition/Methodology Data Source
Watershed Area Total area of the watershed or subwatershed
Delineated subwatershed areas from GIS topographic data (LiDAR and available contour data)
Annual Rainfall Estimated annual precipitation depth
National Oceanic and Atmospheric Administration (NOAA) 30-year historical normal annual precipitation data at the DeKalb Peachtree Airportvii (NOAA, 2015)
Stream Length Total length of streams within the watershed or subwatershed National Hydrography Dataset (NHD) GIS data
Soils Hydrologic soil group (HSG) distribution and depths to groundwater
Natural Resources Conservation Service (NRCS) GIS data
Land Use
Low-, medium- and high-density residential, multi-family residential, commercial, industrial, roadway, forest and rural land use areas (in acres)
Assumed from zoning data or land use, where available, and verified using aerial photography
Sanitary Sewer Overflows (SSOs)
Based on miles of sanitary sewer (model assumes 140 overflows per 1,000 miles of pipe per year based on available research)
Extrapolated from Brookhaven GIS data (feet of sewer/acre) and applied to each subwatershed
Nutrient Concentrations in Stream Channels Nutrient concentration from sediments
Based on reference values for the region as defined in WTM model documentation vi
Urban Channel Erosion
Based on an estimate of sediment contribution from streams within the watershed
Used typical value for moderate erosion vi. Moderate erosion level chosen based on 2015 stream habitat evaluation
The existing conditions watershed model does not account for benefits from the existing stormwater structures based on the
upland assessment, described in Section 2.5. The stormwater management feature assessments show that most of the
stormwater structures do not meet current stormwater management standards and/or are in need of maintenance.
2.2.2. MODEL CALIBRATION AND RESULTS
Predicted data from the baseline models were compared against historical sampling data to confirm that the model predictions
were reasonable. Sampling data was available for three locations within the Study Area, shown in Figure 2-1. The sample data
used for calibration was collected between 2003 and 2014 by DeKalb County Watershed Management as part of their
Watershed Protection Plan long-term monitoring. The model input variables were adjusted to achieve a reasonable agreement
between modeled and observed data.
The model estimates the annual pollutant loading results for total nitrogen (TN), total phosphorus (TP), total suspended solids
(TSS), fecal coliform, and runoff volumes. The total loads are normalized by dividing the total annual load by the subwatershed
area. The normalized subwatershed loads can be compared to each other and also to reference values. Reference values,
presented in Table 2-3, are intended to provide context for the watershed model results, which are not tied to specific
regulations. Reference value ranges are provided in Table 2-3 for two different types of watersheds, one for a forested
watershed and the other for a medium density residential (MDR) watershed. The Study Area is dominated by medium-density
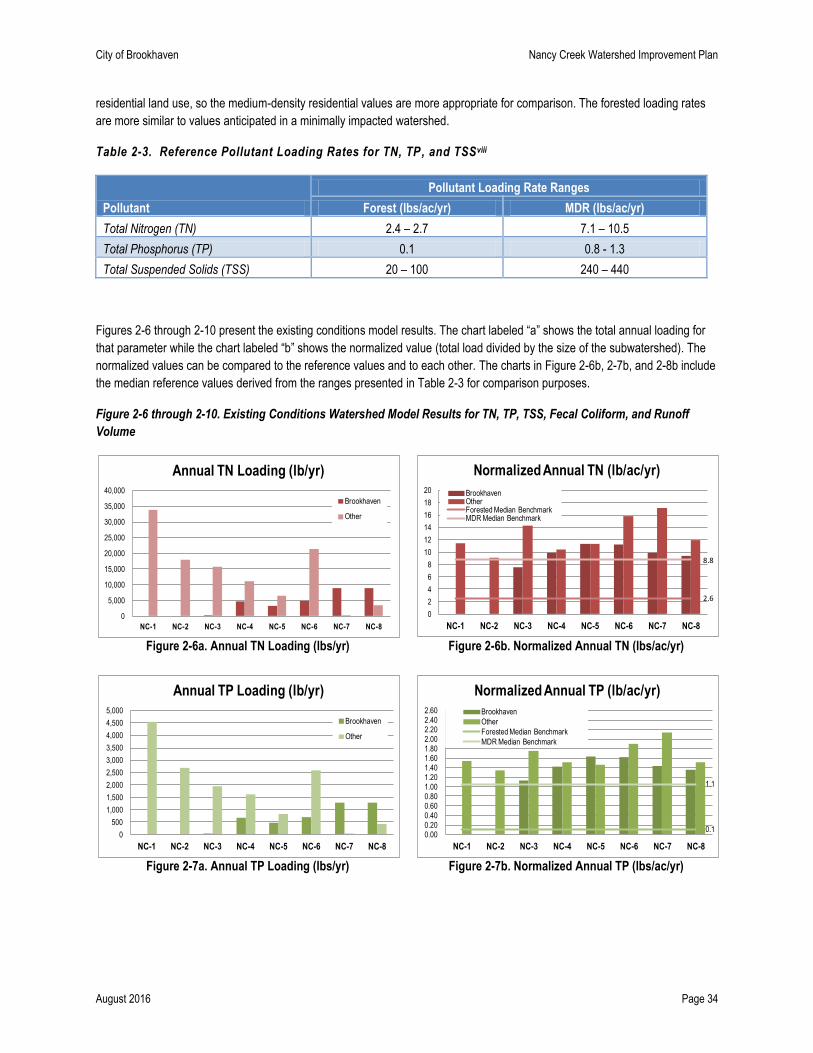
City of Brookhaven Nancy Creek Watershed Improvement Plan
August 2016 Page 34
residential land use, so the medium-density residential values are more appropriate for comparison. The forested loading rates
are more similar to values anticipated in a minimally impacted watershed.
Table 2-3. Reference Pollutant Loading Rates for TN, TP, and TSSviii
Pollutant
Pollutant Loading Rate Ranges
Forest (lbs/ac/yr) MDR (lbs/ac/yr)
Total Nitrogen (TN) 2.4 – 2.7 7.1 – 10.5
Total Phosphorus (TP) 0.1 0.8 - 1.3
Total Suspended Solids (TSS) 20 – 100 240 – 440
Figures 2-6 through 2-10 present the existing conditions model results. The chart labeled “a” shows the total annual loading for
that parameter while the chart labeled “b” shows the normalized value (total load divided by the size of the subwatershed). The
normalized values can be compared to the reference values and to each other. The charts in Figure 2-6b, 2-7b, and 2-8b include
the median reference values derived from the ranges presented in Table 2-3 for comparison purposes.
Figure 2-6 through 2-10. Existing Conditions Watershed Model Results for TN, TP, TSS, Fecal Coliform, and Runoff
Volume
Figure 2-6a. Annual TN Loading (lbs/yr) Figure 2-6b. Normalized Annual TN (lbs/ac/yr)
Figure 2-7a. Annual TP Loading (lbs/yr) Figure 2-7b. Normalized Annual TP (lbs/ac/yr)
0
5,000
10,000
15,000
20,000
25,000
30,000
35,000
40,000
NC-1 NC-2 NC-3 NC-4 NC-5 NC-6 NC-7 NC-8
Annual TN Loading (lb/yr)
Brookhaven
Other
2.6
8.8
0
2
4
6
8
10
12
14
16
18
20
NC-1 NC-2 NC-3 NC-4 NC-5 NC-6 NC-7 NC-8
Normalized Annual TN (lb/ac/yr)
BrookhavenOtherForested Median BenchmarkMDR Median Benchmark
0
500
1,000
1,500
2,000
2,500
3,000
3,500
4,000
4,500
5,000
NC-1 NC-2 NC-3 NC-4 NC-5 NC-6 NC-7 NC-8
Annual TP Loading (lb/yr)
Brookhaven
Other
0.1
1.1
0.000.200.400.600.801.001.201.401.601.802.002.202.402.60
NC-1 NC-2 NC-3 NC-4 NC-5 NC-6 NC-7 NC-8
Normalized Annual TP (lb/ac/yr)
Brookhaven
Other
Forested Median Benchmark
MDR Median Benchmark
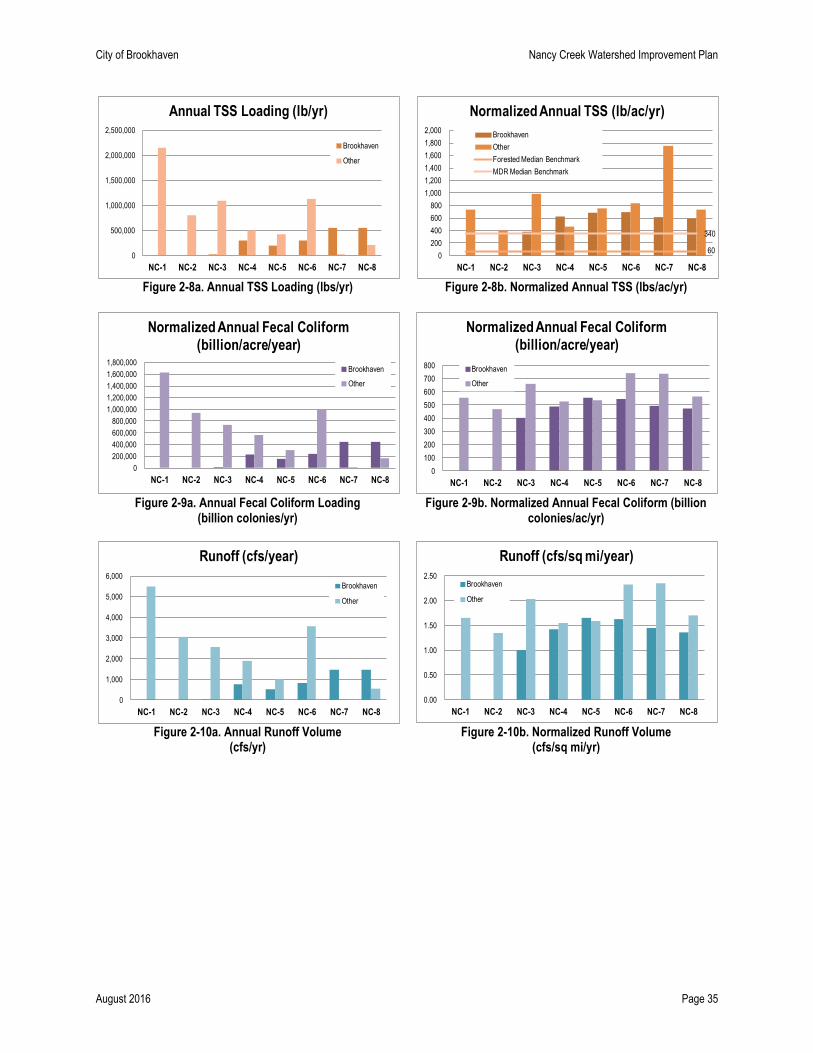
City of Brookhaven Nancy Creek Watershed Improvement Plan
August 2016 Page 35
Figure 2-8a. Annual TSS Loading (lbs/yr) Figure 2-8b. Normalized Annual TSS (lbs/ac/yr)
Figure 2-9a. Annual Fecal Coliform Loading
(billion colonies/yr) Figure 2-9b. Normalized Annual Fecal Coliform (billion
colonies/ac/yr)
Figure 2-10a. Annual Runoff Volume
(cfs/yr) Figure 2-10b. Normalized Runoff Volume
(cfs/sq mi/yr)
0
500,000
1,000,000
1,500,000
2,000,000
2,500,000
NC-1 NC-2 NC-3 NC-4 NC-5 NC-6 NC-7 NC-8
Annual TSS Loading (lb/yr)
Brookhaven
Other
60
340
0
200
400
600
800
1,000
1,200
1,400
1,600
1,800
2,000
NC-1 NC-2 NC-3 NC-4 NC-5 NC-6 NC-7 NC-8
Normalized Annual TSS (lb/ac/yr)
Brookhaven
Other
Forested Median Benchmark
MDR Median Benchmark
0
200,000
400,000
600,000
800,000
1,000,000
1,200,000
1,400,000
1,600,000
1,800,000
NC-1 NC-2 NC-3 NC-4 NC-5 NC-6 NC-7 NC-8
Normalized Annual Fecal Coliform (billion/acre/year)
Brookhaven
Other
0
100
200
300
400
500
600
700
800
NC-1 NC-2 NC-3 NC-4 NC-5 NC-6 NC-7 NC-8
Normalized Annual Fecal Coliform (billion/acre/year)
Brookhaven
Other
0
1,000
2,000
3,000
4,000
5,000
6,000
NC-1 NC-2 NC-3 NC-4 NC-5 NC-6 NC-7 NC-8
Runoff (cfs/year)
Brookhaven
Other
0.00
0.50
1.00
1.50
2.00
2.50
NC-1 NC-2 NC-3 NC-4 NC-5 NC-6 NC-7 NC-8
Runoff (cfs/sq mi/year)
Brookhaven
Other
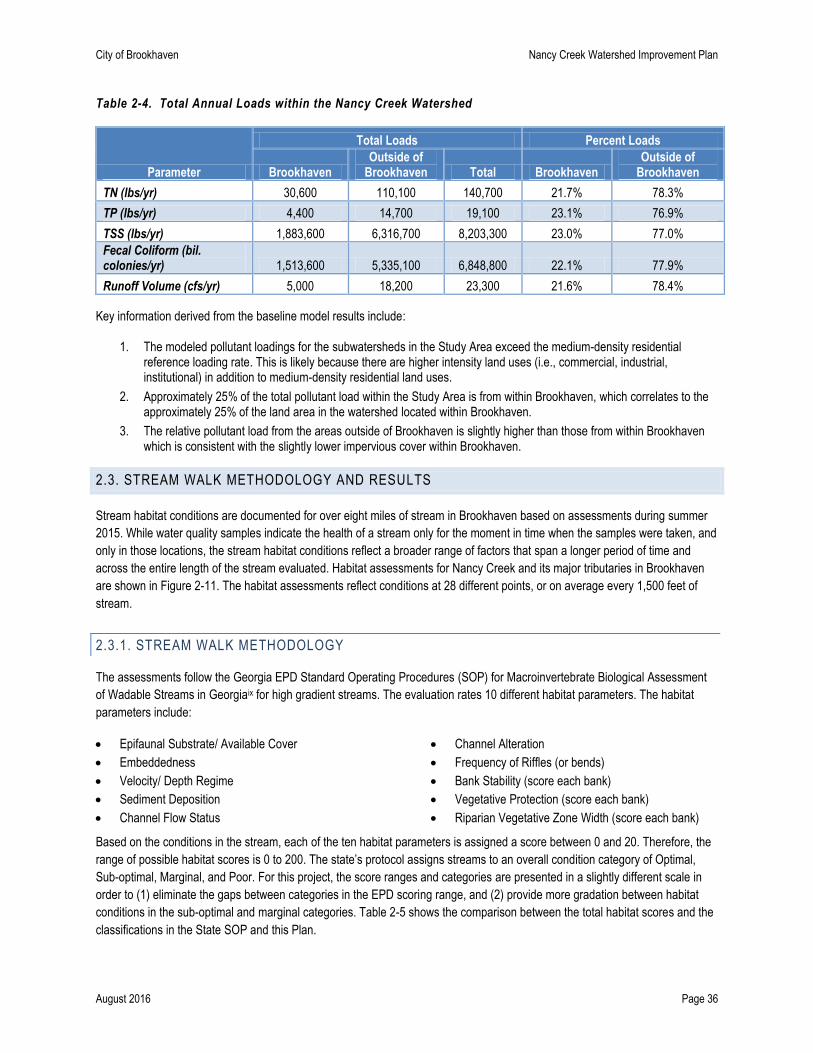
City of Brookhaven Nancy Creek Watershed Improvement Plan
August 2016 Page 36
Table 2-4. Total Annual Loads within the Nancy Creek Watershed
Parameter
Total Loads Percent Loads
Brookhaven Outside of
Brookhaven Total Brookhaven Outside of
Brookhaven
TN (lbs/yr) 30,600 110,100 140,700 21.7% 78.3%
TP (lbs/yr) 4,400 14,700 19,100 23.1% 76.9%
TSS (lbs/yr) 1,883,600 6,316,700 8,203,300 23.0% 77.0%
Fecal Coliform (bil. colonies/yr) 1,513,600 5,335,100 6,848,800 22.1% 77.9%
Runoff Volume (cfs/yr) 5,000 18,200 23,300 21.6% 78.4%
Key information derived from the baseline model results include:
1. The modeled pollutant loadings for the subwatersheds in the Study Area exceed the medium-density residential reference loading rate. This is likely because there are higher intensity land uses (i.e., commercial, industrial, institutional) in addition to medium-density residential land uses.
2. Approximately 25% of the total pollutant load within the Study Area is from within Brookhaven, which correlates to the approximately 25% of the land area in the watershed located within Brookhaven.
3. The relative pollutant load from the areas outside of Brookhaven is slightly higher than those from within Brookhaven which is consistent with the slightly lower impervious cover within Brookhaven.
2.3. STREAM WALK METHODOLOGY AND RESULTS
Stream habitat conditions are documented for over eight miles of stream in Brookhaven based on assessments during summer
2015. While water quality samples indicate the health of a stream only for the moment in time when the samples were taken, and
only in those locations, the stream habitat conditions reflect a broader range of factors that span a longer period of time and
across the entire length of the stream evaluated. Habitat assessments for Nancy Creek and its major tributaries in Brookhaven
are shown in Figure 2-11. The habitat assessments reflect conditions at 28 different points, or on average every 1,500 feet of
stream.
2.3.1. STREAM WALK METHODOLOGY
The assessments follow the Georgia EPD Standard Operating Procedures (SOP) for Macroinvertebrate Biological Assessment
of Wadable Streams in Georgiaix for high gradient streams. The evaluation rates 10 different habitat parameters. The habitat
parameters include:
Epifaunal Substrate/ Available Cover
Embeddedness
Velocity/ Depth Regime
Sediment Deposition
Channel Flow Status
Channel Alteration
Frequency of Riffles (or bends)
Bank Stability (score each bank)
Vegetative Protection (score each bank)
Riparian Vegetative Zone Width (score each bank)
Based on the conditions in the stream, each of the ten habitat parameters is assigned a score between 0 and 20. Therefore, the
range of possible habitat scores is 0 to 200. The state’s protocol assigns streams to an overall condition category of Optimal,
Sub-optimal, Marginal, and Poor. For this project, the score ranges and categories are presented in a slightly different scale in
order to (1) eliminate the gaps between categories in the EPD scoring range, and (2) provide more gradation between habitat
conditions in the sub-optimal and marginal categories. Table 2-5 shows the comparison between the total habitat scores and the
classifications in the State SOP and this Plan.
City of Brookhaven Nancy Creek Watershed Improvement Plan
August 2016 Page 37
Figure 2-11. Habitat Assessment Streams
Brookhaven
Perimeter Creek
Bubbling Creek
Dunwoody
Silver Creek
Chamblee
Nancy CreekN
orth Fork
Nancy C
reek
Source: Esri, DigitalGlobe, GeoEye, i-cubed, Earthstar Geographics,
CNES/Airbus DS, USDA, USGS, AEX, Getmapping, Aerogrid, IGN, IGP,swisstopo, and the GIS User Community
Assessed Study Area Streams
Nancy Creek Watershed Improvement Plan
±0 0.2 0.4 0.6 0.80.1
Miles
Assessed Stream
Waterbody
Streams
Cities
Study Area
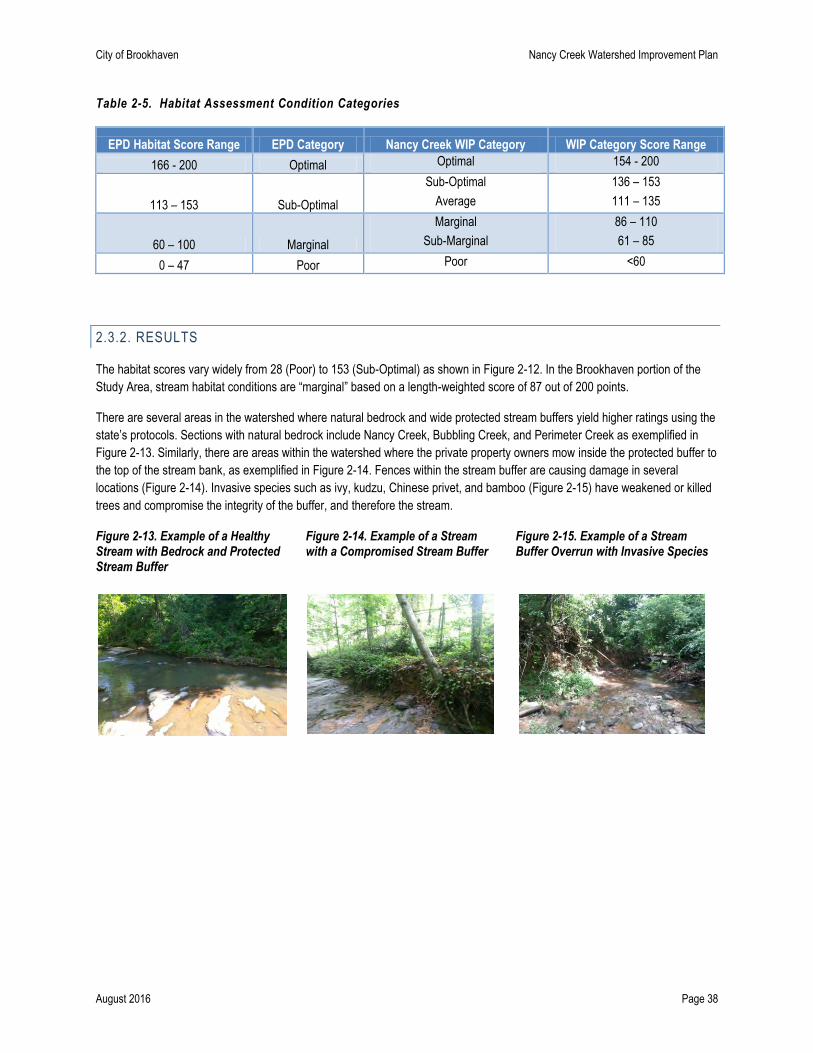
City of Brookhaven Nancy Creek Watershed Improvement Plan
August 2016 Page 38
Table 2-5. Habitat Assessment Condition Categories
EPD Habitat Score Range EPD Category Nancy Creek WIP Category WIP Category Score Range
166 - 200 Optimal Optimal 154 - 200
113 – 153 Sub-Optimal
Sub-Optimal
Average
136 – 153
111 – 135
60 – 100 Marginal
Marginal
Sub-Marginal
86 – 110
61 – 85
0 – 47 Poor Poor <60
2.3.2. RESULTS
The habitat scores vary widely from 28 (Poor) to 153 (Sub-Optimal) as shown in Figure 2-12. In the Brookhaven portion of the
Study Area, stream habitat conditions are “marginal” based on a length-weighted score of 87 out of 200 points.
There are several areas in the watershed where natural bedrock and wide protected stream buffers yield higher ratings using the
state’s protocols. Sections with natural bedrock include Nancy Creek, Bubbling Creek, and Perimeter Creek as exemplified in
Figure 2-13. Similarly, there are areas within the watershed where the private property owners mow inside the protected buffer to
the top of the stream bank, as exemplified in Figure 2-14. Fences within the stream buffer are causing damage in several
locations (Figure 2-14). Invasive species such as ivy, kudzu, Chinese privet, and bamboo (Figure 2-15) have weakened or killed
trees and compromise the integrity of the buffer, and therefore the stream.
Figure 2-13. Example of a Healthy Stream with Bedrock and Protected Stream Buffer
Figure 2-14. Example of a Stream with a Compromised Stream Buffer
Figure 2-15. Example of a Stream Buffer Overrun with Invasive Species
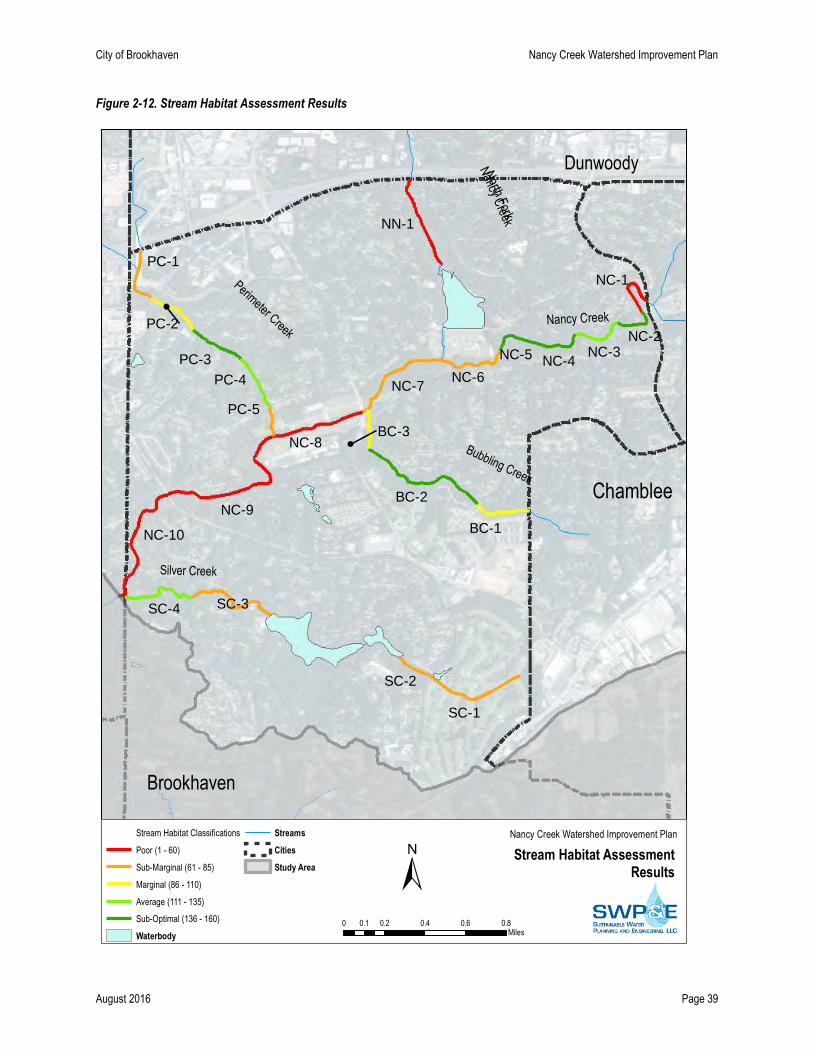
City of Brookhaven Nancy Creek Watershed Improvement Plan
August 2016 Page 39
Figure 2-12. Stream Habitat Assessment Results
Brookhaven
Perimeter Creek
Bubbling Creek
Dunwoody
Silver Creek
ChambleeNC-9
NC-8
BC-2
SC-1
SC-3
NC-7
NN-1
NC-10
SC-4
NC-6
NC-5
PC-2
PC-4
NC-1
BC-1
PC-3NC-3
NC-2
BC-3
SC-2
NC-4
PC-5
PC-1
Nancy CreekN
orth Fork
Nancy C
reek
Source: Esri, DigitalGlobe, GeoEye, i-cubed, Earthstar Geographics,
CNES/Airbus DS, USDA, USGS, AEX, Getmapping, Aerogrid, IGN, IGP,swisstopo, and the GIS User Community
Stream Habitat AssessmentResults
Nancy Creek Watershed Improvement Plan
±0 0.2 0.4 0.6 0.80.1
Miles
Stream Habitat Classifications
Poor (1 - 60)
Sub-Marginal (61 - 85)
Marginal (86 - 110)
Average (111 - 135)
Sub-Optimal (136 - 160)
Waterbody
Streams
Cities
Study Area
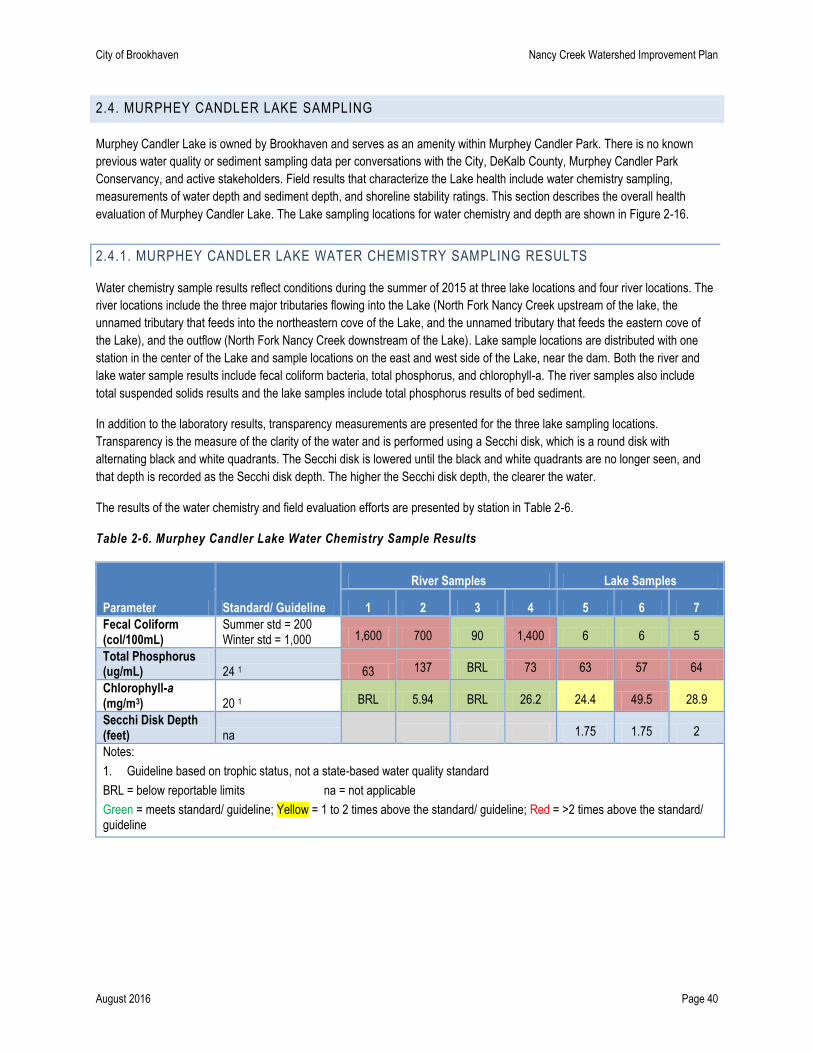
City of Brookhaven Nancy Creek Watershed Improvement Plan
August 2016 Page 40
2.4. MURPHEY CANDLER LAKE SAMPLING
Murphey Candler Lake is owned by Brookhaven and serves as an amenity within Murphey Candler Park. There is no known
previous water quality or sediment sampling data per conversations with the City, DeKalb County, Murphey Candler Park
Conservancy, and active stakeholders. Field results that characterize the Lake health include water chemistry sampling,
measurements of water depth and sediment depth, and shoreline stability ratings. This section describes the overall health
evaluation of Murphey Candler Lake. The Lake sampling locations for water chemistry and depth are shown in Figure 2-16.
2.4.1. MURPHEY CANDLER LAKE WATER CHEMISTRY SAMPLING RESULTS
Water chemistry sample results reflect conditions during the summer of 2015 at three lake locations and four river locations. The
river locations include the three major tributaries flowing into the Lake (North Fork Nancy Creek upstream of the lake, the
unnamed tributary that feeds into the northeastern cove of the Lake, and the unnamed tributary that feeds the eastern cove of
the Lake), and the outflow (North Fork Nancy Creek downstream of the Lake). Lake sample locations are distributed with one
station in the center of the Lake and sample locations on the east and west side of the Lake, near the dam. Both the river and
lake water sample results include fecal coliform bacteria, total phosphorus, and chlorophyll-a. The river samples also include
total suspended solids results and the lake samples include total phosphorus results of bed sediment.
In addition to the laboratory results, transparency measurements are presented for the three lake sampling locations.
Transparency is the measure of the clarity of the water and is performed using a Secchi disk, which is a round disk with
alternating black and white quadrants. The Secchi disk is lowered until the black and white quadrants are no longer seen, and
that depth is recorded as the Secchi disk depth. The higher the Secchi disk depth, the clearer the water.
The results of the water chemistry and field evaluation efforts are presented by station in Table 2-6.
Table 2-6. Murphey Candler Lake Water Chemistry Sample Results
Parameter Standard/ Guideline
River Samples Lake Samples
1 2 3 4 5 6 7
Fecal Coliform (col/100mL)
Summer std = 200 Winter std = 1,000 1,600 700 90 1,400 6 6 5
Total Phosphorus (ug/mL) 24 1 63 137 BRL 73 63 57 64
Chlorophyll-a (mg/m3) 20 1 BRL 5.94 BRL 26.2 24.4 49.5 28.9
Secchi Disk Depth (feet) na
1.75 1.75 2
Notes:
1. Guideline based on trophic status, not a state-based water quality standard
BRL = below reportable limits na = not applicable
Green = meets standard/ guideline; Yellow = 1 to 2 times above the standard/ guideline; Red = >2 times above the standard/ guideline
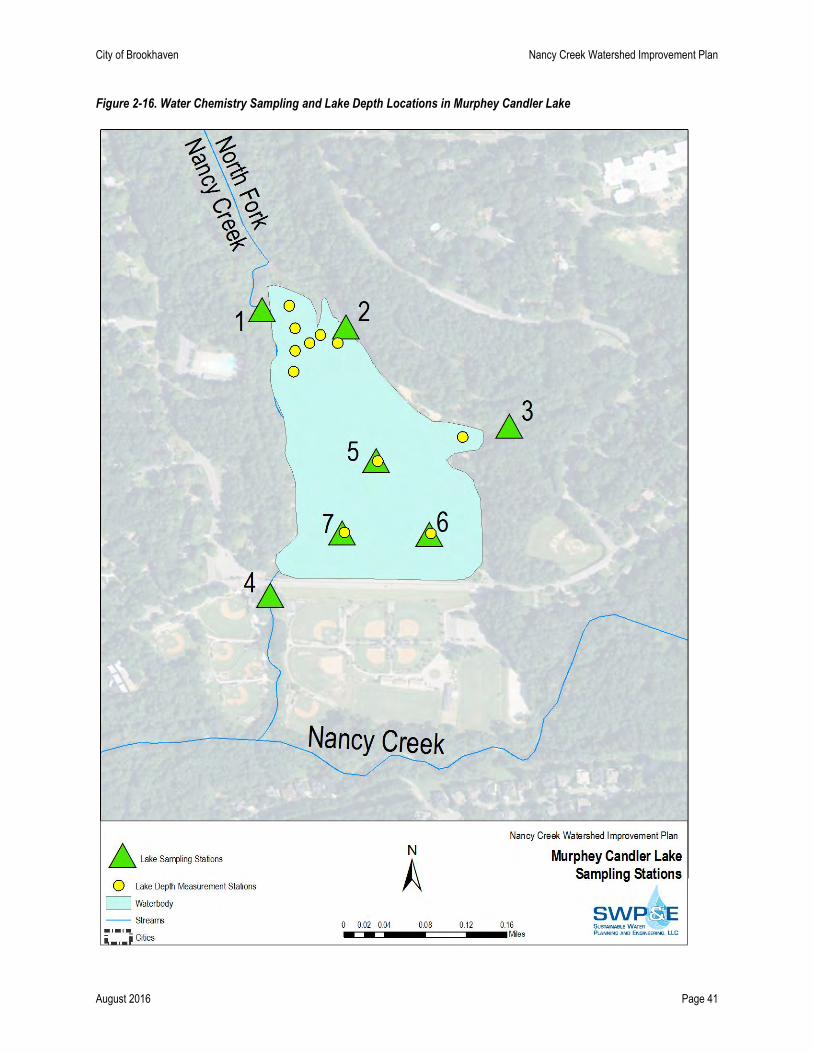
City of Brookhaven Nancy Creek Watershed Improvement Plan
August 2016 Page 41
Figure 2-16. Water Chemistry Sampling and Lake Depth Locations in Murphey Candler Lake
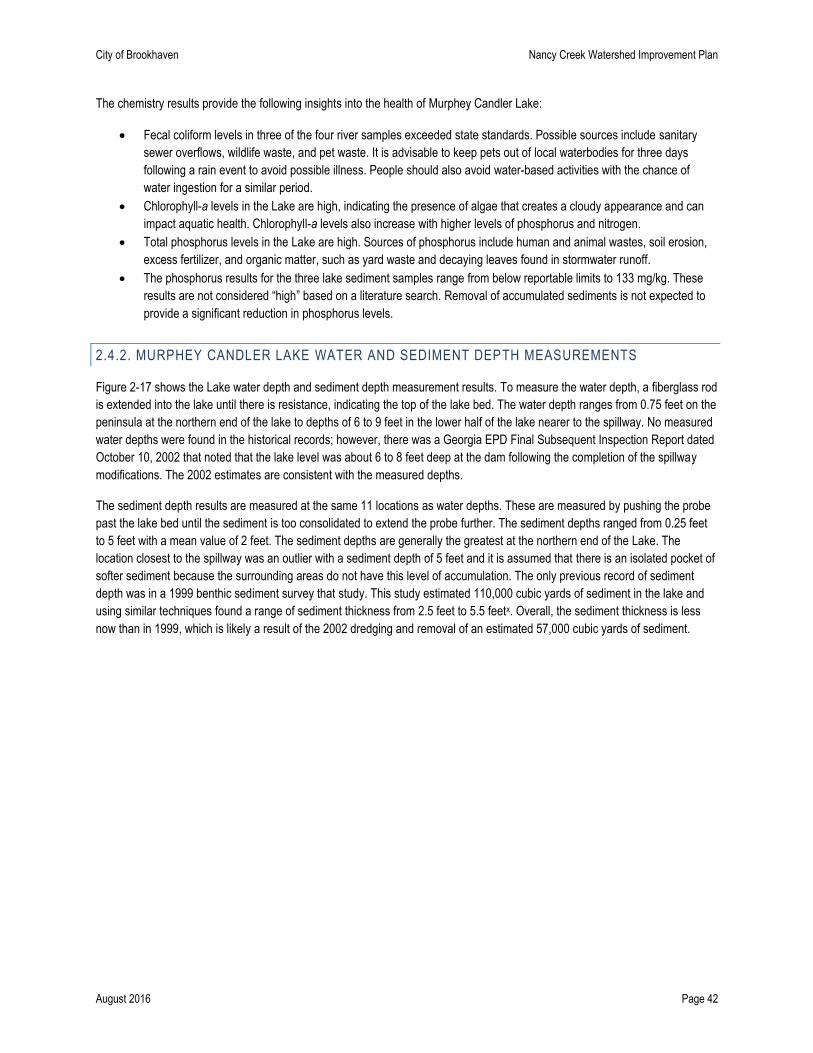
City of Brookhaven Nancy Creek Watershed Improvement Plan
August 2016 Page 42
The chemistry results provide the following insights into the health of Murphey Candler Lake:
Fecal coliform levels in three of the four river samples exceeded state standards. Possible sources include sanitary
sewer overflows, wildlife waste, and pet waste. It is advisable to keep pets out of local waterbodies for three days
following a rain event to avoid possible illness. People should also avoid water-based activities with the chance of
water ingestion for a similar period.
Chlorophyll-a levels in the Lake are high, indicating the presence of algae that creates a cloudy appearance and can
impact aquatic health. Chlorophyll-a levels also increase with higher levels of phosphorus and nitrogen.
Total phosphorus levels in the Lake are high. Sources of phosphorus include human and animal wastes, soil erosion,
excess fertilizer, and organic matter, such as yard waste and decaying leaves found in stormwater runoff.
The phosphorus results for the three lake sediment samples range from below reportable limits to 133 mg/kg. These
results are not considered “high” based on a literature search. Removal of accumulated sediments is not expected to
provide a significant reduction in phosphorus levels.
2.4.2. MURPHEY CANDLER LAKE WATER AND SEDIMENT DEPTH MEASUREMENTS
Figure 2-17 shows the Lake water depth and sediment depth measurement results. To measure the water depth, a fiberglass rod
is extended into the lake until there is resistance, indicating the top of the lake bed. The water depth ranges from 0.75 feet on the
peninsula at the northern end of the lake to depths of 6 to 9 feet in the lower half of the lake nearer to the spillway. No measured
water depths were found in the historical records; however, there was a Georgia EPD Final Subsequent Inspection Report dated
October 10, 2002 that noted that the lake level was about 6 to 8 feet deep at the dam following the completion of the spillway
modifications. The 2002 estimates are consistent with the measured depths.
The sediment depth results are measured at the same 11 locations as water depths. These are measured by pushing the probe
past the lake bed until the sediment is too consolidated to extend the probe further. The sediment depths ranged from 0.25 feet
to 5 feet with a mean value of 2 feet. The sediment depths are generally the greatest at the northern end of the Lake. The
location closest to the spillway was an outlier with a sediment depth of 5 feet and it is assumed that there is an isolated pocket of
softer sediment because the surrounding areas do not have this level of accumulation. The only previous record of sediment
depth was in a 1999 benthic sediment survey that study. This study estimated 110,000 cubic yards of sediment in the lake and
using similar techniques found a range of sediment thickness from 2.5 feet to 5.5 feetx. Overall, the sediment thickness is less
now than in 1999, which is likely a result of the 2002 dredging and removal of an estimated 57,000 cubic yards of sediment.
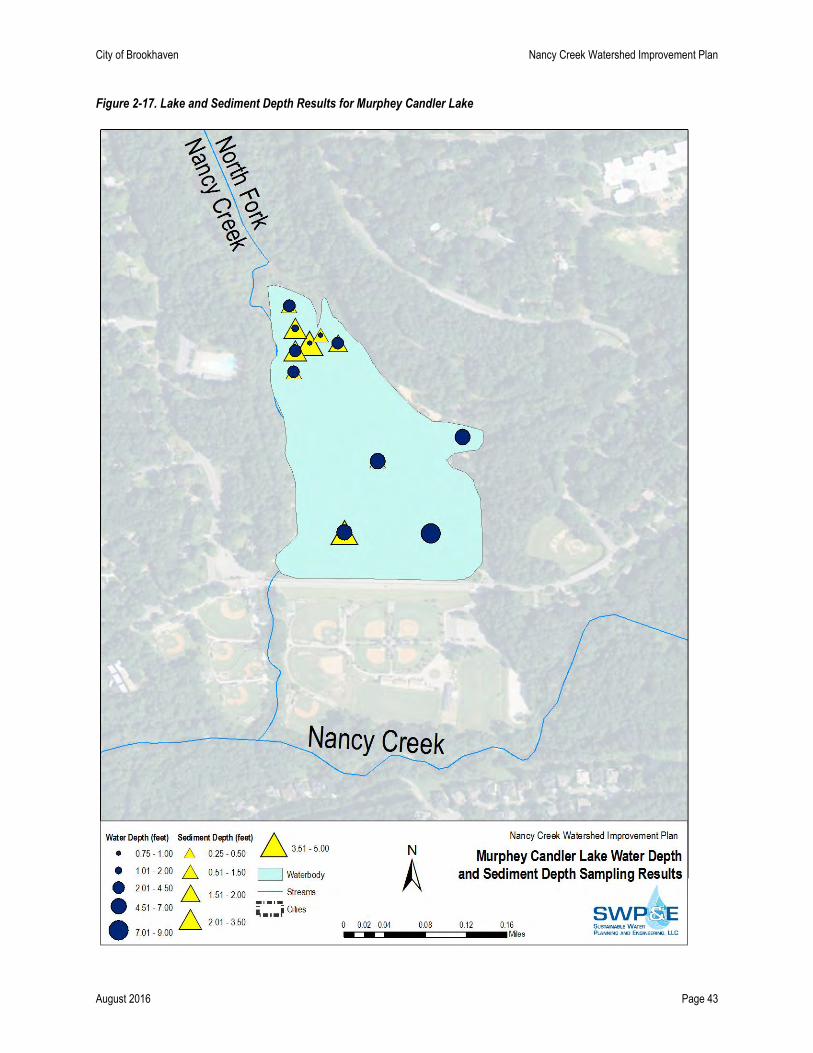
City of Brookhaven Nancy Creek Watershed Improvement Plan
August 2016 Page 43
Figure 2-17. Lake and Sediment Depth Results for Murphey Candler Lake
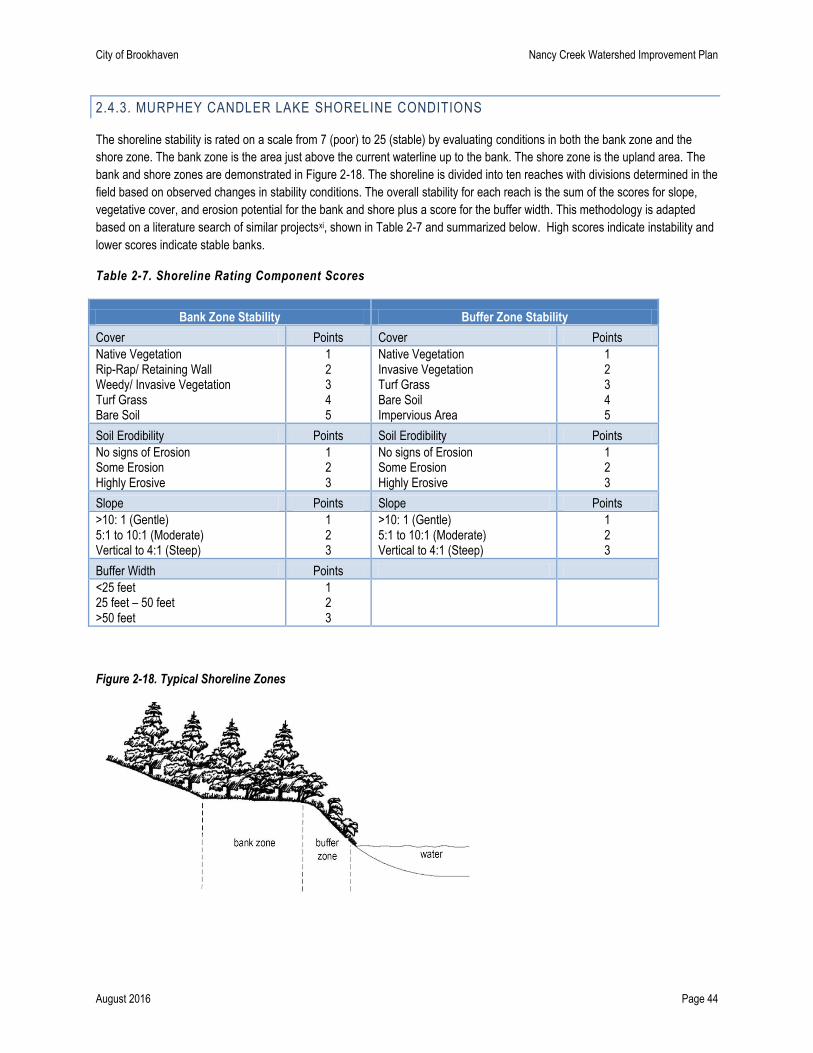
City of Brookhaven Nancy Creek Watershed Improvement Plan
August 2016 Page 44
2.4.3. MURPHEY CANDLER LAKE SHORELINE CONDITIONS
The shoreline stability is rated on a scale from 7 (poor) to 25 (stable) by evaluating conditions in both the bank zone and the
shore zone. The bank zone is the area just above the current waterline up to the bank. The shore zone is the upland area. The
bank and shore zones are demonstrated in Figure 2-18. The shoreline is divided into ten reaches with divisions determined in the
field based on observed changes in stability conditions. The overall stability for each reach is the sum of the scores for slope,
vegetative cover, and erosion potential for the bank and shore plus a score for the buffer width. This methodology is adapted
based on a literature search of similar projectsxi, shown in Table 2-7 and summarized below. High scores indicate instability and
lower scores indicate stable banks.
Table 2-7. Shoreline Rating Component Scores
Bank Zone Stability Buffer Zone Stability
Cover Points Cover Points
Native Vegetation Rip-Rap/ Retaining Wall Weedy/ Invasive Vegetation Turf Grass Bare Soil
1 2 3 4 5
Native Vegetation Invasive Vegetation Turf Grass Bare Soil Impervious Area
1 2 3 4 5
Soil Erodibility Points Soil Erodibility Points
No signs of Erosion Some Erosion Highly Erosive
1 2 3
No signs of Erosion Some Erosion Highly Erosive
1 2 3
Slope Points Slope Points
>10: 1 (Gentle) 5:1 to 10:1 (Moderate) Vertical to 4:1 (Steep)
1 2 3
>10: 1 (Gentle) 5:1 to 10:1 (Moderate) Vertical to 4:1 (Steep)
1 2 3
Buffer Width Points
<25 feet 25 feet – 50 feet >50 feet
1 2 3
Figure 2-18. Typical Shoreline Zones
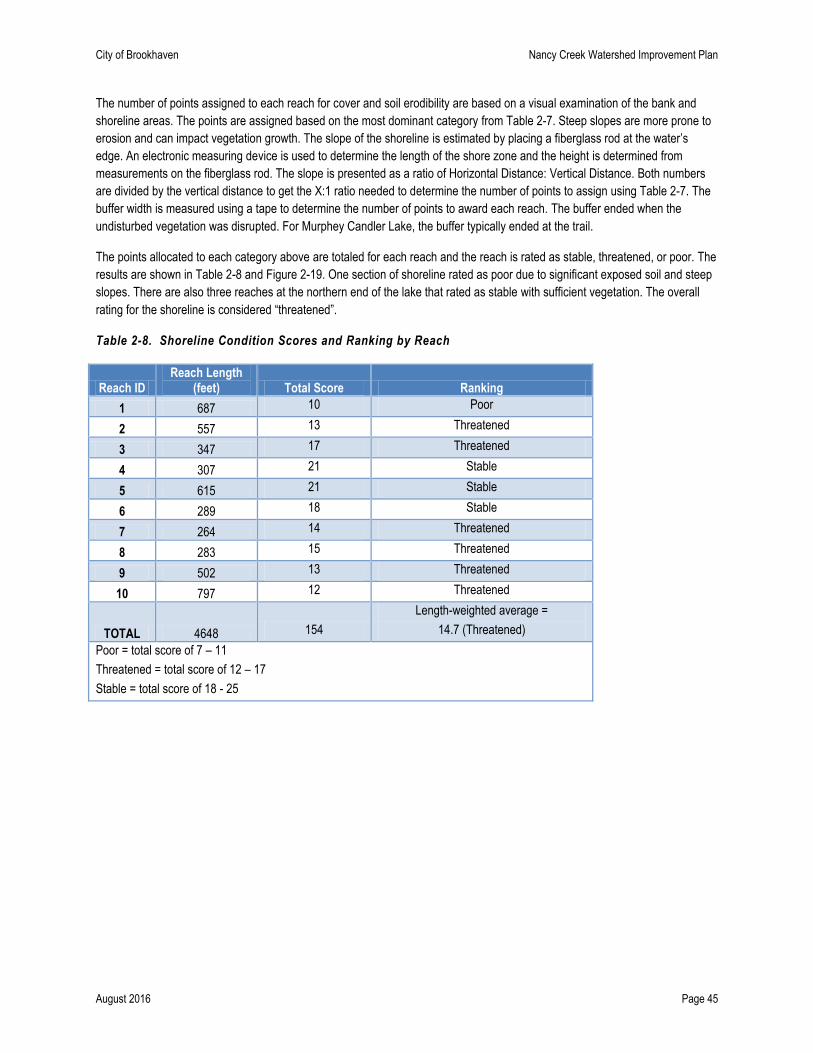
City of Brookhaven Nancy Creek Watershed Improvement Plan
August 2016 Page 45
The number of points assigned to each reach for cover and soil erodibility are based on a visual examination of the bank and
shoreline areas. The points are assigned based on the most dominant category from Table 2-7. Steep slopes are more prone to
erosion and can impact vegetation growth. The slope of the shoreline is estimated by placing a fiberglass rod at the water’s
edge. An electronic measuring device is used to determine the length of the shore zone and the height is determined from
measurements on the fiberglass rod. The slope is presented as a ratio of Horizontal Distance: Vertical Distance. Both numbers
are divided by the vertical distance to get the X:1 ratio needed to determine the number of points to assign using Table 2-7. The
buffer width is measured using a tape to determine the number of points to award each reach. The buffer ended when the
undisturbed vegetation was disrupted. For Murphey Candler Lake, the buffer typically ended at the trail.
The points allocated to each category above are totaled for each reach and the reach is rated as stable, threatened, or poor. The
results are shown in Table 2-8 and Figure 2-19. One section of shoreline rated as poor due to significant exposed soil and steep
slopes. There are also three reaches at the northern end of the lake that rated as stable with sufficient vegetation. The overall
rating for the shoreline is considered “threatened”.
Table 2-8. Shoreline Condition Scores and Ranking by Reach
Reach ID Reach Length
(feet) Total Score Ranking
1 687 10 Poor
2 557 13 Threatened
3 347 17 Threatened
4 307 21 Stable
5 615 21 Stable
6 289 18 Stable
7 264 14 Threatened
8 283 15 Threatened
9 502 13 Threatened
10 797 12 Threatened
TOTAL 4648 154
Length-weighted average =
14.7 (Threatened)
Poor = total score of 7 – 11
Threatened = total score of 12 – 17
Stable = total score of 18 - 25
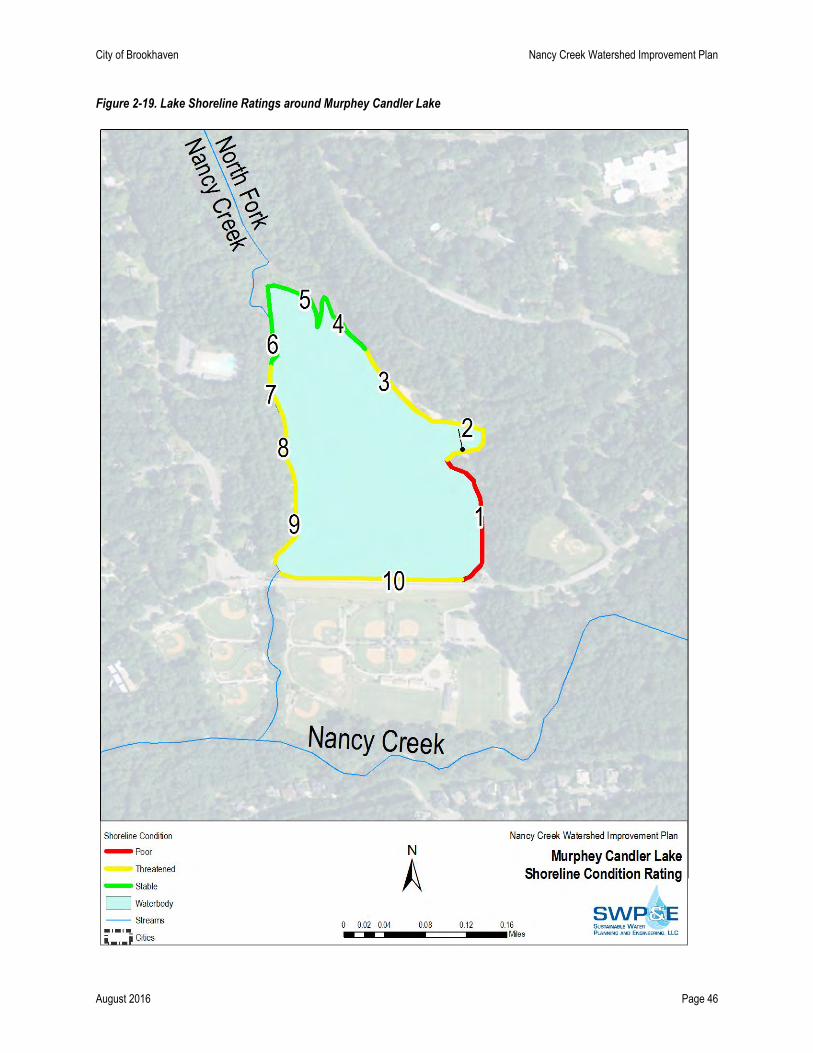
City of Brookhaven Nancy Creek Watershed Improvement Plan
August 2016 Page 46
Figure 2-19. Lake Shoreline Ratings around Murphey Candler Lake
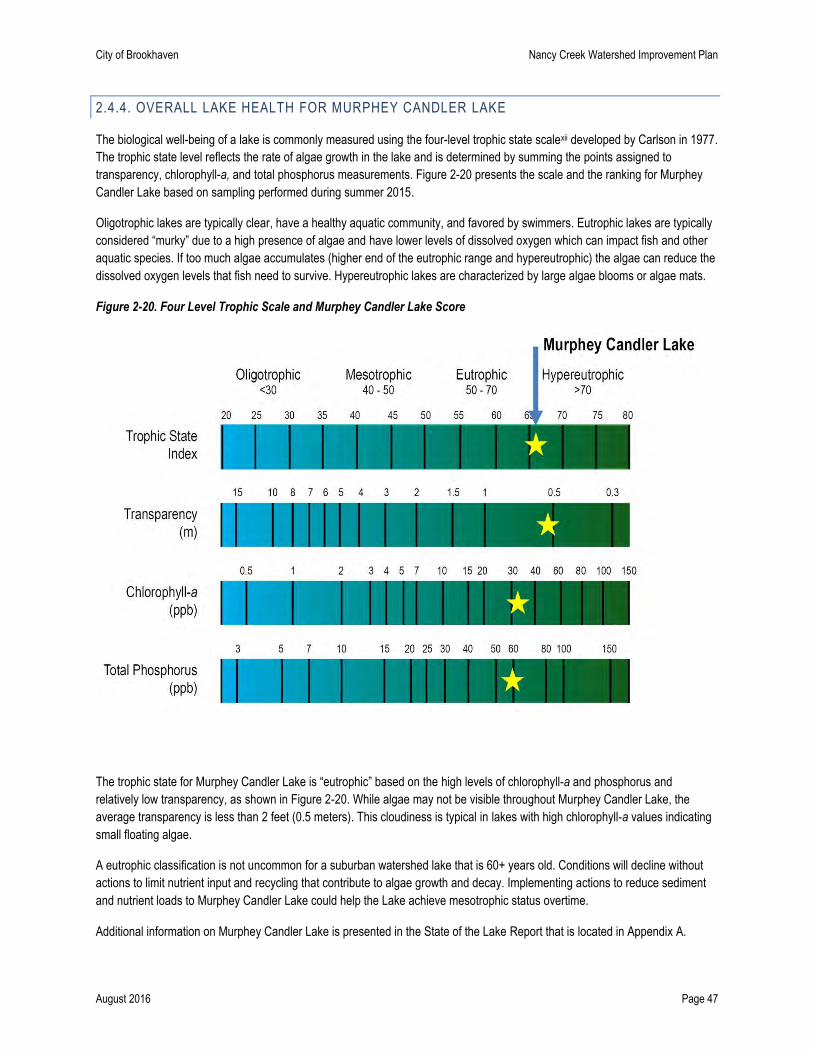
City of Brookhaven Nancy Creek Watershed Improvement Plan
August 2016 Page 47
2.4.4. OVERALL LAKE HEALTH FOR MURPHEY CANDLER LAKE
The biological well-being of a lake is commonly measured using the four-level trophic state scalexii developed by Carlson in 1977.
The trophic state level reflects the rate of algae growth in the lake and is determined by summing the points assigned to
transparency, chlorophyll-a, and total phosphorus measurements. Figure 2-20 presents the scale and the ranking for Murphey
Candler Lake based on sampling performed during summer 2015.
Oligotrophic lakes are typically clear, have a healthy aquatic community, and favored by swimmers. Eutrophic lakes are typically
considered “murky” due to a high presence of algae and have lower levels of dissolved oxygen which can impact fish and other
aquatic species. If too much algae accumulates (higher end of the eutrophic range and hypereutrophic) the algae can reduce the
dissolved oxygen levels that fish need to survive. Hypereutrophic lakes are characterized by large algae blooms or algae mats.
Figure 2-20. Four Level Trophic Scale and Murphey Candler Lake Score
The trophic state for Murphey Candler Lake is “eutrophic” based on the high levels of chlorophyll-a and phosphorus and
relatively low transparency, as shown in Figure 2-20. While algae may not be visible throughout Murphey Candler Lake, the
average transparency is less than 2 feet (0.5 meters). This cloudiness is typical in lakes with high chlorophyll-a values indicating
small floating algae.
A eutrophic classification is not uncommon for a suburban watershed lake that is 60+ years old. Conditions will decline without
actions to limit nutrient input and recycling that contribute to algae growth and decay. Implementing actions to reduce sediment
and nutrient loads to Murphey Candler Lake could help the Lake achieve mesotrophic status overtime.
Additional information on Murphey Candler Lake is presented in the State of the Lake Report that is located in Appendix A.
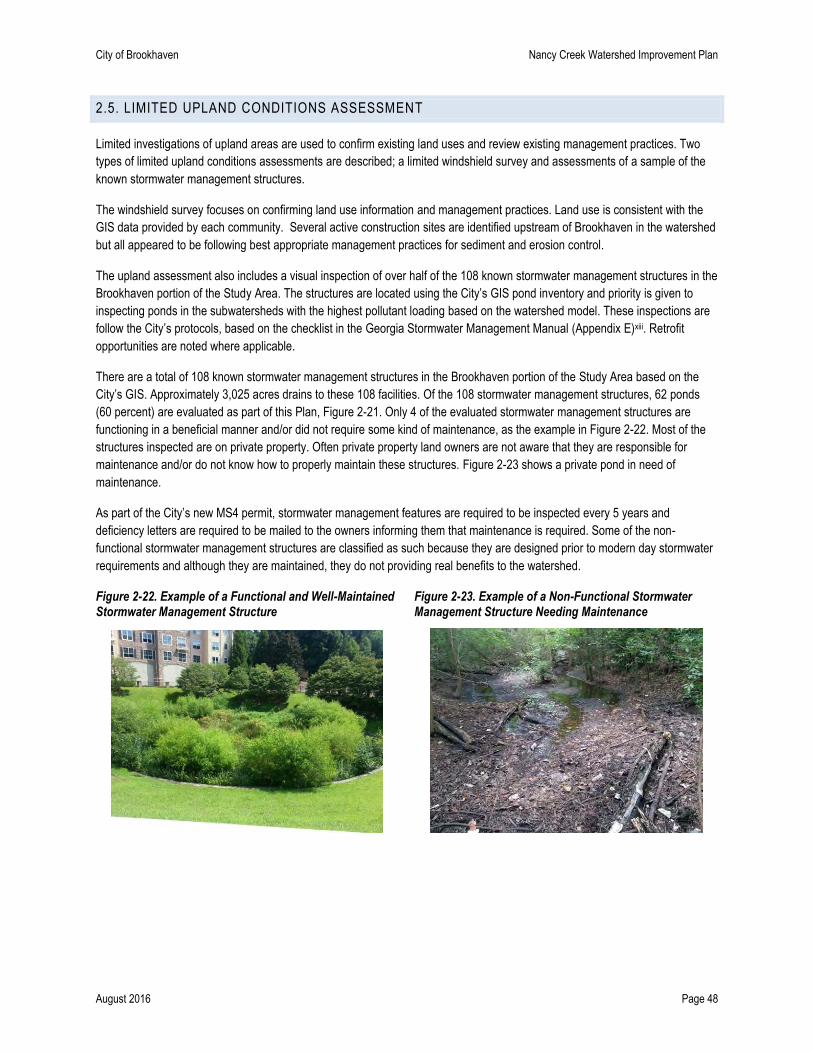
City of Brookhaven Nancy Creek Watershed Improvement Plan
August 2016 Page 48
2.5. LIMITED UPLAND CONDITIONS ASSESSMENT
Limited investigations of upland areas are used to confirm existing land uses and review existing management practices. Two
types of limited upland conditions assessments are described; a limited windshield survey and assessments of a sample of the
known stormwater management structures.
The windshield survey focuses on confirming land use information and management practices. Land use is consistent with the
GIS data provided by each community. Several active construction sites are identified upstream of Brookhaven in the watershed
but all appeared to be following best appropriate management practices for sediment and erosion control.
The upland assessment also includes a visual inspection of over half of the 108 known stormwater management structures in the
Brookhaven portion of the Study Area. The structures are located using the City’s GIS pond inventory and priority is given to
inspecting ponds in the subwatersheds with the highest pollutant loading based on the watershed model. These inspections are
follow the City’s protocols, based on the checklist in the Georgia Stormwater Management Manual (Appendix E)xiii. Retrofit
opportunities are noted where applicable.
There are a total of 108 known stormwater management structures in the Brookhaven portion of the Study Area based on the
City’s GIS. Approximately 3,025 acres drains to these 108 facilities. Of the 108 stormwater management structures, 62 ponds
(60 percent) are evaluated as part of this Plan, Figure 2-21. Only 4 of the evaluated stormwater management structures are
functioning in a beneficial manner and/or did not require some kind of maintenance, as the example in Figure 2-22. Most of the
structures inspected are on private property. Often private property land owners are not aware that they are responsible for
maintenance and/or do not know how to properly maintain these structures. Figure 2-23 shows a private pond in need of
maintenance.
As part of the City’s new MS4 permit, stormwater management features are required to be inspected every 5 years and
deficiency letters are required to be mailed to the owners informing them that maintenance is required. Some of the non-
functional stormwater management structures are classified as such because they are designed prior to modern day stormwater
requirements and although they are maintained, they do not providing real benefits to the watershed.
Figure 2-22. Example of a Functional and Well-Maintained Stormwater Management Structure
Figure 2-23. Example of a Non-Functional Stormwater Management Structure Needing Maintenance

City of Brookhaven Nancy Creek Watershed Improvement Plan
August 2016 Page 49
Figure 2-21. Known Stormwater Management Structures
Brookhaven
Perimeter Creek
Bubbling Creek
Dunwoody
Silver Creek
Chamblee
Nancy CreekN
orth Fork
Nancy C
reek
Source: Esri, DigitalGlobe, GeoEye, i-cubed, Earthstar Geographics,
CNES/Airbus DS, USDA, USGS, AEX, Getmapping, Aerogrid, IGN, IGP,swisstopo, and the GIS User Community
Known Stormwater ManagementStructures in the Study Area
Nancy Creek Watershed Improvement Plan
±0 0.2 0.4 0.6 0.80.1
Miles
Structure Evaluated
No
Yes
Waterbody
Streams
Cities
Study Area
City of Brookhaven Nancy Creek Watershed Improvement Plan
August 2016 Page 50
2.6. SUMMARY OF FINDINGS
There are known fecal coliform bacteria challenges on Nancy Creek and Bubbling Creek. The exceedances appear to
be connected to the aging sanitary sewer system but pet wastes and urban wildlife are other possible sources.
Murphey Candler Lake is considered “eutrophic” due to relatively high concentrations of chlorophyll-a. Streambank
erosion from upgradient streams and sedimentation in the Lake is one source of nutrients that can result in these
higher concentrations. Shoreline stability is considered threatened. There is interest in restoring the shoreline which
was reportedly left exposed after the Lake was dredged and the spillway modified, lowering the water level in 2002.
The overall impervious area in the Study Area is 38 percent. Studies show that watersheds with impervious area
greater than 25 percent have degraded habitat conditions. The overall stream habitat condition in the City limits rates
“marginal”, consistent with the relatively high percentage of impervious area. Additional stormwater controls will be
needed to improve the watershed conditions.
There are only 108 stormwater management features within the Brookhaven portion of the watershed draining an area
of approximately 3,025 acres. Since most of these features are intended to serve drainage areas less than 1 acre,
much of land area is uncontrolled. In a developed watershed, like Nancy Creek, there are relatively few opportunities
for larger stormwater management features which means that a larger number of smaller features will be needed.
The baseline conditions watershed model shows that the pollutant loading is generally higher than that of a typical
medium-density residential “reference” watershed. This is likely because there are more intense land uses
(commercial, industrial, and roadway) and few stormwater management features in the Study Area.

City of Brookhaven Nancy Creek Watershed Improvement Plan
August 2016 Page 51
CHAPTER 3. WATERSHED IMPROVEMENT PROJECTS AND PROGRAMS
This Chapter identifies the projects, additional studies, programs, and policies that contribute to meeting the Plan’s goals for the
Study Area. The methodology for selecting projects is presented followed by a list of recommended projects by project type. This
chapter also reviews the model used to evaluate the benefits associated with each recommended projects and then identify the
additional assessments recommended to further progress toward the Plan goals. Finally, this section recommends
enhancements to the City’s existing programs and policies.
The projects recommended in this Chapter are presented in a recommended implementation order with planning level
implementation costs in Chapter 4. Individual project sheets with pictures and location maps are presented in Appendix B and
Appendix C summarizes the conditions in each subwatershed and lists the projects and studies recommended within that
subwatershed.
3.1. WATERSHED IMPROVEMENT GOALS
This section explains the method for measuring and quantifying the extent to which each recommended project supports the four
Plan goals.
Goal #1: Meet state water quality standards
Meeting state water quality standards is an important goal for this Plan and currently streams exceed the state regulations for
fecal coliform bacteria and fish biota. The review of historical sampling data (Chapter 2.1) shows extremely high levels of fecal
coliform bacteria (greater than 60 times the winter standard). Fecal coliform bacteria levels that high are more commonly
associated with sanitary sewer issues versus domestic or wildlife animal contributions. The DeKalb County Watershed
Management Department is currently under a consent order with EPD and EPA to address sanitary sewer overflows. Based on
the ongoing efforts by the DeKalb County Watershed Management Department to address fecal coliform bacteria contributions
from the sanitary sewer system; this Plan focuses on the fish biota water quality concerns (TSS levels). If fecal coliform levels
remain high after sanitary sewer upgrades are completed, additional investigations of other sources and subsequent projects
may be needed to meet state fecal coliform bacteria standards.
The state’s biota TMDL for the Nancy Creek watershed notes that a 35 percent reduction in TSS is needed to meet state’s biota
standards (Chapter 1.4.2). Projects that reduce the TSS load and contribute toward the 35 percent reduction support this goal.
The future conditions watershed model (described in Chapter 3.4) assesses whether the recommended projects are sufficient to
meet the Plan goal or whether additional reductions are needed. The future conditions watershed model also quantifies the
relative TSS reduction anticipated from each recommended project.
In addition to the state’s numeric water quality standards, the Georgia Water Use Classifications and Water Quality Standards
Rules include subjective requirements. One of these requirements states that water should be free from “floating debris” to the
extent that the debris would “interfere with legitimate water uses”xiv. The accumulation of trash and floating debris in Murphey
Candler Lake is viewed as a violation of this standard, even though the impairment is not on the state’s impaired waters list.
Therefore, projects that reduce the level of floating debris support this goal.
Goal #2: Restore stream buffers to prevent the loss of soil/ stream buffer
In parts of the Nancy Creek watershed, the natural riparian buffer is limited to turfgrass or invasive species that do not stabilize
the stream banks as much as an undisturbed vegetated buffer. Figure 3-1 illustrates the difference between two sites within the
Study Area: a forested riparian buffer and an impacted riparian buffer. Projects to protect, enhance, or restore the stream buffer
prevent this erosion and sedimentation. The Plan recommends stream improvement projects for each reach of stream with
erosion and/or stream buffer issues based on the 2015 habitat assessments to meet this goal. In addition to supporting this goal,
stream restoration projects also reduce TSS loads contributed from bank erosion (goal #1).
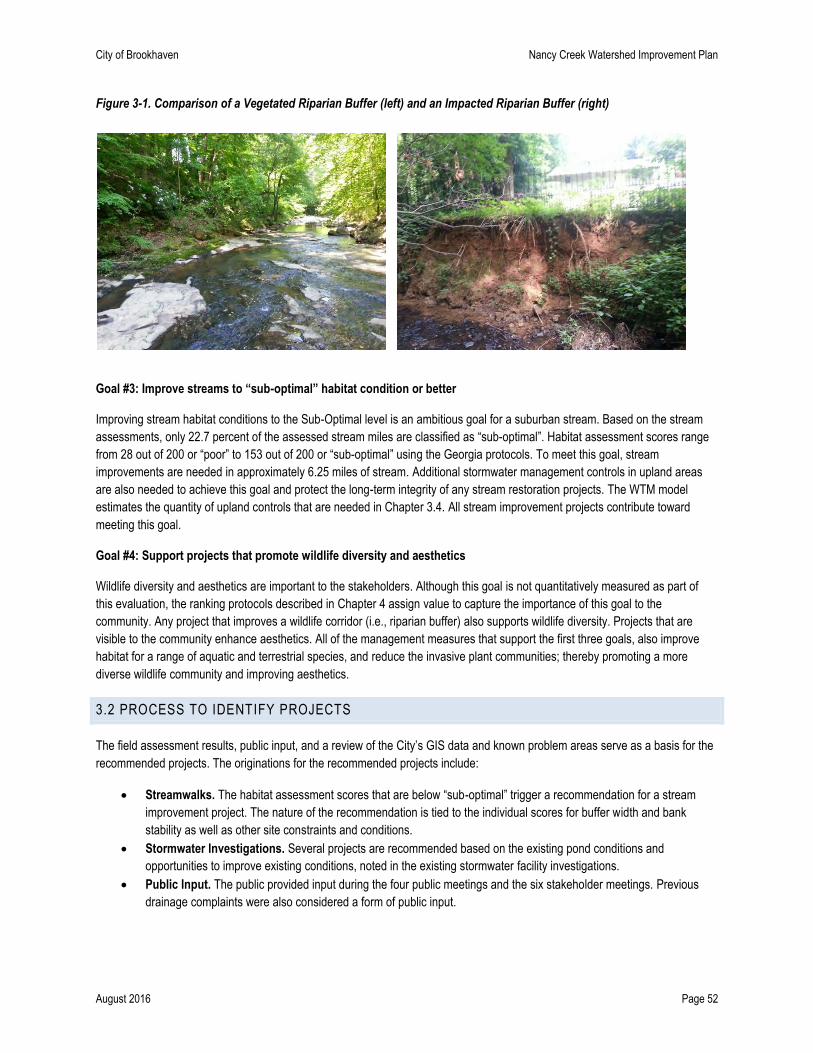
City of Brookhaven Nancy Creek Watershed Improvement Plan
August 2016 Page 52
Figure 3-1. Comparison of a Vegetated Riparian Buffer (left) and an Impacted Riparian Buffer (right)
Goal #3: Improve streams to “sub-optimal” habitat condition or better
Improving stream habitat conditions to the Sub-Optimal level is an ambitious goal for a suburban stream. Based on the stream
assessments, only 22.7 percent of the assessed stream miles are classified as “sub-optimal”. Habitat assessment scores range
from 28 out of 200 or “poor” to 153 out of 200 or “sub-optimal” using the Georgia protocols. To meet this goal, stream
improvements are needed in approximately 6.25 miles of stream. Additional stormwater management controls in upland areas
are also needed to achieve this goal and protect the long-term integrity of any stream restoration projects. The WTM model
estimates the quantity of upland controls that are needed in Chapter 3.4. All stream improvement projects contribute toward
meeting this goal.
Goal #4: Support projects that promote wildlife diversity and aesthetics
Wildlife diversity and aesthetics are important to the stakeholders. Although this goal is not quantitatively measured as part of
this evaluation, the ranking protocols described in Chapter 4 assign value to capture the importance of this goal to the
community. Any project that improves a wildlife corridor (i.e., riparian buffer) also supports wildlife diversity. Projects that are
visible to the community enhance aesthetics. All of the management measures that support the first three goals, also improve
habitat for a range of aquatic and terrestrial species, and reduce the invasive plant communities; thereby promoting a more
diverse wildlife community and improving aesthetics.
3.2 PROCESS TO IDENTIFY PROJECTS
The field assessment results, public input, and a review of the City’s GIS data and known problem areas serve as a basis for the
recommended projects. The originations for the recommended projects include:
Streamwalks. The habitat assessment scores that are below “sub-optimal” trigger a recommendation for a stream
improvement project. The nature of the recommendation is tied to the individual scores for buffer width and bank
stability as well as other site constraints and conditions.
Stormwater Investigations. Several projects are recommended based on the existing pond conditions and
opportunities to improve existing conditions, noted in the existing stormwater facility investigations.
Public Input. The public provided input during the four public meetings and the six stakeholder meetings. Previous
drainage complaints were also considered a form of public input.
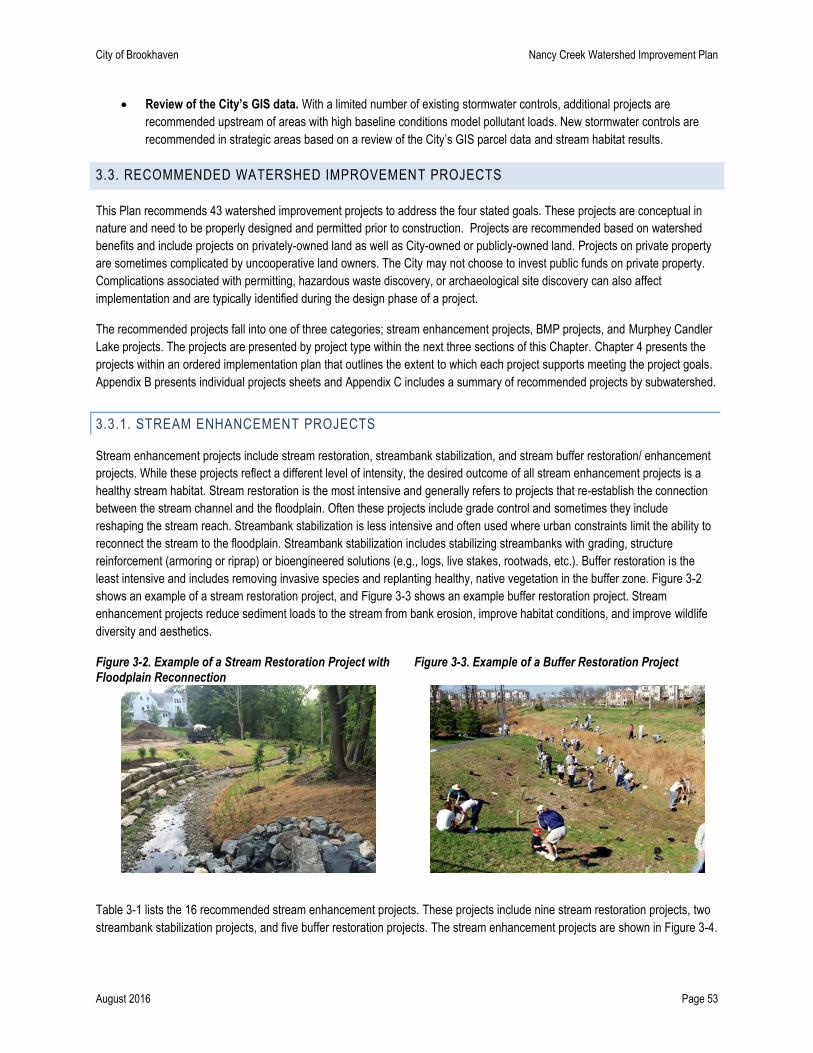
City of Brookhaven Nancy Creek Watershed Improvement Plan
August 2016 Page 53
Review of the City’s GIS data. With a limited number of existing stormwater controls, additional projects are
recommended upstream of areas with high baseline conditions model pollutant loads. New stormwater controls are
recommended in strategic areas based on a review of the City’s GIS parcel data and stream habitat results.
3.3. RECOMMENDED WATERSHED IMPROVEMENT PROJECTS
This Plan recommends 43 watershed improvement projects to address the four stated goals. These projects are conceptual in
nature and need to be properly designed and permitted prior to construction. Projects are recommended based on watershed
benefits and include projects on privately-owned land as well as City-owned or publicly-owned land. Projects on private property
are sometimes complicated by uncooperative land owners. The City may not choose to invest public funds on private property.
Complications associated with permitting, hazardous waste discovery, or archaeological site discovery can also affect
implementation and are typically identified during the design phase of a project.
The recommended projects fall into one of three categories; stream enhancement projects, BMP projects, and Murphey Candler
Lake projects. The projects are presented by project type within the next three sections of this Chapter. Chapter 4 presents the
projects within an ordered implementation plan that outlines the extent to which each project supports meeting the project goals.
Appendix B presents individual projects sheets and Appendix C includes a summary of recommended projects by subwatershed.
3.3.1. STREAM ENHANCEMENT PROJECTS
Stream enhancement projects include stream restoration, streambank stabilization, and stream buffer restoration/ enhancement
projects. While these projects reflect a different level of intensity, the desired outcome of all stream enhancement projects is a
healthy stream habitat. Stream restoration is the most intensive and generally refers to projects that re-establish the connection
between the stream channel and the floodplain. Often these projects include grade control and sometimes they include
reshaping the stream reach. Streambank stabilization is less intensive and often used where urban constraints limit the ability to
reconnect the stream to the floodplain. Streambank stabilization includes stabilizing streambanks with grading, structure
reinforcement (armoring or riprap) or bioengineered solutions (e.g., logs, live stakes, rootwads, etc.). Buffer restoration is the
least intensive and includes removing invasive species and replanting healthy, native vegetation in the buffer zone. Figure 3-2
shows an example of a stream restoration project, and Figure 3-3 shows an example buffer restoration project. Stream
enhancement projects reduce sediment loads to the stream from bank erosion, improve habitat conditions, and improve wildlife
diversity and aesthetics.
Figure 3-2. Example of a Stream Restoration Project with Floodplain Reconnection
Figure 3-3. Example of a Buffer Restoration Project
Table 3-1 lists the 16 recommended stream enhancement projects. These projects include nine stream restoration projects, two
streambank stabilization projects, and five buffer restoration projects. The stream enhancement projects are shown in Figure 3-4.
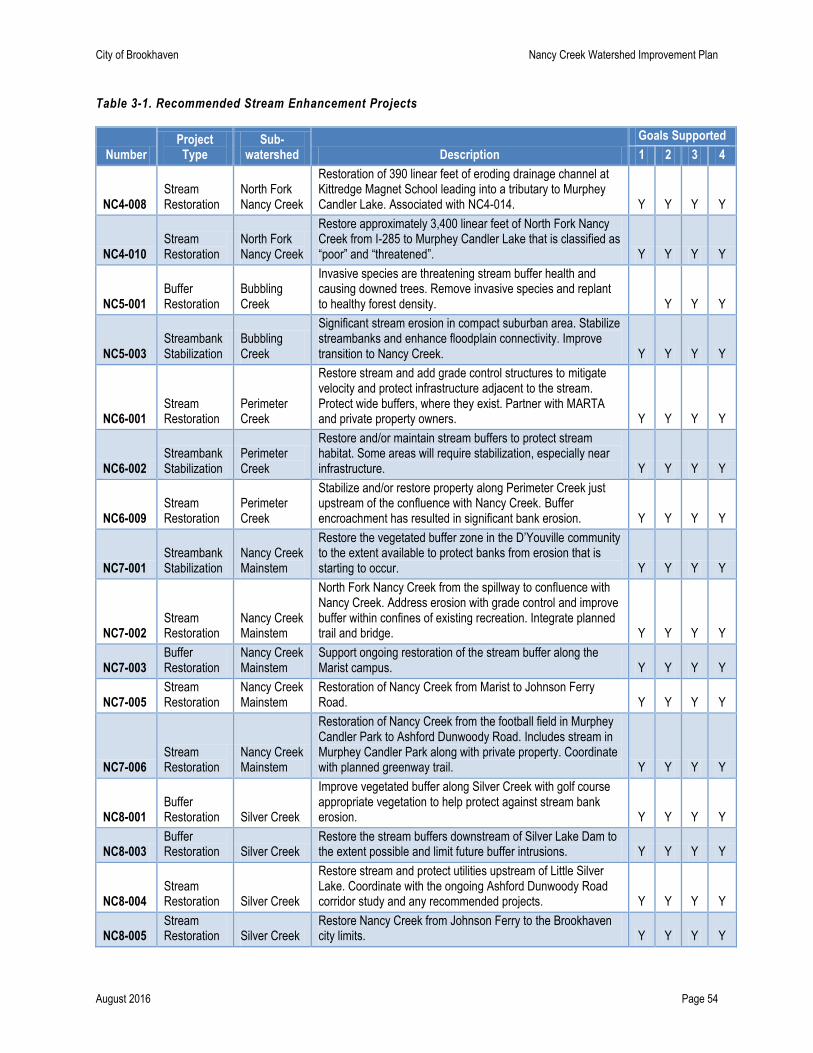
City of Brookhaven Nancy Creek Watershed Improvement Plan
August 2016 Page 54
Table 3-1. Recommended Stream Enhancement Projects
Number Project Type
Sub-watershed Description
Goals Supported
1 2 3 4
NC4-008 Stream Restoration
North Fork Nancy Creek
Restoration of 390 linear feet of eroding drainage channel at Kittredge Magnet School leading into a tributary to Murphey Candler Lake. Associated with NC4-014. Y Y Y Y
NC4-010 Stream Restoration
North Fork Nancy Creek
Restore approximately 3,400 linear feet of North Fork Nancy Creek from I-285 to Murphey Candler Lake that is classified as “poor” and “threatened”. Y Y Y Y
NC5-001 Buffer Restoration
Bubbling Creek
Invasive species are threatening stream buffer health and causing downed trees. Remove invasive species and replant to healthy forest density. Y Y Y
NC5-003 Streambank Stabilization
Bubbling Creek
Significant stream erosion in compact suburban area. Stabilize streambanks and enhance floodplain connectivity. Improve transition to Nancy Creek. Y Y Y Y
NC6-001 Stream Restoration
Perimeter Creek
Restore stream and add grade control structures to mitigate velocity and protect infrastructure adjacent to the stream. Protect wide buffers, where they exist. Partner with MARTA and private property owners. Y Y Y Y
NC6-002 Streambank Stabilization
Perimeter Creek
Restore and/or maintain stream buffers to protect stream habitat. Some areas will require stabilization, especially near infrastructure. Y Y Y Y
NC6-009 Stream Restoration
Perimeter Creek
Stabilize and/or restore property along Perimeter Creek just upstream of the confluence with Nancy Creek. Buffer encroachment has resulted in significant bank erosion. Y Y Y Y
NC7-001 Streambank Stabilization
Nancy Creek Mainstem
Restore the vegetated buffer zone in the D’Youville community to the extent available to protect banks from erosion that is starting to occur. Y Y Y Y
NC7-002 Stream Restoration
Nancy Creek Mainstem
North Fork Nancy Creek from the spillway to confluence with Nancy Creek. Address erosion with grade control and improve buffer within confines of existing recreation. Integrate planned trail and bridge. Y Y Y Y
NC7-003 Buffer Restoration
Nancy Creek Mainstem
Support ongoing restoration of the stream buffer along the Marist campus. Y Y Y Y
NC7-005 Stream Restoration
Nancy Creek Mainstem
Restoration of Nancy Creek from Marist to Johnson Ferry Road. Y Y Y Y
NC7-006 Stream Restoration
Nancy Creek Mainstem
Restoration of Nancy Creek from the football field in Murphey Candler Park to Ashford Dunwoody Road. Includes stream in Murphey Candler Park along with private property. Coordinate with planned greenway trail. Y Y Y Y
NC8-001 Buffer Restoration Silver Creek
Improve vegetated buffer along Silver Creek with golf course appropriate vegetation to help protect against stream bank erosion. Y Y Y Y
NC8-003 Buffer Restoration Silver Creek
Restore the stream buffers downstream of Silver Lake Dam to the extent possible and limit future buffer intrusions. Y Y Y Y
NC8-004 Stream Restoration Silver Creek
Restore stream and protect utilities upstream of Little Silver Lake. Coordinate with the ongoing Ashford Dunwoody Road corridor study and any recommended projects. Y Y Y Y
NC8-005 Stream Restoration Silver Creek
Restore Nancy Creek from Johnson Ferry to the Brookhaven city limits. Y Y Y Y
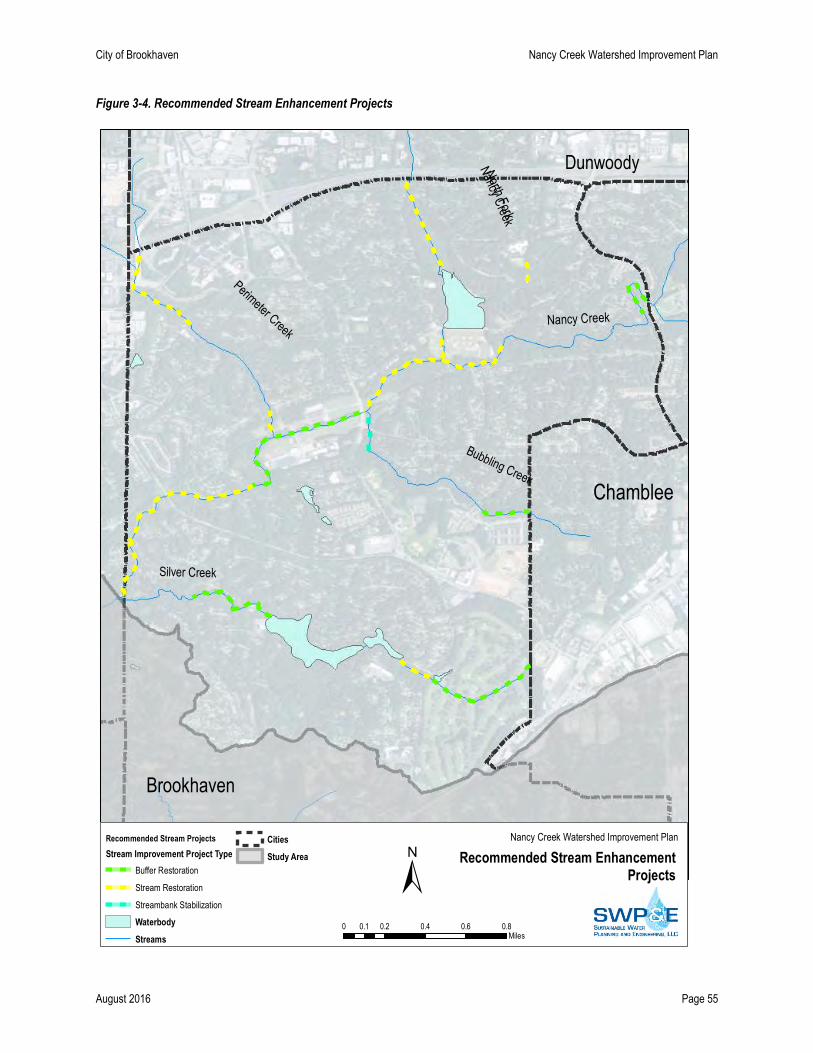
City of Brookhaven Nancy Creek Watershed Improvement Plan
August 2016 Page 55
Figure 3-4. Recommended Stream Enhancement Projects
Brookhaven
Perimeter Creek
Bubbling Creek
Dunwoody
Silver Creek
Chamblee
Nancy CreekN
orth Fork
Nancy C
reek
Source: Esri, DigitalGlobe, GeoEye, i-cubed, Earthstar Geographics,
CNES/Airbus DS, USDA, USGS, AEX, Getmapping, Aerogrid, IGN, IGP,swisstopo, and the GIS User Community
Recommended Stream EnhancementProjects
Nancy Creek Watershed Improvement Plan
±0 0.2 0.4 0.6 0.80.1
Miles
Recommended Stream Projects
Stream Improvement Project Type
Buffer Restoration
Stream Restoration
Streambank Stabilization
Waterbody
Streams
Cities
Study Area
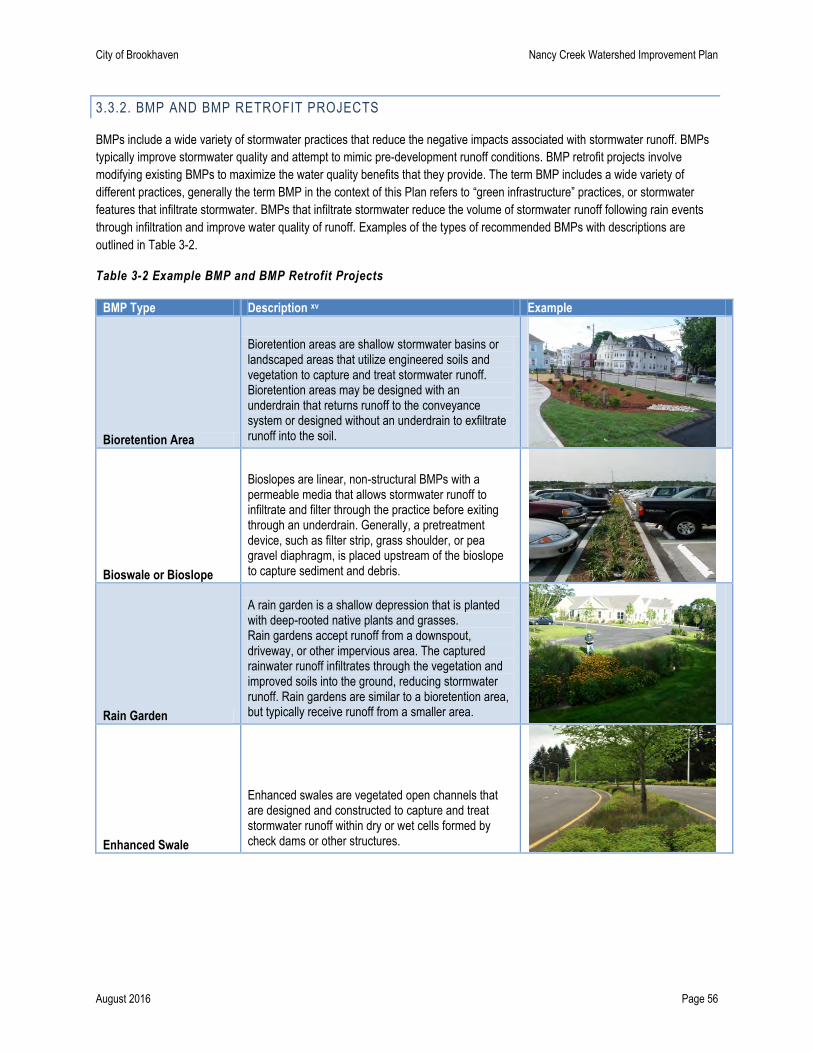
City of Brookhaven Nancy Creek Watershed Improvement Plan
August 2016 Page 56
3.3.2. BMP AND BMP RETROFIT PROJECTS
BMPs include a wide variety of stormwater practices that reduce the negative impacts associated with stormwater runoff. BMPs
typically improve stormwater quality and attempt to mimic pre-development runoff conditions. BMP retrofit projects involve
modifying existing BMPs to maximize the water quality benefits that they provide. The term BMP includes a wide variety of
different practices, generally the term BMP in the context of this Plan refers to “green infrastructure” practices, or stormwater
features that infiltrate stormwater. BMPs that infiltrate stormwater reduce the volume of stormwater runoff following rain events
through infiltration and improve water quality of runoff. Examples of the types of recommended BMPs with descriptions are
outlined in Table 3-2.
Table 3-2 Example BMP and BMP Retrofit Projects
BMP Type Description xv Example
Bioretention Area
Bioretention areas are shallow stormwater basins or landscaped areas that utilize engineered soils and vegetation to capture and treat stormwater runoff. Bioretention areas may be designed with an underdrain that returns runoff to the conveyance system or designed without an underdrain to exfiltrate runoff into the soil.
Bioswale or Bioslope
Bioslopes are linear, non-structural BMPs with a permeable media that allows stormwater runoff to infiltrate and filter through the practice before exiting through an underdrain. Generally, a pretreatment device, such as filter strip, grass shoulder, or pea gravel diaphragm, is placed upstream of the bioslope to capture sediment and debris.
Rain Garden
A rain garden is a shallow depression that is planted with deep-rooted native plants and grasses. Rain gardens accept runoff from a downspout, driveway, or other impervious area. The captured rainwater runoff infiltrates through the vegetation and improved soils into the ground, reducing stormwater runoff. Rain gardens are similar to a bioretention area, but typically receive runoff from a smaller area.
Enhanced Swale
Enhanced swales are vegetated open channels that are designed and constructed to capture and treat stormwater runoff within dry or wet cells formed by check dams or other structures.
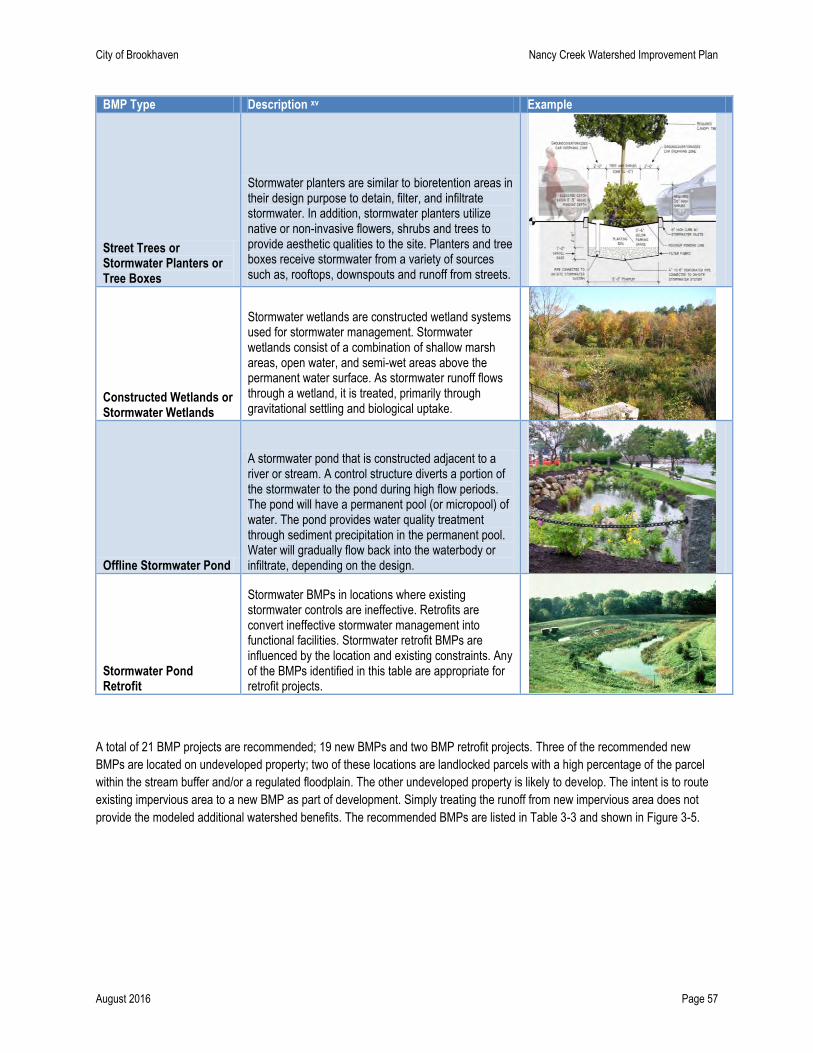
City of Brookhaven Nancy Creek Watershed Improvement Plan
August 2016 Page 57
BMP Type Description xv Example
Street Trees or Stormwater Planters or Tree Boxes
Stormwater planters are similar to bioretention areas in their design purpose to detain, filter, and infiltrate stormwater. In addition, stormwater planters utilize native or non-invasive flowers, shrubs and trees to provide aesthetic qualities to the site. Planters and tree boxes receive stormwater from a variety of sources such as, rooftops, downspouts and runoff from streets.
Constructed Wetlands or Stormwater Wetlands
Stormwater wetlands are constructed wetland systems used for stormwater management. Stormwater wetlands consist of a combination of shallow marsh areas, open water, and semi-wet areas above the permanent water surface. As stormwater runoff flows through a wetland, it is treated, primarily through gravitational settling and biological uptake.
Offline Stormwater Pond
A stormwater pond that is constructed adjacent to a river or stream. A control structure diverts a portion of the stormwater to the pond during high flow periods. The pond will have a permanent pool (or micropool) of water. The pond provides water quality treatment through sediment precipitation in the permanent pool. Water will gradually flow back into the waterbody or infiltrate, depending on the design.
Stormwater Pond Retrofit
Stormwater BMPs in locations where existing stormwater controls are ineffective. Retrofits are convert ineffective stormwater management into functional facilities. Stormwater retrofit BMPs are influenced by the location and existing constraints. Any of the BMPs identified in this table are appropriate for retrofit projects.
A total of 21 BMP projects are recommended; 19 new BMPs and two BMP retrofit projects. Three of the recommended new
BMPs are located on undeveloped property; two of these locations are landlocked parcels with a high percentage of the parcel
within the stream buffer and/or a regulated floodplain. The other undeveloped property is likely to develop. The intent is to route
existing impervious area to a new BMP as part of development. Simply treating the runoff from new impervious area does not
provide the modeled additional watershed benefits. The recommended BMPs are listed in Table 3-3 and shown in Figure 3-5.
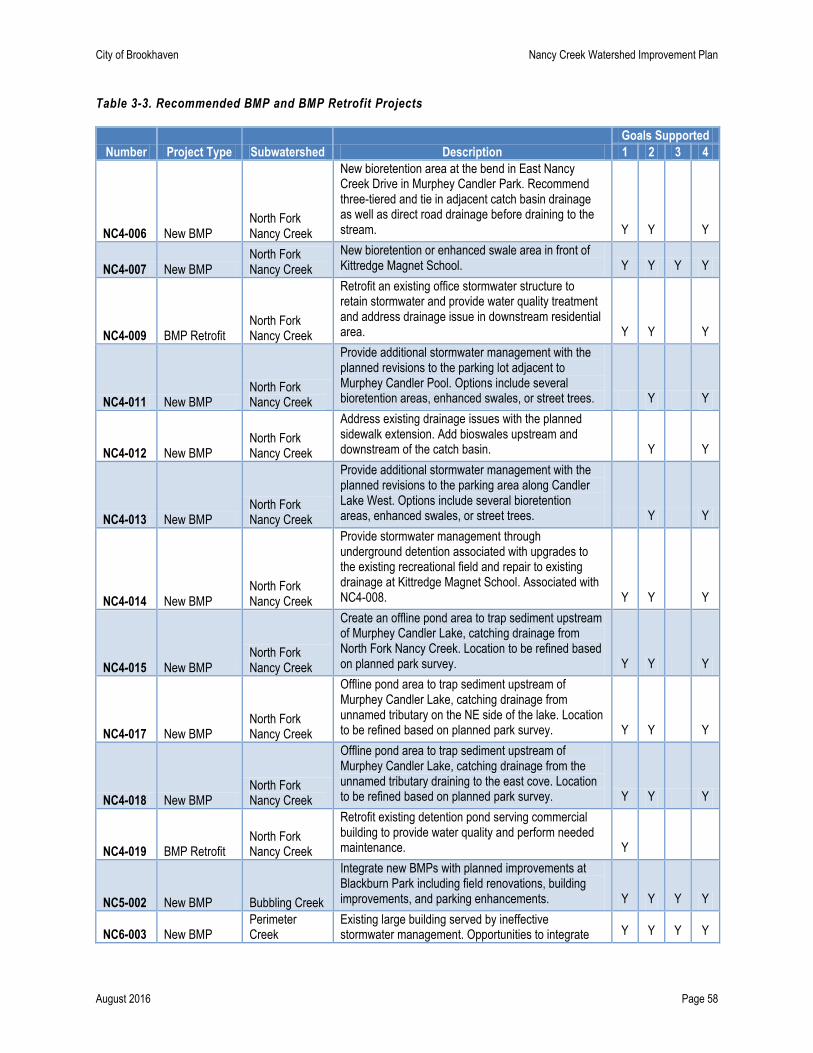
City of Brookhaven Nancy Creek Watershed Improvement Plan
August 2016 Page 58
Table 3-3. Recommended BMP and BMP Retrofit Projects
Number Project Type Subwatershed Description
Goals Supported
1 2 3 4
NC4-006 New BMP North Fork Nancy Creek
New bioretention area at the bend in East Nancy Creek Drive in Murphey Candler Park. Recommend three-tiered and tie in adjacent catch basin drainage as well as direct road drainage before draining to the stream. Y Y Y
NC4-007 New BMP North Fork Nancy Creek
New bioretention or enhanced swale area in front of Kittredge Magnet School. Y Y Y Y
NC4-009 BMP Retrofit North Fork Nancy Creek
Retrofit an existing office stormwater structure to retain stormwater and provide water quality treatment and address drainage issue in downstream residential area. Y Y Y
NC4-011 New BMP North Fork Nancy Creek
Provide additional stormwater management with the planned revisions to the parking lot adjacent to Murphey Candler Pool. Options include several bioretention areas, enhanced swales, or street trees. Y Y
NC4-012 New BMP North Fork Nancy Creek
Address existing drainage issues with the planned sidewalk extension. Add bioswales upstream and downstream of the catch basin. Y Y
NC4-013 New BMP North Fork Nancy Creek
Provide additional stormwater management with the planned revisions to the parking area along Candler Lake West. Options include several bioretention areas, enhanced swales, or street trees. Y Y
NC4-014 New BMP North Fork Nancy Creek
Provide stormwater management through underground detention associated with upgrades to the existing recreational field and repair to existing drainage at Kittredge Magnet School. Associated with NC4-008. Y Y Y
NC4-015 New BMP North Fork Nancy Creek
Create an offline pond area to trap sediment upstream of Murphey Candler Lake, catching drainage from North Fork Nancy Creek. Location to be refined based on planned park survey. Y Y Y
NC4-017 New BMP North Fork Nancy Creek
Offline pond area to trap sediment upstream of Murphey Candler Lake, catching drainage from unnamed tributary on the NE side of the lake. Location to be refined based on planned park survey. Y Y Y
NC4-018 New BMP North Fork Nancy Creek
Offline pond area to trap sediment upstream of Murphey Candler Lake, catching drainage from the unnamed tributary draining to the east cove. Location to be refined based on planned park survey. Y Y Y
NC4-019 BMP Retrofit North Fork Nancy Creek
Retrofit existing detention pond serving commercial building to provide water quality and perform needed maintenance. Y
NC5-002 New BMP Bubbling Creek
Integrate new BMPs with planned improvements at Blackburn Park including field renovations, building improvements, and parking enhancements. Y Y Y Y
NC6-003 New BMP Perimeter Creek
Existing large building served by ineffective stormwater management. Opportunities to integrate Y Y Y Y
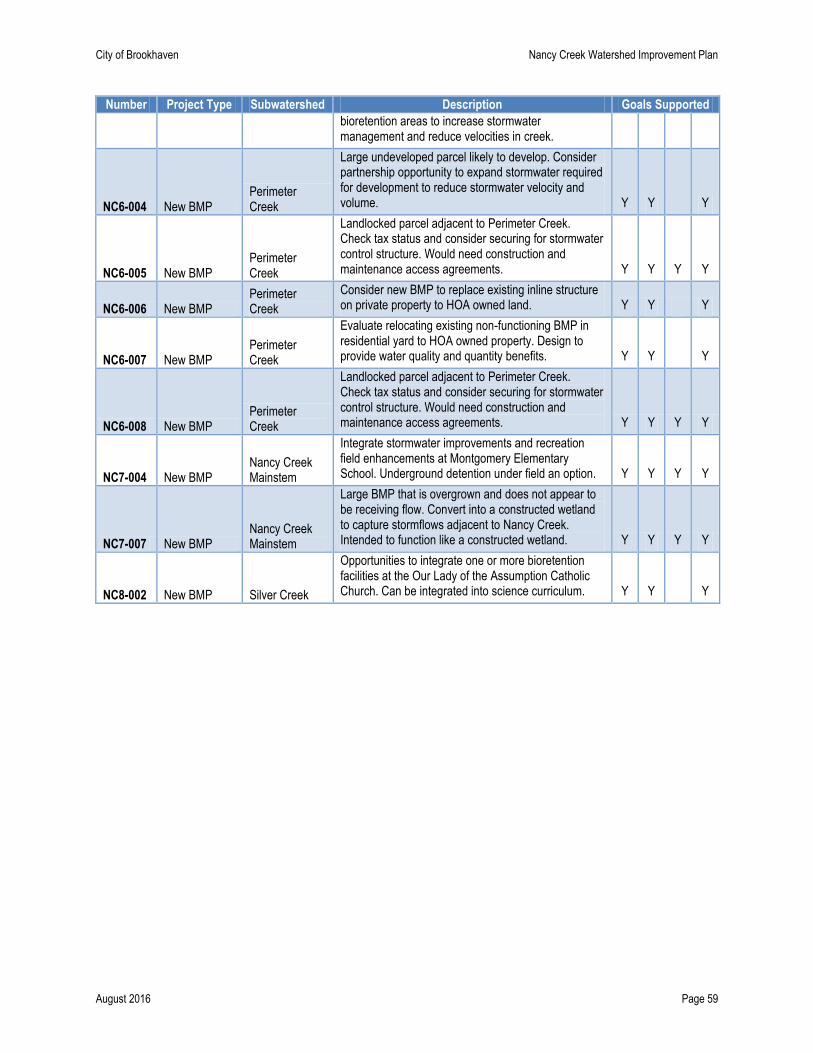
City of Brookhaven Nancy Creek Watershed Improvement Plan
August 2016 Page 59
Number Project Type Subwatershed Description Goals Supported
bioretention areas to increase stormwater management and reduce velocities in creek.
NC6-004 New BMP Perimeter Creek
Large undeveloped parcel likely to develop. Consider partnership opportunity to expand stormwater required for development to reduce stormwater velocity and volume. Y Y Y
NC6-005 New BMP Perimeter Creek
Landlocked parcel adjacent to Perimeter Creek. Check tax status and consider securing for stormwater control structure. Would need construction and maintenance access agreements. Y Y Y Y
NC6-006 New BMP Perimeter Creek
Consider new BMP to replace existing inline structure on private property to HOA owned land. Y Y Y
NC6-007 New BMP Perimeter Creek
Evaluate relocating existing non-functioning BMP in residential yard to HOA owned property. Design to provide water quality and quantity benefits. Y Y Y
NC6-008 New BMP Perimeter Creek
Landlocked parcel adjacent to Perimeter Creek. Check tax status and consider securing for stormwater control structure. Would need construction and maintenance access agreements. Y Y Y Y
NC7-004 New BMP Nancy Creek Mainstem
Integrate stormwater improvements and recreation field enhancements at Montgomery Elementary School. Underground detention under field an option. Y Y Y Y
NC7-007 New BMP Nancy Creek Mainstem
Large BMP that is overgrown and does not appear to be receiving flow. Convert into a constructed wetland to capture stormflows adjacent to Nancy Creek. Intended to function like a constructed wetland. Y Y Y Y
NC8-002 New BMP Silver Creek
Opportunities to integrate one or more bioretention facilities at the Our Lady of the Assumption Catholic Church. Can be integrated into science curriculum. Y Y Y
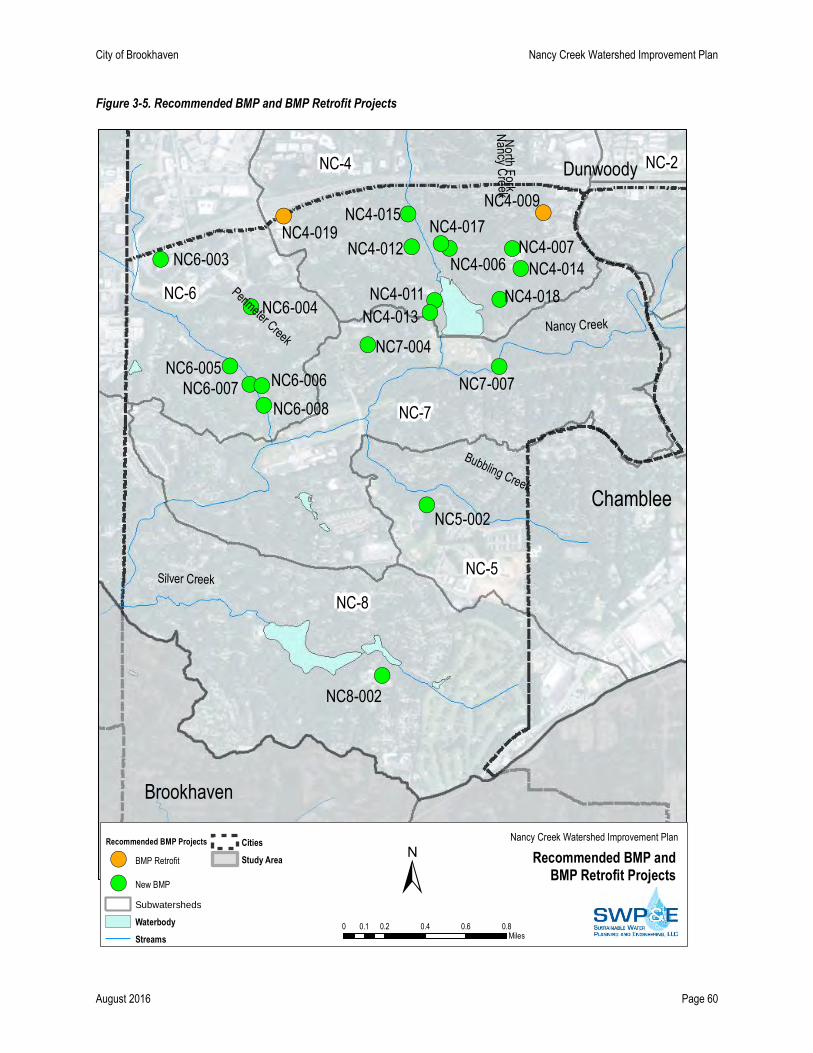
City of Brookhaven Nancy Creek Watershed Improvement Plan
August 2016 Page 60
Figure 3-5. Recommended BMP and BMP Retrofit Projects
!(
!(
!(
!(
!(
!(
!(
!(
!(
!(!(!(!(
!(
!(
!(
!(!(
!(
!(
!(
Brookhaven
Perimeter Creek
Bubbling Creek
Dunwoody
Silver Creek
NC6-007
NC4-017
NC4-006
Chamblee
Nancy Creek
No
rth Fork
Na
ncy Cre
ekNC4-018
NC4-019NC4-015
NC4-014
NC7-004
NC6-005
NC6-003NC4-012 NC4-007
NC4-009
NC7-007
NC5-002
NC6-008
NC6-006
NC6-004
NC8-002
NC4-013
NC4-011
NC-8
NC-7
NC-4
NC-5
NC-6
NC-2
Source: Esri, DigitalGlobe, GeoEye, i-cubed, Earthstar Geographics,
CNES/Airbus DS, USDA, USGS, AEX, Getmapping, Aerogrid, IGN, IGP,swisstopo, and the GIS User Community
Recommended BMP andBMP Retrofit Projects
Nancy Creek Watershed Improvement Plan
±0 0.2 0.4 0.6 0.80.1
Miles
Recommended BMP Projects
!( BMP Retrofit
!( New BMP
Subwatersheds
Waterbody
Streams
Cities
Study Area
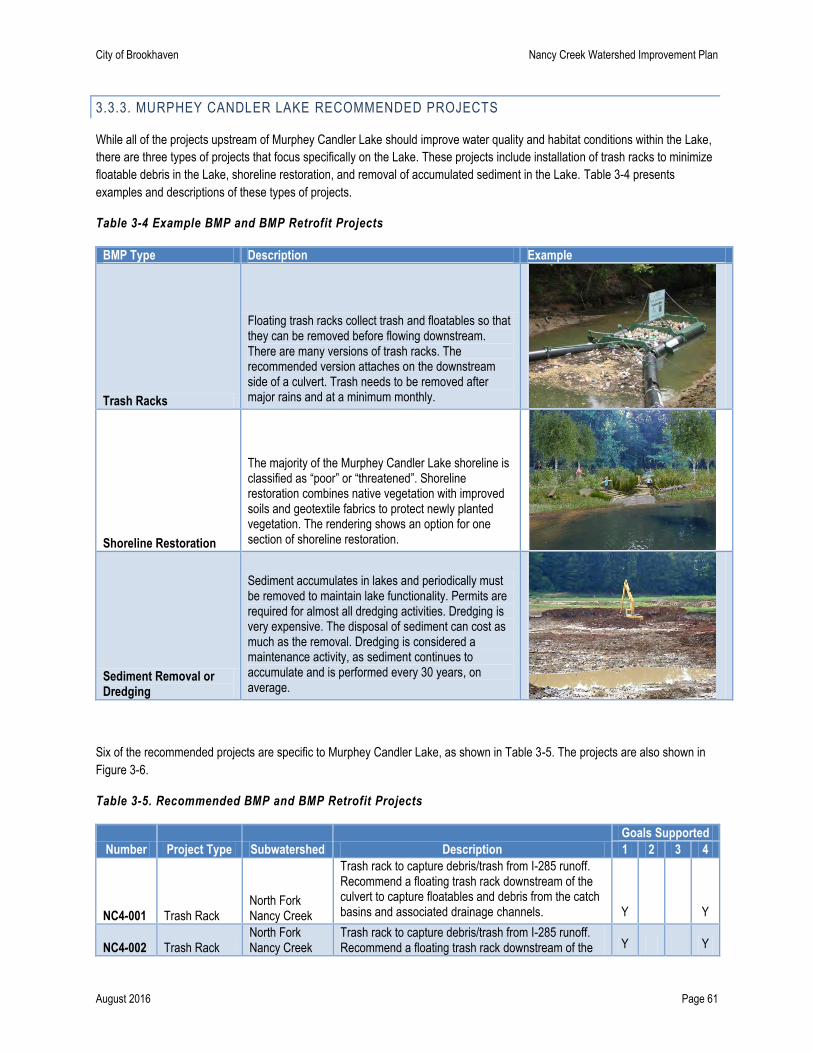
City of Brookhaven Nancy Creek Watershed Improvement Plan
August 2016 Page 61
3.3.3. MURPHEY CANDLER LAKE RECOMMENDED PROJECTS
While all of the projects upstream of Murphey Candler Lake should improve water quality and habitat conditions within the Lake,
there are three types of projects that focus specifically on the Lake. These projects include installation of trash racks to minimize
floatable debris in the Lake, shoreline restoration, and removal of accumulated sediment in the Lake. Table 3-4 presents
examples and descriptions of these types of projects.
Table 3-4 Example BMP and BMP Retrofit Projects
BMP Type Description Example
Trash Racks
Floating trash racks collect trash and floatables so that they can be removed before flowing downstream. There are many versions of trash racks. The recommended version attaches on the downstream side of a culvert. Trash needs to be removed after major rains and at a minimum monthly.
Shoreline Restoration
The majority of the Murphey Candler Lake shoreline is classified as “poor” or “threatened”. Shoreline restoration combines native vegetation with improved soils and geotextile fabrics to protect newly planted vegetation. The rendering shows an option for one section of shoreline restoration.
Sediment Removal or Dredging
Sediment accumulates in lakes and periodically must be removed to maintain lake functionality. Permits are required for almost all dredging activities. Dredging is very expensive. The disposal of sediment can cost as much as the removal. Dredging is considered a maintenance activity, as sediment continues to accumulate and is performed every 30 years, on average.
Six of the recommended projects are specific to Murphey Candler Lake, as shown in Table 3-5. The projects are also shown in
Figure 3-6.
Table 3-5. Recommended BMP and BMP Retrofit Projects
Number Project Type Subwatershed Description
Goals Supported
1 2 3 4
NC4-001 Trash Rack North Fork Nancy Creek
Trash rack to capture debris/trash from I-285 runoff. Recommend a floating trash rack downstream of the culvert to capture floatables and debris from the catch basins and associated drainage channels. Y Y
NC4-002 Trash Rack North Fork Nancy Creek
Trash rack to capture debris/trash from I-285 runoff. Recommend a floating trash rack downstream of the Y Y
City of Brookhaven Nancy Creek Watershed Improvement Plan
August 2016 Page 62
Number Project Type Subwatershed Description Goals Supported
culvert to capture floatables and debris from the catch basins and associated drainage channels.
NC4-003 Trash Rack North Fork Nancy Creek
Trash rack to capture debris/trash from I-285 runoff. Recommend a floating trash rack downstream of the culvert to capture floatables and debris from the catch basins and associated drainage channels. Y Y
NC4-004 Trash Rack North Fork Nancy Creek
Trash rack to capture debris/trash from I-285 runoff. Recommend a floating trash rack downstream of the culvert to capture floatables and debris from the catch basins and associated drainage channels. Y Y
NC4-005 Shoreline Restoration
North Fork Nancy Creek
Restore 3,400 linear feet of shoreline around Murphey Candler Lake (shore classified as “poor” or “threatened”). Y Y
NC4-016 Sediment Removal
North Fork Nancy Creek
Maintenance dredging of accumulated sediment in the northern and eastern coves in Murphey Candler Lake. Y
3.3.3.1. SEDIMENT REMOVAL FOR MURPHEY CANDLER LAKE
The City is concerned with the visible accumulation of sediment in Murphey Candler Lake, which is most pronounced in the
northern coves and eastern cove. In part, the City commissioned this Plan to study the sources of sediment, as well as the
permitting requirements, and optimal timing for sediment removal. This section provides a summary of the most recent dredging
activity and outlines the likely sources of sediment, the frequency of maintenance dredging, and a summary of dredging
alternatives.
Sediment accumulation in Murphey Candler Lake appears to be due primarily to stream bank erosion upstream of the Lake. The
habitat conditions in North Fork Nancy Creek downstream of I-285 and upstream of Murphey Candler Lake are “poor” with
exposed banks greater than 20 feet tall in places and evidence of active erosion. Project NC4-010 recommends restoration of
this impacted section. Similarly, project NC4-008 recommends stabilization of an impacted segment of an unnamed tributary
upstream of Murphey Candler Lake that is highly eroded. Implementation of these and other upstream projects reduces the rate
of accumulation of sediments in Murphey Candler Lake.
Natural accumulation of sediment is expected in any lake. Routine dredging activities are typically recommended when 25 to 30
percent of the storage capacity is lost to sediment accumulation. Sediment is accumulating at a calculated rate of 1 acre-ft/ year
based on the watershed model. Based on this rate of accumulation, Murphey Candler Lake requires maintenance dredging every
30 to 40 years. Murphey Candler Lake was last dredged in 2002; therefore, these calculations suggest that the next dredging of
Murphey Candler Lake should be planned between 2030 and 2040. Looking overall at Murphey Candler Lake, the area weighted
average sediment accumulation represents approximately 16 percent of the total storage volume in the Lake. The overall
accumulation is below the threshold for dredging but the 25 percent threshold will be met in the next 10 years, consistent with the
30 year timeframe.
This timeframe is true if the sediment is distributed throughout the entire Lake. Visual evidence and sampling data show that the
sediment is accumulating in the upper reaches and eastern cove and not impacting the storage levels in the remainder of the
Lake. Looking at the data collected for the upper and lower portions of the Lake separately provides a different conclusion.
The sediment accumulation is the greatest in the northern portion of the Lake. If the analysis only looks at the upper portions of
Murphey Candler Lake, sediment accumulation represents almost half of the total storage volume and therefore dredging is
City of Brookhaven Nancy Creek Watershed Improvement Plan
August 2016 Page 63
recommended for the upper portions of the Lake. In the lower portion of the Lake, sediment accumulation is less than 10 percent
of the storage volume.
Sediment removal, or dredging, is recommended within the next 10 years for the upper portion and eastern cove of this Lake.
Sediment removal, or dredging, does not provide significant watershed-wide benefits but is an important maintenance
responsibility for lake owners, which in this case is the City. Dredging requires a significant capital expense and requires years of
time to properly plan, permit, contract, and finance. Although dredging is recommended, the timeline in Chapter 4 shows the
dredging activities occurring in Years 5 to 10 to allow the City sufficient time to prepare for a successful outcome. If the City can
secure the funding and permits earlier than this timeframe, there is justification to expedite this project.
This project will require a number of permits. The specific permits and the intensity of permitting are dependent on the sediment
removal methods, proposed equipment, sediment disposal methods, and the quantity of sediment to be removed. Likely permits
include a “404 permit” from the US Army Corps of Engineers, the associated Georgia 401 water quality certification, a Georgia
stream buffer variance, and a City land disturbance permit. To reduce permitting costs, this Plan recommends removing
accumulated sediments only to the original Lake design conditions. The dredging will not restore the pre-2002 water depth but
rather remove sediment to the original lake bottom. Based on field depth measurements, historical information, and aerial GIS
imagery, approximately 12,000 cubic yards of sediment from the northern coves and the eastern coves are recommended for
removal.
To reduce overall project costs, the removed sediment can be hauled and used in Lynwood Park to improve ball fields,
consistent with the Park Specific Master Plan recommendationsxvi. If needed, removed sediment may also be spread on Field 11
in Murphey Candler Park. The implementation plan in Chapter 4 presents additional information regarding the cost and schedule
of this project.
3.3.3.2. MURPHEY CANDLER LAKE SHORELINE RESTORATION
Overall, the shoreline conditions around Murphey Candler Lake are considered threatened to poor. As the property owner, the
City expresses a strong interest in restoring the shoreline along the Lake. As part of this Plan, artistic renderings were created to
show how areas of the shoreline could be stabilized to reduce sedimentation and provide a more aesthetically-pleasing park
space. Figures 3-7 and 3-8 show the “before” and “after” artistic renderings for two areas where the Murphey Candler Lake
shoreline is currently considered poor. These renderings reflect some conditions that are seen as important to the stakeholders
and the City. The design of the shoreline restoration should consider typical design considerations as well as the following:
Plants: Native vegetation is to be used. Attention should be paid to the variable water level which may leave vegetation on
the banks periodically inundated when water levels fluctuate naturally. Attention should also be given to the change in
sunlight conditions as the plants mature. The landscape contract should include a one-year warranty on new plants.
Erosion and Sediment Control: Geotextile fabrics are critical to stabilize the banks while the vegetation matures.
Geotextile fabric should always be used when slopes are 3:1 or steeper. In most cases, the fabric should biodegrade over
time, but should last long enough to keep the slopes stable while the vegetation matures. Landscaping fabric is essentially a
weed barrier and is not appropriate. Always follow manufacturer’s installation instructions, which typically recommend
installing the fabric with overlapping seams. Coir logs are recommended to help stabilize the banks. Coir logs can be
planted with plugs of herbaceous vegetation.
Hardscaping: Decorative walls should be made of granite consistent with others in Murphey Candler Park.
Soil: The soil should be specified based on soil tests performed during design. Generally, construction grade dirt without
amendments is not suitable for this application.
Access: Access should be provided in limited locations along the shoreline.
Additional information on the care for newly planted buffer areas is located in the SOPs in Appendix D.
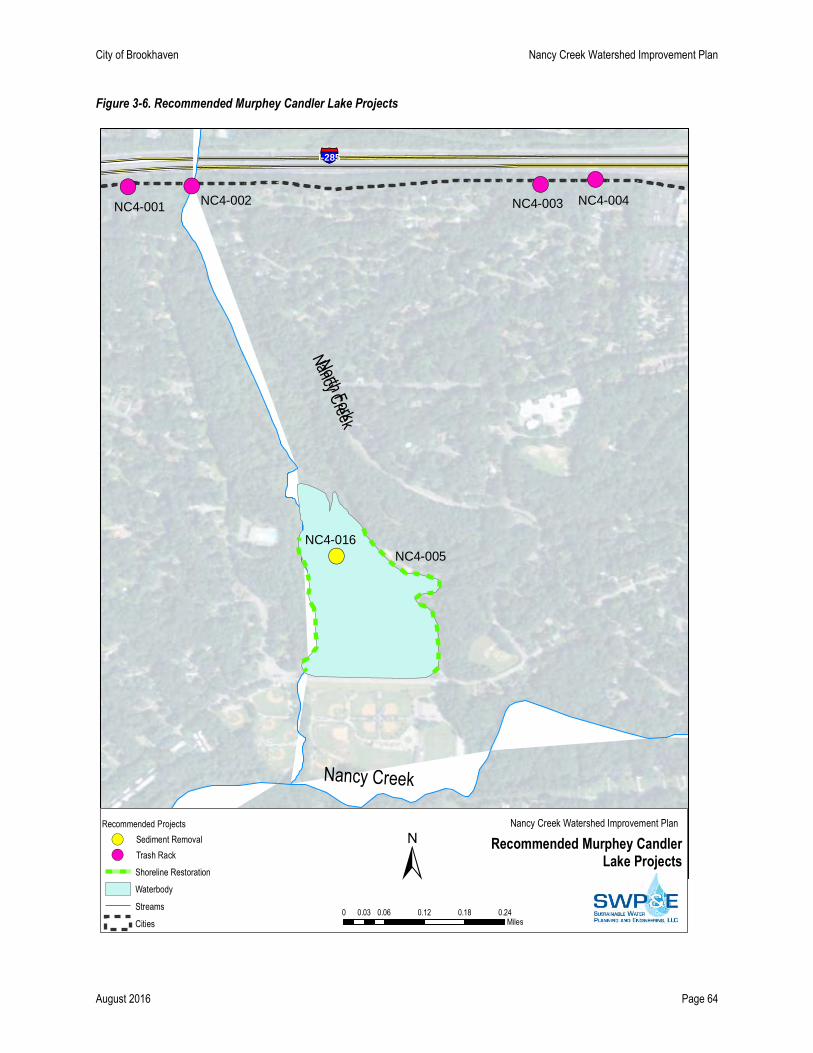
City of Brookhaven Nancy Creek Watershed Improvement Plan
August 2016 Page 64
Figure 3-6. Recommended Murphey Candler Lake Projects
§̈¦I-285
NC4-001NC4-002 NC4-003 NC4-004
NC4-016
Nancy Creek
North F
ork
Nancy C
reek
NC4-005
!(!( !(!(
!(
Source: Esri, DigitalGlobe, GeoEye, i-cubed, Earthstar Geographics,
CNES/Airbus DS, USDA, USGS, AEX, Getmapping, Aerogrid, IGN, IGP,swisstopo, and the GIS User Community
Recommended Murphey CandlerLake Projects
Nancy Creek Watershed Improvement Plan
±0 0.06 0.12 0.18 0.240.03
Miles
Shoreline Restoration
Waterbody
Streams
Cities
Recommended Projects
Sediment Removal
Trash Rack
!(!(
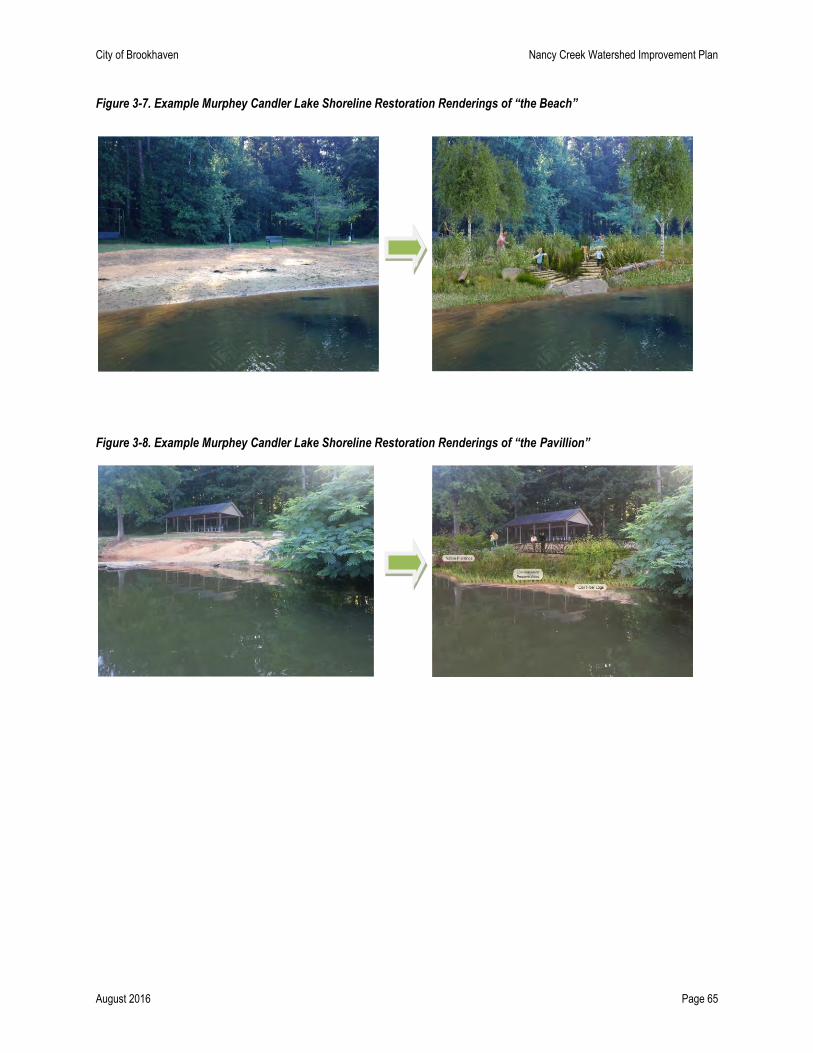
City of Brookhaven Nancy Creek Watershed Improvement Plan
August 2016 Page 65
Figure 3-7. Example Murphey Candler Lake Shoreline Restoration Renderings of “the Beach”
Figure 3-8. Example Murphey Candler Lake Shoreline Restoration Renderings of “the Pavillion”
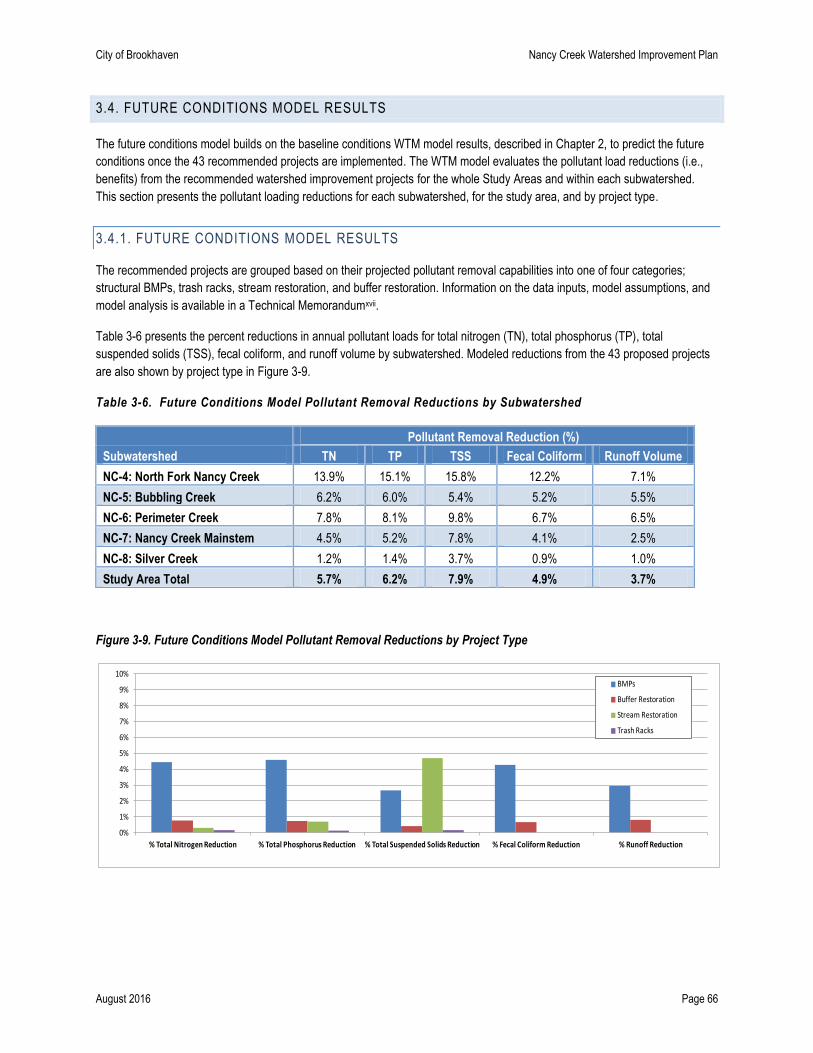
City of Brookhaven Nancy Creek Watershed Improvement Plan
August 2016 Page 66
3.4. FUTURE CONDITIONS MODEL RESULTS
The future conditions model builds on the baseline conditions WTM model results, described in Chapter 2, to predict the future
conditions once the 43 recommended projects are implemented. The WTM model evaluates the pollutant load reductions (i.e.,
benefits) from the recommended watershed improvement projects for the whole Study Areas and within each subwatershed.
This section presents the pollutant loading reductions for each subwatershed, for the study area, and by project type.
3.4.1. FUTURE CONDITIONS MODEL RESULTS
The recommended projects are grouped based on their projected pollutant removal capabilities into one of four categories;
structural BMPs, trash racks, stream restoration, and buffer restoration. Information on the data inputs, model assumptions, and
model analysis is available in a Technical Memorandumxvii.
Table 3-6 presents the percent reductions in annual pollutant loads for total nitrogen (TN), total phosphorus (TP), total
suspended solids (TSS), fecal coliform, and runoff volume by subwatershed. Modeled reductions from the 43 proposed projects
are also shown by project type in Figure 3-9.
Table 3-6. Future Conditions Model Pollutant Removal Reductions by Subwatershed
Subwatershed
Pollutant Removal Reduction (%)
TN TP TSS Fecal Coliform Runoff Volume
NC-4: North Fork Nancy Creek 13.9% 15.1% 15.8% 12.2% 7.1%
NC-5: Bubbling Creek 6.2% 6.0% 5.4% 5.2% 5.5%
NC-6: Perimeter Creek 7.8% 8.1% 9.8% 6.7% 6.5%
NC-7: Nancy Creek Mainstem 4.5% 5.2% 7.8% 4.1% 2.5%
NC-8: Silver Creek 1.2% 1.4% 3.7% 0.9% 1.0%
Study Area Total 5.7% 6.2% 7.9% 4.9% 3.7%
Figure 3-9. Future Conditions Model Pollutant Removal Reductions by Project Type
0%
1%
2%
3%
4%
5%
6%
7%
8%
9%
10%
% Total Nitrogen Reduction % Total Phosphorus Reduction % Total Suspended Solids Reduction % Fecal Coliform Reduction % Runoff Reduction
BMPs
Buffer Restoration
Stream Restoration
Trash Racks
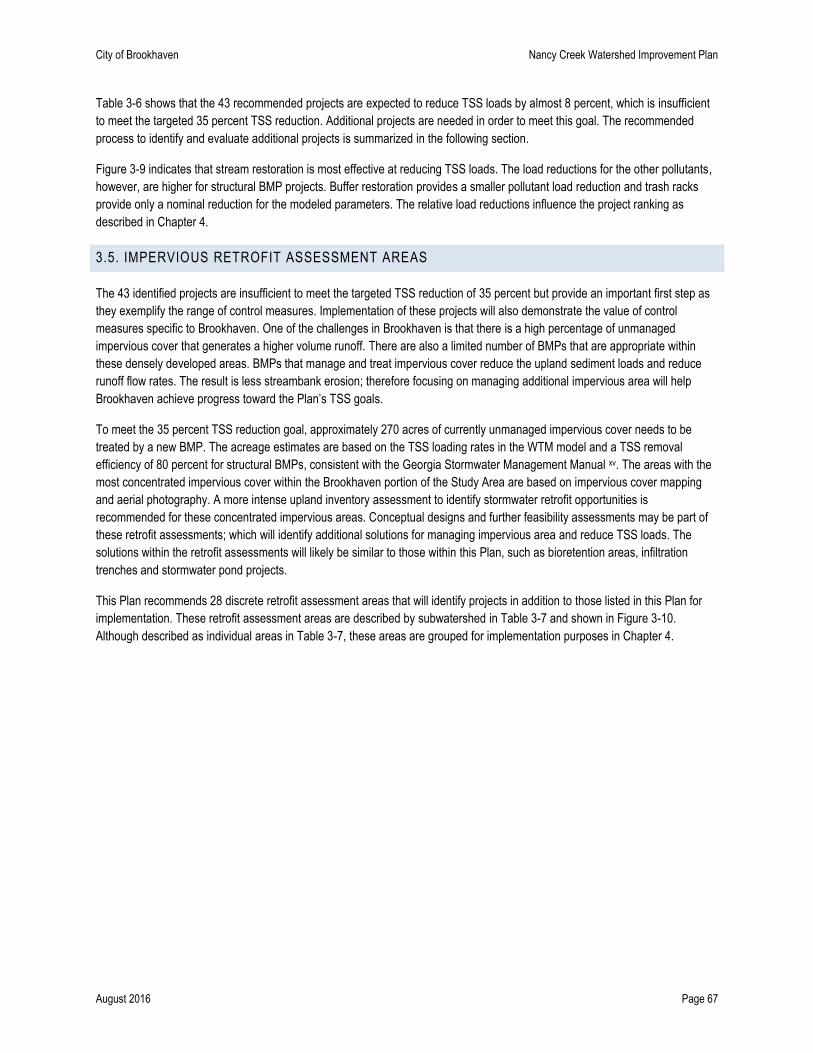
City of Brookhaven Nancy Creek Watershed Improvement Plan
August 2016 Page 67
Table 3-6 shows that the 43 recommended projects are expected to reduce TSS loads by almost 8 percent, which is insufficient
to meet the targeted 35 percent TSS reduction. Additional projects are needed in order to meet this goal. The recommended
process to identify and evaluate additional projects is summarized in the following section.
Figure 3-9 indicates that stream restoration is most effective at reducing TSS loads. The load reductions for the other pollutants,
however, are higher for structural BMP projects. Buffer restoration provides a smaller pollutant load reduction and trash racks
provide only a nominal reduction for the modeled parameters. The relative load reductions influence the project ranking as
described in Chapter 4.
3.5. IMPERVIOUS RETROFIT ASSESSMENT AREAS
The 43 identified projects are insufficient to meet the targeted TSS reduction of 35 percent but provide an important first step as
they exemplify the range of control measures. Implementation of these projects will also demonstrate the value of control
measures specific to Brookhaven. One of the challenges in Brookhaven is that there is a high percentage of unmanaged
impervious cover that generates a higher volume runoff. There are also a limited number of BMPs that are appropriate within
these densely developed areas. BMPs that manage and treat impervious cover reduce the upland sediment loads and reduce
runoff flow rates. The result is less streambank erosion; therefore focusing on managing additional impervious area will help
Brookhaven achieve progress toward the Plan’s TSS goals.
To meet the 35 percent TSS reduction goal, approximately 270 acres of currently unmanaged impervious cover needs to be
treated by a new BMP. The acreage estimates are based on the TSS loading rates in the WTM model and a TSS removal
efficiency of 80 percent for structural BMPs, consistent with the Georgia Stormwater Management Manual xv. The areas with the
most concentrated impervious cover within the Brookhaven portion of the Study Area are based on impervious cover mapping
and aerial photography. A more intense upland inventory assessment to identify stormwater retrofit opportunities is
recommended for these concentrated impervious areas. Conceptual designs and further feasibility assessments may be part of
these retrofit assessments; which will identify additional solutions for managing impervious area and reduce TSS loads. The
solutions within the retrofit assessments will likely be similar to those within this Plan, such as bioretention areas, infiltration
trenches and stormwater pond projects.
This Plan recommends 28 discrete retrofit assessment areas that will identify projects in addition to those listed in this Plan for
implementation. These retrofit assessment areas are described by subwatershed in Table 3-7 and shown in Figure 3-10.
Although described as individual areas in Table 3-7, these areas are grouped for implementation purposes in Chapter 4.
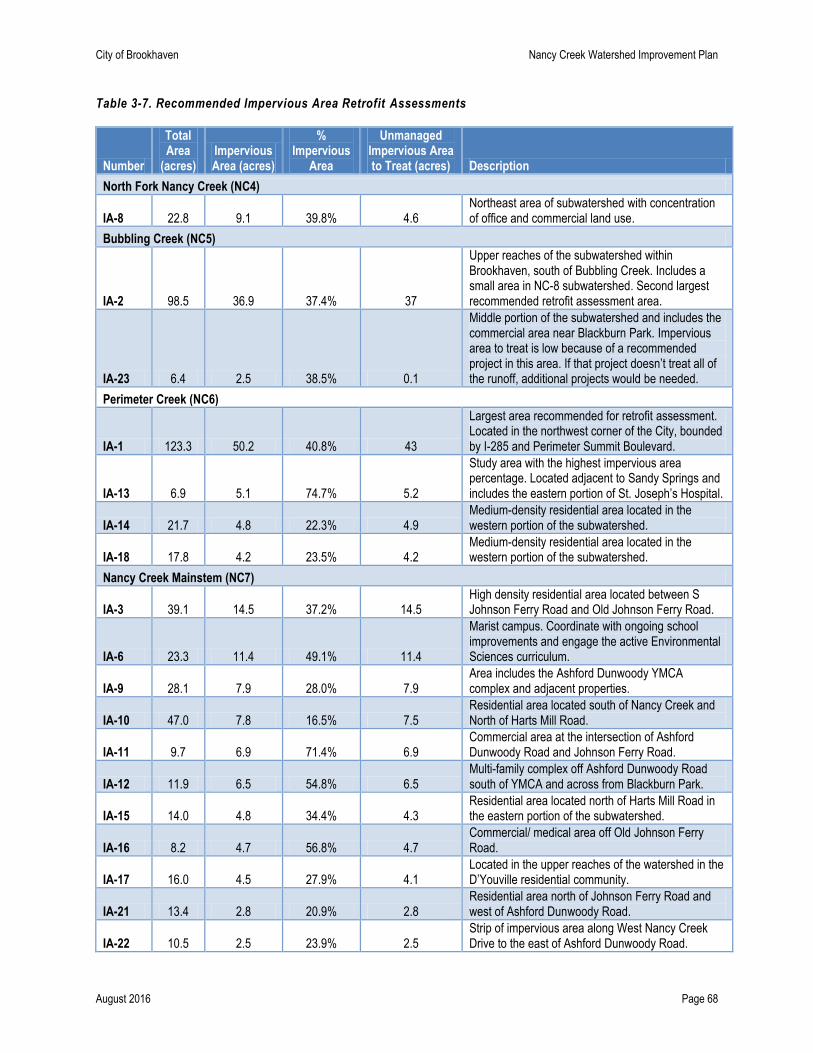
City of Brookhaven Nancy Creek Watershed Improvement Plan
August 2016 Page 68
Table 3-7. Recommended Impervious Area Retrofit Assessments
Number
Total Area
(acres) Impervious Area (acres)
% Impervious
Area
Unmanaged Impervious Area to Treat (acres) Description
North Fork Nancy Creek (NC4)
IA-8 22.8 9.1 39.8% 4.6 Northeast area of subwatershed with concentration of office and commercial land use.
Bubbling Creek (NC5)
IA-2 98.5 36.9 37.4% 37
Upper reaches of the subwatershed within Brookhaven, south of Bubbling Creek. Includes a small area in NC-8 subwatershed. Second largest recommended retrofit assessment area.
IA-23 6.4 2.5 38.5% 0.1
Middle portion of the subwatershed and includes the commercial area near Blackburn Park. Impervious area to treat is low because of a recommended project in this area. If that project doesn’t treat all of the runoff, additional projects would be needed.
Perimeter Creek (NC6)
IA-1 123.3 50.2 40.8% 43
Largest area recommended for retrofit assessment. Located in the northwest corner of the City, bounded by I-285 and Perimeter Summit Boulevard.
IA-13 6.9 5.1 74.7% 5.2
Study area with the highest impervious area percentage. Located adjacent to Sandy Springs and includes the eastern portion of St. Joseph’s Hospital.
IA-14 21.7 4.8 22.3% 4.9 Medium-density residential area located in the western portion of the subwatershed.
IA-18 17.8 4.2 23.5% 4.2 Medium-density residential area located in the western portion of the subwatershed.
Nancy Creek Mainstem (NC7)
IA-3 39.1 14.5 37.2% 14.5 High density residential area located between S Johnson Ferry Road and Old Johnson Ferry Road.
IA-6 23.3 11.4 49.1% 11.4
Marist campus. Coordinate with ongoing school improvements and engage the active Environmental Sciences curriculum.
IA-9 28.1 7.9 28.0% 7.9 Area includes the Ashford Dunwoody YMCA complex and adjacent properties.
IA-10 47.0 7.8 16.5% 7.5 Residential area located south of Nancy Creek and North of Harts Mill Road.
IA-11 9.7 6.9 71.4% 6.9 Commercial area at the intersection of Ashford Dunwoody Road and Johnson Ferry Road.
IA-12 11.9 6.5 54.8% 6.5 Multi-family complex off Ashford Dunwoody Road south of YMCA and across from Blackburn Park.
IA-15 14.0 4.8 34.4% 4.3 Residential area located north of Harts Mill Road in the eastern portion of the subwatershed.
IA-16 8.2 4.7 56.8% 4.7 Commercial/ medical area off Old Johnson Ferry Road.
IA-17 16.0 4.5 27.9% 4.1 Located in the upper reaches of the watershed in the D’Youville residential community.
IA-21 13.4 2.8 20.9% 2.8 Residential area north of Johnson Ferry Road and west of Ashford Dunwoody Road.
IA-22 10.5 2.5 23.9% 2.5 Strip of impervious area along West Nancy Creek Drive to the east of Ashford Dunwoody Road.
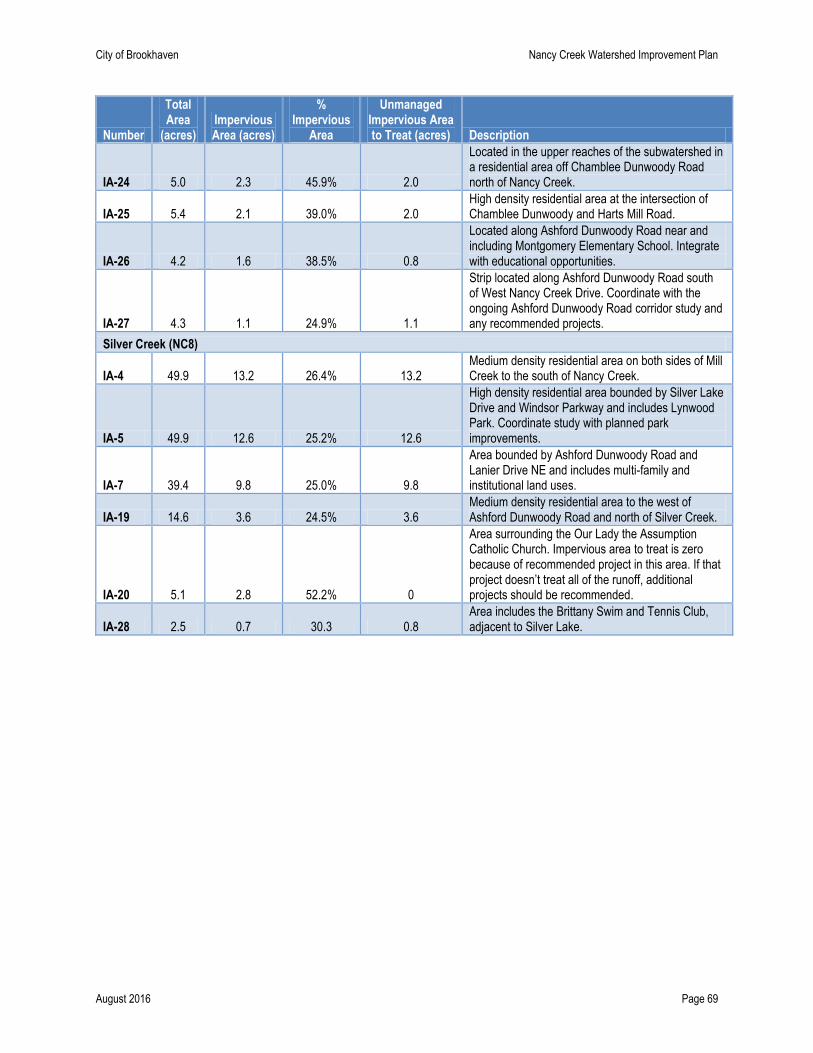
City of Brookhaven Nancy Creek Watershed Improvement Plan
August 2016 Page 69
Number
Total Area
(acres) Impervious Area (acres)
% Impervious
Area
Unmanaged Impervious Area to Treat (acres) Description
IA-24 5.0 2.3 45.9% 2.0
Located in the upper reaches of the subwatershed in a residential area off Chamblee Dunwoody Road north of Nancy Creek.
IA-25 5.4 2.1 39.0% 2.0 High density residential area at the intersection of Chamblee Dunwoody and Harts Mill Road.
IA-26 4.2 1.6 38.5% 0.8
Located along Ashford Dunwoody Road near and including Montgomery Elementary School. Integrate with educational opportunities.
IA-27 4.3 1.1 24.9% 1.1
Strip located along Ashford Dunwoody Road south of West Nancy Creek Drive. Coordinate with the ongoing Ashford Dunwoody Road corridor study and any recommended projects.
Silver Creek (NC8)
IA-4 49.9 13.2 26.4% 13.2 Medium density residential area on both sides of Mill Creek to the south of Nancy Creek.
IA-5 49.9 12.6 25.2% 12.6
High density residential area bounded by Silver Lake Drive and Windsor Parkway and includes Lynwood Park. Coordinate study with planned park improvements.
IA-7 39.4 9.8 25.0% 9.8
Area bounded by Ashford Dunwoody Road and Lanier Drive NE and includes multi-family and institutional land uses.
IA-19 14.6 3.6 24.5% 3.6 Medium density residential area to the west of Ashford Dunwoody Road and north of Silver Creek.
IA-20 5.1 2.8 52.2% 0
Area surrounding the Our Lady the Assumption Catholic Church. Impervious area to treat is zero because of recommended project in this area. If that project doesn’t treat all of the runoff, additional projects should be recommended.
IA-28 2.5 0.7 30.3 0.8 Area includes the Brittany Swim and Tennis Club, adjacent to Silver Lake.
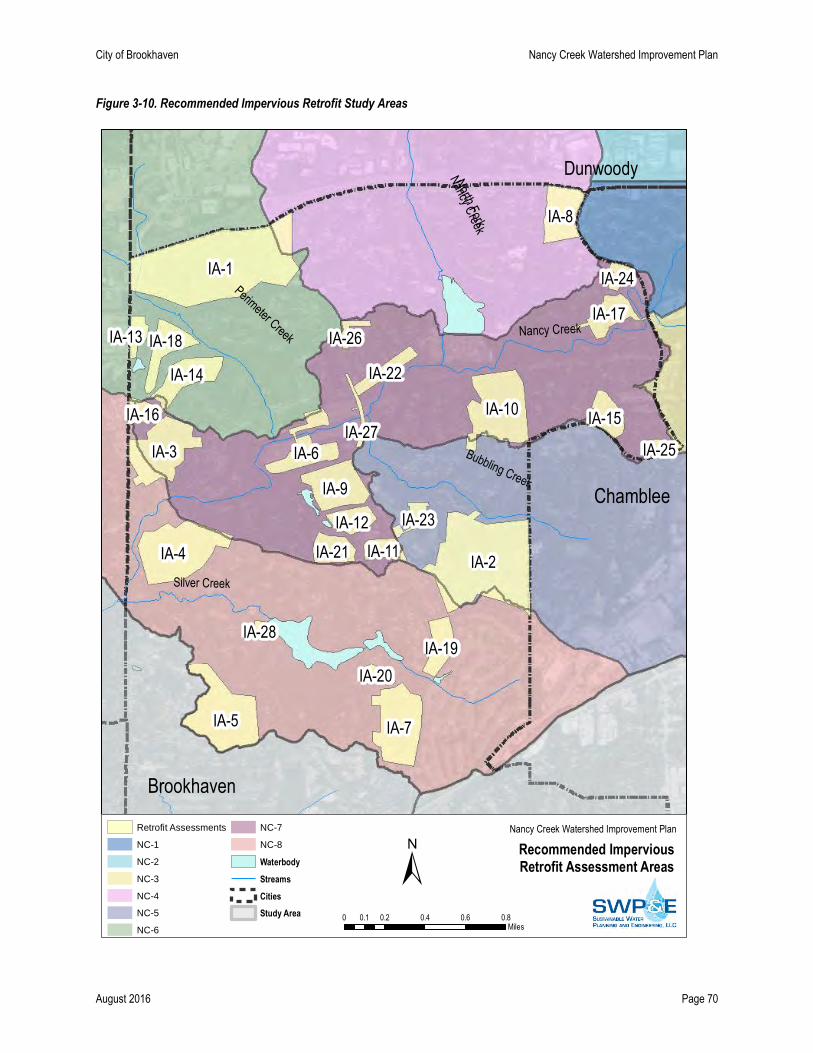
City of Brookhaven Nancy Creek Watershed Improvement Plan
August 2016 Page 70
Figure 3-10. Recommended Impervious Retrofit Study Areas
Brookhaven
Perimeter Creek
Bubbling Creek
Dunwoody
Silver Creek
Chamblee
Nancy Creek
North Fork
Nancy C
reek
IA-1
IA-2IA-4
IA-5 IA-7
IA-3
IA-10
IA-9
IA-6
IA-8
IA-14
IA-18
IA-17
IA-19
IA-15
IA-21
IA-12
IA-22
IA-11
IA-16
IA-13
IA-23
IA-25
IA-20
IA-24
IA-27
IA-26
IA-28
Source: Esri, DigitalGlobe, GeoEye, i-cubed, Earthstar Geographics,
CNES/Airbus DS, USDA, USGS, AEX, Getmapping, Aerogrid, IGN, IGP,swisstopo, and the GIS User Community
Recommended ImperviousRetrofit Assessment Areas
Nancy Creek Watershed Improvement Plan
±0 0.2 0.4 0.6 0.80.1
Miles
Retrofit Assessments
NC-1
NC-2
NC-3
NC-4
NC-5
NC-6
NC-7
NC-8
Waterbody
Streams
Cities
Study Area
City of Brookhaven Nancy Creek Watershed Improvement Plan
August 2016 Page 71
3.6 EXISTING WATERSHED PROGRAMS AND RECOMMENDATIONS
A number of ongoing Brookhaven programs and policies benefit the four stated goals of this Plan. These programs are expected
to continue into the future and are outlined here as part of a comprehensive watershed program. Two new programs are
recommended; regional collaboration and implementation tracking. Implementation enhancements are suggested for three of the
existing City programs. Recommended enhancements fall within: enforcement of existing ordinances, public education and
involvement, and city maintenance activities. The existing programs, with recommended enhancements, and the recommended
new programs are described below.
3.6.1. ENFORCEMENT OF EXISTING ORDINANCES
The City enforces several ordinances that provide protection to the Nancy Creek Watershed. A summary of each of these
ordinances is provided below.
Erosion and Sedimentation Control (Section 14-27 through 14-38). Part of the larger Environment Control
ordinance, the City requires land disturbance projects that are greater than 1 acre in size to be permitted and
implement best practices to prevent the migration of sediment. Maintaining sediment on active land disturbance sites
keeps it out of the Nancy Creek watershed.
Post-Development Stormwater Management (Section 14-27 through 14-38). Part of the larger Environmental
Control ordinance, the City requires projects that add or modify more than 5,000 square feet of impervious area to
mitigate the stormwater quality and quantity impacts. The ordinance was expanded in March 2016 requiring single-
family projects that add, modify, or construct more than 3,000 square feet of impervious area to manage the water
quality volume. This ordinance, with amendments, follows the standards outlined in the Georgia Stormwater
Management Manual. New development and redevelopment projects in the Nancy Creek watershed are required to
construct stormwater controls designed to meet water quality standards and prevent future flooding. Property owners
are also required to sign a maintenance agreement.
Stream Buffers (Section 14-44). The stream buffer protection ordinance protects the riparian buffer during land
disturbance activities. The protections include a 50-foot undisturbed buffer with an additional 25-foot impervious
setback from the point of wrested vegetation on both sides of a stream. This buffer requirement aligns with the state
25-foot water quality buffer. Stream buffers play a critical role in the protection of stream health.
Tree Protection and Replacement (Section 14-39). Revised in 2015, the Tree Protection and Replacement
ordinance protects the existing tree canopy in Brookhaven and requires recompense for tree removal through onsite
planting, offsite planting, or payment into a Tree Recompense Fund. The Tree Recompense Fund can be used to plant
trees on public property and/or to promote healthy urban forests on public property. Permits are required for tree
removal, providing additional protection to the stream buffer even if land is not disturbed.
Floodplain Management (Chapter 14, Article IV). This ordinance establishes restrictions on land development and
construction activities within known floodplain and floodway areas. The ordinance protects public health, safety, and
well being but also benefits watershed health by preserving floodplains to mitigate stormwater flows during rain events.
These ordinances are consistent with the MNGWPD requirements and are considered to be protective of watershed health.
These ordinances, or their equivalent, are also implemented in the other jurisdictions within the Study Area. Additional
ordinances are not recommended at this time. The City should continue to implement these ordinances and ensure that staff and
contractors are properly trained.
This Plan recommends one minor enhancement to the application of the Tree Recompense Fund within the Tree Protection and
Replacement Ordinance. Currently, the ordinance allows the City Arborist to direct money that is paid into the recompense fund
toward the “promotion of a healthy urban forest.” Invasive species were identified throughout the Brookhaven portion of the Study
Area both in the riparian buffer and within City-owned parks. This Plan recommends using the accumulated funds to remove
invasive species and re-vegetate to healthy forest densities. Directing these funds to riparian areas will benefit watershed health
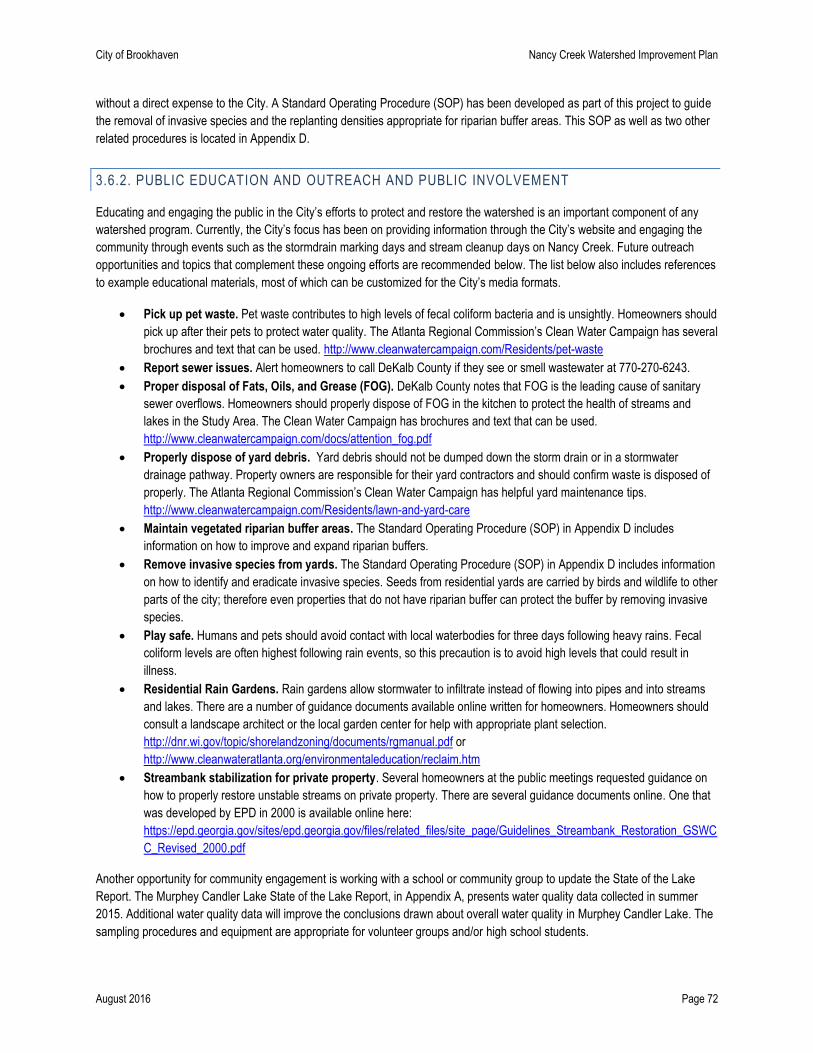
City of Brookhaven Nancy Creek Watershed Improvement Plan
August 2016 Page 72
without a direct expense to the City. A Standard Operating Procedure (SOP) has been developed as part of this project to guide
the removal of invasive species and the replanting densities appropriate for riparian buffer areas. This SOP as well as two other
related procedures is located in Appendix D.
3.6.2. PUBLIC EDUCATION AND OUTREACH AND PUBLIC INVOLVEMENT
Educating and engaging the public in the City’s efforts to protect and restore the watershed is an important component of any
watershed program. Currently, the City’s focus has been on providing information through the City’s website and engaging the
community through events such as the stormdrain marking days and stream cleanup days on Nancy Creek. Future outreach
opportunities and topics that complement these ongoing efforts are recommended below. The list below also includes references
to example educational materials, most of which can be customized for the City’s media formats.
Pick up pet waste. Pet waste contributes to high levels of fecal coliform bacteria and is unsightly. Homeowners should
pick up after their pets to protect water quality. The Atlanta Regional Commission’s Clean Water Campaign has several
brochures and text that can be used. http://www.cleanwatercampaign.com/Residents/pet-waste
Report sewer issues. Alert homeowners to call DeKalb County if they see or smell wastewater at 770-270-6243.
Proper disposal of Fats, Oils, and Grease (FOG). DeKalb County notes that FOG is the leading cause of sanitary
sewer overflows. Homeowners should properly dispose of FOG in the kitchen to protect the health of streams and
lakes in the Study Area. The Clean Water Campaign has brochures and text that can be used.
http://www.cleanwatercampaign.com/docs/attention_fog.pdf
Properly dispose of yard debris. Yard debris should not be dumped down the storm drain or in a stormwater
drainage pathway. Property owners are responsible for their yard contractors and should confirm waste is disposed of
properly. The Atlanta Regional Commission’s Clean Water Campaign has helpful yard maintenance tips.
http://www.cleanwatercampaign.com/Residents/lawn-and-yard-care
Maintain vegetated riparian buffer areas. The Standard Operating Procedure (SOP) in Appendix D includes
information on how to improve and expand riparian buffers.
Remove invasive species from yards. The Standard Operating Procedure (SOP) in Appendix D includes information
on how to identify and eradicate invasive species. Seeds from residential yards are carried by birds and wildlife to other
parts of the city; therefore even properties that do not have riparian buffer can protect the buffer by removing invasive
species.
Play safe. Humans and pets should avoid contact with local waterbodies for three days following heavy rains. Fecal
coliform levels are often highest following rain events, so this precaution is to avoid high levels that could result in
illness.
Residential Rain Gardens. Rain gardens allow stormwater to infiltrate instead of flowing into pipes and into streams
and lakes. There are a number of guidance documents available online written for homeowners. Homeowners should
consult a landscape architect or the local garden center for help with appropriate plant selection.
http://dnr.wi.gov/topic/shorelandzoning/documents/rgmanual.pdf or
http://www.cleanwateratlanta.org/environmentaleducation/reclaim.htm
Streambank stabilization for private property. Several homeowners at the public meetings requested guidance on
how to properly restore unstable streams on private property. There are several guidance documents online. One that
was developed by EPD in 2000 is available online here:
https://epd.georgia.gov/sites/epd.georgia.gov/files/related_files/site_page/Guidelines_Streambank_Restoration_GSWC
C_Revised_2000.pdf
Another opportunity for community engagement is working with a school or community group to update the State of the Lake
Report. The Murphey Candler Lake State of the Lake Report, in Appendix A, presents water quality data collected in summer
2015. Additional water quality data will improve the conclusions drawn about overall water quality in Murphey Candler Lake. The
sampling procedures and equipment are appropriate for volunteer groups and/or high school students.
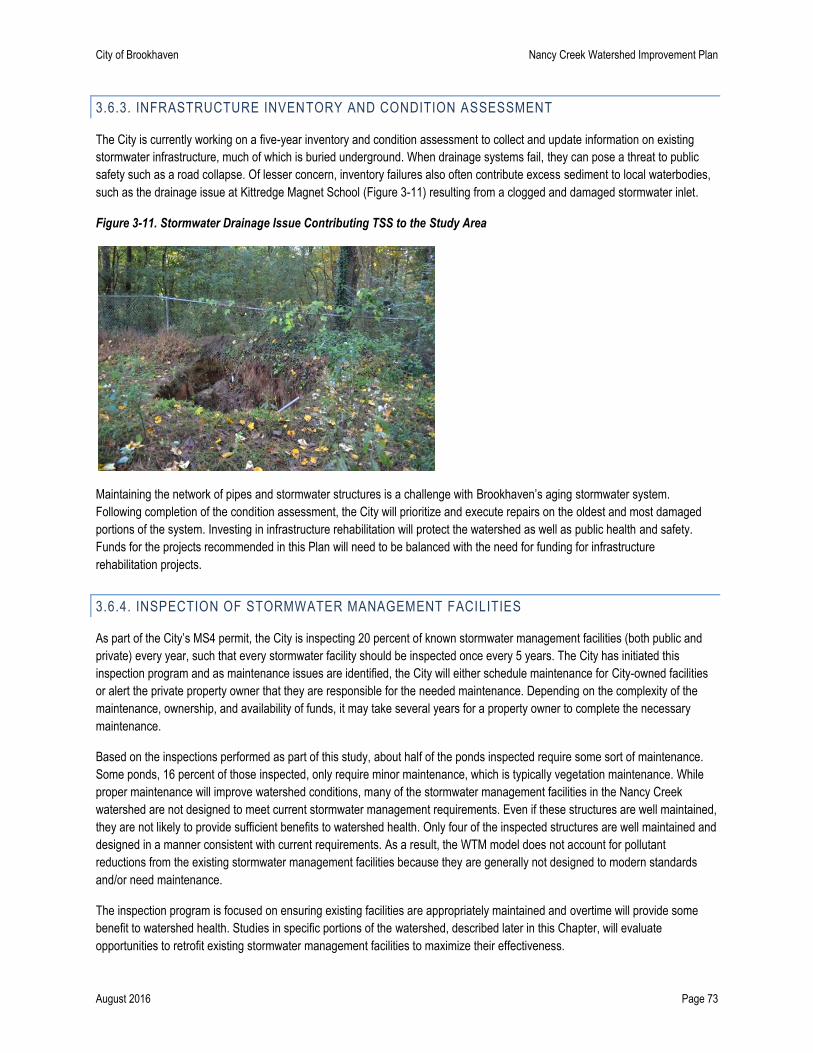
City of Brookhaven Nancy Creek Watershed Improvement Plan
August 2016 Page 73
3.6.3. INFRASTRUCTURE INVENTORY AND CONDITION ASSESSMENT
The City is currently working on a five-year inventory and condition assessment to collect and update information on existing
stormwater infrastructure, much of which is buried underground. When drainage systems fail, they can pose a threat to public
safety such as a road collapse. Of lesser concern, inventory failures also often contribute excess sediment to local waterbodies,
such as the drainage issue at Kittredge Magnet School (Figure 3-11) resulting from a clogged and damaged stormwater inlet.
Figure 3-11. Stormwater Drainage Issue Contributing TSS to the Study Area
Maintaining the network of pipes and stormwater structures is a challenge with Brookhaven’s aging stormwater system.
Following completion of the condition assessment, the City will prioritize and execute repairs on the oldest and most damaged
portions of the system. Investing in infrastructure rehabilitation will protect the watershed as well as public health and safety.
Funds for the projects recommended in this Plan will need to be balanced with the need for funding for infrastructure
rehabilitation projects.
3.6.4. INSPECTION OF STORMWATER MANAGEMENT FACILITIES
As part of the City’s MS4 permit, the City is inspecting 20 percent of known stormwater management facilities (both public and
private) every year, such that every stormwater facility should be inspected once every 5 years. The City has initiated this
inspection program and as maintenance issues are identified, the City will either schedule maintenance for City-owned facilities
or alert the private property owner that they are responsible for the needed maintenance. Depending on the complexity of the
maintenance, ownership, and availability of funds, it may take several years for a property owner to complete the necessary
maintenance.
Based on the inspections performed as part of this study, about half of the ponds inspected require some sort of maintenance.
Some ponds, 16 percent of those inspected, only require minor maintenance, which is typically vegetation maintenance. While
proper maintenance will improve watershed conditions, many of the stormwater management facilities in the Nancy Creek
watershed are not designed to meet current stormwater management requirements. Even if these structures are well maintained,
they are not likely to provide sufficient benefits to watershed health. Only four of the inspected structures are well maintained and
designed in a manner consistent with current requirements. As a result, the WTM model does not account for pollutant
reductions from the existing stormwater management facilities because they are generally not designed to modern standards
and/or need maintenance.
The inspection program is focused on ensuring existing facilities are appropriately maintained and overtime will provide some
benefit to watershed health. Studies in specific portions of the watershed, described later in this Chapter, will evaluate
opportunities to retrofit existing stormwater management facilities to maximize their effectiveness.
City of Brookhaven Nancy Creek Watershed Improvement Plan
August 2016 Page 74
3.6.5. CITY MAINTENANCE ACTIVITIES
The City and its contractors are responsible for maintaining City-owned properties including two parks that are located within the
Study Area: Murphey Candler Park and Blackburn Park. Three SOPs to guide maintenance activities in a manner that protects
the watershed are included in this Plan. Working with City staff and the stakeholders group, the three SOPs include:
SOP #1. Performing Maintenance in an Established Vegetated Buffers;
SOP #2. Removing Invasive Species from and Replanting the Vegetated Buffer; and
SOP #3. Caring for Newly Established Riparian Buffers.
These SOPs are intended to guide work performed in and around riparian buffer areas within Brookhaven. While the target
audience for these SOPs is City staff and/or their contractors, the practices outlined are appropriate for any property owner living
along a waterbody. These SOPs are located in Appendix D.
3.6.6. REGIONAL WATERSHED COORDINATION
The Study Area includes portions of four jurisdictions in addition to Brookhaven. One of the intentions for this Plan is to cultivate
a shared interest in the health of Nancy Creek and the Study Area through collaboration. Moving forward, this Plan suggests
annual meetings to discuss the Nancy Creek Watershed with representatives from Brookhaven, Chamblee, Doraville,
Dunwoody, and Sandy Springs. The annual meetings can provide an opportunity to share water quality data, discuss upcoming
watershed projects, and explore potential regional funding sources.
3.6.7. IMPLEMENTATION TRACKING
This Plan recommends projects that will be implemented over the next 50 years, or more. The projects are identified based on
current watershed conditions and expectations for the future. Tracking progress by collecting new data and revising this Plan is
recommended every 10 years. New monitoring data and updated modeling can be used to measure the progress toward this
Plan’s goals.
In addition to updating the Plan every 10 years, it is important to continue reviewing the data collected by DeKalb County
Watershed Management at the three sampling stations within the Study Area on an annual basis. This recommendation is
consistent with the City’s Impaired Waters Plan. If substantial changes are seen in the annual water quality data, the timing of the
update to this Plan may be adjusted to reflect improved conditions or new pollutants of concern.
City of Brookhaven Nancy Creek Watershed Improvement Plan
August 2016 Page 75
CHAPTER 4: IMPLEMENTATION PLAN
This Chapter presents the information needed to schedule and budget for the projects and studies recommended in this Plan. An
overview of the methodology used to estimate planning level costs for the identified projects and studies is presented as well as
the ultimate estimated total costs for implementation (i.e., construction, maintenance, and long-term maintenance). A list of viable
funding and financing sources is presented with a list of grants that are tailored to the recommended projects. This Chapter also
presents the ranking methodology developed to prioritize implementation of the projects presented in Chapter 3.
The implementation plan outlines the top projects based on the project ranking and public input anticipated for the first 10 years.
Additionally, there is a short-term work plan that includes a greater level of detail for projects that suggested within the first 5
years. Ultimately, the City will adjust the timing based on funding and other City priorities.
4.1. IMPLEMENTATION COSTS
Planning level implementation costs are estimated for each of the recommended projects and studies identified in Chapter 3. The
planning level costs are used to calculate the cost to benefit ratio, which is an important metric used to compare projects to each
other. The basis for the planning level costs for both the 43 recommended projects and the 28 recommended retrofit
assessments is described below. Planning level costs are helpful for long-range budgeting but are not the same as more detailed
engineering costs that are developed based on a specific project design.
4.1.2. RECOMMENDED PROJECT COST ESTIMATION METHODOLOGY AND ASSUMPTIONS
The planning level costs include three components: construction costs, detailed study/ permitting/ engineering costs, and
ongoing maintenance costs following construction. The construction costs are based on unit costs. The detailed study,
permitting, engineering and the maintenance costs are calculated based on a percentage of the construction costs. Land
acquisition costs are not estimated at this time as these are more appropriately calculated during a detailed study or design
phase. However, land acquisition costs may be significant if a project is not on City-owned land or if an easement cannot be
obtained. Contingency costs are not included due to the planning level nature of these estimates.
4.1.2.1. CAPITAL CONSTRUCTION COSTS
Unit costs for construction are based on actual and estimated construction costs from recent similar projects and from literature
research. The costs for new and retrofit BMPs, trash racks, and stream enhancement projects are outlined below.
New and Retrofit Stormwater BMPs: Costs for new and retrofit stormwater BMPs are based on the land use and hydraulic soil
group most dominant in the drainage area for that BMP, as shown in Table 4-1. The most dominant land use is based on the
City’s land use GIS information and the drainage basin served by that feature, delineated as part of this Plan. The hydraulic soil
group reflects the most common soil within the project’s drainage basin, using the NRCS soils data. The cost estimates assume
the selected BMP is capable of removing 80 percent of the TSS pollutant load, consistent with the Georgia Stormwater
Management Manual xv, to support the 35 percent TSS load reduction goal for this Plan.
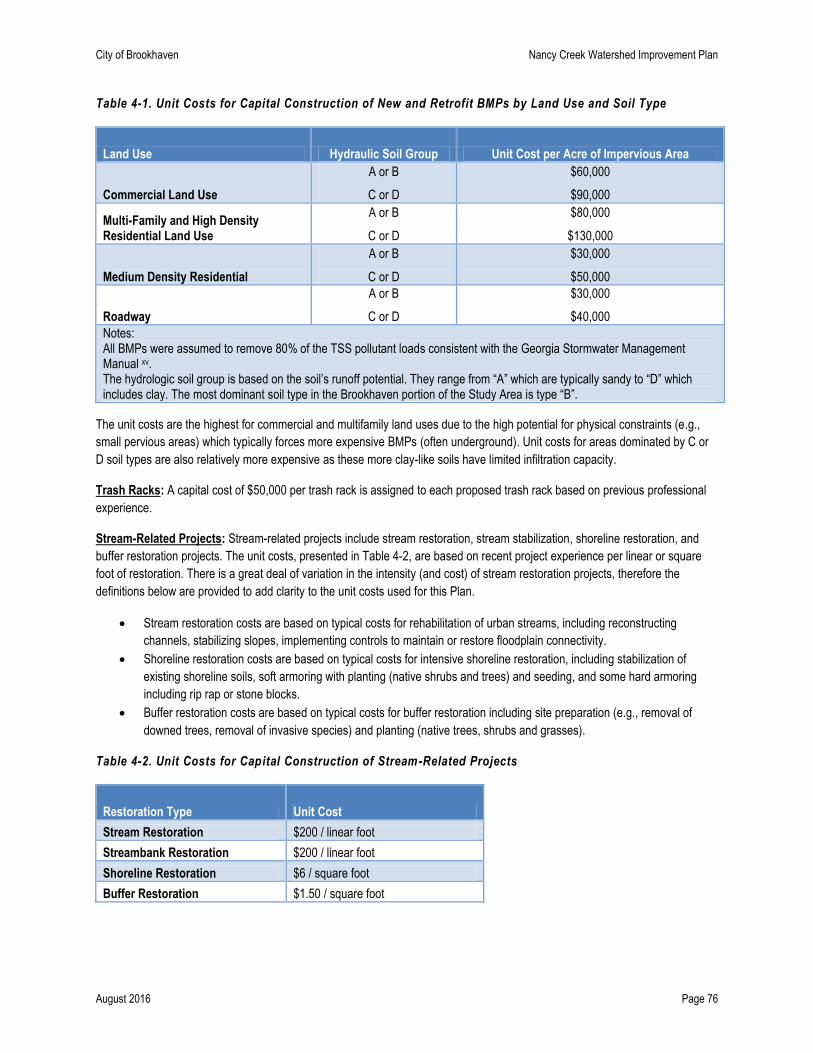
City of Brookhaven Nancy Creek Watershed Improvement Plan
August 2016 Page 76
Table 4-1. Unit Costs for Capital Construction of New and Retrofit BMPs by Land Use and Soil Type
Land Use Hydraulic Soil Group Unit Cost per Acre of Impervious Area
Commercial Land Use
A or B
C or D
$60,000
$90,000
Multi-Family and High Density Residential Land Use
A or B
C or D
$80,000
$130,000
Medium Density Residential
A or B
C or D
$30,000
$50,000
Roadway
A or B
C or D
$30,000
$40,000
Notes: All BMPs were assumed to remove 80% of the TSS pollutant loads consistent with the Georgia Stormwater Management Manual xv. The hydrologic soil group is based on the soil’s runoff potential. They range from “A” which are typically sandy to “D” which includes clay. The most dominant soil type in the Brookhaven portion of the Study Area is type “B”.
The unit costs are the highest for commercial and multifamily land uses due to the high potential for physical constraints (e.g.,
small pervious areas) which typically forces more expensive BMPs (often underground). Unit costs for areas dominated by C or
D soil types are also relatively more expensive as these more clay-like soils have limited infiltration capacity.
Trash Racks: A capital cost of $50,000 per trash rack is assigned to each proposed trash rack based on previous professional
experience.
Stream-Related Projects: Stream-related projects include stream restoration, stream stabilization, shoreline restoration, and
buffer restoration projects. The unit costs, presented in Table 4-2, are based on recent project experience per linear or square
foot of restoration. There is a great deal of variation in the intensity (and cost) of stream restoration projects, therefore the
definitions below are provided to add clarity to the unit costs used for this Plan.
Stream restoration costs are based on typical costs for rehabilitation of urban streams, including reconstructing
channels, stabilizing slopes, implementing controls to maintain or restore floodplain connectivity.
Shoreline restoration costs are based on typical costs for intensive shoreline restoration, including stabilization of
existing shoreline soils, soft armoring with planting (native shrubs and trees) and seeding, and some hard armoring
including rip rap or stone blocks.
Buffer restoration costs are based on typical costs for buffer restoration including site preparation (e.g., removal of
downed trees, removal of invasive species) and planting (native trees, shrubs and grasses).
Table 4-2. Unit Costs for Capital Construction of Stream-Related Projects
Restoration Type Unit Cost
Stream Restoration $200 / linear foot
Streambank Restoration $200 / linear foot
Shoreline Restoration $6 / square foot
Buffer Restoration $1.50 / square foot
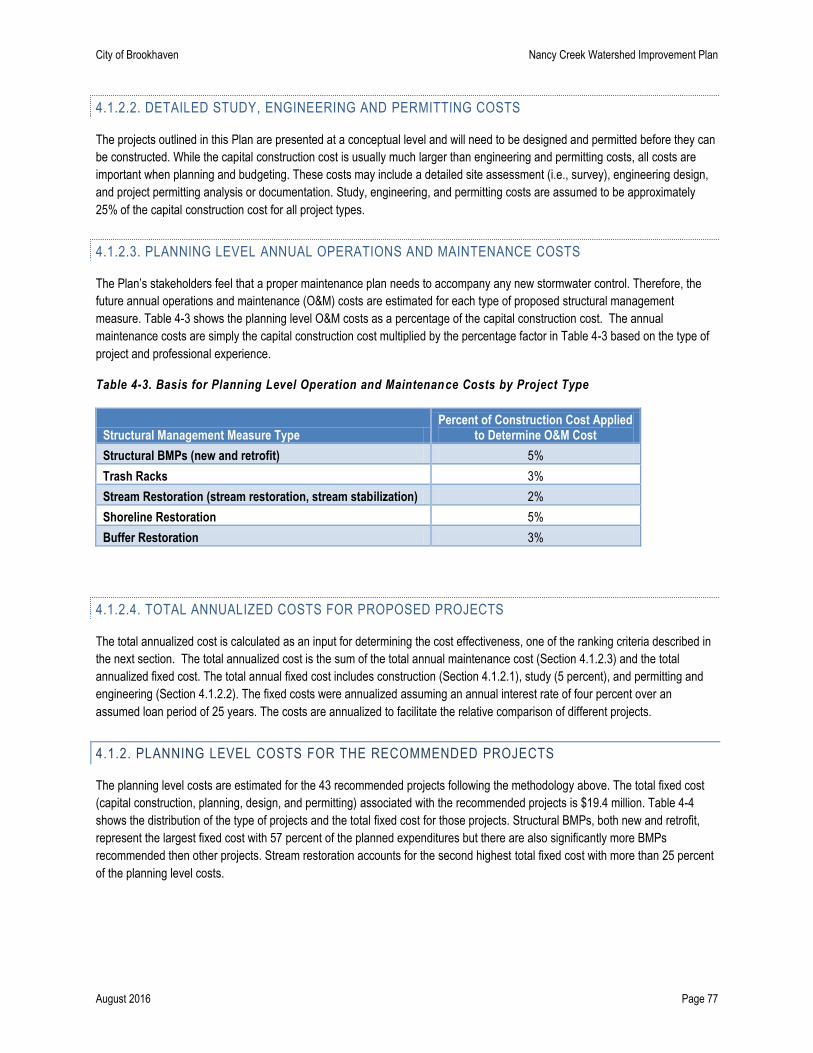
City of Brookhaven Nancy Creek Watershed Improvement Plan
August 2016 Page 77
4.1.2.2. DETAILED STUDY, ENGINEERING AND PERMITTING COSTS
The projects outlined in this Plan are presented at a conceptual level and will need to be designed and permitted before they can
be constructed. While the capital construction cost is usually much larger than engineering and permitting costs, all costs are
important when planning and budgeting. These costs may include a detailed site assessment (i.e., survey), engineering design,
and project permitting analysis or documentation. Study, engineering, and permitting costs are assumed to be approximately
25% of the capital construction cost for all project types.
4.1.2.3. PLANNING LEVEL ANNUAL OPERATIONS AND MAINTENANCE COSTS
The Plan’s stakeholders feel that a proper maintenance plan needs to accompany any new stormwater control. Therefore, the
future annual operations and maintenance (O&M) costs are estimated for each type of proposed structural management
measure. Table 4-3 shows the planning level O&M costs as a percentage of the capital construction cost. The annual
maintenance costs are simply the capital construction cost multiplied by the percentage factor in Table 4-3 based on the type of
project and professional experience.
Table 4-3. Basis for Planning Level Operation and Maintenance Costs by Project Type
Structural Management Measure Type Percent of Construction Cost Applied
to Determine O&M Cost
Structural BMPs (new and retrofit) 5%
Trash Racks 3%
Stream Restoration (stream restoration, stream stabilization) 2%
Shoreline Restoration 5%
Buffer Restoration 3%
4.1.2.4. TOTAL ANNUALIZED COSTS FOR PROPOSED PROJECTS
The total annualized cost is calculated as an input for determining the cost effectiveness, one of the ranking criteria described in
the next section. The total annualized cost is the sum of the total annual maintenance cost (Section 4.1.2.3) and the total
annualized fixed cost. The total annual fixed cost includes construction (Section 4.1.2.1), study (5 percent), and permitting and
engineering (Section 4.1.2.2). The fixed costs were annualized assuming an annual interest rate of four percent over an
assumed loan period of 25 years. The costs are annualized to facilitate the relative comparison of different projects.
4.1.2. PLANNING LEVEL COSTS FOR THE RECOMMENDED PROJECTS
The planning level costs are estimated for the 43 recommended projects following the methodology above. The total fixed cost
(capital construction, planning, design, and permitting) associated with the recommended projects is $19.4 million. Table 4-4
shows the distribution of the type of projects and the total fixed cost for those projects. Structural BMPs, both new and retrofit,
represent the largest fixed cost with 57 percent of the planned expenditures but there are also significantly more BMPs
recommended then other projects. Stream restoration accounts for the second highest total fixed cost with more than 25 percent
of the planning level costs.
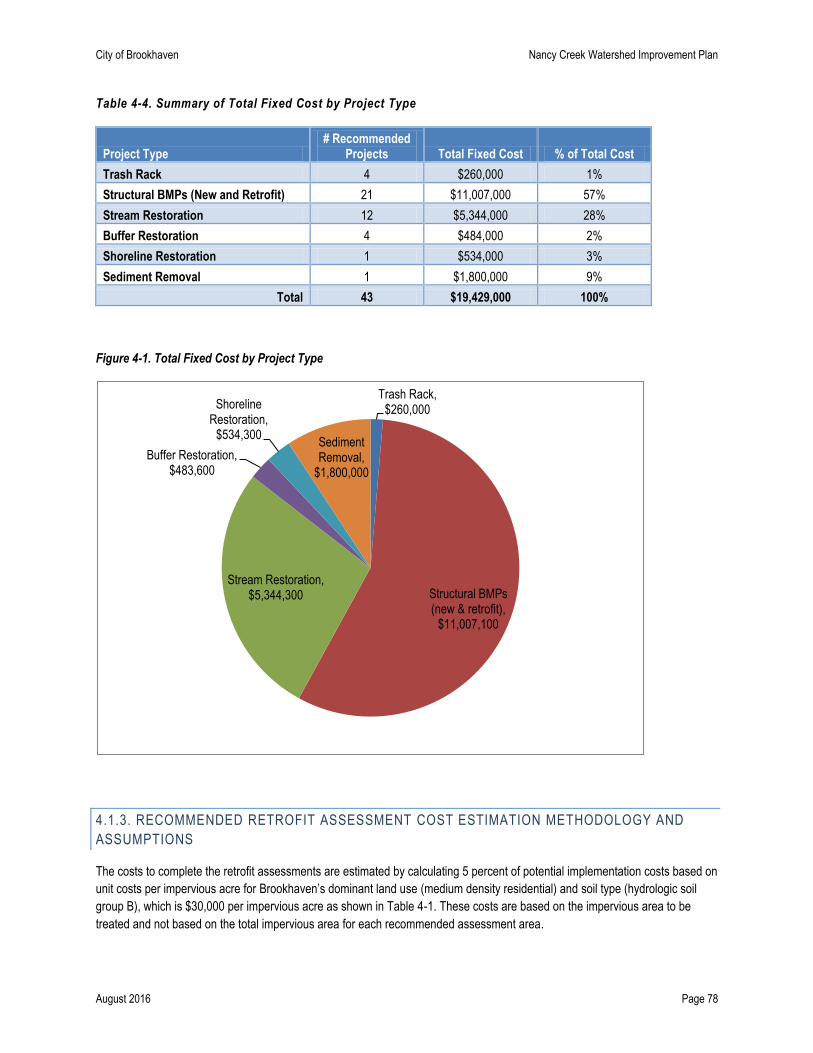
City of Brookhaven Nancy Creek Watershed Improvement Plan
August 2016 Page 78
Table 4-4. Summary of Total Fixed Cost by Project Type
Project Type # Recommended
Projects Total Fixed Cost % of Total Cost
Trash Rack 4 $260,000 1%
Structural BMPs (New and Retrofit) 21 $11,007,000 57%
Stream Restoration 12 $5,344,000 28%
Buffer Restoration 4 $484,000 2%
Shoreline Restoration 1 $534,000 3%
Sediment Removal 1 $1,800,000 9%
Total 43 $19,429,000 100%
Figure 4-1. Total Fixed Cost by Project Type
4.1.3. RECOMMENDED RETROFIT ASSESSMENT COST ESTIMATION METHODOLOGY AND
ASSUMPTIONS
The costs to complete the retrofit assessments are estimated by calculating 5 percent of potential implementation costs based on
unit costs per impervious acre for Brookhaven’s dominant land use (medium density residential) and soil type (hydrologic soil
group B), which is $30,000 per impervious acre as shown in Table 4-1. These costs are based on the impervious area to be
treated and not based on the total impervious area for each recommended assessment area.
Trash Rack, $260,000
Structural BMPs (new & retrofit),
$11,007,100
Stream Restoration, $5,344,300
Buffer Restoration, $483,600
Shoreline Restoration,
$534,300 Sediment Removal,
$1,800,000
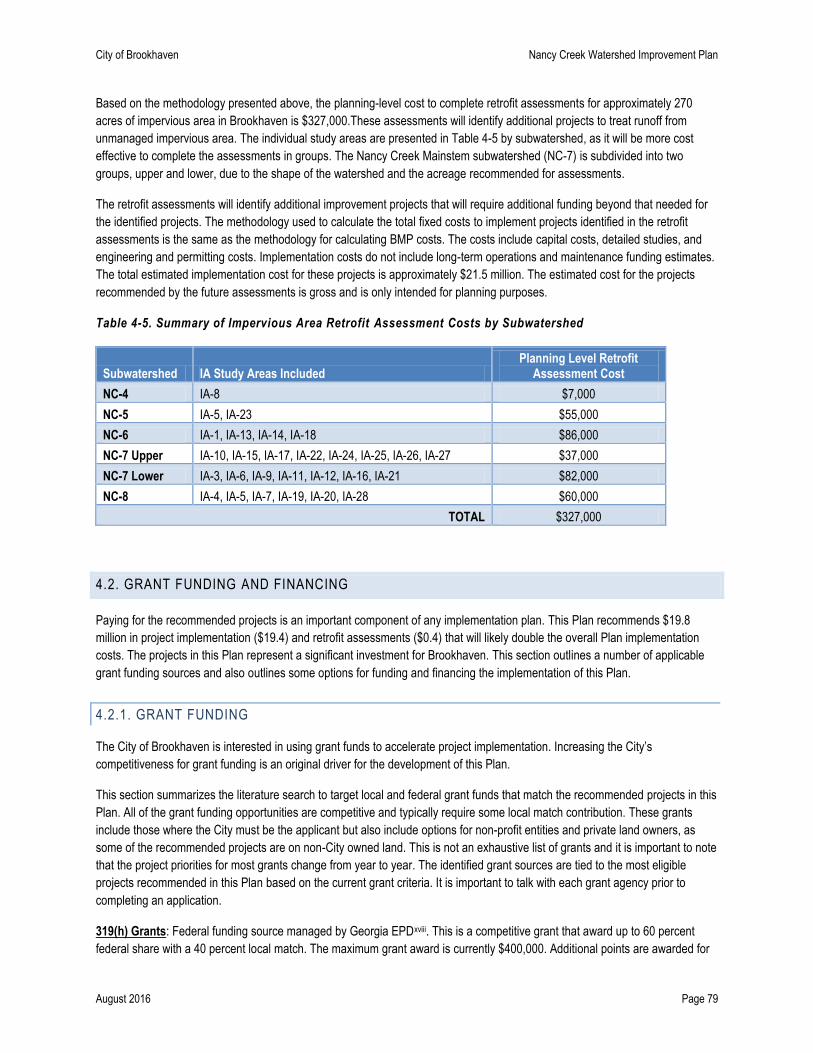
City of Brookhaven Nancy Creek Watershed Improvement Plan
August 2016 Page 79
Based on the methodology presented above, the planning-level cost to complete retrofit assessments for approximately 270
acres of impervious area in Brookhaven is $327,000.These assessments will identify additional projects to treat runoff from
unmanaged impervious area. The individual study areas are presented in Table 4-5 by subwatershed, as it will be more cost
effective to complete the assessments in groups. The Nancy Creek Mainstem subwatershed (NC-7) is subdivided into two
groups, upper and lower, due to the shape of the watershed and the acreage recommended for assessments.
The retrofit assessments will identify additional improvement projects that will require additional funding beyond that needed for
the identified projects. The methodology used to calculate the total fixed costs to implement projects identified in the retrofit
assessments is the same as the methodology for calculating BMP costs. The costs include capital costs, detailed studies, and
engineering and permitting costs. Implementation costs do not include long-term operations and maintenance funding estimates.
The total estimated implementation cost for these projects is approximately $21.5 million. The estimated cost for the projects
recommended by the future assessments is gross and is only intended for planning purposes.
Table 4-5. Summary of Impervious Area Retrofit Assessment Costs by Subwatershed
Subwatershed IA Study Areas Included Planning Level Retrofit
Assessment Cost
NC-4 IA-8 $7,000
NC-5 IA-5, IA-23 $55,000
NC-6 IA-1, IA-13, IA-14, IA-18 $86,000
NC-7 Upper IA-10, IA-15, IA-17, IA-22, IA-24, IA-25, IA-26, IA-27 $37,000
NC-7 Lower IA-3, IA-6, IA-9, IA-11, IA-12, IA-16, IA-21 $82,000
NC-8 IA-4, IA-5, IA-7, IA-19, IA-20, IA-28 $60,000
TOTAL $327,000
4.2. GRANT FUNDING AND FINANCING
Paying for the recommended projects is an important component of any implementation plan. This Plan recommends $19.8
million in project implementation ($19.4) and retrofit assessments ($0.4) that will likely double the overall Plan implementation
costs. The projects in this Plan represent a significant investment for Brookhaven. This section outlines a number of applicable
grant funding sources and also outlines some options for funding and financing the implementation of this Plan.
4.2.1. GRANT FUNDING
The City of Brookhaven is interested in using grant funds to accelerate project implementation. Increasing the City’s
competitiveness for grant funding is an original driver for the development of this Plan.
This section summarizes the literature search to target local and federal grant funds that match the recommended projects in this
Plan. All of the grant funding opportunities are competitive and typically require some local match contribution. These grants
include those where the City must be the applicant but also include options for non-profit entities and private land owners, as
some of the recommended projects are on non-City owned land. This is not an exhaustive list of grants and it is important to note
that the project priorities for most grants change from year to year. The identified grant sources are tied to the most eligible
projects recommended in this Plan based on the current grant criteria. It is important to talk with each grant agency prior to
completing an application.
319(h) Grants: Federal funding source managed by Georgia EPDxviii. This is a competitive grant that award up to 60 percent
federal share with a 40 percent local match. The maximum grant award is currently $400,000. Additional points are awarded for
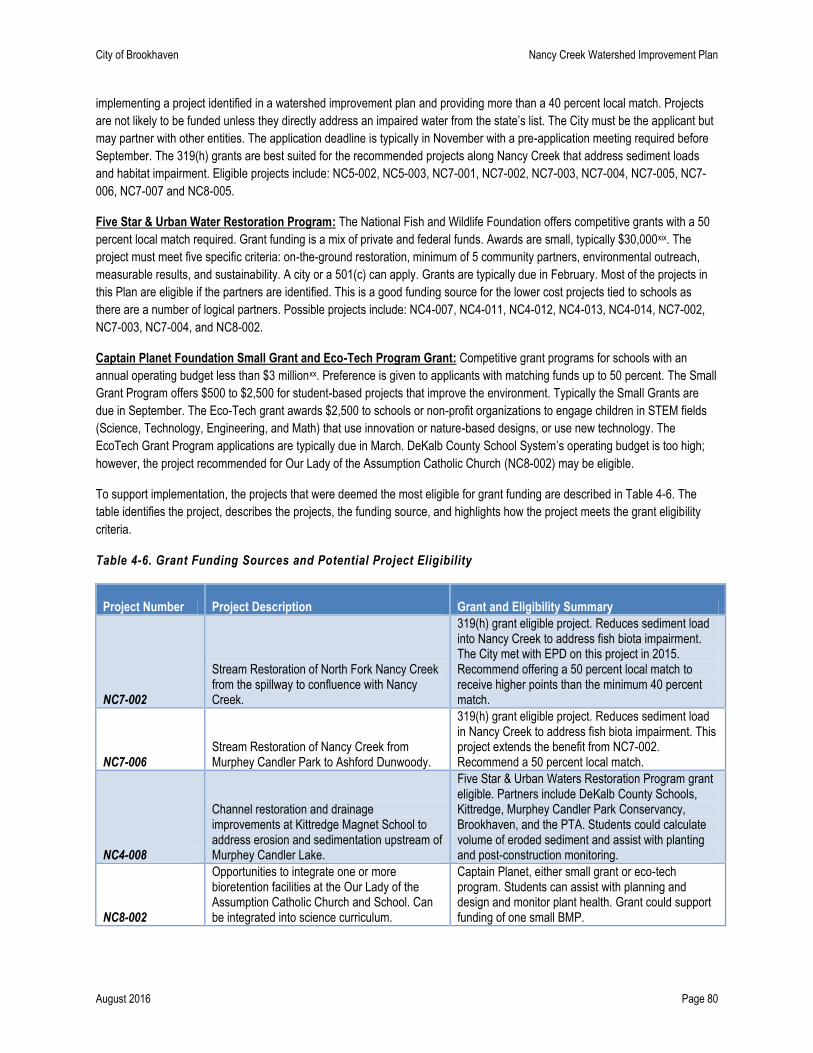
City of Brookhaven Nancy Creek Watershed Improvement Plan
August 2016 Page 80
implementing a project identified in a watershed improvement plan and providing more than a 40 percent local match. Projects
are not likely to be funded unless they directly address an impaired water from the state’s list. The City must be the applicant but
may partner with other entities. The application deadline is typically in November with a pre-application meeting required before
September. The 319(h) grants are best suited for the recommended projects along Nancy Creek that address sediment loads
and habitat impairment. Eligible projects include: NC5-002, NC5-003, NC7-001, NC7-002, NC7-003, NC7-004, NC7-005, NC7-
006, NC7-007 and NC8-005.
Five Star & Urban Water Restoration Program: The National Fish and Wildlife Foundation offers competitive grants with a 50
percent local match required. Grant funding is a mix of private and federal funds. Awards are small, typically $30,000xix. The
project must meet five specific criteria: on-the-ground restoration, minimum of 5 community partners, environmental outreach,
measurable results, and sustainability. A city or a 501(c) can apply. Grants are typically due in February. Most of the projects in
this Plan are eligible if the partners are identified. This is a good funding source for the lower cost projects tied to schools as
there are a number of logical partners. Possible projects include: NC4-007, NC4-011, NC4-012, NC4-013, NC4-014, NC7-002,
NC7-003, NC7-004, and NC8-002.
Captain Planet Foundation Small Grant and Eco-Tech Program Grant: Competitive grant programs for schools with an
annual operating budget less than $3 millionxx. Preference is given to applicants with matching funds up to 50 percent. The Small
Grant Program offers $500 to $2,500 for student-based projects that improve the environment. Typically the Small Grants are
due in September. The Eco-Tech grant awards $2,500 to schools or non-profit organizations to engage children in STEM fields
(Science, Technology, Engineering, and Math) that use innovation or nature-based designs, or use new technology. The
EcoTech Grant Program applications are typically due in March. DeKalb County School System’s operating budget is too high;
however, the project recommended for Our Lady of the Assumption Catholic Church (NC8-002) may be eligible.
To support implementation, the projects that were deemed the most eligible for grant funding are described in Table 4-6. The
table identifies the project, describes the projects, the funding source, and highlights how the project meets the grant eligibility
criteria.
Table 4-6. Grant Funding Sources and Potential Project Eligibility
Project Number Project Description Grant and Eligibility Summary
NC7-002
Stream Restoration of North Fork Nancy Creek from the spillway to confluence with Nancy Creek.
319(h) grant eligible project. Reduces sediment load into Nancy Creek to address fish biota impairment. The City met with EPD on this project in 2015. Recommend offering a 50 percent local match to receive higher points than the minimum 40 percent match.
NC7-006 Stream Restoration of Nancy Creek from Murphey Candler Park to Ashford Dunwoody.
319(h) grant eligible project. Reduces sediment load in Nancy Creek to address fish biota impairment. This project extends the benefit from NC7-002. Recommend a 50 percent local match.
NC4-008
Channel restoration and drainage improvements at Kittredge Magnet School to address erosion and sedimentation upstream of Murphey Candler Lake.
Five Star & Urban Waters Restoration Program grant eligible. Partners include DeKalb County Schools, Kittredge, Murphey Candler Park Conservancy, Brookhaven, and the PTA. Students could calculate volume of eroded sediment and assist with planting and post-construction monitoring.
NC8-002
Opportunities to integrate one or more bioretention facilities at the Our Lady of the Assumption Catholic Church and School. Can be integrated into science curriculum.
Captain Planet, either small grant or eco-tech program. Students can assist with planning and design and monitor plant health. Grant could support funding of one small BMP.
City of Brookhaven Nancy Creek Watershed Improvement Plan
August 2016 Page 81
Although not tied to a specific project recommended in this Plan, the Georgia Department of Natural Resources (DNR) has a
Recreational Trails Program (RTP) grantxxi that will fund project s that add and/or maintain outdoor recreational facilities. These
funds could be used to accelerate the removal of invasive species along the trail at Murphey Candler Park or used to fund
creation of the planned trail along Nancy Creek in Murphey Candler Park. The grant requires a 20 percent local match and will
fund projects with total costs between $32,000 and $125,000.
The US Army Corps of Engineers (Corps) also can participate in funding local projects but their participation typically requires a
Congressional authorization and a subsequent appropriation. An authorization is direction from Congress on policies and
priorities the Corps should pursue. Often this happens through the Water Resource Development Act (WRDA) bill or more
recently the Water Resources Reform and Development Act of 2014xxii. WRDA bills’ do not provide funds to conduct activities.
Potential projects for study or construction are submitted by the Corps annually to Congress in February and are considered for
inclusion in the next Congressional Authorization. Once the funds are authorized, they must also be appropriated. Federal
funding appropriations are provided in the annual Energy and Water Development Appropriations Act or other appropriation acts.
The appropriations must be made for both the planning phase funding and the construction phase funding. There are a number
of different continuing authorizations available if funds are appropriated and authorized. The Section 206 ecosystem restoration
program is the most applicable to the recommended projects in this Plan. Per conversations with regional Corps representatives,
there are no appropriated funds for Section 206 however there are funds appropriated to Section 219 for Water Infrastructure
Projects. While there are no strong matches with projects recommended within this Plan and this funding source, these funds
may be able to offset planned expenditures for other infrastructure projects that free funds for implementation of this Plan. There
is also an opportunity for the City to work with Congress to get an appropriation and authorization in the future. While these
opportunities take time to mature, the regional scope of this Plan increases the opportunity and access to such funds.
4.2.2. FUNDING AND FINANCING OPTIONS
While grants can leverage existing funding sources and accelerate Plan implementation, grants will need to be combined with
other funding and financing alternatives. The main source of funding for implementation of recommended projects is expected to
be the City’s existing stormwater utility. Property owners in Brookhaven pay a monthly fee that is based on their impervious area
that is placed into an enterprise fund dedicated to stormwater management. Any of the projects identified in this Plan could be
implemented with stormwater utility funds. It is important to note, however that there is competition for these funds with other
stormwater priorities including infrastructure rehabilitation, flood mitigation projects in other watersheds, and watershed
improvement projects in other watersheds.
Stormwater Utility Fee: Brookhaven has a Stormwater Utility Fee that collects approximately $2.6M annually. This fee funds
salaries, operating expenses, regulatory compliance, and infrastructure rehabilitation. The stormwater utility is an enterprise fund
and there are restrictions on the type of projects that can be funded with this revenue stream. All of the recommended projects
and assessments identified in this Plan, if allocated, can be funded with the stormwater fee; however there is competition for
funds with other stormwater infrastructure projects.
Based on a review of the stormwater utility budget, the short-term work plan presented later in this Plan assumes that
approximately $250,000 per year can be allocated for Plan implementation. The initial projects identified in this Plan represent
approximately $14M in capital projects. At a rate of $250,000 per year, it would take 56 years to implement all of the
recommendations. This timeline does not account for the O&M costs that accrue after a project is completed or the projects that
will be recommended in the retrofit assessment studies. These additional costs will extend the implementation timeframe at the
planned rate of investment.
Additional sources of funding are needed. Other funding and financing mechanisms can be used in combination with the
stormwater utility fee to accelerate implementation. The City could also consider increasing the current fee of $4 per month for
the average single-family household (3,000 square feet of impervious area). Currently, stormwater utility fees in Georgia range
from $1.05 per month in Fayette County to $8.00 per month in Holly Springs, both for 3,000 square feet of impervious area.
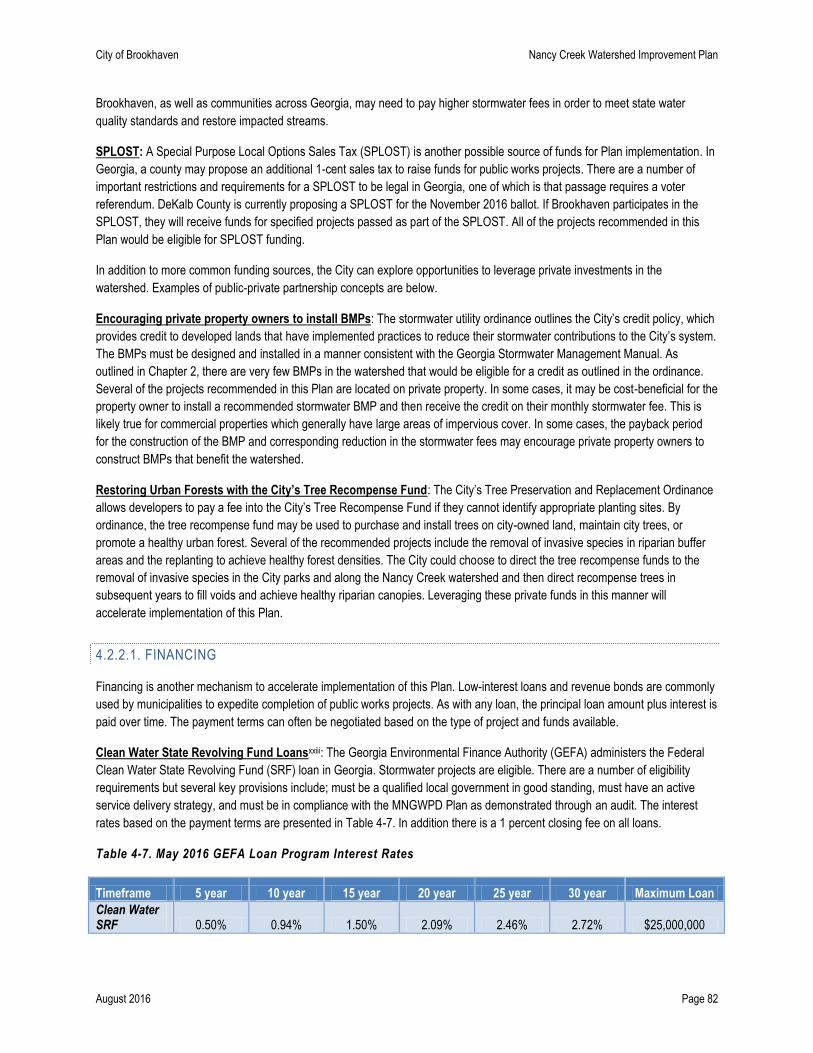
City of Brookhaven Nancy Creek Watershed Improvement Plan
August 2016 Page 82
Brookhaven, as well as communities across Georgia, may need to pay higher stormwater fees in order to meet state water
quality standards and restore impacted streams.
SPLOST: A Special Purpose Local Options Sales Tax (SPLOST) is another possible source of funds for Plan implementation. In
Georgia, a county may propose an additional 1-cent sales tax to raise funds for public works projects. There are a number of
important restrictions and requirements for a SPLOST to be legal in Georgia, one of which is that passage requires a voter
referendum. DeKalb County is currently proposing a SPLOST for the November 2016 ballot. If Brookhaven participates in the
SPLOST, they will receive funds for specified projects passed as part of the SPLOST. All of the projects recommended in this
Plan would be eligible for SPLOST funding.
In addition to more common funding sources, the City can explore opportunities to leverage private investments in the
watershed. Examples of public-private partnership concepts are below.
Encouraging private property owners to install BMPs: The stormwater utility ordinance outlines the City’s credit policy, which
provides credit to developed lands that have implemented practices to reduce their stormwater contributions to the City’s system.
The BMPs must be designed and installed in a manner consistent with the Georgia Stormwater Management Manual. As
outlined in Chapter 2, there are very few BMPs in the watershed that would be eligible for a credit as outlined in the ordinance.
Several of the projects recommended in this Plan are located on private property. In some cases, it may be cost-beneficial for the
property owner to install a recommended stormwater BMP and then receive the credit on their monthly stormwater fee. This is
likely true for commercial properties which generally have large areas of impervious cover. In some cases, the payback period
for the construction of the BMP and corresponding reduction in the stormwater fees may encourage private property owners to
construct BMPs that benefit the watershed.
Restoring Urban Forests with the City’s Tree Recompense Fund: The City’s Tree Preservation and Replacement Ordinance
allows developers to pay a fee into the City’s Tree Recompense Fund if they cannot identify appropriate planting sites. By
ordinance, the tree recompense fund may be used to purchase and install trees on city-owned land, maintain city trees, or
promote a healthy urban forest. Several of the recommended projects include the removal of invasive species in riparian buffer
areas and the replanting to achieve healthy forest densities. The City could choose to direct the tree recompense funds to the
removal of invasive species in the City parks and along the Nancy Creek watershed and then direct recompense trees in
subsequent years to fill voids and achieve healthy riparian canopies. Leveraging these private funds in this manner will
accelerate implementation of this Plan.
4.2.2.1. FINANCING
Financing is another mechanism to accelerate implementation of this Plan. Low-interest loans and revenue bonds are commonly
used by municipalities to expedite completion of public works projects. As with any loan, the principal loan amount plus interest is
paid over time. The payment terms can often be negotiated based on the type of project and funds available.
Clean Water State Revolving Fund Loansxxiii: The Georgia Environmental Finance Authority (GEFA) administers the Federal
Clean Water State Revolving Fund (SRF) loan in Georgia. Stormwater projects are eligible. There are a number of eligibility
requirements but several key provisions include; must be a qualified local government in good standing, must have an active
service delivery strategy, and must be in compliance with the MNGWPD Plan as demonstrated through an audit. The interest
rates based on the payment terms are presented in Table 4-7. In addition there is a 1 percent closing fee on all loans.
Table 4-7. May 2016 GEFA Loan Program Interest Rates
Timeframe 5 year 10 year 15 year 20 year 25 year 30 year Maximum Loan
Clean Water SRF 0.50% 0.94% 1.50% 2.09% 2.46% 2.72% $25,000,000
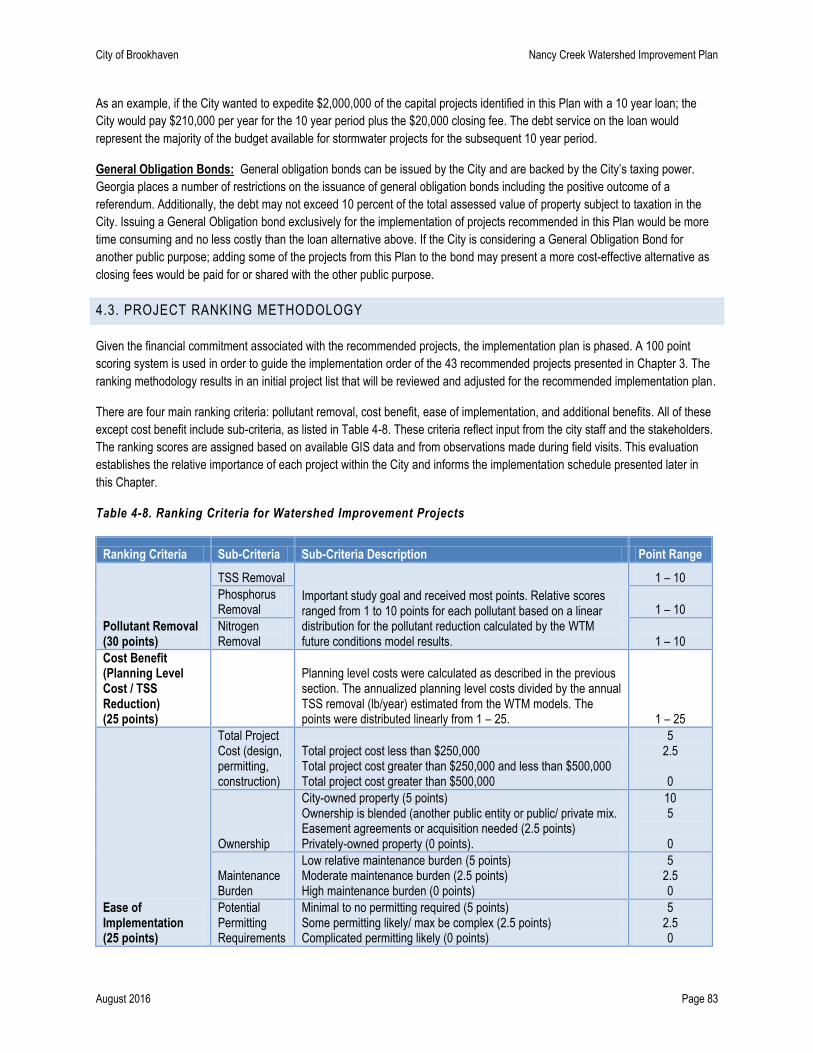
City of Brookhaven Nancy Creek Watershed Improvement Plan
August 2016 Page 83
As an example, if the City wanted to expedite $2,000,000 of the capital projects identified in this Plan with a 10 year loan; the
City would pay $210,000 per year for the 10 year period plus the $20,000 closing fee. The debt service on the loan would
represent the majority of the budget available for stormwater projects for the subsequent 10 year period.
General Obligation Bonds: General obligation bonds can be issued by the City and are backed by the City’s taxing power.
Georgia places a number of restrictions on the issuance of general obligation bonds including the positive outcome of a
referendum. Additionally, the debt may not exceed 10 percent of the total assessed value of property subject to taxation in the
City. Issuing a General Obligation bond exclusively for the implementation of projects recommended in this Plan would be more
time consuming and no less costly than the loan alternative above. If the City is considering a General Obligation Bond for
another public purpose; adding some of the projects from this Plan to the bond may present a more cost-effective alternative as
closing fees would be paid for or shared with the other public purpose.
4.3. PROJECT RANKING METHODOLOGY
Given the financial commitment associated with the recommended projects, the implementation plan is phased. A 100 point
scoring system is used in order to guide the implementation order of the 43 recommended projects presented in Chapter 3. The
ranking methodology results in an initial project list that will be reviewed and adjusted for the recommended implementation plan.
There are four main ranking criteria: pollutant removal, cost benefit, ease of implementation, and additional benefits. All of these
except cost benefit include sub-criteria, as listed in Table 4-8. These criteria reflect input from the city staff and the stakeholders.
The ranking scores are assigned based on available GIS data and from observations made during field visits. This evaluation
establishes the relative importance of each project within the City and informs the implementation schedule presented later in
this Chapter.
Table 4-8. Ranking Criteria for Watershed Improvement Projects
Ranking Criteria Sub-Criteria Sub-Criteria Description Point Range
Pollutant Removal (30 points)
TSS Removal
Important study goal and received most points. Relative scores ranged from 1 to 10 points for each pollutant based on a linear distribution for the pollutant reduction calculated by the WTM future conditions model results.
1 – 10
Phosphorus Removal 1 – 10
Nitrogen Removal 1 – 10
Cost Benefit (Planning Level Cost / TSS Reduction) (25 points)
Planning level costs were calculated as described in the previous section. The annualized planning level costs divided by the annual TSS removal (lb/year) estimated from the WTM models. The points were distributed linearly from 1 – 25. 1 – 25
Ease of Implementation (25 points)
Total Project Cost (design, permitting, construction)
Total project cost less than $250,000 Total project cost greater than $250,000 and less than $500,000 Total project cost greater than $500,000
5 2.5
0
Ownership
City-owned property (5 points) Ownership is blended (another public entity or public/ private mix. Easement agreements or acquisition needed (2.5 points) Privately-owned property (0 points).
10 5
0
Maintenance Burden
Low relative maintenance burden (5 points) Moderate maintenance burden (2.5 points) High maintenance burden (0 points)
5 2.5 0
Potential Permitting Requirements
Minimal to no permitting required (5 points) Some permitting likely/ max be complex (2.5 points) Complicated permitting likely (0 points)
5 2.5 0
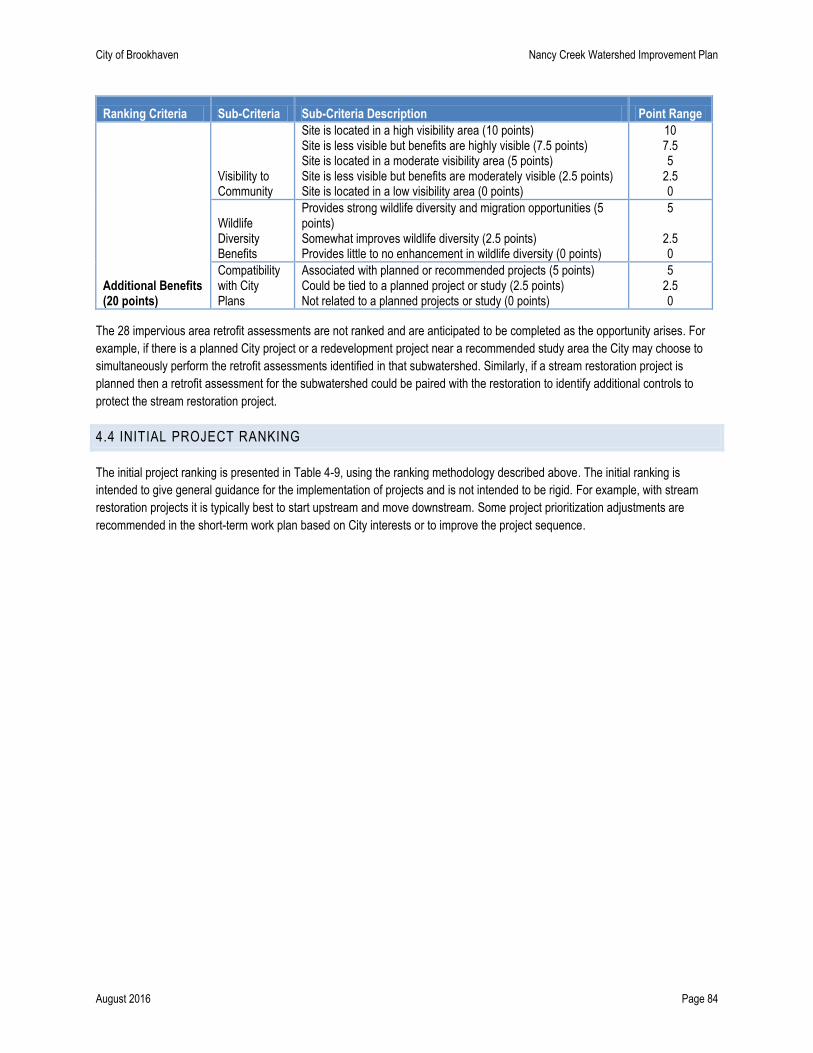
City of Brookhaven Nancy Creek Watershed Improvement Plan
August 2016 Page 84
Ranking Criteria Sub-Criteria Sub-Criteria Description Point Range
Additional Benefits (20 points)
Visibility to Community
Site is located in a high visibility area (10 points) Site is less visible but benefits are highly visible (7.5 points) Site is located in a moderate visibility area (5 points) Site is less visible but benefits are moderately visible (2.5 points) Site is located in a low visibility area (0 points)
10 7.5 5
2.5 0
Wildlife Diversity Benefits
Provides strong wildlife diversity and migration opportunities (5 points) Somewhat improves wildlife diversity (2.5 points) Provides little to no enhancement in wildlife diversity (0 points)
5
2.5 0
Compatibility with City Plans
Associated with planned or recommended projects (5 points) Could be tied to a planned project or study (2.5 points) Not related to a planned projects or study (0 points)
5 2.5 0
The 28 impervious area retrofit assessments are not ranked and are anticipated to be completed as the opportunity arises. For
example, if there is a planned City project or a redevelopment project near a recommended study area the City may choose to
simultaneously perform the retrofit assessments identified in that subwatershed. Similarly, if a stream restoration project is
planned then a retrofit assessment for the subwatershed could be paired with the restoration to identify additional controls to
protect the stream restoration project.
4.4 INITIAL PROJECT RANKING
The initial project ranking is presented in Table 4-9, using the ranking methodology described above. The initial ranking is
intended to give general guidance for the implementation of projects and is not intended to be rigid. For example, with stream
restoration projects it is typically best to start upstream and move downstream. Some project prioritization adjustments are
recommended in the short-term work plan based on City interests or to improve the project sequence.
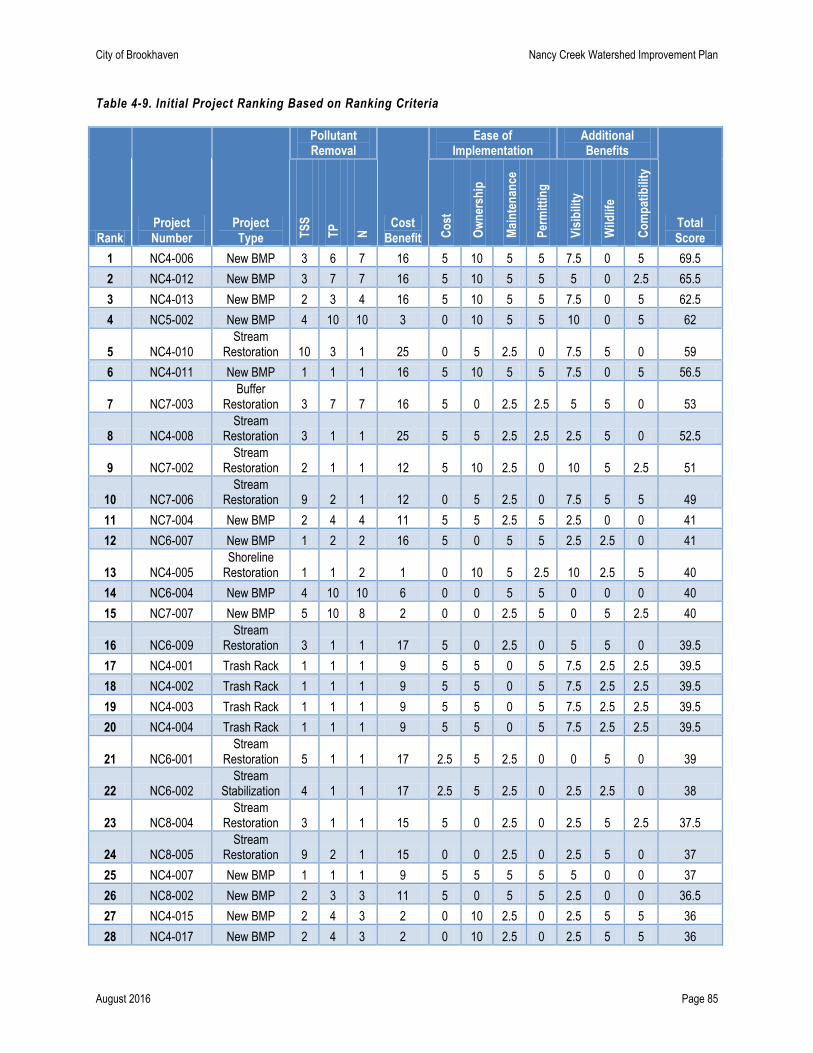
City of Brookhaven Nancy Creek Watershed Improvement Plan
August 2016 Page 85
Table 4-9. Initial Project Ranking Based on Ranking Criteria
Rank Project Number
Project Type
Pollutant Removal
Cost Benefit
Ease of Implementation
Additional Benefits
Total Score T
SS
TP
N
Co
st
Ow
ner
ship
Mai
nte
nan
ce
Per
mit
tin
g
Vis
ibili
ty
Wild
life
Co
mp
atib
ility
1 NC4-006 New BMP 3 6 7 16 5 10 5 5 7.5 0 5 69.5
2 NC4-012 New BMP 3 7 7 16 5 10 5 5 5 0 2.5 65.5
3 NC4-013 New BMP 2 3 4 16 5 10 5 5 7.5 0 5 62.5
4 NC5-002 New BMP 4 10 10 3 0 10 5 5 10 0 5 62
5 NC4-010 Stream
Restoration 10 3 1 25 0 5 2.5 0 7.5 5 0 59
6 NC4-011 New BMP 1 1 1 16 5 10 5 5 7.5 0 5 56.5
7 NC7-003 Buffer
Restoration 3 7 7 16 5 0 2.5 2.5 5 5 0 53
8 NC4-008 Stream
Restoration 3 1 1 25 5 5 2.5 2.5 2.5 5 0 52.5
9 NC7-002 Stream
Restoration 2 1 1 12 5 10 2.5 0 10 5 2.5 51
10 NC7-006 Stream
Restoration 9 2 1 12 0 5 2.5 0 7.5 5 5 49
11 NC7-004 New BMP 2 4 4 11 5 5 2.5 5 2.5 0 0 41
12 NC6-007 New BMP 1 2 2 16 5 0 5 5 2.5 2.5 0 41
13 NC4-005 Shoreline
Restoration 1 1 2 1 0 10 5 2.5 10 2.5 5 40
14 NC6-004 New BMP 4 10 10 6 0 0 5 5 0 0 0 40
15 NC7-007 New BMP 5 10 8 2 0 0 2.5 5 0 5 2.5 40
16 NC6-009 Stream
Restoration 3 1 1 17 5 0 2.5 0 5 5 0 39.5
17 NC4-001 Trash Rack 1 1 1 9 5 5 0 5 7.5 2.5 2.5 39.5
18 NC4-002 Trash Rack 1 1 1 9 5 5 0 5 7.5 2.5 2.5 39.5
19 NC4-003 Trash Rack 1 1 1 9 5 5 0 5 7.5 2.5 2.5 39.5
20 NC4-004 Trash Rack 1 1 1 9 5 5 0 5 7.5 2.5 2.5 39.5
21 NC6-001 Stream
Restoration 5 1 1 17 2.5 5 2.5 0 0 5 0 39
22 NC6-002 Stream
Stabilization 4 1 1 17 2.5 5 2.5 0 2.5 2.5 0 38
23 NC8-004 Stream
Restoration 3 1 1 15 5 0 2.5 0 2.5 5 2.5 37.5
24 NC8-005 Stream
Restoration 9 2 1 15 0 0 2.5 0 2.5 5 0 37
25 NC4-007 New BMP 1 1 1 9 5 5 5 5 5 0 0 37
26 NC8-002 New BMP 2 3 3 11 5 0 5 5 2.5 0 0 36.5
27 NC4-015 New BMP 2 4 3 2 0 10 2.5 0 2.5 5 5 36
28 NC4-017 New BMP 2 4 3 2 0 10 2.5 0 2.5 5 5 36
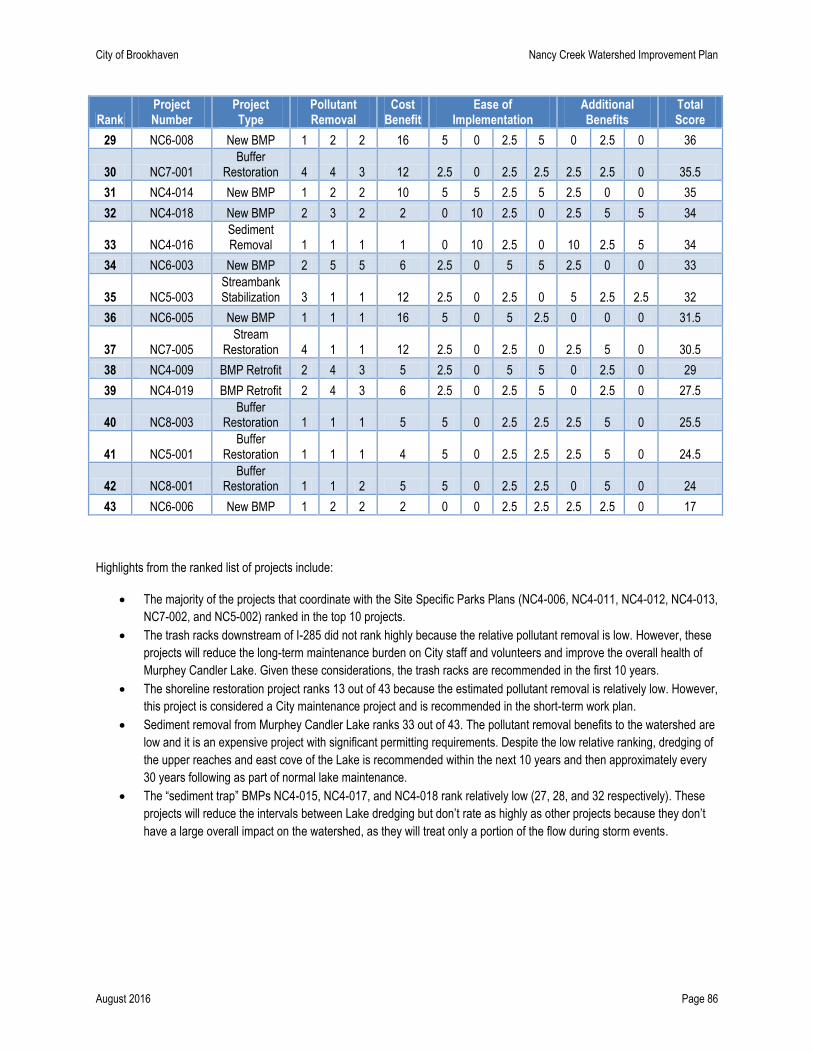
City of Brookhaven Nancy Creek Watershed Improvement Plan
August 2016 Page 86
Rank Project Number
Project Type
Pollutant Removal
Cost Benefit
Ease of Implementation
Additional Benefits
Total Score
29 NC6-008 New BMP 1 2 2 16 5 0 2.5 5 0 2.5 0 36
30 NC7-001 Buffer
Restoration 4 4 3 12 2.5 0 2.5 2.5 2.5 2.5 0 35.5
31 NC4-014 New BMP 1 2 2 10 5 5 2.5 5 2.5 0 0 35
32 NC4-018 New BMP 2 3 2 2 0 10 2.5 0 2.5 5 5 34
33 NC4-016 Sediment Removal 1 1 1 1 0 10 2.5 0 10 2.5 5 34
34 NC6-003 New BMP 2 5 5 6 2.5 0 5 5 2.5 0 0 33
35 NC5-003 Streambank Stabilization 3 1 1 12 2.5 0 2.5 0 5 2.5 2.5 32
36 NC6-005 New BMP 1 1 1 16 5 0 5 2.5 0 0 0 31.5
37 NC7-005 Stream
Restoration 4 1 1 12 2.5 0 2.5 0 2.5 5 0 30.5
38 NC4-009 BMP Retrofit 2 4 3 5 2.5 0 5 5 0 2.5 0 29
39 NC4-019 BMP Retrofit 2 4 3 6 2.5 0 2.5 5 0 2.5 0 27.5
40 NC8-003 Buffer
Restoration 1 1 1 5 5 0 2.5 2.5 2.5 5 0 25.5
41 NC5-001 Buffer
Restoration 1 1 1 4 5 0 2.5 2.5 2.5 5 0 24.5
42 NC8-001 Buffer
Restoration 1 1 2 5 5 0 2.5 2.5 0 5 0 24
43 NC6-006 New BMP 1 2 2 2 0 0 2.5 2.5 2.5 2.5 0 17
Highlights from the ranked list of projects include:
The majority of the projects that coordinate with the Site Specific Parks Plans (NC4-006, NC4-011, NC4-012, NC4-013,
NC7-002, and NC5-002) ranked in the top 10 projects.
The trash racks downstream of I-285 did not rank highly because the relative pollutant removal is low. However, these
projects will reduce the long-term maintenance burden on City staff and volunteers and improve the overall health of
Murphey Candler Lake. Given these considerations, the trash racks are recommended in the first 10 years.
The shoreline restoration project ranks 13 out of 43 because the estimated pollutant removal is relatively low. However,
this project is considered a City maintenance project and is recommended in the short-term work plan.
Sediment removal from Murphey Candler Lake ranks 33 out of 43. The pollutant removal benefits to the watershed are
low and it is an expensive project with significant permitting requirements. Despite the low relative ranking, dredging of
the upper reaches and east cove of the Lake is recommended within the next 10 years and then approximately every
30 years following as part of normal lake maintenance.
The “sediment trap” BMPs NC4-015, NC4-017, and NC4-018 rank relatively low (27, 28, and 32 respectively). These
projects will reduce the intervals between Lake dredging but don’t rate as highly as other projects because they don’t
have a large overall impact on the watershed, as they will treat only a portion of the flow during storm events.

City of Brookhaven Nancy Creek Watershed Improvement Plan
August 2016 Page 87
4.5. IMPLEMENTATION PLAN
The implementation plan identifies the projects that have strong support from the community and City leaders and/or provide
relatively higher benefits as defined in the ranking methodology. The implementation plan suggests projects to be implemented
over the next 10 years, recognizing the dynamic nature of the watershed might change the timeframe and/or projects identified.
The implementation plan is phased to reflect the anticipated funding of $250,000 per year from the City. Several of the projects in
the implementation plan are anticipated to receive grant funding. If grant funding is not secured, the projects may be postponed.
Outside financing is recommended to support dredging of Murphey Candler Lake, as the City estimates this project will cost $1.8
M , which exceeds the $250,000 per year basis for this implementation plan. One alternate project is shown at the end of the 10
year timeframe. If additional funds are secured or projects cost less than budgeted to implement, this project is recommended as
an alternate.
The implementation plan in Table 4-10, outlines implementation progress for 15 of the 43 recommended projects (including the
two alternate projects). The total City investment in the Study Area is anticipated at just under $2 million with a grant funding goal
of almost $400,000 and approximately $200,000 from private property owners.
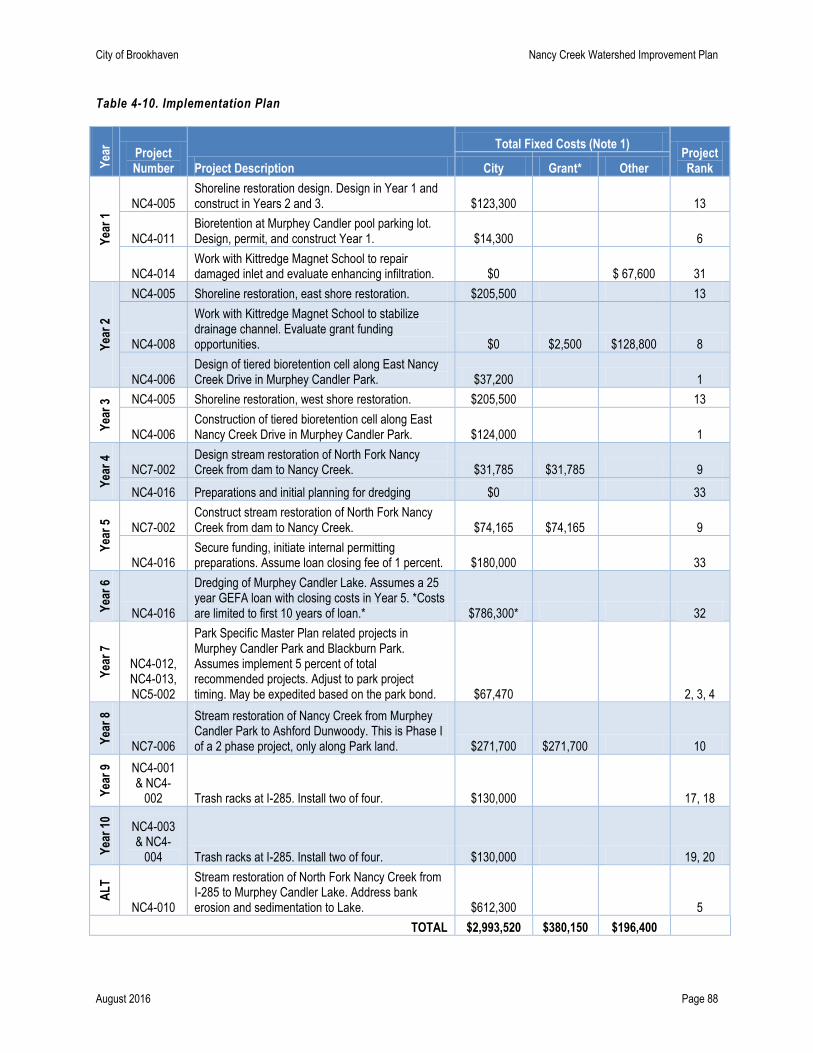
City of Brookhaven Nancy Creek Watershed Improvement Plan
August 2016 Page 88
Table 4-10. Implementation Plan Y
ear
Project Number Project Description
Total Fixed Costs (Note 1) Project Rank City Grant* Other
Yea
r 1
NC4-005 Shoreline restoration design. Design in Year 1 and construct in Years 2 and 3. $123,300 13
NC4-011 Bioretention at Murphey Candler pool parking lot. Design, permit, and construct Year 1. $14,300 6
NC4-014 Work with Kittredge Magnet School to repair damaged inlet and evaluate enhancing infiltration. $0 $ 67,600 31
Yea
r 2
NC4-005 Shoreline restoration, east shore restoration. $205,500 13
NC4-008
Work with Kittredge Magnet School to stabilize drainage channel. Evaluate grant funding opportunities. $0 $2,500 $128,800 8
NC4-006 Design of tiered bioretention cell along East Nancy Creek Drive in Murphey Candler Park. $37,200 1
Yea
r 3
NC4-005 Shoreline restoration, west shore restoration. $205,500 13
NC4-006 Construction of tiered bioretention cell along East Nancy Creek Drive in Murphey Candler Park. $124,000 1
Yea
r 4
NC7-002 Design stream restoration of North Fork Nancy Creek from dam to Nancy Creek. $31,785 $31,785 9
NC4-016 Preparations and initial planning for dredging $0 33
Yea
r 5
NC7-002 Construct stream restoration of North Fork Nancy Creek from dam to Nancy Creek. $74,165 $74,165 9
NC4-016 Secure funding, initiate internal permitting preparations. Assume loan closing fee of 1 percent. $180,000 33
Yea
r 6
NC4-016
Dredging of Murphey Candler Lake. Assumes a 25 year GEFA loan with closing costs in Year 5. *Costs are limited to first 10 years of loan.* $786,300* 32
Yea
r 7
NC4-012, NC4-013, NC5-002
Park Specific Master Plan related projects in Murphey Candler Park and Blackburn Park. Assumes implement 5 percent of total recommended projects. Adjust to park project timing. May be expedited based on the park bond. $67,470 2, 3, 4
Yea
r 8
NC7-006
Stream restoration of Nancy Creek from Murphey Candler Park to Ashford Dunwoody. This is Phase I of a 2 phase project, only along Park land. $271,700 $271,700 10
Yea
r 9
NC4-001 & NC4-
002 Trash racks at I-285. Install two of four. $130,000 17, 18
Yea
r 10
NC4-003 & NC4-
004 Trash racks at I-285. Install two of four. $130,000 19, 20
AL
T
NC4-010
Stream restoration of North Fork Nancy Creek from I-285 to Murphey Candler Lake. Address bank erosion and sedimentation to Lake. $612,300 5
TOTAL $2,993,520 $380,150 $196,400
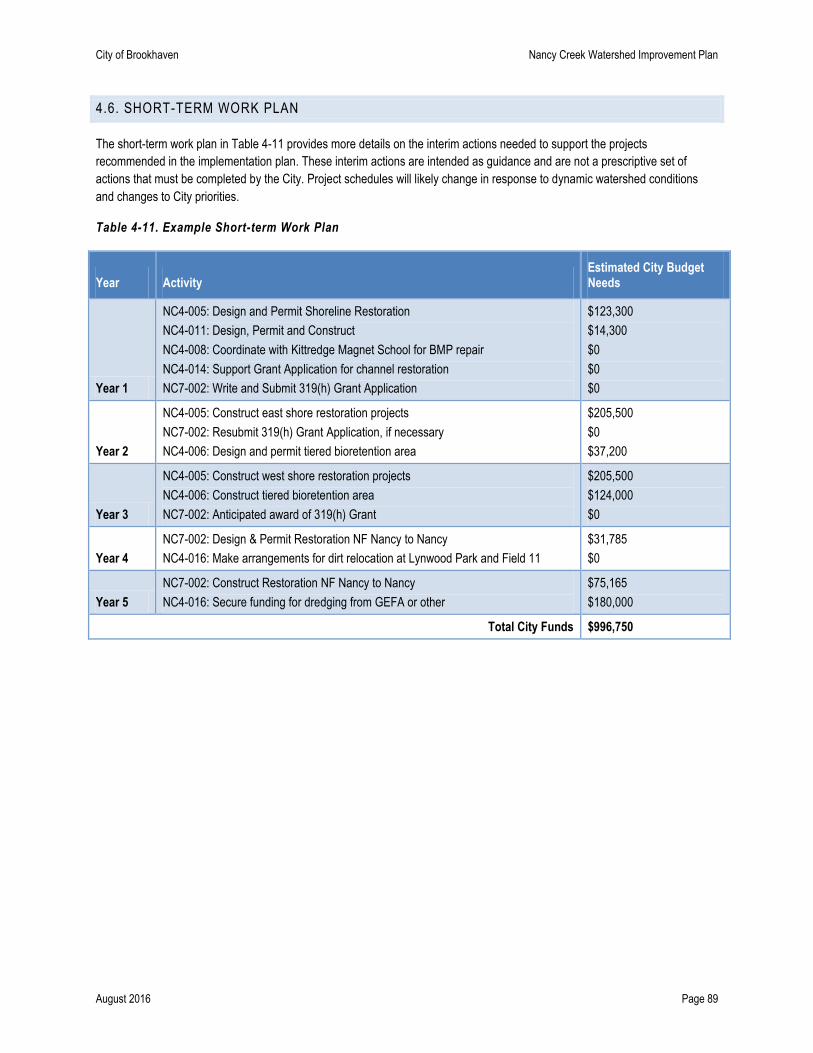
City of Brookhaven Nancy Creek Watershed Improvement Plan
August 2016 Page 89
4.6. SHORT-TERM WORK PLAN
The short-term work plan in Table 4-11 provides more details on the interim actions needed to support the projects
recommended in the implementation plan. These interim actions are intended as guidance and are not a prescriptive set of
actions that must be completed by the City. Project schedules will likely change in response to dynamic watershed conditions
and changes to City priorities.
Table 4-11. Example Short-term Work Plan
Year Activity Estimated City Budget Needs
Year 1
NC4-005: Design and Permit Shoreline Restoration
NC4-011: Design, Permit and Construct
NC4-008: Coordinate with Kittredge Magnet School for BMP repair
NC4-014: Support Grant Application for channel restoration
NC7-002: Write and Submit 319(h) Grant Application
$123,300
$14,300
$0
$0
$0
Year 2
NC4-005: Construct east shore restoration projects
NC7-002: Resubmit 319(h) Grant Application, if necessary
NC4-006: Design and permit tiered bioretention area
$205,500
$0
$37,200
Year 3
NC4-005: Construct west shore restoration projects
NC4-006: Construct tiered bioretention area
NC7-002: Anticipated award of 319(h) Grant
$205,500
$124,000
$0
Year 4
NC7-002: Design & Permit Restoration NF Nancy to Nancy
NC4-016: Make arrangements for dirt relocation at Lynwood Park and Field 11
$31,785
$0
Year 5
NC7-002: Construct Restoration NF Nancy to Nancy
NC4-016: Secure funding for dredging from GEFA or other
$75,165
$180,000
Total City Funds $996,750
City of Brookhaven Nancy Creek Watershed Improvement Plan
August 2016 Page 90
4.7. MEASURING PROGRESS TOWARD GOALS
There are three proposed methods for measuring the progress toward implementing this Plan: a count of completed projects,
review of water quality trend data, and updating the Murphey Candler State of the Lake Report.
Completion of Recommended Projects: Each project has an estimated benefit that is included in Appendix B. As projects are
implemented, the total estimated benefit can be estimated and reported. Information on the benefits to the watershed can be
shared with the public through existing communication channels.
Water Quality Trend Data: The City’s Impaired Waters Plan recommends securing water quality data from DeKalb County
Watershed Management Department and reviewing it annually to see if water quality trends are improving or declining. In
addition to meeting a regulatory requirement, this review may guide the implementation of recommended projects in this Plan.
State of the Lake Report Updates: The City can partner with a non-profit organization and/or school to collect the data needed
annually to update the Murphey Candler Lake State of the Lake report. Additional data will help draw better conclusions about
the health of Murphey Candler Lake and document any measured benefit in lake health following the implementation of
recommended projects.
With any planning study, it is advisable to update the data and analysis every ten years. The update provides an opportunity to
assess stream health and update the model with information on completed projects or significant land use changes in the
watershed. New projects will likely be identified and the update can be paired with the impervious area retrofit assessments
recommended in this Plan.
City of Brookhaven Nancy Creek Watershed Improvement Plan
August 2016 Page 95
DEFINITIONS
Best Management Practices (BMPs): A structure or engineered control devices and systems (e.g. retention ponds) designed to
treat polluted stormwater. Also includes operational or procedural practices (e.g. minimizing use of chemical fertilizers and
pesticides).
Chlorophyll-a: Chlorophyll is the pigment that makes plants and algae green and allows plants and algae to photosynthesize.
Chlorophyll-a is the measure of chlorophyll that is “active” or living. Chlorophyll-a is tested in lakes to determine the presence of
living algae. Too much algae can create a cloudy appearance in lakes and can also deplete the dissolved oxygen needed by fish
and aquatic life. Chlorophyll levels are typically highest in the summer, when these samples were taken. There is currently no
state-wide lake standard for chlorophyll-a, but there are 6 lakes with individual standards, ranging from 10 to 24 mg/m3.
Chlorophyll levels can be accelerated by excess nutrients (phosphorus and nitrogen) with sources including human and animal
wastes, soil erosion, and runoff from fertilized lawns.
Drainage Basin: An area from which all precipitation flows to a single stream or set of streams. Also called a watershed.
Eutrophic: One of the four Carlson Trophic State’s that is used to describe lake health. Eutrophic lakes very productive and
fertile; low clarity/shallow secchi; high chlorophyll and phosphorus concentrations.
Fecal Coliform Bacteria: Fecal coliform bacteria are microscopic organisms found in the intestines of warm blooded animals.
The presence of fecal coliform bacteria is considered an indicator of the possibility of disease-carrying organisms and is
regulated by the state. The winter standard (November – April) is less than 1,000 colonies/ 100 mL and the summer standard is
200 colonies/100 mL. The summer standard is lower as there is greater risk of human ingestion in the warmer months. Because
fecal coliform bacteria are living organisms their counts are not easy to predict. For example, the direct sunlight in the main body
of the lake may kill the bacteria, which could explain why these levels were lower. Sources of fecal coliform could include
sanitary sewer overflows, wildlife waste, and pet waste.
Hydrologic Unit Code (HUC): These codes are a way to identify the drainage basins in the US. The codes are nested from
largest (regions) to smallest (cataloguing units). The larger the number, the smaller the drainage basin being described.
Hydrologic unit codes are assigned by the US Geological Survey (USGS).
Hypereutrophic: One of the four Carlson Trophic State’s that is used to describe lake health. Hypereutrophic lakes are extremely productive with noxious surface scums of algae and low survivability of aquatic life.
Impaired Waters (aka 303(d) list): The 303(d) list of impaired waters is produced by the Georgia EPD annually and assigns a 1
to 5 numerical classification to the streams that have been monitored. The numbers indicate whether the stream met state
standards or was considered impaired. For impaired streams the classifications also indicate whether a Total Maximum Daily
Load (TMDL) study has been prepared or not.
Impervious Cover: Any surface in the landscape that cannot effectively absorb or infiltrate rainfall. This includes driveways,
roads, parking lots, rooftops, and sidewalks. When natural landscapes are intact, rainfall is absorbed into the soil and vegetation.
Also called impervious area.
Mesotrophic: One of the four Carlson Trophic State’s that is used to describe lake health. Mesotrophic lakes are moderately
productive; intermediate clarity, chlorophyll and phosphorus concentration.
Municipal Separate Storm Sewer System (MS4): MS4 refers to conveyance or system of conveyances (including roads with
drainage systems, municipal streets, catch basins, curbs, gutters, ditches, man-made channels, and storm drains) which is
owned or operated by a state, city, town, county, district, association, or other public body (created by or pursuant to state law).
The EPA promulgated rules that require Phase I (“medium” and “large”) communities to implement a stormwater management
City of Brookhaven Nancy Creek Watershed Improvement Plan
August 2016 Page 96
program to control polluted stormwater discharges. The Phase II rules extend coverage to “small” system which must adopt
programs that fall under six minimum control measures. Brookhaven is considered a Phase II community.
Oligotrophic – One of the four Carlson Trophic State’s that is used to describe lake health. Oligotrophic lakes are nutrient poor
and low productivity; high transparency (deep secchi depth), low chlorophyll-a, low phosphorus.
Sanitary Sewer Overflow (SSO): A condition in which untreated sewage is discharged from a sanitary sewer into the
environment prior to reaching sewage treatment facilities. When caused by rainfall it is also known as wet weather overflow.
SSOs can be caused by a number of factors including grease and other blockages as well as infiltration of rainfall into aging pipe
systems.
Stormwater: Water that originates during precipitation events and snow/ice melt. Stormwater can soak into the soil (infiltrate),
be held on the surface and evaporate, or runoff and end up in nearby streams, rivers, or other water bodies (surface water).
Subwatershed: A drainage area that is a smaller unit than a watershed.
Total Maximum Daily Load (TMDL): A regulatory term in the U.S. Clean Water Act, describing a value of the maximum
amount of a pollutant that a body of water can receive while still meeting water quality standards.
Total Phosphorus: Phosphorus is a nutrient that is important for plant growth. Too much phosphorus, however, can lead to
excess plant and algae growth. Common sources include human and animal wastes, soil erosion, and runoff from fertilized
lawns. There is currently no state-wide lake standard for Total Phosphorus.
Trophic State: The total weight of biomass in a given water body at the time of measurement. Because they are of public
concern, the Carlson index uses the algal biomass as an objective classifier of a lake or other water body's trophic status.
Watershed: An area of land that drains to a specific point on a waterbody.
City of Brookhaven Nancy Creek Watershed Improvement Plan
August 2016 Page 97
REFERENCES
i Center for Watershed Protection ii Watershed Protection Research Monograph No. 1: Impacts of Impervious Cover on Aquatic Systems. Center for Watershed Protection. March 2003. iii State of Georgia Tier 2 TMDL Implementation Plan, Revision #1: Peachtree Creek, Nancy Creek and Others Watersheds Chattahoochee River Basin. iv Total Maximum Daily Load Evaluation for Twenty-Five Stream Segments in the Chattahoochee River Basin For Sediment (Biota Impacted). v DeKalb County News Release. DeKalb County Reaches Agreement with EPA, EPD. December 13, 2010. vi Watershed Treatment Model (WTM) 2013 Documentation. Center for Watershed Protection. 2013. vii NOAA. DeKalb Peachtree Airport. 2015. viii NVPDC, 1979. ix Macroinvertebrate Biological Assessment of Wadable Streams in Georgia: Standard Operating Procedures. Version 1. Georgia Department of Natural Resources, Environmental Protection Division, Watershed Protection Branch. March 2007. x Benthic Sediment Survey on Murphey Candler Lake, DeKalb County, Georgia. United Consulting. 1999. xi Long Lake Shoreline Inventory. Rice Creek Watershed District. Ramsey Conservation District. 2008. xii Carlson, R.E. (1977) A trophic state index for lakes. Limnology and Oceanography. 22:2 361--369. xiii Georgia Stormwater Management Manual. 2001. AMEC, et al. xiv Georgia Rule 391.3-6-.03(5)(b) xv Georgia Stormwater Management Manual. 2016. AECOM, et al. xvi City of Brookhaven Site Specific Park Master Plan. Greenberg Farrow. 2016. xvii Memorandum: Water Quality Modeling Analyses within the Upper Nancy Creek Watershed Study Area. February 2016. Horsley Witten Group. xviii http://epd.georgia.gov/section-319h-georgias-nonpoint-source-implementation-grant xix http://www.nfwf.org/fivestar/Pages/home.aspx xx http://captainplanetfoundation.org/apply-for-grants/ xxi http://gastateparks.org/grants/rtp#application xxii Army Corps of Engineers: Water Resources Authorizations, Appropriations, and Activities. Congressional Research Service. 7-5700. February 2016. xxiii GEFA Loan Program Policies. http://gefa.georgia.gov/sites/gefa.georgia.gov/files/related_files/document/GEFA-Loan-Program-Policies.pdf

City of Brookhaven Nancy Creek Watershed Improvement Plan
August 2016 Page 91
APPENDIX A: MURPHEY CANDLER STATE OF THE LAKE REPORT 2015

City of Brookhaven Nancy Creek Watershed Improvement Plan
August 2016 Page 92
APPENDIX B: PROJECT SHEETS

City of Brookhaven Nancy Creek Watershed Improvement Plan
August 2016 Page 93
APPENDIX C: SUBWATERSHED SUMMARIES

City of Brookhaven Nancy Creek Watershed Improvement Plan
August 2016 Page 94
APPENDIX D: STANDARD OPERATING PROCEDURES