name:...
TRANSCRIPT

4-‐1 | P a g e
Name:
Teacher:
Problem 6: Which Bridge Is A Better Design?
MPM1D1 Grade 9 Academic Mathematics: Principles of Mathematics Tool Number Lesson Title & Topics Topics Homework
6.1A Introduction -SPT -Unit 4 to 6 -Solving Simple
pg. 193 #1 – 5 eol, 8, 9, 12, 17 pg. 200 #1, 2, 4 – 7, 9adf, 13, 18
6.1B Solving Multi-Step Equations pg. 193 #1 – 5 eol, 8, 9, 12, 17 pg. 200 #1, 2, 4 – 7, 9adf, 13, 18
6.1C Solving Equations With Geometric Properties and Measurement
pg. 193 #1 – 5 eol, 8, 9, 12, 17 pg. 200 #1, 2, 4 – 7, 9adf, 13, 18
6.2 Assessment FOR Learning Quiz Pg. 200 (Section 4.2) #8, 9bce, 14, 15, 17, 20, 21
6.3 Solving Equations Involving Fractions Pg. 208 #1, 3ac, 4bd, 5, 6b, 9, 10, 11
6.4 Solving Equations With CAS NELSON Worksheet
6.5 Modelling With Algebra Pg. 226 #1, 2, 3, 4, 7, 9, 11, 15,
6.6 Jazz/Review Pg. 230 #1 - 17 6.7 SPT Pencil and Paper Test 6.8 SPT Bridge 6.9 SPT Bridge
Parent/Guardian Signature:
6-‐3 | P a g e
Tool 6.1 Solving Simple Equations MPM1D1: Principles of Mathematics http://www.dpcdsb.org/AMBRO
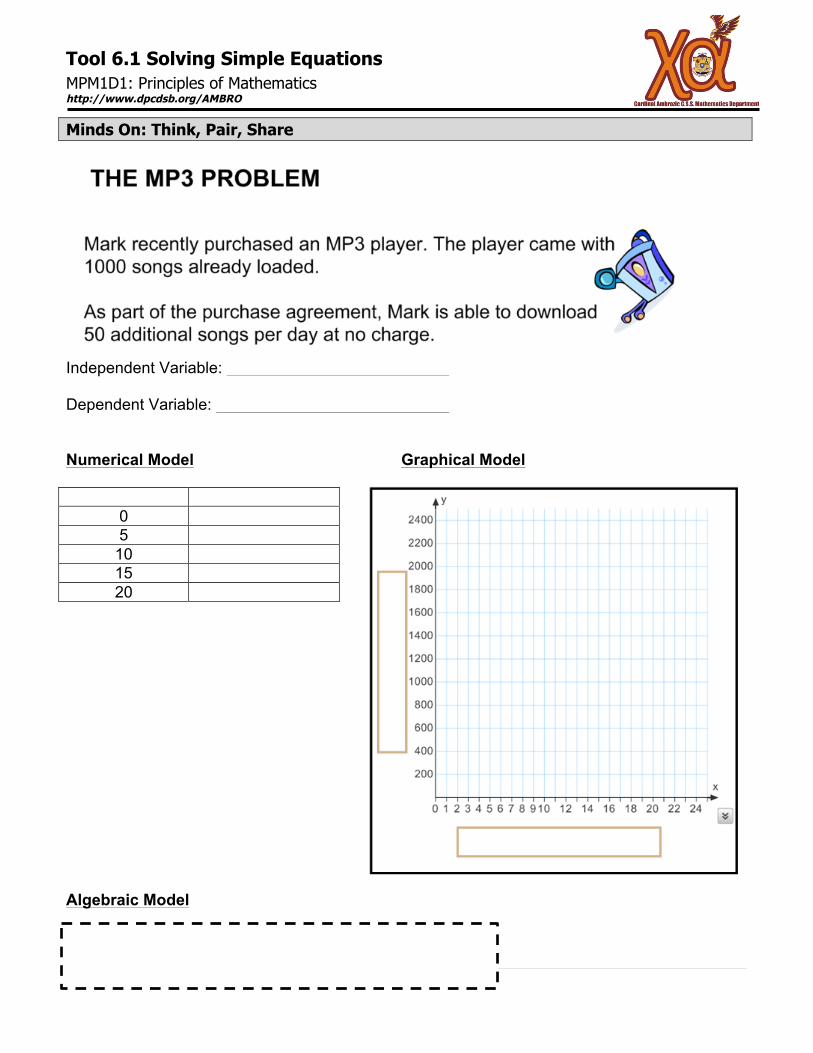
Minds On: Think, Pair, Share
Independent Variable: Dependent Variable: Numerical Model Graphical Model
0 5
10 15 20
Algebraic Model
6-‐4 | P a g e
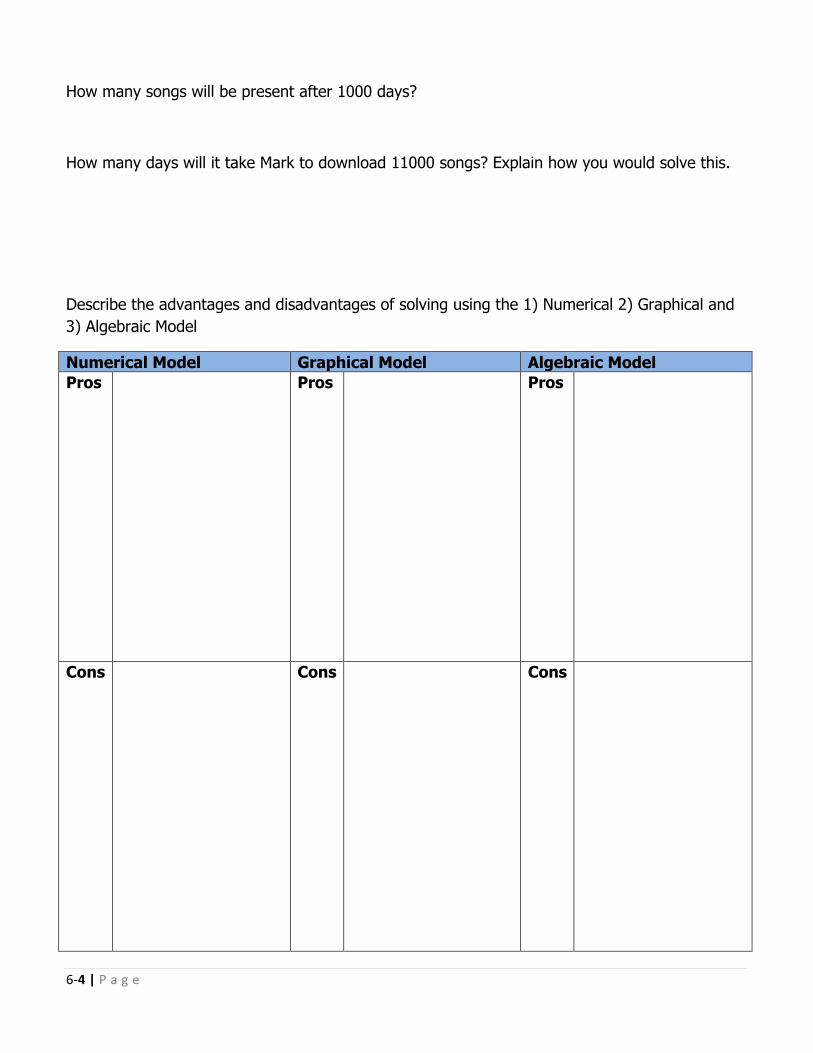
How many songs will be present after 1000 days?
How many days will it take Mark to download 11000 songs? Explain how you would solve this.
Describe the advantages and disadvantages of solving using the 1) Numerical 2) Graphical and 3) Algebraic Model
Numerical Model Graphical Model Algebraic Model Pros
Pros Pros
Cons
Cons Cons
6-‐5 | P a g e
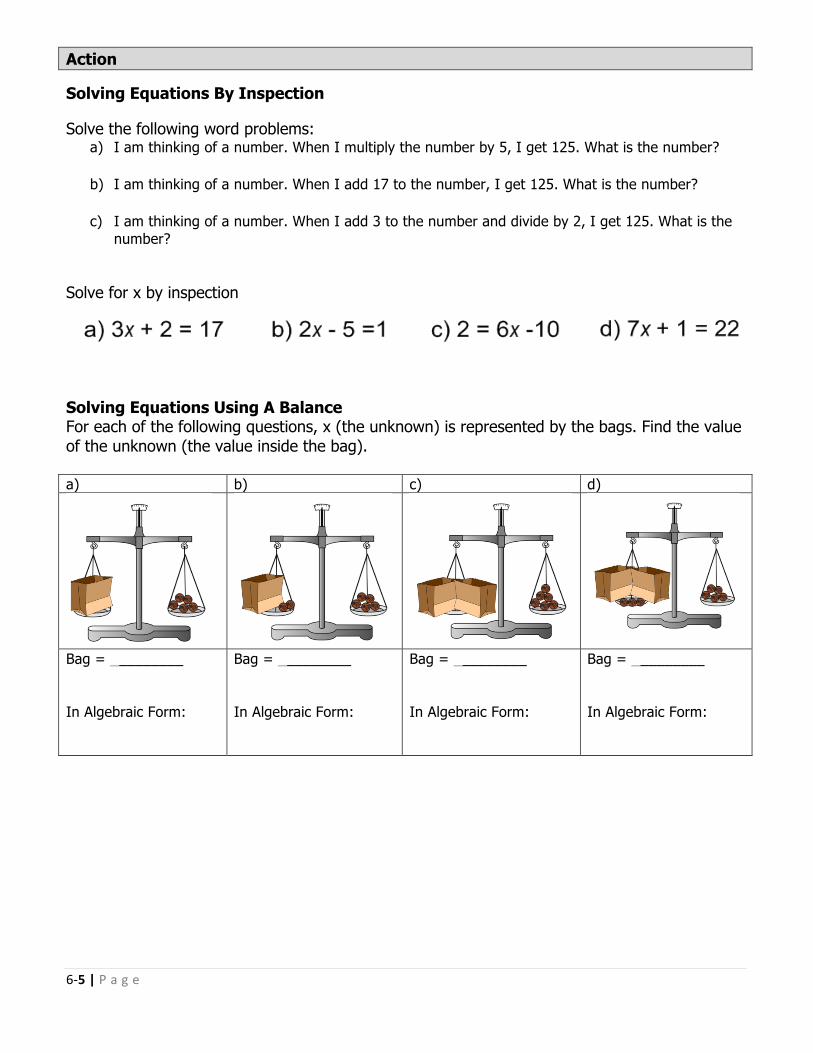
Action
Solving Equations By Inspection
Solve the following word problems: a) I am thinking of a number. When I multiply the number by 5, I get 125. What is the number?
b) I am thinking of a number. When I add 17 to the number, I get 125. What is the number?
c) I am thinking of a number. When I add 3 to the number and divide by 2, I get 125. What is the
number?
Solve for x by inspection
Solving Equations Using A Balance For each of the following questions, x (the unknown) is represented by the bags. Find the value of the unknown (the value inside the bag). a) b) c) d)
Bag = ________ In Algebraic Form:
Bag = ________ In Algebraic Form:
Bag = ________ In Algebraic Form:
Bag = ________ In Algebraic Form:
6-‐6 | P a g e
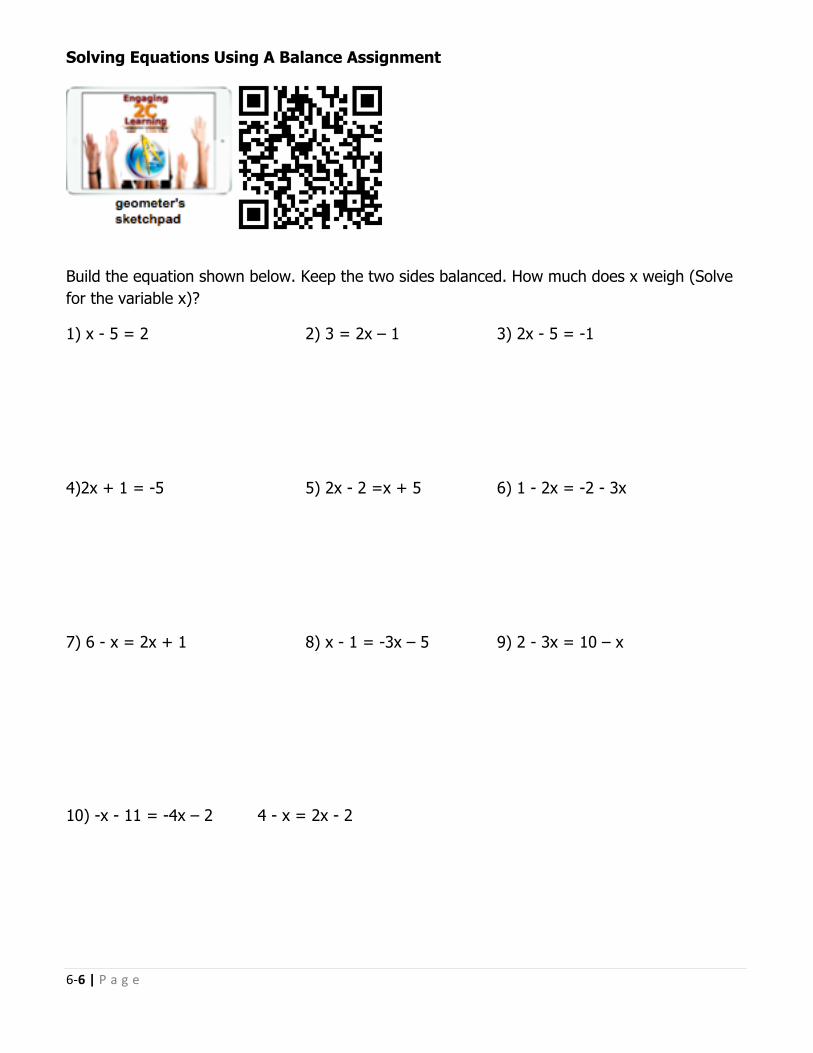
Solving Equations Using A Balance Assignment
Build the equation shown below. Keep the two sides balanced. How much does x weigh (Solve for the variable x)?
1) x - 5 = 2 2) 3 = 2x – 1 3) 2x - 5 = -1 4)2x + 1 = -5 5) 2x - 2 =x + 5 6) 1 - 2x = -2 - 3x 7) 6 - x = 2x + 1 8) x - 1 = -3x – 5 9) 2 - 3x = 10 – x 10) -x - 11 = -4x – 2 4 - x = 2x - 2
6-‐7 | P a g e
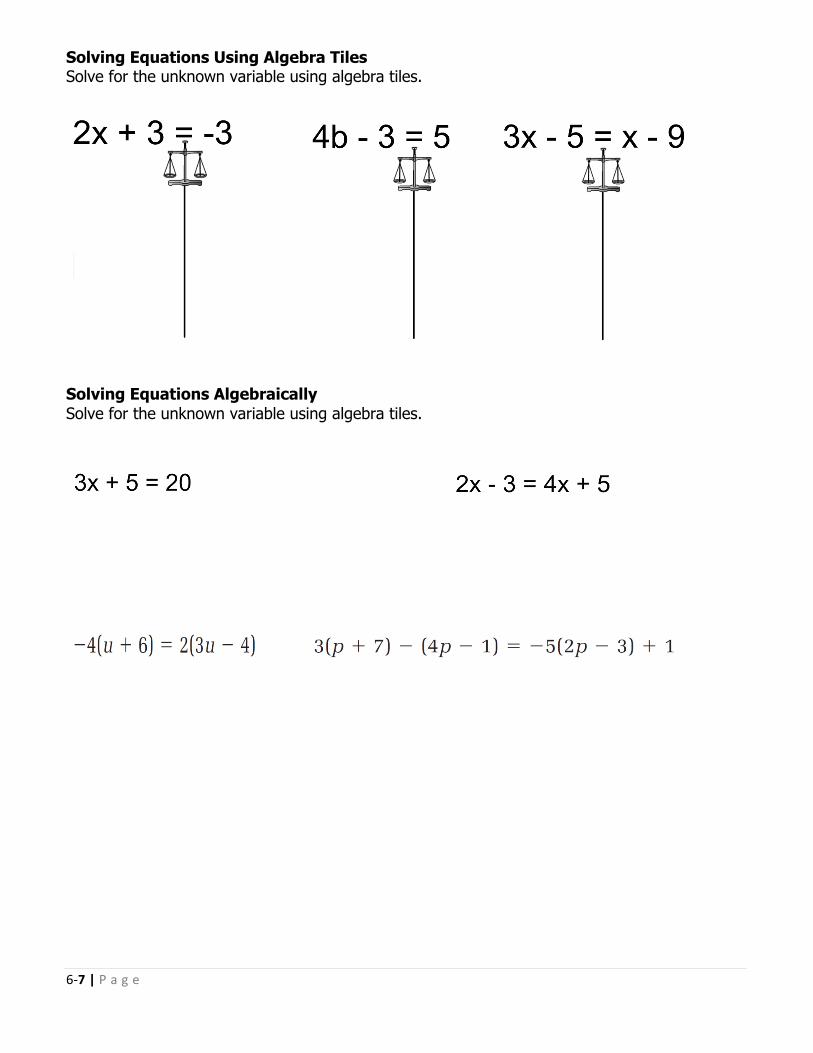
Solving Equations Using Algebra Tiles Solve for the unknown variable using algebra tiles.
Solving Equations Algebraically Solve for the unknown variable using algebra tiles.
6-‐8 | P a g e
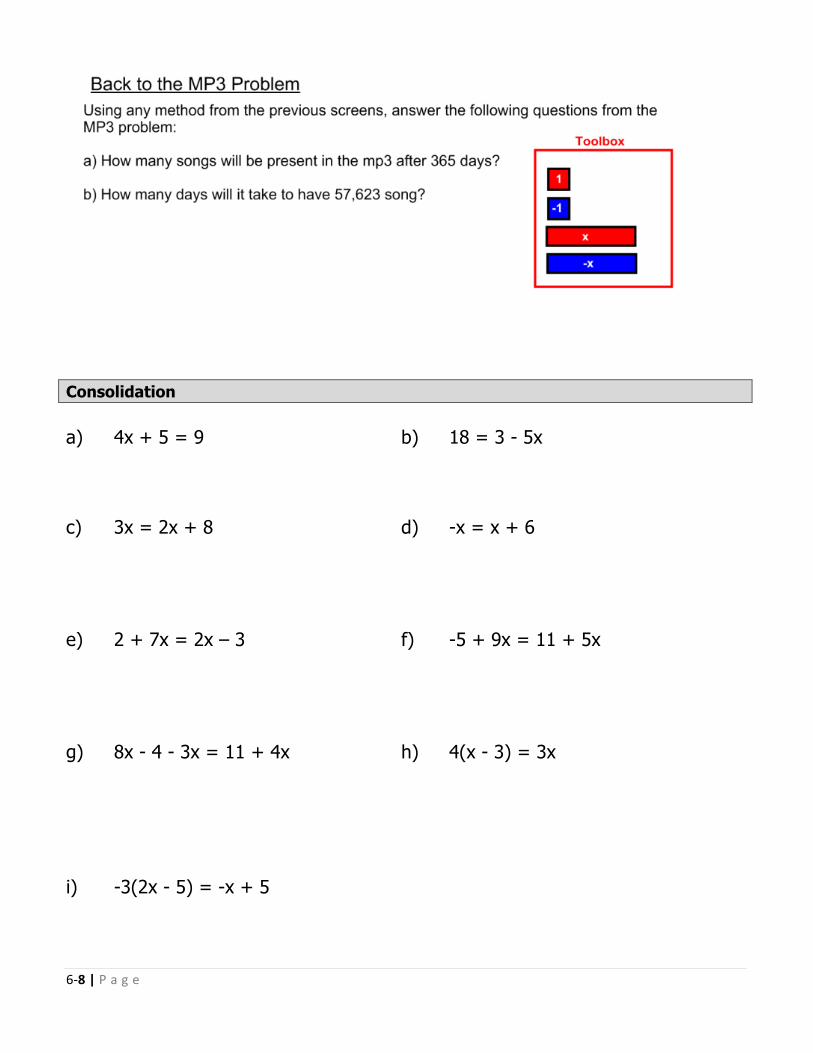
Consolidation a) 4x + 5 = 9 b) 18 = 3 - 5x c) 3x = 2x + 8 d) -x = x + 6 e) 2 + 7x = 2x – 3 f) -5 + 9x = 11 + 5x g) 8x - 4 - 3x = 11 + 4x h) 4(x - 3) = 3x i) -3(2x - 5) = -x + 5

6-‐9 | P a g e
2(x + 8) = 3(2x – 4) –4(u + 6) = 2(3u – 4) 3(p + 7) – (4p – 1) = –5(2p – 3) + 1 Homework list: pg. 193 #1 – 5 eol, 8, 9, 12, 17 pg. 200 #1, 2, 4 – 7, 9adf, 13, 18
6-‐10 | P a g e
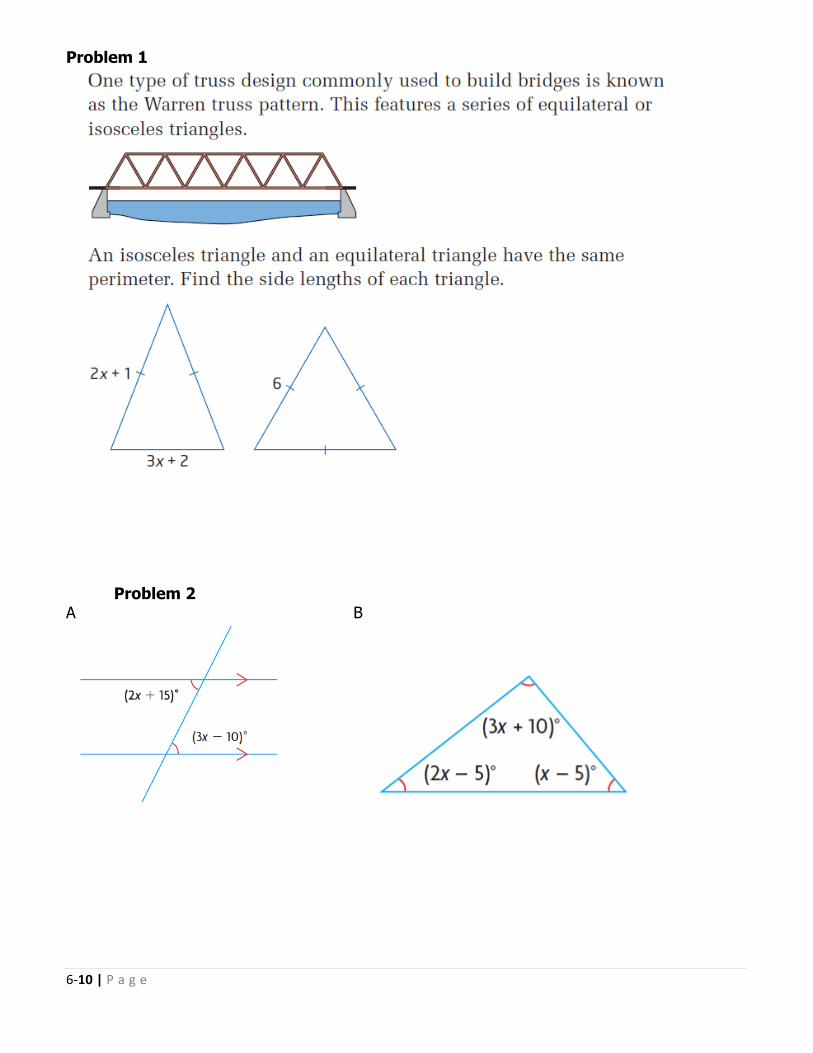
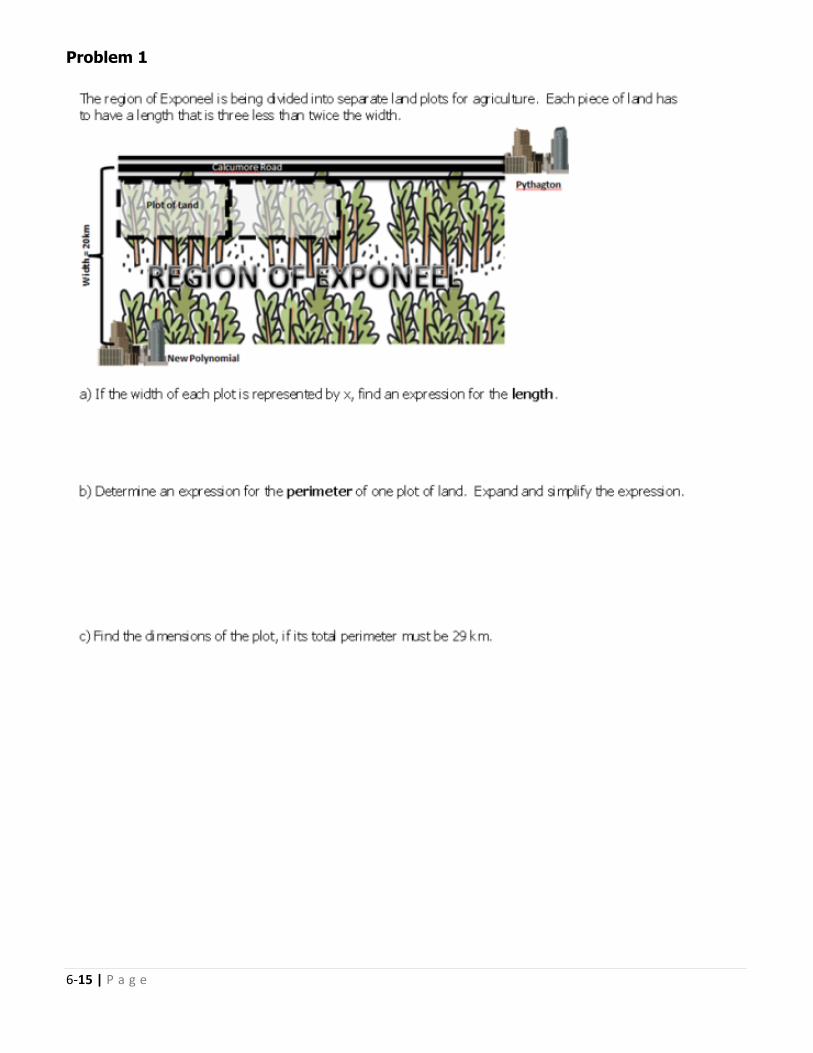
Problem 1
Problem 2 A B
6-‐11 | P a g e
Tool 6.3 Solving Equations Involving Fractions MPM1D1: Principles of Mathematics http://www.dpcdsb.org/AMBRO
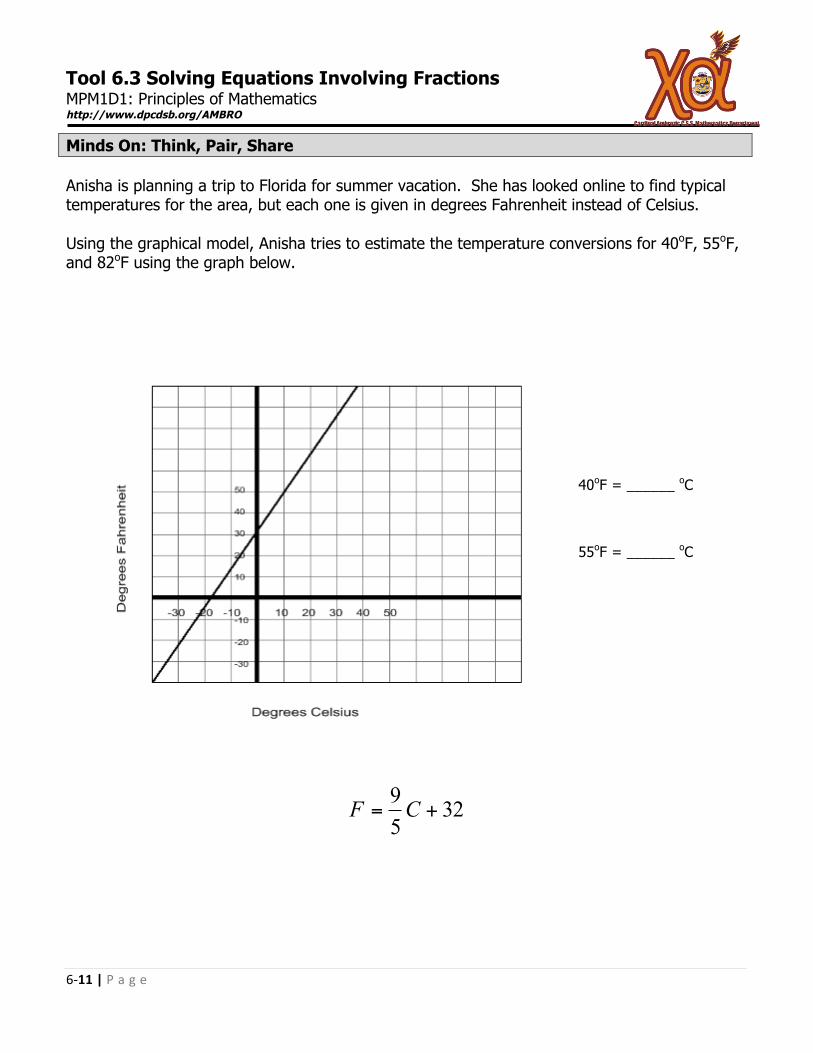
Minds On: Think, Pair, Share Anisha is planning a trip to Florida for summer vacation. She has looked online to find typical temperatures for the area, but each one is given in degrees Fahrenheit instead of Celsius. Using the graphical model, Anisha tries to estimate the temperature conversions for 40oF, 55oF, and 82oF using the graph below.
3259
+= CF
40oF = ______ oC
55oF = ______ oC
82oF = ______ oC
6-‐12 | P a g e
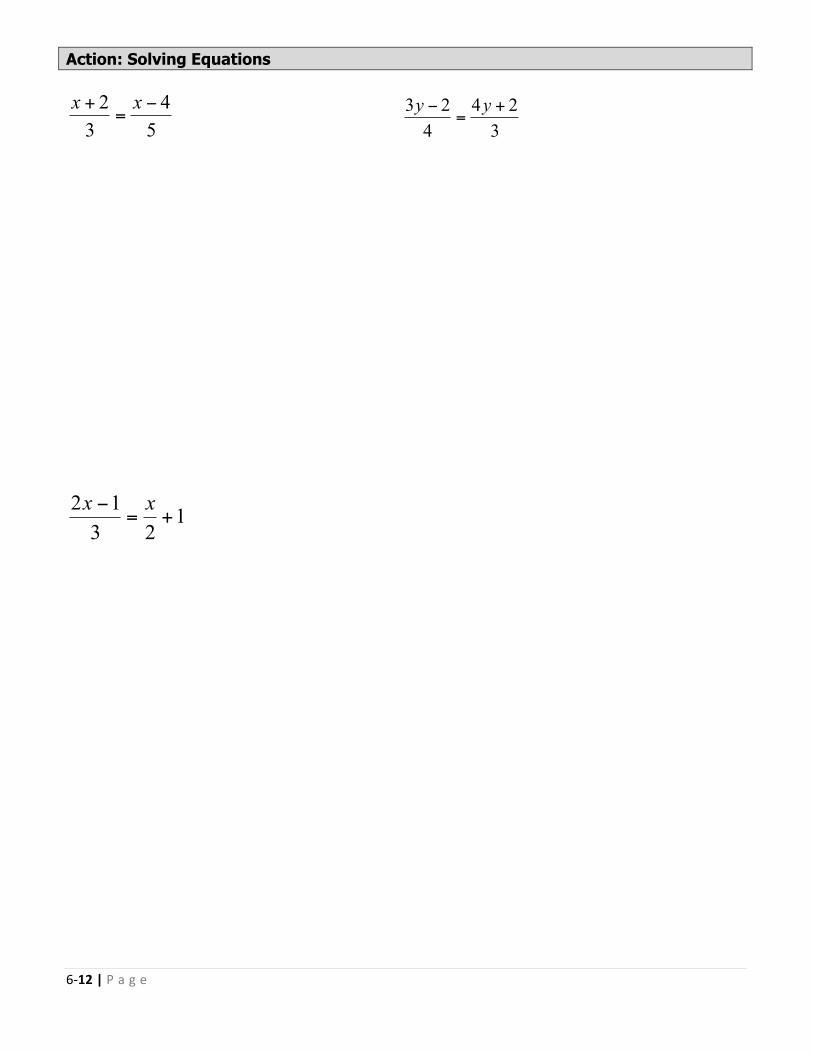
Action: Solving Equations
54
32 −=
+ xx
324
423 +=
− yy
123
12+=
− xx
6-‐13 | P a g e
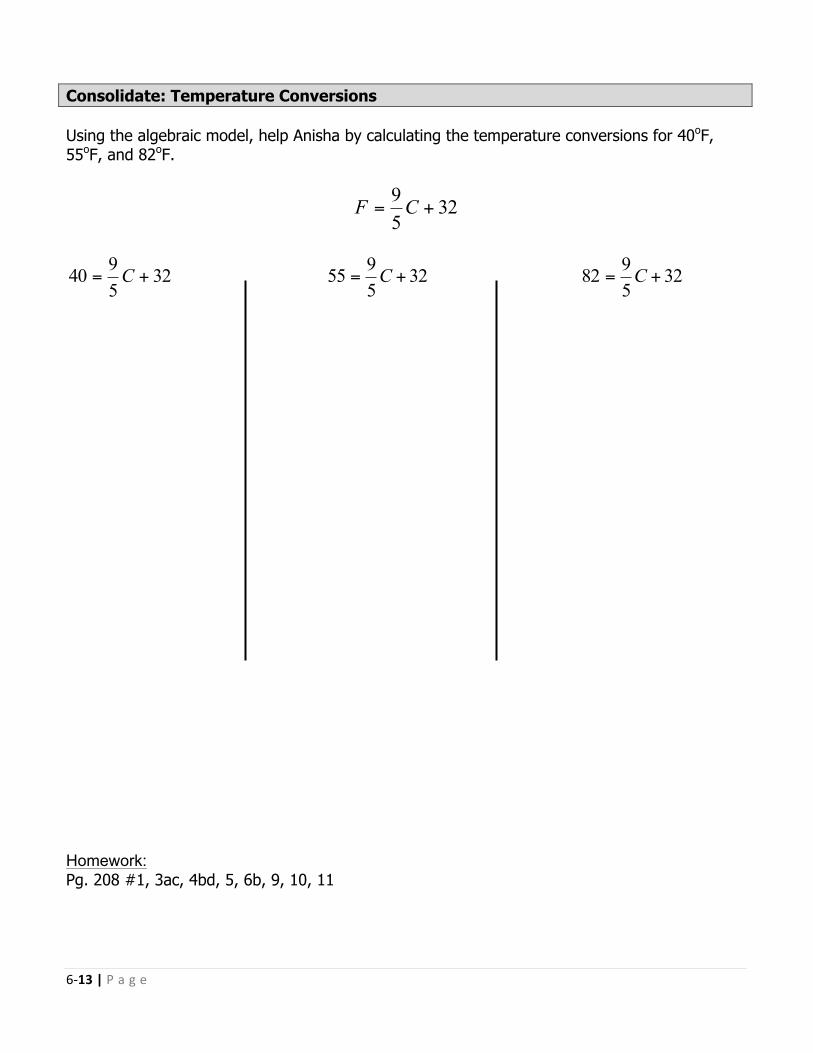
Consolidate: Temperature Conversions Using the algebraic model, help Anisha by calculating the temperature conversions for 40oF, 55oF, and 82oF.
3259
+= CF
325940 += C 32
5955 += C 32
5982 += C
Homework: Pg. 208 #1, 3ac, 4bd, 5, 6b, 9, 10, 11
6-‐14 | P a g e
6-‐15 | P a g e
Problem 1
6-‐16 | P a g e
Problem 2
Two consecutive numbers have a sum of 127. Determine the numbers.
Problem 3
Sunny, Chantel and Thayany are neighbours. Sunny is twice as old as Chantel, and Thayany is three years younger than Sunny. The sum of their ages is 102. How old are they?
Pg. 226 #1, 2, 3, 4, 7, 9, 11, 15
6-‐17 | P a g e
Summative Performance Task: Bridge Designing
Project 6 Unit 6: Solving Equations MPM1D1: Grade 9 Academic Mathematics | Principles of Mathematics
NAME:
SECTION: Introduction
The City of Brampton is considering building a large bridge on Castlemore Rd. from Clarkway Dr. to Huntington Rd to alleviate traffic. You work for the Ambrozic Civil Engineer Company (ACE Co.) and are trying to win the bid for this project. In order to bid you must determine what bridge type works best for the city.
Through surveillance it was found that at any given moment, the maximum number of cars that will be on the bridge at one time is 100. Your task is to determine which bridge design is best for the project (Plank Bridge or Arch Bridge) and how many layers of concrete will be needed to withstand 100 cars.
Bridge Designs
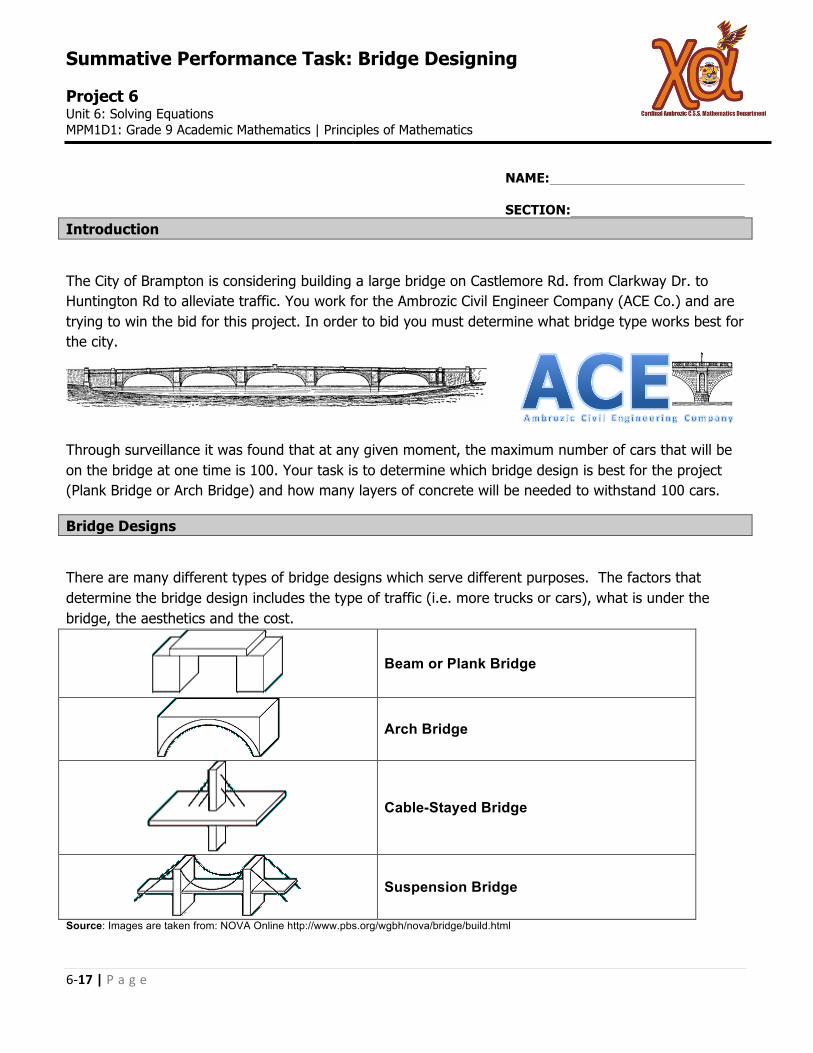
There are many different types of bridge designs which serve different purposes. The factors that determine the bridge design includes the type of traffic (i.e. more trucks or cars), what is under the bridge, the aesthetics and the cost.
Beam or Plank Bridge
Arch Bridge
Cable-Stayed Bridge
Suspension Bridge
Source: Images are taken from: NOVA Online http://www.pbs.org/wgbh/nova/bridge/build.html
6-‐18 | P a g e
Before a bridge is constructed, engineers design models to ensure that the bridge can withstand the stress of the load from cars and people.
During this task you will determine what is the most structurally sound bridge. You will compare both the arch bridge with the plank bridge and you will determine how many cars your bridge can hold.
Preparation Instructions – Teacher Notes
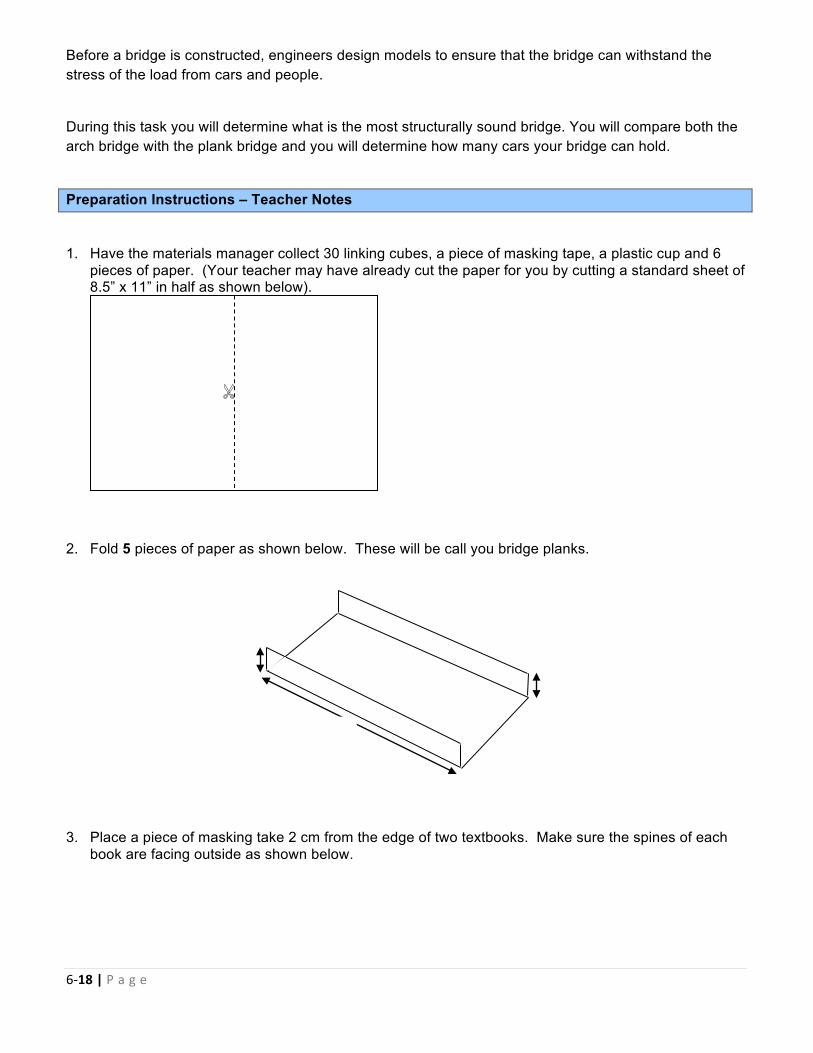
1. Have the materials manager collect 30 linking cubes, a piece of masking tape, a plastic cup and 6 pieces of paper. (Your teacher may have already cut the paper for you by cutting a standard sheet of 8.5” x 11” in half as shown below).
2. Fold 5 pieces of paper as shown below. These will be call you bridge planks.
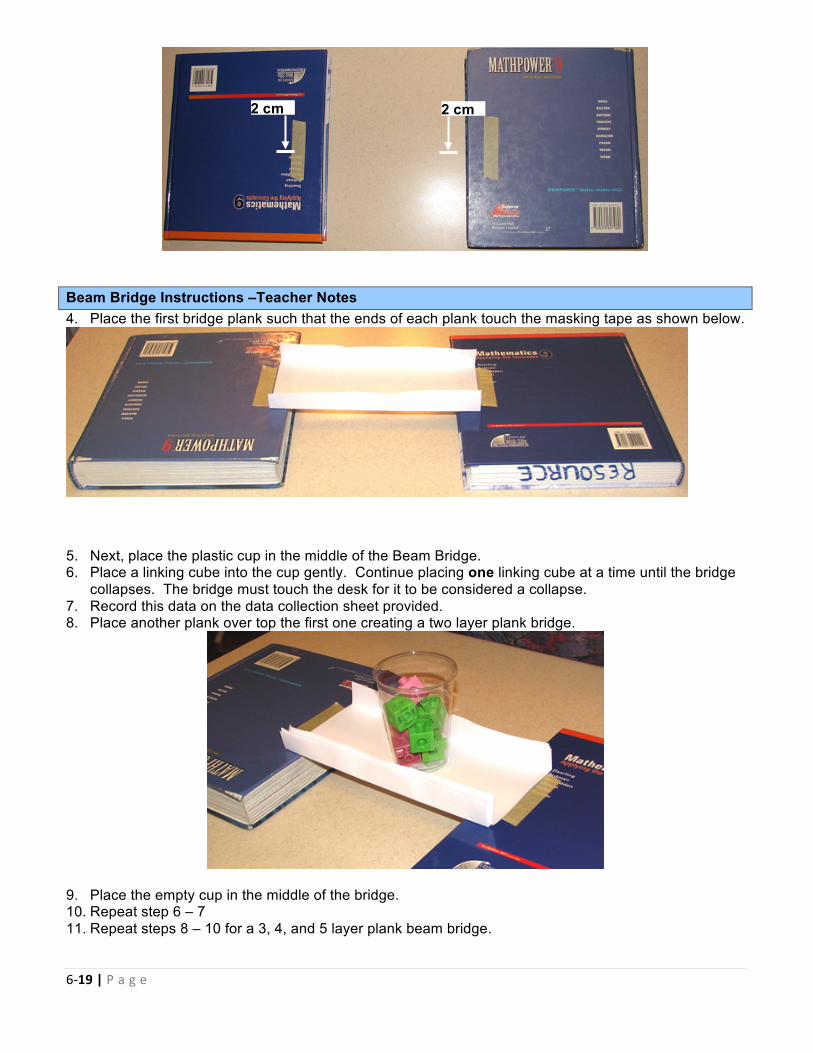
3. Place a piece of masking take 2 cm from the edge of two textbooks. Make sure the spines of each book are facing outside as shown below.
%
6-‐19 | P a g e
Beam Bridge Instructions –Teacher Notes 4. Place the first bridge plank such that the ends of each plank touch the masking tape as shown below.
5. Next, place the plastic cup in the middle of the Beam Bridge. 6. Place a linking cube into the cup gently. Continue placing one linking cube at a time until the bridge
collapses. The bridge must touch the desk for it to be considered a collapse. 7. Record this data on the data collection sheet provided. 8. Place another plank over top the first one creating a two layer plank bridge.
9. Place the empty cup in the middle of the bridge. 10. Repeat step 6 – 7 11. Repeat steps 8 – 10 for a 3, 4, and 5 layer plank beam bridge.
2 cm 2 cm
6-‐20 | P a g e
Arch Bridge Instructions –Teacher Notes
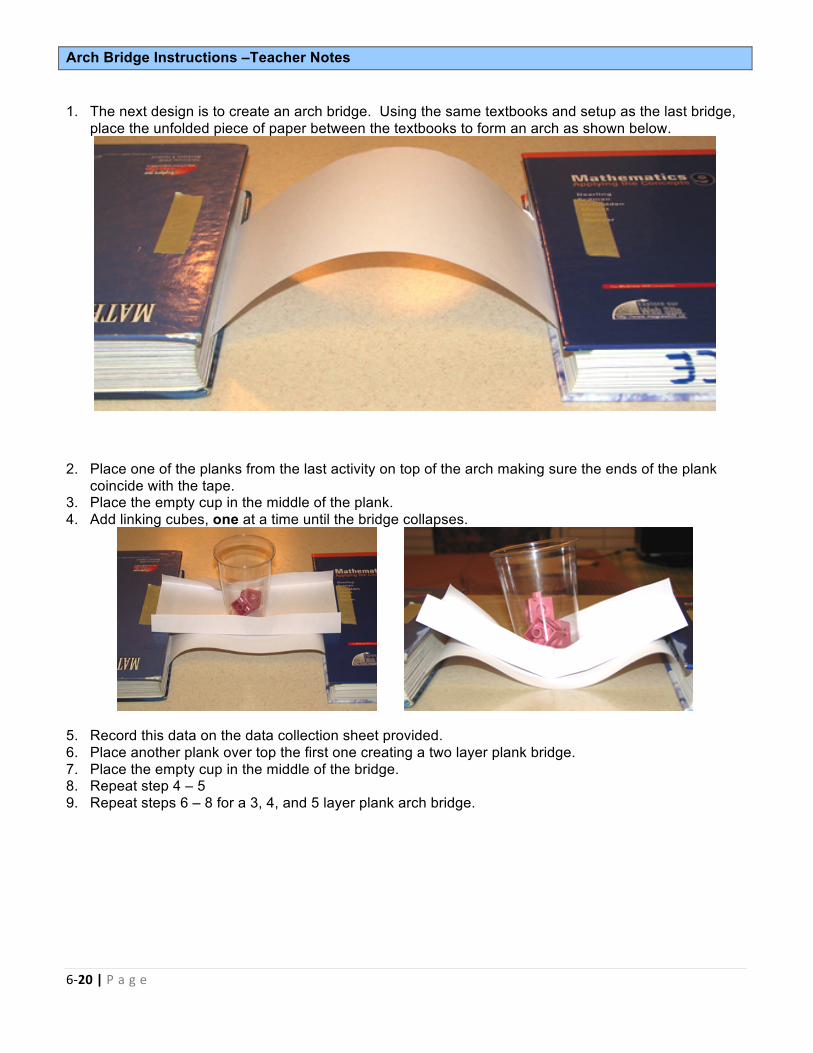
1. The next design is to create an arch bridge. Using the same textbooks and setup as the last bridge, place the unfolded piece of paper between the textbooks to form an arch as shown below.
2. Place one of the planks from the last activity on top of the arch making sure the ends of the plank coincide with the tape.
3. Place the empty cup in the middle of the plank. 4. Add linking cubes, one at a time until the bridge collapses.
5. Record this data on the data collection sheet provided. 6. Place another plank over top the first one creating a two layer plank bridge. 7. Place the empty cup in the middle of the bridge. 8. Repeat step 4 – 5 9. Repeat steps 6 – 8 for a 3, 4, and 5 layer plank arch bridge.
6-‐21 | P a g e
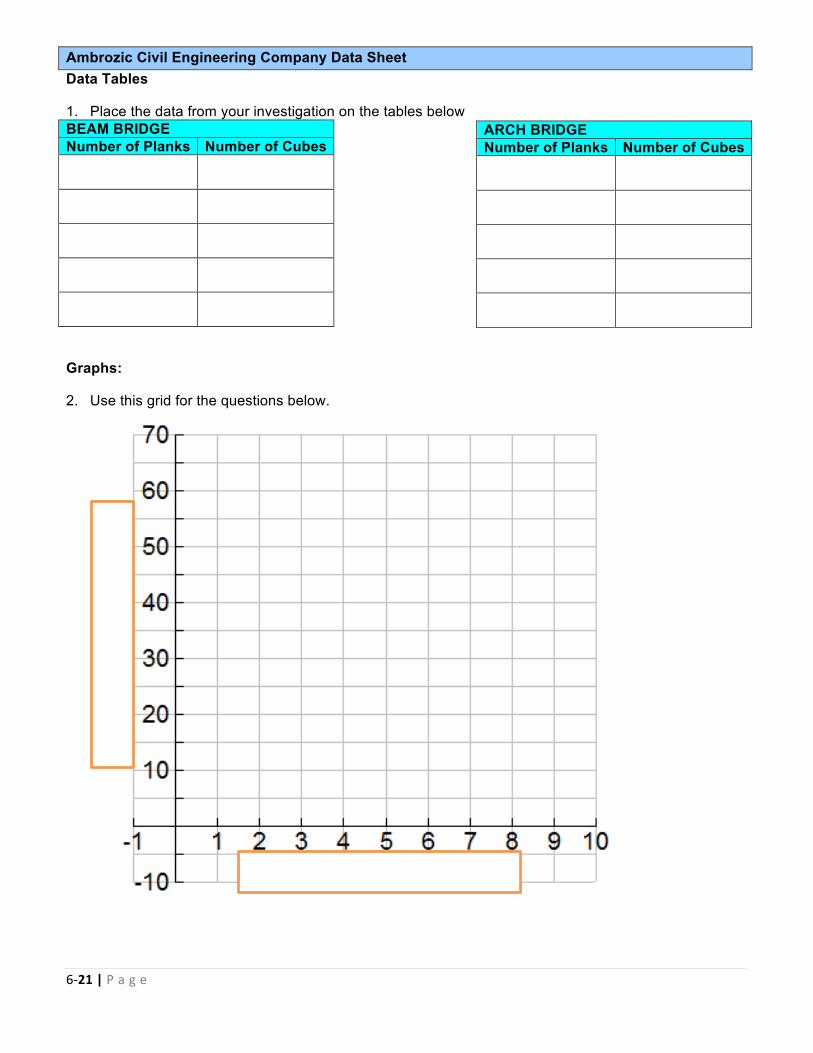
Ambrozic Civil Engineering Company Data Sheet Data Tables
1. Place the data from your investigation on the tables below BEAM BRIDGE Number of Planks Number of Cubes
Graphs:
2. Use this grid for the questions below.
ARCH BRIDGE Number of Planks Number of Cubes
6-‐22 | P a g e
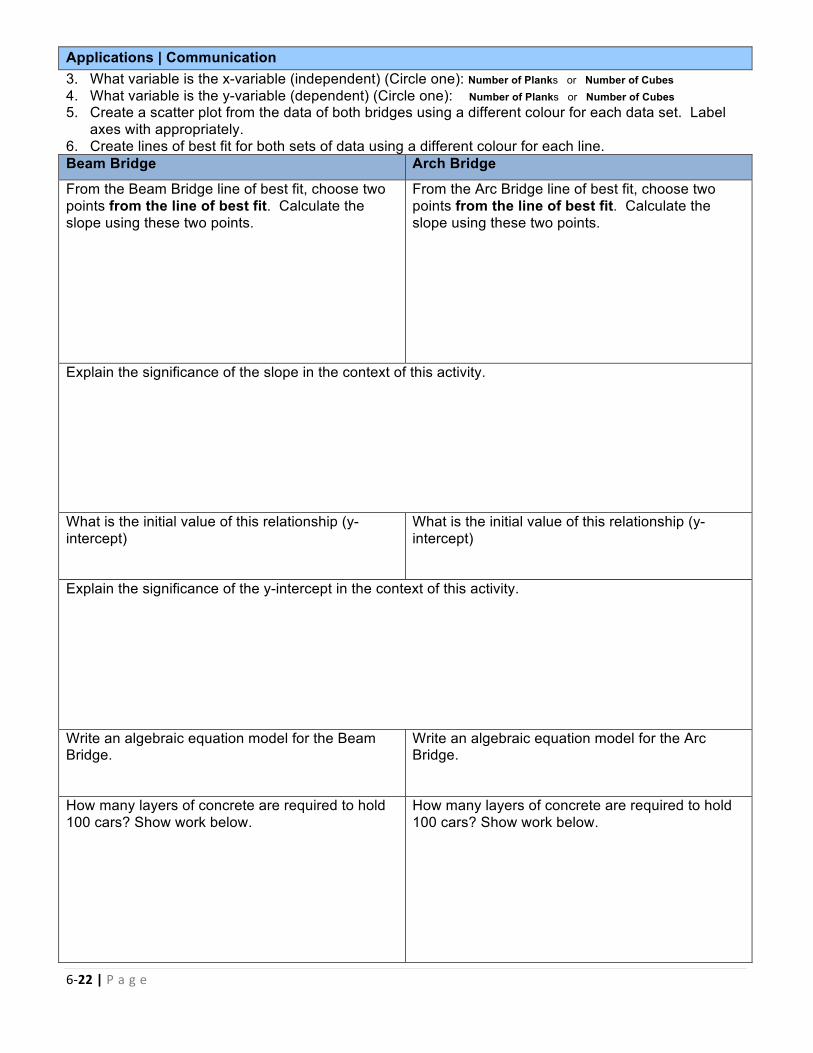
Applications | Communication 3. What variable is the x-variable (independent) (Circle one): Number of Planks or Number of Cubes 4. What variable is the y-variable (dependent) (Circle one): Number of Planks or Number of Cubes 5. Create a scatter plot from the data of both bridges using a different colour for each data set. Label
axes with appropriately. 6. Create lines of best fit for both sets of data using a different colour for each line. Beam Bridge Arch Bridge
From the Beam Bridge line of best fit, choose two points from the line of best fit. Calculate the slope using these two points.
From the Arc Bridge line of best fit, choose two points from the line of best fit. Calculate the slope using these two points.
Explain the significance of the slope in the context of this activity.
What is the initial value of this relationship (y-intercept)
What is the initial value of this relationship (y-intercept)
Explain the significance of the y-intercept in the context of this activity.
Write an algebraic equation model for the Beam Bridge.
Write an algebraic equation model for the Arc Bridge.
How many layers of concrete are required to hold 100 cars? Show work below.
How many layers of concrete are required to hold 100 cars? Show work below.
6-‐23 | P a g e
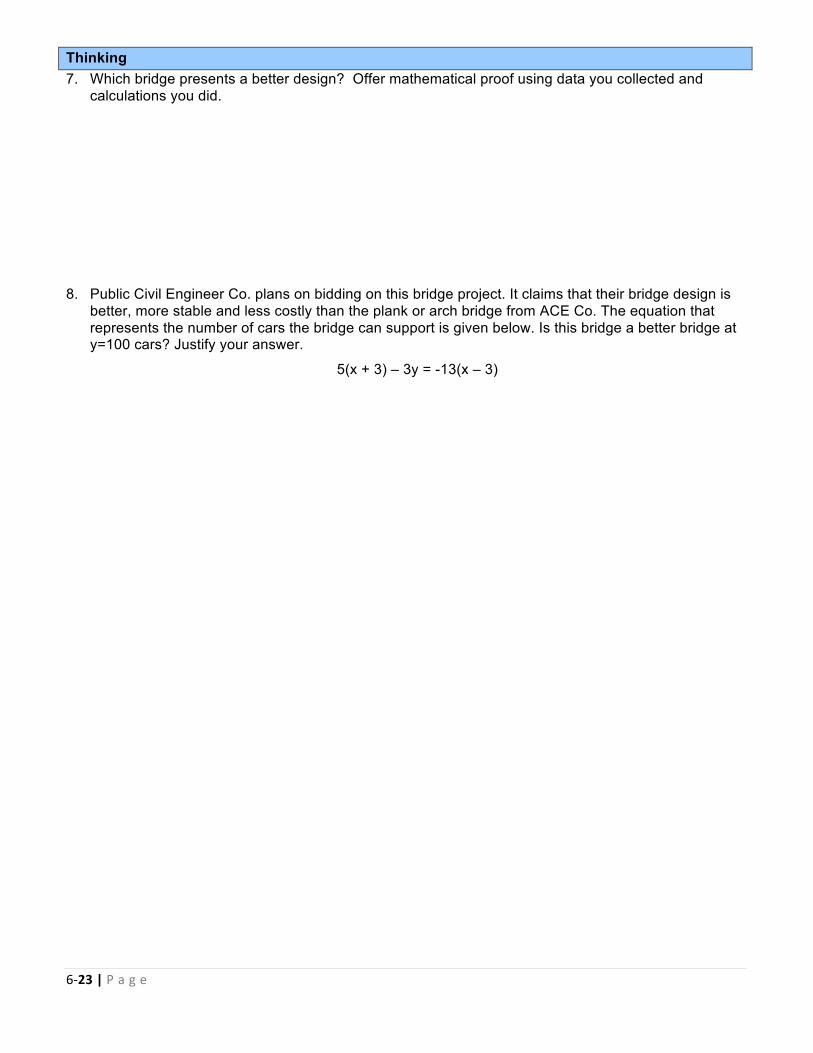
Thinking 7. Which bridge presents a better design? Offer mathematical proof using data you collected and
calculations you did.
8. Public Civil Engineer Co. plans on bidding on this bridge project. It claims that their bridge design is better, more stable and less costly than the plank or arch bridge from ACE Co. The equation that represents the number of cars the bridge can support is given below. Is this bridge a better bridge at y=100 cars? Justify your answer.
5(x + 3) – 3y = -13(x – 3)
6-‐24 | P a g e
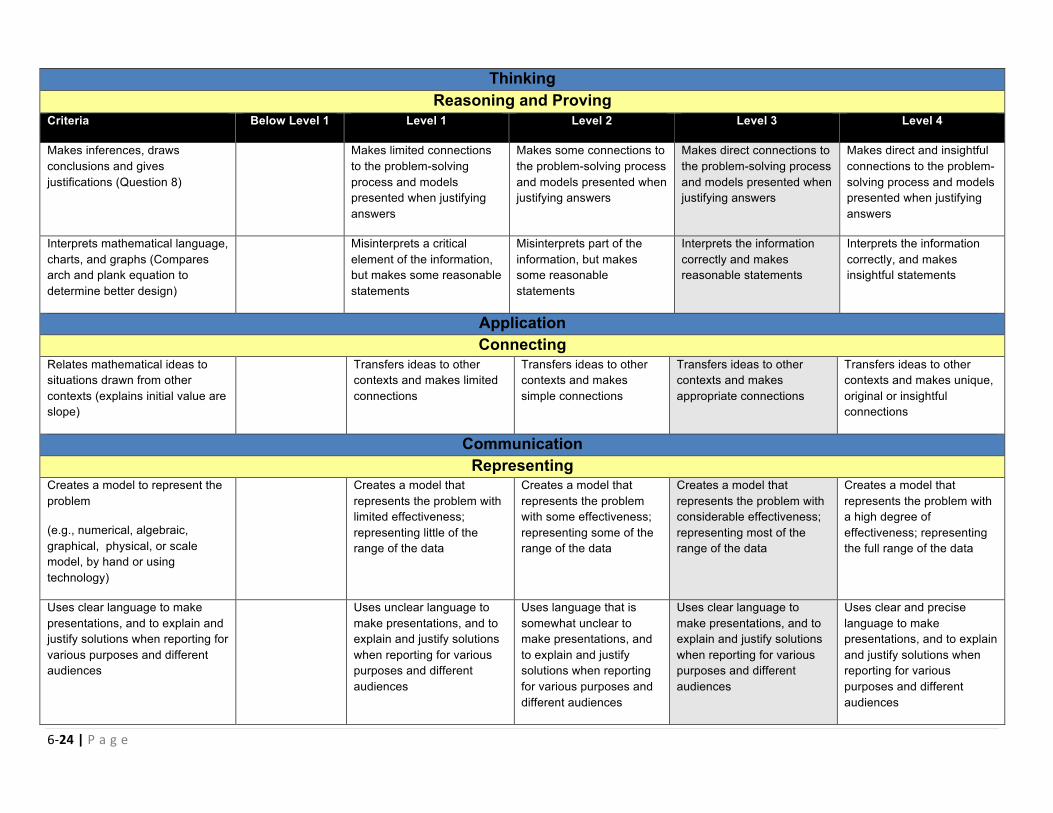
Thinking Reasoning and Proving
Criteria Below Level 1 Level 1 Level 2 Level 3 Level 4
Makes inferences, draws conclusions and gives justifications (Question 8)
Makes limited connections to the problem-solving process and models presented when justifying answers
Makes some connections to the problem-solving process and models presented when justifying answers
Makes direct connections to the problem-solving process and models presented when justifying answers
Makes direct and insightful connections to the problem-solving process and models presented when justifying answers
Interprets mathematical language, charts, and graphs (Compares arch and plank equation to determine better design)
Misinterprets a critical element of the information, but makes some reasonable statements
Misinterprets part of the information, but makes some reasonable statements
Interprets the information correctly and makes reasonable statements
Interprets the information correctly, and makes insightful statements
Application Connecting
Relates mathematical ideas to situations drawn from other contexts (explains initial value are slope)
Transfers ideas to other contexts and makes limited connections
Transfers ideas to other contexts and makes simple connections
Transfers ideas to other contexts and makes appropriate connections
Transfers ideas to other contexts and makes unique, original or insightful connections
Communication Representing
Creates a model to represent the problem
(e.g., numerical, algebraic, graphical, physical, or scale model, by hand or using technology)
Creates a model that represents the problem with limited effectiveness; representing little of the range of the data
Creates a model that represents the problem with some effectiveness; representing some of the range of the data
Creates a model that represents the problem with considerable effectiveness; representing most of the range of the data
Creates a model that represents the problem with a high degree of effectiveness; representing the full range of the data
Uses clear language to make presentations, and to explain and justify solutions when reporting for various purposes and different audiences
Uses unclear language to make presentations, and to explain and justify solutions when reporting for various purposes and different audiences
Uses language that is somewhat unclear to make presentations, and to explain and justify solutions when reporting for various purposes and different audiences
Uses clear language to make presentations, and to explain and justify solutions when reporting for various purposes and different audiences
Uses clear and precise language to make presentations, and to explain and justify solutions when reporting for various purposes and different audiences
25 | P a g e