n91-11984 - nasa · 2013-08-30 · tda progressreport42-102 n91-11984,j august 15, 1990 the impact...
TRANSCRIPT

TDA ProgressReport42-102
N91-11984,J
August 15, 1990
The Impact of NRZ Data Asymmetry on the Performanceof a Space Telemetry System
T. M. Nguyen
Telecommunications Systems Section
The telemetry data asymmetry due to rising and failing voltage transitions can
cause undesired spectrM components at the output of a spacecraft transmitter. The
performance of a space telemetry system can potentially degrade because of these
undesired components. This article derives an expression for the power spectral
density of an asymmetric nonreturn-to-zero (NRZ) data stream. This formula isthen used to investigate how the data bandwidth varies with data asymmetry.
At the receiver end, the threshold levcls of undesired spectrM components that
fall into the carrier-tracking-loop bandwidth are determined by examining the de-
rived spectral density. Further, based on this formula, a simple technique is devel-
oped for the computation of bit signal-to-noise ratio (SNR) degradation due to data
asymmetry. The telemetry bit SNR degradations derived using this technique arecompared with results obtained previously and with measurements by the Electronic
Systems Test Laboratory (ESTL) at the Lyndon B. Johnson Space Center.
I. Introduction
The performance of a space telemetry link will be de-
graded by data asymmetry because of non-ideal rising and
falling voltage transitions. The data asymmetry can causeundesired spectral components that fall within the carrier-
tracking-loop bandwidth, causing potential interference to
the carrier tracking. In addition, these undesirable spec-
tral components can cause telemetry-bit signal-to-noise ra-
tio degradation. Space telemetry links often operate un-
der imposed bandwidth constraints. When two adjacent
data channels overlap in the frequency domain, the per-
formance of a space telemetry system can be degraded
severely. With these concerns in mind, a communications
engineer is interested in determining the power spectral
density of the transmitted data.
The Consultative Committee for Space Data Systems
(CCSDS) recommends the binary NRZ format for space-
craft-to-ground telemetry data [1]. The transmitted bi-
nary NRZ data stream considered in this article is asym-
metric in time with a transition density, Pt, which is less
than or equal to ½. The data-asymmetry model for the
139
https://ntrs.nasa.gov/search.jsp?R=19910002671 2019-03-30T00:47:17+00:00Z

binary NRZ data used in this analysis employs the first
model presented in [2] (i.e., +1 NRZ symbols are elongated
by ATs/2, relative to their nominal value of Ts seconds,
when a negative-going data transition occurs; -1 sym-bols are shortened by the same amount when a positive-
going data transition occurs; and the symbols maintain
their nominal T_ seconds when no transitions occur). Thisarticle derives an expression for the power spectral density
of an asymmetric NRZ data stream. Using this expression,the data bandwidth can be measured as a function of the
data asymmetry for a specified transition density.
Based on the derived formula for the power spectral
density, this article determines the levels of undesired spec-
tral components caused by the data asymmetry that falls
into the carrier-tracking-loop bandwidth and the amount
of telemetry SNR degradation as a function of the amountof data asymmetry. The threshold level of the undesired
spectral components causing potential interference to the
carrier tracking is characterized by the interference-to-
carrier power ratio (l/C). A general expression for the
I/C as a function of the amount of data asymmetry isderived.
In 1978, Simon et al. investigated the effects of data
asymmetry on system performance [2]. Using this tech-nique, the bit SNR degradations were calculated by eval-
uating the average bit error rate (BER) in tile presence
of data asymmetry and then computing the additional bit
SNR required because of asymmetry to produce the same
value of BER when there is no data asymmetry.
This article develops a simple technique to determine
the amount of telemetry-bit SNR performance degradation
as a function of the amount of data asymmetry for a spec-ified transition density. The technique presented here uses
an approach entirely different from that presented in [2].The results obtained by this technique are then compared
with the results presented in [2].
This article begins with the derivation of the power
spectral density for an asymmetric NRZ data stream gen-erated by a purely random source. That is followed by
an investigation of the effect of the data asymmetry onthe data bandwidth. Next, an analysis of the effect ofdata asymmetry on the performance of the carrier track-
ing loop is given along with a set of curves used to deter-
mine the critical amount of data asymmetry that producesundesired spectral components, which cause harmful inter-
ference to carrier tracking. Finally, this article develops a
simple technique to assess the telemetry-bit SNR degrada-tion caused by various values of data asymmetry and then
compares the results obtained from this technique with
the results presented in [2], and the test results taken in
the Electronic Systems Test Laboratory (ESTL).
II. Derivation of the Asymmetric NRZ DataPower Spectrum
Consider a random quaternary source that every T_ sec-
onds transmits a signal from the set {gi(t);i = 1, 2,3,4}with probability pi. In the following analysis, the signalis assumed to be generated by a purely random source
where the signal transmitted in a given signaling intervalis independent of those transmitted in previous signaling
intervals. If one defines Gi(f) as the Fourier transforms of
the symbols gi(l), for i = 1, 2, 3, and 4, respectively, then
the power spectral density of the random data stream gen-
erated by this source is given by [3]
S(f) = R_IplGI(O) + p2G2(0) + p3G3(0)
+ p4G4(O)126(f) + 2R_ _ IplGI(mR,) + p2G2(mR,)rn=l
+ p3G3(mR,) --t-p4G4(mR,)12,5(f - mR,)
+ R,{pl(1 - pl)lGl(f)l 2 + p2(1 - p2)lG2(f)l 2
+ p3(1 -- pa)lG3(f)l 2 + p4(1 - p4)IG4(f)[ 2}
- 2Rs {Pip2_[G1 (f)G_(f)] + plp3_[Gl(f)G_(f)]
+ P2P4_[G2(f)G*4(f)] + p3p4_[G3(f)G*4(f)] } (1)
Ilere, R, = 1/T_ is the symbol rate (or signaling fre-quency), the asterisk denotes a complex conjugate, and_[.] denotes the real part.
It is assumed that the first data-asymmetry model pre-sented in [2] (see Fig. 1) is used in the following analysis.
For this particular asymmetric NRZ data stream,
f +A -(Ts/2) < t < (T_/2)(1 + A)gx(t)
0 elsewhere (2)
f -A -(T,/2) < t _< (T_/2)(1 - A)g2(t)
0 elsewhere (3)
140

+A -(To12) < t <_(T,12) (4)ga(0t 0 elsewhere
-A -(T,/2) < t < (To/2)g,,(t)= - (_)0 elsewhere
The Fourier transforms GI(f), G2(f), G3(/), and
G4(f) of the symbols gl(t), g2(t), 93(0, and g4(t), respec-tively, can be shown to have the following forms:
Ae--(j'qToA )/2
Gl(f) = 7rf sin(rrfTs(1 + A/2)) (0)
Ae(JTIT,_)/2
G2(f) = xf sin(TrfT,(1- A/2)) (7)
A sin( TrfT, ) (8)G3(f) - _rf
G4(f) = -G3(f) (9)
From Eqs. (6), (7), (8), and (9),
For a purely random source, the transition density Pt
can easily be shown to be
p,=2p(I -v) (17)
Inserting the terms from Eqs. (6) through (16) into
Eq. (1) and carrying out the necessary mathematics showsthe power spectral density Sd(f) for the asymmetric
NRZ data stream generated by a purely random sourceto be
" 2T, sin2(rrfT')[al(pt)+a2(p, pt,rl) ]Sd(f)=(A ,)
sin2(TrfT_ 17)2
+ (A_T')a3(Pt' rl) (rfT,)
sin0rfT') [a4(p, pt,rl)- a5(p, pt)]+ (A_To) (TrfT,)2• ¢"
continuous spectrum, So(I)
+ A212P-(1-rlpt)]26(f)
dc component, Sac(J )
Gl(0) -- lim G,(f) = ATs(1 + A/2) (10)f--+o
G_(0) = lim G2(f) = -AT,(1 - A/2) (11)
G3(0) = -a4(0) = lira Ca(f) = AT, (12)]_o
If p is the probability of transmitting a positive pulse,
i.e., p = Pr{gi(t) = +A}, and Pt the transition density,
i.e., pt = Pr{gi(l) # gi+l(t)}, then Pi, for i = 1, 2, 3, and
4 is given by
Pl = Pr{gi(t)= gl(t)} = ppt (13)
p2=Pr{gi(t)=g2(t)}=(l-p)pt (14)
Pa = Pr{gi(t) = ga(t)} = p(1 - Pt) (15)
p4=Pr{gi(t)=g4(t)}=(1-p)(1-pt) (16)
where
+ _r2P_-'_2A2£m=l -_C(m,p,q)3(f-mR,)
_. y .q
harmonics, S_, (] )
(18)
a,(pt) = pt(1 - pt)[1 + 2(1 - Pt)] - p3t (19)
a2(p, Pt,O) = [3p 3 + pt(1 - pt)[1 + 2(1 -- 2p)]]
x cos2(TrfT, 71) (20)
a3(pt, T/) = p,(1 + p_ - Pt)cos20rfT,)
+ pla cos(2rrfT, q) (21)
a4(p, pt, 7) = pt(1 - pt)(1 - 2p) [0.5 cos( 2rr fTstl)
- psin(2rfTsT])] (22)
141

as(p, pt) = 0.5pt(1 -pt)(1 - 2p) (23)
f "1
C(m,p, _/) = sin_(m_rq)[cos_(,n_rq) - (1 - 2p) _sin_(,mrq)J
(24)
A,j = -- (25)
2
Equation (18) shows that the spectrum of the asym-
metric NRZ data stream is a function of the probability of
occurrence p of the positive symbol, the transition density
Pt, and the amount of data asymmetry _. However, thepower spectral density can be expressed in terms of the
transition density by solving Eq. (17) for p and substitut-ing the result in Eq. (18). Note that Eq. (18) is valid only
for Pt <_ 1/2.
It is also interesting to evaluate the power spectral den-sity Sa(f) for the case of random data with equiprobable
symbols, i.e., p = Pt = 1/2. For this special case, from
Eq. (19) through (23),
al(1/2) = 3/8 (26)
a2(112,1/2,_) -- (5/8)cos2(_fYs_) (27)
.3(1/2,1/2, ,) = (3/8) cos2(.fT.)
+ (1/8) cos2(_fT, U) (28)
a4(1/2,1/2,_) = a5(1/2,1/2) = 0 (29)
Where the terms from Eqs. (26) through (29) are sub-stituted into Eq. (18), the power spectral density for the
asymmetric NRZ random data stream with equiprobablesymbols is
S_(f) = (A_T,/8) [ sin2Qr/T')] [3 + 5 cos_(*rfTsT/)]L (1tiT,) 2 J
+ ( A2T,,/_)[_'rsin2(2_fT")_ j][3cos%fT,) +
continuous spectrum, Sg(J')
+ A_(0.5r/)25(f)
de component, S_c(] )
A 2
+ _ £ -_-_C(m, 1/2, q)5(f-mR,)rn=l
Y
harmonics, S_ (.t')
(30)
tIere, from Eq. (24), C(rn, 1/2, rl)is
C(m, 1/2, q) = (1/4) sin2(2rnTrq) (31)
The continuous spectrum S°(f) of Eq. (30) is plotted inFig. 2, which illustrates the normalized data power spectra(i.e., S°(f)/E, here E = A2T,) for several data asymmetry
77. If BW is defined as the one-sided bandwidth of the
NRZ data stream, then the total data power that lies in
the frequency domain (-BW, BW) can be determined.Figure 3 shows the functional dependence of BW on the
data asymmetry for 90.3 percent and 89 percent of thetotal data power containment. As expected, for a fixed
data rate, the one-sided bandwidth BW increases as r/,the data asymmetry, increases.
III. The Effects of Data Asymmetry on theCarrier Tracking Loop
The space telemetry signal recommended by the
CCSDS can be expressed mathematically as [1]
sT(t) = V_ATsin[w¢t + mTd(t)P(t)] (32)
where AT is the transmitted rms voltage, w_ = 2rf¢ is
the angular carrier center frequency in rads/sec, m T is the
telemetry modulation index in rads, d(t) is the data wave-
form generated by the binary (-4-1) NRZ data sequence,and P(I) is the subcarrier waveform.
The most interesting subcarrier waveforms in space ap-
plications are square-wave for deep-space missions (Cat-
egory B) and sine-wave for near-Earth missions (Cate-gory A) [1]. For example, the Category B subcarrier wave-
form can be represented by the Fourier series expansion
4 _ cos[(2k-1)27rfsct]P(t) = -_ E 2k- 1
k=l
(33)
Here, f,_ is the subcarrier frequency in Hz.
If the data sequence d(t) is asymmetric as shown in
Fig. 1 (with equiprobable symbols and A = 1), then the
power spectral density Sa(f) of this asymmetric NRZ data
stream is found in Eq. (18). From Eqs. (32) and (33), it
142

is straightforward to show that the power spectral density
of the deep-space telemetry signal is equal to
ST(f) = A_ cos2(rnT)6(f -- fc)
4 _ sin_(m7, )4- -_-_A T
_-_ [ Sd(f - fc-(2k-1)f,c) W Sd(f - fc W (2k- l)fsc) ]x (2k- 1)_k=l
(34)
Here, Sd(f) is given in Eq. (18) with A = 1.
The index value k, see Eq. (34), denotes the kth har-monic due to the subcarrier, and m, see Eq. (18), denotes
the ruth harmonic due to data asymmetry. When mix-
ing the ruth harmonic with the kth harmonic, a "thirdharmonic" is produced. This third harmonic can have a
spectral component that falls into the carrier-tracking-loopbandwidth. It is desirable to locate this third harmonic by
examining all possible combinations of the index values k
and m. From Eqs. (18) and (34), it is easy to show thatwhen
m = 2nk - n (35)
for k and n are integers. The harmonics Sh(f), from
Eq. (18), when mixed with the subcarrier signal, will pro-duce spectral components that fall on the top of the car-
rier spectral component, tlere, n is the ratio (assumed to
be an integer) of the subcarrier frequency-to-bit rate, i.e.,
n = f_c/R,. The number of subcarrier cycles per symbolis chosen so that the interaction between data sidebands
and the residual RF carrier is minimum. In practice, f_c is
usually chosen to be three times the data rate, i.e., n = 3.
The plot of Eq. (35) is shown in Fig. 4, which illus-trates the functional behavior of the kth harmonic due to
subcarrier versus ruth harmonic due to data asymmetry.
From this figure, for a given k, one can determine the cor-
responding ruth harmonic that, when mixed with the kthharmonic, will produce a spectral component that falls on
the top of the carrier spectral component causing poten-tial interference to the carrier tracking loop. Knowing the
values of m and k, the interference-to-carrier power ratio
I/C can be calculated. From Eqs. (18) and (34), it is easyto show that
8p_ tan2(mT )C(m, p, T1) (36)I/C = 7r4m2(2k _ 1) 2
For m = 2nk - n, k and n are integers.
For p = Pt = 1/2, Eq. (34) becomes
4 tan_(mT)C(m, 1/2, r/)
I/C = 7r4m2(2k _ 1) 2(37)
For m = 2nk- n, k and n are integers, and where
C(m, 1/2, r/) is given in Eq. (31).
The plot of Eq. (37) is shown in Figs. 5 and 6 for various
values of n, k, and m. As expected, Fig. 5 shows that tile
I/C increases as the telemetry modulation index increases.This occurs because less power is allocated to the carrier
component as the telemetry modulation index increases.
Furthermore, Fig. 5 shows that the I/C decreases as bothk and m increase. Figure 6 shows that the 1/C decreases
as n, the subcarrier frequency-to-bit rate, increases.
Figures 5 and 6 can be used to determine the criti-cal amount of data asymmetry that will produce the
threshold level of I/C. As an example, from Fig. 5, for
mT= 1.35 fads, n = 3, k = 1, and m = 3, one finds
that I/C = -19.46 dB for q = 8.27 percent. However,for a deep-space mission, the maximum allowable CIV in-terference for the carrier tracking is (I/C)ma× = -15 dB
[5]. Thus, for this particular case, the undesired spectral
component generated by data asymmetry does not exceedthe maximum allowable interference when the data asym-
metry r/is equal to 8.27 percent. Figure 5 shows that, formT = 1.35 rads, 0.95 rads, n = 3, k = 1, 2, and m = 3, 5,
the interference-to-carrier power ratio does not exceed the
maxinmm allowable interference, i.e., I/C < (I/C)m_×, for
any value of 7/.
IV. Telemetry-Bit SNR Degradation Due to
Data Asymmetry
To quantitatively determine the telemetry-bit SNR de-
gradation due to data asymmetry, one nmst define all the
degradation sources created by the data asymmetry. Inthis section, it is assumed that the telemetry BER degra-
dation due to imperfect bit synchronization is negligible
(only on the order of a few tenths of a dB) [2]. Further-more, the telemetry BER degradation due to imperfect
subcarrier tracking is also ignored. This is the case becausethe subcarrier frequency is usually nmch higher than the
data symbol rate; hence, the subcarrier tracking loop will
not be affected by the data asymmetry. This is particularly
true for a specific implementation of the subcarrier track-
ing loop described in [4]. Thus, there remain three major
143

sources of degradation that the data asymmetry created,namely:
(1) Undesired discrete spectral components
(2) Continuous spectral distortion
(3) Matched filtering loss
The undesired discrete spectral components created bydata asymmetry can cause potential interference to the
telemetry data channel. If one denotes Au as the bit SNR
degradation due to the presence of the undesired spectral
components, then it is straightforward to show that
1 ]0-WA, = 101oglo [1 + No(BW) Sl(f)df] (38)
where No is the one-sided noise spectrum density, BW is
the one-sided data bandwidth, and S1(f) is the interfer-ence power spectrum density.
The above equation assumes that the total noise spec-tral density seen by the telemetry data channel is the ther-
mal noise plus the interference spectral density. If the one-
sided bandwidth is equal to the bit rate, i.e., BW = R,,
then, from Eq. (18),
Si(f) = Sale(f) + 2A_P_ C(1,p, q),_(f - R,)7r 2
(39)
where Sd¢(f)is defined in Eq. (18), and C,(1,p, rl)is givenin Eq. (24) with m = 1.
For p = Pt = 1/2, Sale(f) = S_e(f), see Eq. (30). Thus,
from Eq. (30), Eq. (39) can be rewritten
A 2
St(f) = A2(0.5q)26(f) + _-_2 C(1, 1/2, r/)6(f - R,) (40)
In this case, C(1, 1/2, q) = (1/4)sin2(27rq) is given in
Eq. (31) with m = 1.
Therefore, for p = P, = 1/2, from Eq. (40), Eq. (38)can be written as
Eb C(1, 1/2, r/)A_ = 101ogxo [1 + _0 ((0.5q)2 + 27r_ )] (41)
Here, Eb = A2T, = bit energy. As an example for Cate-
gory B, the bit energy is found to be: Eb = (A_.T,)sin2(mT), see Eq. (34).
Equation (41) assumes that all the harmonics with fre-
quency components greater than R_, i.e., f > R,, have
been filtered out by the predetection filter (assumed to be
of the brick-wall type).
Figure 2 shows that the continuous component of the
telemetry spectral density is distorted by data asymmetry.
Spectral distortion can cause further degradation in bit
SNR. If Ad is the bit SNR degradation due to spectraldistortion, then Ad can be defined as
101o 10[a::]where
Ial = Sen(f)df (43)R,
Here, Sen(f)=Se(f)/Eb, with Se(f) as defined in Eq. (18).
For p = Pt = 1/2,Se(f) = S_(f). Here, S_(f) is given inEq. (30). Then
sa2 = Sud(f)df (44)R,
Here, Sud(f) is the undistorted normalized (by Eb) spec-
tral density, which is given by [3]
[sin(rf/R')] _ (45)S_d(f) = [ (_rf/R,)
It is well known that for binary NRZ data signals, the
matched filter is an integrate and dump filter. Since the
binary NRZ data stream is distorted by the rising andfalling voltage transitions, the integrate and dump filter is
no longer the matched filter for detecting the binary NRZ
data signal. If Am is the bit SNR degradation due to thematched filter, then Am can be defined as
Here the mean value of the matched filter output signal ofthe undistorted signal is represented by #, and the mean
value of the matched filter output signal of the distortedsignal is represented by
/_0 = _ (47)
144

Since the NRZ data stream is asymmetric with p as the
probability of occurrence of the +A symbol and (1- p) for
the -A symbol, the output of the matched filter depends
on the polarity of the symbol over which it is integratingand that of the preceding and succeeding symbols. Thus,the mean value of the matched filter output can be com-
puted by examining eight possible three-symbol sequences.From Appendix A, Fig. 2, of [6], the mean of the matched
filter output signal in the presence of data asymmetry can
be easily shown to have the following form:
If Eqs. (47) and (48) are substituted into Eq. (46),
With equiprobable symbols, i.e., p = 1/2, Eq. (49) be-comes
(50)
The teleiuetry-bit SNR degradation due to data asym-
metry is defined as the sum of the degradations due to un-desired spectral components, the spectral distortion and
the matched filtering loss. From Eqs. (38), (42), and (49),
the bit SNR degradation is given by
A=Au+Ad+Am (51)
Here Au, Ad, and Am are defined in Eqs. (38), (42),
and (49), respectively.
Equation (51) is used to calculate the telemetry-bit
SNR degradation for the specified amount of data asym-
metry with bit-error probability (P_) as a parameter. ForP = Pt = 1/2, the results of these calculations are given inTable 1.
A plot based on the results in Table 1 is illustrated
in Fig. 7. tIere the bit SNR degradation as a functionof data asymmetry with probability of error (P_) as a
parameter is illustrated. This figure clearly shows thatthe telemetry-bit SNR degradation increases as tile data
asymmetry increases. This figure also shows that, for a
fixed data asymmetry, the bit SNR degradation increases
as the error probability decreases.
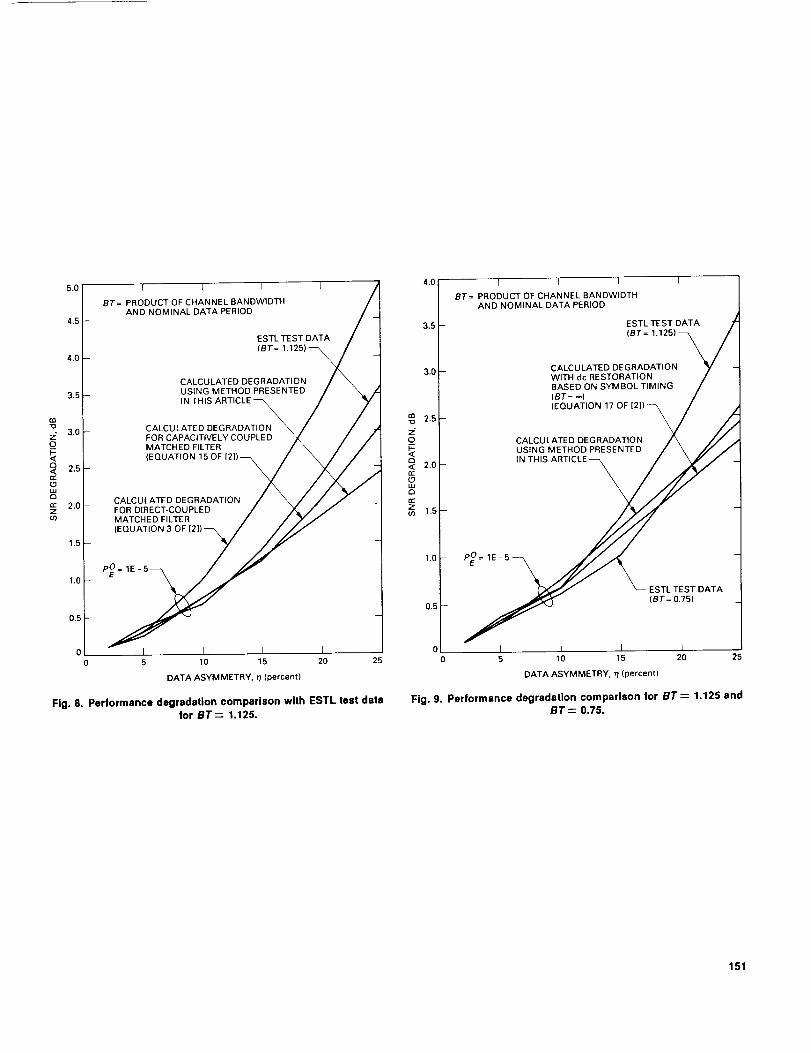
In Figs. 8 and 9, the analytical results found in Table 1
are compared with the results presented in [2]. Figure 8
illustrates the bit SNR degradation versus data asymme-
try along with the comparable results obtained from [2]
corresponding to no dc restoration (direct coupling, Eq. 3
of [2]) and dc restoration by capacitive coupling (Eq. 15
of [2]). In addition, Fig. 8 also shows the test results forBT = 1.125 taken in the ESTL [2] for the sake of com-
parison, where BT denotes the product of channel band-
width and nominal data period. For data asymmetry of
less than 20 percent, the results obtained using the simple
technique presented in this article are very close to the re-sults obtained from Eq. 15 of [2] for a capacitively coupledmatched filter.
The results presented in Table 1 are further compared
in Fig. 9 with the results obtained in [2] for a specific imple-
mentation of the symbol synchronizer with dc restoration
based on symbol timing (Eq. 17 of [2]). The test resultstaken at ESTL for BT = 1.125 and 0.75 are also shown in
this figure for the sake of comparison. Again, these resultsare in good agreement. However, it is to be noted that the
analytical results predicted by Eq. (51) were derived for a
special case where tile one-sided channel bandwidth BW
is equal to tile data bit rate Rs, i.e., BT = 1.
V. Conclusions
The impact of the data asymmetry on the performance
of a space telemetry system has been investigated based on
the derived spectral density of an asymmetric NRZ data
stream. The derived power spectrum is also used to in-
vestigate how rapidly the data bandwidth increases as theamount of data asymmetry iucreases. It was shown that
the data bandwidth increases exponentially as the amount
of data asymmetry increases. An analytical model to pre-dict the threshold levels of undesired spectral components
that fall into the carrier-tracking-loop bandwidth was de-
rived, and a simple model to predict the telemetry-bit SNR
dcgradation due to data asymmetry was developed. It was
shown that, for a specific operating condition, the carrier
tracking loop does not drop lock at any value of 71, thedata asymmetry, and that the simple model developed in
this article can be used to accurately predict the bit SNR
degradation.
145

Acknowledgments
The author is indebted to Drs. M. K. Simon and F. Davarian for their invaluable
comments and useful suggestions during the preliminary review of this work.
References
[1] Consultative Committee for Space Data Systems, Recommendations for Space
Data System Standards, Radio Frequency and Modulation Systems, Part I: Earth
Stations and Spacecraft, CCSDS 401.0-B-I, Blue Book, National Aeronautics and
Space Administration, Washington, D.C., January 1987.
[2] M. K. Simon, K. Tu, and B. tI. Batson, "Effects of Data Asymmetry on Shuttle
Ku-Band Communications Link Performance," IEEE Transactions on Commu-
nications, vol. COM-26, no. 11, pp. 1639-1651, November 1978.
[3] W. C. Lindsey and M. K. Simon, Telecommunication Systems Engineering, Chap-ter 1, Englewood Cliffs, New Jersey: Prentice-Hall, Inc., 1973.
[4] Deep Space Telecommunications Systems Engineering, Chapter 5, J. Yuen, Edi-
tor, New York: Plenum Press, 1983.
[5] International Radio Consultative Committee, "Protection Criteria and SharingConsiderations Relating to Deep Space Research," Recommendations and Re-
ports of the CCIR, 1986, XVIth Plenary Assembly, Volume II: Space Research
and Radio Astronomy, Report 685-2, pp. 278-289, Dubrovnik: CCIR, 1986.
[6] W. K. Alem, G. K. Huth, and M. K. Simon, Integrated Source and Channel
Encoded Digital Communication System Design Study, Final Report (R7803-7)under Contract NAS 9-15240, Axiomatix, Marina del Rey, California, March 31,1978.
146
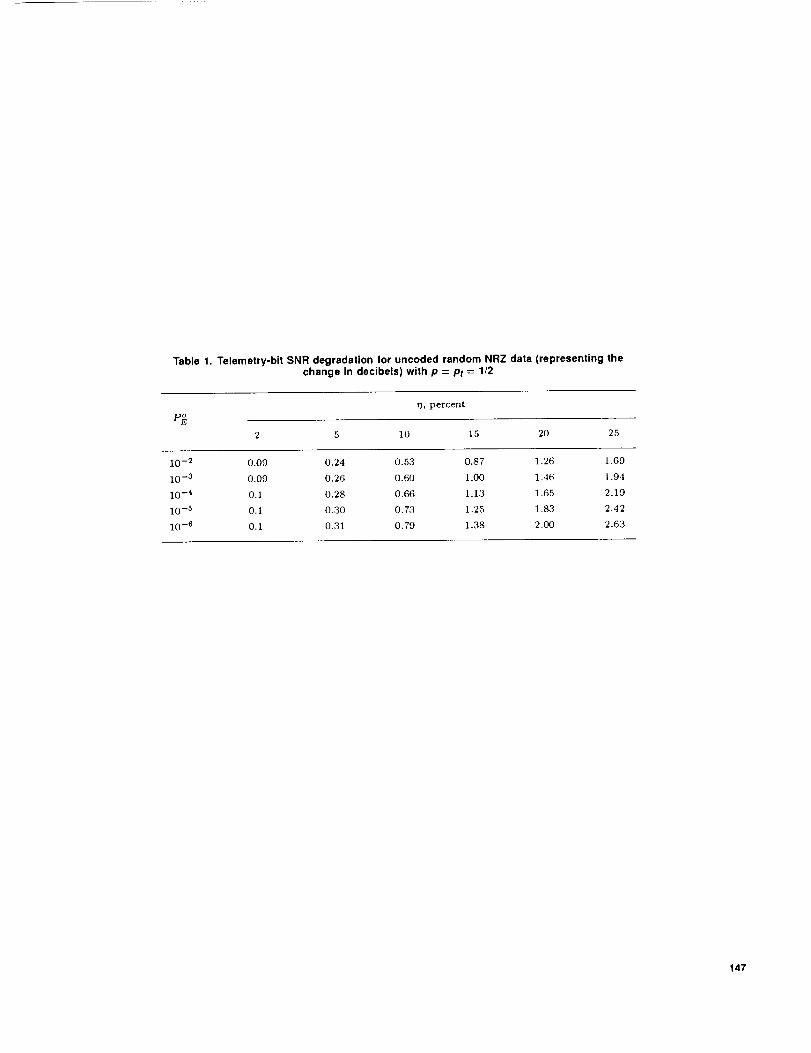
Table 1. Telemetry-bit SNR degradation for uncoded random NRZ data (representing the
change in decibels) with p = Pt = 1/2
_, percent
v_2 5 lO 15 20 25
10 -2 0.09 0.24 0.53 0.87 1.26 1.69
10 -3 0.09 0.26 0.60 1.00 1.46 1.94
10 -4 0.1 0.28 0.66 1.13 1.65 2.19
10 -5 0.1 0.30 0.73 1.25 1.83 2.,12
10-6 0.1 0.31 0.79 1.38 2.00 2.63
147

d(t)
Ars2
I3_ STs
2 2
A_
Fig. 1. Asymmetric NRZ data stream using asymmetry model 1 [2].
I I
0%
rl = 20%
= 25%
q = 35%
r/= DATA ASYMMETRY
0
0 O.5 1.0
f_s
Fig. 2. Normalized power spectre versus data asymmetry.
1.5
3.5
3.0
2.5
(n
2.0cQ
1.5
1.0
0.5
I I I I
BW= ONE-SIDED BANDWIDTH OF THE NRZ DATA
_ BW Sc(f)df = 90.3%
BW -BW
Sc(fldf 89%
BW
I t I I5 10 15 20 25
DATA ASYMMETRY, q (percent)
Fig. 3. One-sided bandwidth versus data asymmetry.
148

>-n-
>-03<oi-
E3
zoz;rr-<"1"
8O
7O
6O
5O
4O
3O
2O
10
I 1 I
n = SUBCARRIER FREQUENCY TO BIT RATE
n=4
1=3
0 I I I I0 2 4 6 8
kth HARMONIC DUE TO SUBCARRIER
I0
Fig. 4. Functional behavior of the ruth versus kth harmonic.
t_
-10 I I I t I I
n = 3 m T = 1.35 rad_k 1 //=
-20
-30
-40
-50
-60
-70 k = 2
-80
n = SUBCARRIER FREQUENCY TO BIT RATE
m T = TELEMETRY MODULATION INDEX, rad-90 m = THE mth HARMONIC DUE TO DATA ASYMMETRY
k = THE kth HARMONIC DUE TO SUBCARRIER
-Ioo I I l I { [0 5 10 15 20 25 30
DATA ASYMMETRY, rt (percent)
Fig. 5. Interference-to-carrier ratio versus data asymmetry for
various values of the telemetry modulation index.
35
149

n_-lO
-10
-2O
-3O
-4O
-5O
-60
I I I I
_- rn T = 1.35 tad k = 1
rrl=3
m=5
I t
,'I, = 3 --
_n=4
I n = SUBCARRIER FREQUENCY TO BITRATE
-70 rn T = TELEMETRY MODULATION INDEXrn = THE ruth HARMONIC DUE TO DATA ASYMMETRY
k = THE kth HARMONIC DUE TO SUBCARRIER
-80 I I I I t I0 5 10 15 20 25 30 35
DATA ASYMMETRY, 71(percent)
Fig. 6. Interference-to-carrier ratio versus data asymmetry for
various values of r/.
rn
Z__0t--<
rr"ZU_
3.0i
2.5
2.0
1.5
1.0
0.5
I 1
BER = BIT ERROR RATE, pO¢:
BER = 1E-I
BER = 1E-5
BER = 1E-4
BER = 1E-3
BER = 1E
I I t I
5 10 15 20
DATA ASYMMETRY,_(percent)
25
Fig. 7. Telemetry-bit SNR degradation versus data asymmetry.
150
5,0
4.5
1.0
l I I
BT= PRODUCT OF CHANNEL BANDWIDTHAND NOMINAL DATA PERIOD
ESTLTEST DATA(BT=
CALCULATED DEGRADATIONUSING METHOD PRESENTEDIN THI, c
CALCULATED DEGRADATION
FOR CAPACITIVELY COUPLEDMATCHED FILTER
(EQUATION 15 OF
CALCULATED DEGRADATION
FOR DIRECT-COUPLEDMATCHED FILTER(EQUATION 3 OF [2
0
0 5 10 15 20 25
DATA ASYMMETRY, F (percent)
Fig. 8. Performance degradation comparison with ESTL test data
for BT= 1,125,
z"_o
iz:(.9
n,-
4,0
3.5
3.0-
2.5
2.0
1.5
1,0
0.5
0'
0
BT= PRODUCT OF CHANNEL BANDWIDTHAND NOMINAL DATA PERIOD
ESTL TEST DATA
(BT= 1.125)_
CALCULATED DEGRADATIONWITH dc RESTORATIONBASED ON SYMBOL TIMING
(BT= _)(EQUATION 17 OF [2
CALCULATED DEGRADATION
USING METHOD PRESENTEDIN THIS ARTI
PEO= 1E - 5---_
ESTL TEST DATA
(BT= 0.75)
5 10 15 20 25
DATA ASYMMETRY, 71(percent)
Fig. 9. Performance degradation comparison for BT--= 1.125 andBT : 0.75.
151