mup thesis maximilian dixon
TRANSCRIPT
How Can An Asset-Based Appreciative Inquiry Risk Assessment Model Improve FEMA’s
Risk MAP Process To Help Communities Become More Resilient?
Maximilian M. Dixon
A thesis
submitted in partial fulfillment of the
requirements for the degree of
Master of Urban Planning
University of Washington
2014
Committee:
Jan Whittington
Robert Freitag
Daniel Abramson
Program Authorized to Offer Degree:
Urban Design and Planning
i
© Copyright 2014
Maximilian M. Dixon

ii
University of Washington
Abstract
How can an asset-based appreciative inquiry risk assessment model improve FEMA’s Risk MAP
process to help communities become more resilient?
Maximilian Dixon
Chair of the Supervisory Committee:
Assistant Professor Jan Whittington
Urban Design and Planning
Communities are facing ever increasing risk. There is a growing awareness among risk
professionals (analysts, emergency managers, planners etc.) that the tools and processes for
assessing risk and helping communities become resilient are inadequate. In order to strengthen
the nation’s resilience, FEMA should modify its Risk MAP process so that it addresses the ever
changing conditions and risks communities face.
In this system analysis, an asset-based appreciative inquiry risk assessment model (referred
to in this thesis as the “ABAIRA Model”) is compared to the Federal Emergency Management
Agency’s Risk MAP process. The ABAIRA Model expands upon an asset-based approach to
Risk MAP (referred to in this thesis as the “Workshop Model”) that the author helped develop
and test at the request of the Federal Emergency Management Agency. Eight main problem areas
for improvement are addressed. These include: (1) defining community resilience; (2) a risk
assessment process that focuses on what really matters to a community, most importantly their
human well-being; (3) effective community engagement; (4) incorporating community goals and
plans into the risk assessment process; (5) identifying assets beyond just built capital, by
including natural and social capital; (6) assessment of community capability; (7) identification
and assessment of mitigation, risk reduction and resilience opportunity; and (8) incorporating
risk assessment into other community planning processes. This analysis expands upon the
Workshop Model’s concepts and approach.
iii
Preface
Over the past year, Professors Robert Freitag, Daniel Abramson, Manish Chalana, myself
and many others explored new ways to increase community participation in the Federal
Emergency Management Agency (FEMA) Risk MAP process, and to better integrate Risk MAP
into communities’ on-going land use planning. We developed an asset-based approach to Risk
MAP (referred to in this thesis as the “Workshop Model”), which we tested by conducting
workshops in three communities: Redmond, Everett and Neah Bay. FEMA provided funding for
these workshops as part of the project. This work culminated in a report titled, Whole Community
Resilience: An Asset-Based Approach to Enhancing Adaptive Capacity Before a Disruption, as
well as an article with the same title submitted to the Journal of the American Planning
Association (JAPA). The article is currently in revision (see Appendix G for a draft copy). Much
of the language of this thesis appears in the report and article, and although I contributed to them
as a co-author with Professors Freitag, Abramson and Chalana, it has not been possible to cite
the author of every idea. This thesis would not have been possible without the opportunity to
contribute to this project; the skills and knowledge I obtained during the pursuit of my
concurrent master’s degrees; and all the hard work from the other project team members.
iv
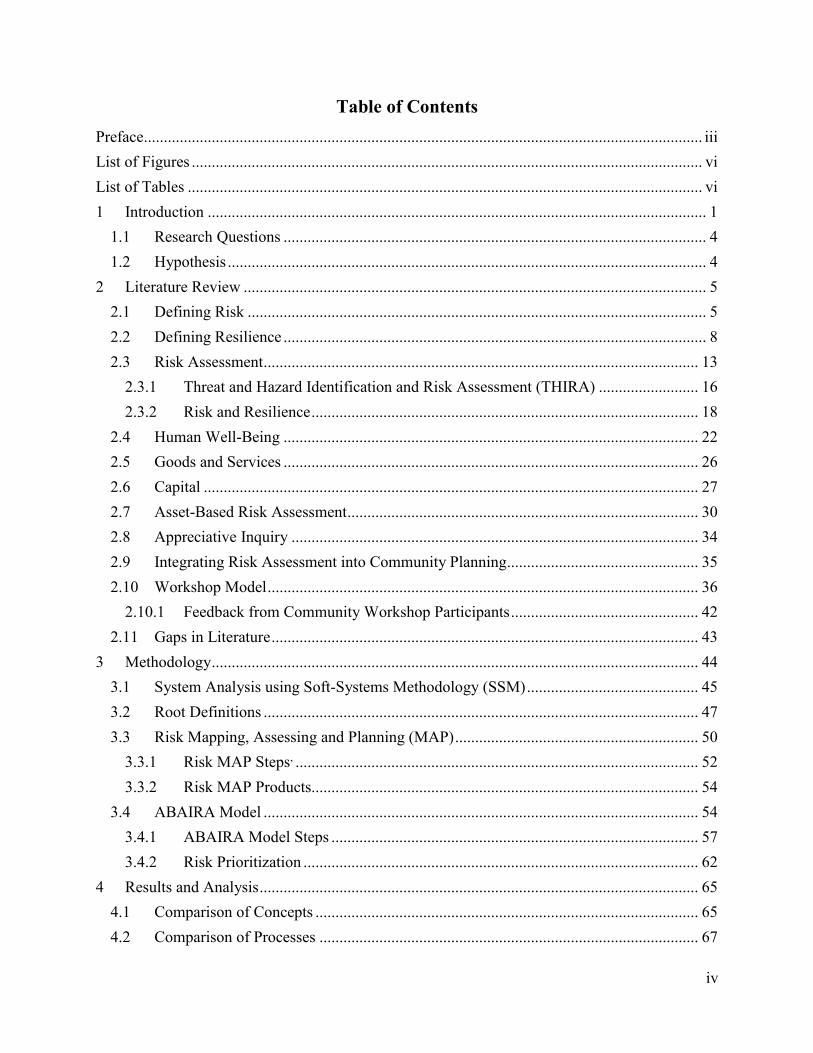
Table of Contents
Preface............................................................................................................................................ iii
List of Figures ................................................................................................................................ vi
List of Tables ................................................................................................................................. vi
1 Introduction ............................................................................................................................. 1
1.1 Research Questions .......................................................................................................... 4
1.2 Hypothesis ........................................................................................................................ 4
2 Literature Review .................................................................................................................... 5
2.1 Defining Risk ................................................................................................................... 5
2.2 Defining Resilience .......................................................................................................... 8
2.3 Risk Assessment ............................................................................................................. 13
2.3.1 Threat and Hazard Identification and Risk Assessment (THIRA) ......................... 16
2.3.2 Risk and Resilience ................................................................................................. 18
2.4 Human Well-Being ........................................................................................................ 22
2.5 Goods and Services ........................................................................................................ 26
2.6 Capital ............................................................................................................................ 27
2.7 Asset-Based Risk Assessment ........................................................................................ 30
2.8 Appreciative Inquiry ...................................................................................................... 34
2.9 Integrating Risk Assessment into Community Planning................................................ 35
2.10 Workshop Model ............................................................................................................ 36
2.10.1 Feedback from Community Workshop Participants ............................................... 42
2.11 Gaps in Literature ........................................................................................................... 43
3 Methodology .......................................................................................................................... 44
3.1 System Analysis using Soft-Systems Methodology (SSM) ........................................... 45
3.2 Root Definitions ............................................................................................................. 47
3.3 Risk Mapping, Assessing and Planning (MAP) ............................................................. 50
3.3.1 Risk MAP Steps, ..................................................................................................... 52
3.3.2 Risk MAP Products................................................................................................. 54
3.4 ABAIRA Model ............................................................................................................. 54
3.4.1 ABAIRA Model Steps ............................................................................................ 57
3.4.2 Risk Prioritization ................................................................................................... 62
4 Results and Analysis .............................................................................................................. 65
4.1 Comparison of Concepts ................................................................................................ 65
4.2 Comparison of Processes ............................................................................................... 67
v
4.3 Suggestions for Improvement to the Risk MAP Process ............................................... 71
4.4 Limitations and Constraints ........................................................................................... 73
5 Discussion .............................................................................................................................. 75
5.1 Findings .......................................................................................................................... 75
5.1.1 Defining Community Resilience ............................................................................. 75
5.1.2 Assessing Risk to What Really Matters .................................................................. 77
5.1.3 Effective Community Engagement ......................................................................... 81
5.1.4 Incorporating Community Goals and Plans ............................................................ 83
5.1.5 Including Natural and Social Capital (Assets) ........................................................ 84
5.1.6 Identifying and Assessing Capability ..................................................................... 85
5.1.7 Identifying and Assessing Opportunity .................................................................. 86
5.1.8 Incorporating Risk into Other Community Planning Processes ............................. 87
5.2 Proposed Risk MAP Process .......................................................................................... 88
5.2.1 Proposed Risk MAP Steps ...................................................................................... 90
5.2.2 Proposed Risk MAP Products ................................................................................. 93
5.3 Limitations ..................................................................................................................... 95
5.4 Further Research ............................................................................................................ 95
6 Conclusion ............................................................................................................................. 97
Works Cited ................................................................................................................................ 100
7 Appendices .......................................................................................................................... 104
7.1 Appendix A. Panarchy ................................................................................................. 104
7.2 Appendix B. The Rockefeller City Resilience Framework.......................................... 109
7.3 Appendix C. Community Workshop Risk and Resilience Worksheet......................... 113
7.4 Appendix D. Community Workshop Agenda .............................................................. 114
7.5 Appendix E. Community Workshop Evaluation Form ................................................ 117
7.6 Appendix F. Summary of Community Workshop Model Results ............................... 118
7.7 Appendix G. Draft Article Submission to JAPA ......................................................... 122
vi
List of Figures
Figure 1. Standard Risk Assessment Process .............................................................................. 14
Figure 2. Risk Assessment Matrix (Time) ................................................................................... 16
Figure 3. THIRA Process ............................................................................................................. 17
Figure 4. Human Ill-being vs. Well-being ................................................................................... 24
Figure 5. Community Workshop .................................................................................................. 40
Figure 6. FEMA Risk Assessment System ................................................................................... 48
Figure 7. ABAIRA System ........................................................................................................... 49
Figure 8. Risk MAP Process ........................................................................................................ 51
Figure 9. ABAIRA Model ............................................................................................................ 56
Figure 10. Proposed Risk MAP Process ....................................................................................... 90
Figure 11. Panarchy Model ........................................................................................................ 104
Figure 12. Panarchy Model with Nested Cycles ........................................................................ 107
List of Tables
Table 1. Common Risk Assessment Matrix ................................................................................ 15
Table 2. Comparison of Risk Management and Resilience Perspectives .................................... 19
Table 3. Contrasting the "Needs" vs. "Assets" Approach to Community Enhancement ............. 32
Table 4. Workshop Participant Response Averages - Likert Scale of 1 (“no”) to 5 (“yes”) ........ 42
Table 5. Risk Prioritization Matrix ............................................................................................... 63
Table 6. Comparison of Resilience Definitions ............................................................................ 66
Table 7. Comparison of Risk Assessment Approaches ................................................................ 67
Table 8. Comparison of Goals ...................................................................................................... 68
Table 9. Comparison of Process Steps .......................................................................................... 69
1
1 Introduction
The world is changing rapidly. Communities are facing greater and more complex risks, i.e.
climate change, cyber vulnerabilities and terrorism. Infrastructure systems are becoming more
complex and expensive to build and maintain. In 2013 the American Society of Civil Engineers
(ASCE) gave US infrastructure a D grade. The tools, processes and approaches we use today to
assess and manage risk are becoming outdated and inadequate. In order for our nation to become
resilient, our communities must become resilient by better managing risk.
Risk assessment provides information about risk to help governments, businesses and
communities make better risk management decisions. This can help communities become “more
resilient and better able to withstand the impacts of disaster.” 1 In order to analyze risk,
organizations must be able to analyze what community stakeholders value. Typically, when
conducting risk assessment, the mapping of what is considered valuable and important to the
broader community is not explicitly stated and debated among the majority of stakeholders.
Instead there is an assumption that all stakeholders implicitly agree on community assets,
including infrastructure, that are both necessary and vulnerable. Stakeholders however often
have different opinions on what is important, which often results in the pursuit of irreconcilable
goals.2
1 Federal Emergency Management Agency. FEMA’s Risk Mapping, Assessment, and Planning (Risk MAP): Fiscal
Year 2011 Report to Congress. Federal Emergency Management Agency, 2011. 2 Becker, Per and Henrik Tehler. “Constructing a Common Holistic Description of What is Valuable and Important
to Protect: A Possible Requisite for Disaster Risk Management.” International Journal of Disaster Risk Reduction 6
(2013): 18–27. 19 and 20.
2
Risk MAP is a process that helps communities map, assess and plan for risk, which helps
them to take action to reduce their risk.3 Through collaboration with State, Local, and Tribal
entities, this process helps communities identify, assess, communicate and mitigate risk (mainly
involving flooding and earthquakes). It also enhances maps (mainly flood maps); provides risk
information (in the form of reports) to help communities enhance their mitigation plans; and
guides and encourages them to communicate risk to their constituents. 4
Risk MAP also supports the following FEMA Administrator’s Priorities: (1) the priority to
strengthen the nation’s resilience to disasters; and (2) FEMA’s strategic priority to foster a
national community-oriented approach to emergency management that strengthens local
institutions, assets, and social networks to build sustainable and resilient communities.5
The Risk MAP process and products are useful for showing communities what built assets
are currently at risk, especially regarding flood data and insurance. It produces useful mapping
layers, maps and data. It gives a good overview of different types of hazards (mainly flood and
earthquake), mitigation actions (mostly focused on built capital), what funding is available for
such actions and what some areas of concern are regarding structures. It also ties in hazard
mitigation planning, and to some extent comprehensive planning. All of these elements make
Risk MAP strong in technical and visual areas, and traditional hazard mitigation planning. The
Risk MAP process can however be much more than delivering quality data.
3 Federal Emergency Management Agency. Community Resilience Upper Spokane Watershed. PowerPoint
Slideshow. Federal Emergency Management Agency, 2012. 4 Institute for Hazards Mitigation Planning and Research, University of Washington. Whole Community Resilience:
An Asset-Based Approach to Enhancing Adaptive Capacity Before a Disruption - Final Report. Federal Emergency
Management Agency, 2014. 36. 5 Federal Emergency Management Agency. FEMA’s Risk Mapping, Assessment, and Planning (Risk MAP): Fiscal
Year 2011 Report to Congress. Federal Emergency Management Agency, 2011.

3
A more effective approach is needed. One that engages community stakeholders; moves
away from problem-based planning (that so often misses informal systems, which characterize
social, cultural and natural capital of a community) to asset-based appreciative inquiry planning;
identifies and assesses all risk to all assets that are necessary for each communities’ human well-
being; incorporates community goals and planning in the risk assessment process; includes
capability and opportunity analyses; and helps address the need for inclusion of risk assessment
and information into other community planning processes. The Federal Emergency Management
Agency understands much of this and funded the development and testing of an asset-based
approach (referred to in this thesis as the “Workshop Model”) to help improve their Risk MAP
process.
This thesis expands on the Workshop Model in the following ways: (1) it formalizes the
approach by creating an expanded asset-based appreciative inquiry risk assessment model
(referred to in this thesis as the “ABAIRA Model”); (2) further clarifies key concepts, including
risk, resilience and human well-being (HWB); (3) expands the scope to include eight major
areas; (4) adds a risk prioritization matrix; and (5) compares the ABAIRA Model to Risk MAP.
The Workshop Model and its underlying concepts of resilience, risk, risk assessment, capital,
human well-being and appreciative inquiry were used as the foundation for the ABAIRA Model.
There are eight main areas for improvement to the Risk MAP process that are addressed in
this thesis. These include: (1) defining community resilience; (2) a risk assessment process that
focuses on what really matters to a community, most importantly their human well-being; (3)
effective community engagement; (4) incorporating community goals and plans into the risk
assessment process; (5) identifying assets beyond just built capital, by including natural and
social capital; (6) assessment of community capability; (7) identification and assessment of
4
mitigation, risk reduction and resilience opportunity; and (8) incorporating risk assessment and
information into other community planning processes.
1.1 Research Questions
Research Question
How can an asset-based appreciative inquiry risk assessment model improve FEMA’s
Risk MAP process to help communities become more resilient?
Sub-questions
o What is risk?
o What is resilience?
o What is risk assessment?
o What is human well-being?
o What is the Risk MAP process?
o What is the ABAIRA Model?
1.2 Hypothesis
The ABAIRA Model will provide an approach with which risk assessment processes can
be improved to help communities become more resilient. At the very least it will further the
much needed discussion that should lead to an improved FEMA Risk MAP process approach and
a better understanding of community risk and resilience.
5
2 Literature Review
Many of the concepts discussed within this analysis are complex and have competing
definitions. It is therefore important to provide some detailed explanations and context. The
discussion begins with risk in the context of hazards and threats. It moves to resilience, then to
risk assessment. From there, human well-being is discussed, along with the necessary goods and
services that support it and the different types of capital (assets) that provide these goods and
services. Then onto asset-based risk assessment and appreciative inquiry, and finally, the process
of integrating risk assessment into other types of planning.
2.1 Defining Risk
Understanding, managing, and reducing risk is fundamental for building community
resilience. Risk as defined by The United Nations Office for Disaster Risk Reduction (UNISDR),
is “The combination of the probability of an event and its negative consequences.” 6 The
negative consequences that are most often listed in regard to disaster risk are losses to lives,
property, assets and services. This view of disaster risk is limited. It discounts the opportunities
that come with change that both causes and is caused by events.
Conventional disaster and hazard mitigation planning views the mitigation-preparation-
response-recovery sequence in linear terms, dependent on an ability to predict events and their
6 UNISDR The United Nations Office for Disaster Risk Reduction Website; “Terminology.”
http://www.unisdr.org/we/inform/terminology. (accessed July 28, 2014).
6
impacts, largely in order to preserve or restore pre-event conditions.7 Such planning is typically
driven by a vulnerability analysis.
The process assumes that resilience is achieved by mitigating all vulnerabilities, which is
expensive, if not impossible and unsustainable given our limited resources. Restoring things back
to the way they were before a disruption is also practically impossible and often socio-
ecologically undesirable. This has been recognized by recent efforts to incorporate sustainability
into community disaster recovery goals. 8,9 Threats should instead be seen as uninvited but
potentially important agents of change, and resilience should be viewed as the capacity to adapt
to change, rather than to bounce back from it.10 The capacity to adapt is being able to respond to
a disruption by adjusting to a new normal, and to build back better, where better is defined
according to community cultural and social values and principles of resilience. 11,12 The capacity
to adapt often times is only revealed after a disruption, but it could and should be developed in
the course of a community’s ongoing development.
In this analysis, risk is defined as threats to human well-being and consequently community
resilience. Opportunities are defined as positive risk or the chance that resilience will improve,
7 Beatley, T. Planning for Coastal Resilience: Best Practices for Calamitous Times. Washington, DC: Island Press,
2009. 6-8. 8 Paton, D., and D. M. Johnston, eds. Disaster Resilience: An Integrated Approach. Springfield, IL: Charles C.
Thomas, 2006. 7 and 8. 9 Smith, G. P., and D. Wenger. “Sustainable Disaster Recovery: Operationalizing an Existing Agenda.” In H. â.
Rodríguez, E. L. Quarantelli and R. R. Dynes, eds. Handbook of Disaster Research, 234-257. New York: Springer,
2007. 10 Norris, F., S. Stevens, B. Pfefferbaum, K. Wyche, and R. Pfefferbaum. “Community Resilience as a Metaphor,
Theory, Set of Capacities, and Strategy for Disaster Readiness.” American Journal of Community Psychology 41,
no.1 (2008): 127-150. 11 Chan, K. M. A., A. D. Guerry, P. Balvanera, S. Klain, T. Satterfield, X. Basurto and U. Woodside. “Where Are
Cultural and Social in Ecosystem Services?: A Framework for Constructive Engagement.” BioScience 62, no. 8
(2012): 744-756. 12 Millennium Ecosystem Assessment. Ecosystems and Human Well-being: Synthesis. Washington, DC: Island
Press, 2005.
7
i.e. through mitigation.13 Capability is defined as the community’s capacity for threat warning,
preparedness, response and recovery. Risk as used in this analysis:
1. Incorporates ecosystem services thinking into the process. Risk assessment goes beyond
merely focusing on built capital to include a consideration of social and natural capital; and
2. Considers the reduction of a community’s ability to adapt to a change and self-organize.
This change in emphasis can be illustrated through two very different approaches to
reducing risk. A traditional approach to risk reduction would include a coastal flood prone
community where all structures are built above the level of flooding. Here the community has
focused on protecting built capital. A different approach is where a community adopts the
necessary legal tools whereby the development rights of structures destroyed by flooding could
be transferred to high ground development sites. This second community might have secured an
acceptance for this approach by involving a wide range of community stakeholders. Resilience
in this case focuses on natural capital (high ground), social capital (networks) and their ability to
adapt to a changing coastline. Should sea level rise and storm severity increase, causing the
shoreline to retreat, our second community may be the more resilient especially if the
government and property owners in our first example were heavily indebted and had exhausted
their financial resources in paying the costs of elevation and had few reserves to rebuild.
13 Freitag, B., S. M. Bolton, F. Westerlund, and J. L. S. Clark. Floodplain Management: A New Approach for a New
Era. Washington, DC: Island Press, 2009.

8
2.2 Defining Resilience
Resilience is a concept with many different definitions and approaches. The Department of
Homeland Security (DHS) defines resilience within PPD-21 as, “the ability to prepare for and
adapt to changing conditions, and withstand and recover rapidly from disruptions.” 14 Some
examples of resilience measures DHS gives include: “developing a business continuity plan,
having a generator for back-up power, and using building materials that are more durable.” 15
This analysis goes beyond the DHS definition of resilience by ascribing to the resilience
science definition and approach, viewed within the context of the Panarchy model. The Panarchy
model is a concept from the science of ecology that explains the evolving nature of complex
adaptive systems. It is the hierarchical structure in which natural (i.e. forests, wetlands, lakes
etc.) and human systems (i.e. structures of governance, settlements, and cultures) are interlinked
in never-ending adaptive cycles of growth, accumulation, restructuring, and renewal (see
Appendix A for a more detailed explanation of Panarchy). 16
Resilience is defined within this analysis as the capacity of a community to absorb change
from an event and adapt so as to retain the ability to provide goods and services necessary for
human well-being (HWB). This means the ability of an individual or community to adapt or
transform in response to disturbances —rather than just “bouncing back,” undergoing
undesirable change, or collapsing. Important to this definition is that what is resilient to one may
14 DHS.gov Department of Homeland Security Official Website; “What Is Security and Resilience?”
http://www.dhs.gov/what-security-and-resilience. (accessed July 28, 2014). 15 Ibid. 16 Holling, C. S. “Understanding the Complexity of Economic, Ecological, and Social Systems.” Ecosystems 4, no. 5
(2001): 390–405. 392.

9
not be resilient to others. One’s resilience may actually depend on another’s collapse. Any
change may bring benefits to some, hardships to others.
“Self-organizing mechanisms in different systems allow them to absorb internal and
external disturbances, but if thresholds are exceeded, systems will be attracted to an alternative
state which may lead to undesirable conditions and reduced function.” 17 Reversing this change
may be very expensive or even impossible. 18
A system state is a set of variables that can “change and create either stabilizing feedbacks
that keep the system in a particular state (e.g., a clear lake) or amplifying feedbacks that push the
system toward a new configuration and system state (e.g., a murky lake).”19 Disturbances are
natural or man-made pressures that influence the ability of a system to continue its functions.
Forest fires, heavy rainfall, earthquakes, and economic bubbles are all examples of
disturbances.20
The concept of resilience shifts the focus from growth and efficiency to adaptation and
flexibility. The aim of community resilience is for the community to be able to adapt in order to
keep the system within a “state” that will continue to provide the goods and services necessary
for HWB. 21 This “state” is different for every community, because each community not only has
its own priorities and conditions, but also different assets that it depends upon for HWB and feels
17 Alberti, M. Russo, M and K. Tenneson. Snohomish Basin 2060 Scenarios: Adapting to an Uncertain Future:
Decision Support for Long Term Provision of Ecosystem Services in the Snohomish Basin, WA. Seattle, WA: Urban
Ecology Research Laboratory, University of Washington, 2013. 48. 18 Ibid. 48. 19 Resilience Alliance. Assessing Resilience in Social-Ecological Systems: Workbook for Practitioners. Version 2.0.
Resilience Alliance, 2010. 6. 20 Alberti, M. Russo, M and K. Tenneson. Snohomish Basin 2060 Scenarios: Adapting to an Uncertain Future:
Decision Support for Long Term Provision of Ecosystem Services in the Snohomish Basin, WA. Seattle, WA: Urban
Ecology Research Laboratory, University of Washington, 2013. 48. 21 Ibid. 48.
10
are important. An example is Neah Bay, WA. The Makah Tribe’s community identity is so
closely connected with its place at Neah Bay that the community cannot consider adaptive
strategies for resilience that other communities (e.g. Redmond, WA) might be able to consider,
such as relocating to a different area post-disaster. The Makah community also depends heavily
upon natural capital (e.g. fishing and timber). Whereas, the Redmond community is not as tied to
its location and it depends heavily upon flexible social capital (e.g. its work force and
businesses). This means much of the Redmond community could consider relocating. 22
Resilience theory leans on certain assumptions: 23
Change is natural and an essential element of systems. When we try to reduce or
eliminate change we actually reduce the systems’ resilience (ability to withstand
disturbances).
Diversity is essential for resilience due to providing opportunities for adaptation to
change. No strategy or condition is ever ‘optimal.’
Uncertainty: “While we may be able to reduce the uncertainty around future events and
conditions of complex systems by expanding empirical studies and improving predictive
models, we will never have complete knowledge. We therefore need approaches to
decision making that are effective across multiple future conditions (i.e. robust strategies)
and that improve our adaptive capacity and opportunities for self-organization.” 24
Systems are linked culturally, politically, socially, economically, ecologically, and
technologically.
There are three related dimensions to resilience: specified resilience, general resilience,
and transformability.
Working with resilience involves both adapting and transforming. 25
22 Institute for Hazards Mitigation Planning and Research, University of Washington. Whole Community Resilience:
An Asset-Based Approach to Enhancing Adaptive Capacity Before a Disruption - Final Report. Federal Emergency
Management Agency, 2014. 36. 23 Alberti, M. Russo, M and K. Tenneson. Snohomish Basin 2060 Scenarios: Adapting to an Uncertain Future:
Decision Support for Long Term Provision of Ecosystem Services in the Snohomish Basin, WA. Seattle, WA: Urban
Ecology Research Laboratory, University of Washington, 2013. 48. 24 Ibid. 49. 25 Walker, Brian H., and David Salt. Resilience Practice: Building Capacity to Absorb Disturbance and Maintain
Function. Washington, DC: Island Press, 2012. 68.
11
Resilience as a process addresses: 26
1. Specified resilience – the capacity to absorb a particular kind of change.
2. General resilience – the capacity to absorb changes of all kinds, including novel,
unforeseen ones.
3. Transformability – the capacity to create a fundamentally new system when conditions
make the existing system untenable.
Resilience science identifies five factors that define resilience:
1. Remembering – this occurs when the potential accumulated and stored in the larger, slow
levels, influence reorganization. A fire burns a forest but seed stocks remain allowing for
the forest to regenerate.
2. Revolt – this occurs when fast, small events overwhelm recovery, which can be positive
or negative. We have destroyed countless forests in order to build houses and plant
orchards. Our resiliency depended on the lack of resiliency of a forest. Or for example, a
burnt forest attempting to reestablish itself may be overtaken by more resilient
competitors such as Scotch Broom or Himalayan Blackberry, preventing the
establishment of the pre-change ecology.
3. Feedbacks – can amplify change in a system or have a stabilizing effect. Resilient
communities have self-organizing feedback mechanisms. Think sunlight reflecting off of
white snow minimizing warming and melting, thus generating a stabilizing feedback on
the snowpack, or dirty snow absorbing the heat from sunlight, leading to further melting,
thus causing an amplifying feedback effect on the snowpack.27 Or for example, a flood
damages a home in Snoqualmie, Washington. Most homes are elevated and the owner
sees a lifestyle and market advantage of elevating the home above future flood levels
even without the incentives of the National Flood Insurance Program. However, along the
east coast of a New Jersey barrier island, using limited resources to elevate your home
may create a destructive feedback if the grounds wash away from under your home and
you have exhausted your financial resources.
4. Threshold / Tipping Point – a point at which a relatively small change in external
conditions causes a rapid change. Change is seldom linear. A one-degree change in
temperature can melt a protective ice shelf, removing a vital buffer for an Alaskan
community.
26 Walker, Brian H., and David Salt. Resilience Practice: Building Capacity to Absorb Disturbance and Maintain
Function. Washington, DC: Island Press, 2012. 68-101. 27 Resilience Alliance. Assessing Resilience in Social-Ecological Systems: Workbook for Practitioners. Version 2.0.
Resilience Alliance, 2010. 6.
12
5. Transformability – the capacity to create a fundamentally new system when conditions
make the existing system untenable – where organizations are capable of exploiting new
opportunities. We pretty much destroyed the economies of Japan and Germany during
WWII. That was one of our war objectives, but in the process we destroyed old built
capital including antiquated machinery and helped modernize both countries’ industrial
sectors.
Another approach to resilience thinking is City Resilience (for more details see Appendix B),
which includes the following: 28
Robustness: strength, or the ability of elements, systems, and other units of analysis to
withstand a given level of stress or demand without suffering degradation or loss of
function;
Redundancy: the extent to which elements, systems, or other units of analysis exist that
are substitutable, i.e., capable of satisfying functional requirements in the event of
disruption, degradation, or loss of functionality;
Resourcefulness: the capacity to identify problems, establish priorities, and mobilize
resources when conditions exist that threaten to disrupt some element, system, or other
unit of analysis.
Rapidity: the capacity to meet priorities and achieve goals in a timely manner.
“Communities can be viewed as a set of interrelated systems that share a
common vision and the overall resilience of communities may be viewed in
much the same way as the overall health of the human body. Communities
depend on a number of interrelated systems for [human well-being]. The
relative ‘health’ of community systems will determine how well a community
can withstand disruptive events. If a community has weakened infrastructure,
like a human body with a compromised immune system, it will not withstand
trauma as well as one in good health. [Also,] investment in community
resilience before a disaster occurs may help a community reduce or avoid
monumental recovery and restoration costs after the event has taken
place.”29
28 Bruneau, Michel, and Andrei Reinhorn. “Exploring the Concept of Seismic Resilience for Acute Care Facilities.”
Earthquake Spectra 23, no.1 (2007): 41-62. 3. 29 Resilience Alliance. Assessing Resilience in Social-Ecological Systems: Workbook for Practitioners. Version 2.0.
Resilience Alliance, 2010. 15.
13
On a final note, just as no strategy or condition is ever ‘optimal’, resilience is not a task or
process that can be considered “completed.” There is no perfect end state or condition.
Therefore, building community resilience means (in the traditional emergency management
definition), “building strong communities that contain adequate essential public and private
services including schools, transportation, health care, utilities, roads and bridges, public safety
and businesses” 30 -- or, in the definition used in this project, resilience is building the capacity of
a community to absorb change (disturbances) and reorganize so as to retain essentially the same
state (function, structure, identity, and feedbacks) that will continue to deliver desired goods and
services for HWB.
2.3 Risk Assessment
A key component of managing risk is to understand it and therefore determine what levels
of risk are acceptable. To do this, risk must be assessed. According to UNISDR, risk assessment
is, “A methodology to determine the nature and extent of risk by analyzing potential hazards
[threats] and evaluating existing conditions of vulnerability that together could potentially harm
exposed people, property, services, livelihoods and the environment on which they depend.” 31
This includes weighing the costs and benefits of mitigating and reducing risk. By considering
these elements and going through this process, communities can better understand how to best
manage and plan for their risk.
30 Resilience Alliance. Assessing Resilience in Social-Ecological Systems: Workbook for Practitioners. Version 2.0.
Resilience Alliance, 2010. 15. 31 UNISDR The United Nations Office for Disaster Risk Reduction Website; “Terminology.”
http://www.unisdr.org/we/inform/terminology. (accessed July 28, 2014).

14
The Department of Homeland Security defines the following terms: 32
Threat – natural or manmade occurrence, individual, entity, or action that has or indicates
the potential to harm life, information, operations, the environment, and/or property.
Vulnerability – physical feature or operational attribute that renders an entity open to
exploitation or susceptible to a given hazard.
Consequence – effect of an event, incident, or occurrence.
Figure 1. Standard Risk Assessment Process 33
A common way of assessing and therefore prioritizing risk is shown in Figure 1. First,
identify the threats (hazards). Second, conduct an inventory of assets that are deemed important.
Third, conduct a vulnerability analysis to figure out which assets are vulnerable to the threats
(hazards) previously identified. Fourth, do an impact analysis to understand consequences. The
32 Department of Homeland Security. National Infrastructure Protection Plan. Department of Homeland Security,
2013. 17. 33 Ready.gov FEMA Ready Campaign Website; “Risk Assessment.” http://www.ready.gov/risk-assessment.
(accessed July 28, 2014).
15
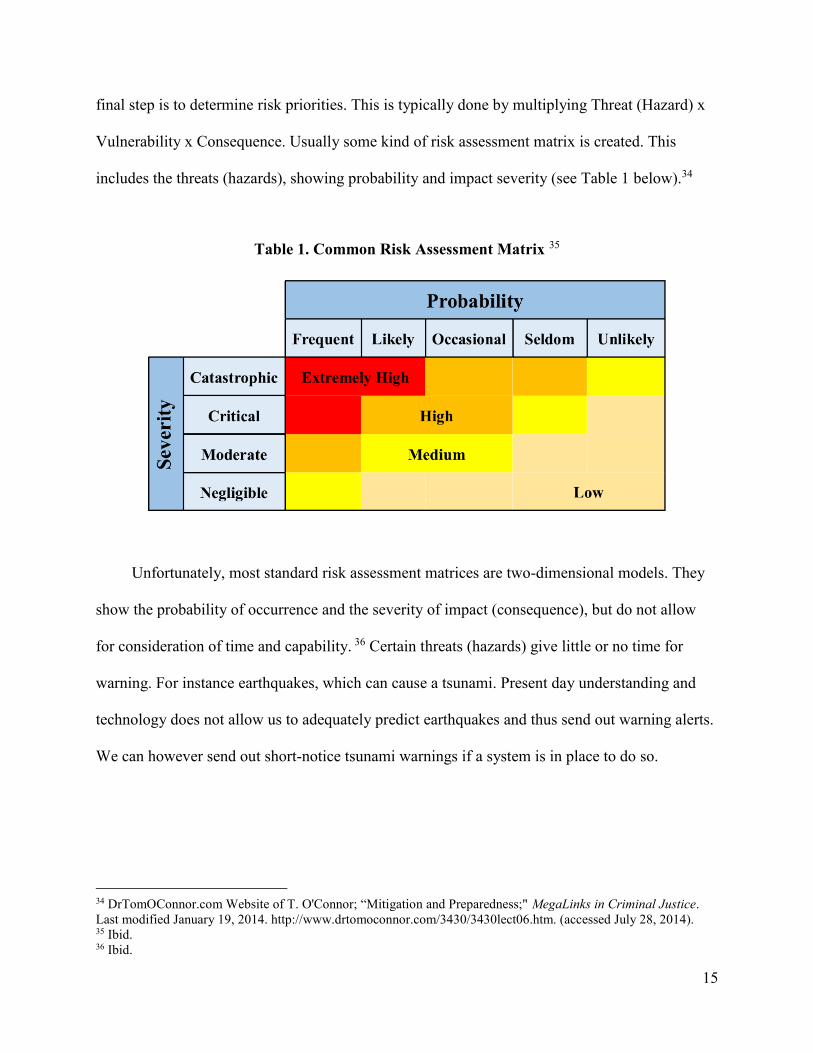
final step is to determine risk priorities. This is typically done by multiplying Threat (Hazard) x
Vulnerability x Consequence. Usually some kind of risk assessment matrix is created. This
includes the threats (hazards), showing probability and impact severity (see Table 1 below).34
Table 1. Common Risk Assessment Matrix 35
Unfortunately, most standard risk assessment matrices are two-dimensional models. They
show the probability of occurrence and the severity of impact (consequence), but do not allow
for consideration of time and capability. 36 Certain threats (hazards) give little or no time for
warning. For instance earthquakes, which can cause a tsunami. Present day understanding and
technology does not allow us to adequately predict earthquakes and thus send out warning alerts.
We can however send out short-notice tsunami warnings if a system is in place to do so.
34 DrTomOConnor.com Website of T. O'Connor; “Mitigation and Preparedness;" MegaLinks in Criminal Justice.
Last modified January 19, 2014. http://www.drtomoconnor.com/3430/3430lect06.htm. (accessed July 28, 2014). 35 Ibid. 36 Ibid.
16
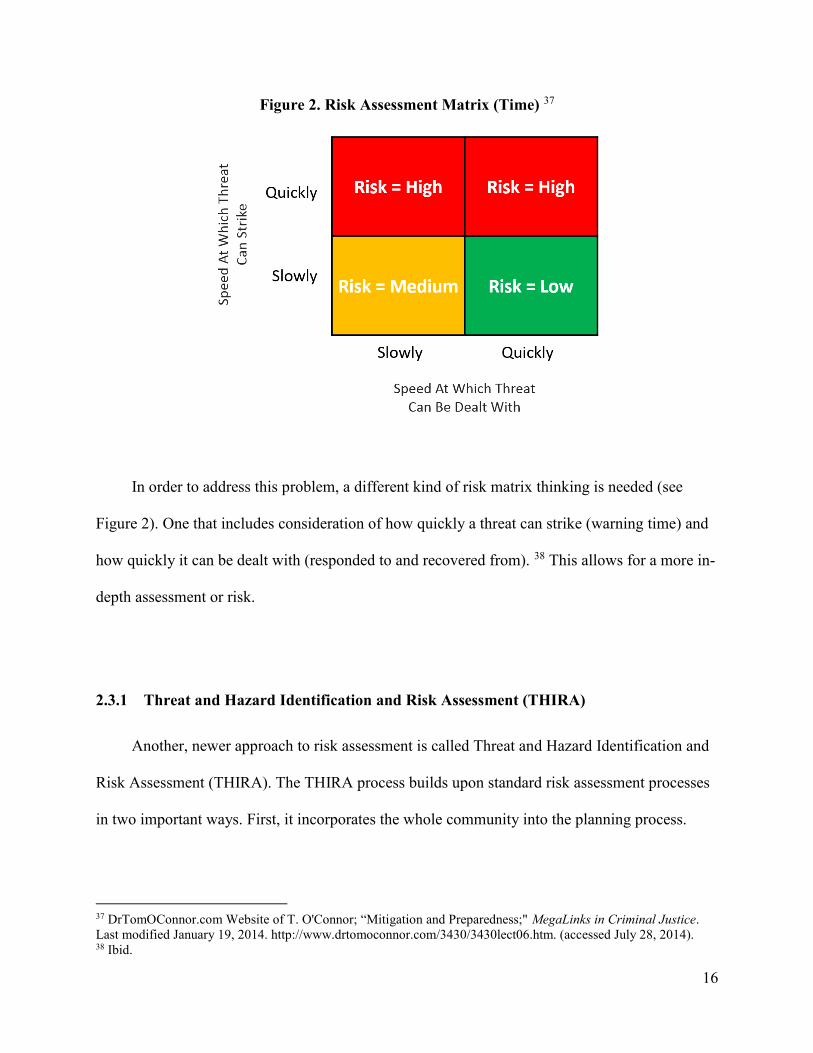
Figure 2. Risk Assessment Matrix (Time) 37
In order to address this problem, a different kind of risk matrix thinking is needed (see
Figure 2). One that includes consideration of how quickly a threat can strike (warning time) and
how quickly it can be dealt with (responded to and recovered from). 38 This allows for a more in-
depth assessment or risk.
2.3.1 Threat and Hazard Identification and Risk Assessment (THIRA)
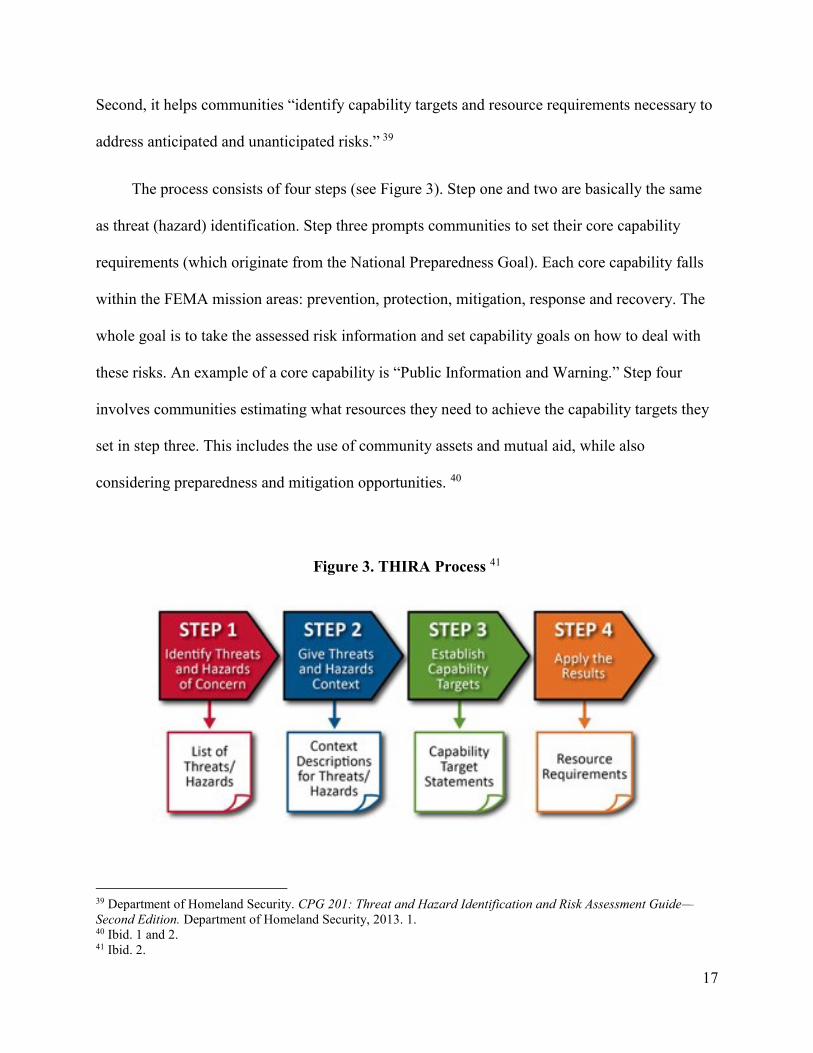
Another, newer approach to risk assessment is called Threat and Hazard Identification and
Risk Assessment (THIRA). The THIRA process builds upon standard risk assessment processes
in two important ways. First, it incorporates the whole community into the planning process.
37 DrTomOConnor.com Website of T. O'Connor; “Mitigation and Preparedness;" MegaLinks in Criminal Justice.
Last modified January 19, 2014. http://www.drtomoconnor.com/3430/3430lect06.htm. (accessed July 28, 2014). 38 Ibid.
17
Second, it helps communities “identify capability targets and resource requirements necessary to
address anticipated and unanticipated risks.” 39
The process consists of four steps (see Figure 3). Step one and two are basically the same
as threat (hazard) identification. Step three prompts communities to set their core capability
requirements (which originate from the National Preparedness Goal). Each core capability falls
within the FEMA mission areas: prevention, protection, mitigation, response and recovery. The
whole goal is to take the assessed risk information and set capability goals on how to deal with
these risks. An example of a core capability is “Public Information and Warning.” Step four
involves communities estimating what resources they need to achieve the capability targets they
set in step three. This includes the use of community assets and mutual aid, while also
considering preparedness and mitigation opportunities. 40
Figure 3. THIRA Process 41
39 Department of Homeland Security. CPG 201: Threat and Hazard Identification and Risk Assessment Guide—
Second Edition. Department of Homeland Security, 2013. 1. 40 Ibid. 1 and 2. 41 Ibid. 2.
18
2.3.2 Risk and Resilience
Approaches to resilience require preparing for the unexpected, whereas risk assessment
typically proceeds from the premise that hazards are identifiable and predictable. Current risk
based approaches are unsatisfactory, even with known hazards. They emphasize risk
probabilities that may be unknowable. Community systems exist within dynamic and
unpredictable environments and estimates of risk probabilities are notoriously unreliable. Take
for example, the estimating of the joint probability and synergy of two or more major events
happening at the same time or back to back. Or look at cascading failures.42
As such, it is inadequate and not helpful to think of community resilience as achieving
some static state of being. It should be approached as an ongoing adaptive process -- not
something that a system achieves or has, but a characteristic of the way it behaves. Ecological
systems when restored do not revert back to their original states like a rubber band returning to
its original shape after being stretched and neither do community systems after an event.
Conditions always change, even when we don’t realize it. 43
Engineering approaches to infrastructure resilience “often represent incremental
adaptations of what has historically been understood as risk [assessment].” 44 Table 2 shows a
comparison between risk management and resilience in regard to engineered systems.
42 Park, J., T. P. Seager, P. S. C. Rao, M. Convertino, and I. Linkov. “Integrating Risk and Resilience Approaches to
Catastrophe Management in Engineering Systems.” Risk Analysis 33, no. 3 (2013): 356–367. 359. 43 Ibid. 359. 44 Ibid. 359 and 360.
19
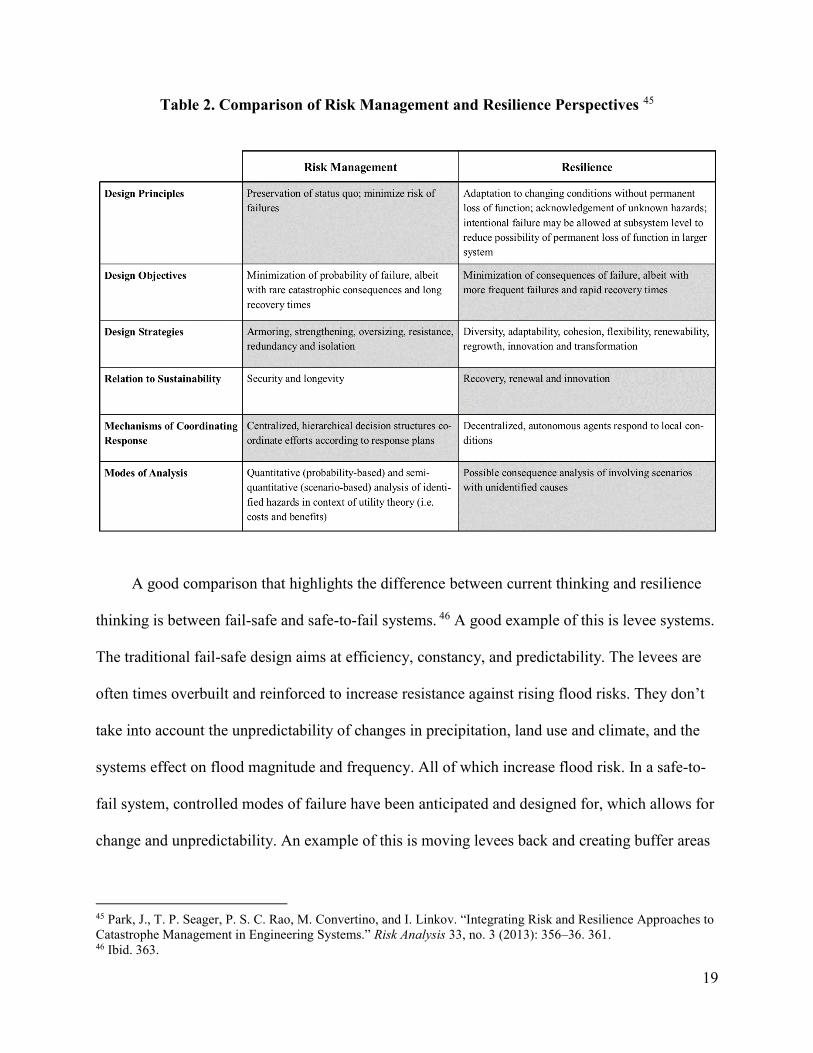
Table 2. Comparison of Risk Management and Resilience Perspectives 45
A good comparison that highlights the difference between current thinking and resilience
thinking is between fail-safe and safe-to-fail systems. 46 A good example of this is levee systems.
The traditional fail-safe design aims at efficiency, constancy, and predictability. The levees are
often times overbuilt and reinforced to increase resistance against rising flood risks. They don’t
take into account the unpredictability of changes in precipitation, land use and climate, and the
systems effect on flood magnitude and frequency. All of which increase flood risk. In a safe-to-
fail system, controlled modes of failure have been anticipated and designed for, which allows for
change and unpredictability. An example of this is moving levees back and creating buffer areas
45 Park, J., T. P. Seager, P. S. C. Rao, M. Convertino, and I. Linkov. “Integrating Risk and Resilience Approaches to
Catastrophe Management in Engineering Systems.” Risk Analysis 33, no. 3 (2013): 356–36. 361. 46 Ibid. 363.

20
that are designed to be flooded when waters rise above the levees. This can mean the difference
between a minor event and a catastrophic one. So, paradoxically, the traditional levee systems
that were intended to reduce the risk from flooding, have actually increased these risks, while at
the same time giving a sense of false security. This shows the value of integrating resilience
thinking, which can help a complex engineered system better persist even when risk estimation is
unreliable. 47
Because complex systems are interdependent, adverse impacts from one system failing
often times spills into other systems. This means that community systems should take into
account not only unexpected direct risks, but also unexpected consequences that could cascade
through other connected systems. Thus it is vital that an adequate representation of stakeholders
be included in the risk assessment process.48
In order to assess risk we must understand what people value. Typically, when conducting
risk assessment, the mapping of what is considered valuable and important to the broader
community is not explicitly stated and debated amongst the majority of stakeholders. Instead
there is an assumption that all stakeholders implicitly agree on community assets that are
vulnerable. Stakeholders however often have different opinions on what is important, which
often results in the pursuit of irreconcilable goals.49
A study using focus groups was done in South Africa, investigating if it is possible for a
wide range of community stakeholders to construct a common holistic description of what is
47 Park, J., T. P. Seager, P. S. C. Rao, M. Convertino, and I. Linkov. “Integrating Risk and Resilience Approaches to
Catastrophe Management in Engineering Systems.” Risk Analysis 33, no. 3 (2013): 356–36. 363. 48 Ibid. 365. 49 Becker, Per and Henrik Tehler. “Constructing a Common Holistic Description of What is Valuable and Important
to Protect: A Possible Requisite for Disaster Risk Management.” International Journal of Disaster Risk Reduction 6
(2013): 18–27. 19 and 20.
21
valuable and important to protect. The study results showed that this approach can establish
common objectives for disaster risk assessment and increase engagement of stakeholders that
otherwise wouldn’t be part of this process. Thus showing that this process is a vital step towards
a more resilient society.
The questions asked were as follows: 50
What is valuable and important to protect?
Why is it valuable?
Which other elements are (or might be) valuable in securing/replacing that valuable
element?
The main elements turned out to be human life, health and well-being. As a result they
came up with “a complex system of critical functions, flows and infrastructure supplying the
basic necessities to secure human life, health and wellbeing, i.e. water, food, shelter, sanitation,
health care, education and livelihood.” 51 Consequently, risk assessment could be used to gather a
quality of life baseline before an event and compare it post-event. This process could be used to
measure community resilience by looking at pre-event service capacity compared to post-event.52
In order to become more resilient, communities must consciously define the quality of life
(human well-being) they want. This can only be achieved through full participation of
50 Becker, Per and Henrik Tehler. “Constructing a Common Holistic Description of What is Valuable and Important
to Protect: A Possible Requisite for Disaster Risk Management.” International Journal of Disaster Risk Reduction 6
(2013): 18–27. 21. 51 Ibid. 26. 52 Bruneau, Michel, and Andrei Reinhorn. “Exploring the Concept of Seismic Resilience for Acute Care Facilities.”
Earthquake Spectra 23, no.1 (2007): 41-62. 4.

22
community stakeholders. The participatory process itself is often times as important as the
outcome. 53
2.4 Human Well-Being
There are many definitions of HWB (quality of life). HWB is experiential, what people
value being and doing. Most would agree though that it includes the following: basic material
needs for a good life; health; personal security; good social relations; and the experience of
freedom. These five components together, provide the conditions for physical, social,
psychological, and spiritual fulfillment.54
One definition of a good quality of life includes, among other factors, “access to income,
education, health care, housing, employment, legal rights and exposure to crime, pollution,
disease, disaster and other risks.” 55 And, according to the Rockefeller City Resilience
Framework, a healthy and resilient community includes the following aspects, “good health;
knowledge and education; reliable services and robust infrastructure; diverse livelihood
opportunities; healthy ecosystems; the ability to organize and make decisions; and access to
external assistance.” 56
For the purposes of this analysis, the Millennium Ecosystem Services typology and
definitions for HWB will be used.
53 Mileti, Dennis S. Disasters by Design: A Reassessment of Natural Hazards in the United States. Washington DC:
Joseph Henry Press, 1999. 5-6. 54 Millennium Ecosystem Assessment. Ecosystems and Human Well-Being: A Framework for Assessment.
Washington, DC: Island Press, 2003. 73-4. 55 Mileti, Dennis S. Disasters by Design: A Reassessment of Natural Hazards in the United States. Washington DC:
Joseph Henry Press, 1999. 5-6. 56 Arup. City Resilience Framework: Resilience Index. The Rockefeller Foundation, 2014.
23
1. Basic Material for a Good Life – secure and adequate livelihoods, income and assets,
enough food and water at all times, furniture, clothing, and access to goods
a. Access (availability and security) to resources to sustain livelihood – Indicators
i. Basic sustenance: water, food, clothes, sanitation, electricity, fuel/gas
stations, roads/bridges, private/public transportation systems, grocery
stores/farmers’ markets, credit, shops; schools, colleges, daycares;
play/sports areas; cell-phone, internet etc.
ii. Employment: sufficient income, stable employment (employed greater
than 6 months), sufficient employed persons (working more than35 hours
per week)
2. Health – access to medical care, feeling well, and having a healthy physical environment
a. Special needs population – Indicators
i. Elderly and children; Linguistic communities; Infirmed; Living alone;
Food and Nutrition (FNS) and Medicaid recipients
b. Healthy environment – Indicators
i. Mobility; Hospitals, pharmacies, clinics etc.; Nutrition – Indicators
(obesity); Expected longevity at birth; Disability-adjusted life years; and
Exposure to toxins – exceedance of guideline limits
3. Security – secure access to natural and other resources, safety of person and possessions,
shelter, and living in a predictable and controllable environment with security from
natural and human-made disasters
a. Shelter – Indicators
i. Shelter (number of homeless, occupancy of permanent shelters, vacancy
rate); and People in adequate housing
b. Exposure to risk (floods, drought, winter storms) – Indicators
i. Risk of death, injury, or property loss through natural hazards; and Hazard
mitigation planning
c. Crime – Indicators
i. Police and fire stations; and Violent crime rate
24
4. Good Social Relations – social cohesion, mutual respect, good gender and family
relations, and the ability to help others and provide for children
a. Ability to communally solve problems – Indicators
i. Residents serving on municipal boards and committees; and Community
Emergency Response Teams (CERT)
b. Sense of belonging – Indicators
i. Registered neighborhood organizations – map your neighborhood;
Community gathering places – community centers; and Community faith-
based organizations
5. Freedoms and Choice – having control over what happens and being able to achieve what
a person values doing or being
a. Participation in decision making – Indicators
i. Level of education; Gender/racial/ethnic/sexual orientation bias; Level of
corruption; Fairness of elections; and Registered voters
Figure 4. Human Ill-being vs. Well-being 57
57 Millennium Ecosystem Assessment. Ecosystems and Human Well-Being: A Framework for Assessment.
Washington, DC: Island Press, 2003. 75.
25
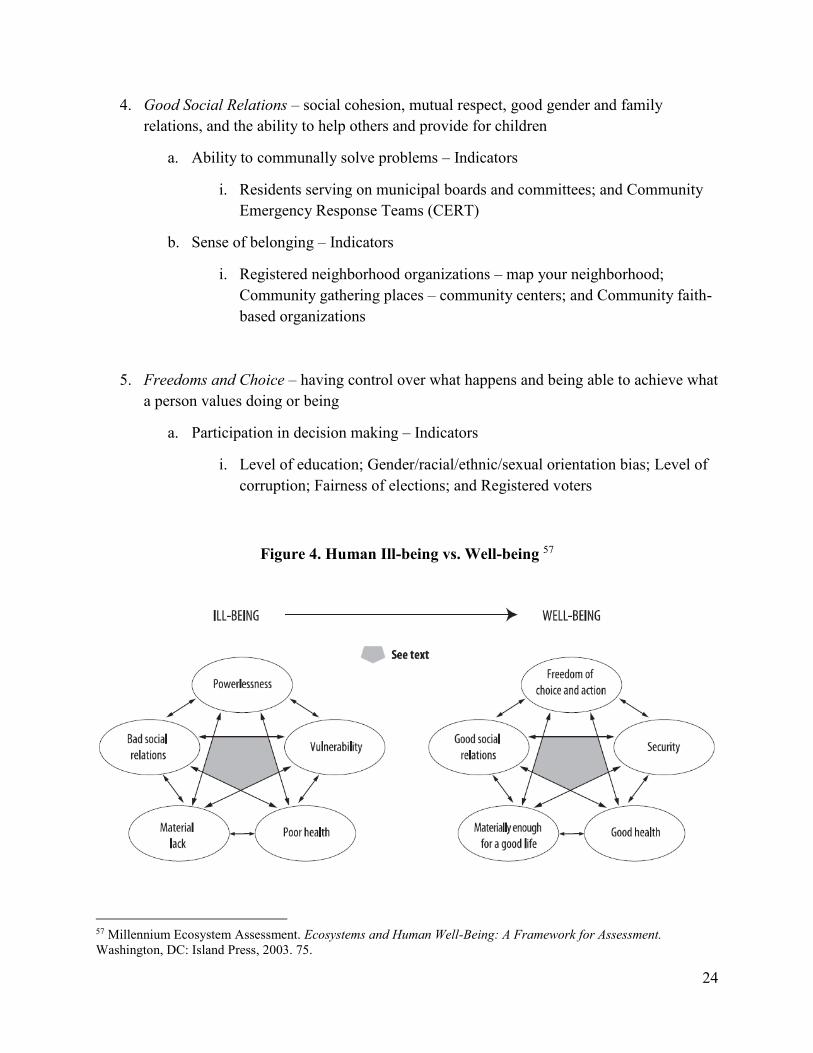
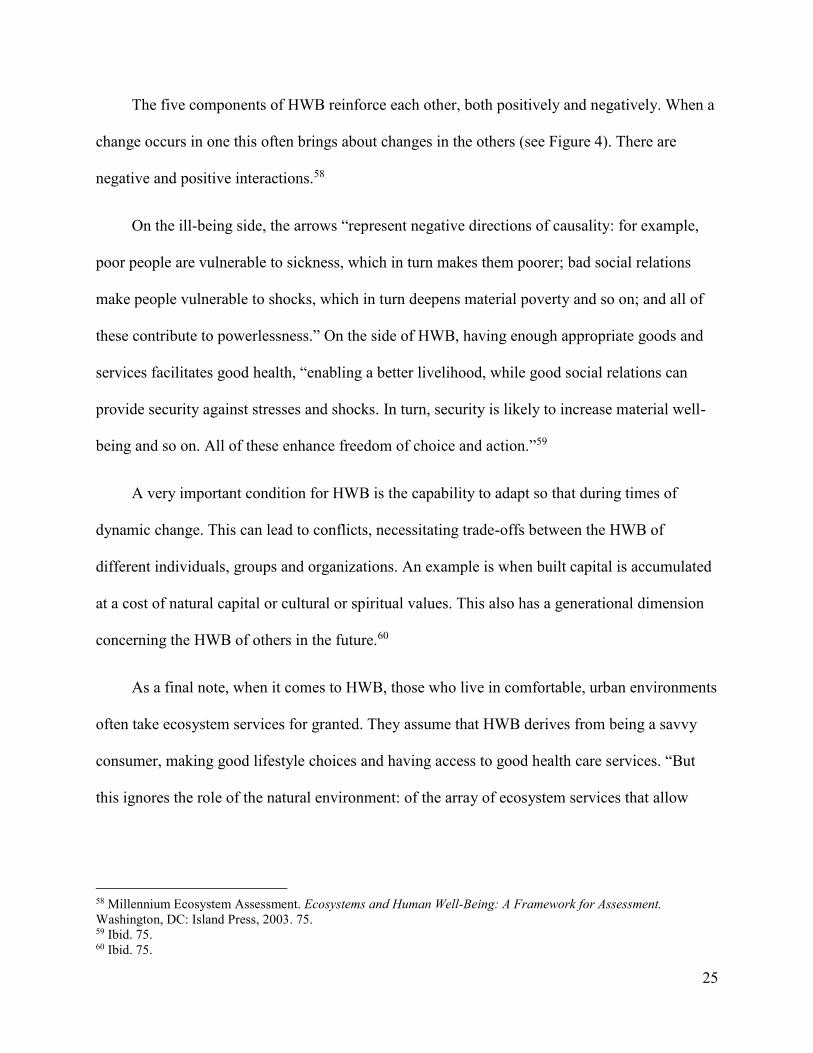
The five components of HWB reinforce each other, both positively and negatively. When a
change occurs in one this often brings about changes in the others (see Figure 4). There are
negative and positive interactions.58
On the ill-being side, the arrows “represent negative directions of causality: for example,
poor people are vulnerable to sickness, which in turn makes them poorer; bad social relations
make people vulnerable to shocks, which in turn deepens material poverty and so on; and all of
these contribute to powerlessness.” On the side of HWB, having enough appropriate goods and
services facilitates good health, “enabling a better livelihood, while good social relations can
provide security against stresses and shocks. In turn, security is likely to increase material well-
being and so on. All of these enhance freedom of choice and action.”59
A very important condition for HWB is the capability to adapt so that during times of
dynamic change. This can lead to conflicts, necessitating trade-offs between the HWB of
different individuals, groups and organizations. An example is when built capital is accumulated
at a cost of natural capital or cultural or spiritual values. This also has a generational dimension
concerning the HWB of others in the future.60
As a final note, when it comes to HWB, those who live in comfortable, urban environments
often take ecosystem services for granted. They assume that HWB derives from being a savvy
consumer, making good lifestyle choices and having access to good health care services. “But
this ignores the role of the natural environment: of the array of ecosystem services that allow
58 Millennium Ecosystem Assessment. Ecosystems and Human Well-Being: A Framework for Assessment.
Washington, DC: Island Press, 2003. 75. 59 Ibid. 75. 60 Ibid. 75.
26
people to enjoy good health, social organization, economic activity, a built environment and life
itself.” 61
2.5 Goods and Services
Goods and services are products of human efforts and natural systems. We use them to
sustain and enhance our human well-being. Goods are items you can see and touch, such as:
water, food, clothing, medicine, tools, your house, fuel etc. Services are provided by people,
entities or nature, such as: water filtration, photosynthesis, electricity, public transportation, law
and order, city planning, daycare etc. These are not discrete categories. Think of them as a
continuum with pure service on the one end and pure goods on the other. Most goods and
services fall between these two extremes. For example, although some utilities actually deliver
physical goods and services; like water utilities which deliver and often treat water — utilities
are usually considered services.
One type of services we want to focus on especially is ecosystem services. These are some
of the benefits that people obtain from natural capital. An ecosystem is a complex system of
plants, animals and micro-organism communities – and usually people – and the nonliving
environment interacting as a functional unit.62 Ecosystems are the planet's life-support systems
61 World Health Organization. Ecosystems and Human Well-Being: Health Synthesis. World Health Organization,
2005. 12. 62 Ash, Neville et al, eds. Ecosystems and Human Well-being: A Manual for Assessment Practitioners. Washington,
DC: Island Press, 2010. xi.
27
for all forms of life, including humans. Our needs for food, water, clean air, shelter and relative
climatic constancy etc. are fundamental and unalterable and thus indispensable to HWB.63
Ecosystem services include the following:
Provisioning services, such as providing food, water, timber and fiber;
Regulating services, such as the regulation of climate, floods, disease, wastes and water
quality;
Cultural services, such as offering recreational, aesthetic, and spiritual benefits; and
Supporting services, such as soil formation, photosynthesis, and nutrient cycling.64
2.6 Capital
Communities rely on goods and services provided by built, natural, and human and social
capital in differing degrees and at different times. Capital typologies differ. Traditionally,
economists define capital as any non-financial asset that is used to produce goods and services.
Ecological economists and accounting regimes, such as the triple bottom line, have broadened
the definition to include natural and human-social capital.65 Some find value in isolating
intellectual capital or financial capital, as well as their interrelation and valuation, however there
appears to be a general consensus with the following classification: 66, 67
63 World Health Organization. Ecosystems and Human Well-Being: Health Synthesis. World Health Organization,
2005. 12. 64 Ash, Neville et al, eds. Ecosystems and Human Well-being: A Manual for Assessment Practitioners. Washington,
DC: Island Press, 2010. xi. 65 Daly, Herman E, and Joshua Farley. Ecological Economics: Principles and Applications. Washington, DC: Island
Press, 2011. 17. 66 Green, G. P., and A. Haines. Asset Building & Community Development (3rd ed.). Thousand Oaks, CA: Sage,
2012. 67 Stokols, D., R. P. Lejano, and J. Hipp. “Enhancing the Resilience of Human-Environment Systems: a Social
Ecological Perspective.” Ecology and Society 18, no.1 (2013): Article 7.
28
1. Built Capital: Things built by humans. Examples include bridges, buildings, dams and
machinery.
2. Natural Capital: Natural capital typically refers to stock that yields a flow of natural
services and tangible natural resources. Examples include forests, wetlands, mangroves,
soil, sand dunes, agriculture and fossil fuels. The Millennium Ecosystems Assessment
includes cultural services as natural capital.
3. Human Capital and Social Capital: These are often combined. Human capital refers to
abilities of individuals. Social capital as abilities of groups of individuals. This includes
networks of human relationships, mutual trust and skills.
The goods and services provided for by one capital are often interchangeable with other
capital. If un-secured furniture falls during an earthquake, you drop, cover and hold, preferably
under a secure object. In other words, if the built capital you depend on is vulnerable (unsecured
furniture), you rely on human and social capital (your ability to know what to do and being
physically able to drop, cover and hold). If you are unable to learn or are physically handicapped,
you are more dependent on your surrounding environment -- If you are an Olympic athlete, less
so.
Communities are not unlike the above example. Communities rely on services provided by
built, natural, and human and social capital in differing degrees and at different times. Resilient
communities exploit their advantages in adapting to extreme events.
The asset-based appreciative inquiry risk assessment approach captures and makes use of a
community’s unique abilities to adapt to dramatic changes including earthquakes, floods and
climate change. While most communities would rely on all three types of capital to varying
degree, some may rely more on a strong built environment. Others may rely on their
29
community’s ability to mobilize and organize their citizenry to share assets, while others might
rely on their natural resources.
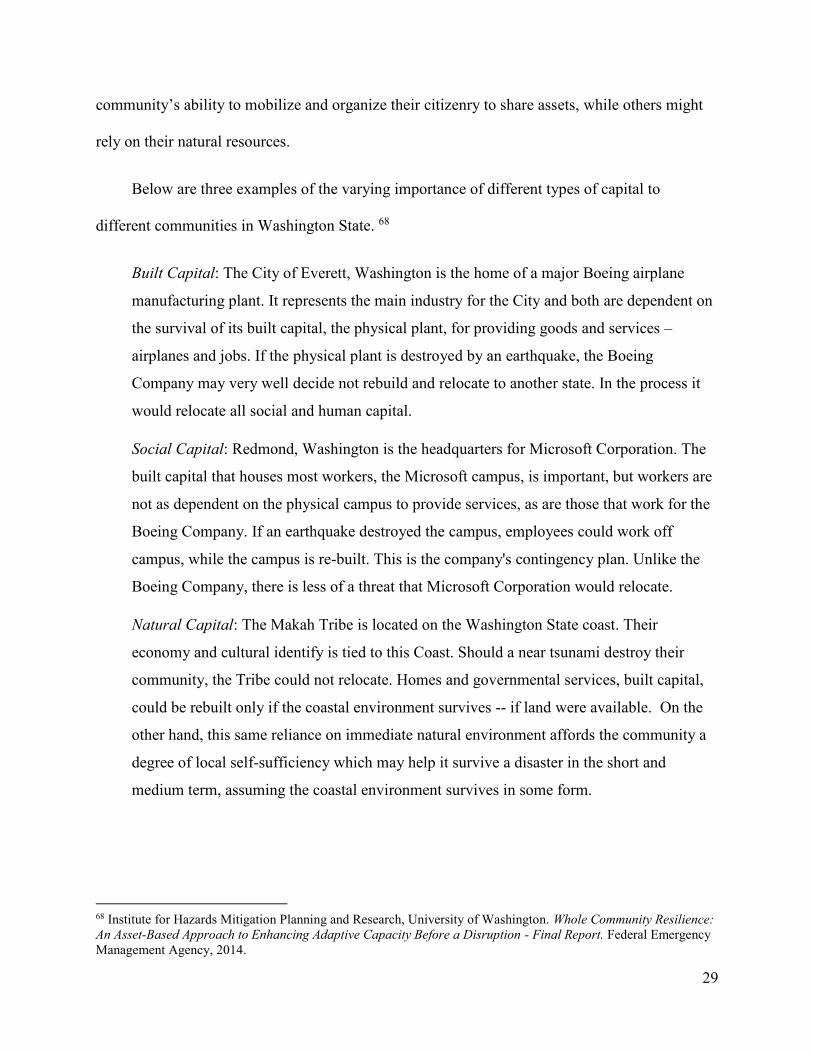
Below are three examples of the varying importance of different types of capital to
different communities in Washington State. 68
Built Capital: The City of Everett, Washington is the home of a major Boeing airplane
manufacturing plant. It represents the main industry for the City and both are dependent on
the survival of its built capital, the physical plant, for providing goods and services –
airplanes and jobs. If the physical plant is destroyed by an earthquake, the Boeing
Company may very well decide not rebuild and relocate to another state. In the process it
would relocate all social and human capital.
Social Capital: Redmond, Washington is the headquarters for Microsoft Corporation. The
built capital that houses most workers, the Microsoft campus, is important, but workers are
not as dependent on the physical campus to provide services, as are those that work for the
Boeing Company. If an earthquake destroyed the campus, employees could work off
campus, while the campus is re-built. This is the company's contingency plan. Unlike the
Boeing Company, there is less of a threat that Microsoft Corporation would relocate.
Natural Capital: The Makah Tribe is located on the Washington State coast. Their
economy and cultural identify is tied to this Coast. Should a near tsunami destroy their
community, the Tribe could not relocate. Homes and governmental services, built capital,
could be rebuilt only if the coastal environment survives -- if land were available. On the
other hand, this same reliance on immediate natural environment affords the community a
degree of local self-sufficiency which may help it survive a disaster in the short and
medium term, assuming the coastal environment survives in some form.
68 Institute for Hazards Mitigation Planning and Research, University of Washington. Whole Community Resilience:
An Asset-Based Approach to Enhancing Adaptive Capacity Before a Disruption - Final Report. Federal Emergency
Management Agency, 2014.

30
2.7 Asset-Based Risk Assessment
“If you are looking for a way to begin work towards organizing local people to
take an active role in the place where they live, it is a good idea to start with
what you know. If you don’t know the place where you live, how will you know
how to take advantage of all there is to offer? How will you know how to build
a strong, active community without the foundation of assets that are already
right there?” 69
“An important beginning point involves mapping the assets of the community — the skills
and talents of local residents, as well as the capabilities available or possible through local
organizations and institutions.”70 ”It shows all the interconnections among assets; these
interconnections reveal ways to access the assets. How you get to the assets and use them, and
the people involved in the getting and using, all these are also assets. Assets—the relations
among them and access to use them—these are the grounds on which communities are built.” 71
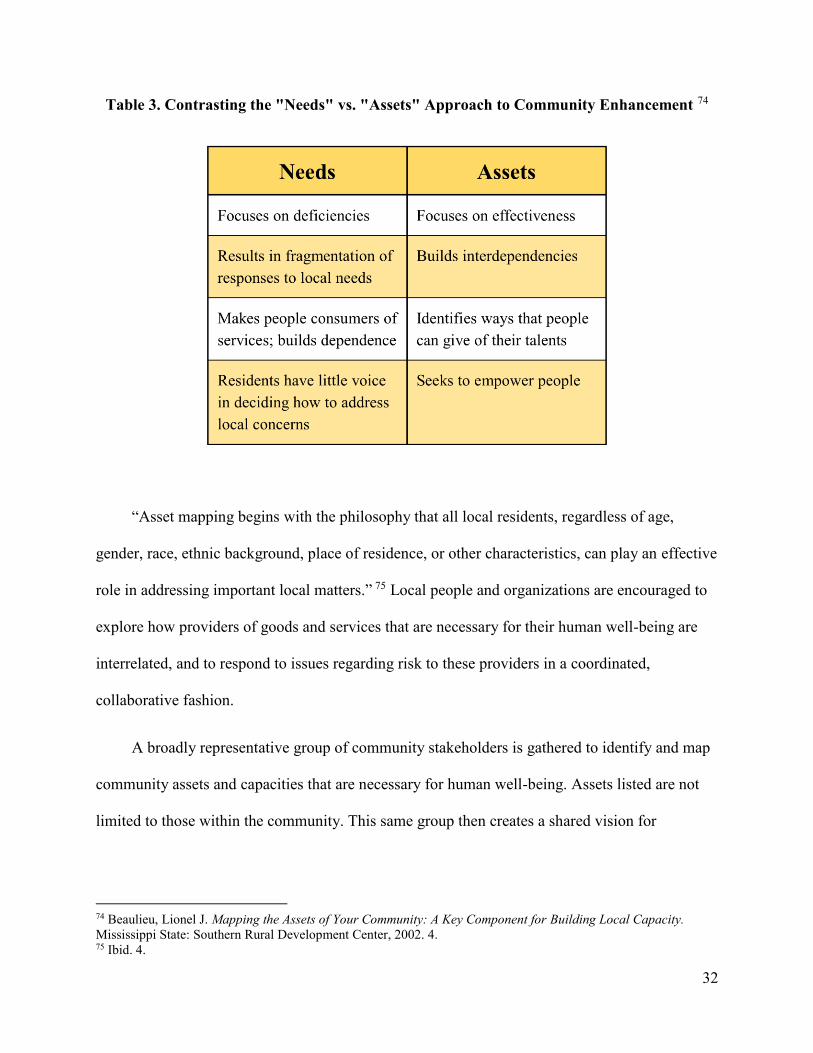
An asset-based approach is very different from the commonly used needs-based or
vulnerability-based approach to community development or risk assessment. It identifies the
community’s positive aspects and looks at ways to empower the community. Community assets
are identified by stakeholders within the community. This includes resources (capital) that would
otherwise be ignored, unrealized or dismissed, such as social and natural capital. This glass is
half-full approach does not deny the real problems or vulnerabilities, it simply focuses efforts on
69 Dorfman, Diane. Mapping Community Assets Workbook. Portland, OR: Northwest Regional Educational
Laboratory, 1998. iii. 70 Beaulieu, Lionel J. Mapping the Assets of Your Community: A Key Component for Building Local Capacity.
Mississippi State: Southern Rural Development Center, 2002. 2. 71 Dorfman, Diane. Mapping Community Assets Workbook. Portland, OR: Northwest Regional Educational
Laboratory, 1998. iii.
31
identifying how community stakeholders and assets contribute and can continue to contribute to
community human well-being. 72
In a needs-based (vulnerability) approach to risk assessment, well-intentioned efforts by
government, universities and NGOs are focused on analyzing community problems
(vulnerabilities) and identifying solutions to meet the needs (address the vulnerabilities) of a
community. This process however is typically very one-sided and casts a negative view upon the
community, by simply viewing it as a collection of needs and a recipient of assistance (focusing
on the vulnerabilities), rather than as part of the solution. By only focusing on the negative
problems and vulnerabilities, community assets and capabilities are often overlooked. This
compromises the community, rather than empowering its members to self-identify community
priorities and take charge of their lives and of the community. It can also lead to communities
overly relying upon government and NGO assistance and expertise, rather than looking
internally for solutions and support. This can lead to weakening of vital local social ties and
networks and consequently the weakening of the community’s resilience.73
72 Mathie, Alison, and Gord Cunningham. From Clients to Citizens: Asset-Based Community Development as a
Strategy for Community Driven Development. Antigonish, Nova Scotia, Canada: Coady International Institute, 2002.
5. 73 Ibid. 4.
32
Table 3. Contrasting the "Needs" vs. "Assets" Approach to Community Enhancement 74
“Asset mapping begins with the philosophy that all local residents, regardless of age,
gender, race, ethnic background, place of residence, or other characteristics, can play an effective
role in addressing important local matters.” 75 Local people and organizations are encouraged to
explore how providers of goods and services that are necessary for their human well-being are
interrelated, and to respond to issues regarding risk to these providers in a coordinated,
collaborative fashion.
A broadly representative group of community stakeholders is gathered to identify and map
community assets and capacities that are necessary for human well-being. Assets listed are not
limited to those within the community. This same group then creates a shared vision for
74 Beaulieu, Lionel J. Mapping the Assets of Your Community: A Key Component for Building Local Capacity.
Mississippi State: Southern Rural Development Center, 2002. 4. 75 Ibid. 4.
33
community resilience that incorporates already established community goals, which leads to
collaborative community action.76
This approach is community-driven and similarly to the ABCD approach, focuses on active
participation and empowerment through community engagement. It also makes use of
appreciative inquiry, which promotes positive change in communities by focusing on what is
working well. Participants draw upon their memories of what they like about their community,
especially in regard to human well-being. Instead of focusing on the problems and what is
vulnerable and internalizing these negative ideas, the idea is to create and reinforce a positive
shared meaning within the community that will enhance the community’s capacity to maintain
and improve the well-being or quality of life of all its stakeholders. 77
“Just as plants grow towards their energy source, so do communities and organizations
move towards what gives them life and energy. Reality is socially constructed and language is a
vehicle for reinforcing shared meaning attributed to that reality. To the extent that memory and
the construction of everyday reality offer hope and meaning, people tend to move in that
direction. Parents and teachers are familiar with this principle; research demonstrates extensively
that children’s performance is shaped by teachers’ and parents’ expectations more than it is by
childrens’ innate ability.” 78
76 Mathie, Alison, and Gord Cunningham. From Clients to Citizens: Asset-Based Community Development as a
Strategy for Community Driven Development. Antigonish, Nova Scotia, Canada: Coady International Institute, 2002.
5. 77 Ibid. 7. 78 Ibid. 7.
34
2.8 Appreciative Inquiry
A theme driving our approach was inspired by a strength-based approach based on the
Appreciative Inquiry model (AI). Some researchers believe that excessive focus on dysfunctions
can actually cause these dysfunctions to become worse or fail to become better. By contrast, AI
assumes that when all members of an organization are motivated to understand and value the
most favorable features of its culture, it can make rapid improvements.
Strength-based methods are used in the creation of organizational development strategy and
implementation of organizational effectiveness tactics.
Appreciative Inquiry is organized around the following principles:79
Appreciate “Best of what is”
Imagine “What might be”
Design “What should be”
Create “What will be”
The process being compared begins with participants profiling the unique attributes of their
respective communities using Human Well-being categories, and not by cataloging community
dysfunctions or vulnerabilities. Questions are then asked that lead from its strengths not
weaknesses.
79 Bushe, G.R. “The Appreciative Inquiry Model.” In Kessler, E. (ed.) The Encyclopedia of Management Theory.
Sage Publications, 2013.
35
2.9 Integrating Risk Assessment into Community Planning
Integrating risk reduction into community planning is vital for making communities more
resilient. There are a number of ways to do this. One way to combine them is to include asset-
based appreciative inquiry risk identification and assessment (an approach that defines risks as
threats to assets and is not vulnerability driven) throughout the planning process. This allows for
the consideration of risk in all community planning, which helps communities tap into their
potential for reducing risk. Community workshops encourage community stakeholders to
identify needs and potential solutions, and can reinforce stakeholder relationships, institutional
frameworks and partnerships to address risk reduction and resilience in a holistic manner. Other
potential benefits include assessing how development contributes to human well-being (quality
of life), especially regarding vulnerable populations within the community; developing good
information on risk and communicating risk information widely.80
Another way is to integrate hazard mitigation into other types of planning. Some progress
has been made towards this through the mandating of mitigation elements in comprehensive
plans, and through incorporation of best practices and techniques of mitigation in zoning codes,
subdivision codes and other instruments.81,82 However, there is still a need to enable greater
stakeholder participation in creative discussions around even better mitigation practices, and to
relate such practices to communities’ overall development policies and unique environmental
80 Valdes, Helena Molin, and Patricia Holly Purcell. "Guidance on Resilience in Urban Planning", International
Journal of Disaster Resilience in the Built Environment 4, no. 1 (2013): 1. 1. 81 Federal Emergency Management Agency. Integrating Hazard Mitigation Into Local Planning: Case Studies and
Tools for Community Officials. Washington, DC: Federal Emergency Management Agency, 2013. 82 Schwab, J. C., ed. Hazard Mitigation: Integrating Best Practices into Planning. Chicago, IL: American Planning
Association, Planning Advisory Service Report No. 560, 2010.
36
and socio-economic conditions, especially given the ever-changing nature of the hazards
themselves.
Yet another way is to integrate risk assessment, such as climate change adaptation, into an
agency’s asset management system. This is a convenient and targeted approach due to the fact
that these processes include “developing inventories of assets and taking a risk-based approach
to factors that affect asset conditions.” 83 Asset management systems offer a streamlined
framework for incorporating risk adaptation into budgets, capital plans and rehabilitation cycles.
Risk adaptation can also be “integrated into transportation planning processes, environmental
review, project development, and performance measurement.”84
2.10 Workshop Model
The Workshop Model was designed and tested to help improve the Federal Emergency
Management Agency (FEMA)’s Risk MAP process. It focused on three main areas: (1) refining
the definitions of resilience and risk; (2) developing the community workshop model itself; and
(3) improving community engagement.
The Workshop Model was tested by conducting community workshops in three
Washington State communities: Redmond, Everett and Neah Bay. The main goal of the
community exercises is to highlight the specifics of local assets that can promote HWB and
adaptive capacities. The Workshop Model’s approach prompts for links or comparisons between
community risk; existing providers of the goods and services necessary for community HWB;
83 Federal Transit Administration. Flooded Bus Barns and Buckled Rails: Public Transportation and Climate
Change Adaptation. Washington, DC: FTA Office of Budget and Policy, 2011. 51. 84 Ibid. 51.
37
community goals; and existing and potential mitigation and adaptation strategies. The approach
also involves a parsing of assets into categories of built, natural, and social (and, more
specifically, social networks) capital.
The approach first asks participants to list the sources of HWB (quality of life) in their
community. What do they like about their community? What makes their community unique?
Only then was the threat introduced for discussion on how the community might prepare for it,
respond to it, recover and rebuild. Unlike most risk assessment efforts, the protocol does not
begin with presentations of exposure and vulnerability. This approach might be compared, for
example, with the “Roadmap for Adapting to Coastal Risk”,85 which has participants develop a
profile of the local population (societal), the built environment (infrastructure) and important
natural resources (ecosystem); however, the NOAA approach begins by describing a hazard
scenario in detail first, and seeks primarily to identify vulnerabilities as well as strengths, in the
context of that specific hazard scenario. 86
The 5E Instructional Method was used to frame the three round workshop process. The 5E
method encourages active dialog along with a progression of thought where subsequent ideas
build on previous ones through five stages of learning -- Engage, Explore, Explain, Elaborate,
and Evaluate. Engage means piquing students’ curiosity, determining their current understanding
and encouraging them to compare their ideas with others. Explore means interacting with the
material and ideas through group discussion, framing the questions, and comparing and sharing
ideas. Explain means understanding concepts and ideas, using terminology, recording the process
85 NOAA Coastal Services Center. Digital Coast: Roadmap for Adapting to Coastal Risk. 2012. 86 Institute for Hazards Mitigation Planning and Research, University of Washington. Whole Community Resilience:
An Asset-Based Approach to Enhancing Adaptive Capacity Before a Disruption - Final Report. Federal Emergency
Management Agency, 2014.
38
and revising ideas based upon comparisons of previous thinking. Elaborate means connecting
ideas, solving problems, applying knowledge to new situations, deepening understanding of
concepts and processes and communicating these understandings with others. Evaluate means
demonstrating understanding by applying it to evaluate other projects, as well as assessing
progress through comparison of current understanding with prior knowledge, which leads to
probing even further into the concept.87
The community workshops consist of three rounds of discussion lasting roughly 3 hours.
Responses are recorded on a prepared template (See Appendix C). Community maps are
provided for spatial reference, and participants are encouraged to make notes on the maps. The
lead facilitator describes the purpose and process of the community workshop after introduction
by a local official.
In order to focus the discussion, participants are divided into groups that correspond to
Millennium Ecosystem Assessment (MA) categories of goods and services for HWB, including:
basic material for a good life; health; security; and good social relations. 88
Below are how each of the four categories are defined: 89
1. Basic Material for a Good Life – secure and adequate livelihoods, income and assets,
enough food and water at all times, furniture, fuel, clothing, and access to goods
2. Health – access to medical care, feeling well, and having a healthy physical environment
3. Security – safety of person and possessions, shelter, and living in a predictable and
controllable environment with security from natural and human-made disasters
87 “Inquiry, the Learning Cycle, & the 5E Instructional Model.” In The Guidelines for Lesson Planning. Electronic
Journal of Science Education. 88 Millennium Ecosystem Assessment. Ecosystems and Human Well-Being: A Framework for Assessment.
Washington, DC: Island Press, 2003. 73-4. 89 Institute for Hazards Mitigation Planning and Research, University of Washington. Whole Community Resilience:
An Asset-Based Approach to Enhancing Adaptive Capacity Before a Disruption - Final Report. Federal Emergency
Management Agency, 2014. 10.
39
4. Good Social Relations – social cohesion, mutual respect, good gender and family
relations, and the ability to help others and provide for children
A facilitator from the project team is assigned to each group to prompt them for ideas
focused on the group’s assigned MA category of goods and services. A note taker is also at each
table.
The first round (pre-disruption) begins with a brief presentation of the community’s overall
socio-economic and spatial profile, including information gathered primarily from
comprehensive planning and mitigation plan documents. Participants are asked to think about
what they like about their community and what makes their community unique. 90
Unlike most risk assessment efforts, the approach used does not begin with presentations of
exposure and vulnerability. Participants then characterize their community in terms of the goods
and services that constitute their HWB, and the assets (providers) that provided those goods and
services. Providers are specific to the community or its surroundings and can be located on a
map, though they may also include spatially dispersed or mobile organizations or networks. At
the end of the round participants in each group circle the top three most important themes or
providers and a spokesperson from each group presents highlights of their discussion to the
room. 91
90 Institute for Hazards Mitigation Planning and Research, University of Washington. Whole Community Resilience:
An Asset-Based Approach to Enhancing Adaptive Capacity Before a Disruption - Final Report. Federal Emergency
Management Agency, 2014. 11. 91 Ibid. 12.

40
Figure 5. Community Workshop
The second round (immediately post-disruption) begins with the introduction of a change
event (threat). Described are general types of impact experienced by different neighborhoods
(areas) across the city based on their building stock, infrastructure, demographics, accessibility,
topography and environmental conditions. The presentation does not describe site-specific
impacts, except for the probabilities of disruption to key services and facilities such as highways,
hospitals and fire and police stations. A brief description of the community’s emergency
41
capability is also included. Participants then discuss how, during the week or so following the
earthquake, they would obtain (i.e. through what providers) the goods and services they
identified during Round One. 92
The third round begins with an introduction to the concept of creating a new community
vision that represents a new normal (i.e. acknowledges irreversible change), has greater
resilience (i.e. is more adaptable to change), and reflects common [local] values, goals and
aspirations for human well-being. The lead facilitator presents generalized publicly vetted
community goals and objectives, as laid out in the comprehensive plan, hazard mitigation plan,
and/or other key policy documents. Participants are encouraged to consider the implicit values
and explicit goals and strategies reflected in these documents, and to think of new strategies that
might occur to them based on the previous rounds of discussion. Participants then review the
providers of HWB that they listed in the earlier rounds, and ways to (a) best help the community
recover from the modeled disruption over the long term; (b) put the community in better position
should another disruption occur; and (c) meet the community’s goals for an even better quality of
life.93
Finally, at the end of Round Three, the groups rotate to another table according to a World
Café-like procedure, in order to add perspectives from different HWB categories to each table’s
findings. Team members from each table rotate clockwise to the next table (minus the team
reporter who remains at the original table) where they are briefed by that table’s team reporter
and then give input. Every 10 minutes teams rotate to the next table and repeat the activity until
92 Institute for Hazards Mitigation Planning and Research, University of Washington. Whole Community Resilience:
An Asset-Based Approach to Enhancing Adaptive Capacity Before a Disruption - Final Report. Federal Emergency
Management Agency, 2014. 11. 93 Ibid. 12.
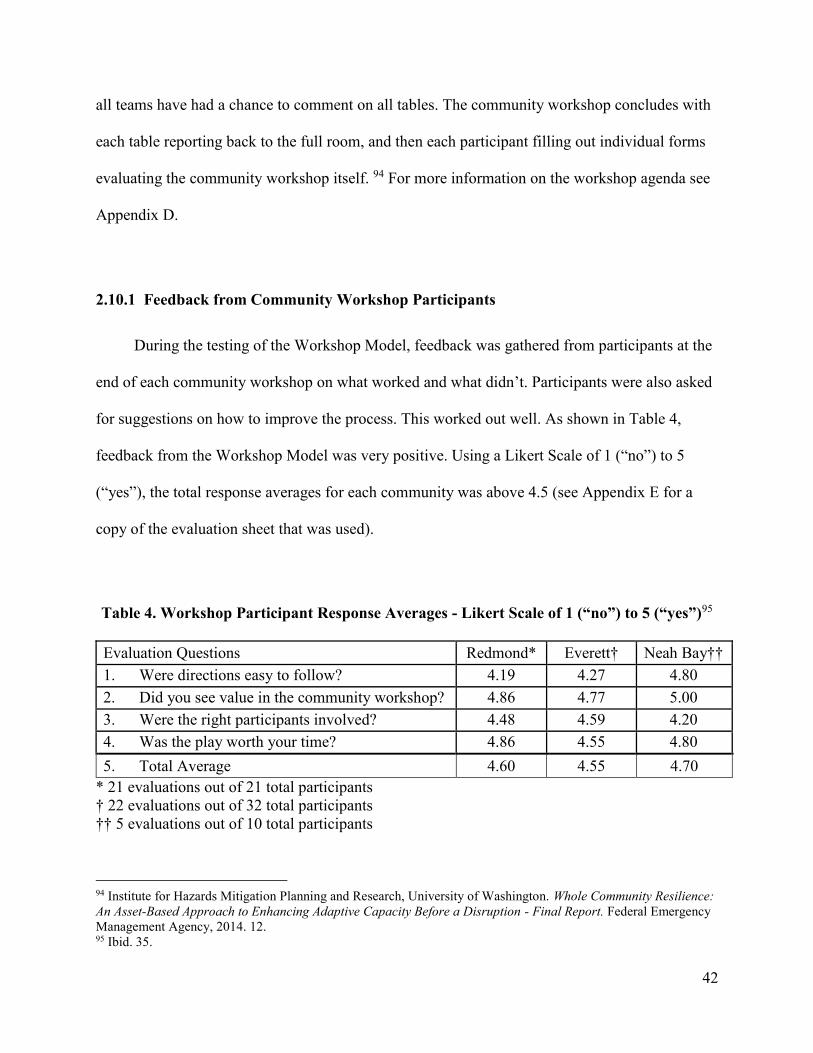
42
all teams have had a chance to comment on all tables. The community workshop concludes with
each table reporting back to the full room, and then each participant filling out individual forms
evaluating the community workshop itself. 94 For more information on the workshop agenda see
Appendix D.
2.10.1 Feedback from Community Workshop Participants
During the testing of the Workshop Model, feedback was gathered from participants at the
end of each community workshop on what worked and what didn’t. Participants were also asked
for suggestions on how to improve the process. This worked out well. As shown in Table 4,
feedback from the Workshop Model was very positive. Using a Likert Scale of 1 (“no”) to 5
(“yes”), the total response averages for each community was above 4.5 (see Appendix E for a
copy of the evaluation sheet that was used).
Table 4. Workshop Participant Response Averages - Likert Scale of 1 (“no”) to 5 (“yes”)95
Evaluation Questions Redmond* Everett† Neah Bay††
1. Were directions easy to follow? 4.19 4.27 4.80
2. Did you see value in the community workshop? 4.86 4.77 5.00
3. Were the right participants involved? 4.48 4.59 4.20
4. Was the play worth your time? 4.86 4.55 4.80
5. Total Average 4.60 4.55 4.70
* 21 evaluations out of 21 total participants
† 22 evaluations out of 32 total participants
†† 5 evaluations out of 10 total participants
94 Institute for Hazards Mitigation Planning and Research, University of Washington. Whole Community Resilience:
An Asset-Based Approach to Enhancing Adaptive Capacity Before a Disruption - Final Report. Federal Emergency
Management Agency, 2014. 12. 95 Ibid. 35.
43
2.11 Gaps in Literature
What was missing is a comprehensive, holistic community resilience framework that
combines the physical aspects of communities (built and natural capital) with the less tangible
aspects associated with human well-being and social capital; that is relevant in the context of
economic, physical, natural and social disruption; and that applies at the community scale rather
than to individual systems within a community. 96 However, Arup is currently developing a city
resilience framework for the Rockefeller Foundation that covers some of this. It would be worth
looking at this framework once it is complete.
96 Arup. City Resilience Framework: Resilience Index. The Rockefeller Foundation, 2014. 4.
44
3 Methodology
Communities are facing ever-increasing risk and there is a growing awareness among risk
professionals (analysts, emergency managers, planners etc.) that the tools and processes for
assessing risk and helping communities become resilient are somewhat inadequate. A more
effective approach is needed. One that engages community stakeholders; moves away from
problem-based planning (that so often misses informal systems, which characterize social,
cultural and natural capital of a community) to asset-based appreciative inquiry planning;
identifies and assesses all risk to all assets that are necessary for each communities’ human well-
being; incorporates community goals and planning; includes capability and opportunity analyses;
and helps address the need for inclusion of risk assessment and information into other
community planning processes.
The Federal Emergency Management Agency is aware of many of these issues and
consequently funded the development and testing of the Workshop Model to help improve their
Risk MAP process. The main areas of concern were community engagement and resilience. Thus
to enhance these pieces of the Risk MAP process the Workshop Model focused on the following:
1. Refining the definitions of resilience and related concepts;
2. Developing a community workshop model; and
3. Achieving effective community buy-in (which leads to action).
Using soft-systems methodology (SSM), the ABAIRA Model is compared to FEMA’s Risk
MAP process. Data was gathered on risk, community resilience, human well-being, the
Workshop Model and the FEMA Risk MAP process. This data, along with information on risk
45
assessment, resilience science, human well-being, asset-based risk assessment and appreciative
inquiry, was used to do the following:
(1) Compare Concepts
a. Resilience
b. Risk assessment
(2) Compare Processes
a. Goals
b. Steps
(3) Provide Suggestions for Improvement to the Risk MAP Process
Research Question
How can an asset-based appreciative inquiry risk assessment model improve FEMA’s
Risk MAP process to help communities become more resilient?
3.1 System Analysis using Soft-Systems Methodology (SSM)
During the analysis process, the ABAIRA Model and the FEMA Risk MAP process are
explained in detail. The ABAIRA model is compared to FEMA’s Risk MAP process using a
classic seven-step SSM approach and CATWOE. CATWOE analysis helps bring clarity to
systems that have multiple ways of viewing them. This allows for a greater understanding of the
ABAIRA Model, Risk MAP and the approaches being compared. It gives important context to
46
concepts and factors being considered that will give readers a richer picture of the problems
being addressed and the solutions being offered. 97
The classic SSM approach is a seven stage process comprising: 98
(1) entering the problem situation,
(2) expressing the problem situation,
(3) formulating root definitions of relevant systems,
(4) building conceptual models of Human Activity Systems,
(5) comparing the models with the real world,
(6) defining changes that are desirable and feasible, and
(7) taking action to improve the real world situation
The SSM approach being used also includes CATWOE.99
C stands for customers. Those who would be the victims or beneficiaries of this system,
e.g., clients.
A stands for actors. Those who would perform the activities of this system, e.g., agents.
T stands for transformation process. The input that is transferred into the output by this
system, e.g., the core of the purposeful activity.
W stands for weltanschauung. The image of this world that makes this system
meaningful, e.g., world view.
O stands for owner. Those who could abolish or stop this activity, e.g., ownership.
E stands for environmental constraints. The external constraints that this system takes
as a given, e.g., environmental impositions.
97 Gregory, F. H. “Cause, Effect, Efficiency & Soft Systems Models” Warwick Business School Research Paper No.
42 (ISSN 0265-5976) January 1992. 3. 98 Ibid. 3. 99 Rosenhead, Jonathan, and John Mingers, Rational Analysis for a Problematic World Revisited 2nd Edition.
Chichester, England: Wiley and Sons, 2001. 75.

47
3.2 Root Definitions
Below are the root definitions of the two systems being compared, FEMA’s Risk MAP
process and the ABAIRA Model. The ABAIRA system, while similar in many fundamental
ways to the Risk MAP system, has some major differences. The ABAIRA system includes
community stakeholders as actors in the process by gathering their input on community assets
and risk reduction opportunities. It assesses community capability and opportunity (prevention,
mitigation and resilience enhancement); improves community resilience by supporting human
well-being; sets risk priorities based upon impacts to human well-being instead of mainly
focusing on vulnerability; and includes ecosystems as customers.
FEMA Risk MAP System
This is a system, organized by DHS, various state and local agencies and contractors
(including academia), which assesses risk to communities and provides adequate, timely and
comprehensive risk information to stakeholders (public, private and government) that is used to
make decisions on how to mitigate and reduce their flood and earthquake risk.
ABAIRA System
This is a system, organized by DHS, various state and local agencies, contractors
(including academia) and community stakeholders, which assesses community risk, capability
and opportunity; and provides adequate, timely and comprehensive risk information to
stakeholders (public, private and government) that is used to make decisions on how to reduce
their risk to human well-being and improve resilience.
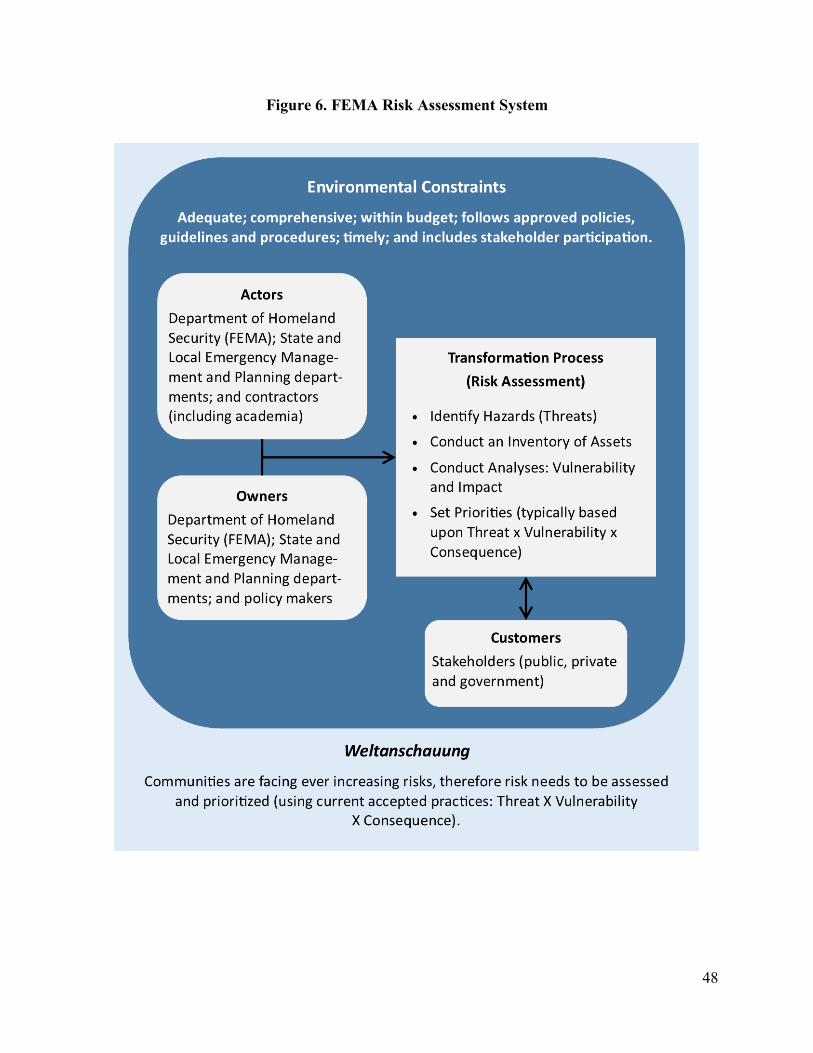
48
Figure 6. FEMA Risk Assessment System

49
Figure 7. ABAIRA System

50
3.3 Risk Mapping, Assessing and Planning (MAP)
The Federal Emergency Management Administration (FEMA) Risk Mapping, Assessing
and Planning (Risk MAP) process is a tool developed and used by FEMA to help enable
communities to better identify, assess, communicate and ultimately mitigate risk to life and
property. Through collaboration with State, Local, and Tribal entities, this process helps
communities identify, assess, communicate and mitigate risk (mainly involving flooding and
earthquakes). It also enhances maps (mainly flood maps); provides risk information (in the form
of reports) to help communities enhance their mitigation plans; and guides and encourages them
to communicate risk to their constituents. 100
This can help communities become “more resilient and better able to withstand the impacts
of disaster.” 101 Risk MAP supports the following FEMA Administrator’s Priorities: (1) to
strengthen the nation’s resilience to disasters; and (2) to foster a national community-oriented
approach to emergency management that strengthens local institutions, assets, and social
networks to build sustainable and resilient communities.102
The Risk MAP Process uses the standard Department of Homeland Security (DHS) risk
assessment method (Threat x Vulnerability x Consequence): 103
Threat – natural or manmade occurrence, individual, entity, or action that has or indicates
the potential to harm life, information, operations, the environment, and/or property.
100 Institute for Hazards Mitigation Planning and Research, University of Washington. Whole Community
Resilience: An Asset-Based Approach to Enhancing Adaptive Capacity Before a Disruption - Final Report. Federal
Emergency Management Agency, 2014. 36. 101 Federal Emergency Management Agency. FEMA’s Risk Mapping, Assessment, and Planning (Risk MAP): Fiscal
Year 2011 Report to Congress. Federal Emergency Management Agency, 2011. 102 Ibid. 103 Department of Homeland Security. National Infrastructure Protection Plan. Department of Homeland Security,
2013. 17.
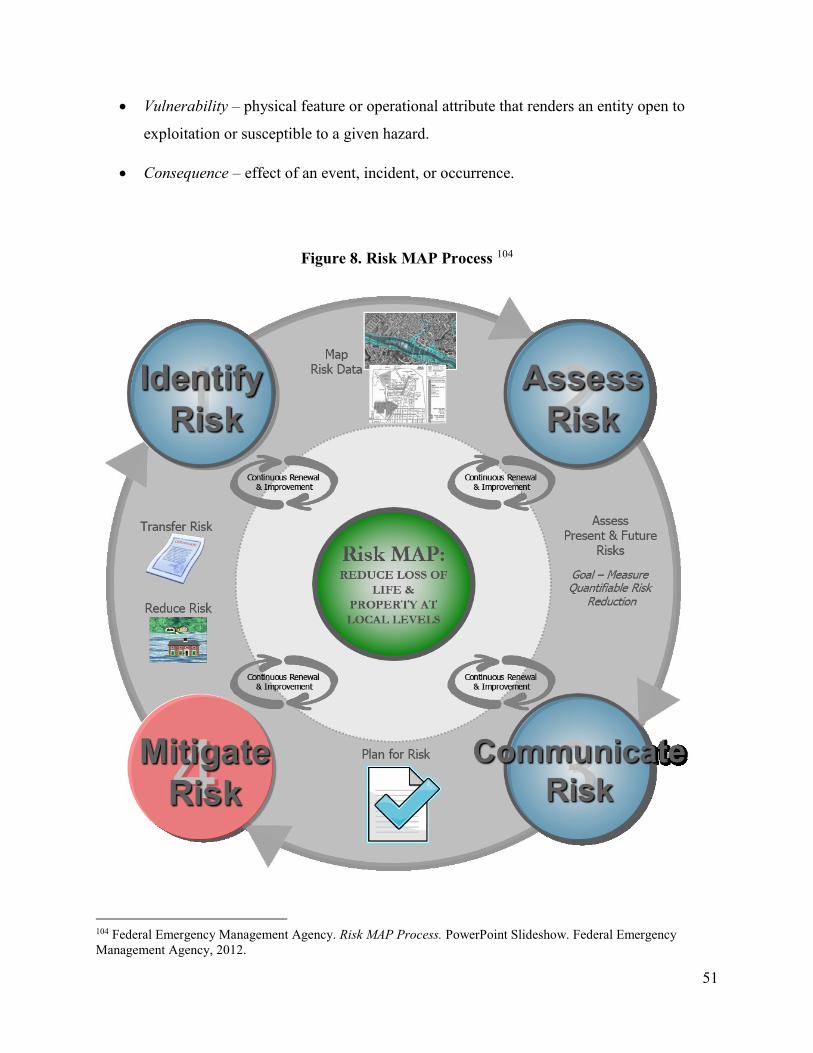
51
Vulnerability – physical feature or operational attribute that renders an entity open to
exploitation or susceptible to a given hazard.
Consequence – effect of an event, incident, or occurrence.
Figure 8. Risk MAP Process 104
104 Federal Emergency Management Agency. Risk MAP Process. PowerPoint Slideshow. Federal Emergency
Management Agency, 2012.
52
3.3.1 Risk MAP Steps105, 106
The Risk MAP process consists of four major steps. Step one is identifying risk (mainly
focused on flooding and earthquakes) and mapping it. This starts with the selecting of a
watershed for Discovery. Discovery involves gathering information on hazards and hazard
mitigation activities within the watershed area in order to determine which areas require
mapping, risk assessment and or mitigation planning assistance. Project areas are then selected
based on whether the risk to the area warrants mitigation action. Step two is assessing risk. This
involves conducting Scoping meetings with project area stakeholders to review the scope of the
project. Risk identification (mainly flooding and earthquakes) is continued in project areas on a
more local scale. A detailed risk assessment is then conducted. Step three is communicating risk.
Risk is discussed with the communities that fall within the project areas. A meeting is conducted
with community officials to review the Risk MAP reports that are being developed for the
communities. These reports contain information on risk and mitigation. A watershed-wide
resilience meeting is then held with community officials and other key stakeholders to identify
and prioritize mitigation action. The Flood Insurance Rate Maps (FIRMs) are issued for the
project areas. Finally, step four is mitigating risk. The communities within the project areas then
take the information that FEMA has provided and use it to mitigate and reduce their risk.
1. Identify Risk - through mapping risk data
a. Select a watershed for Discovery;
b. gather information about local hazards and hazard risks;
105 RiskMAP6.com FEMA Region 6 – Mitigation Division Website; http://www.riskmap6.com/. (accessed July 28,
2014). 106 STARR. Jefferson and Clallam Counties Discovery Report. Federal Emergency Management Agency, 2013. 3.
53
c. review mitigation plans to understand local mitigation capabilities, hazard risk
assessments, and current or future mitigation activities;
d. support communities within the watershed or county to develop a vision for its
future;
e. collect information from communities about their hazard history, development
plans, daily operations, and hazard management activities;
f. use all information gathered to determine which areas of the watershed require
mapping, risk assessment, or mitigation planning assistance through a Risk MAP
project;
g. map the data;
h. decide whether or not the risk warrants mitigation action; and
i. select the project area.
2. Assess Risk - by assessing present and future risks
a. Conduct Scoping meetings with project area stakeholders to review the scope of
the project; and
b. identify and assess risk in project area.
3. Communicate Risk - leads to planning for risk
a. Discuss risks with communities;
b. conduct meeting with community officials to review Risk MAP products;
c. conduct a watershed-wide resilience meeting with community officials and other
key stakeholders to identify and prioritize mitigation action; and
d. issue Flood Insurance Rate Maps (FIRMs).
4. Mitigate Risk - leads to transferring and reducing risk
54
3.3.2 Risk MAP Products
There are three major products that are given to each community during the Risk MAP
process. The first is the Discovery report. It describes the area and lists the following: what needs
are being addressed; past hazards; areas of concern; and current and potential mitigation
projects.107 The second is the Risk report. It provides information on local flood and earthquake
risk, as well as general information on hazard mitigation.108 The third deliverable is the Flood
Insurance Rate Map (FIRM), which is the official map of the community on which FEMA has
delineated both the special hazard areas and the risk premium zones applicable to the
community.
3.4 ABAIRA Model
The ABAIRA Model is an asset-based appreciative inquiry risk assessment approach that
assesses community risk, capability and opportunity; and provides adequate, timely and
comprehensive risk and resilience information to community stakeholders. This information is
then used to make decisions on how to reduce and manage risk to HWB and improve community
resilience. Resilience is defined within the ABAIRA Model as the capacity of a community to
absorb change from an event and adapt so as to retain the ability to provide goods and services
necessary for HWB.
The ABAIRA Model’s approach emphasizes inclusive community stakeholder
engagement; moves away from problem-based planning (that so often misses informal systems,
107 STARR. Jefferson and Clallam Counties Discovery Report. Federal Emergency Management Agency, 2013. 4 108 Federal Emergency Management Agency. Teton Watershed Risk Report. Federal Emergency Management
Agency, 2012.
55
which characterize social, cultural and natural capital of a community) to asset-based
appreciative inquiry planning; identifies and assesses all risk to all assets that are necessary for
each communities’ human well-being; incorporates community goals and planning in the risk
assessment process; includes capability and opportunity analyses; introduces a risk prioritization
matrix that emphasizes impacts to HWB, community capability and opportunity for risk
reduction and resilience enhancement; and helps address the need for inclusion of risk
assessment and information into other community planning processes.
The ABAIRA Model includes the community workshop template from the Workshop
Model as described earlier in section 2.10 of this thesis. The main goal of the community
workshops is to highlight the specifics of local assets that can promote HWB and adaptive
capacities. They do this by prompting for links or comparisons between community risk; existing
providers of the goods and services necessary for community HWB; community goals; and
existing and potential mitigation and adaptation strategies.
The ABAIRA Model follows the 5e structural method, with each phase building upon the
previous one(s). Phases one and two correspond to the “Engage” and “Explore” stages. This
includes initial community stakeholder engagement, where risk, capability and opportunity are
identified; mapping the data; and the first community workshop, where assets are identified.
Phase three addresses the “Explain” and “Elaborate” stages. This includes preliminary
assessment of community risk, capability and opportunity; the communication of this data and
information to the community; and the second community workshop. Phase four corresponds to
the “Elaborate” and “Evaluate” stages. This includes prioritizing and planning for risk, capability

56
and opportunity; utilizing opportunity to mitigate risk and enhance community resilience; and
evaluating and contextualizing these risk reduction opportunities and strategies. 109
Figure 9. ABAIRA Model
109 “Inquiry, the Learning Cycle, & the 5E Instructional Model.” In The Guidelines for Lesson Planning. Electronic
Journal of Science Education.

57
3.4.1 ABAIRA Model Steps110
The ABAIRA Model includes ten major steps, which are categorized based upon
responsibility. Steps one, three, five, six and ten involve both the risk assessment team and
community stakeholders. Their success depends upon significant participation from and
engagement with the communities. This includes community meetings and workshops, and other
forms of outreach to community officials and stakeholders (as inclusive as feasibly possible).
Steps two, four, seven, eight and nine are primarily conducted by the risk assessment team.
Step one is identifying community risk, capability and opportunity. It begins with
identifying the areas and communities to be studied. All available data and information is then
gathered on threats (this includes hazards), community capability (including preparedness,
warning, response and recovery) and opportunity for reducing risk (existing hazard mitigation
plans and activities; and community plans and goals). This includes initial community
stakeholder engagement in order to gather local input on hazards, threats, capability and
opportunity. This leads into step two, which is mapping the data and information. This includes
developing a threat scenario (most catastrophic probable threat) for each community that will be
presented during the community workshops.
Step three is identifying assets that provide the goods and services necessary for each
community’s HWB. This starts off with the first community workshop (round 1 of the Workshop
Model), where input on assets that provide the goods and services necessary for HWB is
110 Institute for Hazards Mitigation Planning and Research, University of Washington. Whole Community
Resilience: An Asset-Based Approach to Enhancing Adaptive Capacity Before a Disruption - Final Report. Federal
Emergency Management Agency, 2014. 38-41.
58
gathered from community stakeholders. The risk assessment team then conducts research on
each community to identify any critical assets that were missed during the workshop(s).
Step four is the preliminary assessment of community risk, capability and opportunity in
regard to HWB for each community. All of the data and information that has been gathered up to
this point is analyzed. This leads to step five, which is communicating risk, capability and
opportunity to community stakeholders. This is done initially through the second community
workshop (round 2 of the Workshop Model), where the threat scenario is presented and
discussed.
Step six is utilizing opportunity to mitigate risk to HWB and enhance resilience. This
begins with the third community workshop (round 3 of the Workshop Model), where participants
are asked to identify resilient assets and envision a more resilient community. This leads to step
seven, which is prioritizing risk to HWB. This involves using the newly developed risk
prioritization matrix (see Table 5). Step eight is planning for community risk, capability and
opportunity in regard to HWB, which includes assessing existing community plans.
Step nine is evaluating and contextualizing risk reduction and resilience enhancement
strategies and action. These strategies and actions are developed, refined and operationalized
with the focus being on HWB in the context of each community’s vision of resilience. This step,
along with the information, reports and assistance provided to each community, should lead to
step ten, which is utilizing capability and opportunity to prevent and mitigate risk to HWB and
enhance community resilience.
59
1. Identify Risk, Capability and Opportunity (Initial Stakeholder Meetings)
The following steps are to be completed by the risk assessment team in collaboration with
community stakeholders:
Identify the areas and communities to be studied
Suggest stakeholders (as inclusive as possible)
Identify risks of concern (using all available current data)
o Includes climate change and terrorism (threats to and from transportation
related assets)
Gather information on community capability (preparedness, warning, response and
recovery)
Identify opportunity for prevention, mitigation and resilience; and future directions as
presented in vetted plans, such as: comprehensive plans; land use plans, and public
works documents
2. Map Risk, Capability and Opportunity Data
The following steps are to be completed by the risk assessment team:
Map collected data
Identify the most probable catastrophic risks
Create a database on the capability of each community that is as comprehensive and
accurate as feasibly possible
Identify the most probable beneficial opportunities
Hypothesize relationships between the highest probable threats, capability of each
community and most probable beneficial opportunities (to present to each
community)
Develop threat scenario(s) that would be most appropriate for each community
Prepare for round 1 of the community workshop

60
3. Identify Assets
The following steps are to be completed by the risk assessment team in collaboration with
community stakeholders:
Conduct round 1 of the community workshop
o Give an overview of the community transportation infrastructure (including
critical infrastructure that is interconnected to it)
o Introduce concepts
o Identify transportation infrastructure assets (providers) of the goods and
services necessary for each community’s human well-being
Identify critical assets that were overlooked during the workshops
Map the assets
4. Assess Risk, Capability and Opportunity regarding HWB
The following steps are to be completed by the risk assessment team:
Preliminary assessment of risk to HWB
Assess community capability
Preliminary assessment of community opportunity
Prepare for round 2 of the community workshop
5. Communicate Risk and Identify Opportunity regarding HWB
The following steps are to be completed by the risk assessment team in collaboration with
community stakeholders:
Discuss risks, capabilities and opportunities with communities
Conduct round 2 of the community workshop
o Introduce concepts
o Introduce scenario(s)
o Describe community capability
61
o Identify providers of goods and services necessary for HWB that would be
available directly after an event
Prepare for round 3 of the community workshop
6. Utilize Opportunity to Mitigate Risk to HWB within context of Community Vision
The following steps are to be completed by the risk assessment team in collaboration with
community stakeholders:
Conduct round 3 of the community workshop (resilience meeting)
o Provide stakeholders with enough information to understand the nexus
between risks, capabilities and opportunities (what the community could
likely become)
o Identify resilient providers
o Identify prevention, mitigation and resilience enhancement solutions that
advance a preferred vision of the community
7. Prioritize Risk regarding HWB
The following steps are to be completed by the risk assessment team:
Assess community opportunity
Assess and prioritize risk to HWB (see Figure 12 for more detail)
o Threats
o Impacts to HWB
o Capability
o Opportunity
8. Plan for Risk, Capability and Opportunity regarding HWB
The following steps are to be completed by the risk assessment team:
Assess community plans
62
Plan for risk, capability and opportunity
9. Evaluate and Contextualize Strategies
The following steps are to be completed by the risk assessment team:
Develop and refine mitigation, risk reduction and resilience enhancement strategies
and actions (include those expressed in round 3 of the community workshop)
10. Utilize Capability and Opportunity to Prevent and Mitigate Risk to HWB; and
Enhance Infrastructure Resilience
The following steps are to be completed by the risk assessment team in collaboration with
community stakeholders:
Operationalize prevention, mitigation and resilience enhancement strategies
Provide information and assistance to community stakeholders on prevention,
mitigation and resilience strategies and planning
3.4.2 Risk Prioritization
The standard way of prioritizing risk is multiplying Threat (Hazard) x Vulnerability x
Consequence. This risk prioritization matrix moves away from this standard in three key ways:
(1) de-emphasizing vulnerability; (2) focusing on impacts to HWB as the consequence; and (3)
including capability and opportunity components. De-emphasizing vulnerability fits into the
ABAIRA approach of focusing on assets necessary for HWB and positive aspects of the
community. With so little resources available, communities can’t fix, protect and or mitigate
every vulnerable asset. Therefore it makes sense to narrow consequences down to the impacts to
HWB. This focuses the priorities on what really matters. Finally, including capability and
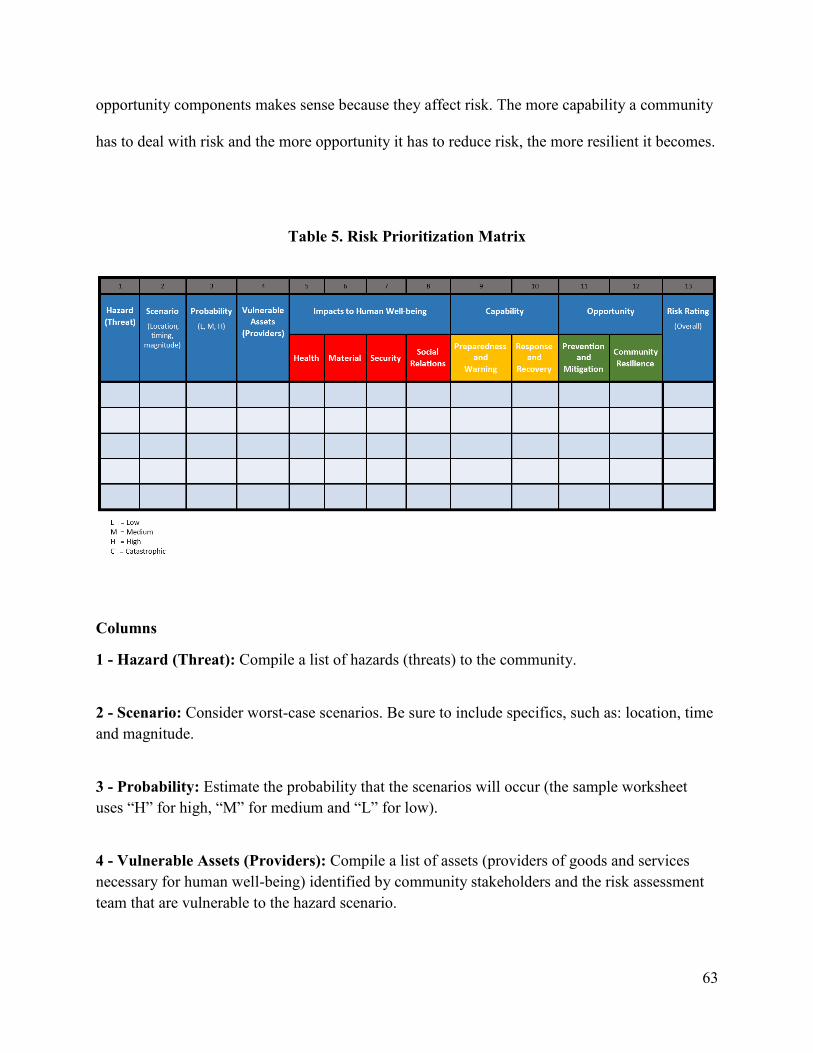
63
opportunity components makes sense because they affect risk. The more capability a community
has to deal with risk and the more opportunity it has to reduce risk, the more resilient it becomes.
Table 5. Risk Prioritization Matrix
Columns
1 - Hazard (Threat): Compile a list of hazards (threats) to the community.
2 - Scenario: Consider worst-case scenarios. Be sure to include specifics, such as: location, time
and magnitude.
3 - Probability: Estimate the probability that the scenarios will occur (the sample worksheet
uses “H” for high, “M” for medium and “L” for low).
4 - Vulnerable Assets (Providers): Compile a list of assets (providers of goods and services
necessary for human well-being) identified by community stakeholders and the risk assessment
team that are vulnerable to the hazard scenario.
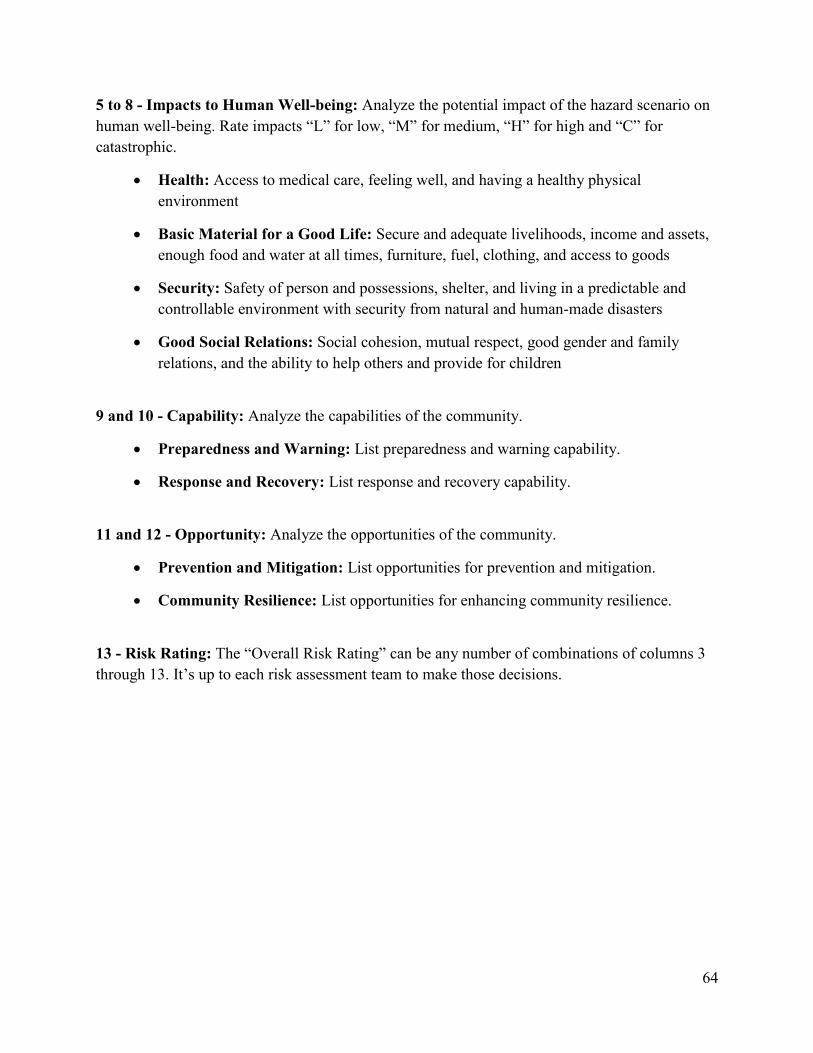
64
5 to 8 - Impacts to Human Well-being: Analyze the potential impact of the hazard scenario on
human well-being. Rate impacts “L” for low, “M” for medium, “H” for high and “C” for
catastrophic.
Health: Access to medical care, feeling well, and having a healthy physical
environment
Basic Material for a Good Life: Secure and adequate livelihoods, income and assets,
enough food and water at all times, furniture, fuel, clothing, and access to goods
Security: Safety of person and possessions, shelter, and living in a predictable and
controllable environment with security from natural and human-made disasters
Good Social Relations: Social cohesion, mutual respect, good gender and family
relations, and the ability to help others and provide for children
9 and 10 - Capability: Analyze the capabilities of the community.
Preparedness and Warning: List preparedness and warning capability.
Response and Recovery: List response and recovery capability.
11 and 12 - Opportunity: Analyze the opportunities of the community.
Prevention and Mitigation: List opportunities for prevention and mitigation.
Community Resilience: List opportunities for enhancing community resilience.
13 - Risk Rating: The “Overall Risk Rating” can be any number of combinations of columns 3
through 13. It’s up to each risk assessment team to make those decisions.
65
4 Results and Analysis
4.1 Comparison of Concepts
The two concepts used in both processes that could best be compared and are the most
relevant for this study are resilience and risk assessment. The Department of Homeland Security
(DHS), including FEMA, is moving towards a holistic risk assessment approach that includes
resilience and the ABAIRA Model focuses on resilience. It is therefore important to understand
how each process approaches resilience and risk assessment.
Resilience
Both processes include adaptation as part of their definition of resilience. The DHS
definition includes preparing for, being able to withstand and recovering from disruptions.
Whereas the ABAIRA Model mentions being able to absorb change (disruption), which is very
similar. The key difference is retaining the ability to provide goods and services necessary for
HWB. The DHS definition does not mention what assets should be doing the withstanding and
what should be recovered. With current recovery practices this means building back to what
things were pre-disruption, without regard to HWB and opportunities to enhance resilience by
building better. While protecting and recovering critical built capital remains an important aspect
of resilience, protecting everything that is vulnerable and recovering it to the state it was pre-
disruption is not an achievable objective, nor a resilient one. This approach is the opposite of
adaptation.
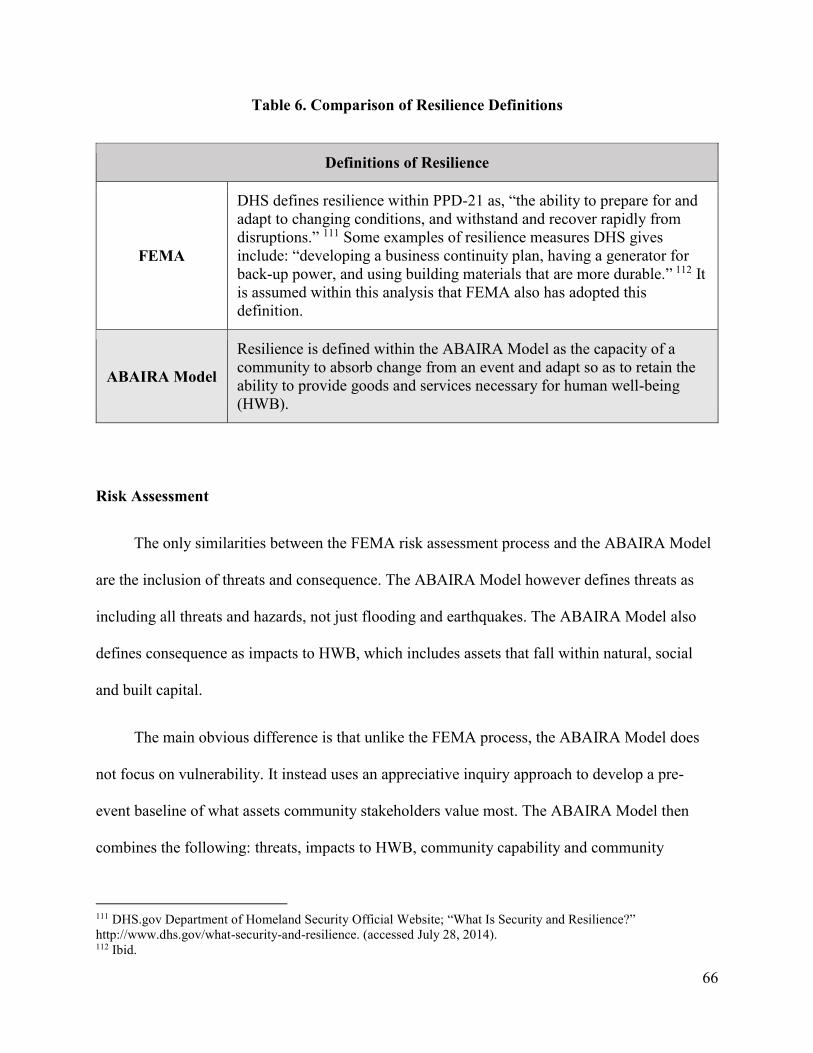
66
Table 6. Comparison of Resilience Definitions
Definitions of Resilience
FEMA
DHS defines resilience within PPD-21 as, “the ability to prepare for and
adapt to changing conditions, and withstand and recover rapidly from
disruptions.” 111 Some examples of resilience measures DHS gives
include: “developing a business continuity plan, having a generator for
back-up power, and using building materials that are more durable.” 112 It
is assumed within this analysis that FEMA also has adopted this
definition.
ABAIRA Model
Resilience is defined within the ABAIRA Model as the capacity of a
community to absorb change from an event and adapt so as to retain the
ability to provide goods and services necessary for human well-being
(HWB).
Risk Assessment
The only similarities between the FEMA risk assessment process and the ABAIRA Model
are the inclusion of threats and consequence. The ABAIRA Model however defines threats as
including all threats and hazards, not just flooding and earthquakes. The ABAIRA Model also
defines consequence as impacts to HWB, which includes assets that fall within natural, social
and built capital.
The main obvious difference is that unlike the FEMA process, the ABAIRA Model does
not focus on vulnerability. It instead uses an appreciative inquiry approach to develop a pre-
event baseline of what assets community stakeholders value most. The ABAIRA Model then
combines the following: threats, impacts to HWB, community capability and community
111 DHS.gov Department of Homeland Security Official Website; “What Is Security and Resilience?”
http://www.dhs.gov/what-security-and-resilience. (accessed July 28, 2014). 112 Ibid.
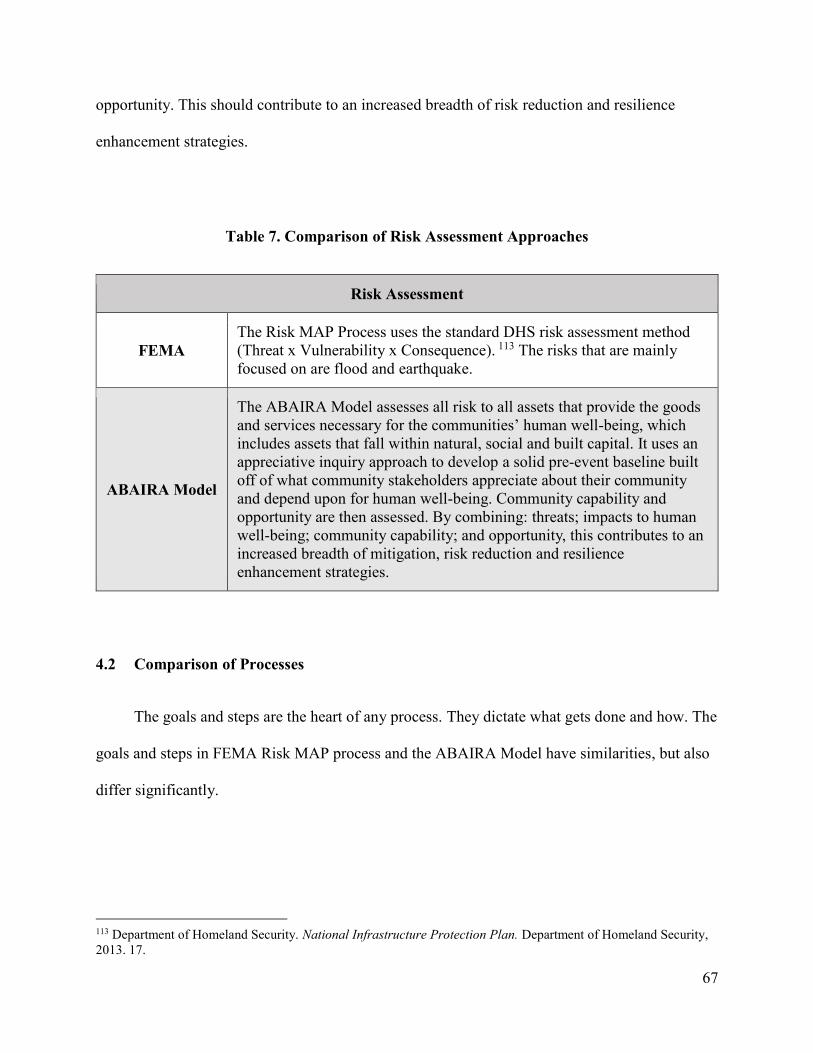
67
opportunity. This should contribute to an increased breadth of risk reduction and resilience
enhancement strategies.
Table 7. Comparison of Risk Assessment Approaches
Risk Assessment
FEMA
The Risk MAP Process uses the standard DHS risk assessment method
(Threat x Vulnerability x Consequence). 113 The risks that are mainly
focused on are flood and earthquake.
ABAIRA Model
The ABAIRA Model assesses all risk to all assets that provide the goods
and services necessary for the communities’ human well-being, which
includes assets that fall within natural, social and built capital. It uses an
appreciative inquiry approach to develop a solid pre-event baseline built
off of what community stakeholders appreciate about their community
and depend upon for human well-being. Community capability and
opportunity are then assessed. By combining: threats; impacts to human
well-being; community capability; and opportunity, this contributes to an
increased breadth of mitigation, risk reduction and resilience
enhancement strategies.
4.2 Comparison of Processes
The goals and steps are the heart of any process. They dictate what gets done and how. The
goals and steps in FEMA Risk MAP process and the ABAIRA Model have similarities, but also
differ significantly.
113 Department of Homeland Security. National Infrastructure Protection Plan. Department of Homeland Security,
2013. 17.
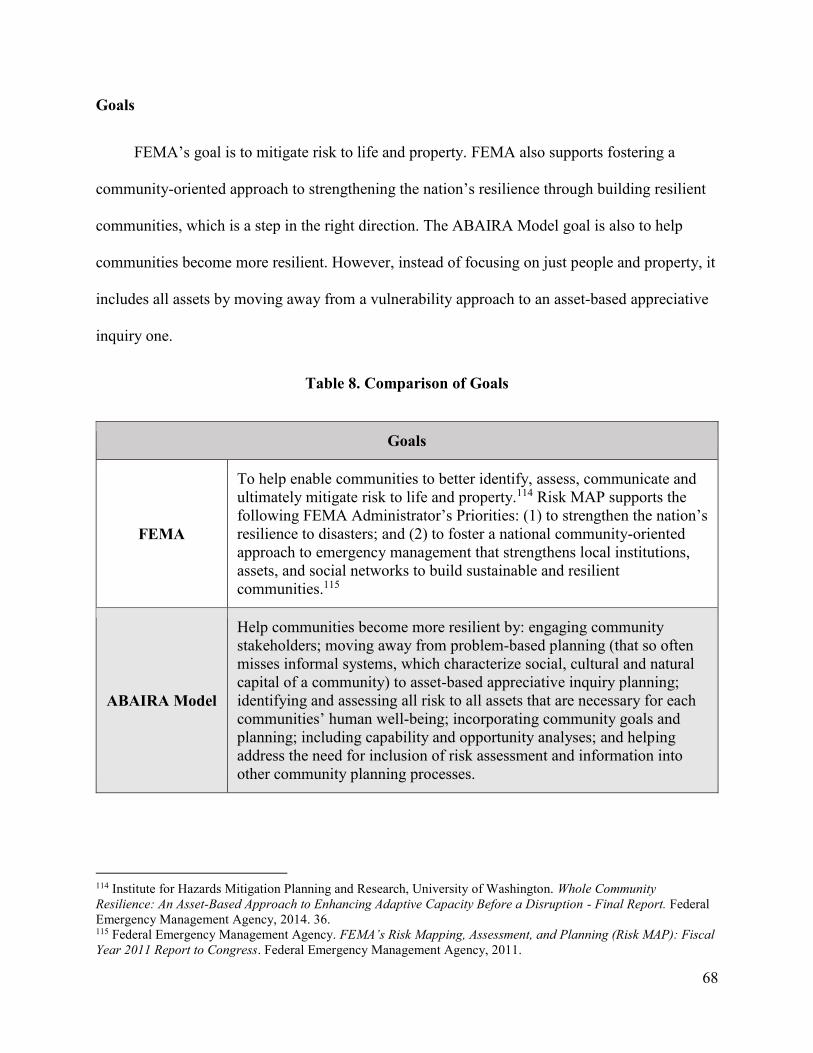
68
Goals
FEMA’s goal is to mitigate risk to life and property. FEMA also supports fostering a
community-oriented approach to strengthening the nation’s resilience through building resilient
communities, which is a step in the right direction. The ABAIRA Model goal is also to help
communities become more resilient. However, instead of focusing on just people and property, it
includes all assets by moving away from a vulnerability approach to an asset-based appreciative
inquiry one.
Table 8. Comparison of Goals
Goals
FEMA
To help enable communities to better identify, assess, communicate and
ultimately mitigate risk to life and property.114 Risk MAP supports the
following FEMA Administrator’s Priorities: (1) to strengthen the nation’s
resilience to disasters; and (2) to foster a national community-oriented
approach to emergency management that strengthens local institutions,
assets, and social networks to build sustainable and resilient
communities.115
ABAIRA Model
Help communities become more resilient by: engaging community
stakeholders; moving away from problem-based planning (that so often
misses informal systems, which characterize social, cultural and natural
capital of a community) to asset-based appreciative inquiry planning;
identifying and assessing all risk to all assets that are necessary for each
communities’ human well-being; incorporating community goals and
planning; including capability and opportunity analyses; and helping
address the need for inclusion of risk assessment and information into
other community planning processes.
114 Institute for Hazards Mitigation Planning and Research, University of Washington. Whole Community
Resilience: An Asset-Based Approach to Enhancing Adaptive Capacity Before a Disruption - Final Report. Federal
Emergency Management Agency, 2014. 36. 115 Federal Emergency Management Agency. FEMA’s Risk Mapping, Assessment, and Planning (Risk MAP): Fiscal
Year 2011 Report to Congress. Federal Emergency Management Agency, 2011.

69
Steps
Due to the ABAIRA Model being based off of the Workshop Model, which was developed
to improve the Risk MAP process, many of the main steps are very similar. The comparison is
therefore divided into two sections. The first section shows the steps that are similar. The second
section highlights the differences, specifically the modifications and additional steps contained
within the ABAIRA Model.
The fundamental steps in the Risk MAP process are similar in many ways to the same
steps within the ABAIRA Model. These include identifying, assessing, communicating and
mitigating risk. There are however some major differences. The most obvious difference is the
movement away from a vulnerability approach to one that focuses on opportunity, capability and
HWB. This includes: identifying and assessing capability, opportunity and risk to HWB to find
relationships between them; conducting the three community workshops; planning for risk,
capability and opportunity; and developing, refining and operationalizing mitigation, risk
reduction and resilience enhancement strategies.
Table 9. Comparison of Process Steps
Steps
Similarities
1. Gather information about local hazards and hazard risks
2. Review mitigation plans to understand local mitigation
capabilities, hazard risk assessments, and current or future
mitigation activities
3. Support communities to develop a vision for its future
4. Collect information from communities about their hazard history,
development plans, daily operations, and hazard management
activities
70
5. Use all information gathered to determine which areas require
mapping, risk assessment, or mitigation planning assistance
through a Risk MAP project
6. Map the data
7. Decide whether or not the risk warrants mitigation action
8. Select the project area
9. Conduct Scoping meetings with project area stakeholders to
review the scope of the project
10. Identify and assess risk in project area
11. Discuss risks with communities
12. Conduct meetings with community officials to review Risk MAP
products
13. Conduct a resilience meeting with community officials and other
key stakeholders to identify and prioritize mitigation action
14. Mitigate Risk
Differences
The ABAIRA Model contains the following modifications and additional
steps:
1. Suggest a more inclusive threshold of stakeholders (including
vulnerable populations)
2. Gather information on community capability (preparedness,
warning, response and recovery)
3. Identify opportunity for prevention, mitigation and resilience; and
future directions as presented in vetted plans, such as:
comprehensive plans; land use plans and public works documents
4. Identify the most probable catastrophic risks
5. Create a database on the capability of each community that is as
comprehensive and accurate as feasibly possible
6. Identify the most probable beneficial opportunities
7. Hypothesize relationships between the highest probable threats,
capability of each community and most probable beneficial
opportunities (to present to each community)
8. Develop threat scenario(s) that would be most appropriate for
each community
9. Conduct round 1 of the Workshop Model to identify assets
(providers) of the goods and services necessary for each
community’s human well-being
10. Assess community capability
11. Discuss risks, capabilities and opportunities with communities
71
12. Conduct round 2 of the Workshop Model to identify providers of
goods and services necessary for HWB that would be available
directly after an event
13. Conduct round 3 of the Workshop Model (resilience meeting)
a. Provide stakeholders with enough information to
understand the nexus between risks, capabilities and
opportunities (what the community could likely become)
b. Identify resilient providers
c. Identify mitigation, risk reduction and resilience
enhancement solutions that advance a preferred vision of
the community
14. Assess community opportunity
15. Assess and prioritize risk to HWB
16. Assess community plans
17. Plan for risk, capability and opportunity
18. Develop, refine and operationalize mitigation, risk reduction and
resilience enhancement strategies (include those expressed in
round 3 of the community workshop)
19. Operationalize prevention, mitigation and resilience enhancement
strategies
20. Provide information and assistance to community stakeholders on
mitigation, risk reduction and resilience strategies and planning
4.3 Suggestions for Improvement to the Risk MAP Process
Based upon the comparison results, there are several modifications that could be
incorporated into the Risk MAP process to improve it. All of these suggested modifications
support refining FEMA’s approach to risk and resilience:
1. Place greater emphasis on all risk to all assets that provide the goods and services
necessary for the communities’ human well-being. This includes assets that fall within
natural and social capital. Rather than restricting risk assessment discussions to
vulnerable built capital.

72
2. Develop tools to identify opportunities for mitigating and reducing risk and improving
community resilience that include natural and social capital.
3. Move away from the DHS risk assessment method (Threat x Vulnerability x
Consequence) to an appreciative inquiry approach that assesses all risk to all assets that
provide the goods and services necessary for the communities’ human well-being.
Develop a solid pre-event baseline built off of what community stakeholders appreciate
about their community and depend upon for human well-being: and assess community
capability and opportunity. By combining: impacts to human well-being; community
capability; and opportunity, this contributes to an increased breadth of mitigation, risk
reduction and resilience enhancement strategies. Using an appreciative inquiry approach
will also increase productivity and enjoyment of the community workshops. Thus
increased community engagement (see Table 4 for participant feedback results from the
Workshop Model that support this).
4. Gather information on community capability (preparedness, warning, response and
recovery) and create a database on the capability of each community that is as
comprehensive and accurate as feasibly possible
5. Better incorporate community goals and planning into the risk assessment process.
6. Address community resilience, not as a static goal or the ability to bounce back, but as a
process enabling communities to self-organize following a critical change event. This
helps in characterizing the community and assessing the value and contribution of all
available assets (natural, social and built), as well as helping participants to take
ownership of the solutions they developed.
7. Provide information and assistance to community stakeholders on mitigation, risk
reduction and resilience strategies and planning
Based upon the comparison results, there are several additions and modifications that could
be incorporated into the Risk MAP products. It is important to note that the ABAIRA Model
does not contain any major products or deliverables, such as flood maps or reports. This is so

73
that when it’s being compared to other processes, the steps, concepts and approach can be
incorporated into the existing products and deliverables.
The Discovery report could include a list of capabilities and a list of current and potential
opportunities. This would help inform communities on where they are currently at in regard to
capability and opportunity. The Risk report could include the following:
1. Community Vision
2. Information on all risk to HWB (not just flood and earthquake risk)
3. Information on capability
4. Information and strategies on mitigation, risk reduction and resilience
5. Guide for incorporating risk assessment and information into local planning processes
a. Explain the need for inclusion of risk assessment and information into other
community planning processes
b. Provide examples of best practices
c. List relevant resources
4.4 Limitations and Constraints
The development and testing of the Workshop Model, which provided the foundation for
the ABAIRA Model, was on a limited budget, tailored for three communities and constrained by
mainly focusing on refining a resilience definition and concepts, developing a community
workshop model and improving effective community engagement. In all three communities, the
project team had previously worked with local emergency management officials on hazard
mitigation planning. The Workshop Model was framed as action research, intended to assist the
communities with on-going planning as well as yield useful findings for broader FEMA policy
and academic understanding. Local officials advertised the workshop to their existing networks
74
of stakeholders in hazard mitigation planning. Participants were therefore not any more
representative of the entire community than these stakeholder networks already are, especially in
the larger and more diverse cities of Redmond and Everett. The objective of the workshops was
therefore to test the new format for discussion among people who for the most part are already
familiar with emergency and disaster planning. This of course limited the perspectives and
probable responses of participants to a narrower range than might be found in the general public.
On the other hand, the participants were not necessarily used to thinking explicitly about their
community’s human well-being (quality of life) in the context of hazard mitigation planning. 116
More testing using the expanded ABAIRA Model will need to be done in order to truly test
the full breadth of the approach that is being suggested in this analysis. The testing will need to
go beyond just a few community workshops. Also the Risk MAP process is very complex and
seems to differ slightly for each of the ten FEMA regions. There are no overall Risk MAP
framework documents or reports that lay out the steps, concepts and approaches in a concise,
comprehensive manner. This made it difficult to do concept and step-by-step process
comparisons. Participant feedback data for Risk MAP Discovery and Scoping meetings, such as:
whether directions are easy to follow; did the participants you see value in the community
exercise; were the right participants (community stakeholders) involved; and was the Risk MAP
process worth their time, was also not available. That is why it’s missing from the analysis
116 Institute for Hazards Mitigation Planning and Research, University of Washington. Whole Community
Resilience: An Asset-Based Approach to Enhancing Adaptive Capacity Before a Disruption - Final Report. Federal
Emergency Management Agency, 2014. 7 and 8.
75
5 Discussion
The comparison results show how an asset-based appreciative inquiry risk assessment
approach could improve FEMA’s Risk MAP process to better help communities become resilient
in the face of ever-changing risk. This approach has the potential to significantly change the way
risk is mapped, assessed and planned for, which helps strengthen our nation’s resilience.
All eight main problem areas are addressed by the ABAIRA Model. These include: (1)
defining community resilience; (2) a risk assessment process that focuses on what really matters
to a community, most importantly their human well-being; (3) effective community engagement;
(4) incorporating community goals and plans into the risk assessment process; (5) identifying
assets beyond just built capital, by including natural and social capital; (6) assessment of
community capability; (7) identification and assessment of mitigation, risk reduction and
resilience opportunity; and (8) incorporating risk assessment and information into other
community planning processes.
5.1 Findings
5.1.1 Defining Community Resilience
The standard risk assessment process assumes that resilience is achieved by mitigating all
vulnerabilities, which is expensive, if not impossible and unsustainable given our limited
resources. Restoring things back to the way they were before a disruption is also practically
impossible and often socio-ecologically undesirable. This has been recognized by recent efforts

76
to incorporate sustainability into community disaster recovery goals. 117,118 Threats should
instead be seen as uninvited but potentially important agents of change, and resilience should be
viewed as the capacity to adapt to change, rather than to bounce back from it.119 The capacity to
adapt is being able to respond to a disruption by adjusting to a new normal, and to build back
better, where better is defined according to community cultural and social values and principles
of resilience.120,121 The capacity to adapt often times is only revealed after a disruption, but it
could and should be developed in the course of a community’s ongoing development.
Approaches to resilience require preparing for the unexpected, whereas risk assessment
typically proceeds from the premise that hazards are identifiable and predictable. Current risk
based approaches are unsatisfactory, even with known hazards. They emphasize risk
probabilities that may be unknowable. Community systems exist within dynamic and
unpredictable environments and estimates of risk probabilities are notoriously unreliable. Take
for example, the estimating of the joint probability and synergy of two or more major events
happening at the same time or back to back. Or look at cascading failures.122
As such, it is inadequate and not helpful to think of community resilience as achieving
some static state of being. It should be approached as an ongoing adaptive process. Not
117 Paton, D., and D. M. Johnston, eds. Disaster Resilience: An Integrated Approach. Springfield, IL: Charles C.
Thomas, 2006. 7 and 8. 118 Smith, G. P., and D. Wenger. “Sustainable Disaster Recovery: Operationalizing an Existing Agenda.” In H. â.
Rodríguez, E. L. Quarantelli and R. R. Dynes, eds. Handbook of Disaster Research, 234-257. New York: Springer,
2007. 119 Norris, F., S. Stevens, B. Pfefferbaum, K. Wyche, and R. Pfefferbaum. “Community Resilience as a Metaphor,
Theory, Set of Capacities, and Strategy for Disaster Readiness.” American Journal of Community Psychology 41,
no.1 (2008): 127-150. 120 Chan, K. M. A., A. D. Guerry, P. Balvanera, S. Klain, T. Satterfield, X. Basurto and U. Woodside. “Where Are
Cultural and Social in Ecosystem Services?: A Framework for Constructive Engagement.” BioScience 62, no. 8
(2012): 744-756. 121 Millennium Ecosystem Assessment. Ecosystems and Human Well-being: Synthesis. Washington, DC: Island
Press, 2005. 122 Park, J., T. P. Seager, P. S. C. Rao, M. Convertino, and I. Linkov. “Integrating Risk and Resilience Approaches
to Catastrophe Management in Engineering Systems.” Risk Analysis 33, no. 3 (2013): 356–367. 359.
77
something that a system achieves or has, but a characteristic of the way it behaves. Ecological
systems when restored do not revert back to their original states like a rubber band returning to
its original shape after being stretched and neither do community systems after an event.
Conditions always change. Even when we don’t realize it. 123
5.1.2 Assessing Risk to What Really Matters
The Risk MAP process could better help communities become more resilient by moving
away from a standard vulnerability approach to an asset-based appreciative inquiry one. Instead
of just focusing on what could potentially break, focus on what really matters.
An asset-based approach is very different from the commonly used needs-based or
vulnerability based approach to risk assessment. It identifies the community’s positive aspects
and looks at ways to empower the community. Community assets are identified by stakeholders
within the community. This includes resources (capital) that would otherwise be ignored,
unrealized or dismissed, such as social and natural capital. This glass is half-full approach does
not deny the real problems or vulnerabilities, it simply focuses efforts on identifying how
community stakeholders and assets contribute and can continue to contribute to community
human well-being. 124
In a needs-based (vulnerability) approach to risk assessment, well-intentioned efforts by
government, universities and NGOs are focused on analyzing community problems
123 Park, J., T. P. Seager, P. S. C. Rao, M. Convertino, and I. Linkov. “Integrating Risk and Resilience Approaches
to Catastrophe Management in Engineering Systems.” Risk Analysis 33, no. 3 (2013): 356–367. 359. 124 Mathie, Alison, and Gord Cunningham. From Clients to Citizens: Asset-Based Community Development as a
Strategy for Community Driven Development. Antigonish, Nova Scotia, Canada: Coady International Institute, 2002.
5.

78
(vulnerabilities) and identifying solutions to meet the needs (address the vulnerabilities) of a
community. This process however is typically very one-sided and casts a negative view upon the
community, by simply viewing it as a recipient of assistance (focusing on the vulnerabilities),
rather than part of the solution. By only focusing on the negative problems and vulnerabilities,
community assets and capabilities are often overlooked. This compromises the community,
rather than empowering it to self-identify community priorities and take charge of their lives and
of the community. It can also lead to communities overly relying upon government and NGO
assistance and expertise, rather than looking internally for solutions and support. This can lead to
weakening of vital local social ties and networks and consequently the weakening of the
community’s resilience.125
Typically, when conducting risk assessment, the mapping of what is considered valuable
and important to the broader community is not explicitly stated and debated amongst the
majority of stakeholders (especially vulnerable stakeholders who are most likely to be impacted).
Instead there is an assumption that all stakeholders implicitly agree on community assets that are
most important and most vulnerable. Stakeholders however often have different opinions on
what is important, which often results in the pursuit of irreconcilable goals.126
A study using focus groups was done in South Africa, investigating if it is possible for a
wide range of community stakeholders to construct a common holistic description of what is
valuable and important to protect. The study results showed that this approach can establish
125 Mathie, Alison, and Gord Cunningham. From Clients to Citizens: Asset-Based Community Development as a
Strategy for Community Driven Development. Antigonish, Nova Scotia, Canada: Coady International Institute, 2002.
4. 126 Becker, Per and Henrik Tehler. “Constructing a Common Holistic Description of What is Valuable and Important
to Protect: A Possible Requisite for Disaster Risk Management.” International Journal of Disaster Risk Reduction 6
(2013): 18–27. 19 and 20.
79
common objectives for disaster risk assessment and increase engagement of stakeholders that
otherwise wouldn’t be part of this process. Thus showing that this process is a vital step towards
a more resilient society.
The questions asked were as follows: 127
What is valuable and important to protect?
Why is it valuable?
Which other elements are valuable in securing that valuable element?
The main elements turned out to be human life, health and well-being. As a result they
came up with “a complex system of critical functions, flows and infrastructure supplying the
basic necessities to secure human life, health and wellbeing, i.e. water, food, shelter, sanitation,
health care, education and livelihood.” 128
The results from the testing of the Workshop Model, which is used as the foundation for
the ABAIRA Model, were very similar to the study done in South Africa, in that participants
constructed both a common holistic description of what is valuable (for their human well-being)
and common objectives for disaster risk assessment. The questions asked during the workshops
were similar as well.
This suggests that the Risk MAP process would benefit from beginning with questions of
HWB and allowing those to drive discussion of community values. These values can be
127 Becker, Per and Henrik Tehler. “Constructing a Common Holistic Description of What is Valuable and Important
to Protect: A Possible Requisite for Disaster Risk Management.” International Journal of Disaster Risk Reduction 6
(2013): 18–27. 21. 128 Ibid. 26.
80
expressed as the providers of HWB goods and services, prompted by questions in an appreciative
inquiry mode:
What do you like about your community?
What helps define the quality of life you value?
What community characteristics provide assurance that you and your community will
recover from a major change?
How can these be incorporated into daily life?
This approach requires FEMA to move away from the standard risk assessment method
(Threat x Vulnerability x Consequence) to an appreciative inquiry approach. One that assesses
all risk to all assets that provide the goods and services necessary for the communities’ human
well-being.
By starting the community workshops with a broad definition and inventory of assets for
everyday quality of life, and then returning to a summary of the community’s goals and plans
after discussing the change event scenario, the ABAIRA Model shows it is relatively easy for
participants to link mitigation, preparedness and recovery capacity with ideas for enhanced well-
being in general, i.e. things they want to do regardless of a threat, but which would also be
especially helpful if a threat is realized. Consequently, risk assessment could be used to gather a
human well-being baseline before an event and compare it post-event. This process could be
used to measure community resilience by looking at pre-event service capacity compared to
post-event. 129 Using an appreciative inquiry approach will also increase productivity and
enjoyment of the community workshops. Thus increased community engagement (see Table 4
129 Bruneau, Michel, and Andrei Reinhorn. “Exploring the Concept of Seismic Resilience for Acute Care Facilities.”
Earthquake Spectra 23, no.1 (2007): 41-62. 4.
81
for participant feedback results from the Workshop Model that support this). The participatory
process itself is often times as important as the outcome. 130
5.1.3 Effective Community Engagement
It is widely understood and accepted that in order to get communities to mitigate and
reduce their risks, they must first understand and accept what those risks are. They then need to
understand how they can mitigate and reduce those risks. Finally, they need the appropriate
skills, tools and resources to take action. All of this requires effective community stakeholder
effective engagement. Communities must feel empowered by the process or else they will ignore
and or reject it, along with the tools and information.
The ABAIRA Model showed that an effective way of engaging community stakeholders is
to obtain their input on how the process can be tailored to work best for their community in
regard to helping them make their community more resilient. Part of obtaining input is eliciting
feedback from workshop participants on what worked and what didn’t and to give suggestions on
how to improve the process. During the testing of the Workshop Model, each community
(Redmond, Everett and Neah Bay) was asked for their input and workshop participants were
given the opportunity to give feedback on the process. This worked out well. As shown in Table
4, feedback from the Workshop Model was very positive. Using a Likert Scale of 1 (“no”) to 5
(“yes”), the total response averages for each community was above 4.5 (see Appendix E for a
copy of the evaluation sheet that was used).
130 Mileti, Dennis S. Disasters by Design: A Reassessment of Natural Hazards in the United States. Washington DC:
Joseph Henry Press, 1999. 5-6.
82
“Asset mapping begins with the philosophy that all local residents, regardless of age,
gender, race, ethnic background, place of residence, or other characteristics, can play an effective
role in addressing important local matters.” 131 Unfortunately community processes, including
FEMA’s Risk MAP process are not usually very inclusive. They tend to leave out the most
vulnerable stakeholders. This is not only a big mistake because it’s these stakeholders who tend
to be the most impacted by change events, but it also limits the understanding of what’s
important to the community, and thus limits the opportunity to mitigate and reduce the
community’s risk.
As anyone who has held a community meeting or workshop can tell you, it is very difficult
to first identify an inclusive representative set of stakeholders, second reach out to them in a
timely manner, and finally get them to show up to the meeting or workshop. While the group of
stakeholders that participated in the testing of the Workshop Model were not as inclusive as we
would have liked, they were representative enough to get useful results showing the value of the
approach (see Appendix F for a summary of the workshop results). During the Risk MAP
process this should not be as much of a problem, given that the time and resource allocations are
much greater than what was allotted for the testing of the Workshop Model.
The concepts, information and tools should also be structured, packaged and presented in a
user-friendly way. This can help engage and empower these very stakeholders who are the most
vulnerable and thus least familiar with the process. This also makes it easier for communities to
make use of them, especially if they don’t have available personnel with the necessary training
and technical expertise. For details no how the workshops were structured see Appendix D.
131 Beaulieu, Lionel J. Mapping the Assets of Your Community: A Key Component for Building Local Capacity.
Mississippi State: Southern Rural Development Center, 2002. 4.
83
5.1.4 Incorporating Community Goals and Plans
In order for the information and tools to be effective and appropriate for the community’s
needs, they should include relevant accurate information regarding the community. This means
incorporating existing community plans, data and goals beyond just the mitigation plans and
flood hazard data. Examples include: comprehensive plans; current and future land-use changes
(in and around the community); economic development goals; ecosystem services and land use
values; and climate change data. This also helps make the information and tools more relevant
and thus more likely to be used by community stakeholders.
Also, in order to fully understand the risk to a community, the current and future plans and
environmental changes must be taken into consideration. According to the National Academy of
Sciences (NAS), while DHS’s risk analysis models for natural hazards appear well suited to
near-term decisions, they should evolve to “support longer term risk management and policy
decisions.” 132 Improvements should be made to take into account the consequences of “long-
term systemic uncertainties, such as those arising from effects of climate change; incorporate
diverse perceptions of risk impacts; and support decision making at local and regional levels.” 133
As an example, the Risk MAP process could “develop and disseminate maps that show flood
hazards under future conditions such as increased impervious area upstream and potential effects
of climate change.” 134
132 National Academy of Sciences. Review of the Department of Homeland Security's Approach to Risk Analysis.
National Academy of Sciences, 2010. 133 Ibid. 134 American Planning Association. Hazard Mitigation: Draft Policy Guide. American Planning Association, 2014.
84
5.1.5 Including Natural and Social Capital (Assets)
Communities rely on goods and services for their well-being, which are provided by built,
natural, and social capital (assets) in differing degrees and at different times. Risk assessment
and management should go beyond merely focusing on built capital to include a consideration of
social and natural capital. All of our critical institutions and assets are or depend upon the natural
environment, including ecosystem services; our human capital; and our social systems. Natural
and social capital are equally if not more important for the long-term resilience of our
communities, which is why opportunities for mitigating and reducing risk and improving
community resilience must include natural and social capital.
According to the American Planning Association (APA), “Communities that integrate
environmental considerations with hazard mitigation planning will be successful in effective
planning for both objectives.” 135 The NAS also mentions that “the full range of consequences of
natural hazard events includes effects that lie outside current evaluations, such as loss of potable
water, housing, and other basic services; diverse effects on communities; impacts on social trust;
psychological effects of disasters; distributional inequities; and differential social
vulnerability.”136 And ,“as risk assessment of natural hazards moves forward over the longer
term, incorporating social dimensions into risk assessment and risk management will have to be
a major priority in building a more complete and robust base of knowledge to inform
decisions.”137
135 American Planning Association. Hazard Mitigation: Draft Policy Guide. American Planning Association, 2014. 136 National Academy of Sciences. Review of the Department of Homeland Security's Approach to Risk Analysis.
National Academy of Sciences, 2010. 137 Ibid.
85
This change in emphasis can be illustrated through two very different approaches to
reducing risk. A traditional approach to risk reduction would include a coastal flood prone
community where all structures are built above the level of flooding. Here the community has
focused on protecting built capital. A different approach is where a community adopts the
necessary legal tools whereby the development rights of structures destroyed by flooding could
be transferred to high ground development sites. This second community might have secured an
acceptance for this approach by involving a wide range of community stakeholders. Resilience
in this case focuses on natural capital (high ground), social capital (networks) and their ability to
adapt to a changing coastline. Should sea level rise and storm severity increase, causing the
shoreline to retreat, our second community may be the more resilient. Especially if the
government and property owners in our first example were heavily indebted and had exhausted
their financial resources in paying the costs of elevation and had few reserves to rebuild. Thus
the resilient community would have protected their quality of life, allowing them to continue to
live and function as a community.
5.1.6 Identifying and Assessing Capability
In order to fully assess a community’s risk to human well-being, we must understand what
its capabilities are. This includes gathering information on: community preparedness; capacity to
warn the community about imminent events; a community’s ability to respond to an event; and
how well a community can recover from the impacts of an event. All of these factors affect how
much and in what ways a community is impacted by change events. This should affect how risk
is understood and prioritized.
86
Assessing the capability of communities and then communicating this information to
community stakeholders will help them to understand what is working and what needs to be
improved. This will help them with their risk planning and developing or updating risk related
documents, such as the Threat and Hazard Identification and Risk Assessment (THIRA). One
way to do this is to create a database that is accessible to the community. Another way is to
include this information in the Discovery and Risk reports. Some information may need to be
restricted due to security and safety issues.
5.1.7 Identifying and Assessing Opportunity
In order for communities to become more resilient, they need to identify, assess and take
advantage of opportunities for mitigation, risk reduction and resilience enhancement. Change
events don’t just bring negative impacts, they can also bring opportunities. These need to be
recognized and understood in order to be taken advantage of and utilized.
The Risk MAP process can help communities identify, assess and utilize their opportunities
by: identifying the most probable beneficial opportunities; hypothesizing relationships between
the highest probable risks, capability of each community and most probable beneficial
opportunities; providing community stakeholders with enough information to understand the
nexus between risks, capabilities and opportunities (what the community could likely become);
and providing information and assistance to community stakeholders on mitigation, risk
reduction and resilience strategies and planning. One suggestion is to include information and
strategies on current and potential opportunities in the Discovery and Risk reports.
87
5.1.8 Incorporating Risk into Other Community Planning Processes
According to the APA, communities want to rebuild back to the way things were pre-event,
without taking into consideration a repeat of the disaster or the effects of long-term trends (such
as beach erosion). 138 The Risk MAP process should guide communities to rebuild for the future,
not the present, and thus in a more resilient manner. In order for communities to fully utilize
their opportunity and thus mitigate and reduce risk, as well as enhance their resilience, they
should incorporate risk information and assessment components into other planning processes.
There are a number of ways the Risk MAP process can be improved to help communities
achieve this. First, the process could be used to reassess land-use plans, zoning ordinances, and
other codes for areas of identified risk and to develop strategies to mitigate those risks. 139
Second, it could be used to assist communities with integrating their Hazard Mitigation Action
Plans into comprehensive plans, by timing the process to coincide with the updating of those
plans. Third, promote community risk and resilience planning in a holistic way, by encouraging
community stakeholders to create a community vision. One that best helps the community
recover from a change event over the long term, puts the community in better position should
another change event occur, and meets the community’s goals for an even better quality of life.
Include this community vision in the Risk report. Fourth, include a guide on incorporating risk
assessment and information into local planning processes in the Risk report. This guide should
explain the need for inclusion of risk assessment and information into other community planning
processes, provide examples of best practices and list relevant resources.
138 American Planning Association. Hazard Mitigation: Draft Policy Guide. American Planning Association, 2014. 139 Ibid.
88
5.2 Proposed Risk MAP Process
The proposed Risk MAP process incorporates the suggested improvements. It includes
eight major steps, which are categorized based upon responsibility. Steps one, two, three and
four involve both the risk assessment team and community stakeholders. Their success depends
upon significant participation from and engagement with the communities. This includes
community meetings and workshops, and other forms of outreach to community officials and
stakeholders (as inclusive as feasibly possible). Steps A, B, C and D are primarily conducted by
the risk assessment team.
Step one is identifying community risk, capability and opportunity. It begins with
identifying the areas and communities to be studied. All available data and information is then
gathered on threats (this includes hazards), community capability (including preparedness,
warning, response and recovery) and opportunity (existing hazard mitigation plans and activities;
and community plans and goals). During this step, initial community meetings (similar to the
Discovery and Scoping meetings in the Risk MAP process) will be conducted, with an inclusive
representation of stakeholders to gather local input on hazards, threats, capability and
opportunity. This leads into step A, which is mapping the data and information. This includes
developing a threat scenario (most catastrophic probable threat) for each community that will be
presented during the community workshops.
Step two is identifying assets that provide the goods and services necessary for each
community’s HWB. This starts off with the first community workshop (round 1 of the Workshop
Model), where input on assets that provide the goods and services necessary for HWB is
89
gathered from community stakeholders. The risk assessment team then conducts research on
each community to identify any critical assets that were missed during the workshop(s).
Step B is the preliminary assessment of community risk, capability and opportunity in
regard to HWB for each community. All of the data and information that has been gathered up to
this point is analyzed. This leads to step three, which is communicating risk, capability and
opportunity to the communities. This is done initially through the second community workshop
(round 2 of the Workshop Model), where the threat scenario is presented and discussed.
Step C is prioritizing and planning for community risk, capability and opportunity in regard
to HWB. This involves using the risk prioritization matrix (see Table 5), as well as incorporating
risk assessment, capability and opportunity into community planning. This step would be done
conjointly with step four, which is utilizing opportunity to mitigate risk and enhance resilience.
This begins with the third community workshop (round 3 of the Workshop Model), where
participants are asked to identify resilient assets and envision a more resilient community.
Finally, step D is evaluating and contextualizing risk reduction and resilience enhancement
strategies and action. These strategies and actions are developed, refined and operationalized
with the focus being on HWB in the context of each community’s vision of resilience. This step,
along with the information, reports and assistance provided to each community, should lead to
community risk reduction and resilience enhancement action.
The proposed Risk MAP process with the suggested improvements incorporated into it
could look like Figure 10.

90
Figure 10. Proposed Risk MAP Process
5.2.1 Proposed Risk MAP Steps
1. Identify Risk, Capability and Opportunity (Discovery and Scoping)
The following steps are to be completed by the risk assessment team in collaboration with
community stakeholders:
Discovery phase (similar to Risk MAP)
Identify the communities to be studied
Suggest stakeholders (as inclusive as possible)
Identify risks of concern (using all available current data)
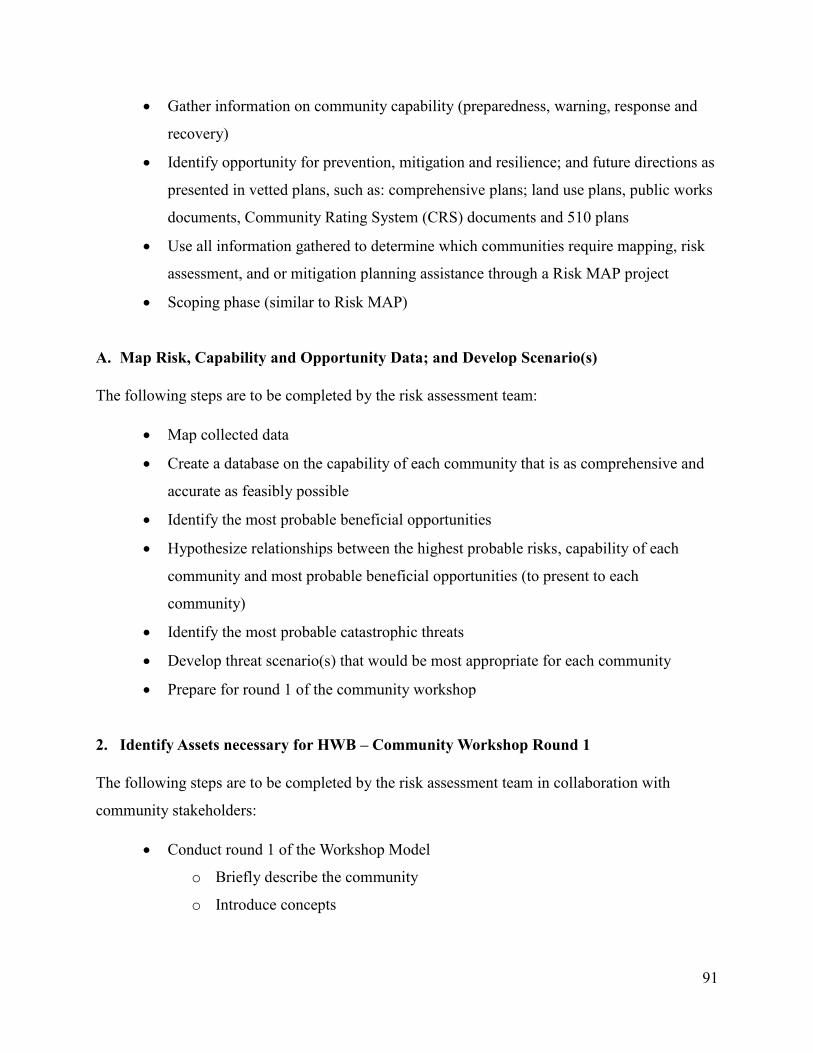
91
Gather information on community capability (preparedness, warning, response and
recovery)
Identify opportunity for prevention, mitigation and resilience; and future directions as
presented in vetted plans, such as: comprehensive plans; land use plans, public works
documents, Community Rating System (CRS) documents and 510 plans
Use all information gathered to determine which communities require mapping, risk
assessment, and or mitigation planning assistance through a Risk MAP project
Scoping phase (similar to Risk MAP)
A. Map Risk, Capability and Opportunity Data; and Develop Scenario(s)
The following steps are to be completed by the risk assessment team:
Map collected data
Create a database on the capability of each community that is as comprehensive and
accurate as feasibly possible
Identify the most probable beneficial opportunities
Hypothesize relationships between the highest probable risks, capability of each
community and most probable beneficial opportunities (to present to each
community)
Identify the most probable catastrophic threats
Develop threat scenario(s) that would be most appropriate for each community
Prepare for round 1 of the community workshop
2. Identify Assets necessary for HWB – Community Workshop Round 1
The following steps are to be completed by the risk assessment team in collaboration with
community stakeholders:
Conduct round 1 of the Workshop Model
o Briefly describe the community
o Introduce concepts
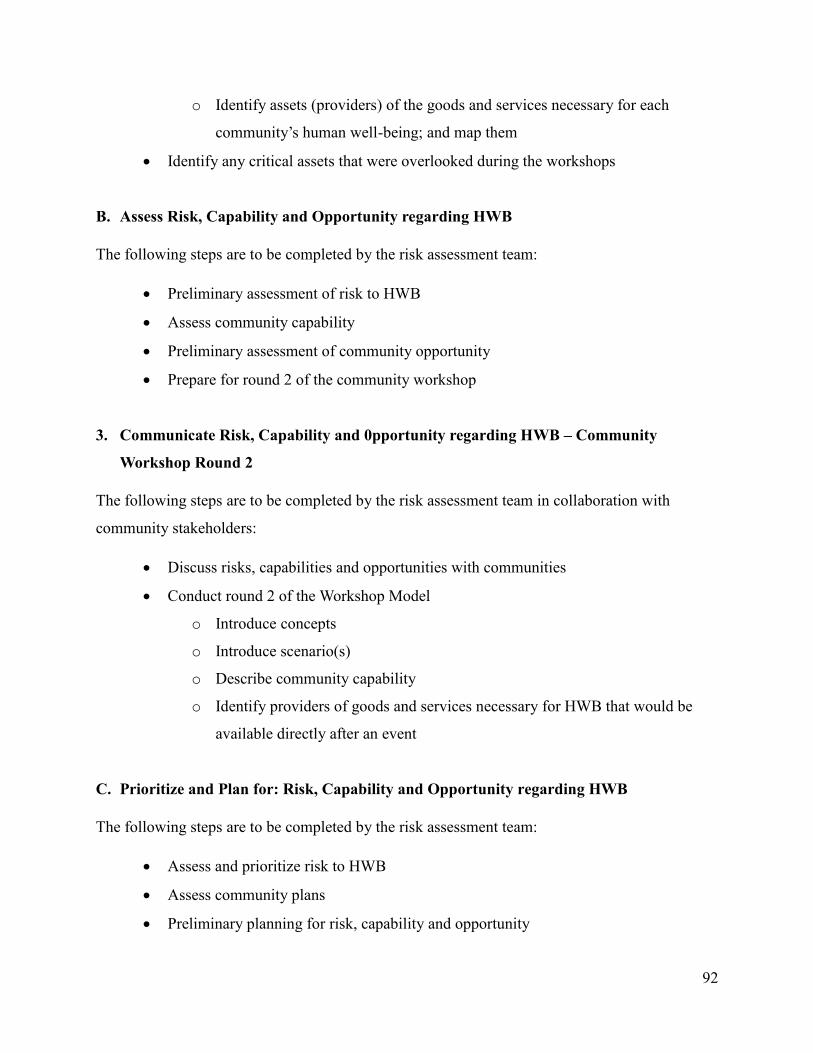
92
o Identify assets (providers) of the goods and services necessary for each
community’s human well-being; and map them
Identify any critical assets that were overlooked during the workshops
B. Assess Risk, Capability and Opportunity regarding HWB
The following steps are to be completed by the risk assessment team:
Preliminary assessment of risk to HWB
Assess community capability
Preliminary assessment of community opportunity
Prepare for round 2 of the community workshop
3. Communicate Risk, Capability and 0pportunity regarding HWB – Community
Workshop Round 2
The following steps are to be completed by the risk assessment team in collaboration with
community stakeholders:
Discuss risks, capabilities and opportunities with communities
Conduct round 2 of the Workshop Model
o Introduce concepts
o Introduce scenario(s)
o Describe community capability
o Identify providers of goods and services necessary for HWB that would be
available directly after an event
C. Prioritize and Plan for: Risk, Capability and Opportunity regarding HWB
The following steps are to be completed by the risk assessment team:
Assess and prioritize risk to HWB
Assess community plans
Preliminary planning for risk, capability and opportunity

93
Prepare for round 3 of the community workshop
4. Utilize Opportunity to Mitigate Risk to HWB within context of Community Vision –
Community Workshop Round 3
The following steps are to be completed by the risk assessment team in collaboration with
community stakeholders:
Conduct round 3 of the Workshop Model (resilience meeting)
o Provide stakeholders with enough information to understand the nexus
between risks, capabilities and opportunities (what the community could
likely become)
o Identify resilient providers
o Identify mitigation, risk reduction and resilience enhancement solutions that
advance a preferred vision of the community
D. Evaluate and Contextualize Strategies; Reduce Risk to HWB
The following steps are to be completed by the risk assessment team:
Develop, refine and operationalize mitigation, risk reduction and resilience
enhancement strategies and actions (include those expressed in round 3 of the
community workshop)
Provide information and assistance to community stakeholders on mitigation, risk
reduction and resilience strategies and planning (amendments to the flood insurance
maps and community rating system documents, including hazards mitigation plans,
comprehensive land use plans, public works capital improvement plans, etc.)
5.2.2 Proposed Risk MAP Products
These products expand upon the current Risk MAP Discovery and Scoping reports. The
Discovery report includes a list of capabilities and opportunities. The Scoping report includes
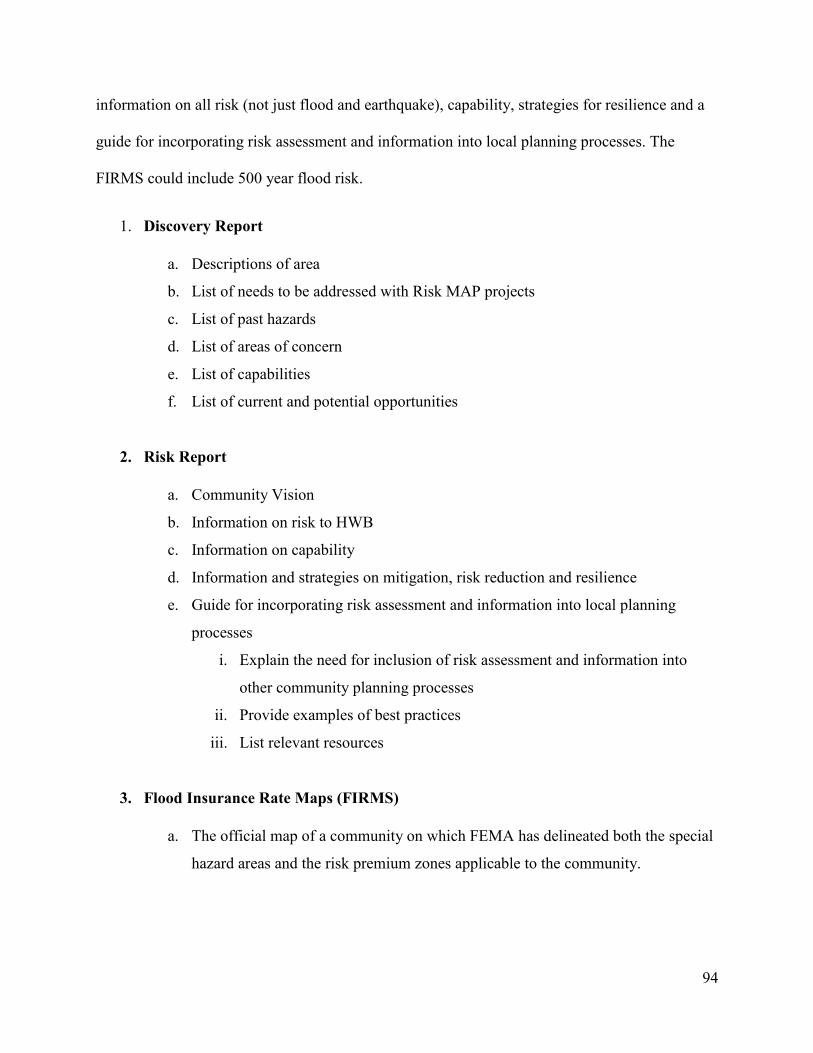
94
information on all risk (not just flood and earthquake), capability, strategies for resilience and a
guide for incorporating risk assessment and information into local planning processes. The
FIRMS could include 500 year flood risk.
1. Discovery Report
a. Descriptions of area
b. List of needs to be addressed with Risk MAP projects
c. List of past hazards
d. List of areas of concern
e. List of capabilities
f. List of current and potential opportunities
2. Risk Report
a. Community Vision
b. Information on risk to HWB
c. Information on capability
d. Information and strategies on mitigation, risk reduction and resilience
e. Guide for incorporating risk assessment and information into local planning
processes
i. Explain the need for inclusion of risk assessment and information into
other community planning processes
ii. Provide examples of best practices
iii. List relevant resources
3. Flood Insurance Rate Maps (FIRMS)
a. The official map of a community on which FEMA has delineated both the special
hazard areas and the risk premium zones applicable to the community.
95
5.3 Limitations
The Workshop Model, which is the foundation for the ABAIRA Model, was only partially
tested due to conducting just three community workshops. The Workshop Model was also
mainly limited to focusing on: (1) refining the definitions of resilience and risk; (2) developing
the community workshop model itself; and (3) improving community engagement. Thus it didn’t
address the Risk MAP process as a whole, nor did it “formally” address all of the problem areas
that the ABAIRA Model addresses. These additional problem areas include: a holistic risk
assessment process that focuses on what really matters to a community, most importantly their
human well-being; incorporating community goals and plans into the risk assessment process;
identifying assets beyond just built capital, by including natural and social capital; assessment of
community capability; identification and assessment of mitigation, risk reduction and resilience
opportunity; and incorporating risk assessment and information into other community planning
processes. This limited the depth of testing as well as suggestions for improvement.
5.4 Further Research
There are a number of opportunities for moving this research forward. First, the ABAIRA
Model could be compared to other risk assessment and management approaches to see what
lessons could be learned. As an example see my master’s capstone Helping Communities
Become More Resilient Through the Use of Asset-Based Risk Assessment for Transportation
Systems.140 Second, the capability assessment and risk prioritization components could be further
140 Dixon, Maximilian. “Helping Communities Become More Resilient Through the Use of Asset-Based Risk
Assessment for Transportation Systems.” Master’s capstone, University of Washington, 2014.
96
researched and refined. Third, the ABAIRA Model could be fully tested in at least one
community to see what works, what doesn’t and what could be improved. This could be done
using a format similar to how the Workshop Model was tested. Fourth, the ABAIRA Model
could be developed into a full risk management process. One way of doing this is by
incorporating a measurement component similar to the DHS Risk Management Framework. This
includes: developing risk reduction and resilience enhancement performance metrics; comparing
results against established HWB baselines; and tracking progress against established community
priorities.
97
6 Conclusion
The world is changing rapidly. Communities are facing greater and more complex risks, i.e.
climate change, cyber vulnerabilities and terrorism. Infrastructure systems are becoming more
complex and expensive to build and maintain. In 2013 the American Society of Civil Engineers
(ASCE) gave US infrastructure a D grade. The tools, processes and approaches we use today to
assess and manage risk are outdated and inadequate. In order for our nation to become resilient,
our communities must become resilient by better managing risk.
With the increased emphasis by DHS and others on a whole community approach to risk
assessment and resilience, there is huge potential for developing a more effect approach. One
that focuses on helping communities adapt to ever changing risks, by: (1) redefining resilience;
(2) assessing risk to what really matters to a community, most importantly their human well-
being; (3) effectively engaging communities to obtain their buy-in and support; (4) incorporating
community goals and plans; (5) identifying assets beyond just built capital, by including natural
and social capital; (6) identifying and assessing community capability; (7) identifying and
assessing community opportunity for mitigation, risk reduction and resilience enhancement; and
(8) incorporating risk assessment and information into other community planning processes.
The Risk MAP process and products are great for traditional hazard mitigation planning.
The Risk MAP process could and should however be much, much more. By incorporating the
suggestions discussed in this analysis and switching to an asset-based appreciative risk
assessment approach, FEMA’s Risk MAP process could be improved to better help communities
become resilient in the face of ever changing risks, which helps strengthen our nation’s
resilience.

98
Asset-based appreciative inquiry risk assessment is a leap in the right direction. It has the
potential to significantly improve the way risk is mapped, assessed and planned for. This
approach is community-driven and similarly to the ABCD approach, focuses on active
participation and empowerment through community engagement. It also makes use of
appreciative inquiry, which promotes positive change in communities by focusing on what is
working well. Participants draw upon their memories of what they like about their community,
especially in regard to human well-being. “Just as plants grow towards their energy source, so do
communities and organizations move towards what gives them life and energy.”141 Instead of
focusing on the problems and what is vulnerable and internalizing these negative ideas, this
approach creates and reinforces a positive shared meaning within the community that will
enhance the community’s capacity to maintain and improve the well-being of all its
stakeholders.142 And thus become more resilient.
This change in emphasis can be illustrated through two very different approaches to
reducing risk. A traditional approach to risk reduction would include a coastal flood prone
community where all structures are built above the level of flooding. Here the community has
focused on protecting built capital. A different approach is where a community adopts the
necessary legal tools whereby the development rights of structures destroyed by flooding could
be transferred to high ground development sites. This second community might have secured an
acceptance for this approach by involving a wide range of community stakeholders. Resilience in
this case focuses on natural capital (high ground), social capital (networks) and their ability to
adapt to a changing coastline. Should sea level rise and storm severity increase, causing the
141 Mathie, Alison, and Gord Cunningham. From Clients to Citizens: Asset-Based Community Development as a
Strategy for Community Driven Development. Antigonish, Nova Scotia, Canada: Coady International Institute, 2002.
7. 142 Ibid. 7.
99
shoreline to retreat, our second community may be the more resilient. Especially if the
government and property owners in our first example were heavily indebted and had exhausted
their financial resources in paying the costs of elevation and had few reserves to rebuild. Thus
the resilient community would have protected their quality of life (human well-being), allowing
them to continue to live and function as a community.
On a final note, integrating risk reduction into community planning is also vital for making
communities more resilient. There are a number of ways to do this. One way to combine them is
to include asset-based appreciative inquiry risk assessment throughout the planning process. This
allows for the consideration of risk in all community planning, which helps communities tap into
their potential for reducing risk. Community workshops encourage community stakeholders to
identify needs and potential solutions, and can reinforce stakeholder relationships, institutional
frameworks and partnerships to address risk reduction and resilience in a holistic manner. Other
potential benefits include assessing how development contributes to human well-being
(especially regarding vulnerable populations within the community), developing good
information on risk, and communicating risk information widely.143
143 Valdes, Helena Molin, and Patricia Holly Purcell. "Guidance on Resilience in Urban Planning", International
Journal of Disaster Resilience in the Built Environment 4, no. 1 (2013): 1. 1.
100
Works Cited
Alberti, M. Advances in Urban Ecology: Integrating Humans and Ecological Processes in
Urban Ecosystems. New York: Springer, 2008.
Alberti, M. Russo, M and K. Tenneson. Snohomish Basin 2060 Scenarios: Adapting to an
Uncertain Future: Decision Support for Long Term Provision of Ecosystem Services in the
Snohomish Basin, WA. Seattle, WA: Urban Ecology Research Laboratory, University of
Washington, 2013.
Alcamo, J. Environmental Futures: the Practice of Environmental Scenario Analysis (1st ed.).
Amsterdam. Boston: Elsevier, 2008.
American Planning Association. Hazard Mitigation: Draft Policy Guide. American Planning
Association, 2014.
Arup. City Resilience Framework: Resilience Index. The Rockefeller Foundation, 2014.
Ash, Neville et al, eds. Ecosystems and Human Well-being: A Manual for Assessment
Practitioners. Washington, DC: Island Press, 2010.
Beatley, T. Planning for Coastal Resilience: Best Practices for Calamitous Times. Washington,
DC: Island Press, 2009.
Beaulieu, Lionel J. Mapping the Assets of Your Community: A Key Component for Building
Local Capacity. Mississippi State: Southern Rural Development Center, 2002.
Becker, Per and Henrik Tehler. “Constructing a Common Holistic Description of What is
Valuable and Important to Protect: A Possible Requisite for Disaster Risk Management.”
International Journal of Disaster Risk Reduction 6 (2013): 18–27.
Bruneau, Michel, and Andrei Reinhorn. “Exploring the Concept of Seismic Resilience for Acute
Care Facilities.” Earthquake Spectra 23, no.1 (2007): 41-62.
Burby, R. J. Cooperating With Nature: Confronting Natural Hazards With Land Use Planning
for Sustainable Communities. Washington, DC: Joseph Henry Press, 1998.
Burkett, V. D. M. Coastal Impacts, Adaptation, and Vulnerabilities: A Technical Input to the
2013 National Climate Assessment. Washington, DC: Island Press, 2012.
Bushe, G.R. “The Appreciative Inquiry Model.” In Kessler, E. (ed.) The Encyclopedia of
Management Theory. Sage Publications, 2013.
Chan, K. M. A., A. D. Guerry, P. Balvanera, S. Klain, T. Satterfield, X. Basurto and U.
Woodside. “Where Are Cultural and Social in Ecosystem Services?: A Framework for
Constructive Engagement.” BioScience 62, no. 8 (2012): 744-756.
Cooperrider, D. L., personal correspondence, as quoted in Bushe, Gervase. “Foundations of
Appreciative Inquiry: History, Criticism and Potential.” AI Practitioner 14, no.1 (2012): 8-20.
Daly, Herman E, and Joshua Farley. Ecological Economics: Principles and Applications.
Washington, DC: Island Press, 2011.
Department of Homeland Security. CPG 201: Threat and Hazard Identification and Risk
Assessment Guide—Second Edition. Department of Homeland Security, 2013.
101
Department of Homeland Security. National Infrastructure Protection Plan. Department of
Homeland Security, 2013.
DHS.gov Department of Homeland Security Official Website; “What Is Security and
Resilience?” http://www.dhs.gov/what-security-and-resilience. (accessed July 28, 2014).
Dixon, Maximilian. “Helping Communities Become More Resilient Through the Use of Asset-
Based Risk Assessment for Transportation Systems.” Master’s capstone, University of
Washington, 2014.
Dorfman, Diane. Mapping Community Assets Workbook. Portland, OR: Northwest Regional
Educational Laboratory, 1998.
DrTomOConnor.com Website of T. O'Connor; “Mitigation and Preparedness;" MegaLinks in
Criminal Justice. Last modified January 19, 2014.
http://www.drtomoconnor.com/3430/3430lect06.htm. (accessed July 28, 2014).
Emery, M., and C. B. Flora. “Appreciative Inquiry as a Visioning Process.” In N. Walzer and G.
F. Hamm, eds. Community Visioning Programs: Processes and Outcomes, 135-155. Hoboken:
Taylor & Francis, 2012.
Federal Emergency Management Agency. Community Resilience Upper Spokane Watershed.
PowerPoint Slideshow. Federal Emergency Management Agency, 2012.
Federal Emergency Management Agency. FEMA’s Risk Mapping, Assessment, and Planning
(Risk MAP): Fiscal Year 2011 Report to Congress. Federal Emergency Management Agency,
2011.
Federal Emergency Management Agency. Integrating Hazard Mitigation Into Local Planning:
Case Studies and Tools for Community Officials. Washington, DC: Federal Emergency
Management Agency, 2013.
Federal Emergency Management Agency. Risk MAP Process. PowerPoint Slideshow. Federal
Emergency Management Agency, 2012.
Federal Emergency Management Agency. Teton Watershed Risk Report. Federal Emergency
Management Agency, 2012.
Federal Transit Administration. Flooded Bus Barns and Buckled Rails: Public Transportation
and Climate Change Adaptation. Washington, DC: FTA Office of Budget and Policy, 2011.
Freitag, B., S. M. Bolton, F. Westerlund, and J. L. S. Clark. Floodplain Management: A New
Approach for a New Era. Washington, DC: Island Press, 2009.
Green, G. P., and A. Haines. Asset Building & Community Development (3rd ed.). Thousand
Oaks, CA: Sage, 2012.
Gregory, F. H. “Cause, Effect, Efficiency & Soft Systems Models” Warwick Business School
Research Paper No. 42 (ISSN 0265-5976) January 1992.
Gunderson, L. H., and C. S. Holling, eds. Panarchy: Understanding Transformations in Human
and Natural Systems. Washington, DC: Island Press, 2002.
Holling, C. S. “Understanding the Complexity of Economic, Ecological, and Social Systems.”
Ecosystems 4, no. 5 (2001): 390–405.
102
“Inquiry, the Learning Cycle, & the 5E Instructional Model.” In The Guidelines for Lesson
Planning. Electronic Journal of Science Education.
Institute for Hazards Mitigation Planning and Research, University of Washington. Whole
Community Resilience: An Asset-Based Approach to Enhancing Adaptive Capacity Before a
Disruption - Final Report. Federal Emergency Management Agency, 2014.
Lee, B., F. Preston, and G. Green. Preparing for High-Impact, Low-Probability Events: Lessons
from Eyjafjallajökull. A Chatham House Report. London, UK: The Royal Institute of
International Affairs, Chatham House, 2012.
Mathie, Alison, and Gord Cunningham. From Clients to Citizens: Asset-Based Community
Development as a Strategy for Community Driven Development. Antigonish, Nova Scotia,
Canada: Coady International Institute, 2002.
Mileti, Dennis S. Disasters by Design: A Reassessment of Natural Hazards in the United States.
Washington DC: Joseph Henry Press, 1999.
Millennium Ecosystem Assessment. Ecosystems and Human Well-Being: A Framework for
Assessment. Washington, DC: Island Press, 2003.
Millennium Ecosystem Assessment. Ecosystems and Human Well-being: Synthesis. Washington,
DC: Island Press, 2005.
National Academy of Sciences. Review of the Department of Homeland Security's Approach to
Risk Analysis. National Academy of Sciences, 2010.
NOAA Coastal Services Center. Digital Coast: Roadmap for Adapting to Coastal Risk. 2012.
Norris, F., S. Stevens, B. Pfefferbaum, K. Wyche, and R. Pfefferbaum. “Community Resilience
as a Metaphor, Theory, Set of Capacities, and Strategy for Disaster Readiness.” American
Journal of Community Psychology 41, no.1 (2008): 127-150.
Orchiston, C. “Seismic Risk Scenario Planning and Sustainable Tourism Management:
Christchurch and the Alpine Fault Zone, South Island, New Zealand.” Journal of Sustainable
Tourism 20, no.1 (2011): 59-79.
Park, J., T. P. Seager, P. S. C. Rao, M. Convertino, and I. Linkov. “Integrating Risk and
Resilience Approaches to Catastrophe Management in Engineering Systems.” Risk Analysis 33,
no. 3 (2013): 356–367.
Paton, D., and D. M. Johnston, eds. Disaster Resilience: An Integrated Approach. Springfield,
IL: Charles C. Thomas, 2006.
Peterson, G. D., G. S. Cumming, and S. R. Carpenter. “Scenario Planning: A Tool for
Conservation in an Uncertain World.” Conservation Biology 17, no.2 (2003): 358-366.
Ready.gov FEMA Ready Campaign Website; “Risk Assessment.” http://www.ready.gov/risk-
assessment. (accessed July 28, 2014).
Resilience Alliance. Assessing Resilience in Social-Ecological Systems: Workbook for
Practitioners. Version 2.0. Resilience Alliance, 2010.
RiskMAP3.com FEMA Region 3 Risk MAP Website; “About Risk MAP.”
http://riskmap3.com/about. (accessed July 28, 2014).
103
RiskMAP6.com FEMA Region 6 – Mitigation Division Website; http://www.riskmap6.com/.
(accessed July 28, 2014).
Rosenhead, Jonathan, and John Mingers, Rational Analysis for a Problematic World Revisited
2nd Edition. Chichester, England: Wiley and Sons, 2001.
Schwab, J. C., ed. Hazard Mitigation: Integrating Best Practices into Planning. Chicago, IL:
American Planning Association, Planning Advisory Service Report No. 560, 2010.
Smith, G. P., and D. Wenger. “Sustainable Disaster Recovery: Operationalizing an Existing
Agenda.” In H. â. Rodríguez, E. L. Quarantelli and R. R. Dynes, eds. Handbook of Disaster
Research, 234-257. New York: Springer, 2007.
STARR. Jefferson and Clallam Counties Discovery Report. Federal Emergency Management
Agency, 2013.
Stokols, D., R. P. Lejano, and J. Hipp. “Enhancing the Resilience of Human-Environment
Systems: a Social Ecological Perspective.” Ecology and Society 18, no.1 (2013): Article 7.
UNISDR The United Nations Office for Disaster Risk Reduction Website; “Terminology.”
http://www.unisdr.org/we/inform/terminology. (accessed July 28, 2014).
Valdes, Helena Molin, and Patricia Holly Purcell. "Guidance on Resilience in Urban Planning",
International Journal of Disaster Resilience in the Built Environment 4, no. 1 (2013): 1.
Walker, Brian H., and David Salt. Resilience Practice: Building Capacity to Absorb Disturbance
and Maintain Function. Washington, DC: Island Press, 2012.
Walker, Brian H., and David Salt. Resilience Thinking: Sustaining Ecosystems and People in a
Changing World. Washington, DC: Island Press, 2006.
World Health Organization. Ecosystems and Human Well-Being: Health Synthesis. World Health
Organization, 2005.
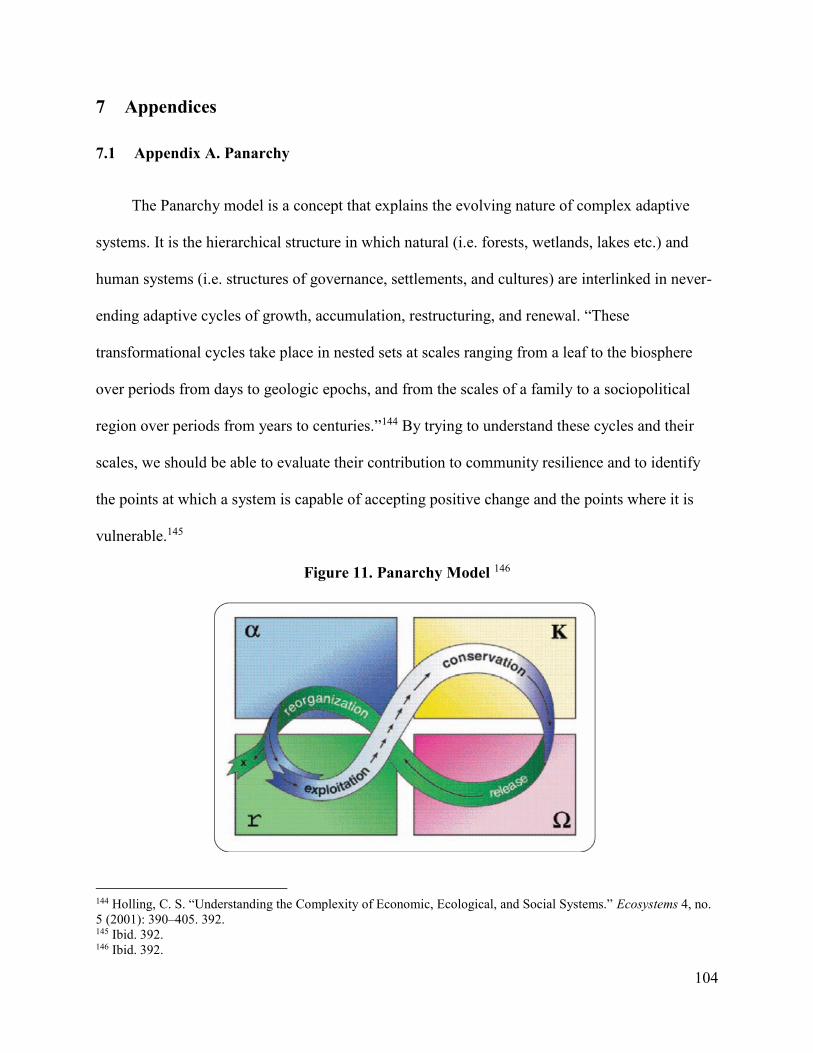
104
7 Appendices
7.1 Appendix A. Panarchy
The Panarchy model is a concept that explains the evolving nature of complex adaptive
systems. It is the hierarchical structure in which natural (i.e. forests, wetlands, lakes etc.) and
human systems (i.e. structures of governance, settlements, and cultures) are interlinked in never-
ending adaptive cycles of growth, accumulation, restructuring, and renewal. “These
transformational cycles take place in nested sets at scales ranging from a leaf to the biosphere
over periods from days to geologic epochs, and from the scales of a family to a sociopolitical
region over periods from years to centuries.”144 By trying to understand these cycles and their
scales, we should be able to evaluate their contribution to community resilience and to identify
the points at which a system is capable of accepting positive change and the points where it is
vulnerable.145
Figure 11. Panarchy Model 146
144 Holling, C. S. “Understanding the Complexity of Economic, Ecological, and Social Systems.” Ecosystems 4, no.
5 (2001): 390–405. 392. 145 Ibid. 392. 146 Ibid. 392.
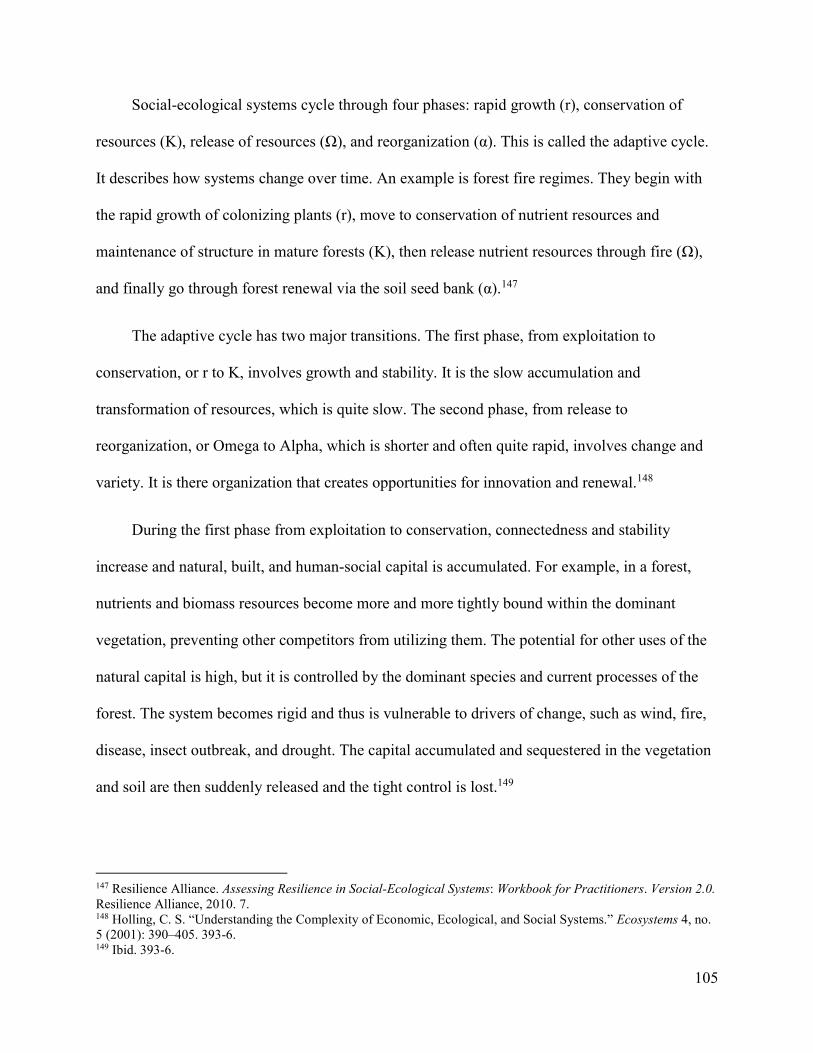
105
Social-ecological systems cycle through four phases: rapid growth (r), conservation of
resources (K), release of resources (Ω), and reorganization (α). This is called the adaptive cycle.
It describes how systems change over time. An example is forest fire regimes. They begin with
the rapid growth of colonizing plants (r), move to conservation of nutrient resources and
maintenance of structure in mature forests (K), then release nutrient resources through fire (Ω),
and finally go through forest renewal via the soil seed bank (α).147
The adaptive cycle has two major transitions. The first phase, from exploitation to
conservation, or r to K, involves growth and stability. It is the slow accumulation and
transformation of resources, which is quite slow. The second phase, from release to
reorganization, or Omega to Alpha, which is shorter and often quite rapid, involves change and
variety. It is there organization that creates opportunities for innovation and renewal.148
During the first phase from exploitation to conservation, connectedness and stability
increase and natural, built, and human-social capital is accumulated. For example, in a forest,
nutrients and biomass resources become more and more tightly bound within the dominant
vegetation, preventing other competitors from utilizing them. The potential for other uses of the
natural capital is high, but it is controlled by the dominant species and current processes of the
forest. The system becomes rigid and thus is vulnerable to drivers of change, such as wind, fire,
disease, insect outbreak, and drought. The capital accumulated and sequestered in the vegetation
and soil are then suddenly released and the tight control is lost.149
147 Resilience Alliance. Assessing Resilience in Social-Ecological Systems: Workbook for Practitioners. Version 2.0.
Resilience Alliance, 2010. 7. 148 Holling, C. S. “Understanding the Complexity of Economic, Ecological, and Social Systems.” Ecosystems 4, no.
5 (2001): 390–405. 393-6. 149 Ibid. 393-6.

106
Other examples involve human-social capital. Corporations such as IBM, AT&T, or
General Motors become rigid to the point of crisis and then have to restructure. The Soviet
Union suffered a sudden collapse for similar reasons. In these cases agents of change were
stakeholder revolts, public-interest attacks through the legal system, or more extreme societal
revolts.150
In summary, there are four key elements that characterize an adaptive cycle:
1. Capital increases incrementally in conjunction with increased efficiency, which leads to
increased rigidity. This is the phase from r to K in Figure 11.
2. As capital increases, slow changes gradually expose an increasing vulnerability
(decreased resilience) to drivers of change, such as fire, insect outbreak, competitors, or
opposition groups. This leads to release, which moves abruptly into a back loop from K
to Ω.
3. When uncertainty is high, potential is great, and controls are weak, innovation tends to
flourish, so that new and unexpected combinations can form. This is the phase of
reorganization (Ω to a).
4. Those innovations are then tested (a to r). Many fail, but some survive and adapt. This
leads the cycle back to the phase of growth from r to K.151
150 Holling, C. S. “Understanding the Complexity of Economic, Ecological, and Social Systems.” Ecosystems 4, no.
5 (2001): 390–405. 393-6. 151 Ibid. 393-6.

107
Figure 12. Panarchy Model with Nested Cycles 152
Figure 12 introduces three important concepts to the adaptive cycle. The first is nested
sets of adaptive cycles (which turn it into the Panarchy model). The larger cycle is slower and
typically acts to stabilize the smaller faster cycles, thus maintaining system integrity (for a time
at least). These fast nested cycles can allow for inventing, experimenting and testing within the
slower more stable cycles, thus improving long-term resilience. This is done through the second
important concept, revolt, which occurs when fast, small events overwhelm large, slow ones.
Revolt however can also lead to weakening long-term community resilience (i.e. hotels come in
right after a tsunami and buy up land on the beach which was previously village housing).The
third is remembering. This occurs when the potential accumulated and stored in the larger, slow
152 Holling, C. S. “Understanding the Complexity of Economic, Ecological, and Social Systems.” Ecosystems 4, no.
5 (2001): 390–405. 396.
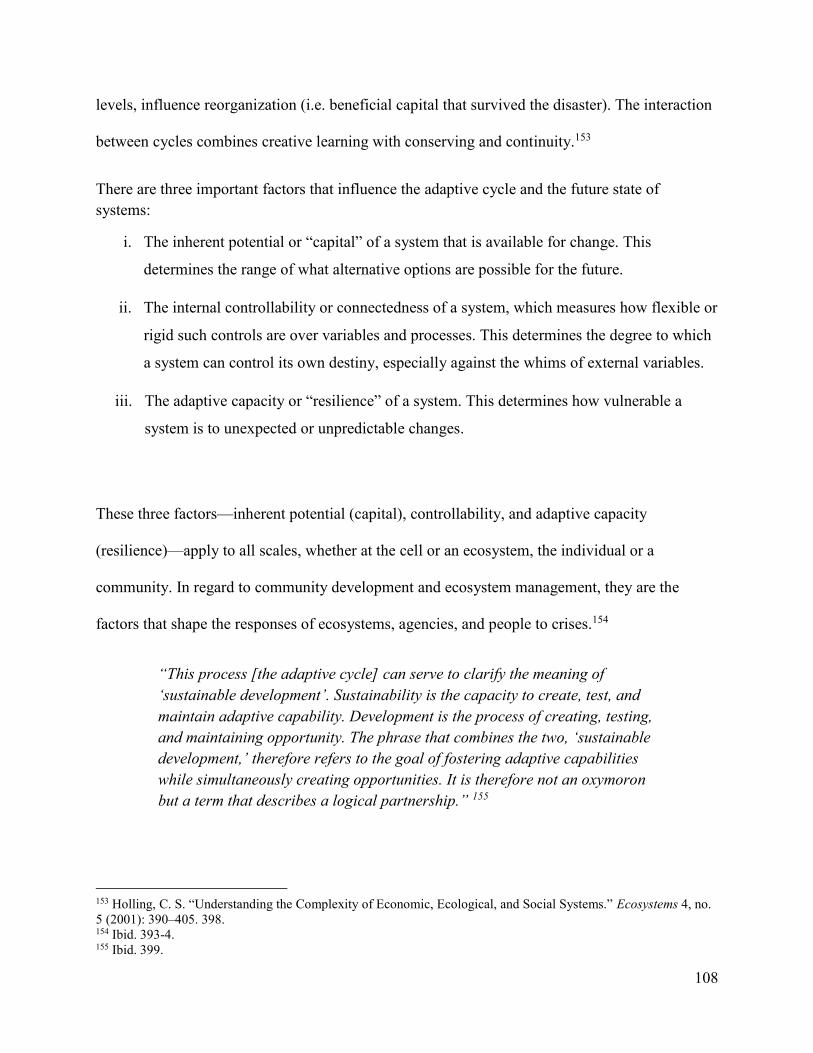
108
levels, influence reorganization (i.e. beneficial capital that survived the disaster). The interaction
between cycles combines creative learning with conserving and continuity.153
There are three important factors that influence the adaptive cycle and the future state of
systems:
i. The inherent potential or “capital” of a system that is available for change. This
determines the range of what alternative options are possible for the future.
ii. The internal controllability or connectedness of a system, which measures how flexible or
rigid such controls are over variables and processes. This determines the degree to which
a system can control its own destiny, especially against the whims of external variables.
iii. The adaptive capacity or “resilience” of a system. This determines how vulnerable a
system is to unexpected or unpredictable changes.
These three factors—inherent potential (capital), controllability, and adaptive capacity
(resilience)—apply to all scales, whether at the cell or an ecosystem, the individual or a
community. In regard to community development and ecosystem management, they are the
factors that shape the responses of ecosystems, agencies, and people to crises.154
“This process [the adaptive cycle] can serve to clarify the meaning of
‘sustainable development’. Sustainability is the capacity to create, test, and
maintain adaptive capability. Development is the process of creating, testing,
and maintaining opportunity. The phrase that combines the two, ‘sustainable
development,’ therefore refers to the goal of fostering adaptive capabilities
while simultaneously creating opportunities. It is therefore not an oxymoron
but a term that describes a logical partnership.” 155
153 Holling, C. S. “Understanding the Complexity of Economic, Ecological, and Social Systems.” Ecosystems 4, no.
5 (2001): 390–405. 398. 154 Ibid. 393-4. 155 Ibid. 399.
109
7.2 Appendix B. The Rockefeller City Resilience Framework
This approach, “moves away from traditional disaster risk management, which is founded
on risk assessments that relate to specific hazards. Instead, it accepts the possibility that a wide
range of disruptive events – both stresses and shocks – may occur but are not necessarily
predictable. Resilience focuses on enhancing the performance of a system in the face of multiple
hazards, rather than preventing or mitigating the loss of assets due to specific events.” 156
In this framework there are 12 indicators, which fall into the following four categories: “the
health and wellbeing of individuals (people); urban systems and services (place); economy and
society (organization); and, finally, leadership and strategy (knowledge).” 157 These indicators
are performance indicators. “They describe the outcome of actions to build resilience, not the
actions themselves. This acknowledges that resilience results from individual and collective
action at various levels, delivered by multiple stakeholders ranging from households to
municipal government.” 158
Qualities of Resilient Systems159
Reflective
They have mechanisms to continuously evolve, and will modify standards or norms based on
emerging evidence, rather than seeking permanent solutions based on the status quo.
Robust
Robust systems include well-conceived, constructed and managed physical assets, so that they
can withstand the impacts of hazard events without significant damage or loss of function.
156 Arup. City Resilience Framework: Resilience Index. The Rockefeller Foundation, 2014. 3. 157 Ibid. 8. 158 Ibid. 8. 159 Ibid. 5.
110
Redundant
Redundancy refers to spare capacity purposely created within systems so that they can
accommodate disruption, extreme pressures or surges in demand. It includes diversity: the
presence of multiple ways to achieve a given need or fulfil a particular function.
Flexible
Flexibility implies that systems can change, evolve and adapt in response to changing
circumstances. This may favor decentralized and modular approaches to infrastructure or
ecosystem management.
Resourceful
Resourcefulness implies that people and institutions are able to rapidly find different ways to
achieve their goals or meet their needs during a shock or when under stress.
Inclusive
Inclusion emphasizes the need for broad consultation and engagement of communities, including
the most vulnerable groups. Addressing the shocks or stresses faced by one sector, location, or
community in isolation of others is an anathema to the notion of resilience. An inclusive
approach contributes to a sense of shared ownership or a joint vision to build city resilience.
Integrated
Integration and alignment between city systems promotes consistency in decision-making and
ensures that all investments are mutually supportive to a common outcome. Integration is evident
within and between resilient systems, and across different scales of their operation.
Indicators of Resilient Systems 160
1. Minimal human vulnerability
This relates to the extent to which everyone’s basic needs are met.
160 Arup. City Resilience Framework: Resilience Index. The Rockefeller Foundation, 2014. 8.
111
2. Diverse livelihoods and employment
This is facilitated by access to finance, ability to accrue savings, skills training, business support,
and social welfare.
3. Adequate safeguards to human life and health
This relies on integrated health facilities and services, and responsive emergency services.
4. Collective identity and mutual support
This is observed as active community engagement, strong social networks and social integration.
5. Social stability and security
This includes law enforcement, crime prevention, justice, and emergency management.
6. Availability of financial resources and contingency funds
This is observed in sound management of city finances, diverse revenue streams, and the ability
to attract business investment, allocate capital, and build emergency funds.
7. Reduced physical exposure and vulnerability
This relies on environmental stewardship, appropriate infrastructure, effective land use planning
and enforcement of planning regulations.
8. Continuity of critical services
This results from diversity of provision, redundancy, active management and maintenance of
ecosystems and infrastructure, and contingency planning.
9. Reliable communications and mobility
This is enabled by diverse and affordable multi-modal transport systems and information and
communication technology (ICT) networks, and contingency planning.
10. Effective leadership and management
This relates to government, business and civil society and is recognizable in trusted individuals,
multi-stakeholder consultation, and evidence-based decision-making.
112
11. Empowered stakeholders
This is underpinned by education for all, and relies on access to up-to-date information and
knowledge to enable people and organizations to take appropriate action.
12. Integrated development planning
This is indicated by the presence of a vision, an integrated development strategy, and plans that
are regularly reviewed and updated by cross-departmental groups.
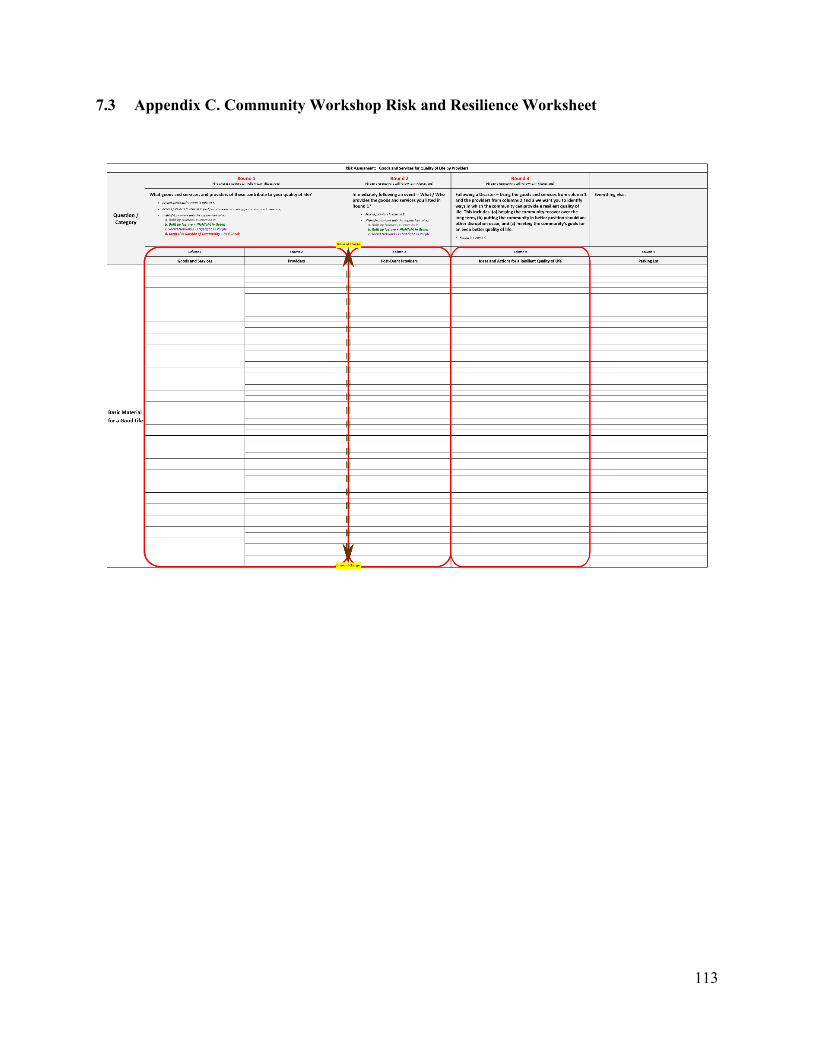
113
7.3 Appendix C. Community Workshop Risk and Resilience Worksheet

114
7.4 Appendix D. Community Workshop Agenda
o Have participants sign in and create a name tag
o Arrange participants into three tables of 5-7 members each:
Basic Material for a Good Life
Health
Security
Good Social Relations
o Welcome: by community official (5 minutes)
o Introductions/statement of purpose/community overview: (15 minutes)
o Round 1 Introduction: (5 minutes)
Explain Goods and Services and Providers
Describe tools: Risk Assessment Sheet and Map
Describe Round 1
o Round 1: (40 minutes total)
Each table conducts an ice breaker where everyone says their name and why
they are there (5 minutes).
Each table will select a team leader who will summarize and present at the
end of team discussions
1. Facilitator asks: Think about what defines your community? What goods and
services and providers of these contribute to your quality of life? (25
minutes)
Give examples of goods and services
Record goods and services in column 1.
Record providers in column 2.
Feel free to draw lines connecting goods and services to providers.
Have the team leader place dots next to what they will talk about.
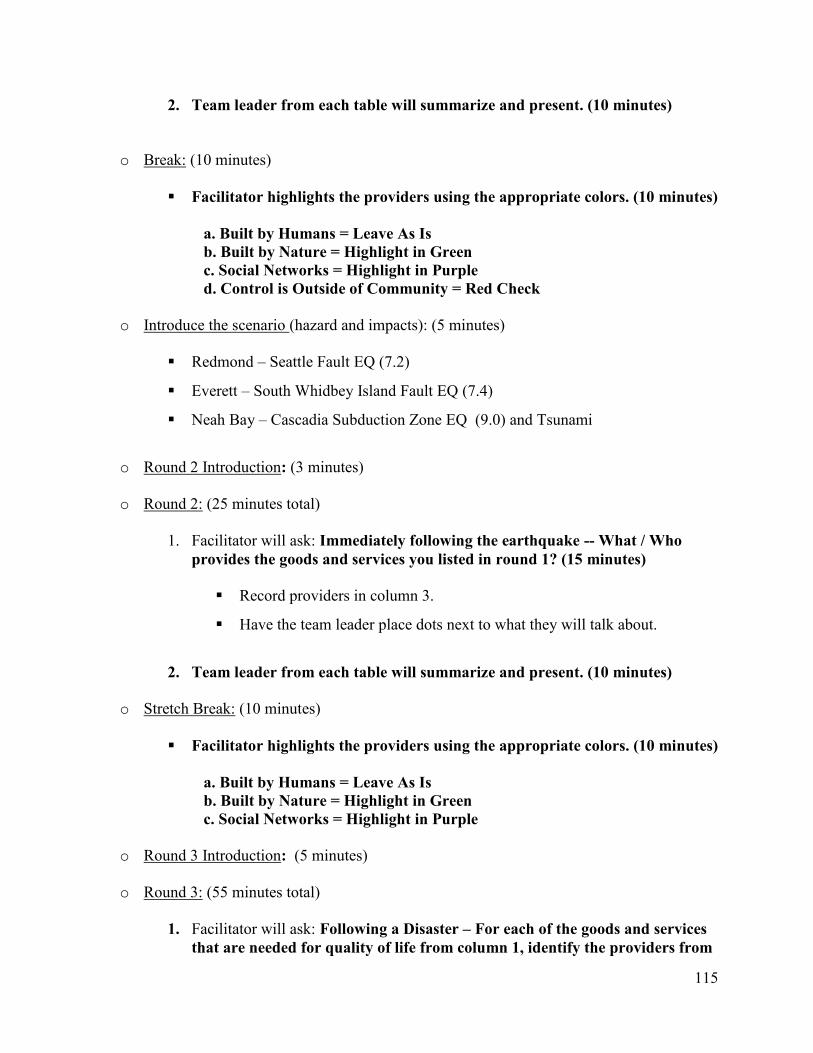
115
2. Team leader from each table will summarize and present. (10 minutes)
o Break: (10 minutes)
Facilitator highlights the providers using the appropriate colors. (10 minutes)
a. Built by Humans = Leave As Is
b. Built by Nature = Highlight in Green
c. Social Networks = Highlight in Purple
d. Control is Outside of Community = Red Check
o Introduce the scenario (hazard and impacts): (5 minutes)
Redmond – Seattle Fault EQ (7.2)
Everett – South Whidbey Island Fault EQ (7.4)
Neah Bay – Cascadia Subduction Zone EQ (9.0) and Tsunami
o Round 2 Introduction: (3 minutes)
o Round 2: (25 minutes total)
1. Facilitator will ask: Immediately following the earthquake -- What / Who
provides the goods and services you listed in round 1? (15 minutes)
Record providers in column 3.
Have the team leader place dots next to what they will talk about.
2. Team leader from each table will summarize and present. (10 minutes)
o Stretch Break: (10 minutes)
Facilitator highlights the providers using the appropriate colors. (10 minutes)
a. Built by Humans = Leave As Is
b. Built by Nature = Highlight in Green
c. Social Networks = Highlight in Purple
o Round 3 Introduction: (5 minutes)
o Round 3: (55 minutes total)
1. Facilitator will ask: Following a Disaster – For each of the goods and services
that are needed for quality of life from column 1, identify the providers from

116
columns 2 and 3 that would do ALL of the following: (a) best help the
community recover over the long term, (b) put the community in better
position should another disruption occur, and (c) meet the community’s goals
for an even better quality of life. (15 minutes)
Record in column 4.
If you think of any providers that do not yet exist, list them in column 5,
the “Parking Lot”.
2. Break into World Café where each team rotates clockwise (except for the
team leader) every 10 minutes until all teams have participated at all tables
(20 minutes)
Have the team leader place dots next to what they will talk about.
3. Team leader from each table will summarize and present. (10 minutes)
o Evaluations: Pass them out
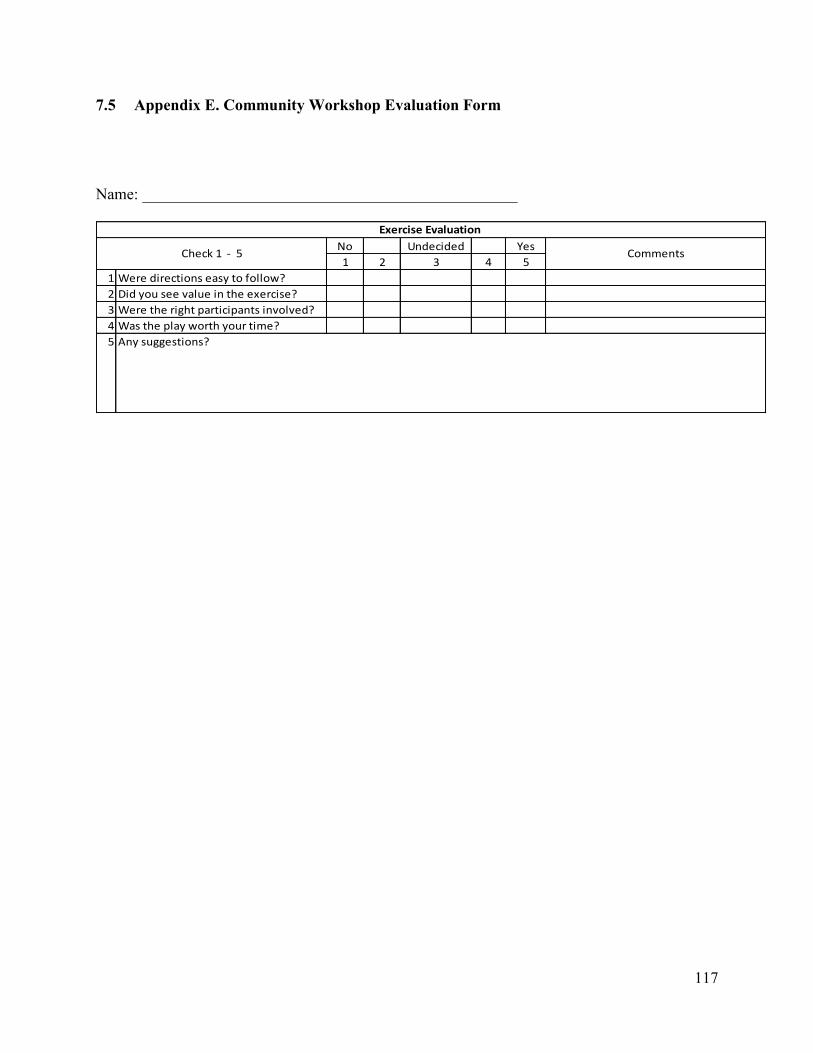
117
7.5 Appendix E. Community Workshop Evaluation Form
Name: _______________________________________________
No Undecided Yes
1 2 3 4 5
1 Were directions easy to follow?
2 Did you see value in the exercise?
3 Were the right participants involved?
4 Was the play worth your time?
Comments
Any suggestions?
Check 1 - 5
Exercise Evaluation
5

118
7.6 Appendix F. Summary of Community Workshop Model Results 161
Item Redmond Everett Neah Bay
Reliance on
Institutions for
basic materials
vital for HWB
Institutional (governmental or large-scale
commercial) providers of HWB would be less
reliable and most businesses would be
unreliable or run out of supplies post-
earthquake;
Would rely very little upon
the traditional providers
(built capital) and take the
opportunity to go back to
traditional ways of living
with the land; including
hunting and gathering, and
traditional ways of
education;
Reliance on
family, friends
and neighbors
post-disruption, would rely upon immediate
neighbors, family and friends, neighborhood-
based organizations, the less formal networks
that support them, and decentralized
infrastructure;
the community has a
tighter and better organized
informal social structure
that allow for
communication,
improvisation and
flexibility;
Reliance on
social networks
post-disruption, would rely very little upon
traditional providers (built capital) and
overwhelmingly upon social networks (social
capital) for goods and services;
post-disruption, would rely
more upon social networks
(social capital) for goods
and services and very little
upon traditional providers
(built capital);
Multifunctional
facilities
the multifunctional adaptability of some
institutional facilities enhanced their
importance post-disruption;
the tribe already moved
some of their critical
multifunctional facilities
above the tsunami
inundation zone and have
plans to move other critical
buildings and services in
coming years;
Change in
institutional
roles
institutions that were listed as important
providers of one type of good or service
before the disruption would provide
alternative goods and services; e.g. churches
and schools for shelter and food distribution;
trails for alternative access; parks for shelter
(camping) and assembly etc.;
there was Implicit
concurrence but changes in
institutional roles was not
mentioned directly;
161 Institute for Hazards Mitigation Planning and Research, University of Washington. Whole Community
Resilience: An Asset-Based Approach to Enhancing Adaptive Capacity Before a Disruption - Final Report. Federal
Emergency Management Agency, 2014. 33.

119
Redundancy /
Relocation of
services
a clear need for
distributed system
redundancy,
including increased
self-sufficiency and
diversification of
facilities and services
through the creation
or strengthening of
neighborhood centers
outside of
liquefaction areas;
distributed system
redundancy by
locating goods and
services in more
accessible areas post-
event, and increased
self-sufficiency and
diversification of
facilities and services
through the creation
or strengthening of
neighborhood centers
outside of high risk
areas;
already relocated some of
their critical buildings and
services above the tsunami
inundation zone and have
plans to move other critical
buildings and services in
coming years;
Alternative
routes
need safer alternate
transportation routes
that increase
connections between
the hilly areas;
need for safe
alternative routes and
links to surrounding
areas to mitigate
post-distruption
isolation and
consequently longer
recovery times;
need safer alternate
transportation routes, due
to having only one way in
and one way out; e.g.
improving existing logging
roads;
Walkability
neighborhood centers
should be walkable
from most residences,
via trails and
walkways that
improve accessibility;
neighborhood centers
should be walkable
from most
residences;
community does regular
tsunami drills, thus a need
for walkable access;
Need for
community
nodes / centers
new neighborhood
centers should
include branch
municipal services,
healthcare and
emergency medical
facilities, food and
water sources such as
community gardens,
shopping for daily
necessities; places for
both programmed and
spontaneous
gatherings; and multi-
functional space to
accommodate the
different
programmatic ideas
neighborhood centers
should include
branch municipal
services, healthcare
and emergency
medical facilities,
food and water
sources such as
community gardens,
shopping for daily
necessities, places
for both programmed
and spontaneous
gatherings, and
community caches of
emergency supplies,
such as medicine,
food and water;
central facilities outside the
tsunami inundation zone
would contain community
caches of emergency
supplies such as medicine,
food and water;
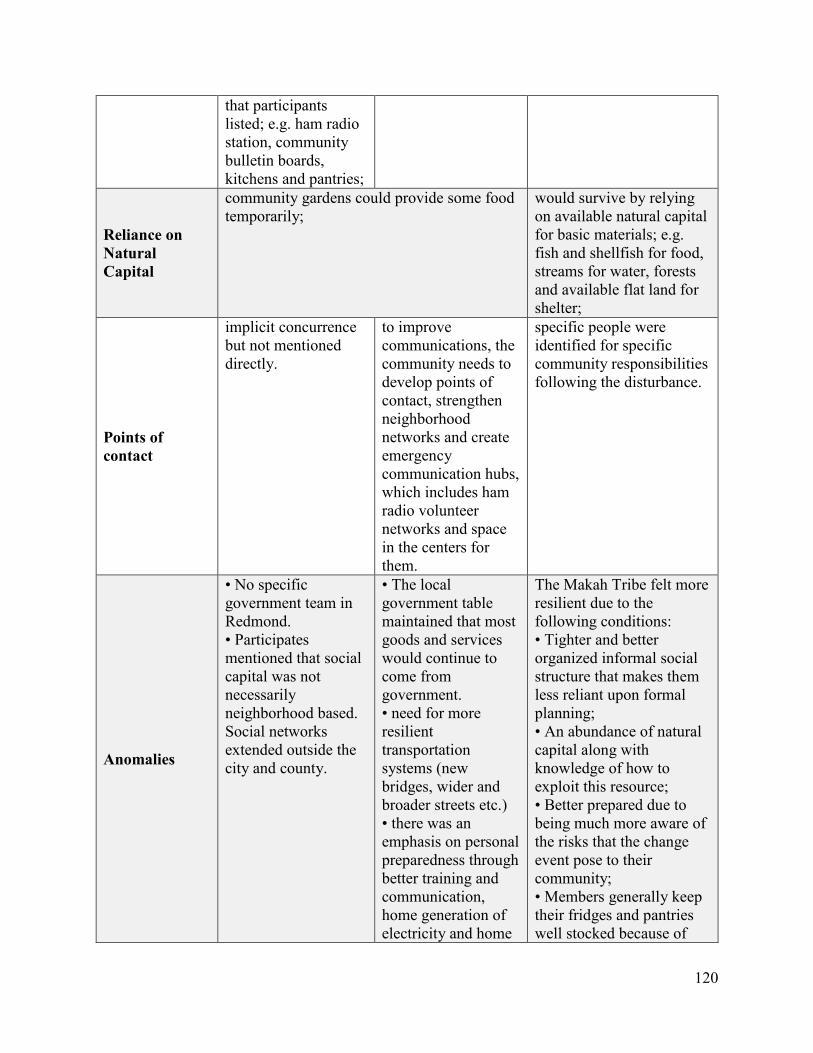
120
that participants
listed; e.g. ham radio
station, community
bulletin boards,
kitchens and pantries;
Reliance on
Natural
Capital
community gardens could provide some food
temporarily;
would survive by relying
on available natural capital
for basic materials; e.g.
fish and shellfish for food,
streams for water, forests
and available flat land for
shelter;
Points of
contact
implicit concurrence
but not mentioned
directly.
to improve
communications, the
community needs to
develop points of
contact, strengthen
neighborhood
networks and create
emergency
communication hubs,
which includes ham
radio volunteer
networks and space
in the centers for
them.
specific people were
identified for specific
community responsibilities
following the disturbance.
Anomalies
• No specific
government team in
Redmond.
• Participates
mentioned that social
capital was not
necessarily
neighborhood based.
Social networks
extended outside the
city and county.
• The local
government table
maintained that most
goods and services
would continue to
come from
government.
• need for more
resilient
transportation
systems (new
bridges, wider and
broader streets etc.)
• there was an
emphasis on personal
preparedness through
better training and
communication,
home generation of
electricity and home
The Makah Tribe felt more
resilient due to the
following conditions:
• Tighter and better
organized informal social
structure that makes them
less reliant upon formal
planning;
• An abundance of natural
capital along with
knowledge of how to
exploit this resource;
• Better prepared due to
being much more aware of
the risks that the change
event pose to their
community;
• Members generally keep
their fridges and pantries
well stocked because of

121
storage of water;
• disaster information
and preparedness
training should be
disseminated within
neighborhoods and
implemented in k-12
school curriculum,
with the help of
increased translation
capability;
• the Incident
Command Structure
should be brought to
the neighborhood
level;
• a standard disaster
language and
vocabulary should be
developed;
• neighborhood
centers would also
include decentralized
energy districts.
their remoteness;
• All homes have a
secondary heat source-
wood stove or propane;
• Community does regular
tsunami drills;
• The change event is seen
as an opportunity to go
back to traditional ways of
living with the land and
education, rather than a
catastrophe causing
displacement, and;
• Because of the above
mentioned, the Makah
would survive, as they
have in this area for
thousands of years.
122
7.7 Appendix G. Draft Article Submission to JAPA
Whole Community Resilience: An Asset-Based Approach to Enhancing Adaptive Capacity
before a Disruption
Submission to “Building Back Better,” JAPA Special Issue on Disaster Planning
Robert Charles Freitag, Daniel Benjamin Abramson, Manish Chalana, Maximilian Dixon
University of Washington, Seattle
April 22, 2014
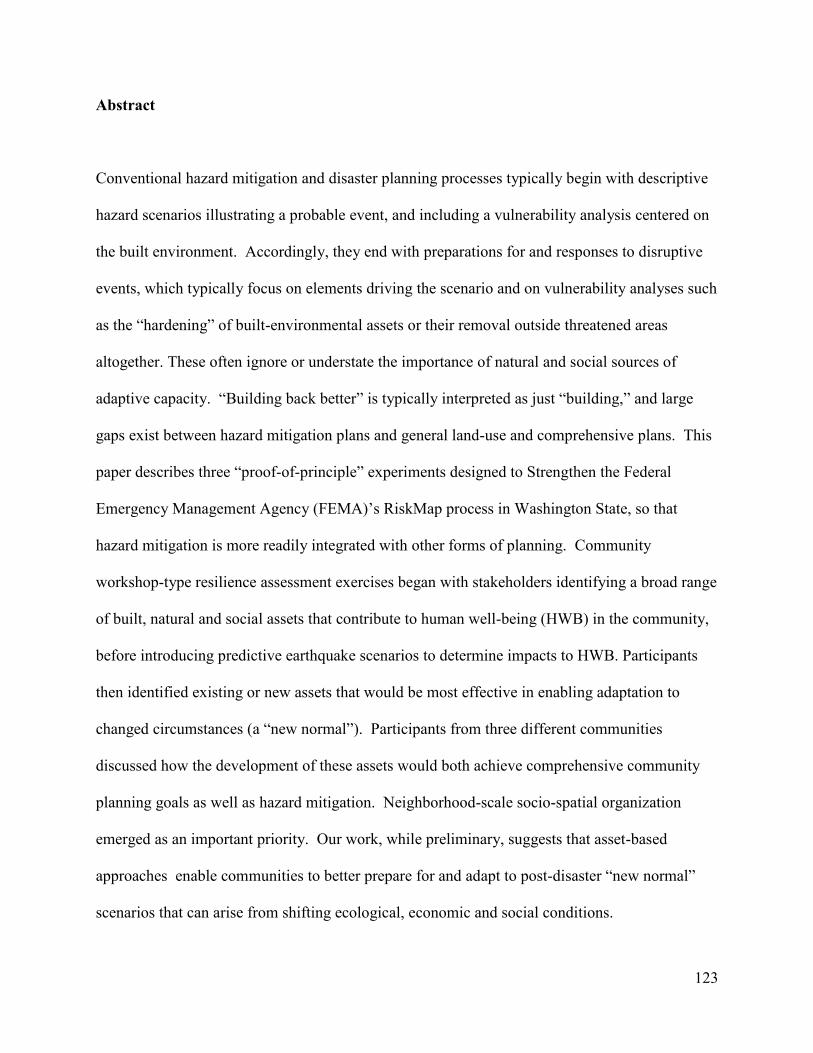
123
Abstract
Conventional hazard mitigation and disaster planning processes typically begin with descriptive
hazard scenarios illustrating a probable event, and including a vulnerability analysis centered on
the built environment. Accordingly, they end with preparations for and responses to disruptive
events, which typically focus on elements driving the scenario and on vulnerability analyses such
as the “hardening” of built-environmental assets or their removal outside threatened areas
altogether. These often ignore or understate the importance of natural and social sources of
adaptive capacity. “Building back better” is typically interpreted as just “building,” and large
gaps exist between hazard mitigation plans and general land-use and comprehensive plans. This
paper describes three “proof-of-principle” experiments designed to Strengthen the Federal
Emergency Management Agency (FEMA)’s RiskMap process in Washington State, so that
hazard mitigation is more readily integrated with other forms of planning. Community
workshop-type resilience assessment exercises began with stakeholders identifying a broad range
of built, natural and social assets that contribute to human well-being (HWB) in the community,
before introducing predictive earthquake scenarios to determine impacts to HWB. Participants
then identified existing or new assets that would be most effective in enabling adaptation to
changed circumstances (a “new normal”). Participants from three different communities
discussed how the development of these assets would both achieve comprehensive community
planning goals as well as hazard mitigation. Neighborhood-scale socio-spatial organization
emerged as an important priority. Our work, while preliminary, suggests that asset-based
approaches enable communities to better prepare for and adapt to post-disaster “new normal”
scenarios that can arise from shifting ecological, economic and social conditions.

124
Key words: Resilience, Risk Assessment, Disaster Recovery, Scenario Planning, Hazard
Mitigation, Social Capital.
Introduction: The Problem
“We need stronger neighborhoods, increased walkability, greater sense of place, mixed
land uses, closer neighbor and family ties and trust”– these were some of the conclusions from a
recent series of community tabletop exercises held in the Washington State cities of Redmond,
Everett and Neah Bay. These outcomes would be expected if the exercise focused on Smart
Growth, but here community stakeholders were addressing earthquake risks. Individuals did
mention a need for the usual earthquake mitigation measures such as retrofitting or strengthening
key structures and infrastructures, developing redundant energy sources and improving general
emergency response capacity, but those did not drive the concluding discussions. Rather, a new
approach to discussing earthquake risks that began with an inventory of community assets –
built, natural and social “capital” – instead of emphasizing vulnerabilities, prompted this
different response from stakeholders largely familiar with emergency preparedness. The
experience holds promising lessons for efforts to better integrate disaster planning with general
land use and community planning for everyday betterment and well-being in a broad sense – a
goal that has proven both alluring and elusive to disaster planners in recent years (Pearce, 2003;
Wamsler, 2006).
Conventional disaster and hazard mitigation planning views the mitigation-preparation-
response-recovery sequence in linear terms, dependent on an ability to predict events and their
125
impacts, largely in order to preserve or restore pre-event conditions (Beatley, 2009, pp. 6-8).
Such planning is typically driven by a vulnerability analysis. The direct association of
vulnerability reduction with resilience underlies the FEMA National Mitigation Framework. In
the Framework FEMA suggests that long-term vulnerability reduction is achievable when
communities and businesses “build and sustain resilient systems, communities, and critical
infrastructure and key resources lifelines to reduce their vulnerability to natural, technological,
and human-caused incidents by lessening the likelihood, severity, and duration of the adverse
consequences related to the incident”(National Mitigation Framework 2013, p. 24).
Recent efforts to incorporate sustainability into the goals of community disaster recovery
recognize that restoration of the status quo ante is practically impossible and often socio-
ecologically undesirable (Paton & Johnston, 2006, pp. 7-8; Smith & Wenger, 2007). “Hazards”
are more constructively viewed as uninvited by potentially important “change agents,” and
“resilience” describes the capacity to adapt to change, rather than to “bounce back” from it
(Davoudi, 2012; Norris, Stevens, Pfefferbaum, Wyche, & Pfefferbaum, 2008). “Adaptive
capacity” is the ability to respond to a disruption by adjusting to a new normal, and to “build
back better,” where “better” is defined according to community cultural and social values and
principles of sustainability (Chan et al., 2012; Millennium Ecosystem Assessment [Program],
2005). Adaptive capacity may be revealed only after a disruption, but it develops in the course of
a community’s ongoing development, based on social strengths, self-organization, and
connection to place (Berkes & Ross, 2013).
Some progress has been made towards integrating hazard mitigation into other types of
planning through the mandating of mitigation elements in comprehensive plans, and through
incorporation of best practices and techniques of mitigation in zoning codes, subdivision codes

126
and other instruments (FEMA, 2013; Schwab, 2010). However, there is still a need to enable
greater stakeholder participation in creative discussions around even better mitigation practices,
and to relate such practices to communities’ overall development policies and unique
environmental and socio-economic conditions, especially given the ever-changing nature of the
hazards themselves.
The applicability of more adaptive approaches is relatively well established for situations
of gradual change, or for extreme but more predictable and spatially limited hazards such as
flooding (Alberti, 2008; Burkett, 2012, p. 23ff; Freitag, Bolton, Westerlund, & Clark, 2009). In
contrast, events such as earthquakes and their associated hazards present unique challenges to
planned adaptation; they are diffuse in their impacts, relatively rare, and have exceptionally short
warning time frames and extremely high consequences (Burby, 1998, p. 150). Communities
continue to have great difficulty incorporating predictive scenarios of this kind of risk into an
adaptive planning process in advance of an event (Lee, Preston, & Green, 2012), especially when
the process begins with a scenario of destruction and an effort to identify vulnerabilities
(Orchiston, 2011). In such a setting, community members are prone to find the exercise
discouraging in general and to focus only on their immediate response to the emergency,
defining its effects primarily in terms of impact on the physical environment. Emergency
managers frequently have difficulty achieving broad and extensive participation of community
stakeholders in these exercises, as well as in coordinating mitigation strategies with the
community’s general policies and plans for development. The conventional focus on the
community’s physical, built assets exacerbates this challenge, particularly when it ignores non-
material social and cultural capital and values, and related ecosystem services (Aldrich, 2012;
Stokols, Lejano, & Hipp, 2013).
127
An Appreciative Inquiry Approach to Using Hazard Scenarios in Participatory Adaptive
Planning
This paper presents substantive findings from an abbreviated set of predictive scenario
planning exercises, in which the main goal was to highlight the specifics of local assets that
could promote Human Well-Being (HWB) and adaptive capacities. The approach de-emphasizes
the specifics of the risk scenario itself. Instead, it prompts stakeholders to link or compare
comprehensive planning goals on the one hand, and existing potential mitigation and adaptation
strategies on the other. The approach differs even from other asset-based methods that focus on
asset protection rather than on adaptive capacity (e.g. Siembieda, 2010). The Federal Emergency
Management Agency (FEMA) provided funding for these exercises as part of a project to
explore new ways to increase community participation in the FEMA RiskMap discovery process,
and to better integrate RiskMap into communities’ on-going land use planning. Specifically,
FEMA sought to introduce the risk reduction conversation earlier in the process and motivate
people to see it as part of their daily lives.
Unlike most risk assessment efforts, our protocol does not begin with presentations of
exposure and vulnerability. Rather, our approach first asks participants to list the sources of
HWB in their community. What do they like about their community? What makes their
community unique? What brings them joy? Only then do we present the hazard, or “change
agent,” for discussion on how the community might prepare for it, respond to it, recover and
rebuild.
128
In some ways our approach can be compared to the “Roadmap for Adapting to Coastal
Risk” (NOAA Coastal Services Center, 2012), which has participants develop a profile of “the
local population” (“societal”), “the built environment” (“infrastructure”) and “important natural
resources” (“ecosystem”). However, the NOAA approach begins by describing a hazard
scenario in detail first, and seeks primarily to identify vulnerabilities as well as strengths, in the
context of that specific hazard scenario. Our approach differs significantly in that we present the
hazard or “change agent” only after the participants have profiled the unique attributes of their
respective communities using HWB categories. Instead of cataloging dysfunctions or
vulnerabilities, we ask questions that then lead from the community’s strengths.
In effect, we are applying principles of asset-based community development to disaster
planning (Green & Haines, 2012), specifically the idea that creative thinking leads from strength-
based positive approaches to inquiry and action, as expressed in the Appreciative Inquiry model
(AI) (Emery & Flora, 2012). Our application of AI principles is with the recognition that, in the
words of Cooperrider:
“we are still in our infancy in understanding non-deficit, strength-based or life-centric
approaches to change. William James called for it back in 1902, in Varieties of Religious
Experience, when he said we know a lot about the kind of change that happens when
people feel threatened, feel fear and violence is coming at them, but we don’t know much
about the kind of change that happens when, in his words, ‘everything is hot and alive
within us and everything reconfigures itself around it’ (Cooperrider, 2012).
129
This project was specifically designed to explore what happens when the focus is on things “ hot
and alive” – how this more positive emphasis and sequence of discussion can prompt ideas for
disaster response that are more adaptive than is usually the case in hazard mitigation planning
exercises.
We are also interested in how a broader, more balanced and integrative consideration of
different types of assets – i.e. not just built, but also natural and social capital – can prompt more
adaptive thinking. Communities rely on goods and services provided by built, natural and social
capital in varying degrees and at different times. Capital typologies differ; for example, Green
and Haines (2012) categorize community assets as physical, human, social, financial,
environmental, political, and cultural capital. We draw our simpler classification from the
Millennium Ecosystem Assessment literature (Millennium Ecosystem Assessment [Program],
2005) and particularly from Mulder et al. (2006), leaving out human capital (“personal growth
and development”), and define the remaining three categories as follows:
1. Built Capital: Things built by humans for rather specialized purposes, and with
significant ecological footprints. Examples include bridges, buildings, dams and
machinery.
2. Natural Capital: Environmental features that yield a flow of ecosystem services and
tangible natural resources. Examples include forests, wetlands, mangroves, soil, sand
dunes, agriculture and fossil fuels.
3. Social Capital: Networks and associations of human relationships, based on mutual trust,
common interest or particular skills. Examples include service providers, regular festivals
and gatherings, clubs and faith-based organizations.

130
These categories are not exclusive. Most assets can be associated with more than one
type of capital depending on its actual use. A park, for example, might normally be considered a
source of natural ecosystem services, but if it is substantially engineered for a special physical
purpose (as in a baseball field), it might be considered “built”; or, if it functions primarily as a
gathering place or festival venue (as in a farmers market), it might be considered “social.” The
classification mainly allows us to see how the quality of life provided by one type of asset or
capital under current conditions might be provided by a different type under changed conditions
after a disruption. Since this interchangeability may not be evident on its face, we hoped to
discover this capacity and make it explicit in discussion.
The project is based on workshop exercises with three Washington State communities:
Redmond, Everett and Neah Bay. In all three communities, the project team had previously
worked with local community members on hazard mitigation planning. The project was framed
as action research, intended to assist the communities with on-going planning, as well as yield
useful findings for broader FEMA policy and academic understanding. Officials advertised the
workshops to their existing networks of stakeholders in hazard mitigation planning. Participants
were therefore not any more representative of the entire community than these stakeholder
networks already were, especially in the larger and more diverse cities of Redmond and Everett.
The objective of the workshops was to test the new format for discussion among people who are
already familiar with emergency and disaster planning. This, of course, limited the perspectives
and probable responses of participants to a narrower range than might be found in the general
public. On the other hand, the participants were not necessarily used to thinking explicitly about
their community’s whole quality of life in the context of hazard mitigation planning.
131
In all three participating communities, comprehensive and other overall planning
documents lacked explicit discussion of hazard mitigation elements. We recognized that
comprehensive plans attempt to express a consensus and often avoid controversial measures. In
this exercise, we expected to find some disagreement regarding the definition of “better” in
discussions of how to “build back better”; we were surprised by the level of enthusiastic
agreement that we actually observed.i
The community meetings were held in Redmond in September 2013, Everett in October
2013, and Neah Bay in January 2014. Findings from the three workshops are reported and
discussed below.
Exercise Procedure
The exercise consisted of three rounds of discussion (which we refer to as “play”) lasting
a total of 2.5 hours. Responses were recorded on a prepared template (Figure 1). Community
maps were provided for spatial reference, and participants were encouraged to make notes on the
maps. After introduction by a local official, the lead facilitator described the purpose of the
exercise as a pilot effort that offered a different way of identifying risks. Risk was defined as the
chance that a community would not be resilient to a change such as an earthquake. The
definition of resilience was adapted from Walker and Salt (2012), where resilience is defined as
the capacity of a community to absorb change from an event, and retain its identity while
reorganizing to provide goods and services necessary for quality of life.
132
In order to focus the discussion, participants were divided into groups that corresponded
to Millennium Ecosystem Assessment (MA) categories of goods and services for HWB,ii
including: basic material for a good life; health; security; and good social relations (Millennium
Ecosystem Assessment [Program], 2005)iii. A facilitator from the project team was assigned to
prompt each group for ideas focused on the group’s assigned MA category of goods and
services.
Round One (“pre-disruption”) began with a brief presentation of the community’s overall
socio-economic and spatial profile, including information gathered primarily from
comprehensive planning and mitigation plan documents. Community profiles were presented in
HWB categories to prepare participants for group discussion within these HWB subject areas.
Participants then characterized their community in terms of the goods and services that constitute
its quality of life, and the sources and providers of those goods and services. Goods and services
included essential material things or activities like “water,” “exercise” and “medicine”; non-
material things like “information” and “cultural expression”; and combinations of material and
non-material things like “refugee services” and “social gathering over food.” Sources and
providers were specific to the community or its surroundings and could be located on a map,
though they could also include spatially dispersed or mobile organizations or networks. At the
end of the round, participants circled the three to five most important sources/providers, and
placed a red check alongside the sources/providers that were completely outside of community
control. Facilitators also highlighted each source/provider as essentially a form of either “built,”
“natural” or “social” capital, depending on the purpose mentioned by the participants. Then each
group assigned a spokesperson to present highlights to the room.
133
Round Two (immediately post-disruption) began with the introduction of a
hazard/change agent. In our cases, an earthquake scenario highlighting the maximum probable
event was used as the change agent, although the particular earthquake event modeled varied
based on locality: a Seattle Fault earthquake in Redmond, a South Whidbey Fault event in
Everett, and a Cascadia Zone event in Neah Bay. For Redmond and Everett, the impacts were
modeled using HAZUS simulation software using local data and largely drawn from preexisting
Hazard Mitigation Plans.
The simulation was presented broadly, describing general types of impact experienced by
different neighborhoods across the city based on their building stock, infrastructure service,
accessibility, and soil conditions given magnitude of shaking. The presentation does not
describe site-specific impacts, except for the probabilities of disruption to key facilities such as
highways, hospitals and fire and police stations. Participants then discuss how, during the week
or so following the earthquake, they would obtain (i.e. through what sources and providers) the
goods and services they identified during Round One. Participants could add to the initial lists of
goods/services and sources/providers at any time during the exercise.
Round Three (“new normal”) began with an introduction to the concept of “re-visioning”
the community so that it represents a new normal (i.e. “acknowledges irreversible change”), has
greater resilience (i.e. “is more adaptable to change”), and reflects common [local] values, goals
and aspirations for quality of life. The lead facilitator then presented generalized publicly vetted
community goals and objectives, as laid out in the comprehensive plan, hazard mitigation plan
and/or other key policy documents. Participants were encouraged to consider the implicit values
and explicit goals and strategies reflected in these documents, and to think of new strategies that
might occur to them based on the previous rounds of discussion, but the facilitator took care not
134
to suggest specific measures and plan recommendations. Participants then reviewed the sources
and providers of quality of life that they listed in the earlier rounds, and identified those that
would (a) best help the community recover from the modeled disruption over the long term; (b)
put the community in better position should another disruption occur; and (c) meet the
community’s goals for an even better quality of life. Participants also added new
sources/providers that would increase community resilience but could be implemented as part of
a non-recovery evolutional planning process.
Finally, at the end of Round Three, the groups rotated from table to table according to a
World Café procedure: Members from each team, minus each team’s reporter who remained at
the original table, moved to another table where they were briefed by that table’s team reporter,
and then could add a new perspective from different HWB categories to concepts generated by
the original team. After about 15 minutes, all teams rotated to yet another table and repeated the
activity. The exercise concluded with each table reporting back to the full room, and then each
participant filling out individual forms evaluating the exercise itself.
Relevant Characteristics of the Project Communities and their Participants
Certain characteristics of the three communities that participated in the project so far
provide important background for interpretation of the workshop results.
Redmond is a suburb of Seattle that has grown quickly from a small agricultural railroad
town to a polycentric incubator for high-tech industry. While the campuses for such firms as
Microsoft and Nintendo have significant physical footprints, we expected the community overall

135
to be more reliant on the “social capital” of software and social media networks that reach
beyond the built environment of Redmond, than on the “built capital” of physical infrastructure.
Microsoft in particular has a sophisticated comprehensive system for maintaining operations
globally given the threat of disruption at its headquarters in Redmond or at other important
centers.
Redmond’s residential population is smaller than its employee population, and residents
are on average young, well-educated recent arrivals in the city, many of them immigrants from
Asia. The city’s commercial downtown lies on vulnerable alluvial soils in a valley prone to
flooding and liquefaction during an earthquake, but is also rapidly densifying with mixed-use
multifamily housing and retail, as well as an extensive park and trail system. On the more
seismically stable surrounding hills, single-family housing predominates in single-use residential
neighborhoods, with some large office parks and industry (the Microsoft campus is on one of the
hills). For the most part the upland residential areas have no walkable retail or neighborhood
services. The city’s comprehensive plan, Redmond 2030, calls for extending the trail system to
connect residential communities and creating limited mixed use areas within existing residential
communities (City of Redmond, 2011). The hazard mitigation plan notes that these communities
may be isolated following an earthquake.
The Redmond workshop exercise took place in the police training center, and involved 24
participants, including a city councilor, a city planner, a risk management official for the school
district, a security consultant for Microsoft, and a number of Community Policing Advisory
Board members, Community Emergency Response Team (CERT) trainees and resident members
of the general public. The event that we modeled consisted of a magnitude 7.2 Seattle crustal
fault earthquake, which included greatest damage from shaking to the Overlake neighborhood,

136
home to Microsoft’s main campus as well as strip-type automobile-oriented commercial areas. It
also included damage from shaking as well as liquefaction that would disable most of the public
and commercial facilities in the downtown. Access to the nearest large urban centers of Bellevue
and Seattle would likely be compromised.
Everett is an established industrial center along the Interstate-5 (I-5) expressway corridor
that runs the full north-south length of the U.S. West coast. Since it is home to one of Boeing’s
largest aircraft plants as well as an important naval base, we expected the community to rely
most heavily for quality of life on the “built capital” of its specialized physical infrastructure.
The population of Everett is largely working-class, and ethnically diverse, with a substantial
number of refugees and other recently arrived immigrants. The city’s pre-war central business
district and older residential neighborhoods of small blocks with sidewalks are located at the tip
of a peninsula isolated by Puget Sound to the west and the Snohomish River delta to the east,
overlooking a port which includes extensive naval facilities. Newer post-war strip development
predominates the main arteries leading from the expressway to the central business district. The
large Boeing plant has its own connection to the expressway, but is otherwise surrounded by
newer residential areas. These are primarily single-use neighborhoods of single-family housing
on loop roads and cul-de-sacs with few sidewalks. The more expensive homes occupy a coastal
bluff and more modest homes the interior. Everett’s 2025 Comprehensive Plan calls for
improving the marina and for urban expansion up to the edge of the Snohomish floodplains in
the north and northeast (City of Everett, 2005). The hazard mitigation plan addresses
vulnerabilities associated with the older building stock and isolation of the coastal
neighborhoods, and provides guidance for construction within coastal hazards areas.
137
The Everett exercise also took place in a police station, and involved 33 participants
including representatives from a wider array of public, private and non-profit entities than those
who had attended the Redmond workshop. Everett participants included representatives from a
host of municipal departments, including city planning, neighborhoods, economic development,
police, fire, housing authority, transit and utilities; elderly, social work and social service
agencies; a legislative aid; and representatives of industries, including Boeing, Puget Sound
Energy, and insurance and real estate companies. In Everett, we modeled an event entailing a
7.4-magnitude earthquake on the South Whidbey Island crustal fault. This included greatest
damage from shaking in the area of the Boeing’s Everett plant and residential neighborhoods to
its northwest, south and southeast, and damage from liquefaction and unstable soils throughout
the Snohomish River valley and estuary. The I-5 corridor would likely be compromised both
north and south of the city, and older structures in the city center would experience widespread
damage.
Based on participant feedback and more extensive follow-up meetings with the
community hosts for Everett (who had observed the first exercise in Redmond), we made some
modifications to the exercise protocol for the Everett exercise. We clarified our instructions, and
reduced the time we spent describing the community profiles, the disruption scenario, and
existing comprehensive plan and hazard mitigation plan provisions. This allowed more time for
discussion in Everett and, later, in Neah Bay.
Neah Bay is a small 865-resident (2010 census) coastal community located on Makah
Tribal lands on the Olympic Peninsula. Home to one of the largest tribal marine fisheries in the
138
U.S., and with its forest resources and emerging eco-tourism industry, it exemplifies a
community that relies heavily on “natural capital.”
Located at the most northwesterly tip of the 48 contiguous United States, Neah Bay is an
isolated community. There is only one two-lane road connecting the town with surrounding
communities, and the road is subject to blockage by landslides following heavy rains.
Nonetheless, the community has strong and long-established family and tribal networks, and
relies on this form of capital for quality of life as well as to access its environmental assets.
The exercises in Neah Bay were held in the tribal marina, and organized by the tribe’s
emergency preparedness coordinator. Ten community members participated, including the chief
of police, an elder, an entrepreneur in developing new ecological food products, and other
residents. The exercise was driven by a 9.0 magnitude earthquake event along the Cascadia
Subduction Zone. The scenario included a near tsunami that would wash over much of the
community with a 30-minute to 1-hour warning. The scenario assumed that residents warned by
the shaking ground and knowledge of tsunami threats would evacuate to available high ground.
The event would isolate the community since the only access would be by air or sea. Most built
capital in homes and commercial and government structures would be destroyed. Providers of
food, water and health services would not be functional. The Makah Tribe has been well aware
of the risks that a Cascadia Subduction Zone earthquake and the resulting tsunami pose to their
community, and has already moved some of its critical buildings and services above the tsunami
inundation zone. With plans to move other critical buildings and services in coming years, the
community also practices regular tsunami drills. Within the previous two years, the community
has undertaken both a general hazard mitigation plan as well as a plan for new tsunami vertical
evacuation facilities.
139
During the day of the scheduled exercise there was a conflicting community activity
which required the exercise play to be shortened by ½ hour, and the smaller number of Neah Bay
participants allowed for only two HWB teams of 5 – 6 each. The social relations team was
combined with health, and the basic materials team was joined with the security team. The
smaller number of participants also allowed us to dispense with the World Café round. The
project team did not feel that this detracted from the ability of the participants to identify
providers of goods and services for the three rounds of play, and to consider the tribe’s recent
mitigation plans in light of existing community social and economic development plans.
Exercise Results
A number of clear themes emerged from participant discussions in the three exercises (refer
to Figure 3).
The first three themes below characterized the Rounds One and Two discussions (pre- and
immediate-post-disruption sourcing of quality of life, respectively):
1. Institutional (governmental or large-scale commercial) sources/providers of HWB in normal
circumstances would be less reliable in the immediate aftermath of the simulated earthquake.
Regardless of which theme served as the focus for their discussion group (i.e. basic materials,
security, health or social relations), participants listed many institutional sources/providers as
necessary for quality-of-life goods and services under current normal conditions. These
included schools, buses, hospitals, chain supermarkets, city housing and social service
agencies, radio stations, and major arenas for recreational and cultural activities. After the

140
disruption all groups focused on listing immediate neighbors, neighborhood-based
organizations and the less formal networks supporting them, as well as more decentralized
infrastructures for information dissemination (ham radios), water (cisterns), food (backyard
and neighborhood groceries), and movement (walking or individual forms of movement as
opposed to transit). Participants assumed that most businesses would be unreliable or run out
of supplies in the immediate aftermath of an earthquake. However, in contrast to the urban
communities of Redmond and Everett, participants in Neah Bay felt comfortable that more
traditional food and shelter providers would be available through exploitation of natural
capital (fishing, shellfish and forest wildlife) and social relations (friends and family
resources).
2. The multifunctional adaptability of some institutional facilities enhanced their importance
after the simulated earthquake. Institutions that were listed as important providers of one type
of good or service before the disruption (churches/mosques/temples for worship, schools for
education, and trails, parks and arenas for recreation) became important for other purposes
after the disruption: e.g. churches/mosques/temples and schools for shelter and food
distribution; trails for movement when roads are broken; parks for shelter (camping) and
refuge/assembly; arenas for shelter, assembly and information.
3. Decentralized technology and infrastructure systems were seen as useful mainly as part of a
localized communitarian response, though participants in Redmond felt this response could
extend beyond the immediate community through social media networks. Participants in
Neah Bay felt that the informal structure of their community networks made them more

141
resilient and less reliant on formal planning. In particular, they spoke of the sharing of
housing and food as a reliable cross-community asset for survival in the immediate aftermath
of the disruption. Participants in all workshops discussed alternatives to large centralized
systems, but primarily in the context of reliance on neighbors and social networks rather than
through an individualistic “prepper” response.
For the Round Three discussion on how to increase adaptive capacity in anticipation of a
“new normal,” the themes listed above emerged in the following ways:
4. There was clear consensus that the creation or strengthening of neighborhood centers would
be one of the most effective means of putting residents in a better position should an
earthquake occur. Neighborhood centers should be walkable from most residences, and
include branch municipal services, healthcare and emergency medical facilities, grocery and
other shopping for daily necessities, and places for both programmed and spontaneous
gatherings. If necessary, zoning codes should be changed to accommodate the mixing of
uses and building types necessary to develop such centers. The consensus was expressed
both within each table group (i.e. in the context of discussing just one of the four MA
categories of HWB), as well as in the mixed-category discussions generated by the World
Café-style rotation among tables.iv At the time of the Neah Bay exercise, the community had
already begun considering moving community centers and gathering places to high ground.
Since most new housing on the reservation has been built in two hillside neighborhoods that
would be isolated from each other in the event of a tsunami, there was considerable
discussion about how to strengthen these neighborhoods’ self-sufficiency.
142
5. There was also a broad consensus that programming of space and activities on a
neighborhood scale should have the goal of building trust and increasing communication
among neighbors. Specific programmatic ideas varied among the three exercises and the
various table groups, but ideas that came up in multiple settings included: organization of
amateur ham radio or walkie-talkie operators to be able to coordinate and communicate with
neighbors in an emergency event; translation services and “universal” symbols and guides for
multilingual communities; time-banking or mutual aid of needed skills such as home repair;
community gardening and shared growing, preparation, storage and dispensing of food
(which might take place as regular events even outside of any emergency situation).
6. While natural capital received little attention as a source of goods and services in the urban
communities, residents of Redmond and Everett saw parks and habitat restoration areas as
potential sources of water and even food (wildlife) during an emergency. Participants
recognized how the cleanliness of open water bodies and aquifers took on an added
significance in this perspective. Participants in Neah Bay felt confident that they could
exploit post-event natural capital providers of basic goods and services. Water was available
in existing streams and fish and shellfish normally for export could easily be made available
locally.
7. The built, social and natural capital emphasized separately in the three points above were
largely linked in participants’ comments. New neighborhood centers should include multi-
functional space to accommodate the different programmatic ideas that participants listed.
143
Ham radio volunteers, for example, should be known and accessible to their neighbors, and
could have space in the neighborhood centers, along with community bulletin boards,
kitchens and pantries. Trails and walkways throughout neighborhoods would improve the
accessibility of these facilities to a larger number of residents. Decentralized technologies,
including community gardens in the urban areas and the environmental assets of Neah Bay,
would be accessible through the social capital of neighborhood and family networks.
Evaluations were very positive. Participants in all three workshops were supportive of the
exercise (Figure 4). While changes were made after the workshop in Redmond to both the
Everett and Neah Bay workshop protocols, none of these changes seemed to diminish the
enthusiasm for the activities undertaken or the conclusions reached.
Concluding discussion
The exercises we describe here constitute only a partial “proof of principle” for an asset-
based appreciative inquiry approach to community discussions about potential disasters. Based
on three participating community exercises, we find clear themes that at least provide some
direction for further testing and research. We also find some guidance for efforts to improve
hazard mitigation planning and better integration with general comprehensive planning.
FEMA tasked us specifically to explore new ways to integrate the conversation of
resilience into FEMA’s RiskMap “Discovery” process. Our work suggests that the RiskMap
process would benefit from beginning with questions of HWB and allowing those to drive
144
discussion of community values. These values can be expressed as the providers of HWB goods
and services, prompted by questions in an Appreciative Inquiry mode:
1. What do you like about your community?
2. What helps define the quality of life you value?
3. What community characteristics provide assurance that you and your community will
recover from a major change?
4. How can these be incorporated into daily life?
By starting the exercise with a broad definition and inventory of assets for everyday
quality of life, and then returning to a summary of the comprehensive plan after discussing the
earthquake scenario, we found that it was relatively easy for participants to link mitigation,
preparedness and recovery capacity with ideas for enhanced well-being in general, i.e. things
they want to do regardless of a threat, but which would also be especially helpful if a threat is
realized.
In a key example of how the connection between hazard mitigation planning and more
general planning became obvious, the participants found that urban form was as important as the
geology of the simulated earthquakes in prompting the direction of discussion. The emphasis on
neighborhood isolation and self-reliance in both the Redmond and Everett workshops derived in
part from the nature of crustal fault earthquakes in those communities. The location of
liquefaction, variable magnitudes of ground acceleration from neighborhood to neighborhood,
and the types of buildings prone to damage, were specific to the type of earthquake we simulated
for these exercises. (For example, the short-period waves of crustal faults would produce

145
different impacts than other types of events would, such as a Cascadia Subduction Zone
earthquake off the Pacific coast, which would have a more generalized impact across a wider
area.)
However, although the types of earthquakes simulated for the Redmond and Everett
scenarios were similar, and their areas of strongest shaking coincided with the locations of the
two cities’ most important businesses (Microsoft and Boeing), other impacts on the two cities
were quite different. In Redmond’s scenario, the downtown service center was also severely
damaged, while the upland residential neighborhoods on the stable soils experienced less damage
but became “islands” surrounded by liquefaction and shaking in the central and surrounding
valleys. In Everett, the liquefaction and shaking were not at the center of the city, but at its
periphery. The downtown itself experienced relatively little damage except for individual older
buildings, and its mix of uses and grid of small blocks enhanced internal accessibility to
important providers of good and services – but because it was located on a peninsula with a
narrow neck, it was easily cut off from the rest of the city. In both cities, the layout of the street
network and current land use zoning in most areas exacerbated these problems, making each
neighborhood internally less walkable, and providing few connections to other parts of the city.
An important principle underlying the exercise is the role of social capital in enhancing a
community’s adaptive capacity. In the immediate aftermath of a disruption, social capital
(especially on a very local scale) is a crucial substitute or back-up for vulnerable large, complex
systems and institutions and built infrastructure. Neah Bay, in particular, demonstrated the
importance of social and natural capital in supplementing the goods and services traditionally
provided by the built environment. It was as if the HAZUS output, with its emphasis on the
vulnerability of built capital, not only provided minimal direction in promoting community
146
resilience—defined as the ability to self-organize—but misdirected the effort. Where a
community does not rely on built capital, the software is not instructive.
Beyond this, however, participants also recognized that social capital is not created
overnight; it must develop gradually, through organizations and in facilities that are place-based
and functional on a daily basis. Participants therefore acknowledged implicitly another function
of social capital in resilience: it enables a community to self-organize. Conventional hazard
mitigation and disaster planning emphasize built-environmental preparations for and responses to
disruptive events, especially when considering timeframes outside the periods immediately
before and after the events (e.g. warning systems and emergency response). According to this
emphasis, vulnerable structures should be either “hardened” or sited outside threatened areas
altogether; and “building back better” is typically interpreted as just “building.” Mitigation of
impacts to vulnerable built capital remains a critical aspect of resilience, but mitigating all that is
vulnerable and to all possible threats is not an achievable objective.
Mitigation does not in itself enable a living community to self-organize. The U.S. eastern
coastal barrier islands damaged by Hurricane Sandy offer a case in point; even if all built capital
were rebuilt or retrofitted to FEMA’s advisory base flood elevations, many of these islands
would still not be resilient to emergency climate threats (McKay, 2013). Sea levels are rising,
the frequency of severe storms increasing, sand is being blown inland or washing out to sea. The
mitigation of built capital on such shifting sands may even reduce community resilience if the
community is financially or socially less prepared to adapt to future changes.
An approach based on a more ecological concept of resilience emphasizes communities’
total capacity not just to survive a disruption, but also to adapt to the irreversible, unpredictable,
and on-going changes that follow it. Large investments in mitigating the impacts of specific
147
low-probability, but high-consequence events are often difficult to justify, and they may not be
necessary if a community’s adaptive capacity is otherwise high. This capacity depends on a
broad combination of goods and services provided by built, natural and social capital to differing
degrees and at different times. By premising planning discussions on a definition of this more
holistic set of assets, communities can more easily see how to balance their reliance on a robust
built environment with an ability to adapt to change.
Acknowledgments
The authors acknowledge FEMA for funding this project, and Charlie Gorman, Dave DeHaan,
Mary Schoenfeldt, Andrew Winck and other emergency management staff for the Cities of
Redmond and Everett and the Makah Tribe who hosted the exercises. Special recognition is due
to the project’s graduate student research assistants at the University of Washington – Chungho
Kim, Jonathan Olds, Jesse Reynolds, and Timothy Lehman – as well as Washington Sea Grant
Coastal Resources Specialist Jamie Mooney, Rachel Aronson of the Washington State
Department of Ecology, and Prof. Ann Bostrom of the University of Washington Daniel J. Evans
School of Public Affairs. Their many efforts included developing the literature review, testing and
honing the exercise protocol, and facilitating, documenting and evaluating the community
discussions.
148
References
Alberti, M. (2008). Advances in urban ecology: integrating humans and ecological processes in
urban ecosystems. New York: Springer.
Beatley, T. (2009). Planning for coastal resilience : best practices for calamitous times.
Washington, DC: Island Press.
Berkes, F. & Ross, H. (2013), Community Resilience: Toward an Integrated Approach, Society
& Natural Resources 26 (1), 5-20..
Burby, R. J. (1998). Cooperating with nature: confronting natural hazards with land use
planning for sustainable communities. Washington, D.C.: Joseph Henry Press.
Burkett, V. D. M. (2012). Coastal impacts, adaptation, and vulnerabilities: a technical input to
the 2013 National Climate Assessment. Washington, [D.C.]: Island Press.
Chan, K. M. A., Guerry, A. D., Balvanera, P., Klain, S., Satterfield, T., Basurto, X., . . .
Woodside, U. (2012). Where are Cultural and Social in Ecosystem Services? A
Framework for Constructive Engagement. BioScience, 62(8), 744-756. doi:
10.1525/bio.2012.62.8.7
City of Everett. (2005). Everett 2025 Comprehensive Plan. Everett, WA.
City of Redmond. (2011). Redmond 2030: City of Redmond Comprehensive Plan. Redmond,
WA.
Cooperrider, D. L., personal correspondence, as quoted in Bushe, Gervase. (2012). Foundations
of Appreciative Inquiry: History, Criticism and Potential. AI Practitioner, 14(1), 8-20.
Davoudi, S. (2012). Resilience: A Bridging Concept or a Dead End? Planning Theory and
Practice 13 (2), 299-307
Emery, M., & Flora, C. B. (2012). Appreciative Inquiry as a Visioning Process. In N. Walzer &
G. F. Hamm (Eds.), Community Visioning Programs: Processes and Outcomes (pp. 135-
155). Hoboken: Taylor & Francis.
FEMA. (2013). Integrating Hazard Mitigation Into Local Planning: Case Studies and Tools for
Community Officials. [Washington, D.C.]: Federal Emergency Management Agency.
Freitag, B., Bolton, S. M., Westerlund, F., & Clark, J. L. S. (2009). Floodplain Management: A
New Approach for a New Era. Washington, DC: Island Press.
Green, G. P., & Haines, A. (2012). Asset building & community development (3rd ed.). Thousand
Oaks, Calif.: SAGE.
Lee, B., Preston, F., & Green, G. (2012). Preparing for High-impact, Low-probability Events:
Lessons from Eyjafjallajökull. A Chatham House Report. London: The Royal Institute of
International Affairs, Chatham House.
McKay, J. (2013). Is it Time to Develop a New Blueprint for Rebuilding. 1.
Millennium Ecosystem Assessment [Program]. (2005). Ecosystems and Human Well-being:
Synthesis: Island Press.
Mulder, K., Costanza, R., & Erickson, J. (2006). The contribution of built, human, social and
natural capital to quality of life in intentional and unintentional communities. Ecological
Economics,59(1), 13–23. doi:10.1016/j.ecolecon.2005.09.021.
Norris, F., Stevens, S., Pfefferbaum, B., Wyche, K., & Pfefferbaum, R. (2008). Community
Resilience as a Metaphor, Theory, Set of Capacities, and Strategy for Disaster Readiness.
American Journal of Community Psychology, 41(1), 127-150.
149
Orchiston, C. (2011). Seismic risk scenario planning and sustainable tourism management:
Christchurch and the Alpine Fault zone, South Island, New Zealand. Journal of
Sustainable Tourism, 20(1), 59-79. doi: 10.1080/09669582.2011.617827
Paton, D., & Johnston, D. M. (Eds.). (2006). Disaster Resilience: An Integrated Approach.
Springfield, IL: Charles C. Thomas.
Pearce, L. (2003). Disaster Management and Community Planning, and Public Participation:
How to Achieve Sustainable Hazard Mitigation. Natural Hazards, 28(2-3), 2-3.
Schwab, J. C. (Ed.). (2010). Hazard Mitigation: Integrating Best Practices into Planning.
Chicago, IL: American Planning Association, Planning Advisory Service Report No. 560.
Siembieda, W.J. (2010). Lowering Vulnerability Using the Asset-Access-Time Method. Journal
of Disaster Research 5 (2), 180-186.
Smith, G. P., & Wenger, D. (2007). Sustainable Disaster Recovery: Operationalizing an Existing
Agenda. In H. â. Rodríguez, E. L. Quarantelli & R. R. Dynes (Eds.), Handbook of
disaster research (pp. 234-257). New York: Springer.
Stokols, D., Lejano, R. P., & Hipp, J. (2013). Enhancing the Resilience of Human-Environment
Systems: a Social Ecological Perspective. Ecology and Society, 18(1). doi: 10.5751/es-
05301-180107
Wamsler, C. (2006). Mainstreaming Risk Reduction in Urban Planning and Housing: A
Challenge for International Aid Organisations. [Article]. Disasters, 30(2), 151-177. doi:
10.1111/j.0361-3666.2006.00313.x
i We define “better” as “community-defined HWB”. However, our exercise did not challenge the group to make
trade-offs or define priorities. ii We refer to HWB for purposes of this analysis, but used “quality of life” in presentations during the exercise. iii MA includes “freedom of choice and action” as a fifth category. During this exercise each group was asked to
consider choice in a general way, though it also emerges in the range of sources and providers listed for any given
good or service. iv By “consensus” we mean that no dissension was expressed. We employed no mechanism to determine whether
any participants held dissenting views but kept them private.