multi-temporal salinity mapping in the pilot sites and ...iraq-salinity-platform.icarda.org/iraq...
TRANSCRIPT
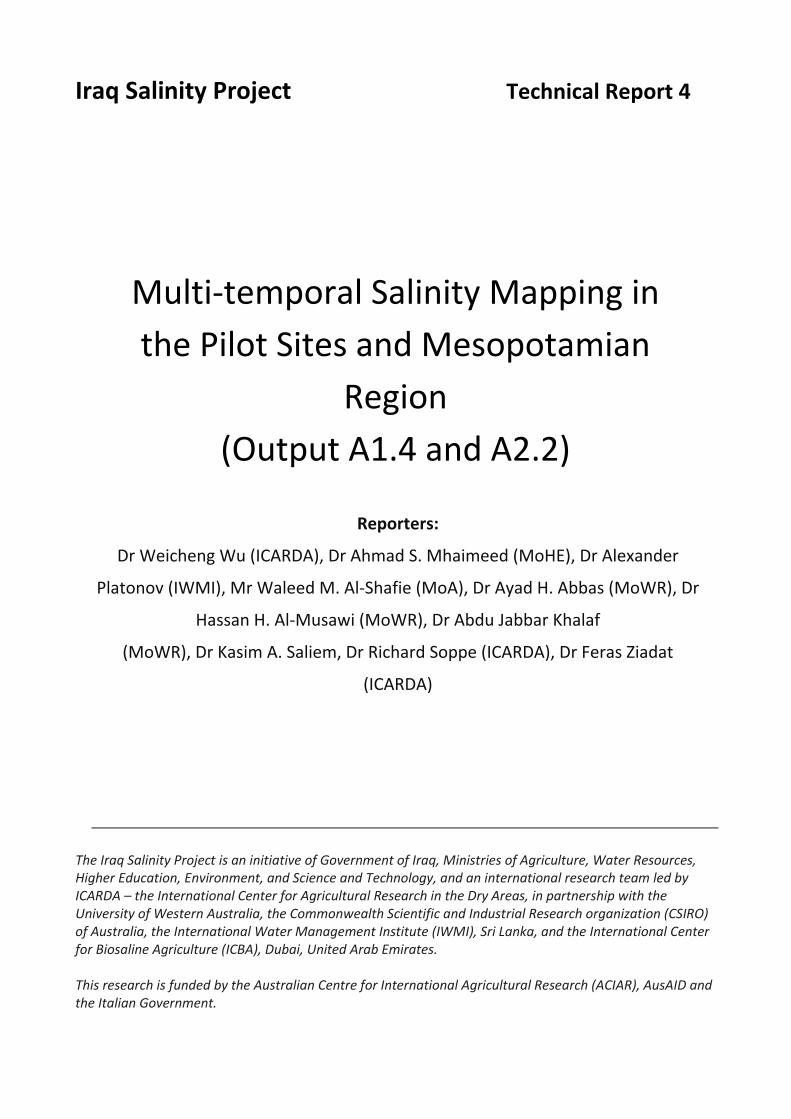
Iraq Salinity Project Technical Report 4
Multi-temporal Salinity Mapping in the Pilot Sites and Mesopotamian
Region (Output A1.4 and A2.2)
Reporters:
Dr Weicheng Wu (ICARDA), Dr Ahmad S. Mhaimeed (MoHE), Dr Alexander
Platonov (IWMI), Mr Waleed M. Al-Shafie (MoA), Dr Ayad H. Abbas (MoWR), Dr
Hassan H. Al-Musawi (MoWR), Dr Abdu Jabbar Khalaf
(MoWR), Dr Kasim A. Saliem, Dr Richard Soppe (ICARDA), Dr Feras Ziadat
(ICARDA)
The Iraq Salinity Project is an initiative of Government of Iraq, Ministries of Agriculture, Water Resources, Higher Education, Environment, and Science and Technology, and an international research team led by ICARDA – the International Center for Agricultural Research in the Dry Areas, in partnership with the University of Western Australia, the Commonwealth Scientific and Industrial Research organization (CSIRO) of Australia, the International Water Management Institute (IWMI), Sri Lanka, and the International Center for Biosaline Agriculture (ICBA), Dubai, United Arab Emirates.
This research is funded by the Australian Centre for International Agricultural Research (ACIAR), AusAID and the Italian Government.

2
This technical report series captures and documents the work in progress of the Iraq Salinity Project, in its seven research themes, working at the regional, farm and irrigation system scales. Technical reports feed into the Iraq Salinity Assessment, a synthesis and solutions to solving the problem: Situation Analysis (Report 1); Approaches and Solutions (Report 2) and Investment Options (Report 2).
Key words: southern Iraq, central Iraq, spatial distribution, remote sensing, irrigation, salinity
mapping.
This report was written and compiled by Dr Weicheng Wu (ICARDA), Dr Ahmad S. Mhaimeed (MoHE), Dr Alexander Platonov (IWMI), Mr Waleed M. Al-Shafie (MoA), Dr Ayad H. Abbas (MoWR), Dr Hassan H. Al-Musawi (MoWR), Dr Abdu Jabbar Khalaf (MoWR), Dr Kasim A. Saliem, Dr Richard Soppe (ICARDA), Dr Feras Ziadat (ICARDA)
With Dr Weicheng Wu (Leader), Dr Feras Ziadat (Co-Leader), Dr Eddy De Pauw-International
Centre of Agriculture Research in Dry Areas (ICARDA), Richard Soppe (SCIRO) and Alexander
Platonov (IWMI).
http://icarda.org/iraq-salinity-project/teaser

ACIAR and Italian Iraq Salinity Projects [Components A and 1]: Output A1.4 and A2.2
Multi-temporal Salinity Mapping in the Pilot Sites and Mesopotamian
Region
(Output A1.4 and A2.2)
Dr Weicheng Wu (ICARDA), Dr Ahmad S. Mhaimeed (MoHE), Dr Alexander Platonov (IWMI), Mr Waleed M. Al-Shafie (MoA), Dr Ayad H. Abbas (MoWR), Dr Hassan H. Al-Musawi (MoWR), Dr Abdu Jabbar Khalaf
(MoWR), Dr Kasim A. Saliem, Dr Richard Soppe (ICARDA), Dr Feras Ziadat (ICARDA)
Contact: [email protected]
1. Introduction
As proposed in the beginning of the project implementation, ones of the key outputs of Components A and
1 is the multi-temporal salinity maps of the pilot project sites namely Musaib, Dujaila, Abu Khaseeb, Shat-
Al-Arab (ACIAR Project), and West Gharraf (Nassirieh, Italian Project) (Output A1.4), and regional salinity
maps of the whole Mesopotamia (Output A2.2). Based on the salinity models developed in the previous
period (Output A1.3), it is possible to produce these maps after application of the related models
respectively to the satellite images of the pilot sites in Mesopotamia.
The multi-temporal observation points are fixed at 1990, 2000 and 2010.
2. Salinity mapping in pilot sites
2.1 Data
As indicated in the model development (Output A1.3), it is essential to use multiyear satellite images for
salinity mapping to avoid crop rotation and fallow problem, and for the year 2010, to avoid as well the SLC-
Off problem of the recent Landsat ETM+ images. The satellite images corresponding to the observation
points of time were acquired respectively in the period 1988-1993, 1998-2002 and 2009-2012; and are
listed in the following Tables 1, 2 and 3.
2.2 Procedure
As indicated in Output A1.3, the main procedure is composed of: 1) Pre-processing including atmospheric
correction using FLAASH model, 2) Derivation of relevant remote sensing indicators such as vegetation
indices (e.g., GDVI, NDVI, EVI, SARVI, SAVI) and non-vegetation indices (NDWI, NDII, Tasseled Cap
Brightness, Principal Components and Spring Maximum Temperature), and 3) Extraction of the multiyear
maximum value in each pixel of each index. This procedure was applied to all satellite images.
2.3 Application of salinity models

ACIAR and Italian Iraq Salinity Projects [Components A and 1]: Output A1.4 and A2.2
Models developed from different sites were applied respectively to the remote sensing indicators of their
corresponding sites. That is to say, the models obtained from Musaib were applied only to vegetation
indices and non-vegetation indices of Musaib. The same was applied for others.
Only for Shat-Al-Arab and Abu Khaseeb, no proper models were developed due to insufficiency of field
measurements. So we apply the integrated regional salinity models. If the salinity maps derived from the
integrated models are in a good agreement with the available field data, the validity of models can be thus
indirectly evaluated.
Table 1: Landsat images used for salinity mapping in Musaib
Landsat Frame: 168-37
2010 (2009-2012) 2000 (1998-2002) 1990 (1988-1993)
Spring Summer Spring Summer Spring Summer
2009-03-17 2008-08-05 1999-02-26 1998-08-02 1990-03-29 1989-08-01
2009-04-18 2010-08-11 1999-03-14 2000-08-23 1991-02-12 1990-08-12
2010-03-20 2011-08-14 2000-04-09 2000-08-31 1993-02-17 1990-08-20
2011-02-03 2012-08-16 2000-04-25 2001-08-18 1992-08-19
2011-02-19 2012-09-01 2001-02-23 2002-08-05
2012-02-22
2001-03-11
2012-03-09
2001-03-27
2012-04-26 2001-04-28
2002-04-15
Table 2: Satellite images used in Dujail and West Gharraf sites
Frame: 167-38
2010 (2009-2012) 2000 (1998-2002) 1990 (1988-1993)
Spring Summer Spring Summer Spring Summer
2009-03-26 2009-09-02 1998-04-21 1999-08-14 1988-03-16 1990-08-13
2009-04-11 2010-08-20 2000-03-09 2000-08-08 1990-02-18 1990-08-29
2010-03-29 2011-08-23 2000-04-26 2002-07-29 1990-03-06 1992-08-02
2011-04-17 2012-08-25 2001-04-21 1993-02-16 1992-08-18
2012-04-03 2002-04-24 1993-03-30
2012-04-19

ACIAR and Italian Iraq Salinity Projects [Components A and 1]: Output A1.4 and A2.2
Table 3: Satellite images employed for salinity mapping in the Shat-Al-Arab and Abu Khaseeb Sites
Frame: 166-39
2010 (2009-2012) 2000 (1998-2003) 1990 (1988-1993)
Spring Summer Spring Summer Spring Summer
2009-03-26 2009-09-02 1998-04-14 1998-08-04 1988-02-06 1989-08-19
2009-04-11 2010-08-20 2000-02-23 1999-08-15 1991-02-22 1990-08-14
2010-03-29 2011-08-23 2000-03-26 2000-08-01 1991-03-10 1990-08-30
2011-04-17 2012-08-25 2001-02-25 2001-08-04 1991-03-26 1991-08-01
2012-04-03 2001-04-14 1993-03-23 1991-08-17
2012-04-19 2003-02-15 1992-08-27
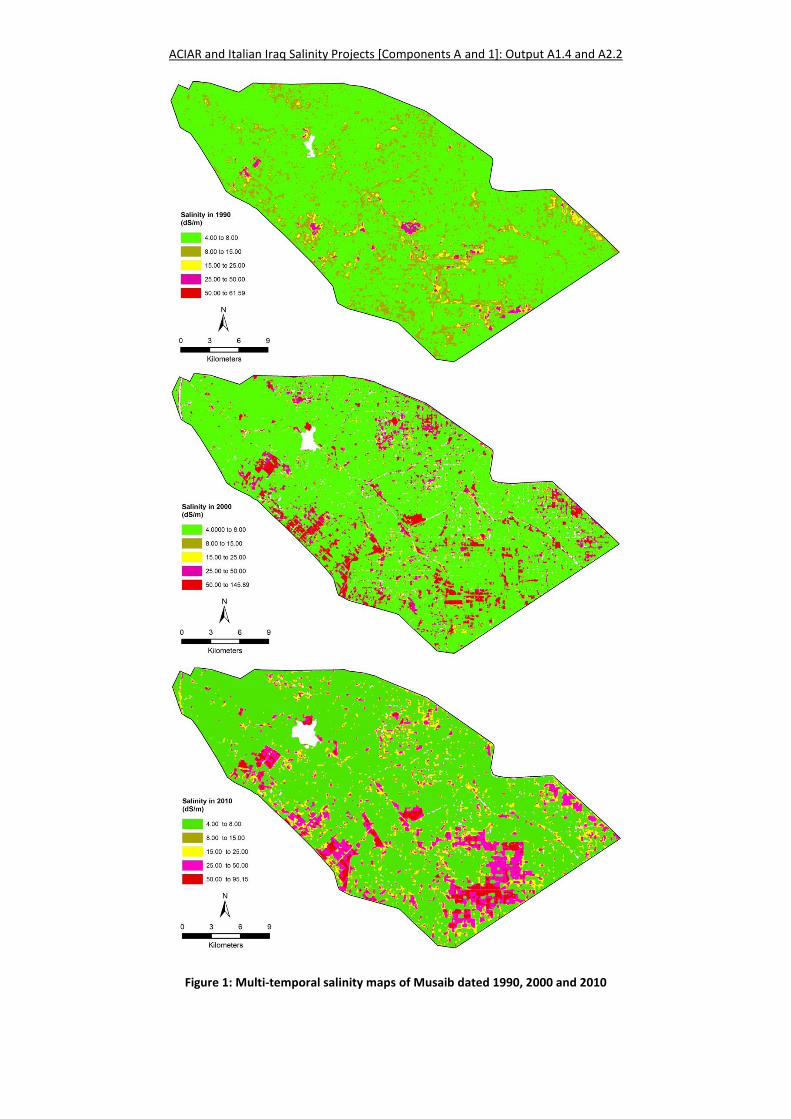
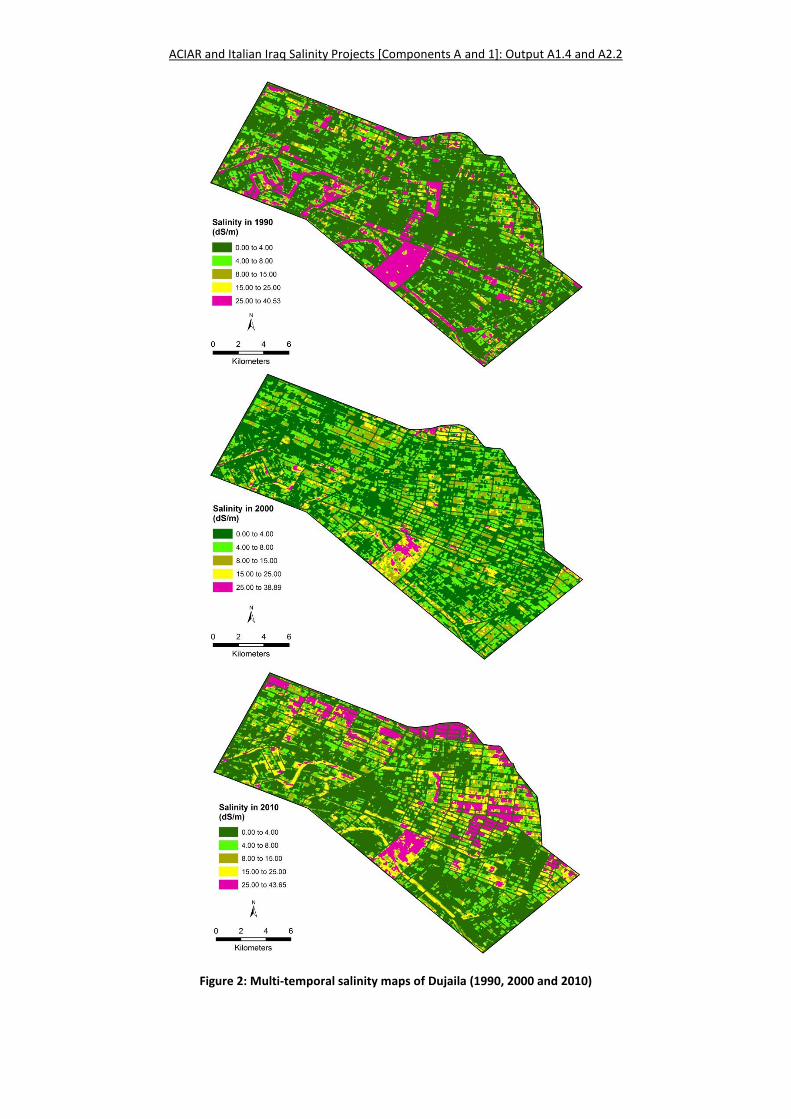
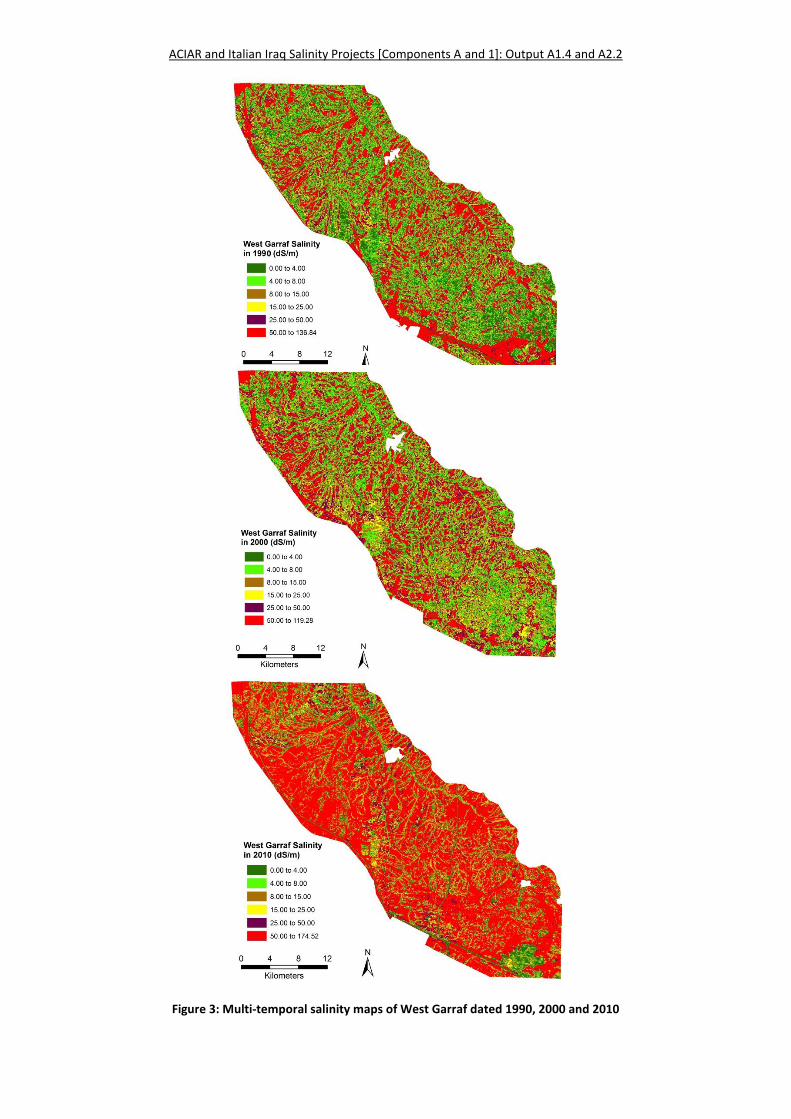
2.4 Multi-temporal salinity maps
Salinity maps produced for each pilot site are shown in figures 1, 2, 3, 4 and 5.
Whether the salinity maps are reliable, the recent ones dated 2010 were checked against the field data
(EM38 readings and lab EC). It was obtained that the agreement equations are respectively in:
Musaib: Modeled EC = 0.6306*Ground Measured EC + 0.0185 (R² = 0.8108)
Dujaila: Modeled EC = 0.8087* Ground Measured EC + 2.1627 (R² = 0.8087)
This indicates that the maps are of high reliability and the salinity models developed can effectively
produce relevant salinity maps.
ACIAR and Italian Iraq Salinity Projects [Components A and 1]: Output A1.4 and A2.2
Figure 1: Multi-temporal salinity maps of Musaib dated 1990, 2000 and 2010
ACIAR and Italian Iraq Salinity Projects [Components A and 1]: Output A1.4 and A2.2
Figure 2: Multi-temporal salinity maps of Dujaila (1990, 2000 and 2010)
ACIAR and Italian Iraq Salinity Projects [Components A and 1]: Output A1.4 and A2.2
Figure 3: Multi-temporal salinity maps of West Garraf dated 1990, 2000 and 2010

ACIAR and Italian Iraq Salinity Projects [Components A and 1]: Output A1.4 and A2.2
Figure 4: Abu-Khaseeb salinity maps

ACIAR and Italian Iraq Salinity Projects [Components A and 1]: Output A1.4 and A2.2
Figure 5: Shat-Al-Arab salinity maps
ACIAR and Italian Iraq Salinity Projects [Components A and 1]: Output A1.4 and A2.2
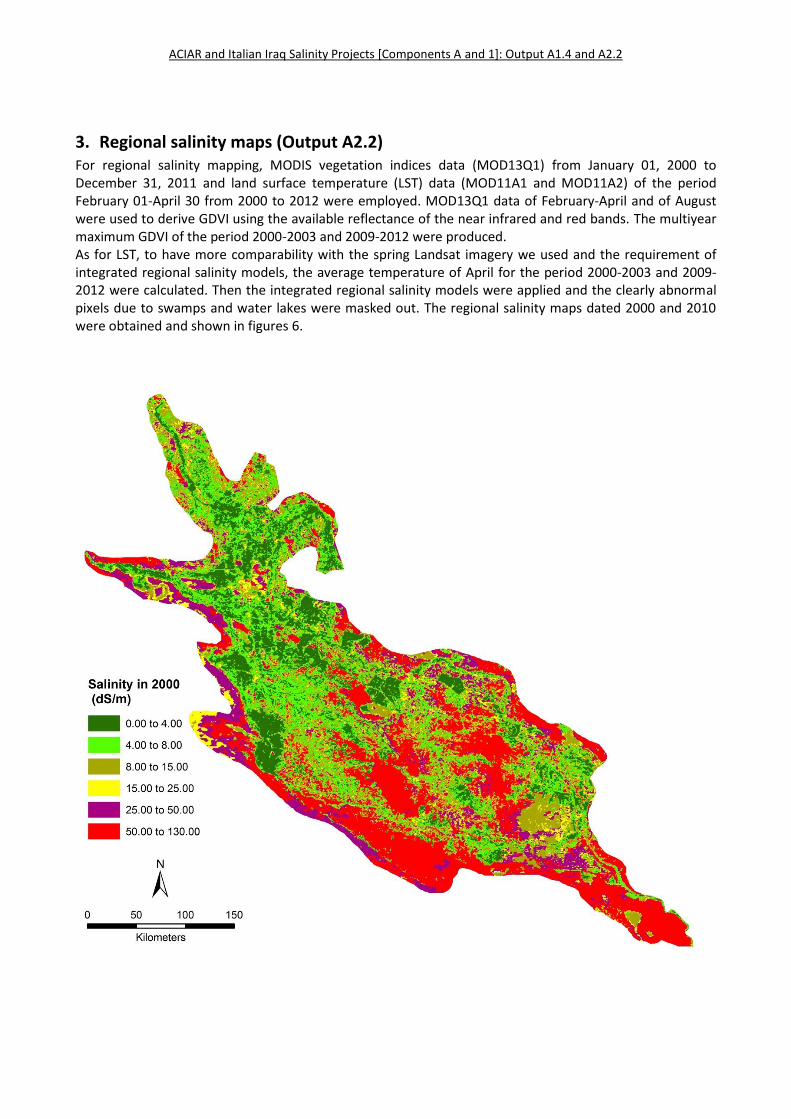
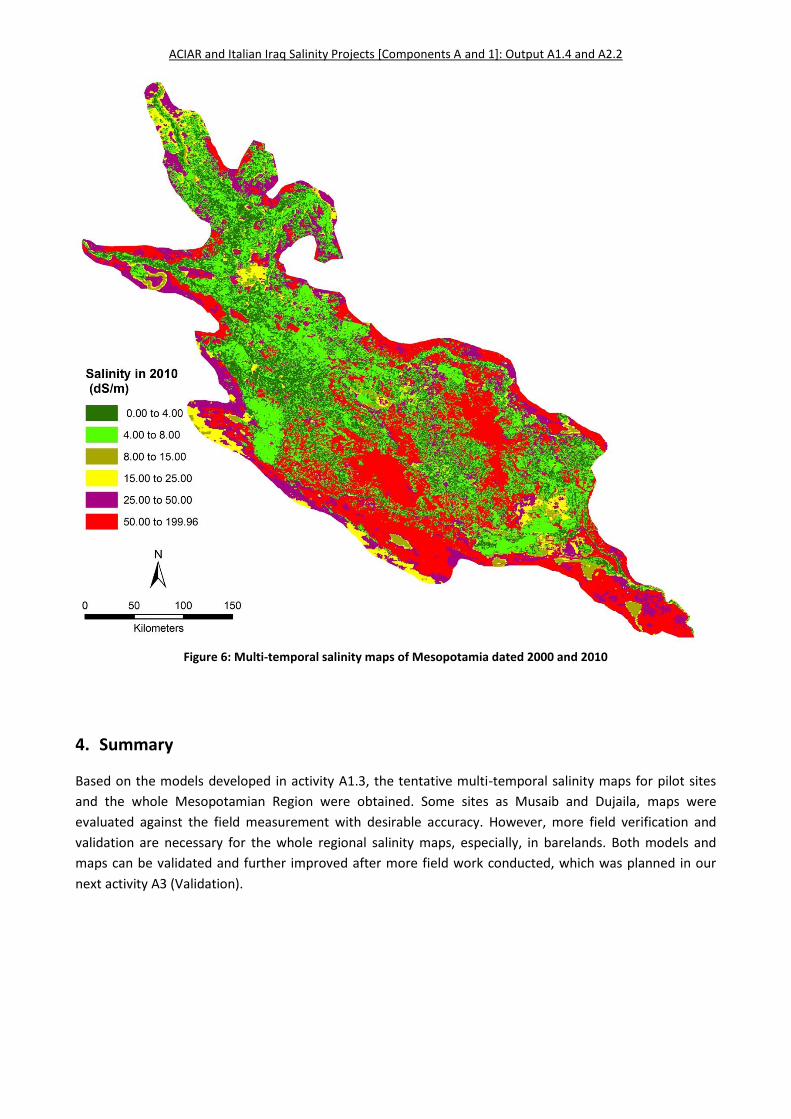
3. Regional salinity maps (Output A2.2) For regional salinity mapping, MODIS vegetation indices data (MOD13Q1) from January 01, 2000 to December 31, 2011 and land surface temperature (LST) data (MOD11A1 and MOD11A2) of the period February 01-April 30 from 2000 to 2012 were employed. MOD13Q1 data of February-April and of August were used to derive GDVI using the available reflectance of the near infrared and red bands. The multiyear maximum GDVI of the period 2000-2003 and 2009-2012 were produced. As for LST, to have more comparability with the spring Landsat imagery we used and the requirement of integrated regional salinity models, the average temperature of April for the period 2000-2003 and 2009-2012 were calculated. Then the integrated regional salinity models were applied and the clearly abnormal pixels due to swamps and water lakes were masked out. The regional salinity maps dated 2000 and 2010 were obtained and shown in figures 6.
ACIAR and Italian Iraq Salinity Projects [Components A and 1]: Output A1.4 and A2.2
Figure 6: Multi-temporal salinity maps of Mesopotamia dated 2000 and 2010
4. Summary
Based on the models developed in activity A1.3, the tentative multi-temporal salinity maps for pilot sites
and the whole Mesopotamian Region were obtained. Some sites as Musaib and Dujaila, maps were
evaluated against the field measurement with desirable accuracy. However, more field verification and
validation are necessary for the whole regional salinity maps, especially, in barelands. Both models and
maps can be validated and further improved after more field work conducted, which was planned in our
next activity A3 (Validation).