multi rotor design and scaling
DESCRIPTION
Finished Thesis about multi rotor design and scaling.TRANSCRIPT
University of Massachusetts - AmherstScholarWorks@UMass Amherst
Masters Theses 1896 - February 2014 Dissertations and Theses
2013
Multi Rotor Wind Turbine Design And CostScalingPreeti [email protected]
Follow this and additional works at: http://scholarworks.umass.edu/theses
This Open Access is brought to you for free and open access by the Dissertations and Theses at ScholarWorks@UMass Amherst. It has been acceptedfor inclusion in Masters Theses 1896 - February 2014 by an authorized administrator of ScholarWorks@UMass Amherst. For more information, pleasecontact [email protected].
Verma, Preeti, "Multi Rotor Wind Turbine Design And Cost Scaling" (). Masters Theses 1896 -February 2014. Paper 1158.http://scholarworks.umass.edu/theses/1158
MULTI ROTOR WIND TURBINE DESIGN AND COSTSCALING
A Thesis Presented
by
PREETI VERMA
Submitted to the Graduate School of theUniversity of Massachusetts Amherst in partial fulfillment
of the requirements for the degree of
MASTER OF SCIENCE IN MECHANICAL ENGINEERING
September 2013
Mechanical and Industrial Engineering
MULTI ROTOR WIND TURBINE DESIGN AND COSTSCALING
A Thesis Presented
by
PREETI VERMA
Approved as to style and content by:
James F. Manwell, Co-chair
Jon G. McGowan, Co-chair
Sergio F. Brena, Member
Donald L. Fisher, Department ChairMechanical and Industrial Engineering

To my supportive and loving parents, Rani Verma & R. S. Verma,and my sister, Gargi Verma.
ACKNOWLEDGMENTS
I thank my advisor, Prof. James F. Manwell for the several fruitful discussions
regarding the underlying requirements of my work. Thank you for helping me under-
stand the subtle aspects of up-wind turbine design.
Thanks to Prof. Jon G. McGowan for his guidance and support.
Thanks to Prof. Sergio F. Brena for his support and insightful feedback on Struc-
tural Design.
Thanks to my loving parents for their continued love and support during the
writing of this thesis.
iv
ABSTRACT
MULTI ROTOR WIND TURBINE DESIGN AND COSTSCALING
SEPTEMBER 2013
PREETI VERMA
M.S.M.E., UNIVERSITY OF MASSACHUSETTS AMHERST
Directed by: Professor James F. Manwell and Professor Jon G. McGowan
The current generation wind turbines are upscaled into multi megawatt range
in terms of output power. However, the energy benefit from the turbine is offset
by the increased mass and cost. Twenty MW wind turbines are now feasible with
rotor diameters up to 200 m, according to a new report from the EU-funded UpWind
project in 2011. The question is, how much bigger can wind turbines get realistically?
One concept worth considering, and the one that is the subject of this thesis, is to
have more than one rotor on a single support structure. Such turbines could have
a greater power to weight ratio. Multi-rotor systems also offer the advantage of
standardization, transportation and ease of installation and maintenance.
In this thesis the NREL 5 MW single rotor baseline wind turbine is compared
with a 5 MW multi-rotor wind turbine. The multiple rotors are downscaled using
scaling curves keeping the 5 MW baseline machine as reference.
v
TABLE OF CONTENTS
Page
ACKNOWLEDGMENTS . . . . . . . . . . . . . . . . . . . . . . . . . . . . . . . . . . . . . . . . . . . . . iv
ABSTRACT . . . . . . . . . . . . . . . . . . . . . . . . . . . . . . . . . . . . . . . . . . . . . . . . . . . . . . . . . . v
LIST OF TABLES . . . . . . . . . . . . . . . . . . . . . . . . . . . . . . . . . . . . . . . . . . . . . . . . . . .viii
LIST OF FIGURES . . . . . . . . . . . . . . . . . . . . . . . . . . . . . . . . . . . . . . . . . . . . . . . . . . . ix
CHAPTER
1. INTRODUCTION TO WIND TURBINES . . . . . . . . . . . . . . . . . . . . . . . . . 1
1.1 Wind Power Around the World . . . . . . . . . . . . . . . . . . . . . . . . . . . . . . . . . . . . . 11.2 Basics of Wind Turbines . . . . . . . . . . . . . . . . . . . . . . . . . . . . . . . . . . . . . . . . . . . 3
1.2.1 Power Curve . . . . . . . . . . . . . . . . . . . . . . . . . . . . . . . . . . . . . . . . . . . . . . . 31.2.2 One-Dimensional Momentum Theory and Betz Limit . . . . . . . . . . . 51.2.3 Parametric Sensitivity . . . . . . . . . . . . . . . . . . . . . . . . . . . . . . . . . . . . . . 6
2. INTRODUCTION TO MULTI ROTOR WIND TURBINES . . . . . . . 7
2.1 Merits and Drawbacks of MRWTs . . . . . . . . . . . . . . . . . . . . . . . . . . . . . . . . . . 92.2 Motivation . . . . . . . . . . . . . . . . . . . . . . . . . . . . . . . . . . . . . . . . . . . . . . . . . . . . . . 102.3 Overview of Key Historical Precedents . . . . . . . . . . . . . . . . . . . . . . . . . . . . . . 10
2.3.1 Early MRWT Designs . . . . . . . . . . . . . . . . . . . . . . . . . . . . . . . . . . . . . 112.3.2 Recognition of Standardization Benefit . . . . . . . . . . . . . . . . . . . . . . . 122.3.3 Modern MRWTs . . . . . . . . . . . . . . . . . . . . . . . . . . . . . . . . . . . . . . . . . . 132.3.4 Scaling Relationships . . . . . . . . . . . . . . . . . . . . . . . . . . . . . . . . . . . . . . 13
3. SCALING ECONOMICS . . . . . . . . . . . . . . . . . . . . . . . . . . . . . . . . . . . . . . . . . 16
3.1 Scaling Trends . . . . . . . . . . . . . . . . . . . . . . . . . . . . . . . . . . . . . . . . . . . . . . . . . . 16
3.1.1 Geomteric Scaling . . . . . . . . . . . . . . . . . . . . . . . . . . . . . . . . . . . . . . . . . 16
vi
3.1.2 Dynamic Scaling . . . . . . . . . . . . . . . . . . . . . . . . . . . . . . . . . . . . . . . . . . 173.1.3 Empirical Scaling . . . . . . . . . . . . . . . . . . . . . . . . . . . . . . . . . . . . . . . . . 17
3.2 Scaling Effects on Wind Turbine Design . . . . . . . . . . . . . . . . . . . . . . . . . . . . 193.3 Aerodynamic Interaction . . . . . . . . . . . . . . . . . . . . . . . . . . . . . . . . . . . . . . . . . 213.4 Other Scaling Facts . . . . . . . . . . . . . . . . . . . . . . . . . . . . . . . . . . . . . . . . . . . . . . 223.5 5 MW Three-Rotor Wind Turbine RNA Components . . . . . . . . . . . . . . . . . 23
3.5.1 Properties of Down-Scaled RNA . . . . . . . . . . . . . . . . . . . . . . . . . . . . . 233.5.2 RNA Cost and Weight Scaling . . . . . . . . . . . . . . . . . . . . . . . . . . . . . . 24
4. SUPPORT STRUCTURE DESIGN . . . . . . . . . . . . . . . . . . . . . . . . . . . . . . . 31
4.1 Design Requirement . . . . . . . . . . . . . . . . . . . . . . . . . . . . . . . . . . . . . . . . . . . . . 324.2 Design Specifications . . . . . . . . . . . . . . . . . . . . . . . . . . . . . . . . . . . . . . . . . . . . . 32
4.2.1 Material . . . . . . . . . . . . . . . . . . . . . . . . . . . . . . . . . . . . . . . . . . . . . . . . . 324.2.2 Design conditions . . . . . . . . . . . . . . . . . . . . . . . . . . . . . . . . . . . . . . . . . 324.2.3 Design Loads . . . . . . . . . . . . . . . . . . . . . . . . . . . . . . . . . . . . . . . . . . . . . 33
4.3 Structural Scheme . . . . . . . . . . . . . . . . . . . . . . . . . . . . . . . . . . . . . . . . . . . . . . . 354.4 Final Design . . . . . . . . . . . . . . . . . . . . . . . . . . . . . . . . . . . . . . . . . . . . . . . . . . . . 39
4.4.1 Analysis . . . . . . . . . . . . . . . . . . . . . . . . . . . . . . . . . . . . . . . . . . . . . . . . . 404.4.2 Blade Deflection . . . . . . . . . . . . . . . . . . . . . . . . . . . . . . . . . . . . . . . . . . 44
4.5 Weight Summary and Comparison . . . . . . . . . . . . . . . . . . . . . . . . . . . . . . . . . 46
5. CONCLUSION . . . . . . . . . . . . . . . . . . . . . . . . . . . . . . . . . . . . . . . . . . . . . . . . . . . 50
BIBLIOGRAPHY . . . . . . . . . . . . . . . . . . . . . . . . . . . . . . . . . . . . . . . . . . . . . . . . . . . 52
vii
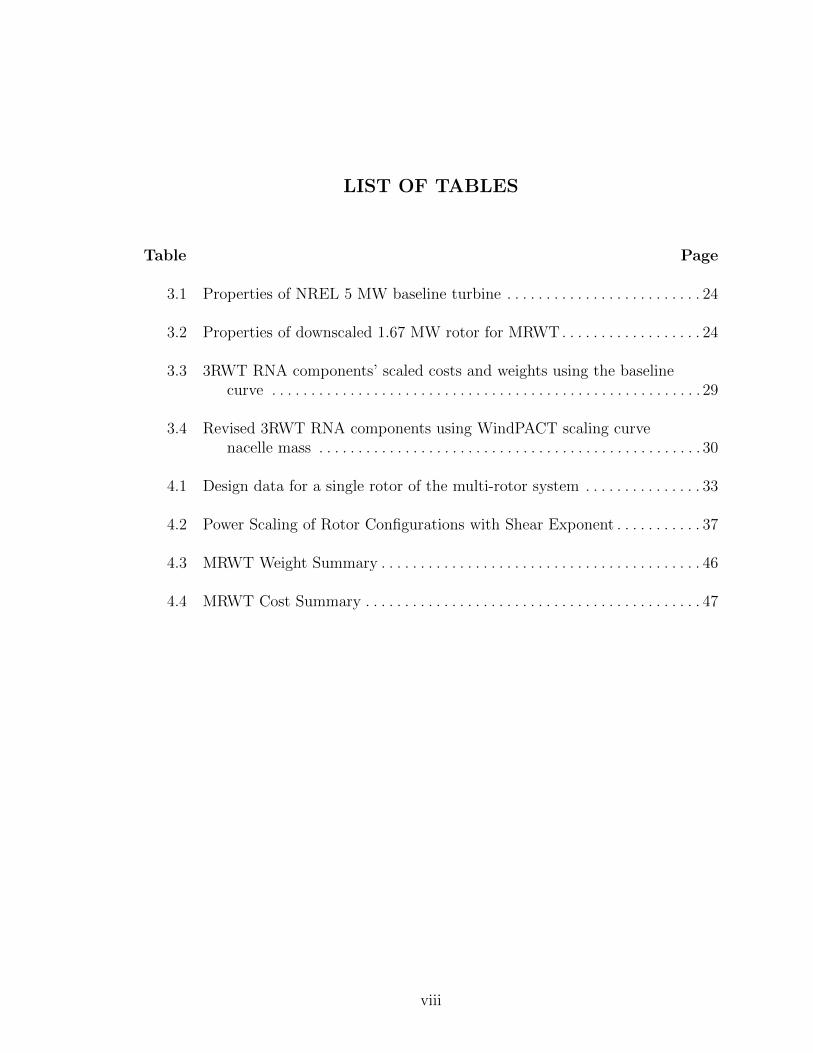
LIST OF TABLES
Table Page
3.1 Properties of NREL 5 MW baseline turbine . . . . . . . . . . . . . . . . . . . . . . . . . 24
3.2 Properties of downscaled 1.67 MW rotor for MRWT. . . . . . . . . . . . . . . . . . 24
3.3 3RWT RNA components’ scaled costs and weights using the baselinecurve . . . . . . . . . . . . . . . . . . . . . . . . . . . . . . . . . . . . . . . . . . . . . . . . . . . . . . . 29
3.4 Revised 3RWT RNA components using WindPACT scaling curvenacelle mass . . . . . . . . . . . . . . . . . . . . . . . . . . . . . . . . . . . . . . . . . . . . . . . . . 30
4.1 Design data for a single rotor of the multi-rotor system . . . . . . . . . . . . . . . 33
4.2 Power Scaling of Rotor Configurations with Shear Exponent . . . . . . . . . . . 37
4.3 MRWT Weight Summary . . . . . . . . . . . . . . . . . . . . . . . . . . . . . . . . . . . . . . . . . 46
4.4 MRWT Cost Summary . . . . . . . . . . . . . . . . . . . . . . . . . . . . . . . . . . . . . . . . . . . 47
viii
LIST OF FIGURES
Figure Page
1.1 World cumulative installed wind power capacity, 1980 - 2009 [7] . . . . . . . . . 2
1.2 Cumulative installed wind turbine capacity : top ten countries, 2010[4] . . . . . . . . . . . . . . . . . . . . . . . . . . . . . . . . . . . . . . . . . . . . . . . . . . . . . . . . . . . 2
1.3 Major components of a HAWT [22] . . . . . . . . . . . . . . . . . . . . . . . . . . . . . . . . . 4
1.4 Typical wind turbine power curve [22] . . . . . . . . . . . . . . . . . . . . . . . . . . . . . . . 4
2.1 Increasing wind turbine rotor size [10] . . . . . . . . . . . . . . . . . . . . . . . . . . . . . . . 8
2.2 2-Rotor Danish wind mills, 1873 [25] . . . . . . . . . . . . . . . . . . . . . . . . . . . . . . . 11
2.3 3-Rotor turbine concept by Hermann Honnef, 1930 [9] . . . . . . . . . . . . . . . . 12
2.4 Percy Thomas’ two rotor aerogenerator tower wind turbine patentdesign [31] . . . . . . . . . . . . . . . . . . . . . . . . . . . . . . . . . . . . . . . . . . . . . . . . . . . 13
2.5 Concept wind station with thirty-four 100 kW wind generators atseven levels, 1976 [14] . . . . . . . . . . . . . . . . . . . . . . . . . . . . . . . . . . . . . . . . . 14
2.6 A Lagerwey 4 rotor system [9] . . . . . . . . . . . . . . . . . . . . . . . . . . . . . . . . . . . . . 15
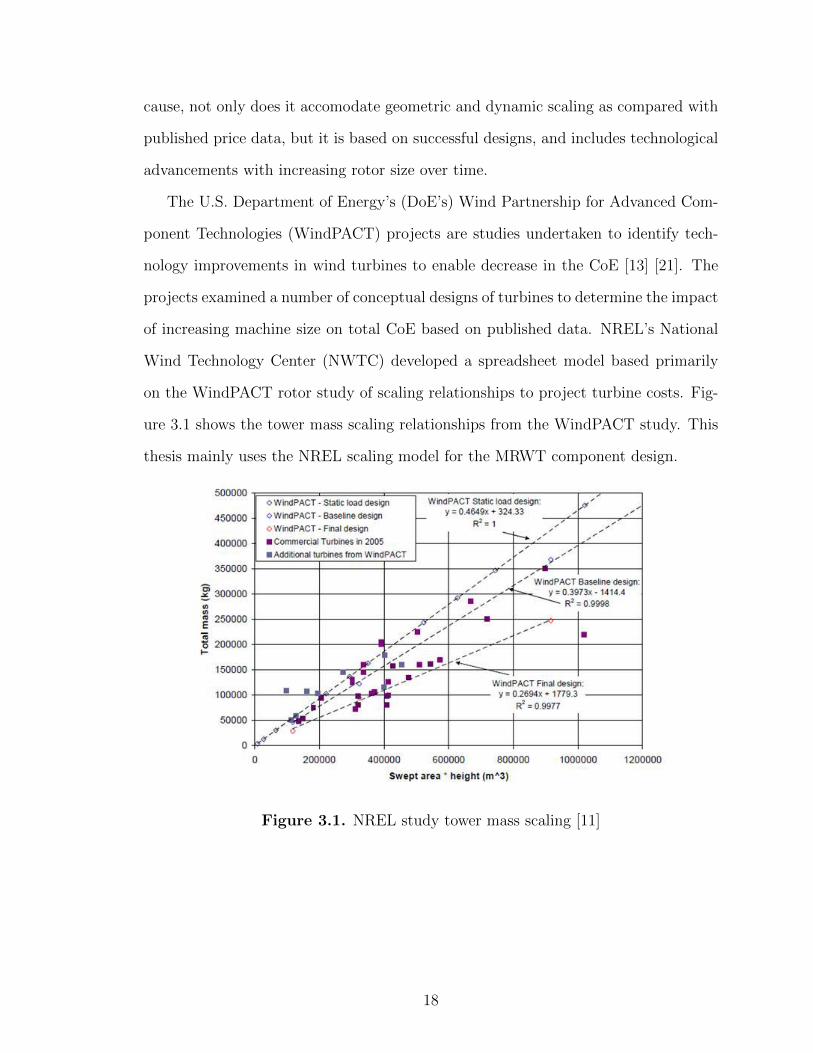
3.1 NREL study tower mass scaling [11] . . . . . . . . . . . . . . . . . . . . . . . . . . . . . . . 18
3.2 Scaling of wind turbine nacelle system mass [3] . . . . . . . . . . . . . . . . . . . . . . 22
3.3 Wind turbine nacelle system mass above 80m diameter [3] . . . . . . . . . . . . 23
3.4 NREL study blade mass scaling [11] . . . . . . . . . . . . . . . . . . . . . . . . . . . . . . . . 26
4.1 NREL baseline machine response curves [18] . . . . . . . . . . . . . . . . . . . . . . . . 34
4.2 Three-Rotor Turbine Configurations . . . . . . . . . . . . . . . . . . . . . . . . . . . . . . . . 36
ix
4.3 Three arm support structure configuration . . . . . . . . . . . . . . . . . . . . . . . . . . 38
4.4 Three arm truss type support frame . . . . . . . . . . . . . . . . . . . . . . . . . . . . . . . . 39
4.5 Triangular truss type support frame . . . . . . . . . . . . . . . . . . . . . . . . . . . . . . . . 41
4.6 Triangular truss type support frame dimensions . . . . . . . . . . . . . . . . . . . . . . 42
4.7 Triangular truss frame member assignments . . . . . . . . . . . . . . . . . . . . . . . . . 43
4.8 SAP2000: Frame members for tower and space frame, shell elementsfor bearings . . . . . . . . . . . . . . . . . . . . . . . . . . . . . . . . . . . . . . . . . . . . . . . . . . 44
4.9 Truss type support frame deflections . . . . . . . . . . . . . . . . . . . . . . . . . . . . . . . 45
4.10 Design capacity check . . . . . . . . . . . . . . . . . . . . . . . . . . . . . . . . . . . . . . . . . . . . 46
4.11 Maximum stress in frame member . . . . . . . . . . . . . . . . . . . . . . . . . . . . . . . . . 47
4.12 First natural frequency, side to side mode . . . . . . . . . . . . . . . . . . . . . . . . . . . 48
4.13 Second natural frequency, fore and aft mode. . . . . . . . . . . . . . . . . . . . . . . . . 49
4.14 Third natural frequency, twisting mode . . . . . . . . . . . . . . . . . . . . . . . . . . . . . 49
x
CHAPTER 1
INTRODUCTION TO WIND TURBINES
The increasing awareness of the need for environmentally sustainable energy pro-
duction has driven the promotion of wind energy conversion systems. Wind is a form
of solar power, created by the uneven heating of the Earth’s surface. Wind turbines
have been developed for over a millenium and are avalaible in various configurations
of horizontal and vertical axis. Wind energy conversion systems tranform kinetic en-
ergy avaialble in the wind into eletrical energy. Due to some favourable characteristcs
such as economical viability, a clean energy resource, low environmental impact, and
the potential to cover a large percentage of the energy requirement, this technology
has grown considerably in the last few decades. Presently, wind energy accounts for
2.3% of the total U.S. electricity supply. The cost to produce a unit of electricity
from the wind has decreased by 80% during the last twenty years [6].
The United Nations has said if greenhouse gas emissions are not cut by 70% within
the next 30 years, the world will face detrimental climate system consequences. This
necessitates continued research and development in clean energy technologies in order
to create more environmentally friendly energy solutions.
1.1 Wind Power Around the World
Figure 1.1 shows the cumulative installed wind capacity in the world up to 2009
which soared above 150,000 MW, while Figure 1.2 shows that, just the top ten par-
ticipating countries’ wind turbine installed capacity exceeds that of 2009, in 2010.
1
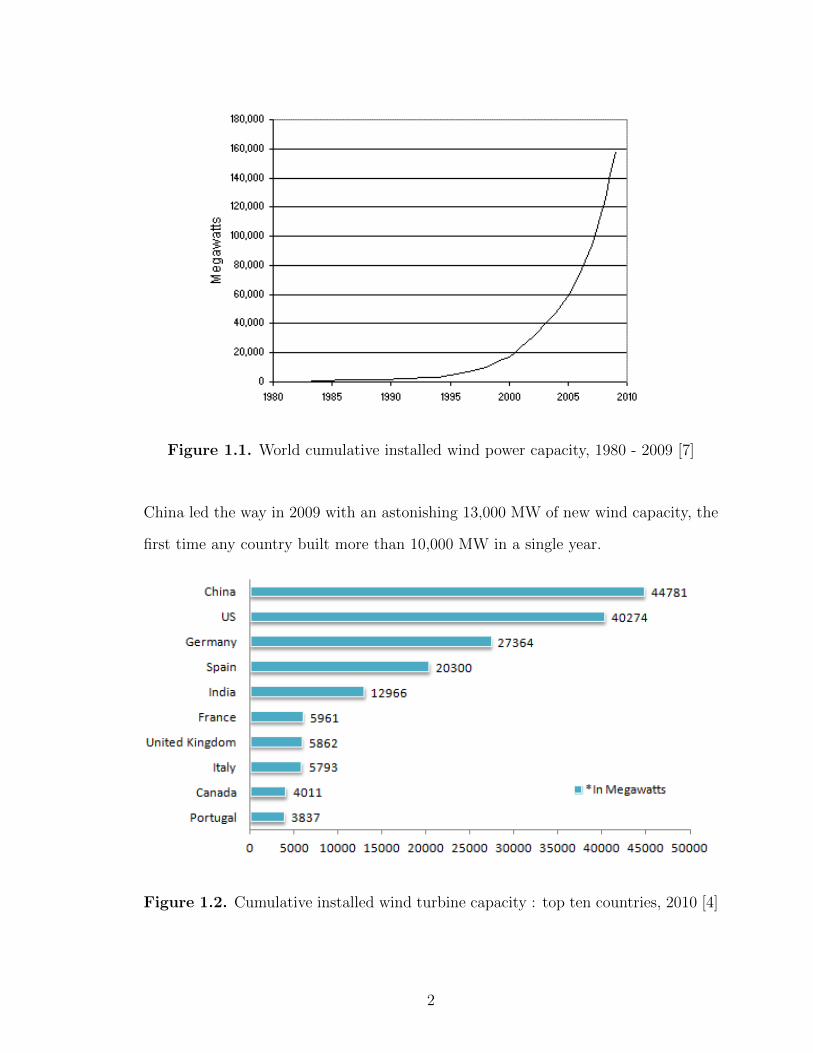
Figure 1.1. World cumulative installed wind power capacity, 1980 - 2009 [7]
China led the way in 2009 with an astonishing 13,000 MW of new wind capacity, the
first time any country built more than 10,000 MW in a single year.
Figure 1.2. Cumulative installed wind turbine capacity : top ten countries, 2010 [4]
2
The potential for wind power has been estimated to be 600 EJ/yr (167,000 TWh)
[29]. Wind power is growing at the rate of 30% annually, with a worldwide installed
capacity of 198 gigawatts (GW) in 2010 [20], and is widely used in Europe, Asia, and
the United States.
1.2 Basics of Wind Turbines
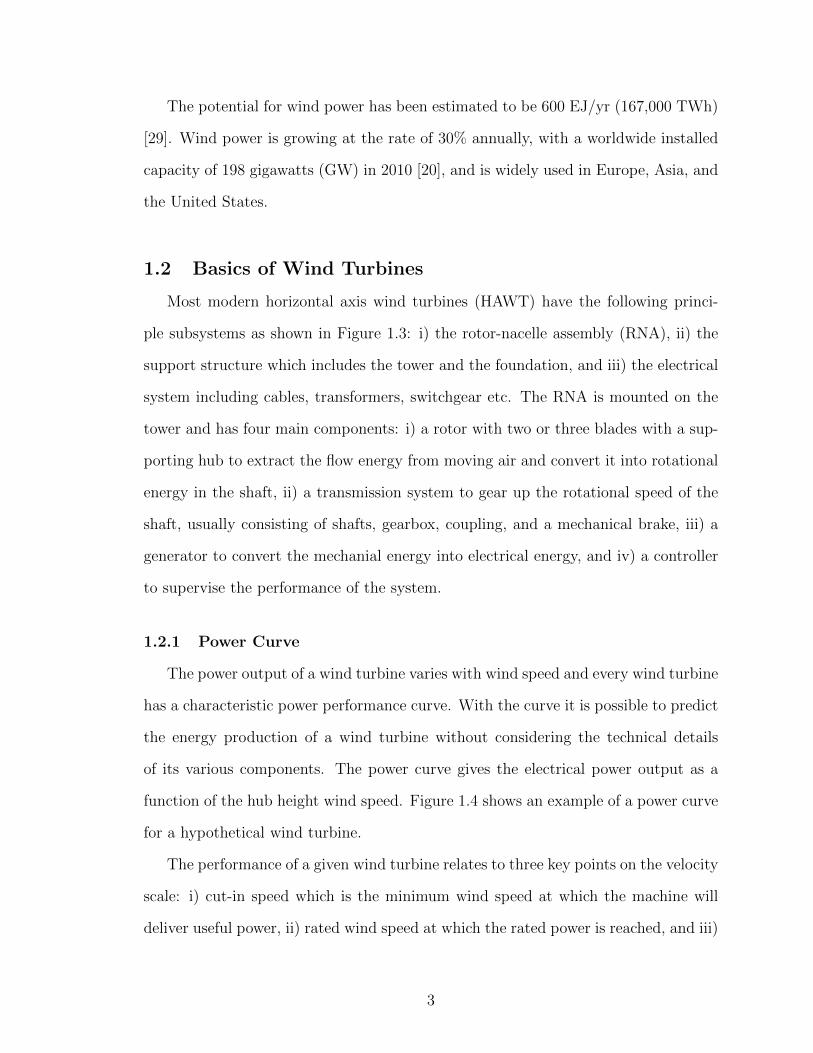
Most modern horizontal axis wind turbines (HAWT) have the following princi-
ple subsystems as shown in Figure 1.3: i) the rotor-nacelle assembly (RNA), ii) the
support structure which includes the tower and the foundation, and iii) the electrical
system including cables, transformers, switchgear etc. The RNA is mounted on the
tower and has four main components: i) a rotor with two or three blades with a sup-
porting hub to extract the flow energy from moving air and convert it into rotational
energy in the shaft, ii) a transmission system to gear up the rotational speed of the
shaft, usually consisting of shafts, gearbox, coupling, and a mechanical brake, iii) a
generator to convert the mechanial energy into electrical energy, and iv) a controller
to supervise the performance of the system.
1.2.1 Power Curve
The power output of a wind turbine varies with wind speed and every wind turbine
has a characteristic power performance curve. With the curve it is possible to predict
the energy production of a wind turbine without considering the technical details
of its various components. The power curve gives the electrical power output as a
function of the hub height wind speed. Figure 1.4 shows an example of a power curve
for a hypothetical wind turbine.
The performance of a given wind turbine relates to three key points on the velocity
scale: i) cut-in speed which is the minimum wind speed at which the machine will
deliver useful power, ii) rated wind speed at which the rated power is reached, and iii)
3
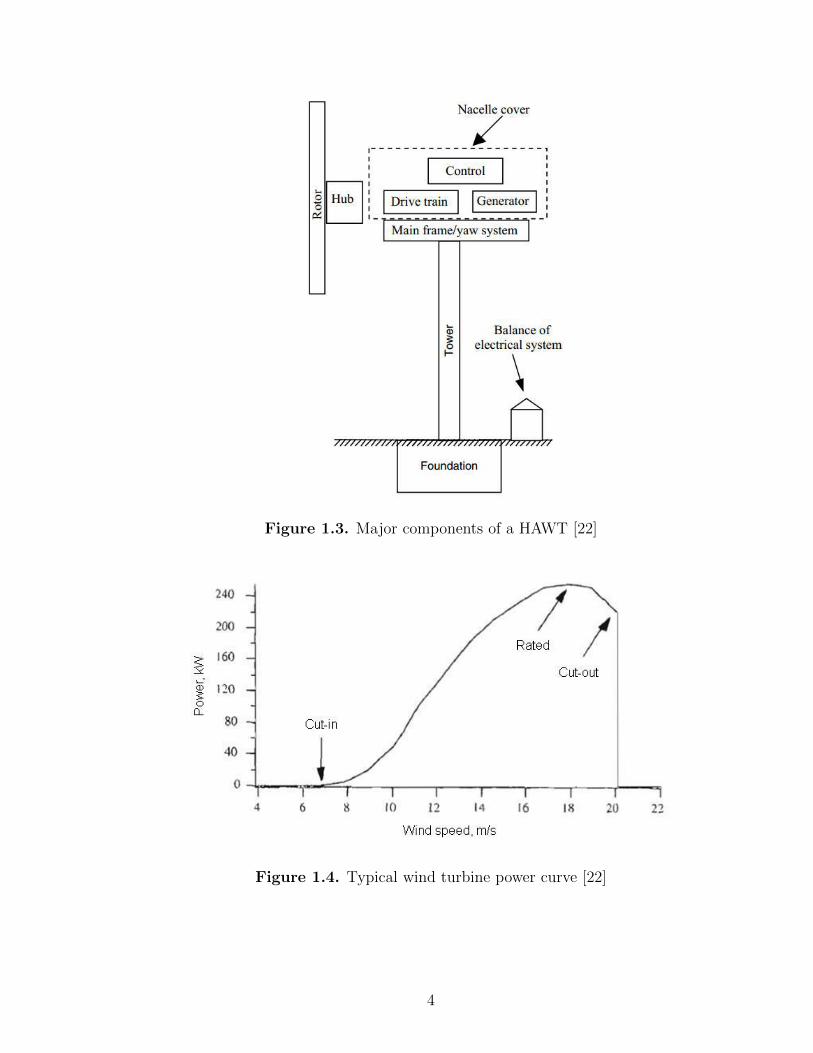
Figure 1.3. Major components of a HAWT [22]
Figure 1.4. Typical wind turbine power curve [22]
4
the cut-out speed which is the maximum wind speed at which the turbine is allowed
to deliver power, limited by engineering design and safety constraints.
Power curves for existing machines can normally be obtained from the manu-
facturer, derived from field tests using standardized testing methods. The process
of determination of power characteristics of the wind turbine components and their
efficiencies is very complex.
1.2.2 One-Dimensional Momentum Theory and Betz Limit
From momentum theory, it can be shown that the power of a cylinder of air of
radius R and density ρ moving with a given speed v can be expressed as:
Pw =1
2ρπR2v3 (1.1)
Since the air has to flow away from the wind turbine to be in a steady-state
condition, the air stream cannot be stopped by the rotor. Thus, only a fraction of the
kinetic energy available in the wind can be extracted. This fraction is referred to as
the power coefficient, Cp of the wind turbine. The maximum value of Cp that can be
achieved is 1627
or 59.26% and this is called the Betz Limit. Therefore, the mechanical
power extracted by a wind turbine of radius R from an air stream of speed v is given
by:
Pmech = Cp1
2ρπR2v3 (1.2)
The Betz limit is the ideal theoretical Cp and in reality there is a decrease in
the maximum achievable power due to: i) rotation of wake behind the rotor, ii) fi-
nite number of blades and tip losses, and iii) non-negligible aerodynamic drag on the
rotor. The overall turbine efficiency is a function of both the Cp and the mechan-
ical/electrical efficiency of the wind turbine [22]. Equation 1.3 shows the effective
5
output power of a wind turbine, where ηo is the overall mechanical efficiency of the
drive train.
Po = ηoCp1
2ρπR2v3 (1.3)
1.2.3 Parametric Sensitivity
It can be seen from Equation 1.3 that the extractable power from the wind turbine
varies as the square of the rotor radius R and as the cube of the wind velocity v. Thus
the output of a wind turbine greatly depends on the choice of site (mean wind speed)
and the size of turbine (rotor radius). Because the potential energy produced from the
wind is directly proportional to the cube of the wind speed, increased wind speeds of
only a few meters per second can produce a significantly larger amount of electricity.
It should be noted that the Cp is not constant, so in reality most power curves are
not purely cubic. In fact, real power curves are closer to linear in the range between
cut-in and rated wind speed. The above case holds good for a given Cp at a given
wind speed and rotor radius.
6
CHAPTER 2
INTRODUCTION TO MULTI ROTOR WIND TURBINES
There has been an ever increasing growth in the size of wind turbines over the
past decade. Much progress has been seen in land-based wind turbines which have
significantly improved and stabilized at 3 MW power capacity [3]. In the past three or
four years, interest remains in yet larger turbines for land-based and mainly offshore
market.
The current generation of wind turbines have been upscaled into multi megawatt
range in terms of output power. However, the energy benefit from these large tur-
bines is offset by the increased mass and cost. In order to find the best locations to
harvest wind, it is a natural step to take wind turbines offshore, recognizing onshore
environmental impacts and the abundance of better quality wind resources at sea.
For offshore wind turbines, support structures are the main cost drivers (over 40%
of the system components cost) and it is vital to extract the maximum effect of the
wind [23]. In order to do this either the rotors need to be made larger, or more than
one rotor must be used. Is up-scaling economically viable?
Twenty MW wind turbines are now possible to manufacture with rotor diameters
around 200 m, according to a new report from the EU-funded UpWind project in
2011. This conclusion was not arrived at by simply geometrically up-scaling a 5 MW
machine. The design was highly modified: the blades are based on a lighter, better
design, with unique adaptations to the design of the controls and sensors. Whether
such a large wind turbine is economically feasible remains to be seen. Figure 2.1
illustrates the growth in wind turbine size since 1985. The question is, how much
7
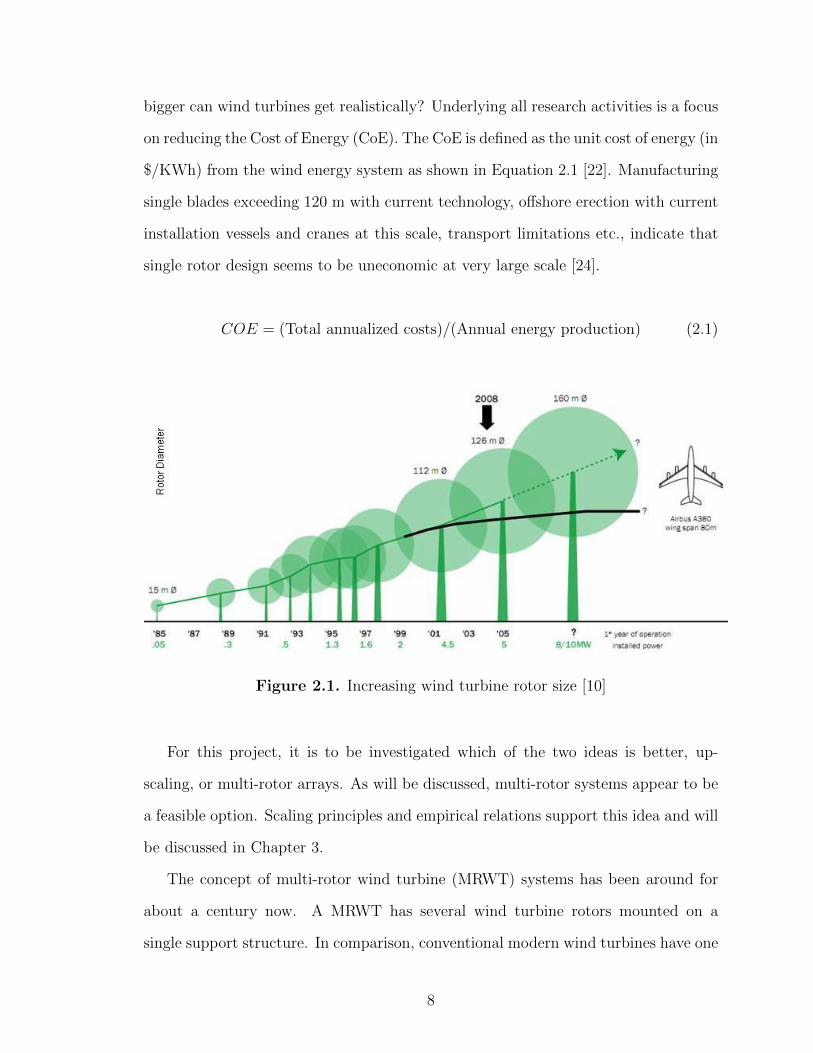
bigger can wind turbines get realistically? Underlying all research activities is a focus
on reducing the Cost of Energy (CoE). The CoE is defined as the unit cost of energy (in
$/KWh) from the wind energy system as shown in Equation 2.1 [22]. Manufacturing
single blades exceeding 120 m with current technology, offshore erection with current
installation vessels and cranes at this scale, transport limitations etc., indicate that
single rotor design seems to be uneconomic at very large scale [24].
COE = (Total annualized costs)/(Annual energy production) (2.1)
Figure 2.1. Increasing wind turbine rotor size [10]
For this project, it is to be investigated which of the two ideas is better, up-
scaling, or multi-rotor arrays. As will be discussed, multi-rotor systems appear to be
a feasible option. Scaling principles and empirical relations support this idea and will
be discussed in Chapter 3.
The concept of multi-rotor wind turbine (MRWT) systems has been around for
about a century now. A MRWT has several wind turbine rotors mounted on a
single support structure. In comparison, conventional modern wind turbines have one
8
rotor. The initial motivation for making multi rotors was in the difficulty of making
very large blades due to technology limitations. This was overcome by modern glass
composites and the multi-rotor idea has until recently been neglected.
2.1 Merits and Drawbacks of MRWTs
In so far as multi-rotor wind turbines are so different from conventional wind
turbines, it is worth summarizing what some of their anticipated advantages (merits)
and disadvantages (drawbacks) are.
Merits:
• Reduced blade mass and cost since blade weight increases with diameter faster
than power (discussed in Chapter 3).
• Reduced total rotor-nacelle assembly (RNA) weight, possibly result in reduced
tower weight and cost. Reduced RNA weight means reduced weight of the
transmission-generator assembly as well as that of all the rotors.
• Greater average power due to the possibility to run the rotors at different (vari-
able) speeds. Possibly increased average power output due to interaction of
wake vortices of closely spaced turbines (discussed in Chapter 3).
• Ease of installation of smaller rotors.
• Ease of repair and maintenance of smaller components.
• Ease of transport of smaller blades. Smaller components are cheaper and easier
to transport and assemble.
• 1n
th turbine malfunction upon part failure for n rotor system. Realistically, this
is feasible only if a turbine could be allowed to run with only some of its rotors
operating (unbalanced forces would need to be considered).
9
Drawbacks:
• Increased mass of steel in tower top due to support frame to hold and yaw the
multiple rotor assembly.
• Increased complexity of system overall.
• Dynamics of tower top structure. Knowledge of effects of rotor interaction and
wind shear is essential (discussed in chapter 3).
2.2 Motivation
The purpose of this thesis is to investigate whether there is any reason to think
that a land-based MRWT would be preferable to a single rotor wind turbine with
the same swept area. The project focusses on a first level analysis. Specifically, the
relative weights and costs of two turbines of the same swept area, one with a single
rotor, the other with 3 rotors, are considered. Every effort is made to insure that
this is an ”apples to apples” comparison. That is, the same tip speed ratio and same
number of blades are used on each rotor, the same type of tower, the same wind
speeds, and the same wind shear etc. are used. To do this, a scaling model is chosen.
The design stresses are not used as design driver, but the stresses are accounted for.
This will be discussed in detail in Chapter 3. The work is divided into two parts, the
first pertains to scaling studies adopted to determine the economic feasibilty of the
design, and the second discusses the design of the structure to determine its structural
feasibility.
2.3 Overview of Key Historical Precedents
This section explains the history of MRWTs keeping in mind the design concept
developments. There have been several multi-rotor concepts over the past decade,
employing vertical axis, uniaxial etc., machines. However, these concepts do not
10
contribute much to the key concepts of wind turbine scaling, and horizontal-axis
single-plane multi-rotor systems and therefore will not be discussed.
2.3.1 Early MRWT Designs
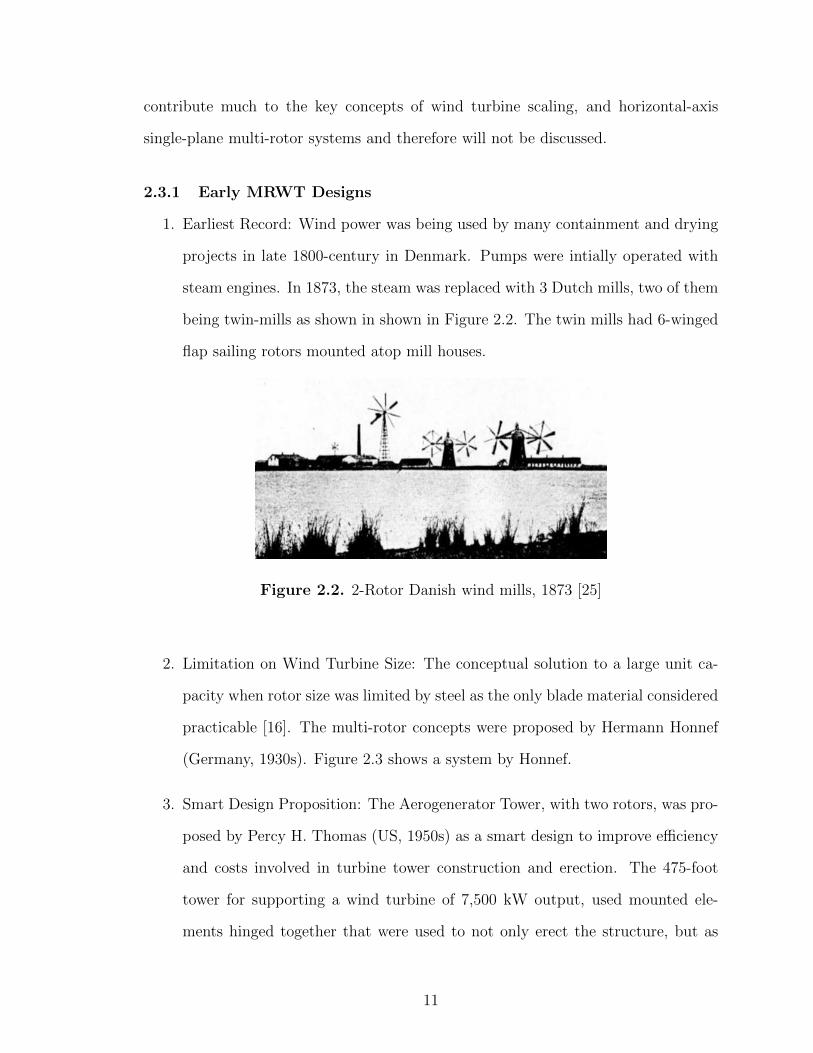
1. Earliest Record: Wind power was being used by many containment and drying
projects in late 1800-century in Denmark. Pumps were intially operated with
steam engines. In 1873, the steam was replaced with 3 Dutch mills, two of them
being twin-mills as shown in shown in Figure 2.2. The twin mills had 6-winged
flap sailing rotors mounted atop mill houses.
Figure 2.2. 2-Rotor Danish wind mills, 1873 [25]
2. Limitation on Wind Turbine Size: The conceptual solution to a large unit ca-
pacity when rotor size was limited by steel as the only blade material considered
practicable [16]. The multi-rotor concepts were proposed by Hermann Honnef
(Germany, 1930s). Figure 2.3 shows a system by Honnef.
3. Smart Design Proposition: The Aerogenerator Tower, with two rotors, was pro-
posed by Percy H. Thomas (US, 1950s) as a smart design to improve efficiency
and costs involved in turbine tower construction and erection. The 475-foot
tower for supporting a wind turbine of 7,500 kW output, used mounted ele-
ments hinged together that were used to not only erect the structure, but as
11
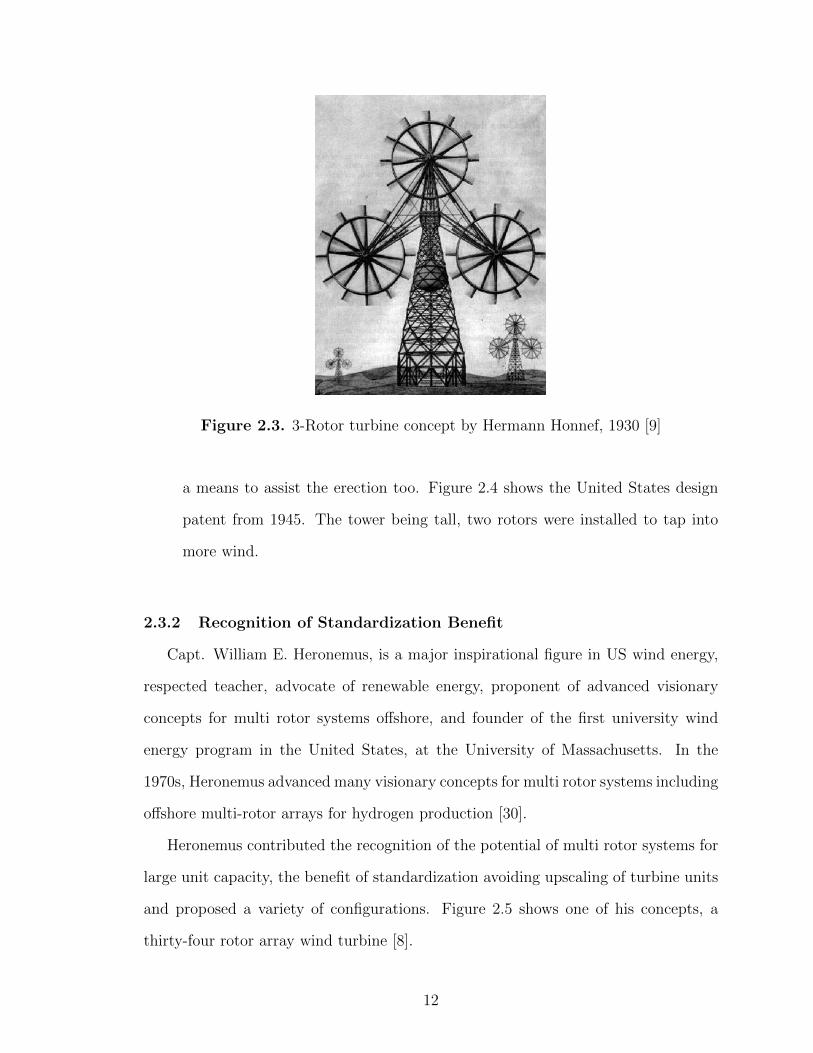
Figure 2.3. 3-Rotor turbine concept by Hermann Honnef, 1930 [9]
a means to assist the erection too. Figure 2.4 shows the United States design
patent from 1945. The tower being tall, two rotors were installed to tap into
more wind.
2.3.2 Recognition of Standardization Benefit
Capt. William E. Heronemus, is a major inspirational figure in US wind energy,
respected teacher, advocate of renewable energy, proponent of advanced visionary
concepts for multi rotor systems offshore, and founder of the first university wind
energy program in the United States, at the University of Massachusetts. In the
1970s, Heronemus advanced many visionary concepts for multi rotor systems including
offshore multi-rotor arrays for hydrogen production [30].
Heronemus contributed the recognition of the potential of multi rotor systems for
large unit capacity, the benefit of standardization avoiding upscaling of turbine units
and proposed a variety of configurations. Figure 2.5 shows one of his concepts, a
thirty-four rotor array wind turbine [8].
12
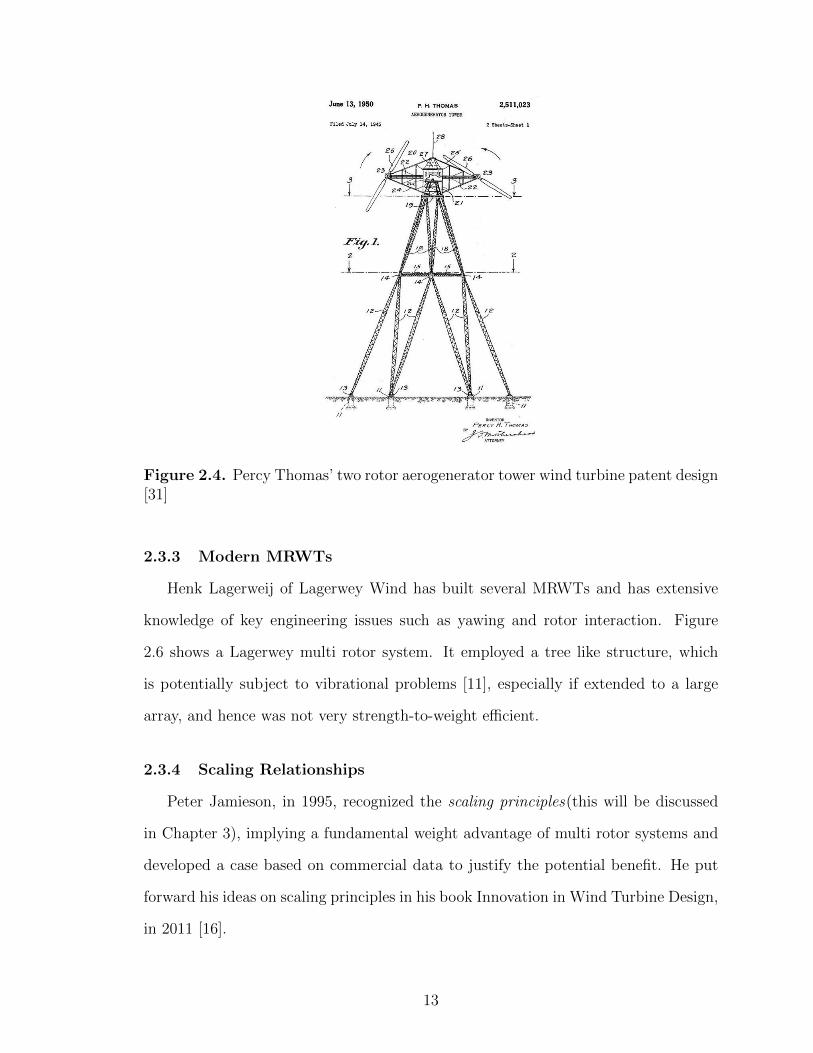
Figure 2.4. Percy Thomas’ two rotor aerogenerator tower wind turbine patent design[31]
2.3.3 Modern MRWTs
Henk Lagerweij of Lagerwey Wind has built several MRWTs and has extensive
knowledge of key engineering issues such as yawing and rotor interaction. Figure
2.6 shows a Lagerwey multi rotor system. It employed a tree like structure, which
is potentially subject to vibrational problems [11], especially if extended to a large
array, and hence was not very strength-to-weight efficient.
2.3.4 Scaling Relationships
Peter Jamieson, in 1995, recognized the scaling principles(this will be discussed
in Chapter 3), implying a fundamental weight advantage of multi rotor systems and
developed a case based on commercial data to justify the potential benefit. He put
forward his ideas on scaling principles in his book Innovation in Wind Turbine Design,
in 2011 [16].
13
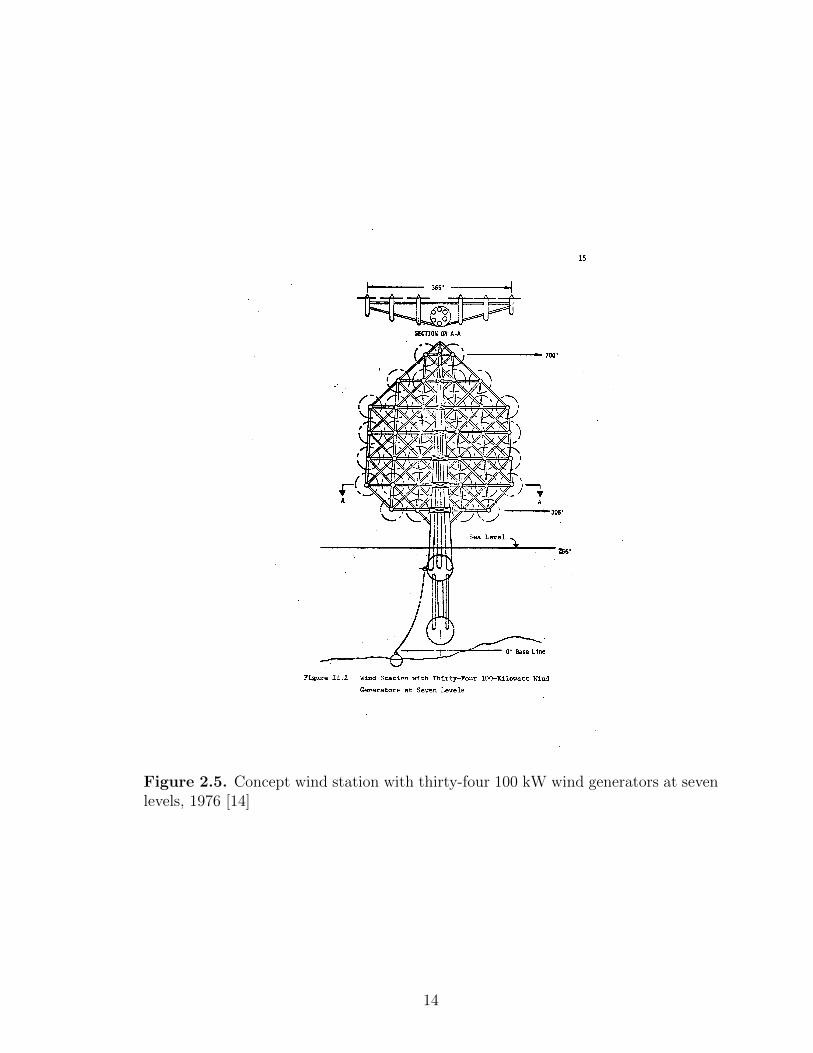
Figure 2.5. Concept wind station with thirty-four 100 kW wind generators at sevenlevels, 1976 [14]
14
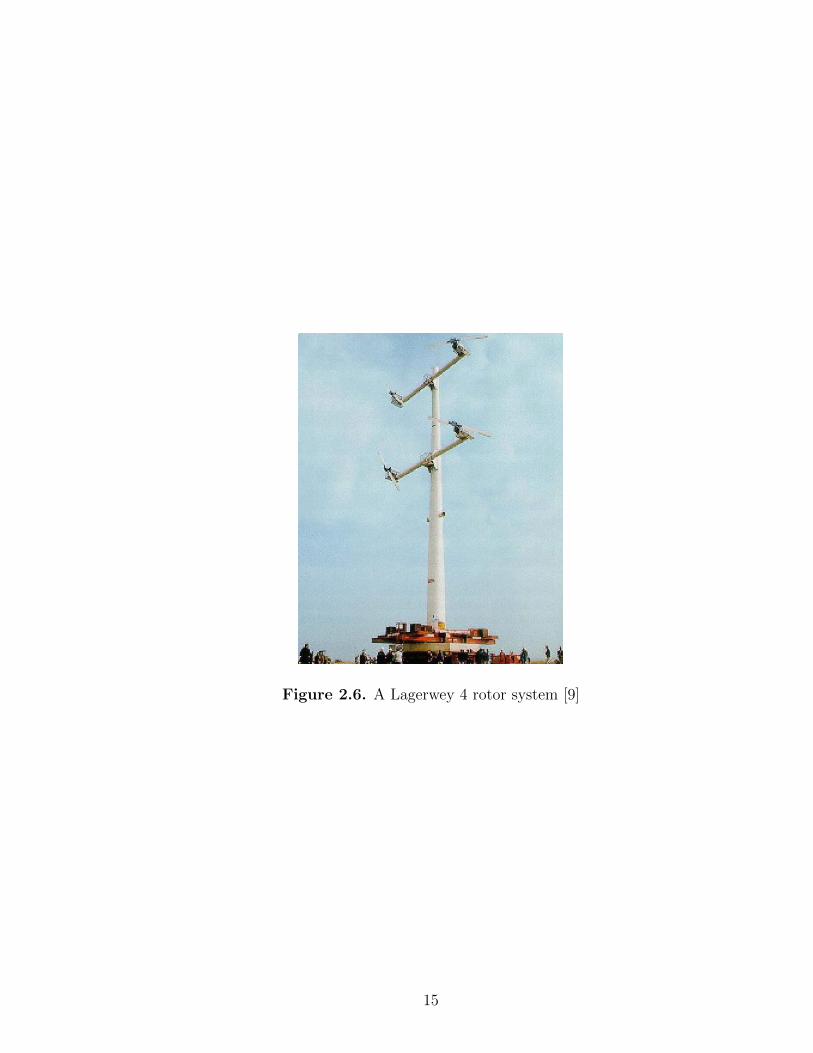
Figure 2.6. A Lagerwey 4 rotor system [9]
15
CHAPTER 3
SCALING ECONOMICS
There have been several attempts to develop modern scaling models for HAWTs.
But because wind turbines have changed in size and configuration so rapidly, many
models are out of date before they can be used effectively by designers. In the mid to
late 1990s, the configuration for utility-scale turbines began to stabilize around the
three-bladed, upwind design [3]. This chapter describes scaling of wind turbines in
the multi megawatt range and MRWT design concepts with respect to HAWTs.
3.1 Scaling Trends
3.1.1 Geomteric Scaling
The simplest scaling procedure is to simply multiply the dimensions of an object
uniformly by a similar factor. This method is called geometric scaling which is refered
to as the 0th order of scaling.
The area of any 3D object scales as the square of the length, whereas the volume
scales as the cube of the length. Thus, upscaling rotor size by a small fraction
(geometric scaling) significantly increases the rotor mass and cost. This relationship,
known as the area-volume relationship has been adopted by Jamieson to show that
having multiple small rotors, each generating a fraction of the total power proves to
be more mass effective than a single large rotor of the same power capacity [15]. The
mass advantage is observed in the rotor and drive train components.
16
The above concept is expressed mathematically as
K = n
(d
D
)3
=nm
M=
1√n
(3.1)
where n is the number of rotors of the MRWT and m is the associated mass and d
is the diameter of each rotor of the MRWT, M is the mass and D is the diameter
of the single large rotor, and K is the ratio of masses of the two systems [15]. The
1√n
formula clearly describes the mass advantage (which could mean a cost benefit)
of downscaling. In other words, if the rotor diameter is halved, the area (and hence
the amount of wind captured) is quartered. However, the mass has decreased to an
eighth. Simply put, the mass decreases faster than power with decreasing diameter.
3.1.2 Dynamic Scaling
In a scaling scenario, physical quantities such as load, size, weight etc. vary with
the scale factor. In dynamic scaling, let pre-numbers be defined as relations between
these physical quantities such that the pre-numbers do not vary with the scale factor.
For example, limiting stress is one such pre-number in strength-to-weight problems.
Thus stress can be used as the design driver, which allows modifying dimensions and
offers flexibility relative to the geometric scaling method as it depends on material
properties. This method is referred to as the 1st order of scaling. This method of
scaling was not used for the project. However, the stresses are accounted for and will
be discussed next.
3.1.3 Empirical Scaling
The 2nd order of scaling is based on scaling models developed from published
wind turbine design and cost data. Scaling curves obtained from plotting the various
wind turbine components’ weight/cost for a range of rotor size give us mathematical
models of design augmentation with size. This scaling method is preferred simply be-
17
cause, not only does it accomodate geometric and dynamic scaling as compared with
published price data, but it is based on successful designs, and includes technological
advancements with increasing rotor size over time.
The U.S. Department of Energy’s (DoE’s) Wind Partnership for Advanced Com-
ponent Technologies (WindPACT) projects are studies undertaken to identify tech-
nology improvements in wind turbines to enable decrease in the CoE [13] [21]. The
projects examined a number of conceptual designs of turbines to determine the impact
of increasing machine size on total CoE based on published data. NREL’s National
Wind Technology Center (NWTC) developed a spreadsheet model based primarily
on the WindPACT rotor study of scaling relationships to project turbine costs. Fig-
ure 3.1 shows the tower mass scaling relationships from the WindPACT study. This
thesis mainly uses the NREL scaling model for the MRWT component design.
Figure 3.1. NREL study tower mass scaling [11]
18
3.2 Scaling Effects on Wind Turbine Design
Empirical models provide component weights and costs. Using such models to
downscale for the purpose of MRWTs calls for certain design considerations that are
not included in the scaling laws. The scaling effects to be considered are:
1. Tip Speed: In upscaling a wind turbine, a consistent basis of comparison re-
quires that a representative tip speed is constant. This preserves the flow ge-
ometry in terms of the relationship between rotor speed and wind speed at any
given operating point. Maintaining a given tip speed at any given wind speed
implies that in up-scaling, rotor angular velocity, ω, must vary inversely with
diameter, D, and decrease with increasing turbine size [16]. For this project,
the MRWT rotors are designed for same tip speed as the single large rotor.
2. Self Weight Loads Scaling: The blade bending load due to self weight will be
proportional to the product of the mass scaling as D3 and a moment arm scaled
as D. Hence blade bending moments will scale as D4. Thus for larger blades,
the self weight of the blade becomes a design driver. This warrants higher
design factor of safety in terms of stresses. This project involves downscaling.
Therefore, self weight load scaling is not applicable.
3. Population and Sample Effect Sizes: This term comes from fracture mechanics
of materials. For homogeneous materials, the larger the sample size, the greater
the probability of critical flaw existing in a given sample. This implies that at
some level of upscaling it is not adequate to design for constant stress. Instead
a reducing stress allowable must be adopted. This is equivalent to mass scaling
more than cubically [27]. This is significant when the estimated effect sizes are
large or are statistically significant. In this case, effect on size will be negligible,
since the number of components will only increase three-fold and therefore will
not be considered in this project.
19

4. Lift and Drag Coefficients: For a boundary layer around the airfoil sections
of the blade, the Reynold’s number characterizes the effect of the boundary
layer and it is found that flow around the airfoil and its associated lift and drag
coefficients depend not only on shape, but on the size of the airfoil too. This is a
minor effect, almost negligible for medium (850 kW to 1,500 kW for land-based)
and large wind turbines [27].
5. Wind Shear: It is rate of change of wind speed or direction with distance. The
wind speed at a certain height above ground level is given by the power law.
v = vref
(z
zref
)α
(3.2)
where v and vref are the mean wind speeds at the heights z and zref , respectively.
The assumption of a normal wind profile or the power law relation is a common
approach used in the wind energy industry to estimate the wind speed v at a
higher elevation z using surface (usually at 10 m) or tower measurements of
wind speeds vref at reference height zref . The shear exponent α is typically
assumed to be equal to 0.2.
With respect to upscaling, wind shear implies that scaling will result in an
increase in power from the wind turbine greater than in proportion to swept
area or diameter squared because, as hub height increases, the associated wind
speed is also increasing. However, it should be noted that the increase in wind
speed with height will also imply an increase in loads thus diminishing any likely
benefits from increased swept area [27]. Wind shear effects will be included in
the design of the multi-rotor system.
The scaling method adopted and the above mentioned fundamental scaling issues
imply that, in down-scaling the NREL 5 MW baseline wind turbiine, the stresses
would not be greatly affected and will remain within and above safe limits.
20
3.3 Aerodynamic Interaction
One of the important factors of wind turbine design is the aerodynamics. A multi-
rotor system will require a careful analysis of the aerodynamics due to the interaction
of rotors in an array in the same wind field.
Smulders, et.all [28] showed through tunnel testing that for two adjacent rotors
with no overlap, the average power output of a two rotor system is slightly higher
than that of two single rotors, especially if the spacing of the tips is very small. This
is true for the situation of co-rotation as well as counter-rotation. The effects are due
to wake rotation, more specifically of the interaction of wake vortices. As regards the
forces on the two-rotor system, the test results concluded that the contribution of the
axial forces keep the up-wind rotor systems headed out into the wind. If the distance
between the rotor plane and yawing axis is too large then the side forces working on
the plane tend to turn the rotor out of the wind [28]. The paper suggests that rotors
placed adjacent to each other give slightly higher average output power. It should be
noted that, these tests were done on 20 cm diameter rotors. Therefore, more study
is needed in this area.
Wind tunnel tests conducted by Southwest Research Intitute (SwRI) for Ocean
Wind Energy Systems (OWES) on a seven-rotor array of 400 W capacity each showed
similar results. It was determined that rotor spacing of as little as 2% of the rotor
diameter resulted in little or no blade interaction [26].
These results strengthen the case for multi-rotor arrays being feasible without
detrimental aerodynamic interactions. Nevertheless, more work is needed to under-
stand the behaviour of multi-rotor aerodynamics and it may well be a whole study
of its own. For the design of the MRWT in this thesis, in consideration of the results
of the Sumlders and SwRI study, it is assumed that there will be no effect on energy
production, one way or the other, due to changing the number of rotors.
21
3.4 Other Scaling Facts
For any given design style, nacelle mass is very much determined by turbine torque
rating, which scales as the cube of diameter. This implies that with consistent design
at the same level of technology development, the scaling exponent of nacelle mass will
be cubic. It appears that nacelle mass for commercial turbines scales approximately
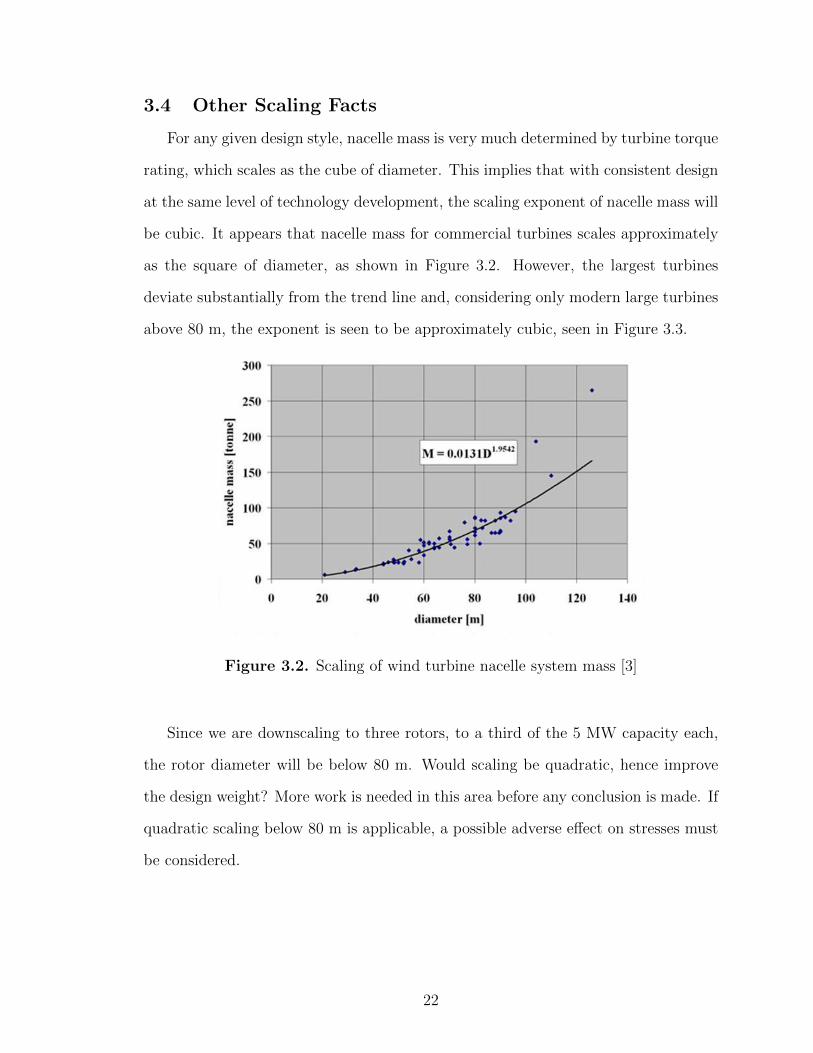
as the square of diameter, as shown in Figure 3.2. However, the largest turbines
deviate substantially from the trend line and, considering only modern large turbines
above 80 m, the exponent is seen to be approximately cubic, seen in Figure 3.3.
Figure 3.2. Scaling of wind turbine nacelle system mass [3]
Since we are downscaling to three rotors, to a third of the 5 MW capacity each,
the rotor diameter will be below 80 m. Would scaling be quadratic, hence improve
the design weight? More work is needed in this area before any conclusion is made. If
quadratic scaling below 80 m is applicable, a possible adverse effect on stresses must
be considered.
22

Figure 3.3. Wind turbine nacelle system mass above 80m diameter [3]
3.5 5 MW Three-Rotor Wind Turbine RNA Components
This section presents the general framework and design for the RNA of the multi-
rotor assembly based on scaling fundamentals. The RNA component weights are
obtained using NREL scaling studies.
3.5.1 Properties of Down-Scaled RNA
In the present work, the baseline for comparison purposes is the ’NREL 5 MW
Baseline Wind Turbine’ [18]. It is a conventional three bladed up-wind representa-
tive utility-scale multi-megawatt turbine, and is variable-speed variable blade-pitch-
to-feather-controlled. It was chosen for the extensive information about it readily
available. Table 3.1 shows the turbine properties. It is a broad design based on in-
formation published by various turbine manufacturers with heavy emphasis on the
REpower 5 MW machine. The model has been, and will likely continue to be, used as
a reference by research teams throughout the world for advanced land- and sea-based
wind energy technologies [18].
23
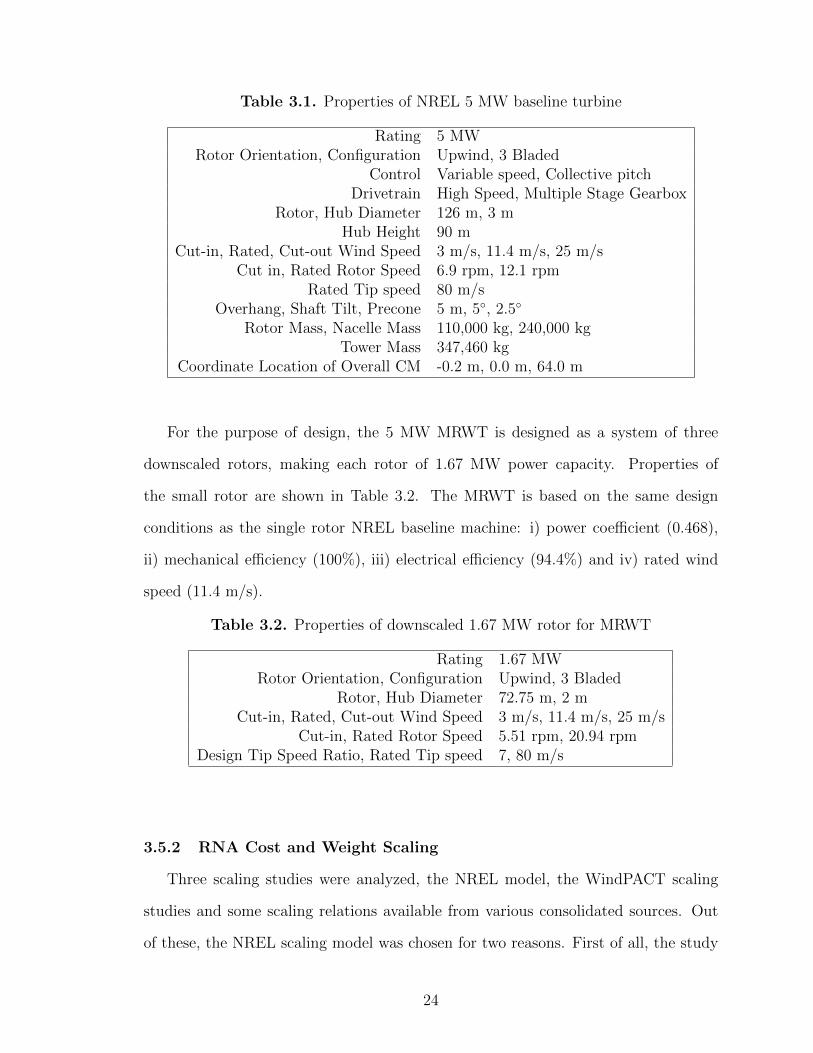
Table 3.1. Properties of NREL 5 MW baseline turbine
Rating 5 MWRotor Orientation, Configuration Upwind, 3 Bladed
Control Variable speed, Collective pitchDrivetrain High Speed, Multiple Stage Gearbox
Rotor, Hub Diameter 126 m, 3 mHub Height 90 m
Cut-in, Rated, Cut-out Wind Speed 3 m/s, 11.4 m/s, 25 m/sCut in, Rated Rotor Speed 6.9 rpm, 12.1 rpm
Rated Tip speed 80 m/sOverhang, Shaft Tilt, Precone 5 m, 5◦, 2.5◦
Rotor Mass, Nacelle Mass 110,000 kg, 240,000 kgTower Mass 347,460 kg
Coordinate Location of Overall CM -0.2 m, 0.0 m, 64.0 m
For the purpose of design, the 5 MW MRWT is designed as a system of three
downscaled rotors, making each rotor of 1.67 MW power capacity. Properties of
the small rotor are shown in Table 3.2. The MRWT is based on the same design
conditions as the single rotor NREL baseline machine: i) power coefficient (0.468),
ii) mechanical efficiency (100%), iii) electrical efficiency (94.4%) and iv) rated wind
speed (11.4 m/s).
Table 3.2. Properties of downscaled 1.67 MW rotor for MRWT
Rating 1.67 MWRotor Orientation, Configuration Upwind, 3 Bladed
Rotor, Hub Diameter 72.75 m, 2 mCut-in, Rated, Cut-out Wind Speed 3 m/s, 11.4 m/s, 25 m/s
Cut-in, Rated Rotor Speed 5.51 rpm, 20.94 rpmDesign Tip Speed Ratio, Rated Tip speed 7, 80 m/s
3.5.2 RNA Cost and Weight Scaling
Three scaling studies were analyzed, the NREL model, the WindPACT scaling
studies and some scaling relations available from various consolidated sources. Out
of these, the NREL scaling model was chosen for two reasons. First of all, the study
24
proved to arrive at numbers closer to the NREL 5 MW baseline turbine components,
especially the blades which contribute mainly towards the cost of the RNA [18].
Secondly, the NREL study is a newer study.
The NREL scaling study was conduted using data available as of 2002 and the
results of each study are in 2002 dollars. This was not adjusted as the two assem-
blies being compared examine the percentage change in cost and weight rather than
absolute numbers. Fixed charge costs such as Initial Capital Cost, Annual Operating
Expenses etc. were not calculated. As mentioned before, this is a first level analysis
and only the turbine component costs were considered.
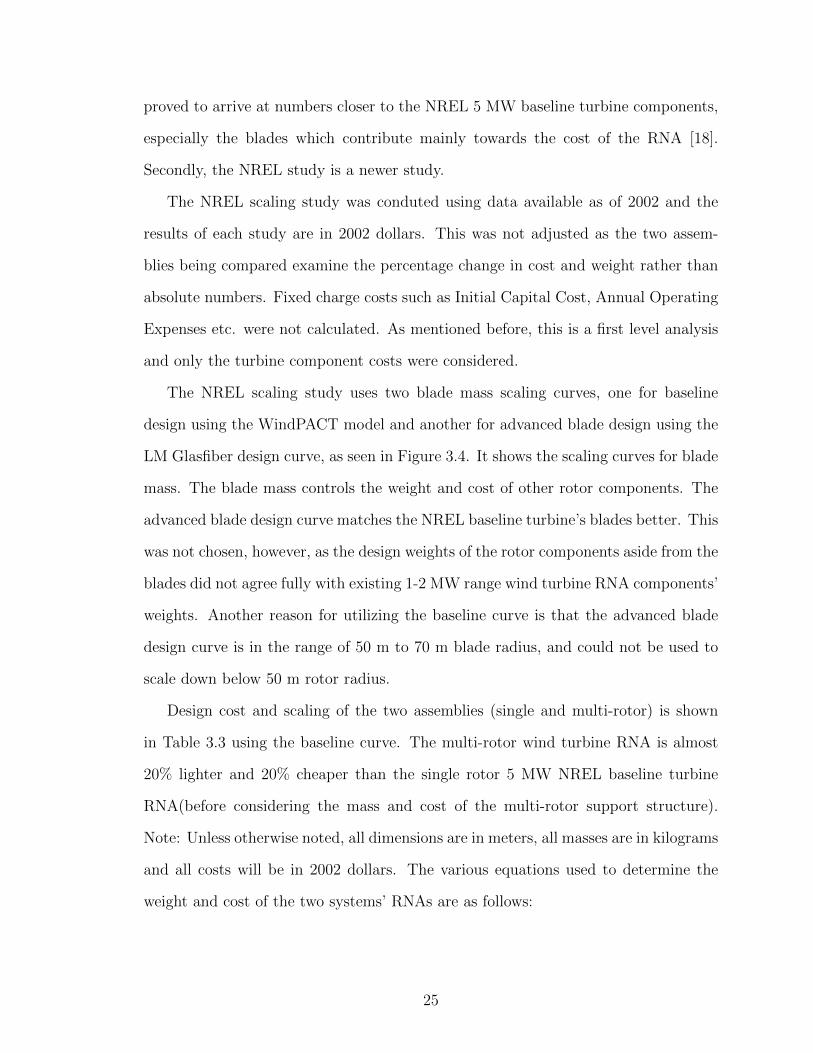
The NREL scaling study uses two blade mass scaling curves, one for baseline
design using the WindPACT model and another for advanced blade design using the
LM Glasfiber design curve, as seen in Figure 3.4. It shows the scaling curves for blade
mass. The blade mass controls the weight and cost of other rotor components. The
advanced blade design curve matches the NREL baseline turbine’s blades better. This
was not chosen, however, as the design weights of the rotor components aside from the
blades did not agree fully with existing 1-2 MW range wind turbine RNA components’
weights. Another reason for utilizing the baseline curve is that the advanced blade
design curve is in the range of 50 m to 70 m blade radius, and could not be used to
scale down below 50 m rotor radius.
Design cost and scaling of the two assemblies (single and multi-rotor) is shown
in Table 3.3 using the baseline curve. The multi-rotor wind turbine RNA is almost
20% lighter and 20% cheaper than the single rotor 5 MW NREL baseline turbine
RNA(before considering the mass and cost of the multi-rotor support structure).
Note: Unless otherwise noted, all dimensions are in meters, all masses are in kilograms
and all costs will be in 2002 dollars. The various equations used to determine the
weight and cost of the two systems’ RNAs are as follows:
25
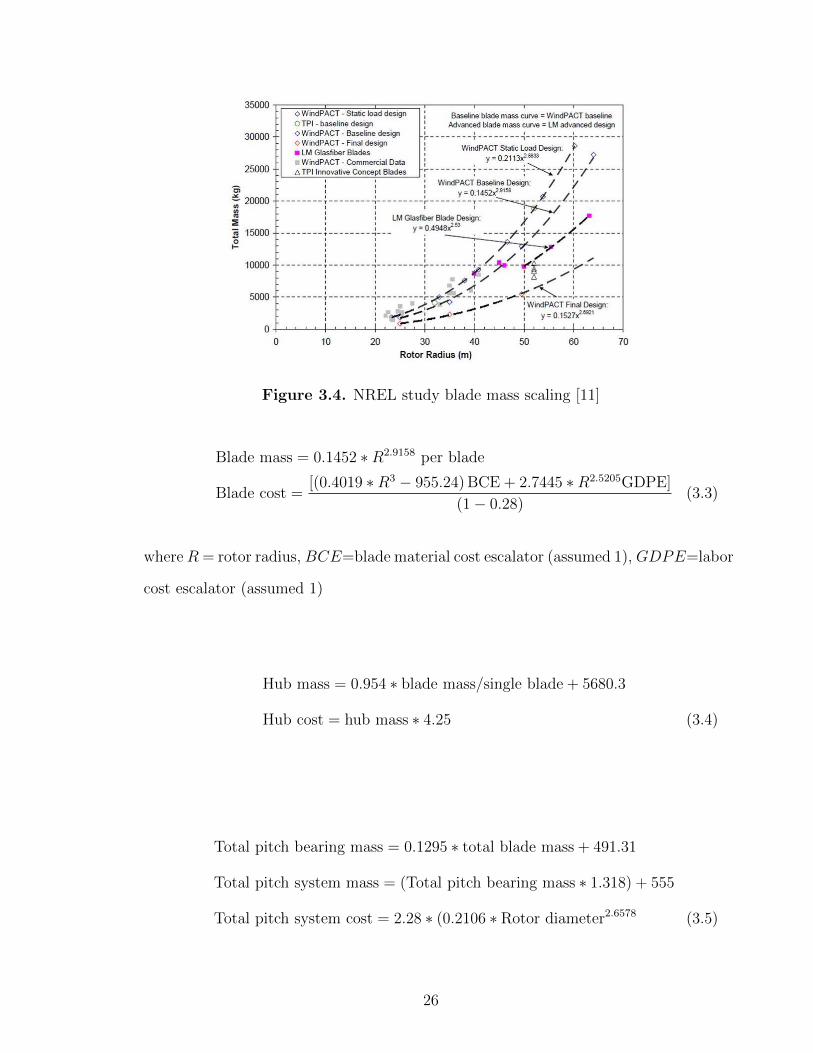
Figure 3.4. NREL study blade mass scaling [11]
Blade mass = 0.1452 ∗R2.9158 per blade
Blade cost =[(0.4019 ∗R3 − 955.24) BCE + 2.7445 ∗R2.5205GDPE]
(1− 0.28)(3.3)
whereR= rotor radius, BCE=blade material cost escalator (assumed 1), GDPE=labor
cost escalator (assumed 1)
Hub mass = 0.954 ∗ blade mass/single blade + 5680.3
Hub cost = hub mass ∗ 4.25 (3.4)
Total pitch bearing mass = 0.1295 ∗ total blade mass + 491.31
Total pitch system mass = (Total pitch bearing mass ∗ 1.318) + 555
Total pitch system cost = 2.28 ∗ (0.2106 ∗ Rotor diameter2.6578 (3.5)
26
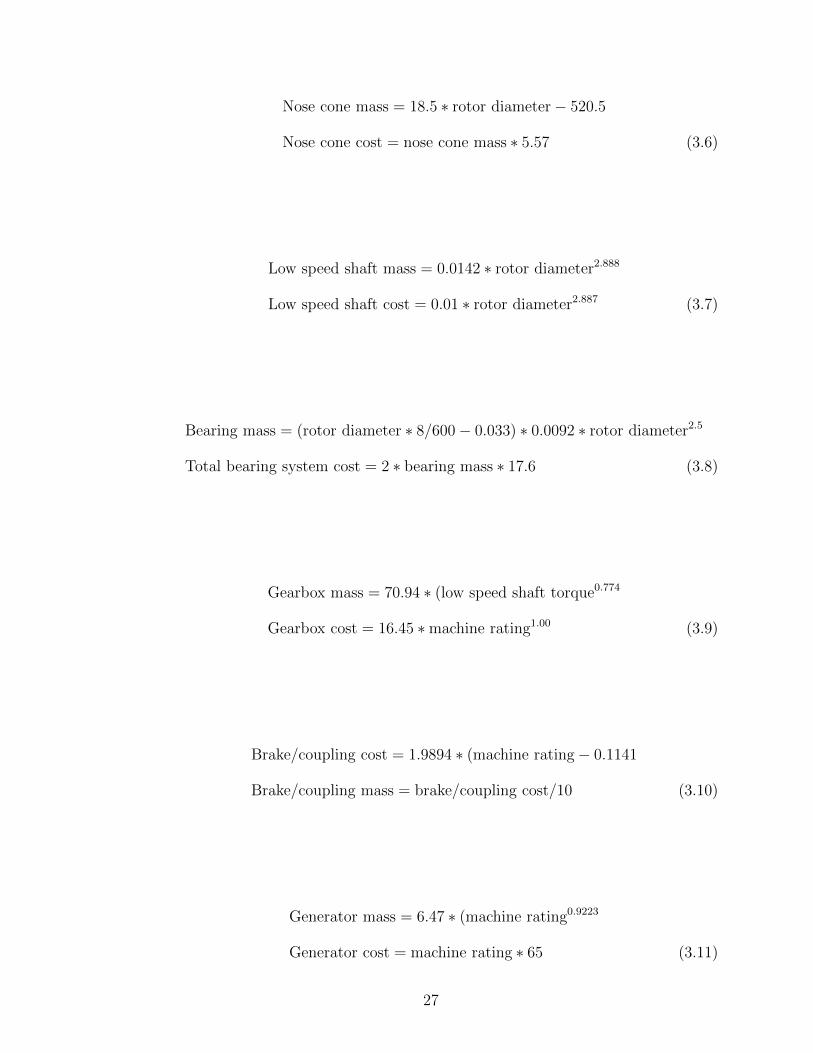
Nose cone mass = 18.5 ∗ rotor diameter− 520.5
Nose cone cost = nose cone mass ∗ 5.57 (3.6)
Low speed shaft mass = 0.0142 ∗ rotor diameter2.888
Low speed shaft cost = 0.01 ∗ rotor diameter2.887 (3.7)
Bearing mass = (rotor diameter ∗ 8/600− 0.033) ∗ 0.0092 ∗ rotor diameter2.5
Total bearing system cost = 2 ∗ bearing mass ∗ 17.6 (3.8)
Gearbox mass = 70.94 ∗ (low speed shaft torque0.774
Gearbox cost = 16.45 ∗machine rating1.00 (3.9)
Brake/coupling cost = 1.9894 ∗ (machine rating− 0.1141
Brake/coupling mass = brake/coupling cost/10 (3.10)
Generator mass = 6.47 ∗ (machine rating0.9223
Generator cost = machine rating ∗ 65 (3.11)
27
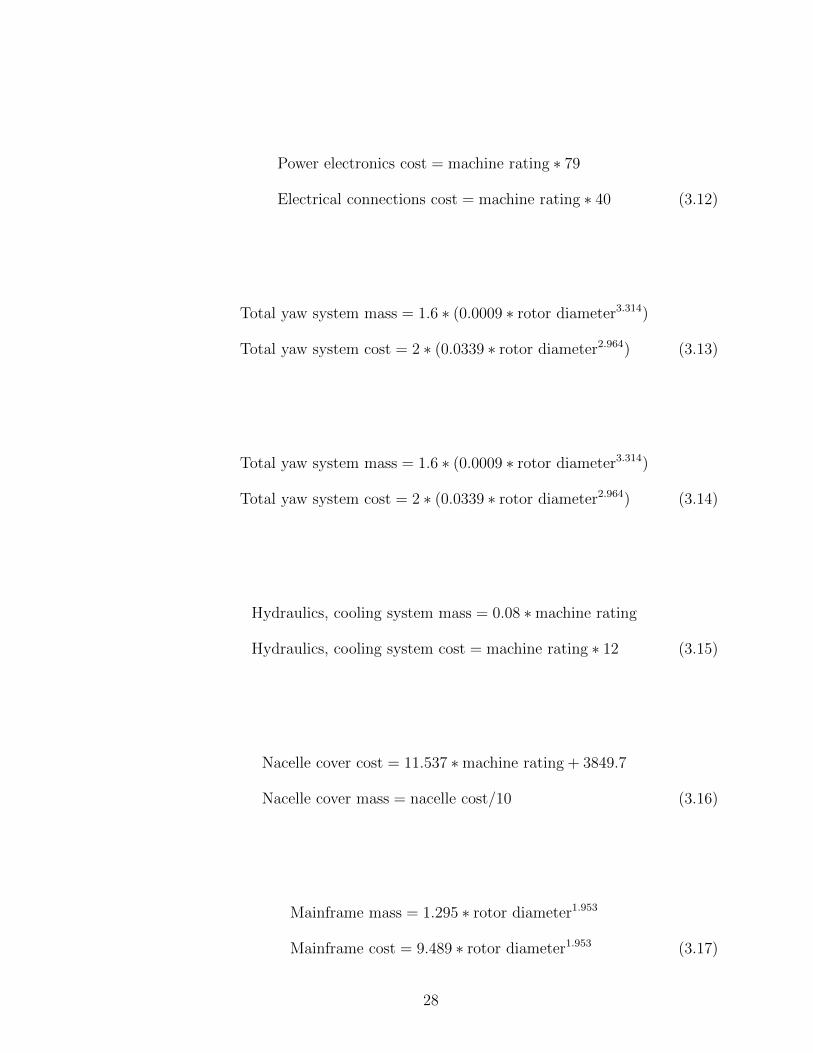
Power electronics cost = machine rating ∗ 79
Electrical connections cost = machine rating ∗ 40 (3.12)
Total yaw system mass = 1.6 ∗ (0.0009 ∗ rotor diameter3.314)
Total yaw system cost = 2 ∗ (0.0339 ∗ rotor diameter2.964) (3.13)
Total yaw system mass = 1.6 ∗ (0.0009 ∗ rotor diameter3.314)
Total yaw system cost = 2 ∗ (0.0339 ∗ rotor diameter2.964) (3.14)
Hydraulics, cooling system mass = 0.08 ∗machine rating
Hydraulics, cooling system cost = machine rating ∗ 12 (3.15)
Nacelle cover cost = 11.537 ∗machine rating + 3849.7
Nacelle cover mass = nacelle cost/10 (3.16)
Mainframe mass = 1.295 ∗ rotor diameter1.953
Mainframe cost = 9.489 ∗ rotor diameter1.953 (3.17)
28
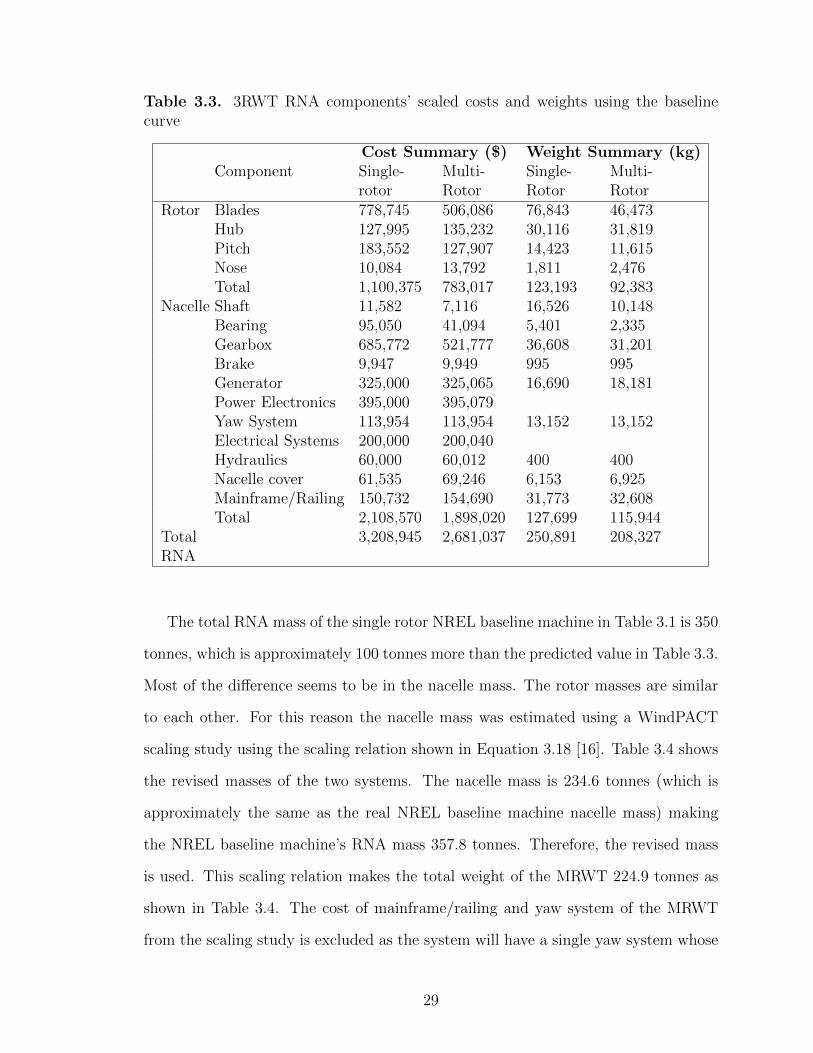
Table 3.3. 3RWT RNA components’ scaled costs and weights using the baselinecurve
Cost Summary ($) Weight Summary (kg)Component Single-
rotorMulti-Rotor
Single-Rotor
Multi-Rotor
Rotor Blades 778,745 506,086 76,843 46,473Hub 127,995 135,232 30,116 31,819Pitch 183,552 127,907 14,423 11,615Nose 10,084 13,792 1,811 2,476Total 1,100,375 783,017 123,193 92,383
Nacelle Shaft 11,582 7,116 16,526 10,148Bearing 95,050 41,094 5,401 2,335Gearbox 685,772 521,777 36,608 31,201Brake 9,947 9,949 995 995Generator 325,000 325,065 16,690 18,181Power Electronics 395,000 395,079Yaw System 113,954 113,954 13,152 13,152Electrical Systems 200,000 200,040Hydraulics 60,000 60,012 400 400Nacelle cover 61,535 69,246 6,153 6,925Mainframe/Railing 150,732 154,690 31,773 32,608Total 2,108,570 1,898,020 127,699 115,944
TotalRNA
3,208,945 2,681,037 250,891 208,327
The total RNA mass of the single rotor NREL baseline machine in Table 3.1 is 350
tonnes, which is approximately 100 tonnes more than the predicted value in Table 3.3.
Most of the difference seems to be in the nacelle mass. The rotor masses are similar
to each other. For this reason the nacelle mass was estimated using a WindPACT
scaling study using the scaling relation shown in Equation 3.18 [16]. Table 3.4 shows
the revised masses of the two systems. The nacelle mass is 234.6 tonnes (which is
approximately the same as the real NREL baseline machine nacelle mass) making
the NREL baseline machine’s RNA mass 357.8 tonnes. Therefore, the revised mass
is used. This scaling relation makes the total weight of the MRWT 224.9 tonnes as
shown in Table 3.4. The cost of mainframe/railing and yaw system of the MRWT
from the scaling study is excluded as the system will have a single yaw system whose
29
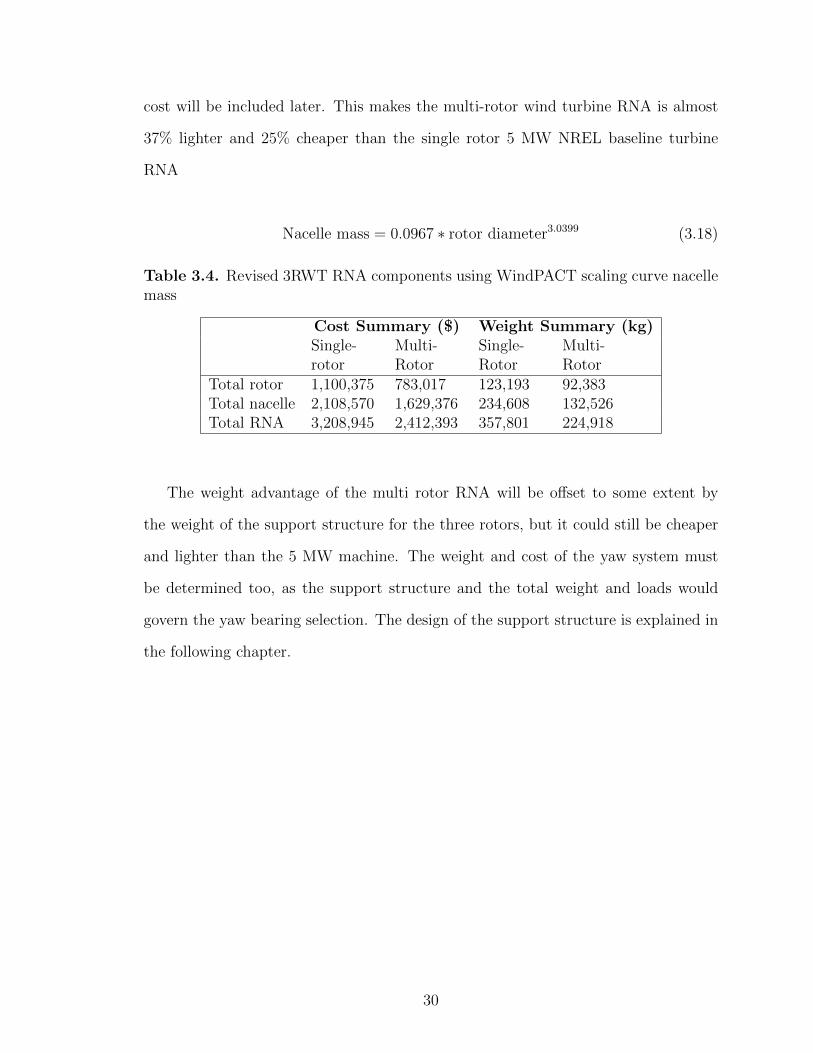
cost will be included later. This makes the multi-rotor wind turbine RNA is almost
37% lighter and 25% cheaper than the single rotor 5 MW NREL baseline turbine
RNA
Nacelle mass = 0.0967 ∗ rotor diameter3.0399 (3.18)
Table 3.4. Revised 3RWT RNA components using WindPACT scaling curve nacellemass
Cost Summary ($) Weight Summary (kg)Single-rotor
Multi-Rotor
Single-Rotor
Multi-Rotor
Total rotor 1,100,375 783,017 123,193 92,383Total nacelle 2,108,570 1,629,376 234,608 132,526Total RNA 3,208,945 2,412,393 357,801 224,918
The weight advantage of the multi rotor RNA will be offset to some extent by
the weight of the support structure for the three rotors, but it could still be cheaper
and lighter than the 5 MW machine. The weight and cost of the yaw system must
be determined too, as the support structure and the total weight and loads would
govern the yaw bearing selection. The design of the support structure is explained in
the following chapter.
30
CHAPTER 4
SUPPORT STRUCTURE DESIGN
It is required to estimate realistic costs for a feasible yaw system and compatible
structure to support three rotors at 90 m effectve hub height. There will be space
between the rotors, but it will be small, ≈ 5% rotor diameter. As previously noted,
this could conceivably result in a slight improvement in power output, but that pos-
sible improvement is not taken into account in this study [28]. In this chapter the
structural design process of the support frame, the preliminary yaw system and the
tower is presented. The key phases of the design process discussed are the objective of
the design, the loads and configurations, the scope of the research, and the iterative
design process of the whole structure. The scope of the design is as follows.
1. Advantages Considered:
• Reduced blade mass and cost
• Reduced total RNA weight
• Greater average power (due to the possibility to run the rotors at different
speeds).
2. Disadvantages Considered:
• Increased mass of steel in the multi-rotor support structure.
Cost/ease of installation, transport, turbine malfunction and dynamics of tower
top structure are not included in this design.
31
4.1 Design Requirement
The main objective is to design a support structure for the 5 MW MRWT and
compare the wieght and cost of the entire system with the NREL 5 MW baseline
wind turbine. In order to maintain a consistent basis of comparison the following
specifications are kept same as the NREL 5 MW baseline wind turbine: same tower,
three bladed rotors, rotor TSR 7, 90 m hub height, 11.4 m/s rated wind speed, 0.14
wind shear exponent.
4.2 Design Specifications
4.2.1 Material
The material chosen is structural steel alloy ASTM A992 with a minimum yield
strength of 345 MPa and minimum tensile strength 448 MPa. It has density 7850
kg/m3, Young’s modulus 200 GPa and shear modulus 77 GPa which is less than the
material used in the NREL machine, but comparable and only increases the safety
factor. Keeping a safety factor of 1.8 the limiting stress for the design is 190 MPa.
4.2.2 Design conditions
The wind regime for load and safety considerations is divided into the normal wind
conditions, which will occur frequently during normal operation of a wind turbine, and
the extreme wind conditions that are defined as having a 1-year or 50-year recurrence
period, as defined in the fundamental wind turbine design standard, IEC 61400-1 [2].
The MRWT is modeled for simplified versions of two IEC design conditions (static
analysis with steady wind model):
1. Operating at rated power: This is called the Normal Turbulence Model (NTM).
2. Stationary at maximum wind: This is the Extreme Wind Speed Model (EWM).
The 50 year EWM is chosen for this design.
32
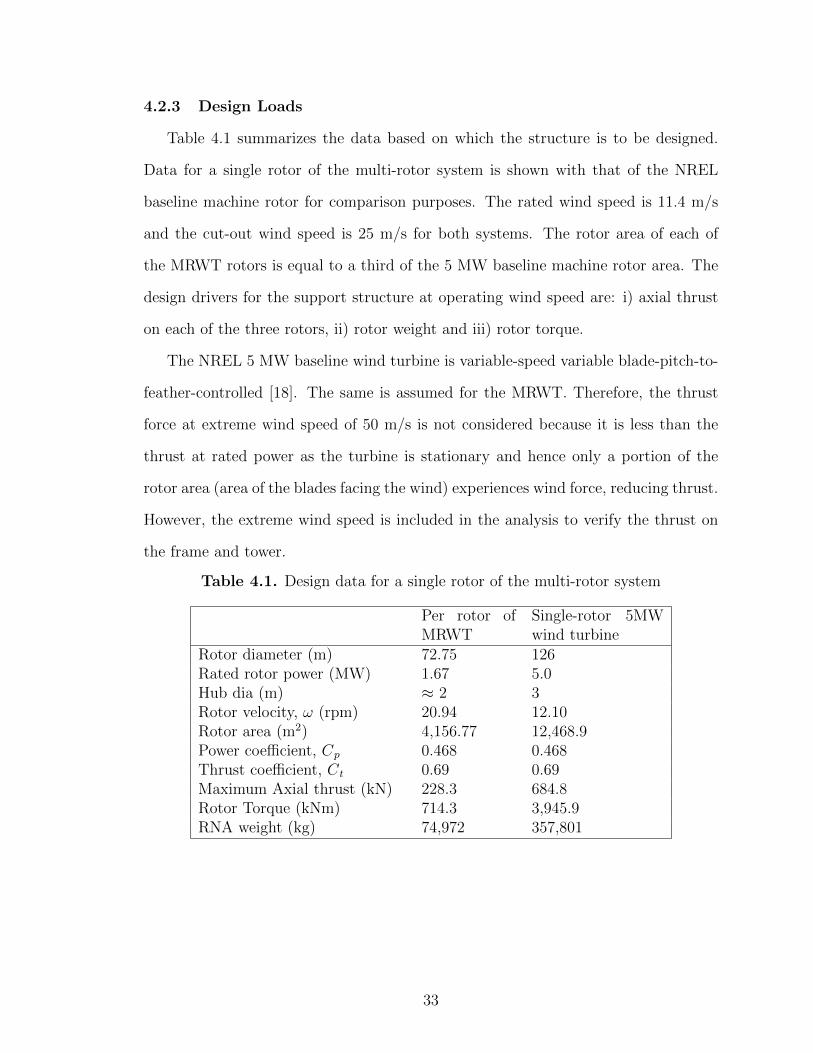
4.2.3 Design Loads
Table 4.1 summarizes the data based on which the structure is to be designed.
Data for a single rotor of the multi-rotor system is shown with that of the NREL
baseline machine rotor for comparison purposes. The rated wind speed is 11.4 m/s
and the cut-out wind speed is 25 m/s for both systems. The rotor area of each of
the MRWT rotors is equal to a third of the 5 MW baseline machine rotor area. The
design drivers for the support structure at operating wind speed are: i) axial thrust
on each of the three rotors, ii) rotor weight and iii) rotor torque.
The NREL 5 MW baseline wind turbine is variable-speed variable blade-pitch-to-
feather-controlled [18]. The same is assumed for the MRWT. Therefore, the thrust
force at extreme wind speed of 50 m/s is not considered because it is less than the
thrust at rated power as the turbine is stationary and hence only a portion of the
rotor area (area of the blades facing the wind) experiences wind force, reducing thrust.
However, the extreme wind speed is included in the analysis to verify the thrust on
the frame and tower.
Table 4.1. Design data for a single rotor of the multi-rotor system
Per rotor ofMRWT
Single-rotor 5MWwind turbine
Rotor diameter (m) 72.75 126Rated rotor power (MW) 1.67 5.0Hub dia (m) ≈ 2 3Rotor velocity, ω (rpm) 20.94 12.10Rotor area (m2) 4,156.77 12,468.9Power coefficient, Cp 0.468 0.468Thrust coefficient, Ct 0.69 0.69Maximum Axial thrust (kN) 228.3 684.8Rotor Torque (kNm) 714.3 3,945.9RNA weight (kg) 74,972 357,801
33
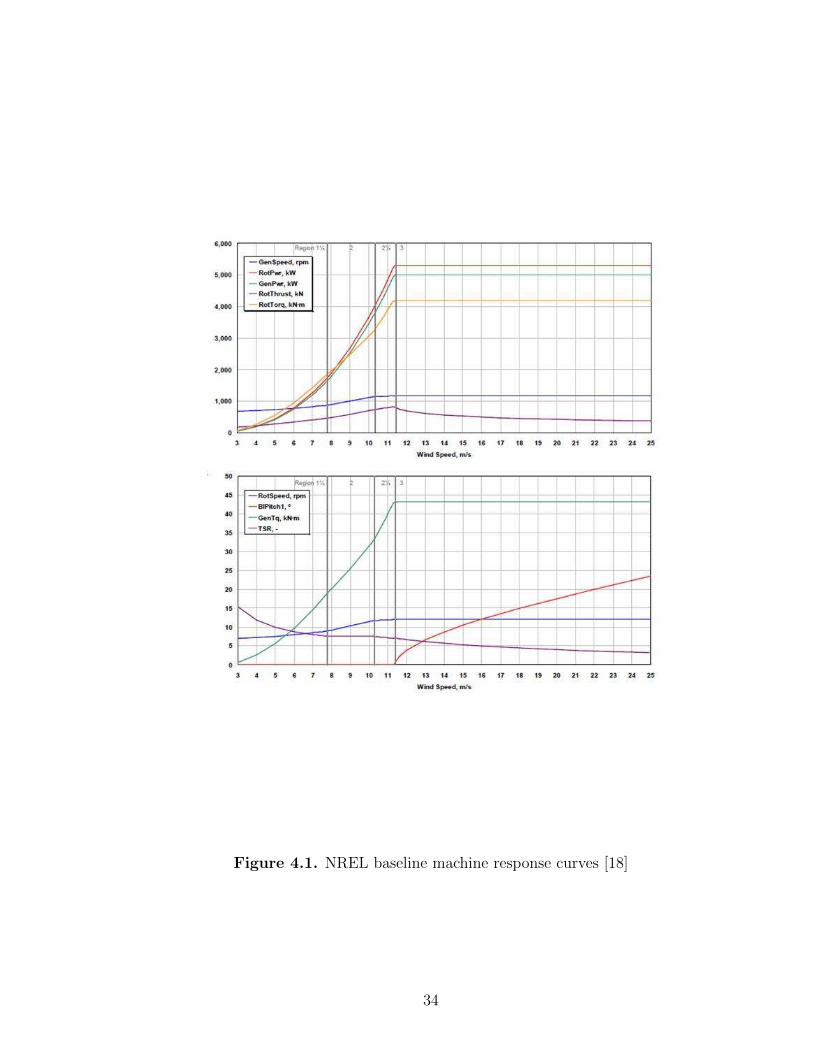
Figure 4.1. NREL baseline machine response curves [18]
34
Figure 4.1 shows the steady state responses as a function of time for the NREL
baseline machine [18]. The maximum rotor thrust, rotor torque, and rotor speed
agree with values shown in Table 4.1.
Some points to consider that are inferred from Table 4.1 are: i) the rotor rpm of
the multi-rotor system increases, ii) axial thrust remains the same in both cases, iii)
rotor Cp is the same in both cases and iv) the total torque is less. Torque on the
support frame will depend on the direction of rotation of the multi-rotors and can
possibly be further reduced by counter-rotating rotors.
Loading for the design consists of:
1. Dead loads for the weights of the RNAs as well as the structure’s self weight.
2. Rotor aerodynamic loads applied as point loads on the structure.
This accounts for only rotor aerodynamic loads and the weight of the RNAs. The
structure frame and tower drag loads are also included in the design. These are
applied as a steady wind load varying as the shear exponent with height. Fatigue
loads were not included at this stage. This leaves some uncertainty in whether the
structure can withstand these loads but this can be addressed once more information
on fatigue loads is available.
4.3 Structural Scheme
The structure will need to withstand bending moments due to thrust from each of
the rotors and will also have to support the weight of the RNA corresponding to each
of the rotors. Regardless of the specifics, the goal is to hold each of the three smaller
RNAs in a manner such that the maximum stresses are within allowable design code
limits, the overall mass of the framework is low enough so that the system is not
heavier than the 5 MW baseline machine, and also not to be too complex. The yaw
35
bearing will be assumed to be at the 90 m level on the tower. The design will require
several iterations for optimization of the tower top structure.
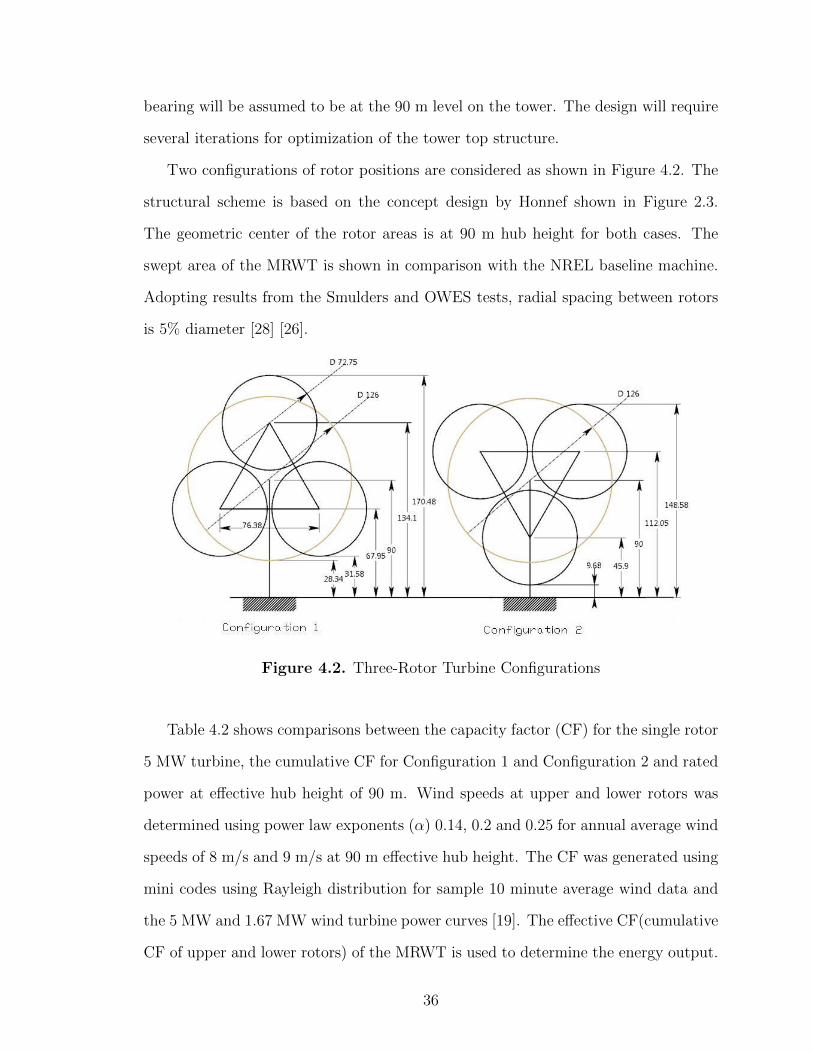
Two configurations of rotor positions are considered as shown in Figure 4.2. The
structural scheme is based on the concept design by Honnef shown in Figure 2.3.
The geometric center of the rotor areas is at 90 m hub height for both cases. The
swept area of the MRWT is shown in comparison with the NREL baseline machine.
Adopting results from the Smulders and OWES tests, radial spacing between rotors
is 5% diameter [28] [26].
Figure 4.2. Three-Rotor Turbine Configurations
Table 4.2 shows comparisons between the capacity factor (CF) for the single rotor
5 MW turbine, the cumulative CF for Configuration 1 and Configuration 2 and rated
power at effective hub height of 90 m. Wind speeds at upper and lower rotors was
determined using power law exponents (α) 0.14, 0.2 and 0.25 for annual average wind
speeds of 8 m/s and 9 m/s at 90 m effective hub height. The CF was generated using
mini codes using Rayleigh distribution for sample 10 minute average wind data and
the 5 MW and 1.67 MW wind turbine power curves [19]. The effective CF(cumulative
CF of upper and lower rotors) of the MRWT is used to determine the energy output.
36
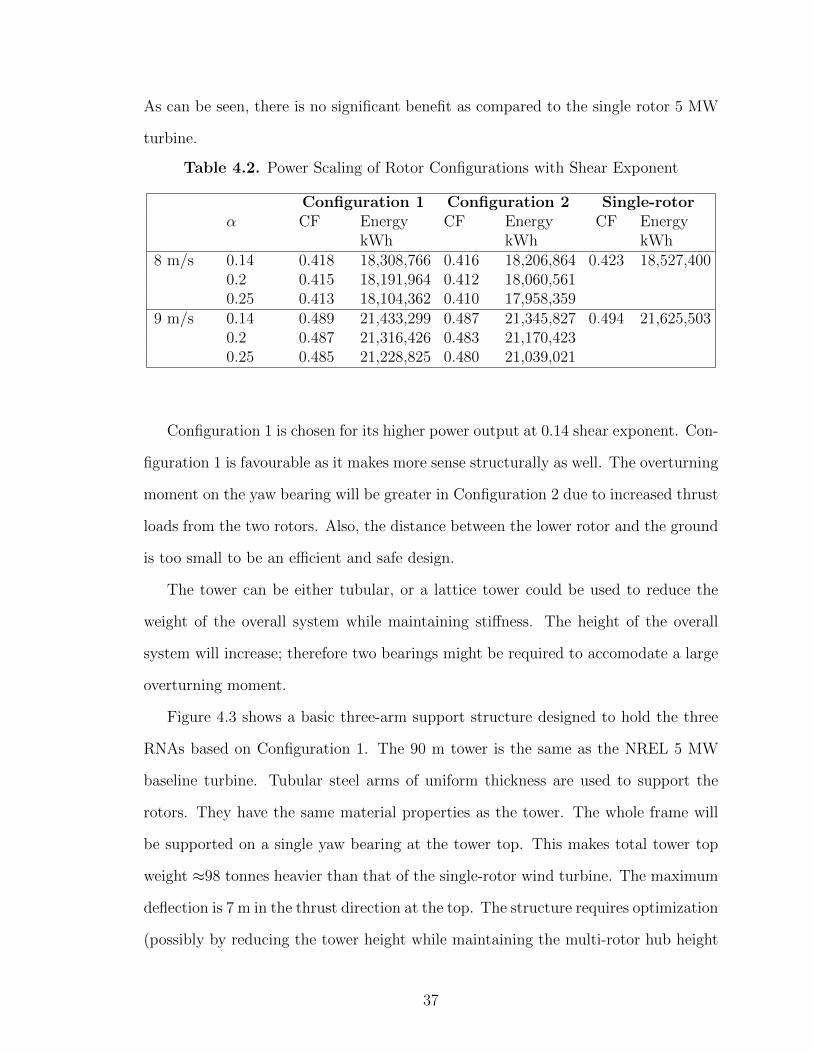
As can be seen, there is no significant benefit as compared to the single rotor 5 MW
turbine.
Table 4.2. Power Scaling of Rotor Configurations with Shear Exponent
Configuration 1 Configuration 2 Single-rotorα CF Energy
kWhCF Energy
kWhCF Energy
kWh8 m/s 0.14 0.418 18,308,766 0.416 18,206,864 0.423 18,527,400
0.2 0.415 18,191,964 0.412 18,060,5610.25 0.413 18,104,362 0.410 17,958,359
9 m/s 0.14 0.489 21,433,299 0.487 21,345,827 0.494 21,625,5030.2 0.487 21,316,426 0.483 21,170,4230.25 0.485 21,228,825 0.480 21,039,021
Configuration 1 is chosen for its higher power output at 0.14 shear exponent. Con-
figuration 1 is favourable as it makes more sense structurally as well. The overturning
moment on the yaw bearing will be greater in Configuration 2 due to increased thrust
loads from the two rotors. Also, the distance between the lower rotor and the ground
is too small to be an efficient and safe design.
The tower can be either tubular, or a lattice tower could be used to reduce the
weight of the overall system while maintaining stiffness. The height of the overall
system will increase; therefore two bearings might be required to accomodate a large
overturning moment.
Figure 4.3 shows a basic three-arm support structure designed to hold the three
RNAs based on Configuration 1. The 90 m tower is the same as the NREL 5 MW
baseline turbine. Tubular steel arms of uniform thickness are used to support the
rotors. They have the same material properties as the tower. The whole frame will
be supported on a single yaw bearing at the tower top. This makes total tower top
weight ≈98 tonnes heavier than that of the single-rotor wind turbine. The maximum
deflection is 7 m in the thrust direction at the top. The structure requires optimization
(possibly by reducing the tower height while maintaining the multi-rotor hub height
37
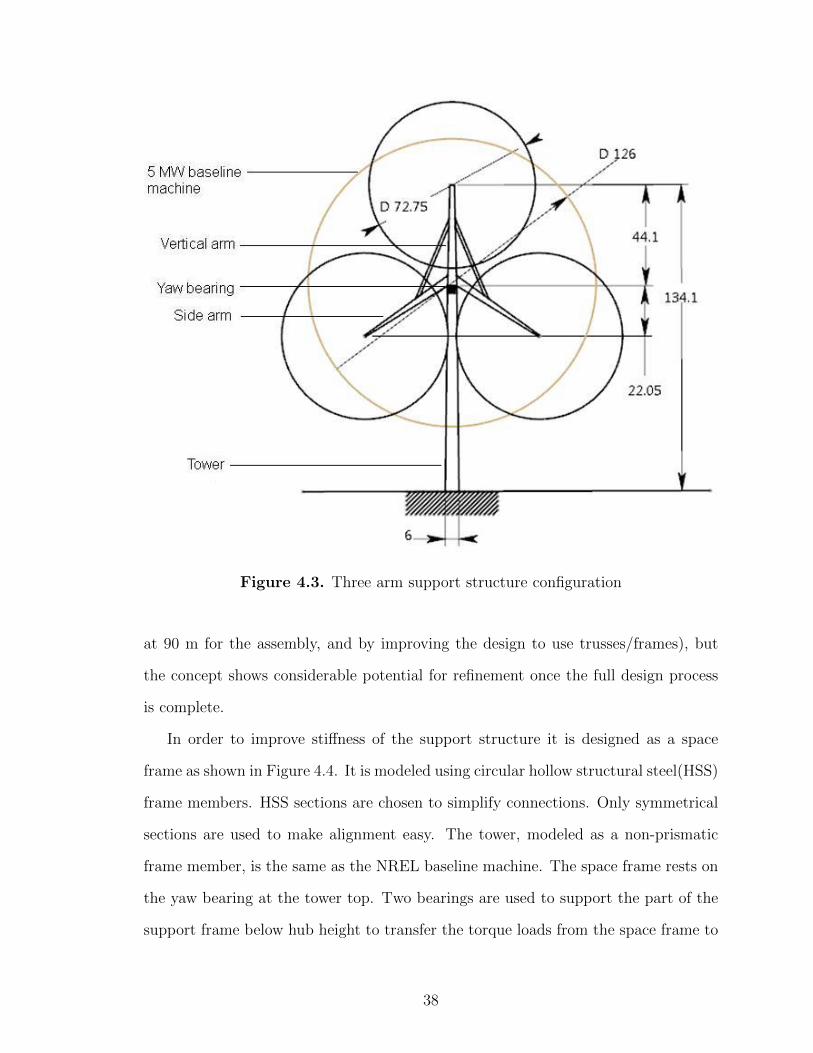
Figure 4.3. Three arm support structure configuration
at 90 m for the assembly, and by improving the design to use trusses/frames), but
the concept shows considerable potential for refinement once the full design process
is complete.
In order to improve stiffness of the support structure it is designed as a space
frame as shown in Figure 4.4. It is modeled using circular hollow structural steel(HSS)
frame members. HSS sections are chosen to simplify connections. Only symmetrical
sections are used to make alignment easy. The tower, modeled as a non-prismatic
frame member, is the same as the NREL baseline machine. The space frame rests on
the yaw bearing at the tower top. Two bearings are used to support the part of the
support frame below hub height to transfer the torque loads from the space frame to
38
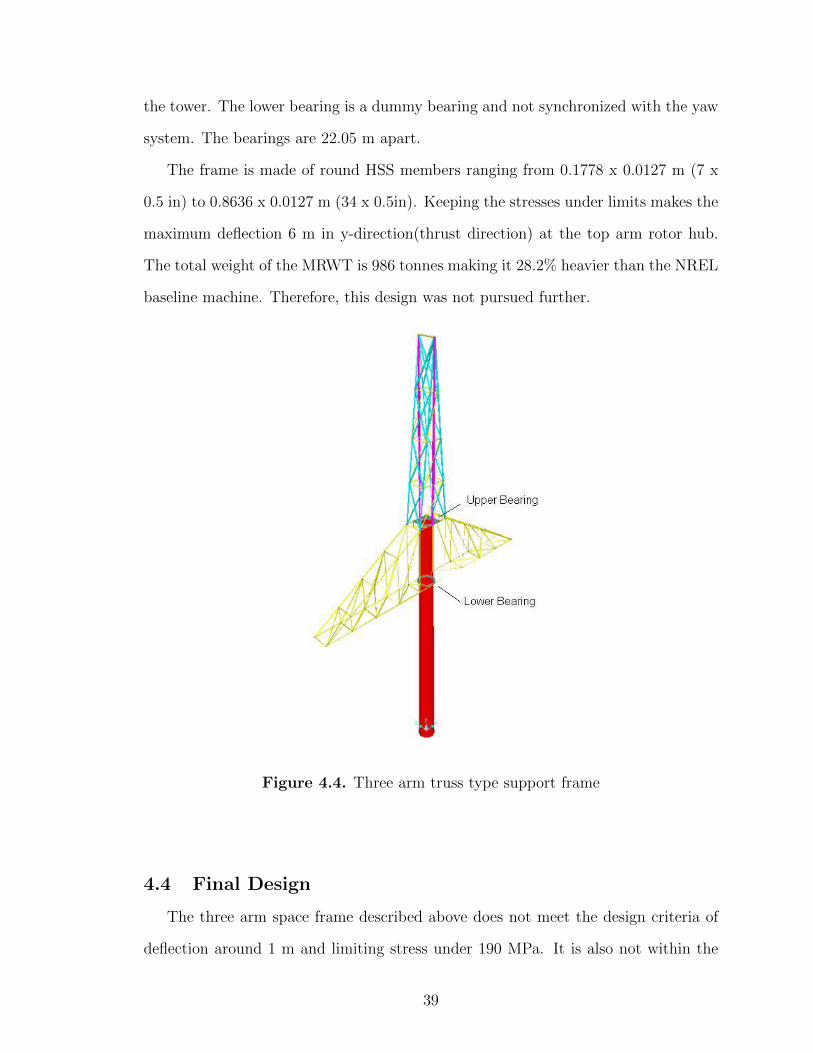
the tower. The lower bearing is a dummy bearing and not synchronized with the yaw
system. The bearings are 22.05 m apart.
The frame is made of round HSS members ranging from 0.1778 x 0.0127 m (7 x
0.5 in) to 0.8636 x 0.0127 m (34 x 0.5in). Keeping the stresses under limits makes the
maximum deflection 6 m in y-direction(thrust direction) at the top arm rotor hub.
The total weight of the MRWT is 986 tonnes making it 28.2% heavier than the NREL
baseline machine. Therefore, this design was not pursued further.
Figure 4.4. Three arm truss type support frame
4.4 Final Design
The three arm space frame described above does not meet the design criteria of
deflection around 1 m and limiting stress under 190 MPa. It is also not within the
39
weight limit of 700 tonnes. It could also be complex to build and erect as it has
too many joints. Figures 4.5 and 4.6 shows a simpler design, having fewer members
and hence fewer joints. It is based on the concept multi-rotor array system by Capt.
Heronemus as shown in Figure 2.5. Similar space frame schemes are also a commonly
used occurrence in modern civil engineering structures such as bridges and boarding
structures. The space frame is mounted on the same tower as the NREL baseline
machine and the support frame rests on the tower using two bearings 22.05 m apart.
Figure 4.6 shows the triangular two bearing support frame. The frame member
assignments are shown in Figure 4.7.
Slewing bearings are used for heavy duty applications like industrial turntables
which makes them ideal for the yaw system. They are available in large diameters, can
have integral internal or external gearing, or gearless and are lightweight. However,
they are quite expensive. The largest available off the shelf slewing bearings have
OD 5 m, weigh about 6 tonnes and cost about $50,000. Rotek (www.rotek-inc.com/)
makes custom bearings upto 9 m OD. Slewing bearings are used in this design as they
are lightweight and do not greatly offset the cost benefit from the MRWT system.
The upper bearing, mounted at the tower top has ID 4 m. It is synchronized with
the yaw system. The lower bearing has ID 4.5 m, is not synchronized with the yaw
system and is used only for load transfer.
4.4.1 Analysis
The design is analyzed using SAP2000 [5]. SAP2000 is a state of the art, sophisti-
cated and intuitive, finite element based analysis tool. The tower and support frame
are modeled using frame members and the bearings are modeled as shell elements
as shown in Figure 4.8. The frames were chosen through a number of iterations
to meet allowable weight and stress limits. The joints between frame members are
modeled as body constraints with 6 degrees of freedom (DOF), while shell elements
40
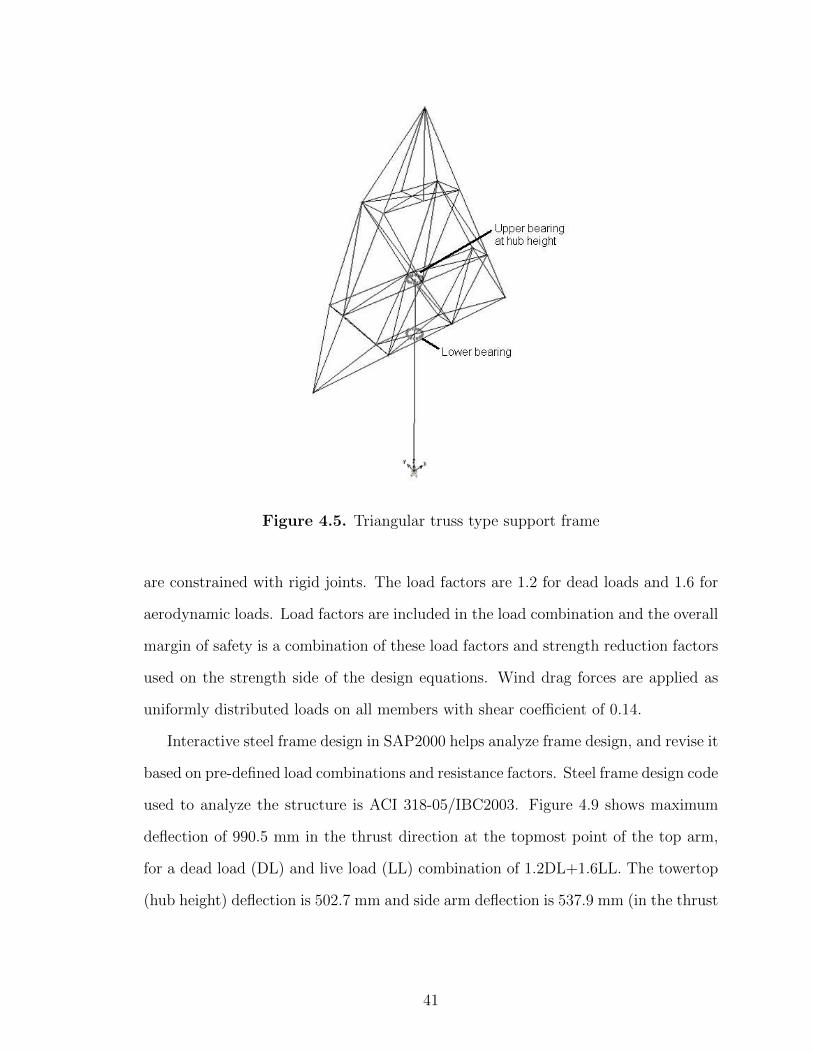
Figure 4.5. Triangular truss type support frame
are constrained with rigid joints. The load factors are 1.2 for dead loads and 1.6 for
aerodynamic loads. Load factors are included in the load combination and the overall
margin of safety is a combination of these load factors and strength reduction factors
used on the strength side of the design equations. Wind drag forces are applied as
uniformly distributed loads on all members with shear coefficient of 0.14.
Interactive steel frame design in SAP2000 helps analyze frame design, and revise it
based on pre-defined load combinations and resistance factors. Steel frame design code
used to analyze the structure is ACI 318-05/IBC2003. Figure 4.9 shows maximum
deflection of 990.5 mm in the thrust direction at the topmost point of the top arm,
for a dead load (DL) and live load (LL) combination of 1.2DL+1.6LL. The towertop
(hub height) deflection is 502.7 mm and side arm deflection is 537.9 mm (in the thrust
41
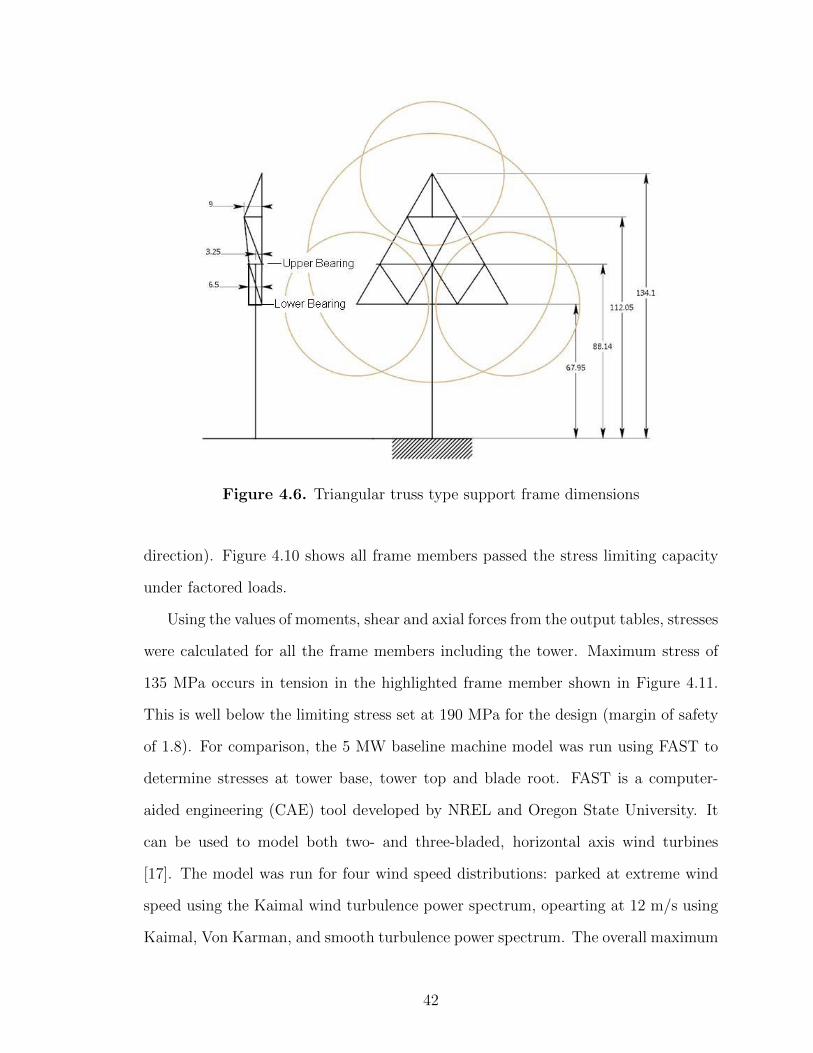
Figure 4.6. Triangular truss type support frame dimensions
direction). Figure 4.10 shows all frame members passed the stress limiting capacity
under factored loads.
Using the values of moments, shear and axial forces from the output tables, stresses
were calculated for all the frame members including the tower. Maximum stress of
135 MPa occurs in tension in the highlighted frame member shown in Figure 4.11.
This is well below the limiting stress set at 190 MPa for the design (margin of safety
of 1.8). For comparison, the 5 MW baseline machine model was run using FAST to
determine stresses at tower base, tower top and blade root. FAST is a computer-
aided engineering (CAE) tool developed by NREL and Oregon State University. It
can be used to model both two- and three-bladed, horizontal axis wind turbines
[17]. The model was run for four wind speed distributions: parked at extreme wind
speed using the Kaimal wind turbulence power spectrum, opearting at 12 m/s using
Kaimal, Von Karman, and smooth turbulence power spectrum. The overall maximum
42
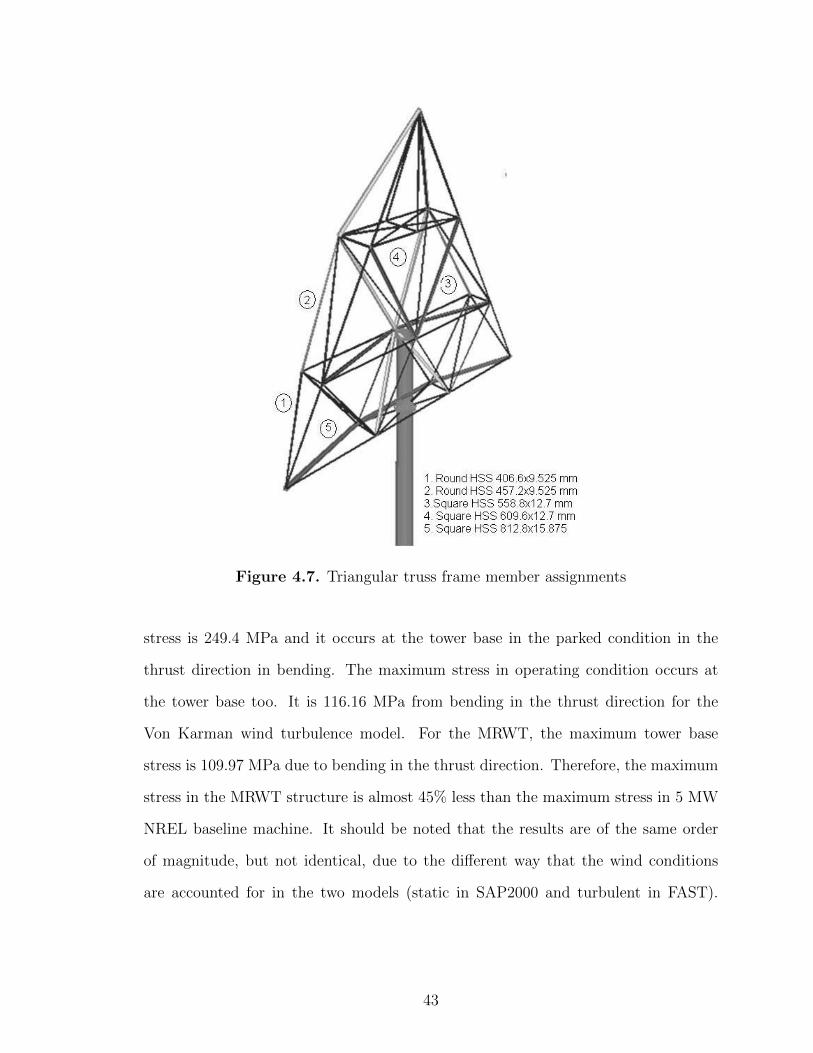
Figure 4.7. Triangular truss frame member assignments
stress is 249.4 MPa and it occurs at the tower base in the parked condition in the
thrust direction in bending. The maximum stress in operating condition occurs at
the tower base too. It is 116.16 MPa from bending in the thrust direction for the
Von Karman wind turbulence model. For the MRWT, the maximum tower base
stress is 109.97 MPa due to bending in the thrust direction. Therefore, the maximum
stress in the MRWT structure is almost 45% less than the maximum stress in 5 MW
NREL baseline machine. It should be noted that the results are of the same order
of magnitude, but not identical, due to the different way that the wind conditions
are accounted for in the two models (static in SAP2000 and turbulent in FAST).
43
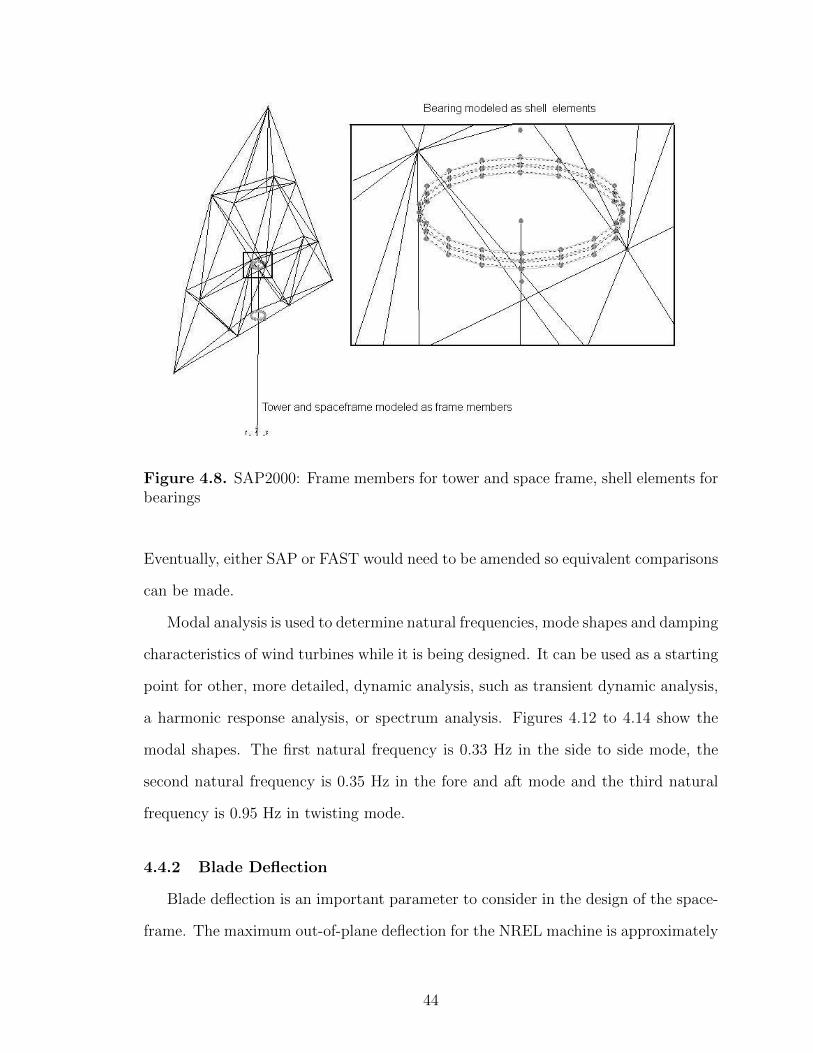
Figure 4.8. SAP2000: Frame members for tower and space frame, shell elements forbearings
Eventually, either SAP or FAST would need to be amended so equivalent comparisons
can be made.
Modal analysis is used to determine natural frequencies, mode shapes and damping
characteristics of wind turbines while it is being designed. It can be used as a starting
point for other, more detailed, dynamic analysis, such as transient dynamic analysis,
a harmonic response analysis, or spectrum analysis. Figures 4.12 to 4.14 show the
modal shapes. The first natural frequency is 0.33 Hz in the side to side mode, the
second natural frequency is 0.35 Hz in the fore and aft mode and the third natural
frequency is 0.95 Hz in twisting mode.
4.4.2 Blade Deflection
Blade deflection is an important parameter to consider in the design of the space-
frame. The maximum out-of-plane deflection for the NREL machine is approximately
44
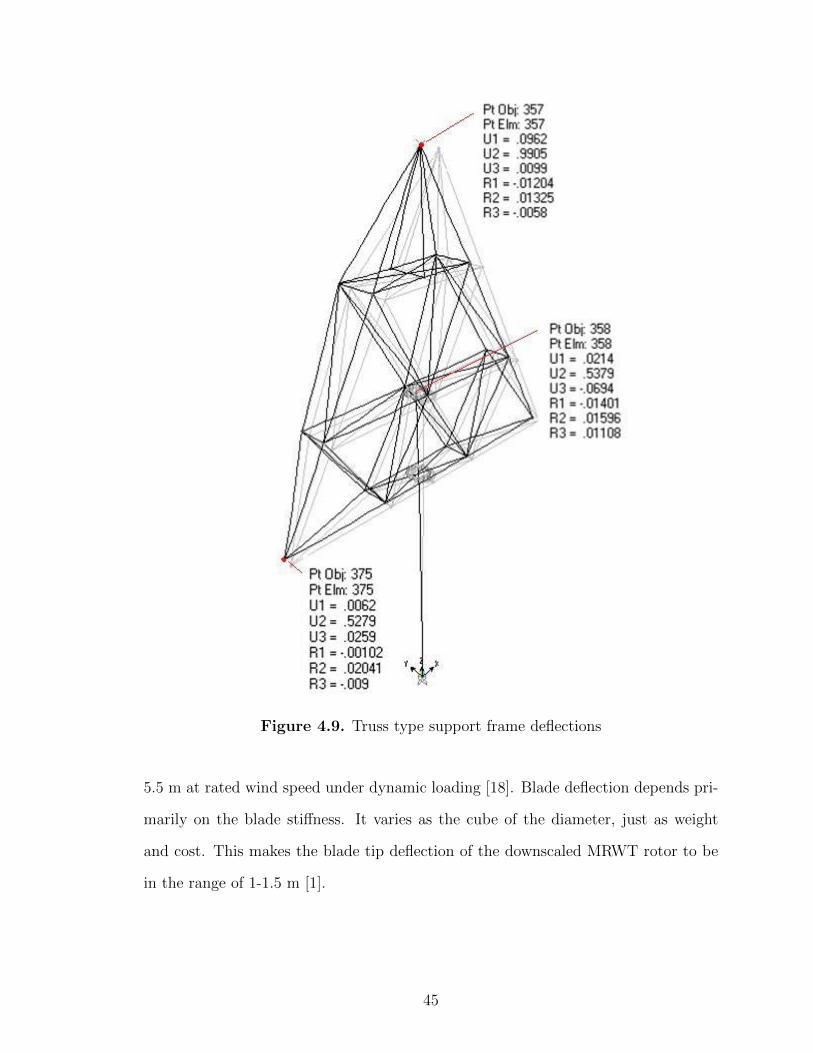
Figure 4.9. Truss type support frame deflections
5.5 m at rated wind speed under dynamic loading [18]. Blade deflection depends pri-
marily on the blade stiffness. It varies as the cube of the diameter, just as weight
and cost. This makes the blade tip deflection of the downscaled MRWT rotor to be
in the range of 1-1.5 m [1].
45
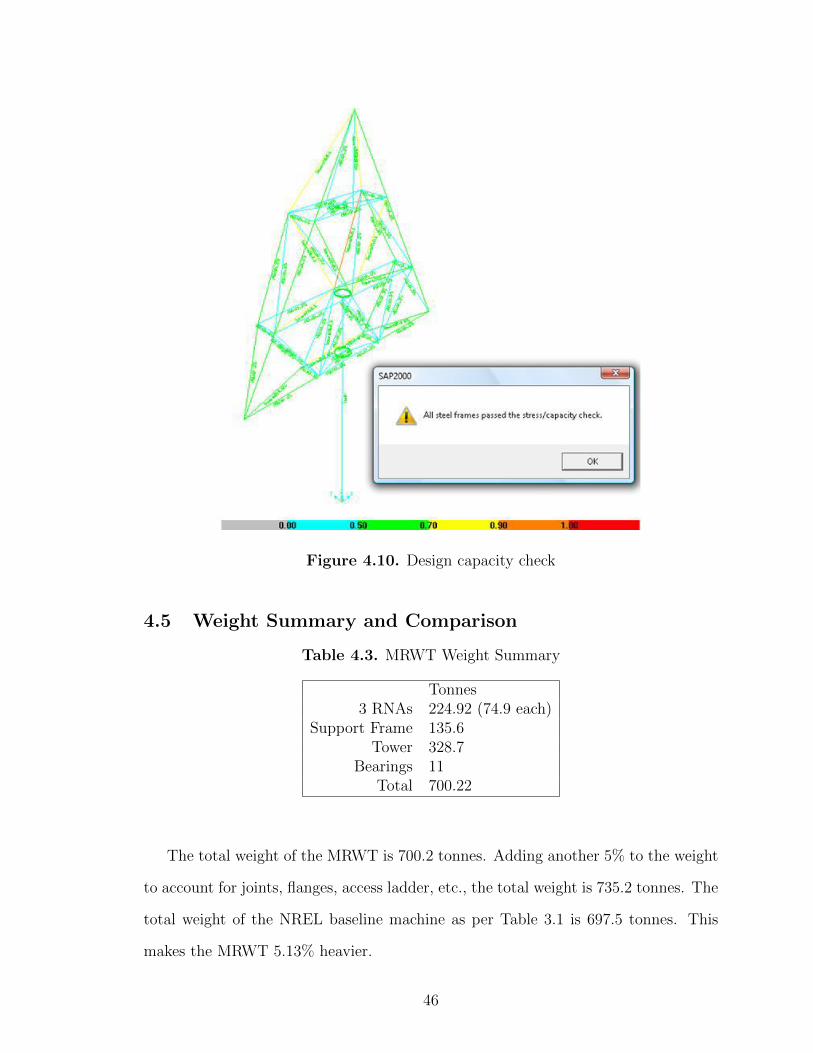
Figure 4.10. Design capacity check
4.5 Weight Summary and Comparison
Table 4.3. MRWT Weight Summary
Tonnes3 RNAs 224.92 (74.9 each)
Support Frame 135.6Tower 328.7
Bearings 11Total 700.22
The total weight of the MRWT is 700.2 tonnes. Adding another 5% to the weight
to account for joints, flanges, access ladder, etc., the total weight is 735.2 tonnes. The
total weight of the NREL baseline machine as per Table 3.1 is 697.5 tonnes. This
makes the MRWT 5.13% heavier.
46
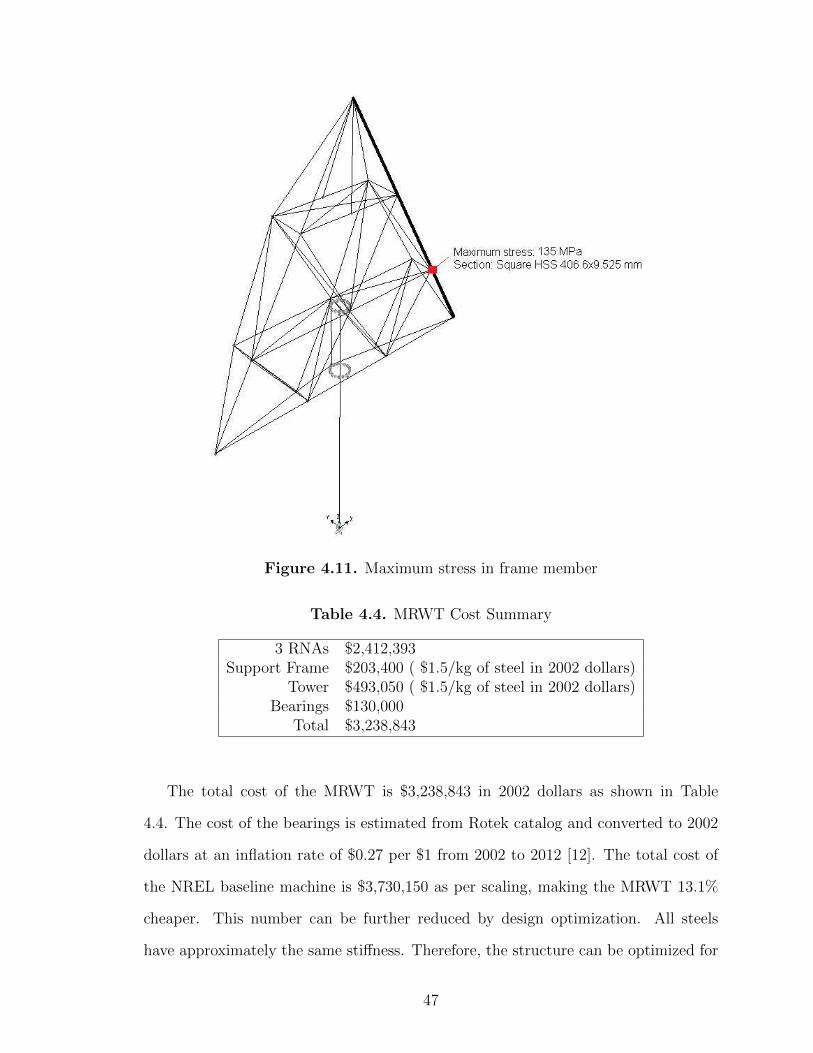
Figure 4.11. Maximum stress in frame member
Table 4.4. MRWT Cost Summary
3 RNAs $2,412,393Support Frame $203,400 ( $1.5/kg of steel in 2002 dollars)
Tower $493,050 ( $1.5/kg of steel in 2002 dollars)Bearings $130,000
Total $3,238,843
The total cost of the MRWT is $3,238,843 in 2002 dollars as shown in Table
4.4. The cost of the bearings is estimated from Rotek catalog and converted to 2002
dollars at an inflation rate of $0.27 per $1 from 2002 to 2012 [12]. The total cost of
the NREL baseline machine is $3,730,150 as per scaling, making the MRWT 13.1%
cheaper. This number can be further reduced by design optimization. All steels
have approximately the same stiffness. Therefore, the structure can be optimized for
47

Figure 4.12. First natural frequency, side to side mode
stiffness by exploring other structural configurations, perhaps by using a lattice or
hybrid tower as the drag loads on the MRWT system are less than the 5MW baseline
machine.
48
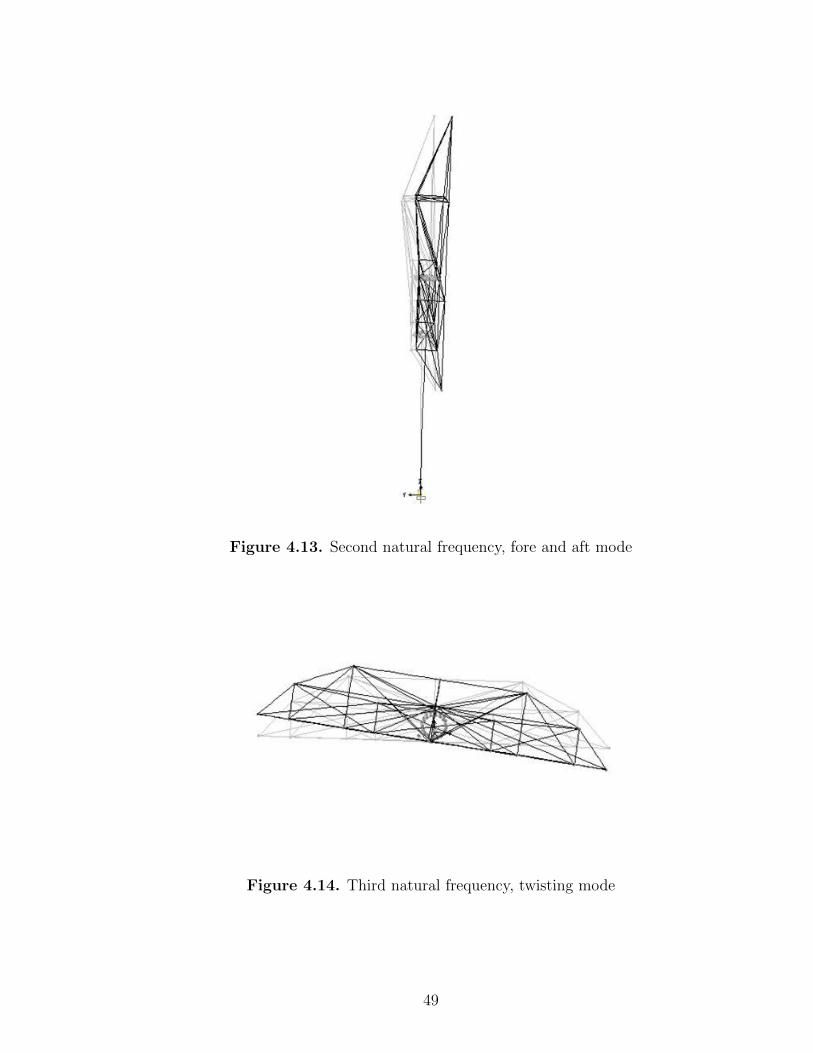
Figure 4.13. Second natural frequency, fore and aft mode
Figure 4.14. Third natural frequency, twisting mode
49
CHAPTER 5
CONCLUSION
The work presented so far shows how the different scaling techniques are integrated
in scaling models such as the NREL and WindPACT studies to provide an overall
model. This model helps in determining multi-megawatt wind turbine components’
weights and costs. A three rotor wind turbine is designed to compare its cost and
weight with a single rotor machine of equivalent capacity. The NREL 5 MW baseline
wind turbine is used as reference for comparison. Scaling models downscale the 5
MW baseline machine RNA to three 1.67 MW capacity RNAs.
It has been shown that by using the scaling models the RNA components’ weight
reduces by ≈ 37% and cost reduces ≈ 25% . This is a promising result as the scaling
model used is at a preliminary stage and is a crude version of the real situation. These
are the preliminary numbers that we have arrived at. Keeping the tip speed ratio
constant as scaling requires, the rotational speed of the rotor increases, decreasing
torque and reducing load on transmission. Therefore nacelle components like gen-
erator, gearbox, etc. will be much lighter than those components in a single rotor
turbine, as shown in Table 3.3. The reduced component weight is offset by the sup-
port structure weight. The triangular truss support structure described in Chapter
4 makes the tower top weight of the MRWT 5.13% heavier than the single-rotor ma-
chine. Despite being heavier, it is 13.1% less expensive than the single rotor machine.
The MRWT design is conservative and has great potential for optimization.
It is observed that in transitioning from one rotor to three rotors, the maximum
weight advantage is achieved from the downscaled rotor blades. Conversely, the in-
50
crease in weight arises due to a complex support structure. As a result, an important
question that arises is the relation between the number of rotors, the layout and the
amount of material required to support them. This optimization study deserves more
extensive research.
One of the most important areas to study in the MRWT design is the aerody-
namics. It is assumed for this work that the aerodynamics is unaffected by a closely
spaced rotor array in a wind field as suggested by Smulders, et al. and the OWES
tests. More work is needed to understand the behaviour of multi-rotor aerodynamics
and it may well be a whole study of its own. Yawing of an MRWT goes hand in hand
with aerodynamics and also merits further study.
The dynamic analysis of the loads on the frame has not been considered. It is
possible to use time series outputs from FAST as inputs to SAP at chosen locations
on the geometry. This would be a good start to understand the complex 3-d nonlinear
dynamics of a MRWT. The frame will be subject to asymmetrical loads, shear, yawing
etc. Furthermore, the whole assembly must be validated for a wider range of design
cases. Other IEC design conditions should be accounted for to ensure complete, safe
design such as extreme operating gust (EOG), extreme turbulence model (ETM),
extreme direction change (EDC), extreme wind shear (EWS). Other environmental
conditions such as rain, hail, snow, ice, earthquakes, humidity and temperature should
be studied too. Different loading scenarios would have to taken into account in future
studies such as startup, shutdown and braking.
The MRWT design developed here uses a most basic approach to modeling MRWT
RNA components. Other researchers may develop new ideas from the outline pre-
sented here. The main purpose of the MRWT is to reduce the overall cost of the ma-
chine. Despite the present limitations and the scarce literature available, the design
provides useful predictions and allows inferences about the behaviour of the system.
With increased versatility, MRWTs could become useful in some applications.
51
BIBLIOGRAPHY
[1] Anonymous. Parametric Study for Large Wind Turbine Blades. Technical ReportSAND2002-2519, Sandia National Laboratories, August 2002.
[2] Anonymous. IEC 61400-1 Ed.3: Wind turbines - Part 1: Design requirements,Final Draft International Standard. Technical Report 88/228/FDIS, Interna-tional Electrotechnical Commission, May 2005.
[3] Anonymous. Wind Energy The Facts, Rotor and Nacelle Mass,http://www.wind-energy-the-facts.org, 2006.
[4] Anonymous. BP Statistical Review of The World Energy, June 2010,www.bp.com/statisticalreview, 2010.
[5] Anonymous. SAP2000 Overview, http://sap2000.org/, 2012.
[6] Anonymous. U.S. Department of The Interior, December 2012,http://www.blm.gov/wo/st/en/prog/energy/wind energy.html, 2012.
[7] L. R. Brown. World on the edge : How to prevent environmental and economiccollapse. W. W. Norton & Company, 2011.
[8] I. G. Dambolena. A Planning Methodology for The Analysis and Design of Wind-Power Systems. PhD thesis, University of Massachusetts, Amherst, U.S.A, Jan-uary 1974.
[9] H. Dorner. Wind Energy History, http://www.ifb.uni-stuttgart.de/ do-erner/ewindenergie1.html, 1997.
[10] N. Fichaux, J. Beurskens, P.H. Jensen, and J. Wilkes. UpWind : Design Limitsand Solutions for Very Large Wind Turbines (1st ed). 2011.
[11] L. Fingerish, M. Hand, and A. Laxson. Wind Turbine Design Cost and Scal-ing Model. Technical Report NREL/TP-500-40566, National Renewable EnergyLaboratory, CO, December 2006.
[12] S. M. Friedman. The Inflation Calculator, Technology,http://www.westegg.com/inflation/, 2012.
[13] D. A. Griffin. WindPACT Turbine Design Scaling Studies Technical Area 1Com-posite Blades for 80- to 120-Meter Rotor. Technical Report NREL/SR-500-29492, National Renewable Energy Laboratory, CO, April 2001.
52
[14] W. E. Heronemus. Pollution-Free Energy From Offshore Winds. Proceedings of8th Annual Conference and Exposition, Marine Technology Society. Washington,D.C., U.S.A, 1972.
[15] P. Jameison and M. Branney. Multi-Rotors: A Solution to 20 MW and Beyond?.Deep Sea Offshore Wind R&D Conference. Trondheim, Norway, 2012.
[16] P. Jamieson. Innovation in Wind Turbine Design. John Wiley & Sons, 2011.
[17] J. Jonkman. National Wind Technology Center, Computer Aided EngineeringTools, http://wind.nrel.gov/designcodes/simulators/fast/, 2012.
[18] J. Jonkman, S. Butterfield, W. Musial, and G. Scott. Definition of a 5 MWReference Wind Turbine for Offshore System Development. Technical ReportNREL/TP-500-38060, National Renewable Energy Laboratory, February 2009.
[19] Jason Jonkman. National Wind technology Center, Forum,https://wind.nrel.gov/forum/wind/viewtopic.php?f=2&t=363, 2010.
[20] L. Kroldrup. Gains in Global Wind Capacity Reported, The New York Times,Green Inc, February 2010.
[21] D. J. Malcolm and A.C. Hansen. WindPACT Turbine Rotor Design Study. Tech-nical Report NREL/SR-500-32495, National Renewable Energy Laboratory, CO,June 2002.
[22] J. F. Manwell, J. G. McGowan, and A. L. Rogers. Wind Energy Explained:Theory, Design and Application (2nd ed). John Wiley & Sons, 2009.
[23] W. Musial, S. Butterfield, and B. Ram. Energy from Offshore Wind. Proceedingsof Offshore Technology Conference. Houston, U.S.A, May 2006.
[24] A. D. Ngo, J. Denault, A. Nakai, T. Morii, S. V. Hoa, and H. Hamada. De-sign, Manufacturing and Applications of Composites. Proceedings of 8th JointCanada-Japan Workshop on Composites. Montreal, Quebec, Canada, 2010.
[25] J. V. Nielsen. Danmarks Vindkrafthistoriske Samling (Danish Wind HistoricalCollection), http://www.vindhistorie.dk/Faktablade/Faktablad 2a.pdf, 2001.
[26] D. Ransom, J. J. Moore, and M. Heronemus-Pate. Per-formance of Wind Turbines in a Closely Spaced Array,http://online.qmags.com/REWNA0510/?pg=7&mode=2, 2006.
[27] G. Sieros, P. Chaviaropoulos, J. D. Sorensen, B. H. Bulder, and P. Jamieson.Upscaling Wind Turbines : Theoretical and Practical Aspects and Their Impacton The Cost of Energy,Wind Energy : The UpWind Special Issue, Volume 15,Issue 1, January 2012.
53
[28] P. T. Smulders, S. Osborns, and C. Moes. Aerodynamic Interaction BetweenTwo Rotors Set Next to Each Other in One Plane. Proceedings of EuropeanWind Energy Conference. Hamburg, Germany, 1984.
[29] L. Starke. State of the World: Into a Warming World (1st ed). W. W. Norton& Company : New York, 2000.
[30] F. Stoddard. The Life and Work of Bill Heronemus, Wind Engineering Pioneer,http://www.umass.edu/windenergy/, 2006.
[31] P. H. Thomas. Aerogenerator Tower, US Patent No. 2511023, July 1945.
54