multi-lab ev smart grid integration requirements study: providing
TRANSCRIPT
NREL is a national laboratory of the U.S. Department of Energy Office of Energy Efficiency & Renewable Energy Operated by the Alliance for Sustainable Energy, LLC This report is available at no cost from the National Renewable Energy Laboratory (NREL) at www.nrel.gov/publications.
Contract No. DE-AC36-08GO28308
Multi-Lab EV Smart Grid Integration Requirements Study Providing Guidance on Technology Development and Demonstration T. Markel and A. Meintz National Renewable Energy Laboratory
K. Hardy, B. Chen, and T. Bohn Argonne National Laboratory
J. Smart, D. Scoffield, and R. Hovsapian Idaho National Laboratory
S. Saxena, J. MacDonald, and S. Kiliccote Lawrence Berkeley National Laboratory
K. Kahl Oak Ridge National Laboratory
R. Pratt Pacific Northwest National Laboratory
Technical Report NREL/TP-5400-63963 May 2015
NREL is a national laboratory of the U.S. Department of Energy Office of Energy Efficiency & Renewable Energy Operated by the Alliance for Sustainable Energy, LLC This report is available at no cost from the National Renewable Energy Laboratory (NREL) at www.nrel.gov/publications.
Contract No. DE-AC36-08GO28308
National Renewable Energy Laboratory 15013 Denver West Parkway Golden, CO 80401 303-275-3000 • www.nrel.gov
Multi-Lab EV Smart Grid Integration Requirements Study Providing Guidance on Technology Development and Demonstration T. Markel and A. Meintz National Renewable Energy Laboratory
K. Hardy, B. Chen, and T. Bohn Argonne National Laboratory
J. Smart, D. Scoffield, and R. Hovsapian Idaho National Laboratory
S. Saxena, J. MacDonald, and S. Kiliccote Lawrence Berkeley National Laboratory
K. Kahl Oak Ridge National Laboratory
R. Pratt Pacific Northwest National Laboratory
Prepared under Task No. VTP2.IN14
Technical Report NREL/TP-5400-63963 May 2015

NOTICE
This report was prepared as an account of work sponsored by an agency of the United States government. Neither the United States government nor any agency thereof, nor any of their employees, makes any warranty, express or implied, or assumes any legal liability or responsibility for the accuracy, completeness, or usefulness of any information, apparatus, product, or process disclosed, or represents that its use would not infringe privately owned rights. Reference herein to any specific commercial product, process, or service by trade name, trademark, manufacturer, or otherwise does not necessarily constitute or imply its endorsement, recommendation, or favoring by the United States government or any agency thereof. The views and opinions of authors expressed herein do not necessarily state or reflect those of the United States government or any agency thereof.
This report is available at no cost from the National Renewable Energy Laboratory (NREL) at www.nrel.gov/publications.
Available electronically at SciTech Connect http:/www.osti.gov/scitech
Available for a processing fee to U.S. Department of Energy and its contractors, in paper, from:
U.S. Department of Energy Office of Scientific and Technical Information P.O. Box 62 Oak Ridge, TN 37831-0062 OSTI http://www.osti.gov Phone: 865.576.8401 Fax: 865.576.5728 Email: [email protected]
Available for sale to the public, in paper, from:
U.S. Department of Commerce National Technical Information Service 5301 Shawnee Road Alexandra, VA 22312 NTIS http://www.ntis.gov Phone: 800.553.6847 or 703.605.6000 Fax: 703.605.6900 Email: [email protected]
Cover Photos by Dennis Schroeder: (left to right) NREL 26173, NREL 18302, NREL 19758, NREL 29642, NREL 19795.
NREL prints on paper that contains recycled content.

iii
This report is available at no cost from the National Renewable Energy Laboratory (NREL) at www.nrel.gov/publications.
Acknowledgments The authors thank David Anderson of the U.S. Department of Energy, Office of Energy Efficiency and Renewable Energy, Vehicle Technologies Office for initiating and supporting this work as a step toward aggregating the knowledge from the national laboratory system experts to solve future energy challenges.
Further, the authors extend their gratitude to the following people for their contributions to Section 4.4 about the University of Delaware demonstration project: Willett Kempton, Sachin Kamboj, and Andrew Levitt.
iv
This report is available at no cost from the National Renewable Energy Laboratory (NREL) at www.nrel.gov/publications.
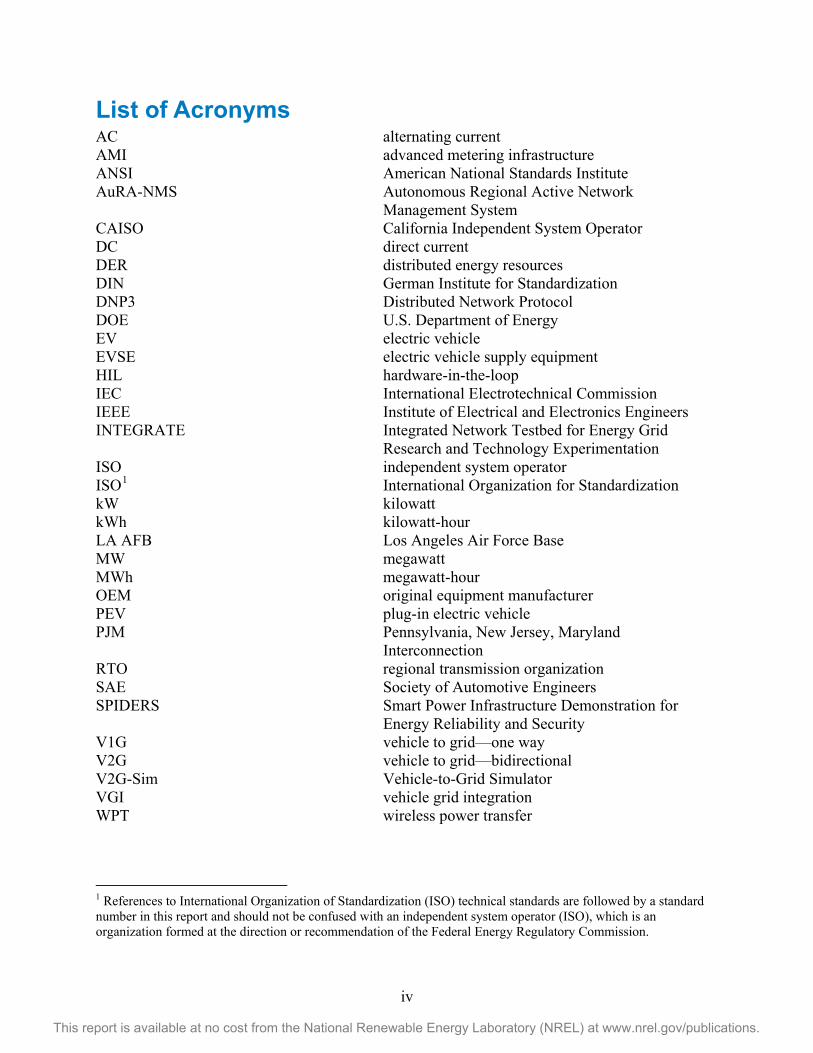
List of Acronyms AC alternating current AMI advanced metering infrastructure ANSI American National Standards Institute AuRA-NMS Autonomous Regional Active Network
Management System CAISO California Independent System Operator DC direct current DER distributed energy resources DIN German Institute for Standardization DNP3 Distributed Network Protocol DOE U.S. Department of Energy EV electric vehicle EVSE electric vehicle supply equipment HIL hardware-in-the-loop IEC International Electrotechnical Commission IEEE Institute of Electrical and Electronics Engineers INTEGRATE Integrated Network Testbed for Energy Grid
Research and Technology Experimentation ISO independent system operator ISO1 International Organization for Standardization kW kilowatt kWh kilowatt-hour LA AFB Los Angeles Air Force Base MW megawatt MWh megawatt-hour OEM original equipment manufacturer PEV plug-in electric vehicle PJM Pennsylvania, New Jersey, Maryland
Interconnection RTO regional transmission organization SAE Society of Automotive Engineers SPIDERS Smart Power Infrastructure Demonstration for
Energy Reliability and Security V1G vehicle to grid—one way V2G vehicle to grid—bidirectional V2G-Sim Vehicle-to-Grid Simulator VGI vehicle grid integration WPT wireless power transfer
1 References to International Organization of Standardization (ISO) technical standards are followed by a standard number in this report and should not be confused with an independent system operator (ISO), which is an organization formed at the direction or recommendation of the Federal Energy Regulatory Commission.
v
This report is available at no cost from the National Renewable Energy Laboratory (NREL) at www.nrel.gov/publications.
Executive Summary The U.S. Department of Energy’s (DOE’s) role to propel the development and deployment of science and technology to address the nation’s future energy challenges should include the integration of renewables and interactions between the smart electricity grid of the future and the evolution of electrified transportation. DOE’s EV Everywhere initiative intends to accelerate the adoption of electrified transportation. DOE’s Office of Energy Efficiency and Renewable Energy’s Grid Integration Initiative, working in support of DOE’s Grid Tech Team, brings together five program offices to collaborate on ways to enhance the value proposition and the overall efficiency of a long-term system scenario built around energy efficiency and renewable energy technologies. These offices include Vehicle Technologies, Building Technologies, Fuel Cells Technologies, Wind & Water Power Technologies, and Solar Energy Technologies.
There are expectations that electrified vehicles can be an integral part of the smart, renewable electricity grid of the future. To work toward understanding this potential, a collaboration among six national laboratories leverages core expertise to define plug-in electric vehicle (PEV) grid integration scenarios and suggest the opportunities they support along with the necessary system implementation requirements. The institutions involved include the National Renewable Energy Laboratory, Argonne National Laboratory, Idaho National Laboratory, Lawrence Berkeley National Laboratory, Pacific Northwest National Laboratory, and Oak Ridge National Laboratory. Following are some of the key questions the multi-lab team is working to answer:
• What future electricity grid services are relevant to PEVs?
• What are the potential costs and benefits of candidate electricity grid and PEV services?
• What metrics and key performance parameters are relevant to quantifying the cost and benefits of candidate PEV grid services and technology solutions?
• What are the grid-centric and PEV-centric opportunities and perspectives?
• How might achieving these future integrated systems influence the petroleum consumption and energy benefits of the overall system?
• What might hinder PEV adoption, and what actions can be taken to enable the growth of grid-integrated features?
• What technologies need to be developed to enable vehicle grid integration (VGI)?
The team of authors met regularly to coordinate individual efforts. This document constitutes a planned deliverable to DOE, and its content and conclusions are expected to provide critical input to research and development plans for future VGI work in the National Renewable Energy Laboratory’s Energy Systems Integration Facility and facilities among the national laboratory system sponsored by DOE and other research entities.
The report begins with a discussion of the current state of the energy and transportation systems, followed by a summary of some VGI scenarios and opportunities. The current efforts to create foundational interface standards are detailed, and the requirements for enabling PEVs as a grid resource are presented. Existing technology demonstrations that include vehicle to grid functions are summarized. The report also includes a data-based discussion on the magnitude and variability of PEVs as a grid resource, followed by an overview of existing simulation tools that

vi
This report is available at no cost from the National Renewable Energy Laboratory (NREL) at www.nrel.gov/publications.
can be used to explore the expansion of VGI to larger grid functions that might offer system and customer value. The document concludes with a summary of the requirements and potential action items that would support greater adoption of VGI.
vii
This report is available at no cost from the National Renewable Energy Laboratory (NREL) at www.nrel.gov/publications.
Table of Contents List of Acronyms ........................................................................................................................................ iv Executive Summary .................................................................................................................................... v List of Figures ............................................................................................................................................ ix List of Tables ............................................................................................................................................... x 1 Current Situation: Driving Interest and Opportunity for Vehicle Grid Integration ......................... 1 2 Potential Grid-Integrated Vehicle Functions ..................................................................................... 3
2.1 Stakeholders and System Components .......................................................................................... 3 2.2 Potential Value .............................................................................................................................. 7 2.3 Scales ............................................................................................................................................. 9 2.4 Example Value Proposition/Grid Impact .................................................................................... 12
3 Enabling PEV to Grid Integration ...................................................................................................... 14 3.1 Key Factors to Enable PEV to Grid Integration .......................................................................... 14 3.2 Current State ................................................................................................................................ 14
3.2.1 Reference Architecture ................................................................................................... 14 3.2.2 Codes and Standards ...................................................................................................... 17 3.2.3 Use Cases and Demonstrations ...................................................................................... 19 3.2.4 Paradigms That Enable Coordinated Control and Active Grid Management ................ 20 3.2.5 Advanced Metering Infrastructure and Sensing Technology for Grid Quality,
Reliability, and Real-Time Energy Management ........................................................... 21 3.2.6 PEV and EVSE Cyber Security for VGI ........................................................................ 22
3.3 Recommended Research and Development to Enable PEV to Grid Integration ........................ 22 4 Grid-Integration Demonstration Efforts ........................................................................................... 27
4.1 Fort Carson V2G Microgrid Integration ..................................................................................... 27 4.2 Los Angeles Air Force Base and U.S. Army Reserve 63rd Regional Support Command .......... 29
4.2.1 PEV Pilot at the Los Angeles Air Force Base ................................................................ 29 4.2.2 Optimized PEV Fleet Management and Grid Transaction at the U.S. Army 63rd
Regional Support Command .......................................................................................... 31 4.3 OEM Central Server .................................................................................................................... 31 4.4 University of Delaware V2G Development and Demonstration ................................................. 32 4.5 Electrified Roadway Analysis of Interaction with Renewables .................................................. 34
4.5.1 State of the Art ............................................................................................................... 35 4.5.2 Exploration of Roadway Electrification Feasibility ....................................................... 39 4.5.3 Integrating More Renewable Electricity ........................................................................ 39 4.5.4 Grid Power Quality Impacts from WPT Charging and Roadway Electrification .......... 41
5 Magnitude and Variability of Controllable Capacity Provided by Grid-Connected PEVs ........... 44 5.1 Direct Analysis of EV Project Data ............................................................................................ 45
5.1.1 Magnitude of Controllable Capacity .............................................................................. 45 5.1.2 Available Charge Energy ............................................................................................... 46 5.1.3 Available Charge Power ................................................................................................. 47
5.2 Hypothetical PEV Penetration Scenarios .................................................................................... 47 5.2.1 Description of PEV Penetration Scenarios ..................................................................... 48 5.2.2 Total Available Charge Energy for Both Scenarios ....................................................... 48 5.2.3 Total Available Charge Power for Both Scenarios ........................................................ 48 5.2.4 Potential Impact on Utility Loads .................................................................................. 49 5.2.5 Ability to Integrate Wind Energy ................................................................................... 50
5.3 Variability of Available Charge Energy and Available Charge Power from Day to Day ........... 50 5.4 EV Project Data Analysis Conclusions and Recommendations .................................................. 51
6 Simulation Scenario Forecasts ......................................................................................................... 53 6.1 Overview of the Vehicle-to-Grid Simulator (V2G-Sim) ............................................................. 53
6.1.1 Model Structure .............................................................................................................. 53

viii
This report is available at no cost from the National Renewable Energy Laboratory (NREL) at www.nrel.gov/publications.
6.2 V2G-Sim: Use Cases ................................................................................................................... 58 6.2.1 Forecasting PEV Grid Interactions and Uncertainty ...................................................... 58 6.2.2 Spatial Resolution of PEV Grid Interactions ................................................................. 59 6.2.3 Battery Degradation for Driving and Grid Services ....................................................... 60 6.2.4 PEVs for Renewables Integration .................................................................................. 61 6.2.5 PEVs for Demand Response .......................................................................................... 63 6.2.6 Adequacy of Inexpensive Charging Infrastructure ........................................................ 65
7 Integration Path Forward ................................................................................................................... 68 7.1 Potential Needs by Layer ............................................................................................................ 68 7.2 Potential Needs by Region .......................................................................................................... 69 7.3 Potential Needs by Stakeholder ................................................................................................... 69 7.4 Potential Needs by Policy Structure ............................................................................................ 71 7.5 Research Implementation Scenarios ........................................................................................... 71
7.5.1 Simulation Investigations ............................................................................................... 72 7.5.2 HIL Investigations .......................................................................................................... 73
References ................................................................................................................................................. 75
ix
This report is available at no cost from the National Renewable Energy Laboratory (NREL) at www.nrel.gov/publications.
List of Figures Figure 1. System stakeholders ...................................................................................................................... 6 Figure 2. States that have deregulated energy markets ............................................................................... 11 Figure 3. Battery evaluation tool value ....................................................................................................... 13 Figure 4. European Commission’s Mandate 490 smart grid reference architecture [38] ........................... 15 Figure 5. European Commission’s Mandate 490 smart grid reference architecture plane definition [38] . 15 Figure 6. National Institute of Standards and Technology Smart Grid Architecture Model iterations,
layers, and planes [37] ........................................................................................................... 16 Figure 7. IEEE standard 2030 guide for smart grid interoperability [39] ................................................... 17 Figure 8.System architecture defined in INTEGRATE initiative ............................................................... 17 Figure 9. Major interconnection and communications standards for VGI .................................................. 19 Figure 10. Eight types of interactions among PEVs and the grid [40] ........................................................ 20 Figure 11. Use cases defined by the California Public Utilities Commission [40] ..................................... 20 Figure 12. OEM Central Server [60] .......................................................................................................... 32 Figure 13. Charging dichotomy. Images by Josh Bauer, NREL ................................................................. 35 Figure 14. Comparison of wireless inductive power transfer providers [72] .............................................. 37 Figure 15. Seasonal curtailment of renewables in a high-penetration sceario (blue: solar; green: wind) ... 41 Figure 16. Comparing load shapes from potential electrified-roadway implementation ............................ 41 Figure 17. Multipurposing electrified roadway inverter technology for grid opportunities ....................... 43 Figure 18. Percent of Nissan Leafs connected to their home EVSE during regular weekdays .................. 46 Figure 19. Histogram of energy charged overnight by Nissan Leafs in Seattle .......................................... 46 Figure 20. Available charge power per Nissan Leaf in Seattle at different charge rates ............................ 47 Figure 21. Total available charge power for short-term and long-term PEV penetration scenarios ........... 48 Figure 22. The 95/95 tolerance interval (95% coverage with 95% confidence) for available charge energy
and available charge power .................................................................................................... 51 Figure 23. Bottom-up modeling approach in V2G-Sim .............................................................................. 53 Figure 24. Structure of coupled submodels comprising V2G-Sim ............................................................. 54 Figure 25. Schematic overview of EV models integrated into V2G-Sim [91] ........................................... 55 Figure 26. Schematic overview of plug-in hybrid models integrated into V2G-Sim [91] .......................... 55 Figure 27. Validation of Nissan Leaf EV powertrain model in V2G-Sim .................................................. 56 Figure 28. Example of EVSE measurement data that is used to calibrate and validate the charger [93] ... 57 Figure 29. Equivalent circuit model implemented in V2G-Sim to quantify battery dynamics during
driving, charging, and grid service ......................................................................................... 57 Figure 30. Detailed electrochemical model to be implemented in V2G-Sim to quantify battery dynamics
and internal battery parameters during driving, charging, and grid service ........................... 57 Figure 31. Solid-electrolyte interphase formation on the graphite anode surface in a lithium-ion battery . 58 Figure 32. Total charging demand for 1,000 EVs that charge on a mix of Level 1 and Level 2 chargers at
home and workplace locations ............................................................................................... 59 Figure 33. Example of spatially resolved home and workplace charging load results from V2G-Sim ...... 59 Figure 34. Example of PEV charging load results from V2G-Sim for which the load is spatially resolved
across the continental United States ....................................................................................... 60 Figure 35. V2G-Sim predictions of the 24-hour battery state-of-charge profiles for 12 PEVs that are
driving and offering a grid service by discharging at maximum power between 6 p.m. and 9 p.m. ........................................................................................................................................ 60
Figure 36. Capacity fade comparison for various vehicle load cases with and without grid services ........ 61 Figure 37. Impact of 3 million PEVs on the California net load curve (i.e., duck curve) .......................... 63 Figure 38. (Black contour) Charging load for uncontrolled charging and (blue contour) managed charging
to deliver a demand response grid service between 5 p.m. and 9 p.m. .................................. 64 Figure 39. Percentage reduction in PEV charging load that can be removed during demand response
events occurring with varying durations during different times of the day ........................... 64
x
This report is available at no cost from the National Renewable Energy Laboratory (NREL) at www.nrel.gov/publications.
Figure 40. Fraction of U.S. drivers whose weekday and weekend travel needs can be satisfied by EVs under various scenarios of charger availability ...................................................................... 66
Figure 41. Fraction of drivers that have different levels of remaining EV range after accounting for battery energy consumption from all daily trips under various scenarios of charger availability .............................................................................................................................. 66
Figure 42. Sensitivity analysis of the impact of various vehicle use characteristics on the fraction of U.S. drivers whose daily travel can be satisfied with EVs for the Level 1 charging scenarios ..... 67
Figure 43. Potential HIL system for component/control system optimization ........................................... 73
List of Tables Table 1. Grid Service Potential at Various Scales ...................................................................................... 11 Table 2. Barriers to Integration and Recommended Research and Development to Enable PEV to Grid
Integration .............................................................................................................................. 23 Table 3. Comparison of Total Utility Load to PEV Loads for Both the Short-Term and Long-Term PEV
Penetration Scenarios ............................................................................................................. 49 Table 4. Example of Travel Itinerary Information for a Selected Vehicle Provided to V2G-Sim ............. 54 Table 5. Potential Needs by Layer .............................................................................................................. 68 Table 6. Potential Needs by Region ............................................................................................................ 69 Table 7. Potential Needs by Stakeholder .................................................................................................... 69 Table 8. Potential Needs by Policy Structure.............................................................................................. 71
1
This report is available at no cost from the National Renewable Energy Laboratory (NREL) at www.nrel.gov/publications.
1 Current Situation: Driving Interest and Opportunity for Vehicle Grid Integration
Concerns about environmental health, climate change, and energy security have spurred a rebirth of the electric vehicle (EV) and creation of new types of electrified vehicles in the automotive industry. In particular, the growth of plug-in electric vehicles (PEVs) is supported by U.S. state and federal legislative targets as well as those in the international community. PEVs represent a potentially large growth in electrical load that could boost electricity sales, but they may impact system capital and maintenance costs by contributing to peak loads and changing the loading patterns of electricity distribution equipment if vehicle charging is not properly coordinated and integrated as part of a larger electricity system. This integration can come in the form of organized unidirectional vehicle to grid (V1G) charging or bidirectional (V2G) electricity import and export. In parallel, legislation supporting renewable energy generation has led to the need for new flexible grid resources to support their reliable integration. Grid storage provides that needed flexibility, and PEVs have the potential to be a very low-cost form of grid storage if they can serve a dual purpose with a marginal impact on their primary transport role. Further, vehicle owners looking to reduce the overall cost of ownership of their PEV may be compensated for providing services when their vehicle is not in use for mobility. The combination of potential grid impacts from growing levels of unmanaged PEV charging and the opportunities from using these vehicles for electricity grid storage highlight the need to implement mechanisms to coordinate the integration of vehicles into the grid today and in the future.
Energy used in the transportation sector comprises approximately one-third of the total primary energy consumed in the United States [1]. In 2012, the energy consumed by light-duty vehicles accounted for 61% of all transportation energy consumption in the United States, or the equivalent of 8.4 million barrels of oil per day, and it represented 10% of the world’s petroleum liquids consumption [1]. Additionally, fossil-fueled combustion in the transportation sector contributes 28% of U.S. greenhouse gas emissions annually as well as significant quantities of urban pollutants [2]. These pollutant emissions can be significantly damaging to human health in urban centers, where population density is highest. However, vehicle electrification represents an opportunity to move emissions associated with transportation away from population centers. This can constitute an improvement in air quality and public health in urban centers and an opportunity for significant reductions in emissions if marginal load increases are met using clean resources, such as renewable generation [3].
U.S. state and federal governing bodies, as well as others globally, have enacted policies that support the growth of the electrified vehicle industry and greenhouse gas reductions in the electricity sector due to the social, economic, and environmental drivers discussed above. In the United States, 29states and a number of local governments have instituted renewable portfolio standards that set targets for electricity generation by renewable resources [4], and legislation is being implemented to establish additional ways to incentivize greenhouse gas reductions. In California, for example, the legislature has enacted bills that set targets for greenhouse gas reductions [5], increase the amount of distributed renewable energy [6], and mandate grid-connected energy storage [7]. Further, one governmental action set targets for zero-emission vehicle adoption, that includes a memorandum of understanding signed by eight state governors, to bring a total of 3.3 million EVs or hydrogen fuel cell vehicles on the road by 2025 [8]. At the federal level, the Department of Energy’s (DOE’s) EV Everywhere Grand Challenge [9] aims to
2
This report is available at no cost from the National Renewable Energy Laboratory (NREL) at www.nrel.gov/publications.
accelerate the deployment of EVs, and, acting separately, the Department of Transportation and the Environmental Protection Agency have tightened vehicle fuel economy standards [10], which will provide further incentives for electrified vehicle deployments. There is also considerable interest outside of the United States in vehicle electrification. The Chinese government has set targets of 5 million electrified vehicles on the road by 2020, primarily to help alleviate air pollution [11]. In 2013, India released its National Electric Mobility Mission Plan 2020, which targets the deployment of 5 million to 7 million hybrid and electrified vehicles in the country by 2020 [12]. In the European Union, mandates for member countries regarding charging infrastructure should further grow PEV sales [13]. These legislative actions taken at all levels of government lead to the expectation of an increase in renewable energy generation and PEV sales worldwide that present both opportunities and challenges for the electricity system.
Rising PEV sales coupled with increases in renewable energy generation provide both opportunities and challenges for electric utility companies. The addition of PEV charging may cause increases in peak electricity load and have adverse impacts on distribution grids, such as extended loading of transformers leading to premature failure [14], [15]. However, in many areas, self-generation from renewable resources is reducing the electricity energy sales upon which utilities rely to maintain their infrastructure [16], and the addition of PEV load represents a large boost in electricity sales that utilities are interested in promoting. Further, there is an opportunity to coordinate and control PEV charging to support the reliable operation of the electric grid [17]. With additional uncertainty and variability in the net electricity load due to renewable generation, system operators and utilities are looking for flexible resources that can be controlled to minimize the impacts of uncertainty and variability on the electricity system. PEV charging, and potentially discharging, has been identified as a possible flexible balancing resource available to grid operators [18], [19]. With recent attention on energy storage from regulators, PEVs may prove to be very low-cost electricity storage devices, because the majority of the capital investment can be attributed to their primary mobility function [17]. To electricity grid operators, PEVs represent a low-cost, highly controllable, and rapidly responding electricity storage device near load centers and an opportunity for increased electricity sales, which makes connected PEVs a highly valuable addition to the future electricity grid.
For PEV manufacturers and prospective vehicle owners, the high premium that consumers must pay up front to purchase PEVs can be a major barrier to increasing sales, and this may be mitigated by VGI. PEVs can cost thousands of dollars more than comparable conventional vehicle models [20], [21]. To increase the lifetime operational savings from the fuel switch, revenue from providing grid services has been proposed [22]. These VGI revenues have the potential to boost PEV sales by reducing the total cost of ownership of PEVs.
Finally, economic and social trends make vehicle-to-grid interactions even more attractive to PEV owners. The rise of the so-called “sharing economy,” as described in [23], has given popularity to the idea of using personal items for social and financial gain. Individuals may be more likely than ever to seek new ways to leverage the value of their capital assets, such as their home or vehicle. VGI can be considered an extension of these business models, in which a rent is paid to the vehicle owner in exchange for using their vehicle to support the electricity grid. Because these models are generally accepted in the public today, it stands to reason that a VGI-based model would be accepted and even desirable by PEV owners in the future.
3
This report is available at no cost from the National Renewable Energy Laboratory (NREL) at www.nrel.gov/publications.
2 Potential Grid-Integrated Vehicle Functions Grid services provided by integrated PEVs must be responsive to various stakeholders, maximize the value proposition, and scale from local to more broad implementations. This chapter presents several potential scenarios.
2.1 Stakeholders and System Components Following are the functional roles played by key stakeholders in the electrical system [24].
• System reliability. Independent system operators (ISOs) and regional transmission organizations (RTOs) operate regional transmission networks and ensure access to transmission by all users to facilitate competition in power supply markets. ISO charters vary by region. Some are responsible for transmission planning, rate setting, transaction processing, and the construction of new facilities, but their primary responsibility is maintaining system stability and reliability on a variety of timescales.
• Transmission. Transmission is a two-way network to transport electricity throughout a state or region. A grid refers to an integrated system that relies on generation, transmission, and distribution to move power from one location to another.
• Balancing. The current U.S. electric grid has very little energy storage capacity; therefore, the dynamic power demand must be made equal to or balanced with supply. A portion of the generation capacity is reserved to correct for inaccurate demand and supply forecasts. When utilities err in their generation control estimates, they pay balancing costs. The variability of power generated by renewable resources (e.g., wind and solar) affects a utility’s ability to accurately match resources and demand forecasts. Resource and geographic diversity can be used to limit the impacts of variable generation.
• Distribution. Distribution systems are generally designed for one-way power flow from a transmission line to an end user. A radial line refers to these one-way transmission and distribution elements. Distribution is typically controlled by a utility and maintained by the physical boundary between the distribution and transmission system of a substation transformer, which steps down the transmission system voltage. These systems were designed with no generation within the feeders, but the presence of V2G vehicles, stationary storage, and photovoltaic arrays in the feeders introduces new operational paradigms to the feeder voltage control systems.
• Feeder. Feeders are power lines emanating from a substation to residential and distribution transformers.
• Commerce. There can be considerable regional variation in actors that provide service to a consumer of electricity. These differences are defined by the following roles.
o Aggregators. Brokers act on behalf of groups of customers to negotiate for the purchase or supply of electricity services through service agreements. The aggregated customers may be entire municipalities (e.g., Cape Cod) or entities (e.g., municipal buildings) that pool their load to obtain favorable rates. The customer mix (e.g., residential, commercial, and industrial) dictates the services the aggregators can sell, because each has its own typical load curve.

4
This report is available at no cost from the National Renewable Energy Laboratory (NREL) at www.nrel.gov/publications.
o Utilities. Vertically oriented electric utilities have defined geographical distribution boundaries. Utilities are responsible for generating or purchasing their own electric power, transmission, and distribution to retail customers in their service territory.
o Load serving entities. Load serving entities serve retail customers within a control area and have been granted legal authority to sell electrical energy. These include aggregators with a distribution utility or simply a vertically oriented utility.
• Production. Electricity generation for the bulk power system is composed of baseload generating plants and variable generation. Baseload typically consists of coal and nuclear generating units, which are usually committed and dispatched at constant or near-constant levels. Variable generation sources provide energy that varies over time and cannot be readily stored. These sources typically include solar, wind, and some hydropower generation technologies.
• Consumption.
o Customers. With the advent of competition in the utility industry, utilities view each customer as one bill payer regardless of the number of meters they have.
o Building owners/homeowners: Building owners or homeowners are responsible for the operations and maintenance of their facilities and are electric customers. Owners that choose to install electric vehicle supply equipment (EVSE) are typically providing a resource for multiple PEV owners. In some cases, these owners may install local renewable generation from which at times they may sell electricity to the grid through a net metering agreement.
o Vehicles/Drivers/Owners. Operators of PEVs are responsible for connecting their PEVs to EVSE for charging. When the EVSE is at a home, the operator is typically an electric customer and the homeowner.
Following are some common terms related to grid-interface interactions and their definitions.
• Demand response. Demand response is voluntary (and compensated) load reduction used as a bulk system reliability resource. Historically, utilities have controlled generation to ensure reliability, but controlling load can also be effective. Methods of demand response are also known as direct load control, industrial load shedding, rolling blackouts, tariffs (time of use/critical peak pricing), demand limiting, and incentives (time-based rebates). An important consideration is that different customers respond well to different types of demand response.
• Congestion. In competitive power markets, the demand for low-cost power causes power to be transported great distances to reach consumers. When an existing transmission system cannot accommodate all of the power flow, congestion results. Congestion is relieved by operating higher-cost generators in the high-demand vicinity. These costs are passed on to consumers, often only to those online during the congested period. Congestion is managed by ISOs in competitive markets.
• Regulation services. Regulation services fine-tune the balance between power generation and demand. This is also called frequency regulation or automatic generation control, and

5
This report is available at no cost from the National Renewable Energy Laboratory (NREL) at www.nrel.gov/publications.
it is priced separately from power generation and procured as an ancillary service. A system operator uses the forecasted load to schedule generators to match the anticipated load 1 day ahead for each hour of the following day. This output is then corrected 1 hour ahead and further corrected every 5 minutes. A system operator then uses 4-second automatic generation control to command some generators to change generator output to exactly match the load. Grid-tied V1G/V2G PEVs can change load or generation in response to scheduled or automatic generation control commands.
• Voltage support. At the feeder level, voltage is controlled from the substation to the end of the feeder. The feeder voltage is maintained within a utility’s required tolerance band by changing feeder currents using variable-ratio transformers (tap changers) and capacitor banks. Solar generators can cause local voltage excursions on the feeders because of both high penetration and weather-influenced variability.
• Ramp rate. The ramp rate is the change in speed at which a generator can increase (ramp up) or decrease (ramp down) generation. Generating units have different characteristics, which make some more suited to supply certain needed functions. Research by the California Independent System Operator (CAISO) indicates that changes in solar generation output during spring and fall mornings and evenings may cause a need for mitigation strategies.
• Demand charges. Demand charges are additional charges for electricity based on the highest capacity (power) used during a given metered period, typically a 15-minute interval during a particular billing cycle.

6
This report is available at no cost from the National Renewable Energy Laboratory (NREL) at www.nrel.gov/publications.
Figure 1. System stakeholders
7
This report is available at no cost from the National Renewable Energy Laboratory (NREL) at www.nrel.gov/publications.
The architecture shown in Figure 1 is representative of key functions and responsibilities of the electrical transmission and distribution system. This is a general representation of an electrical energy system; but there are a wide variety of configurations. PEV owners and some of their concerns are indicated in color. The blue text shows PEV smart grid interfaces, the red text shows electricity cost-related considerations, and the green text represents opportunities available to PEV owners to reduce costs, meet environmental concerns, or provide services. Note that PEV customers are typically near the end of the electrical distribution chain.
2.2 Potential Value The potential value associated with managed charging is a very strong function of the regional balancing requirements, utility rate structures, generation mix, load portfolio, PEV usage profile, and battery characteristics. A region’s characteristics that affect the value proposition include on-peak/off-peak electricity rates, base electricity rates, time-of-use rates, demand charges, demand response, proximity of the distribution system to infrastructure limits, the availability of low-cost hydropower for balancing services, outage impact costs, and the relative proportion of renewables generation to base-load generation. These regional characteristics lead to a need for an integrated analysis that enables optimizing the value proposition. A regional PEV charging optimization strategy may offer grid benefits.
The following quantified value propositions are based on recent studies and analyses.
• PEVs can provide real-time frequency regulation when they are not being used for transportation. The highest value market is for frequency regulation ancillary services. In areas that have deregulated electricity markets, regulation can have average values of $30/MWh to $45/MWh [25]. However, recent data suggests market prices to be approximately $10/MWh because of falling natural gas costs.
• Spinning reserves (synchronous reserves) have values in the range of $10/MW of capacity per hour, but with much less frequent dispatch. Revenue primarily comes from capacity rather than energy. PEV batteries are designed to support quick response times at low total energy demand needed for capacity (power) applications [25].
• V2G architectures with aggregated vehicles can improve the compatibility of V2G with the current ancillary services system. Aggregation improves the reliability of V2G ancillary services and enables minimum contractible power requirements to be met [26].
• Dual-use V2G programs (frequency regulation and peak reduction) profits are actually higher, because peak reduction occurs on a limited number of days. Dual-use profits are highly dependent on power (charge rate), and in one example in New York they ranged from $277 to $837 annually for 1.3-kW chargers from 2007 to 2009 and from $2,200 to $2,500 for 10-kW chargers during the same time period [27].
• The U.S. Department of Defense V2G PEV projects that supply power to CAISO and early results from eV2g—a demonstration project in the Pennsylvania, New Jersey, Maryland Interconnection (PJM) territory—indicate that frequency regulation can potentially make as much as $150 per month per PEV. Frequency regulation revenue for PEVs in North America is predicted to grow to approximately $50 million in 2022 [28].
8
This report is available at no cost from the National Renewable Energy Laboratory (NREL) at www.nrel.gov/publications.
• The value of regulating services varies throughout the nation. States and regions that have higher penetration levels of variable energy resources (such as wind and solar power) and no flexible hydropower capacity tend to have higher costs and prices for regulation services. They may be the first market adopters for PEV regulation services.
• Load management strategies that reduce demand charges could have higher value than shifting charging from on-peak to off-peak periods. In most cases, a demand charge reduction or demand limiting strategy implies some load shifting from peak to off-peak hours and thus compounds the savings [29].
• V1G can provide significant value, but it requires approximately 50% more vehicles to provide the same wind generation balancing capability as V2G [30].
• A study using PEVs for voltage support recommended that PEVs should make economic charging decisions every 5 minutes while performing 1-second interval adjustments to voltage support. Simulation results indicate that the voltage support value may be from $5 to $50 per year per PEV [31].
• The value of implementing demand response is reported to be $50.70 per kW per year. The size of the demand response capacity (number of homes) is determined by the lowest load condition just meeting the balancing requirement, which leaves significant capacity underutilized for the remainder of the day. The most advantageous load profile for providing balancing services is a flat profile that achieves maximal utilization of the demand response resource. Because a typical residential load shape is not flat, meeting all balancing requirements with residential demand response is unlikely to be economical. [32].
• ISO/RTO Council [33] recommended several VGI products or services for initial deployment based on a combination of their potential usefulness to the ISO/RTOs and the likely response of aggregators and end consumers. A phased implementation approach is recommended by selecting the initial products and services that are characterized by their infrastructure requirements and ability to support grid reliability. The services include V1G and V2G implementations of:
o Emergency load curtailment. PEVs can provide a quick-response load-curtailment resource that may be aggregated for maximum effect for emergency events. Due to relatively simple mechanisms for engaging this resource’s large benefit, emergency load curtailment of PEV charging is likely a near-term product.
o Dynamic pricing. Time-of-use pricing has demonstrated customers’ responses to rate schedules. Dynamic pricing might be another way to charge PEV batteries during preferable times. There are a number of pricing methods including day-ahead and real-time pricing. Dynamic pricing is more complex and requires automated communications and control methods to implement. Another form of dynamic pricing is called transactive energy. Each participant in this market negotiates with the market for the price, time, and rate of energy transfer.
o Enhanced aggregation. The potential for high concentrations of PEV charging loads in the evening makes managing charging throughout the day a priority for ISO/RTOs. Some aggregators, automakers, and information management groups are proactive in developing scheduling capabilities. This product is
9
This report is available at no cost from the National Renewable Energy Laboratory (NREL) at www.nrel.gov/publications.
complementary to time-of-use programs such as those typically offered by retail utilities. It could also be potentially linked to a dynamic-pricing product.
o Regulation. Expected PEV load in the next few years is not likely to have a large impact on the amount of total regulation in the ISO/RTO markets or regulation-market prices. However, the regulation market is attractive to PEV stakeholders, because it can generate fairly predictable revenues. In addition, the relatively simple but new communications requirements for this product make it a good trial for subsequent PEV products and services.
o Reserves. Aggregated PEVs are capable of providing two services: spinning reserves and demand response that use similar communications.
• Emergency/off-grid backup power/outage mitigation and transmission and distribution deferral costs. These are associated with infrequent, localized, and relatively short-duration events. The continuity of power has a high value for some facilities or regions (e.g., hospitals, individuals requiring specialized services). The costs associated with outages can be reduced by shortening the outage length. Transmission and distribution deferral can be justified when services are available to supply power when grid load exceeds the transmission and distribution capacity.
2.3 Scales The studies described above consistently state that the regulation services market has a high value proposition that can be enhanced by combining it with other services. PEVs with V1G charging rate control are uniquely suited to participate in a variety of services, including time of use/critical peak pricing, demand charge reduction, demand response, voltage support, and ramp rate reduction. PEVs with V2G charging control require fewer vehicles to provide the same service level and can also participate in outage mitigation, transmission and distribution deferral, and arbitrage services that are beneficial for enabling greater levels of renewable generation on the grid.
The basic building block to extend the value proposition beyond preferred PEV charging times and rates is the electrical meter behind which the PEV is connected. The meter provides quantifiable charging data to a utility or aggregator. This data can then be accurately associated with needed services that were communicated to the PEVs and the timeliness of the services rendered. A number of options are available for this bidirectional communications between PEV and aggregator/utility, including EVSE networks, original equipment manufacturer (OEM) vehicle networks, smart meter networks, and home networks. After the value proposition has been identified, the second hurdle is developing and implementing the PEV-to-meter customer communications network connectivity to an aggregator or utility that can be broadly scaled while still meeting the service delivery requirements.
Validating the PEV grid service value proposition requires that both the communications and the PEV charging infrastructure deliver timely services and that the customer receives remuneration for these services. The utility must also be able to measure an impact that provides value to its operation. This impact will be primarily realized at the distribution level.
At the home meter level, a utility-offered EV tariff program selection (e.g., time-of-use rate) is typically the least-cost approach for the PEV owner, provided the owner’s PEV charging need
10
This report is available at no cost from the National Renewable Energy Laboratory (NREL) at www.nrel.gov/publications.
conforms to the EV program schedule. An integrated OEM timer control exists in many vehicles presently on the road to take advantage of these seasonally fixed time-window programs; however, this implementation does not allow for communicated management, and transformer impacts are amplified by concentrating PEV charging in narrow time windows. Instead, if for example PEVs are charged when demand charges are in effect, home energy management systems can transmit energy consumption limitations. This charging rate control has been demonstrated as a method to implement either static or dynamic home energy limits [29]. V1G controlled charging is typically adequate at the home level, because demand charges are on peak energy usage in a month and the peak could occur when a PEV is not plugged in. Aggregation is currently required to gain access to most additional grid service value at the home level.
If building or campus loads were aggregated with adequate PEV loads, the building or campus load shape could be flattened by scheduling PEV charging times. The flattened load shape would enable more predictable result for demand response and critical peak pricing events, reduce facility demand charges, and enable voltage support services to be provided. If combined with V2G PEVs, additional value could be obtained by supplying power to the building or campus when needed as well as by providing infrequent but high-value outage mitigation and transmission and distribution deferral services. Key advantages of aggregating PEV charging with building or campus loads is the preexisting relationship (employer/employee) for remuneration, an established communications infrastructure, and the potential for additional utility revenue for regulation services. Challenges are associated with this approach, including the complexity of integrating the schedules and travel demands of many PEV owners with the needs of the facility, implementing remuneration contracts to each PEV owner, bridging the building or campus energy management and control system to distinct PEV charging control systems, and implementing PEV charging communications controls at the building or campus level. A predictable building or campus load shape favorable to the distribution system could justify preferred utility electrical rates for the building or campus owner. Additional communications and control complexity is required for high-value regulation services.
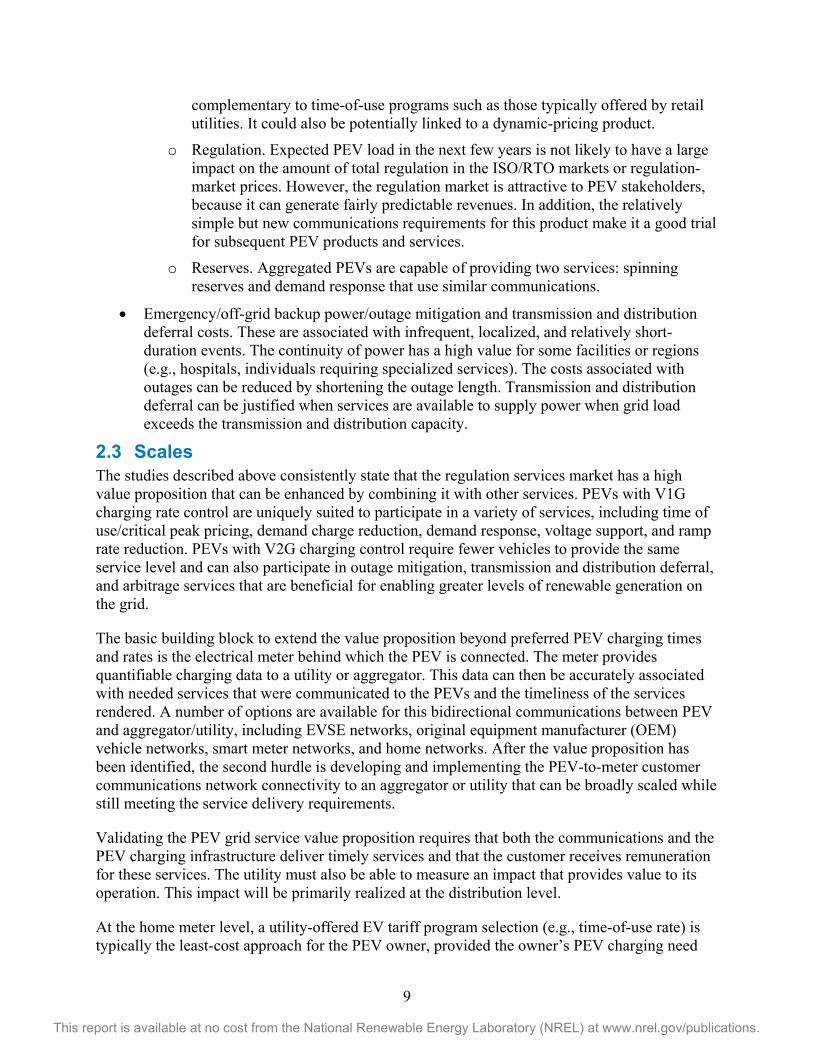
Aggregation beyond the building or campus level requires more broadly adopted communications through networks such as EVSE networks, OEM vehicle networks, or smart meter networks to an aggregator or utility. Communications of the metering data, customer information, and services rendered to the aggregator or utility are needed for the customer to receive payment. The aggregator must develop a controllable load or service customer base that can be integrated and to which services can be sold. A market must also be available for economic transactions to occur. The purple and green shaded states shown in Figure 2 have deregulated electric markets. The availability of these markets and restrictions in participation vary widely. Some markets have had mixed results in delivering lower cost energy to consumers.
11
This report is available at no cost from the National Renewable Energy Laboratory (NREL) at www.nrel.gov/publications.
Figure 2. States that have deregulated energy markets
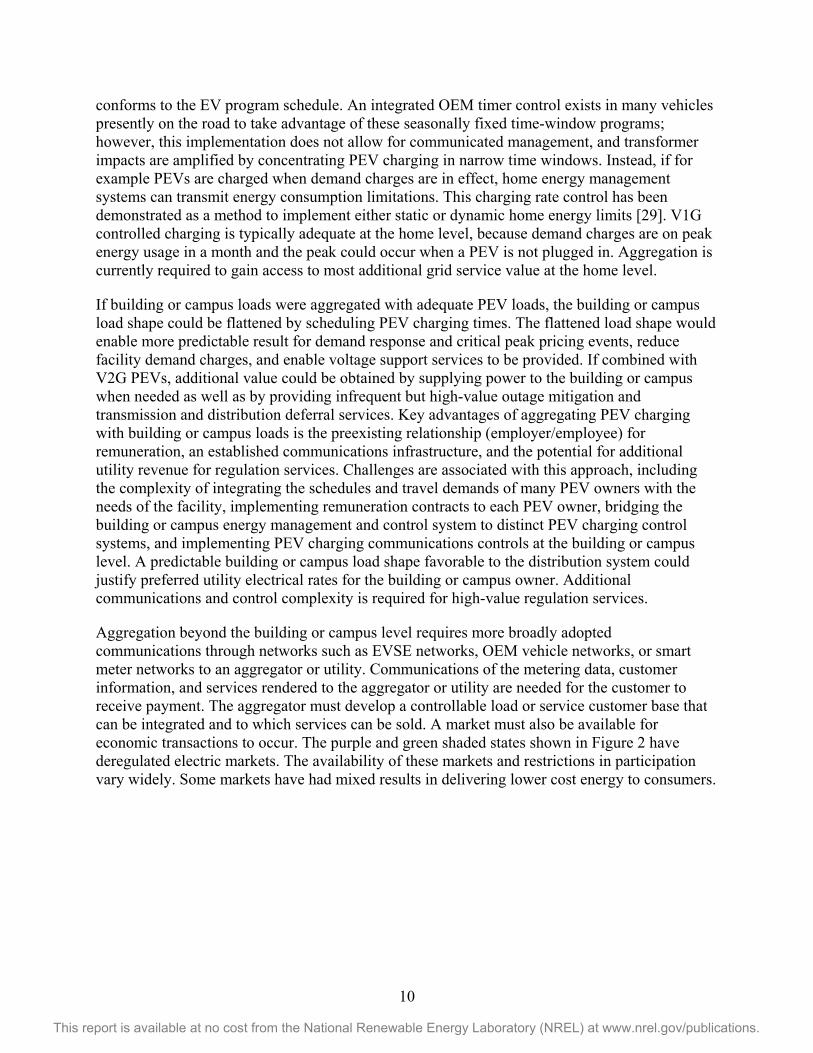
Table 1 provides a summary of grid services that currently could have an economic impact at the home, building or campus, and aggregator levels. Note that there is likely only one “customer” and metered rate schedule for homes and buildings, whereas an aggregator, shown in the third row, is likely implemented across multiple “customers” and metering schedules, which induces significant complexity.
Table 1. Grid Service Potential at Various Scales
Scale Time of Use/ Critical Peak
Pricing Demand Charges
Voltage Support
Regulation Services
Demand Response
Ramp Rate
Outage/ Transmission
and Distribution Arbitrage
Home/PEV Owner
V1G/ V2G
V1G/ V2G
Building/ Campus
V1G/ V2G
V1G/ V2G
V1G/ V2G
V1G/ V2G
V1G/ V2G
V1G/ V2G V2G V2G
Aggregator V1G/ V2G
V1G/ V2G
V1G/ V2G
V1G/ V2G
V1G/ V2G
V1G /V2G V2G V2G
PEV-sourced grid services such as those listed in Table 1 must also have a positive economic impact for a utility-owned distribution system. This utility economic impact will be regional and will also be affected by generation resources, stationary storage portfolios, the availability of low-cost hydropower for balancing services, the relative proportion of renewables generation to base-load generation, and the proximity of the distribution system to infrastructure limits. The communications and control system between aggregators, balancing authorities, utilities, and system operators needs to have a communications and control latency requirement adequate to meet electrical system requirements. V2G’s bidirectional current flow in the feeders will also add a layer of complexity to the utility managing the distribution system current flow.
System operators (ISOs/RTOs) are responsible for the electrical system stability and reliability on a variety of timescales. This responsibility includes maintaining adequate base-load generation and system frequency control though day-ahead, hour-ahead, and 5-minute scheduling as well as automatic generation control commands. A key aspect of the VGI value
12
This report is available at no cost from the National Renewable Energy Laboratory (NREL) at www.nrel.gov/publications.
proposition will be the reliable and timely response to scheduled changes in the aggregated PEV power sourced or consumed.
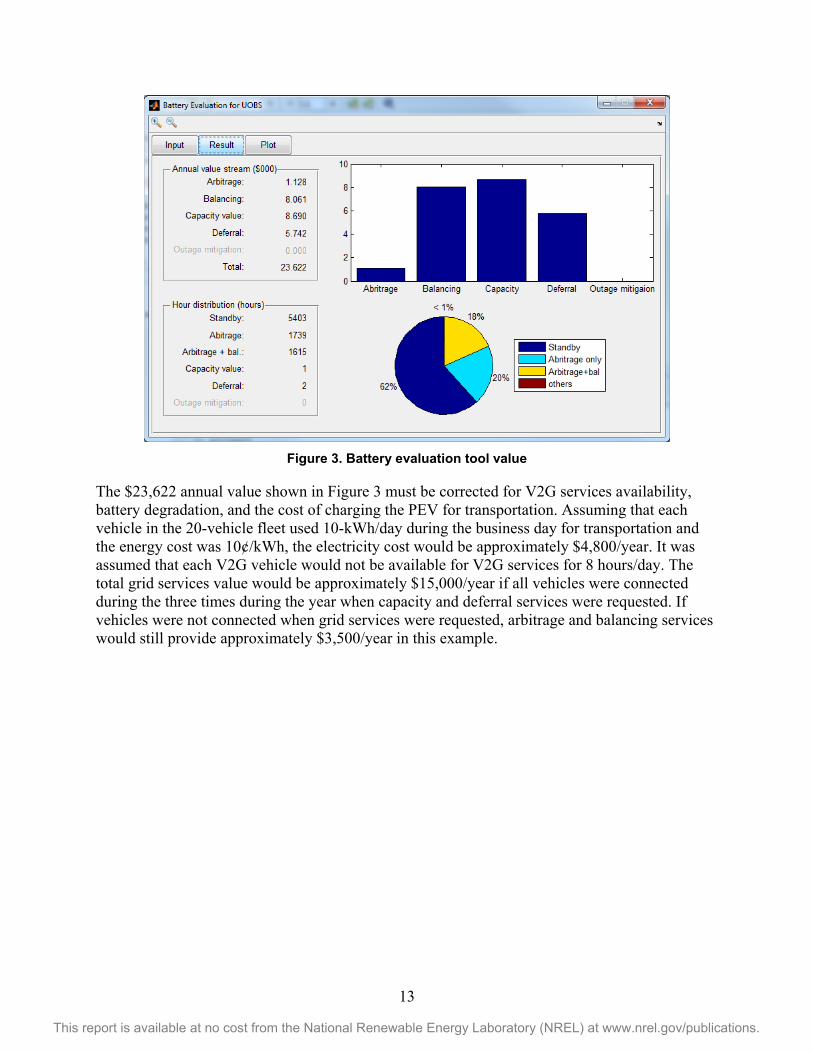
2.4 Example Value Proposition/Grid Impact Maximizing the value proposition becomes more complex as the number of potential services expands. Pacific Northwest National Laboratory has developed a tool [34] [35] for the stationary energy storage industry that integrates grid conditions with potential grid service value and implementation optimization (i.e., when to charge or discharge the batteries and which grid service participation maximizes the customer value). Aggregated V2G vehicles would be a distributed implementation of a stationary energy storage system when connected to the grid and not being used for mobility. The total value depends on battery capacity availability and grid services required. This dynamic value maximization process can be integrated into a transactive architecture enabling the PEV to negotiate prices for the grid services offered. The original tool is being updated to compensate for vehicle availability based on vehicle travel patterns, energy consumed for transportation purposes, and costs associated with Li-ion battery degradation for aggregated PEV scenarios.
Characteristics of the simulated grid conditions used for this example are listed below.
• Energy capacity: 0.5 MWh—20 V2G vehicles with 25-kWh batteries • Power capacity: 66 kW—20 V2G vehicles with 3.3-kW chargers • Battery charging efficiency: 90% [36] • Battery discharging efficiency: 81% [36] • Price: Varied from 2¢/kWh to 23.5¢/kWh. Obtained from a price forecasting model,
Aurora, used by Puget Sound Energy to minimize production costs and generate corresponding energy prices
• Arbitrage energy storage systems: Charge during low-price periods (i.e., buying electricity) and discharge the stored energy during periods of high prices (i.e., selling during high-priced periods). The economic reward is the price differential between buying and selling electrical energy minus the cost of losses during the charging/discharging cycle.
• Outage mitigation: Reduce the duration and frequency of unplanned electrical system outages. This includes transient faults, brownouts, and blackouts.
• Transmission and distribution deferral: Provide additional capacity to defer or avoid the need to upgrade electrical transmission and distribution equipment or extend the life of existing transmission and distribution equipment.
• Balancing signal input file: Contains minute-by-minute balancing signals throughout a year. The system reserve requirements and balancing signals in the Puget Sound Energy system were determined stochastically based on 1-minute system load data, wind generation data, and statistics of current load and wind forecast errors.
• Capacity value and transmission and distribution deferral input files: Contain power requirements during each hour for the two services. The values were obtained using forecast load information and available system/local resource capacity for Bainbridge Island.
13
This report is available at no cost from the National Renewable Energy Laboratory (NREL) at www.nrel.gov/publications.
Figure 3. Battery evaluation tool value
The $23,622 annual value shown in Figure 3 must be corrected for V2G services availability, battery degradation, and the cost of charging the PEV for transportation. Assuming that each vehicle in the 20-vehicle fleet used 10-kWh/day during the business day for transportation and the energy cost was 10¢/kWh, the electricity cost would be approximately $4,800/year. It was assumed that each V2G vehicle would not be available for V2G services for 8 hours/day. The total grid services value would be approximately $15,000/year if all vehicles were connected during the three times during the year when capacity and deferral services were requested. If vehicles were not connected when grid services were requested, arbitrage and balancing services would still provide approximately $3,500/year in this example.
14
This report is available at no cost from the National Renewable Energy Laboratory (NREL) at www.nrel.gov/publications.
3 Enabling PEV to Grid Integration 3.1 Key Factors to Enable PEV to Grid Integration Effectively integrating PEVs with a power grid offers the potential to reduce peak power requirements, regulate grid voltage and frequency, and balance the intermittent power output of distributed energy resources (DERs). To provide this functionality, an environment that enables grid coordination with EVSEs and PEVs is necessary. Although the availability of private and public EVSEs have increased to accommodate the increasing numbers of PEVs in the market, most lack the sophistication (i.e., communications and control capability) to be integrated in a managed grid in a manner that is required to implement the higher-level PEV-grid service functions mentioned above. In addition, the metering and communications infrastructure that connects PEVs to utilities for grid service is not yet well defined and developed. Various challenges remain to integrate PEVs in a (future) smart grid, including system architecture, communications and information exchange standards, and regulation and business models. Key factors to enable seamless VGI include:
• A uniform reference architecture
• Harmonized interface standards or protocol translators for interoperability
• Standard use cases and demonstrations to quantify the costs and benefits
• Control paradigms that enable coordinated control and active grid management
• An advanced metering infrastructure (AMI) and sensing technology for grid quality, reliability, and real-time energy management
• Cyber security.
3.2 Current State
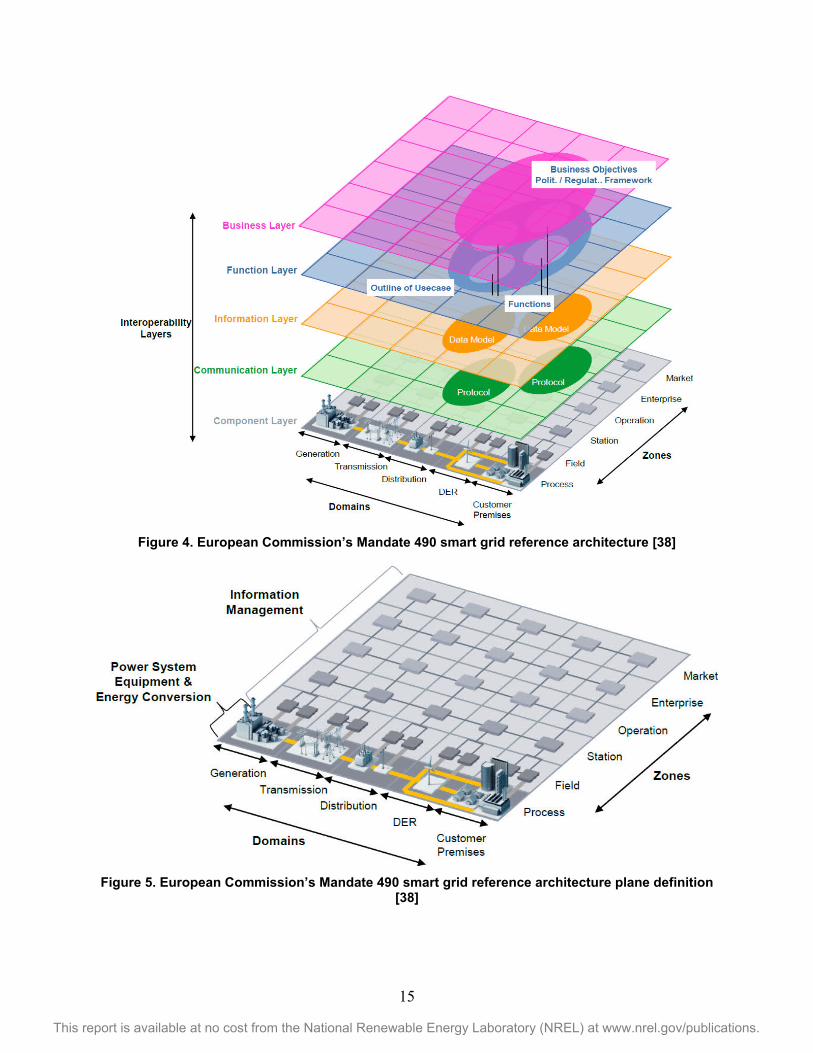
3.2.1 Reference Architecture The smart grid is a complex system that needs to provide service for different types of customers (industrial, business, and residential) within various regional utilities and support diverse devices and systems developed by different manufacturers [37]. Facilitating interoperability in such a large-scale distributed system would benefit from the adoption of a reference architecture to define requirements for interoperability and smart grid use cases. A reference architecture is defined as “the structure of a system with its element types and their structures, as well as their interaction types, among each other and with their environment [38].” There are several smart grid reference architecture models. Figure 4 shows the smart grid reference architecture (Smart Grid Architecture Model) [38] defined by the European Commission’s Mandate 490 for smart grids. This three-dimensional reference architecture relates five interoperability layers to the two-dimensional smart grid plane (Figure 5). The interoperability dimension defines five abstract interoperability layers: business, function, information, communications, and component. The two-dimensional smart grid plane defines smart grid components and subsystems from the viewpoints of electrical process and information management. One dimension covers the complete electrical energy conversion chain: bulk generation, transmission, distribution, DER, and customers premises; whereas the other dimension represents the hierarchical levels of power system management: process, field, station, operation, enterprise, and market.
15
This report is available at no cost from the National Renewable Energy Laboratory (NREL) at www.nrel.gov/publications.
Figure 4. European Commission’s Mandate 490 smart grid reference architecture [38]
Figure 5. European Commission’s Mandate 490 smart grid reference architecture plane definition
[38]
16
This report is available at no cost from the National Renewable Energy Laboratory (NREL) at www.nrel.gov/publications.
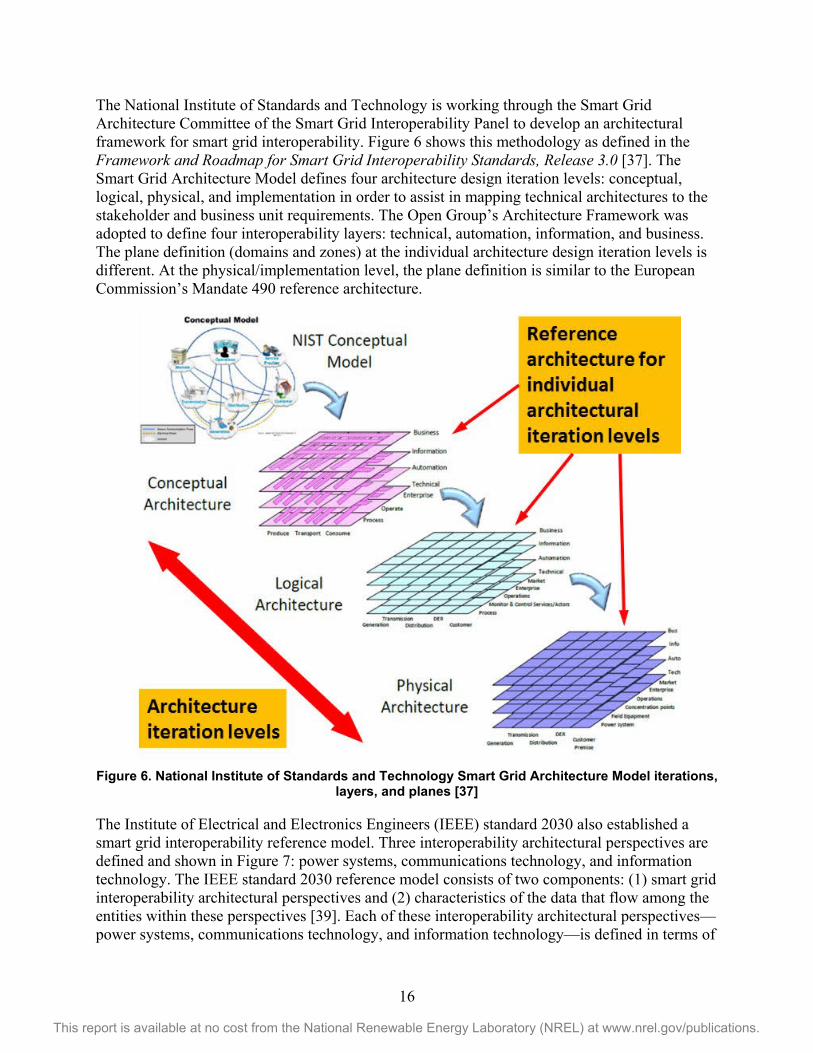
The National Institute of Standards and Technology is working through the Smart Grid Architecture Committee of the Smart Grid Interoperability Panel to develop an architectural framework for smart grid interoperability. Figure 6 shows this methodology as defined in the Framework and Roadmap for Smart Grid Interoperability Standards, Release 3.0 [37]. The Smart Grid Architecture Model defines four architecture design iteration levels: conceptual, logical, physical, and implementation in order to assist in mapping technical architectures to the stakeholder and business unit requirements. The Open Group’s Architecture Framework was adopted to define four interoperability layers: technical, automation, information, and business. The plane definition (domains and zones) at the individual architecture design iteration levels is different. At the physical/implementation level, the plane definition is similar to the European Commission’s Mandate 490 reference architecture.
Figure 6. National Institute of Standards and Technology Smart Grid Architecture Model iterations,
layers, and planes [37]
The Institute of Electrical and Electronics Engineers (IEEE) standard 2030 also established a smart grid interoperability reference model. Three interoperability architectural perspectives are defined and shown in Figure 7: power systems, communications technology, and information technology. The IEEE standard 2030 reference model consists of two components: (1) smart grid interoperability architectural perspectives and (2) characteristics of the data that flow among the entities within these perspectives [39]. Each of these interoperability architectural perspectives—power systems, communications technology, and information technology—is defined in terms of
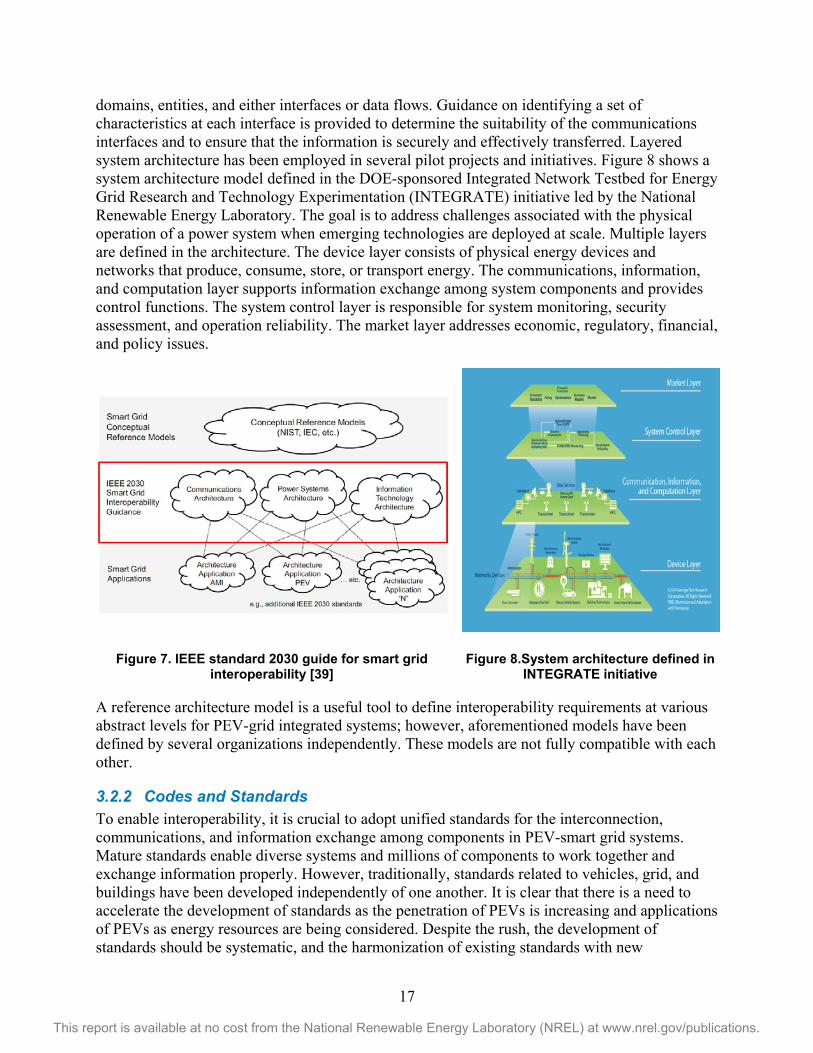
17
This report is available at no cost from the National Renewable Energy Laboratory (NREL) at www.nrel.gov/publications.
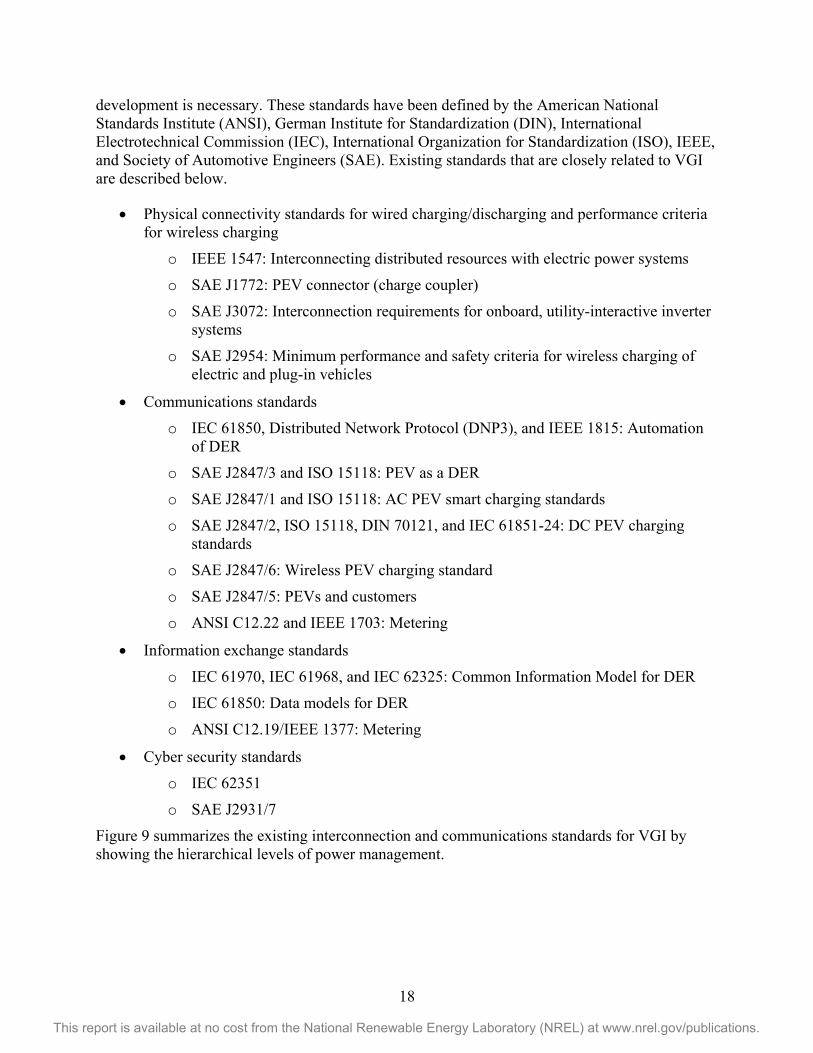
domains, entities, and either interfaces or data flows. Guidance on identifying a set of characteristics at each interface is provided to determine the suitability of the communications interfaces and to ensure that the information is securely and effectively transferred. Layered system architecture has been employed in several pilot projects and initiatives. Figure 8 shows a system architecture model defined in the DOE-sponsored Integrated Network Testbed for Energy Grid Research and Technology Experimentation (INTEGRATE) initiative led by the National Renewable Energy Laboratory. The goal is to address challenges associated with the physical operation of a power system when emerging technologies are deployed at scale. Multiple layers are defined in the architecture. The device layer consists of physical energy devices and networks that produce, consume, store, or transport energy. The communications, information, and computation layer supports information exchange among system components and provides control functions. The system control layer is responsible for system monitoring, security assessment, and operation reliability. The market layer addresses economic, regulatory, financial, and policy issues.
Figure 7. IEEE standard 2030 guide for smart grid interoperability [39]
Figure 8.System architecture defined in INTEGRATE initiative
A reference architecture model is a useful tool to define interoperability requirements at various abstract levels for PEV-grid integrated systems; however, aforementioned models have been defined by several organizations independently. These models are not fully compatible with each other.
3.2.2 Codes and Standards To enable interoperability, it is crucial to adopt unified standards for the interconnection, communications, and information exchange among components in PEV-smart grid systems. Mature standards enable diverse systems and millions of components to work together and exchange information properly. However, traditionally, standards related to vehicles, grid, and buildings have been developed independently of one another. It is clear that there is a need to accelerate the development of standards as the penetration of PEVs is increasing and applications of PEVs as energy resources are being considered. Despite the rush, the development of standards should be systematic, and the harmonization of existing standards with new
18
This report is available at no cost from the National Renewable Energy Laboratory (NREL) at www.nrel.gov/publications.
development is necessary. These standards have been defined by the American National Standards Institute (ANSI), German Institute for Standardization (DIN), International Electrotechnical Commission (IEC), International Organization for Standardization (ISO), IEEE, and Society of Automotive Engineers (SAE). Existing standards that are closely related to VGI are described below.
• Physical connectivity standards for wired charging/discharging and performance criteria for wireless charging
o IEEE 1547: Interconnecting distributed resources with electric power systems
o SAE J1772: PEV connector (charge coupler)
o SAE J3072: Interconnection requirements for onboard, utility-interactive inverter systems
o SAE J2954: Minimum performance and safety criteria for wireless charging of electric and plug-in vehicles
• Communications standards
o IEC 61850, Distributed Network Protocol (DNP3), and IEEE 1815: Automation of DER
o SAE J2847/3 and ISO 15118: PEV as a DER
o SAE J2847/1 and ISO 15118: AC PEV smart charging standards
o SAE J2847/2, ISO 15118, DIN 70121, and IEC 61851-24: DC PEV charging standards
o SAE J2847/6: Wireless PEV charging standard
o SAE J2847/5: PEVs and customers
o ANSI C12.22 and IEEE 1703: Metering
• Information exchange standards
o IEC 61970, IEC 61968, and IEC 62325: Common Information Model for DER
o IEC 61850: Data models for DER
o ANSI C12.19/IEEE 1377: Metering
• Cyber security standards
o IEC 62351
o SAE J2931/7
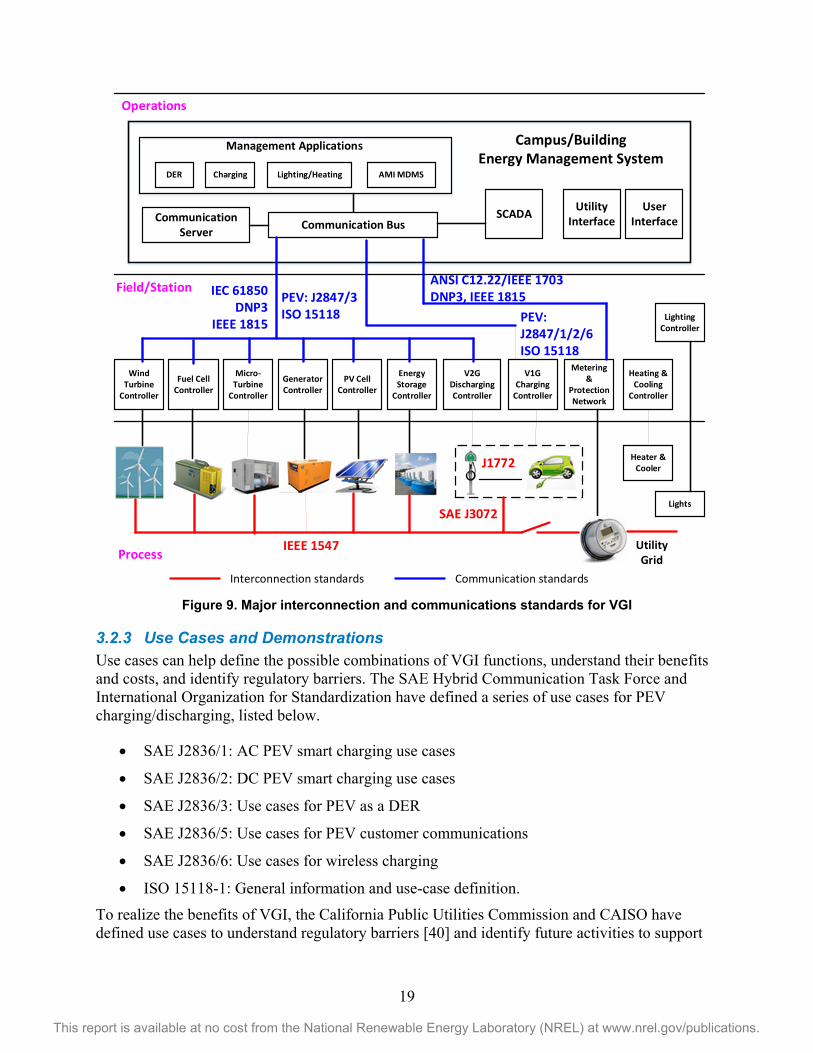
Figure 9 summarizes the existing interconnection and communications standards for VGI by showing the hierarchical levels of power management.
19
This report is available at no cost from the National Renewable Energy Laboratory (NREL) at www.nrel.gov/publications.
Figure 9. Major interconnection and communications standards for VGI
3.2.3 Use Cases and Demonstrations Use cases can help define the possible combinations of VGI functions, understand their benefits and costs, and identify regulatory barriers. The SAE Hybrid Communication Task Force and International Organization for Standardization have defined a series of use cases for PEV charging/discharging, listed below.
• SAE J2836/1: AC PEV smart charging use cases
• SAE J2836/2: DC PEV smart charging use cases
• SAE J2836/3: Use cases for PEV as a DER
• SAE J2836/5: Use cases for PEV customer communications
• SAE J2836/6: Use cases for wireless charging
• ISO 15118-1: General information and use-case definition.
To realize the benefits of VGI, the California Public Utilities Commission and CAISO have defined use cases to understand regulatory barriers [40] and identify future activities to support
Wind Turbine
Controller
Fuel CellController
Micro- Turbine
Controller
GeneratorController
PV CellController
Energy Storage
Controller
J1772
Process
Heater & Cooler
Field/Station
V2G Discharging Controller
V1G Charging
Controller
Lighting Controller
Heating & Cooling
Controller
Metering &
ProtectionNetwork
Operations
Campus/Building Energy Management System
User Interface
Management Applications
DER Charging Lighting/Heating
Utility InterfaceCommunication Bus
SCADA
Lights
Communication Server
AMI MDMS
PEV: J2847/3 ISO 15118
IEC 61850DNP3
IEEE 1815 PEV: J2847/1/2/6ISO 15118
ANSI C12.22/IEEE 1703 DNP3, IEEE 1815
IEEE 1547 Utility Grid
SAE J3072
Interconnection standards Communication standards
20
This report is available at no cost from the National Renewable Energy Laboratory (NREL) at www.nrel.gov/publications.
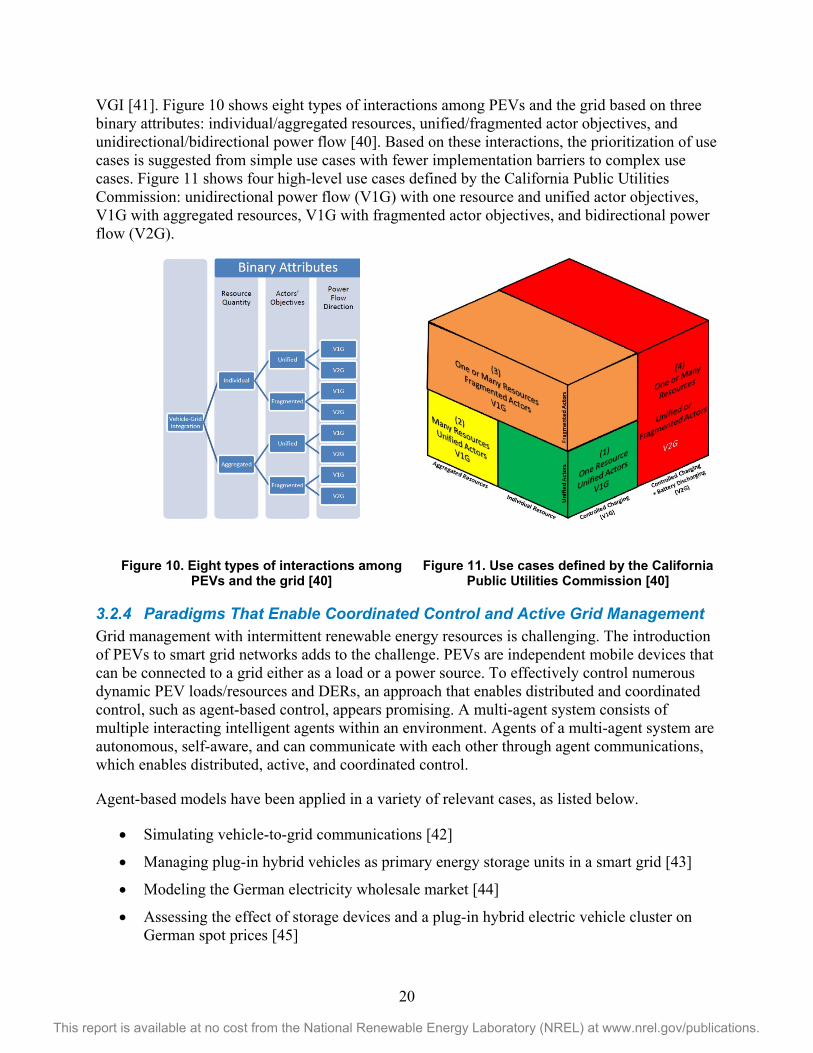
VGI [41]. Figure 10 shows eight types of interactions among PEVs and the grid based on three binary attributes: individual/aggregated resources, unified/fragmented actor objectives, and unidirectional/bidirectional power flow [40]. Based on these interactions, the prioritization of use cases is suggested from simple use cases with fewer implementation barriers to complex use cases. Figure 11 shows four high-level use cases defined by the California Public Utilities Commission: unidirectional power flow (V1G) with one resource and unified actor objectives, V1G with aggregated resources, V1G with fragmented actor objectives, and bidirectional power flow (V2G).
Figure 10. Eight types of interactions among PEVs and the grid [40]
Figure 11. Use cases defined by the California Public Utilities Commission [40]
3.2.4 Paradigms That Enable Coordinated Control and Active Grid Management Grid management with intermittent renewable energy resources is challenging. The introduction of PEVs to smart grid networks adds to the challenge. PEVs are independent mobile devices that can be connected to a grid either as a load or a power source. To effectively control numerous dynamic PEV loads/resources and DERs, an approach that enables distributed and coordinated control, such as agent-based control, appears promising. A multi-agent system consists of multiple interacting intelligent agents within an environment. Agents of a multi-agent system are autonomous, self-aware, and can communicate with each other through agent communications, which enables distributed, active, and coordinated control.
Agent-based models have been applied in a variety of relevant cases, as listed below.
• Simulating vehicle-to-grid communications [42]
• Managing plug-in hybrid vehicles as primary energy storage units in a smart grid [43]
• Modeling the German electricity wholesale market [44]
• Assessing the effect of storage devices and a plug-in hybrid electric vehicle cluster on German spot prices [45]
21
This report is available at no cost from the National Renewable Energy Laboratory (NREL) at www.nrel.gov/publications.
• Modeling a virtual power plant and scheduling supply to the grid and storage in EV batteries [46]
• Managing the recharging behavior of grid-connected plug-in hybrid electric vehicles [47].
The technology has also gained applications in PEV charging control. Haack et al [48] demonstrated an agent-based control system to maintain energy usage of a residence at a defined goal. Household loads include the heating, ventilating, and air-conditioning unit; water heater; and up to three PEVs. VOLTTRON [49] agents control the PEV charging rate and fulfill all homeowner energy demands by carefully specifying energy-consumption priorities.
The Autonomous Regional Active Network Management System (AuRA-NMS) [50] is an effort to develop an active power grid management system. The project investigates distributed control methods to remove technical barriers to the connection of small-scale renewable generators, energy storage systems, and dynamic loads, such as PEVs, to the grid and maintain the quality of distribution networks. Seven universities in the United Kingdom, two distributed network operators, and ABB Ltd. are participating in this project. The objectives of AuRA-NMS include power flow management, steady-state voltage control, automatic restoration, and proactive network optimization. AuRA-NMS adopts a multi-agent system approach to provide flexibility and extensibility [51]. Control objectives are implemented as software agents that can be deployed with an agent platform running across several substation computers.
3.2.5 Advanced Metering Infrastructure and Sensing Technology for Grid Quality, Reliability, and Real-Time Energy Management
To integrate PEVs into a smart grid, AMI and sensing technologies are critical for real-time energy management and to ensure grid quality and reliability. AMI integrates smart meters, communications networks, and meter data management systems and enables two-way communications by providing near real-time data on power consumption and electricity price. With the emergence of intermittent energy resources (such as solar and wind) and dynamic PEV loads, multiple sensing and monitoring functions are needed for efficient grid operation and maintenance. The information gathered by the AMI and sensors can be used to make control decisions to improve grid quality, ensure grid reliability, and achieve the optimization of energy management.
The sensing and monitoring functions implemented in current EVSEs are limited. Smart meters available on the market use the Smart Energy Profile 1.0 standard and can measure only power consumption. Some smart meter manufacturers are working with industry to integrate power consumption measurement with sensing capabilities. For example, Itron Embedded Sensing [52] is integrating bidirectional energy flow measurement with voltage monitoring for solar inverters and energy storage systems.
Most advanced metering infrastructure systems available today are proprietary. To develop an open and interoperable AMI, the Electric Power Research Institute IntelliGrid program [53] launched an initiative with utilities to identify the values of interoperable AMI and define a generic AMI architecture [54].
22
This report is available at no cost from the National Renewable Energy Laboratory (NREL) at www.nrel.gov/publications.
3.2.6 PEV and EVSE Cyber Security for VGI The improved communications and control needs identified in sections 3.2.1 to 3.2.5 introduce cyber security vulnerabilities that can clearly be used to exploit the emerging V1G and V2G system functionalities that PEVs would provide to a smarter grid. Vulnerabilities have been demonstrated that allow exploiters to locally control the EVSE and its ability to accurately measure kWh transfers. Further, via the EVSE system’s ability to communicate and be controlled by back-office operations, it is possible to take control of other EVSEs located in remote locations.
Idaho National Laboratory has performed cyber security assessments of several smart grid-enabled EVSEs that have been and are being developed for consumer use. These units are designed to be connected to the grid and managed by an electric utility company so that V1G charging of the vehicles will enhance the overall stability of the electric grid when deployed at a large scale. The cyber assessment performed was done in a manner to evaluate the accessibility of the EVSE from remote means as well as with physical access to the device. The intent is to provide EVSE manufacturers with information about how to secure their hardware and software so that the devices will be less likely to be used in nefarious ways. This testing is very specific to the particular EVSE design, and the results have been released only to the respective EVSE manufacturer. However, it can be said that both remote and physical access risks exist, and the vulnerabilities exposed have ranged from minor harm to the local EVSE to using local access to completely control the EVSE of one manufacturer’s countrywide system, including being able to turn other EVSEs off at distant locations.
Although today’s EVSEs have been predominately connected to the back-office operations of major industrial companies, future EVSE communications are envisioned to be connected to electric utility computer and control systems. This introduces probable vulnerabilities to the utility operation and control of the grid that would result from this new communications pathway. Similarly, there is a need to better understand and protect the vulnerabilities that start at the EVSE and can impact the control systems of the PEV. Further, it is possible that attacks on the control systems of PEVs would result in vulnerabilities that may exploit grid communications via the EVSE utilizing the vehicle-to-grid communications pathway.
Understanding cyber security implications will require the implementation and testing of systems that meet the standards discussed in Section 3.2.2. These tests will provide a mechanism to inform the manufacturers of the potential risks, possible equipment enhancements, and more broadly inform the standards community in order to propose revisions for improving the security of these systems.
3.3 Recommended Research and Development to Enable PEV to Grid Integration
Table 2 summarizes the barriers to integration as well as recommendations and strategic research and development opportunities to enable VGI.
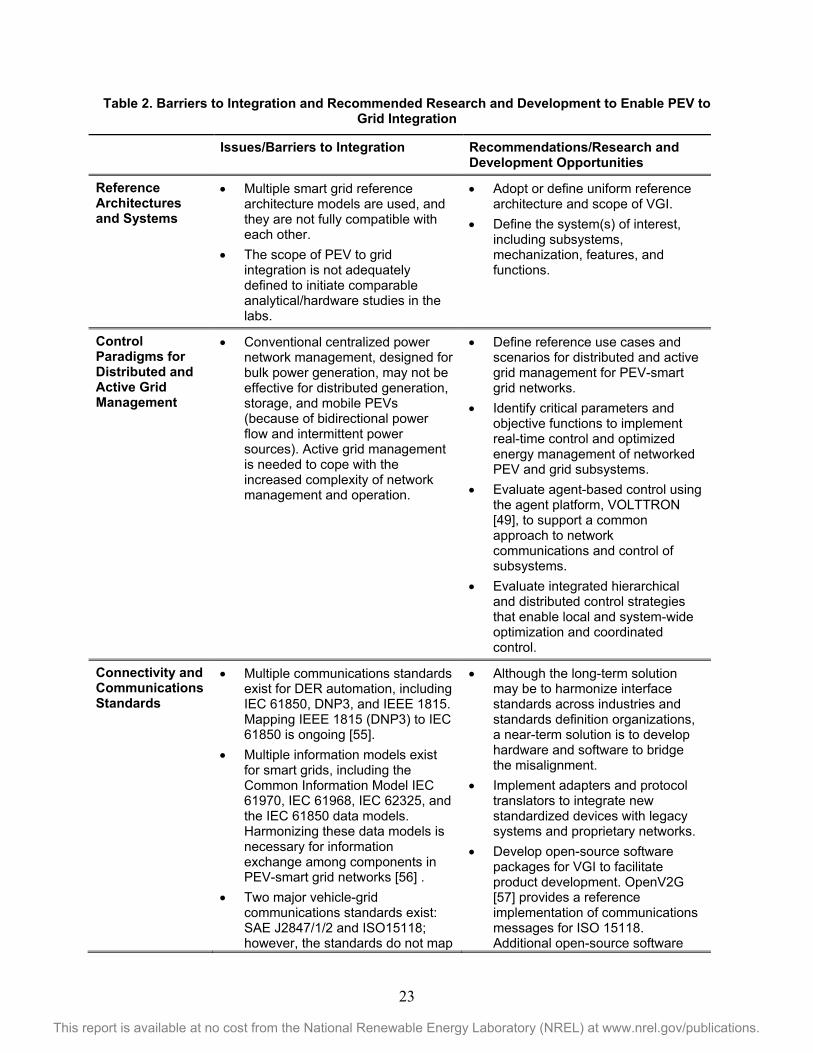
23
This report is available at no cost from the National Renewable Energy Laboratory (NREL) at www.nrel.gov/publications.
Table 2. Barriers to Integration and Recommended Research and Development to Enable PEV to Grid Integration
Issues/Barriers to Integration Recommendations/Research and Development Opportunities
Reference Architectures and Systems
• Multiple smart grid reference architecture models are used, and they are not fully compatible with each other.
• The scope of PEV to grid integration is not adequately defined to initiate comparable analytical/hardware studies in the labs.
• Adopt or define uniform reference architecture and scope of VGI.
• Define the system(s) of interest, including subsystems, mechanization, features, and functions.
Control Paradigms for Distributed and Active Grid Management
• Conventional centralized power network management, designed for bulk power generation, may not be effective for distributed generation, storage, and mobile PEVs (because of bidirectional power flow and intermittent power sources). Active grid management is needed to cope with the increased complexity of network management and operation.
• Define reference use cases and scenarios for distributed and active grid management for PEV-smart grid networks.
• Identify critical parameters and objective functions to implement real-time control and optimized energy management of networked PEV and grid subsystems.
• Evaluate agent-based control using the agent platform, VOLTTRON [49], to support a common approach to network communications and control of subsystems.
• Evaluate integrated hierarchical and distributed control strategies that enable local and system-wide optimization and coordinated control.
Connectivity and Communications Standards
• Multiple communications standards exist for DER automation, including IEC 61850, DNP3, and IEEE 1815. Mapping IEEE 1815 (DNP3) to IEC 61850 is ongoing [55].
• Multiple information models exist for smart grids, including the Common Information Model IEC 61970, IEC 61968, IEC 62325, and the IEC 61850 data models. Harmonizing these data models is necessary for information exchange among components in PEV-smart grid networks [56] .
• Two major vehicle-grid communications standards exist: SAE J2847/1/2 and ISO15118; however, the standards do not map
• Although the long-term solution may be to harmonize interface standards across industries and standards definition organizations, a near-term solution is to develop hardware and software to bridge the misalignment.
• Implement adapters and protocol translators to integrate new standardized devices with legacy systems and proprietary networks.
• Develop open-source software packages for VGI to facilitate product development. OpenV2G [57] provides a reference implementation of communications messages for ISO 15118. Additional open-source software
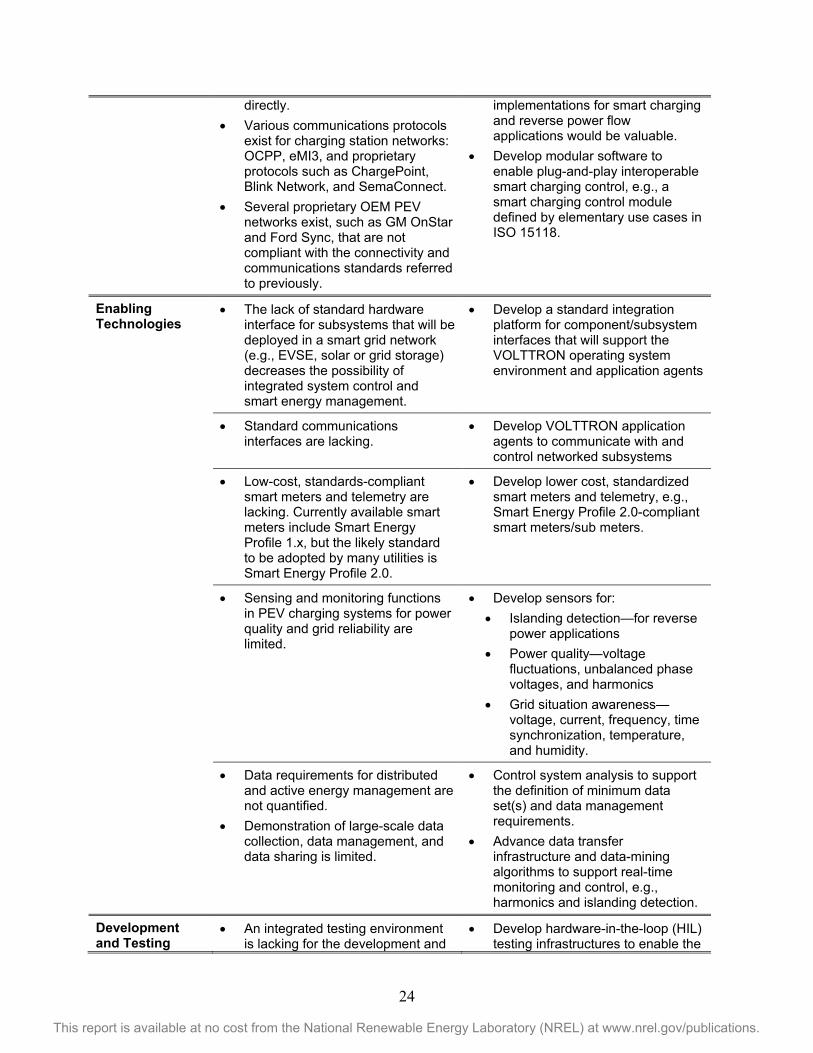
24
This report is available at no cost from the National Renewable Energy Laboratory (NREL) at www.nrel.gov/publications.
directly. • Various communications protocols
exist for charging station networks: OCPP, eMI3, and proprietary protocols such as ChargePoint, Blink Network, and SemaConnect.
• Several proprietary OEM PEV networks exist, such as GM OnStar and Ford Sync, that are not compliant with the connectivity and communications standards referred to previously.
implementations for smart charging and reverse power flow applications would be valuable.
• Develop modular software to enable plug-and-play interoperable smart charging control, e.g., a smart charging control module defined by elementary use cases in ISO 15118.
Enabling Technologies
• The lack of standard hardware interface for subsystems that will be deployed in a smart grid network (e.g., EVSE, solar or grid storage) decreases the possibility of integrated system control and smart energy management.
• Develop a standard integration platform for component/subsystem interfaces that will support the VOLTTRON operating system environment and application agents
• Standard communications interfaces are lacking.
• Develop VOLTTRON application agents to communicate with and control networked subsystems
• Low-cost, standards-compliant smart meters and telemetry are lacking. Currently available smart meters include Smart Energy Profile 1.x, but the likely standard to be adopted by many utilities is Smart Energy Profile 2.0.
• Develop lower cost, standardized smart meters and telemetry, e.g., Smart Energy Profile 2.0-compliant smart meters/sub meters.
• Sensing and monitoring functions in PEV charging systems for power quality and grid reliability are limited.
• Develop sensors for: • Islanding detection—for reverse
power applications • Power quality—voltage
fluctuations, unbalanced phase voltages, and harmonics
• Grid situation awareness—voltage, current, frequency, time synchronization, temperature, and humidity.
• Data requirements for distributed and active energy management are not quantified.
• Demonstration of large-scale data collection, data management, and data sharing is limited.
• Control system analysis to support the definition of minimum data set(s) and data management requirements.
• Advance data transfer infrastructure and data-mining algorithms to support real-time monitoring and control, e.g., harmonics and islanding detection.
Development and Testing
• An integrated testing environment is lacking for the development and
• Develop hardware-in-the-loop (HIL) testing infrastructures to enable the
25
This report is available at no cost from the National Renewable Energy Laboratory (NREL) at www.nrel.gov/publications.
Infrastructure evaluation of subsystem interfaces and control for active grid management strategies.
• Test tools to verify compliance with connectivity and communications standards are lacking.
rapid prototyping, evaluation, and optimization of components, embedded controls, and control algorithms (Figure 43).
• Define compliance test procedures, and develop tools for verification.
Demonstrations to Quantify the Cost and Benefit of PEV to Grid Integration
• Standardized demonstrations are lacking for smart charging control and assessments of the costs/benefits of PEV-supported grid services, such as voltage control and frequency regulation, in smart grid settings that have variable renewable power sources.
• Develop an integrated PEV-grid system using standard control interfaces (e.g., smart bidirectional power control), agent-based distributed and active network management, real-time energy management, online monitoring for grid quality and reliability, and interfaces with utilities (e.g., Open Automated Demand Response) and customers for demand response services.
The following list summarizes recommended research and development to enable VGI.
• Adopt reference architecture and systems.
o Adopt or define uniform reference architecture and the scope of analytical and hardware studies.
o Define the systems of interest, including subsystems, mechanizations, features, and functions.
• Implement control paradigms for active management of distributed generation, storage, and mobile PEVs.
o Define reference use cases, scenarios, and requirements for the communications and control of PEV-grid networks.
o Utilize the VOLTTRON platform to develop a common control agent-based approach to network communications and the integrated control of subsystems.
• Establish connectivity and communications standards.
o Develop hardware and software to resolve the differences in communications standards among the interfaces and enable integration with legacy systems, and develop physical adaptors/protocol translators using a standard integration platform and open-source software.
• Enable technologies.
o Develop a standard integration platform for component/subsystem interfaces.
o Develop VOLTTRON application agents to communicate with and control subsystems.
o Develop low-cost, standards-compliant smart meters.

26
This report is available at no cost from the National Renewable Energy Laboratory (NREL) at www.nrel.gov/publications.
o Develop sensors for islanding detection, power quality, and grid situation awareness.
o Utilize, adapt, or develop advanced data transfer and management infrastructures.
• Develop and test infrastructure.
o Develop HIL testing infrastructures with the capability to share information among laboratory systems.
o Test procedures and tools to verify compliance with connectivity/communications standards.
• Demonstrate and quantify the cost and benefit of VGI.
27
This report is available at no cost from the National Renewable Energy Laboratory (NREL) at www.nrel.gov/publications.
4 Grid-Integration Demonstration Efforts 4.1 Fort Carson V2G Microgrid Integration The Fort Carson V2G demonstration project is a subset of the Smart Power Infrastructure Demonstration for Energy Reliability and Security—Phase Two (SPIDERS-II) project. The larger SPIDERS project at Fort Carson is focused on providing electric power surety through the development of a semiautonomous microgrid. The V2G portion of the project is a demonstration of how PEVs can support the microgrid by providing a source of energy storage. The objectives of the demonstration are to (1) develop hardware and software to interface PEVs to an electric microgrid and aggregated control system, (2) control the bidirectional inverter(s) with connected PEVs to provide peak power shaving while the microgrid is in grid-tied mode, and (3) to similarly control the PEVs to provide frequency regulation [58]. The National Renewable Energy Lab has actively participated in the SPIDERS design effort in a role to support the formulation of requirements documents and standards, and it has used a functional test bed to guide system implementation.
Fort Carson’s microgrid is composed of a 1.1-MW critical load and 1-MW priority load, 3.15 MVA of diesel generation, 1 MW of photovoltaic generation, and the addition of six on-site PEVs with five associated EVSEs bidirectional inverters capable of four-quadrant operation. The PEVs include five Smith Electric vehicles and one Boulder Electric vehicle. The EVSEs, constructed by Coritech, utilize SAE J1772 standard combo connectors that allow for a direct current (DC) power connection to each PEV’s battery and communicate using the power line carrier physical layer on the control pilot line. This approach follows the SAE J2931/4 intent to use the control pilot line for power line carrier communications, but it does not utilize the newly defined HomePlug Green physical layer. The controller area network protocol is used for communications over the power line carrier with an Arduino Uno on both ends to encode and decode the messages. The EVSE communicates the status of the PEV and the inverter via Modbus over transmission control protocol/Internet protocol to a server that acts as the microgrid controller. Each EVSE contains an inverter capable of providing up to 60 kW of bidirectional capability with a controllable power factor of 0.9 leading to 0.8 lagging. The total system capability of the five vehicles connected is 300 kW, with 264 kWh of usable energy based on an imposed limitation of 60% of the total battery energy. The usable energy to the grid for a vehicle is based on battery management system constraints of 80% of the total energy and an additional 20% reserve for vehicle operation.
The development of the Coritech EVSE specifically for this project presented an unknown risk to the microgrid given the unfamiliar application of a bidirectional inverter capability. To mitigate this risk, the National Renewable Energy Laboratory performed conformance-type testing to verify the capability of the EVSE to comply with IEEE 1547 by utilizing methods developed as part of IEEE 1547.1 [59]. The timing for this testing did not allow for the communications capability of the EVSE to be tested, and the fact that the EVSE would be connected using an isolation transformer negated the need for DC injection requirements to be tested. However, this testing identified conformance in nearly all areas except for single phase undervoltage conditions. This information was reported to both Coritech and the SPIDERS team. Although no solution was found, the decision was made to proceed with the device integration with the known risks to the microgrid identified.

28
This report is available at no cost from the National Renewable Energy Laboratory (NREL) at www.nrel.gov/publications.
The peak power shaving control is achieved by an heuristic algorithm developed by MIT Lincoln Laboratory. This algorithm makes peak selection decisions based on real-time information of the microgrid and connected PEVs with prior optimized decision parameters to output a commanded charge or discharge power to the connected vehicle(s). This can be thought of as a centralized control in which the aggregated controller will utilize any connected vehicle for as long as the vehicle reports available energy and power capability of the battery (based on state of charge and temperature). Several criteria are used to determine when to shave a peak; however, generally the algorithm considers the ramp rate of power use, a historic minimum power below which shaving is not necessary, and the time of day and day of week. The optimized decision parameters are based on seasonal information for the location, previous power demand records for the location, and the size of the vehicle fleet.
Demonstration of this control was performed in March 2014 with the use of two vehicles under a continuous connection for a three-week experiment. The system was capable of shaving 43 kW off the measured demand, which at the Colorado peak demand charge rate of $20/kW would be worth $860 in reduced expenses for the month. This event captured 45% of the total connected power capability of two vehicles, which implies some robustness to this result for a case in which the vehicles are not stationary. The energy use of the batteries during the three-week period resulted in approximately half of the total usable energy. This amount of energy would not be expected to add a burdensome amount of cycle life to the battery.
Frequency regulation control was demonstrated at the facility by using a recorded regulation signal, which would be expected to come from the utility. The signal included in this experiment was recorded from PJM during a 24-hour period. The demand signal was sent to the microgrid controller with a 4-second sampling rate, and a command response was delivered to the EVSEs at a 15-second sample rate. Testing data suggests that the inverters are capable of following rapidly changing power commands. Further work would likely be needed to eliminate the discrepancy in control command timings to successfully participate in market operations. The test utilized two Smith Electric vehicles that were connected for the entire duration of the test. These vehicles each have a 60-kW inverter and an 80-kWh battery capacity; however, only 47.5 kW and 70 kWh per vehicle were allowed to be used for regulation control.
The test demonstrated the potential of the system to follow a frequency regulation signal and therefore the feasibility to use the PEVs to provide frequency regulation; however, the lag in the system will need to be improved to provide a 4-second response time to ensure an acceptable dynamic response to improve the performance score of this resource. The technology maturity of the software and hardware in the EVSEs and the control system of the vehicles limited the opportunity for extended testing; however, 30 minutes of testing in regulation market operation mode was successfully completed. The energy use of the batteries for this activity was even smaller than that of peak shaving, resulting in battery cycling of less than 10% of the usable energy. If it is assumed that this regulation could occur for 16 hours a day (excluding 8 hours of vehicle use), then at a rate of $20/MWh of support, 95 kW would result in 45.6 MWh per month or $912 in reduced expenses for the month.
In addition to peak shaving and frequency support of the system in grid-tied mode, the EVSEs have the ability to supply reactive power. The export of up to 363 kVAR from the EVSEs was shown in the technical demonstration of the microgrid in September 2013. This reactive power

29
This report is available at no cost from the National Renewable Energy Laboratory (NREL) at www.nrel.gov/publications.
when the system is operating in grid-tied mode would make it possible to save approximately $1,800 a month in penalties from a utility. When the Fort Carson system is operating as a microgrid, this capability would be available to provide reactive power in a situation when high photovoltaic power is available and providing only real power and there is a desire to reduce the reactive support that would otherwise be provided by the diesel generators. Automated control of such possibilities has not been demonstrated in this system, because it was not included in the scope of the project.
4.2 Los Angeles Air Force Base and U.S. Army Reserve 63rd Regional Support Command
Lawrence Berkeley National Laboratory has two ongoing VGI demonstrations that are designed to provide different grid services to the wholesale market in California using managed vehicle fleets. These two demonstrations take place at the Los Angeles Air Force Base (LA AFB) and at the U.S. Army Reserve 63rd Regional Support Command in Mountain View, California, and are described below.
4.2.1 PEV Pilot at the Los Angeles Air Force Base Electrification of non-tactical vehicle fleets represents a key efficiency and energy security objective for the U.S. Department of Defense. To achieve electrification, the U.S. Department of Defense has targeted vehicle-to-grid (V2G) services as a way to decrease the overall cost of operating the vehicle fleet and achieve rough parity with traditional internal combustion vehicle fleets. Among other planned demonstrations, a mixed-purpose and mixed-duty 40-vehicle 100% PEV pilot test fleet will be deployed at the LA AFB. Currently, 13 Nissan LEAFs, 4 Ford C-Max Energis, and 2 Chevrolet Volts are currently deployed at the base. The remaining 13 passenger and cargo vans, 5 medium-duty trucks, 4 heavy-duty trucks, and a bus are in various stages of production, testing, and delivery. Full fleet deployment is expected by July 2015, but market participation may begin sooner when a 500-kW minimum is met. The LA AFB fleet will provide a V2G service, frequency regulation, to the CAISO wholesale electricity market to recoup some of the additional costs of procuring PEVs and their supporting infrastructure.
Lawrence Berkeley National Laboratory, with its partners Honeywell, Inc., and Kisensum, LLC, have developed the fleet scheduling, optimization, and control software to enable the vehicle fleet at LA AFB to participate in CAISO’s ancillary service markets. This project is the first of its kind in attempting to provide financially binding market participation with bidirectional charging and discharging of an operational vehicle fleet to provide the most technologically demanding service that is procured in wholesale electricity markets. The final project goal is to analyze the potential to use these PEVs to support critical infrastructure on the base in the event of an emergency. The project is funded jointly between the California Energy Commission and the U.S. Department of Defense’s Environmental Security Technology Certification Program.
The vehicle fleet and charging infrastructure, largely procured by the U.S. Department of Defense, consists of sedans, vans, pickup trucks, box trucks, and a bus. The vehicles are a mix of PEVs and pure battery EVs capable of charging and discharging via both alternating current (AC) Level 2 and DC fast-charging interfaces. The charging infrastructure is a mix of AC and DC charging in which the AC Level 2 charging is limited to 15 kW and DC fast charging is between 15 kW and 50 kW.

30
This report is available at no cost from the National Renewable Energy Laboratory (NREL) at www.nrel.gov/publications.
The technical approach to fleet participation in regulation markets includes gathering the travel requirements of the fleet through a fleet operations management system, developing schedules for jointly optimal PEV charging and regulation bid capacities, communicating those bids and the resulting awards and dispatches to/from CAISO using open standard communications, and disaggregating electricity dispatches in real time to command individual vehicles to charge or discharge through an optimal hierarchical control framework. These systems are described below.
• Kisensum’s fleet operations management system, known as the On-Base Electric Vehicle Infrastructure, allows base personnel to reserve and check out PEVs for mobility tasks. This system collects information about planned trip departure and return times, vehicle preferences, expected distance traveled, etc. It stores this along with actual trip information upon the vehicle’s return to provide the system with an expectation of vehicle energy needs and times when the vehicles may be available to participate in grid services.
• Optimization capability based on Lawrence Berkeley National Laboratory’s Distributed Energy Resources Customer Adoption Model has been extended to deliver optimal scheduling for the fleet. The model is a mixed-integer linear programming optimization that minimizes the cost of vehicle operations subject to the physical, travel, and market constraints inherent to the system and the CAISO context. The cost of vehicle operations includes both the cost of vehicle charging under the LA AFB’s retail tariff and the potential revenue that could be generated through regulation market participation. The optimal schedules will be passed back to On-Base Electric Vehicle Infrastructure to be bid through the scheduling coordinator’s (Southern California Edison) mechanism into CAISO markets. These schedules are also used by the On-Base Electric Vehicle Infrastructure’s implementation of the optimal control algorithms developed for the disaggregation of dispatch signals. Additionally, the Distributed Energy Resources Customer Adoption Model will collect other necessary input data for optimal scheduling of resources, such as weather forecasts and historical market prices.
• Communications in the demonstration utilize open standards when possible. Dispatch and resource telemetry are sent to a demand response automation server via the Open Automated Demand Response 2.0b smart grid data format standard. From the demand response automation server, information is transferred to CAISO and the scheduling coordinator via the Inter Control Center Protocol, an industry standard for electricity network communications. Communications between the On-Base Electric Vehicle Infrastructure and PEV charging infrastructure utilize two standard data formats: Open Charge Point Protocol and Smart Energy Profile 2.0.
• Last, the real-time charging control algorithm disaggregates CAISO dispatch signals into individual charging and discharging commands for the PEVs plugged in at the base. This algorithm attempts to minimize the norm of the deviation from vehicular optimal energy schedules predetermined by the Distributed Energy Resources Customer Adoption Model as uncertain frequency regulation dispatches are received at 4-second intervals by CAISO.
A system such as that demonstrated at LA AFB can provide a number of economic and environmental benefits. The overall security and environmental benefits of reducing fossil-fueled
31
This report is available at no cost from the National Renewable Energy Laboratory (NREL) at www.nrel.gov/publications.
non-tactical military vehicle fleets are clear; however, wisely managing PEV fleets can minimize costs and create non-transportation benefits. Vehicle charging can be costly if not scheduled well relative to the prevailing utility tariff and other constraints, whereas the fast-responding energy storage capability of vehicle batteries can provide valuable services to help satisfy building and local base energy requirements. Further, although vehicles individually are not large electricity loads or sources, when they are aggregated or integrated with the buildings at which they are interconnected, they can become a controlled entity able to ameliorate the adverse effects of variability in renewable resources and loads and provide demand response and ancillary service to the local utility and the wider power system around it. These power system services can provide additional revenue to offset the costs of PEV ownership.
4.2.2 Optimized PEV Fleet Management and Grid Transaction at the U.S. Army 63rd Regional Support Command
The U.S. Army 63rd Regional Support Command demonstration project aims to use a VGI architecture similar to that at the LA AFB pilot to provide a different set of services utilizing solely unidirectional charging-based grid interactions. This project will combine traditional demand response with PEV smart charging to provide an integrated demand side management resource to the CAISO energy market through its proxy demand resource model. This is the U.S. Army’s 63rd Regional Support Command (“Moffett”) project, and not a “feature” of the LA AFB project. For the Moffett project, we are targeting the fourth quarter of 2015 for market participation. The fleet used at the U.S. Army 63rd Regional Support Command will be smaller, approximately 15 passenger vehicles. The proxy demand response will be coordinated between both the PEV fleet and some building demand response load-shedding strategies. This approach allows for greatly simplified metering and enables a reduced cost of enabling market participation. The demonstration will utilize the On-Base Electric Vehicle Infrastructure software platform developed for the LA AFB project. This project rounds out the demonstration of wholesale market integrated services that can be provided by PEVs and allows for an estimation of the potential revenues and risks that PEVs may see from vehicle-grid interactions.
4.3 OEM Central Server OEM Central Server is a collaboration among 8 automotive OEMs, 16 utilities, a major information technology developer, and the Electric Power Research Institute to develop a standards-based, scalable communications platform that facilitates VGI. This project is a self-funded effort that will help unlock benefits for all stakeholders—customers, utilities, OEMs, infrastructure providers, etc.
The OEM Central Server is a server-based application that enables utilities to manage charging for the entire installed base of PEVs as controllable loads. The application uses a set of open, interoperable standards-based interfaces—either via aggregated, indirect demand response programs using Open Automated Demand Response profile 2.0b or via direct-to-customer pricing and demand response signals delivered through AMI or public internet-connected Home Area Networks using Smart Energy Profile 2.0 connectivity. This server-based application also allows the demand response signals to be routed through OEM servers such as telematics servers to reach the vehicle. Chrysler, Mercedes, and Toyota are evaluating the direct telematics path (business to consumer), whereas BMW, GM, Ford, Honda, and Toyota are evaluating the Internet (business-to-business) path.
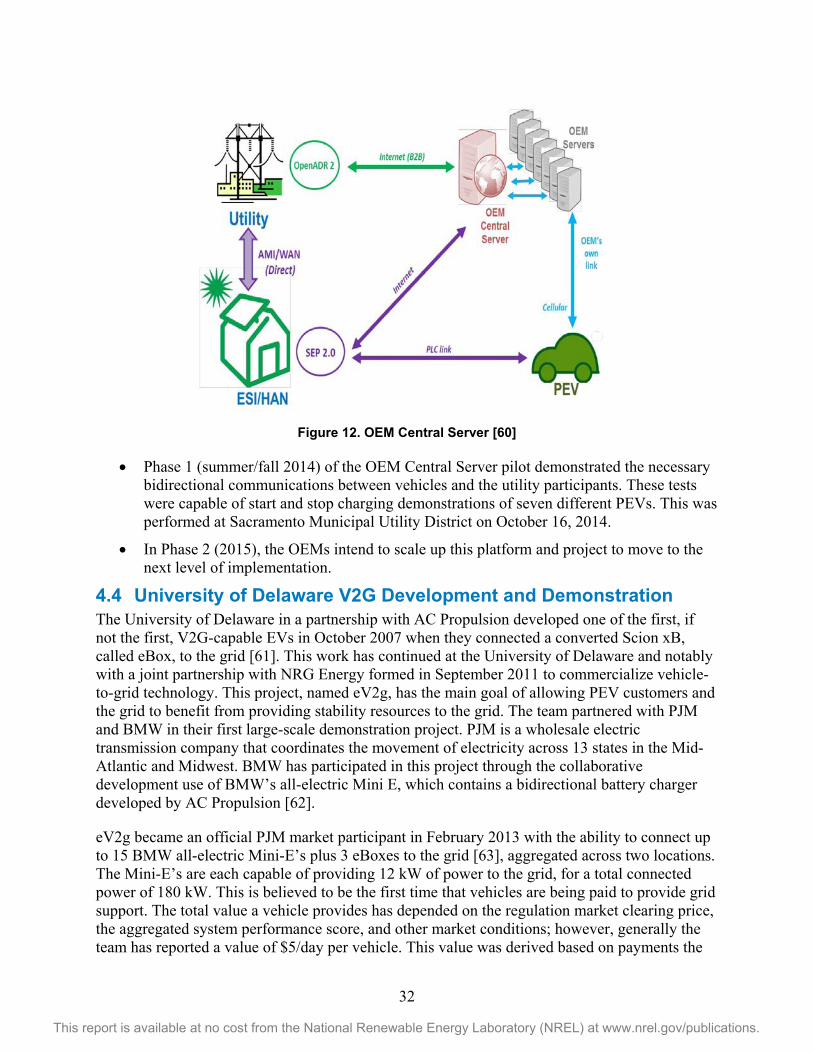
32
This report is available at no cost from the National Renewable Energy Laboratory (NREL) at www.nrel.gov/publications.
Figure 12. OEM Central Server [60]
• Phase 1 (summer/fall 2014) of the OEM Central Server pilot demonstrated the necessary bidirectional communications between vehicles and the utility participants. These tests were capable of start and stop charging demonstrations of seven different PEVs. This was performed at Sacramento Municipal Utility District on October 16, 2014.
• In Phase 2 (2015), the OEMs intend to scale up this platform and project to move to the next level of implementation.
4.4 University of Delaware V2G Development and Demonstration The University of Delaware in a partnership with AC Propulsion developed one of the first, if not the first, V2G-capable EVs in October 2007 when they connected a converted Scion xB, called eBox, to the grid [61]. This work has continued at the University of Delaware and notably with a joint partnership with NRG Energy formed in September 2011 to commercialize vehicle-to-grid technology. This project, named eV2g, has the main goal of allowing PEV customers and the grid to benefit from providing stability resources to the grid. The team partnered with PJM and BMW in their first large-scale demonstration project. PJM is a wholesale electric transmission company that coordinates the movement of electricity across 13 states in the Mid-Atlantic and Midwest. BMW has participated in this project through the collaborative development use of BMW’s all-electric Mini E, which contains a bidirectional battery charger developed by AC Propulsion [62].
eV2g became an official PJM market participant in February 2013 with the ability to connect up to 15 BMW all-electric Mini-E’s plus 3 eBoxes to the grid [63], aggregated across two locations. The Mini-E’s are each capable of providing 12 kW of power to the grid, for a total connected power of 180 kW. This is believed to be the first time that vehicles are being paid to provide grid support. The total value a vehicle provides has depended on the regulation market clearing price, the aggregated system performance score, and other market conditions; however, generally the team has reported a value of $5/day per vehicle. This value was derived based on payments the
33
This report is available at no cost from the National Renewable Energy Laboratory (NREL) at www.nrel.gov/publications.
University of Delaware team received for their market participation during periods of operation in 2013 and 2014. The performance score was calculated by PJM based on their interpretation of Federal Energy Regulatory Commission Order 755, in which regulation service providers must be compensated based on the accuracy of how close the power produced follows the regulation signal.
The vehicles contain a vehicle smart link, which is software implemented on an automotive-grade Linux machine, combined with a custom communications board, that communicates with the vehicle control systems to determine battery status and trip predictions. The vehicle smart link communicates to the aggregator using the control pilot line on the SAE J1772 connector to the EVSE. The communications physical layer is a single-wire controller area network communications known as CAN-CP because of its implementation on the control pilot line as specified in the third edition of IEC 61851-1 in Annex D. This specification allows for the use of encapsulated Internet protocol in which point-to-point protocol packets can be sent via the controller area network physical layer. The EVSE utilizes this capability to carry standard Internet protocol packets from the vehicle smart link to the local network where the data is routed through the Internet to where the aggregator resides. This method provides for direct encrypted communications from the vehicle to aggregator. Similarly, the EVSE has its own direct communications link to the aggregator and can be used to send telematics information. [64]
This system is designed so that when the vehicles are parked the rate of charging or discharging for each vehicle is determined by a decentralized process. In this process, the vehicle smart link on each vehicle provides an aggregator with a charging plan for a defined time horizon and how much the vehicle can deviate (up or down) from that plan. The aggregator uses this information to calculate the capacity of the connected vehicles (energy with driver constraints and power with connection constraints) and bid services to PJM accordingly. The PJM response is then used by the aggregator in real time to command specific power deviation requests of each vehicle to meet the regulation signal. The vehicle smart link receives the power command from the aggregator and adjusts the onboard bidirectional charger to meet the request. The vehicle smart link is capable of determining the charging plan and allowable deviation through the use of data that the vehicle driver has provided to predict the next trip in order to determine how much range will be required and the departure time. This system design allows for two different agents, the aggregator and vehicle smart link, to prioritize their objectives, which at times may differ, in such a way to satisfy both the driver’s vehicle requirements and the regulation market [65].
Reverse power flow or providing energy back to the grid requires permission from the utility for the right to interconnect to their distribution network. Approval is usually provided through a utility interconnect application. This application process provides assurance to the utility that the connection will not destabilize the grid and is safe. The technical performance requirements are defined in IEEE 1547, and compliance is ensured through recognized certification laboratories that will list the grid-connection inverters under UL 1741. This UL standard has been written for stationary devices such as solar inverters and does not allow vehicle bidirectional battery-charging inverters to be certified. Currently, there is ongoing effort within SAE to provide a similar conformance mechanism through the development of SAE J3072; however, in this demonstration authority was granted to interconnect based on IEEE 1547 tests that occurred at the National Renewable Energy Laboratory in 2008. These tests focused specifically on the
34
This report is available at no cost from the National Renewable Energy Laboratory (NREL) at www.nrel.gov/publications.
response to abnormal voltage and frequency, unintentional islanding, harmonics, and DC injection. A complete review of the test methods can be found in [66]. Note that these tests were completed on the eBox vehicle, but both the eBox and the Mini-E are based on similar AC Propulsion bidirectional chargers. Similar testing on the Mini-E is planned at National Renewable Energy Laboratory in 2015 to expand upon the IEEE 1547 tests.
Project participation with the ancillary services market is a significant achievement in this demonstration and is necessary to receive payment for the supplied grid services. This has been accomplished in part because of a broader stakeholder process PJM has pursued to accommodate “behind-the-meter” resources. Specifically this process has resulted in the changes listed below [67].
1. The rules allow for non-utility company or non-distribution company meters to be placed behind the distribution company meters for the specific use of providing telemetry in demand response applications.
2. Rule changes allow for the aggregation of demand response resources that have enabled the application of fleet or multiple unit dispatch.
3. Participation in the demand response market is now possible for end-use customers that can provide only 100 kW of capacity.
These changes, although implemented for other distributed resources, have also allowed for the Mini-E vehicles to be aggregated into a single source that is capable of participating in the market. The ability to participate at the 100-kW level has allowed for smaller resources—in this case, operation is possible when only nine vehicles are available. The use of a certified, non-utility meter data allows connection without requiring an additional metered account. The changes in metering and location aggregation are significant in their potential to allow for an aggregator to combine the resources of vehicles across many parking locations in a distribution company region. Note that these rules apply only within the PJM interconnection area and that similar changes may be necessary in other regions to replicate this activity.
4.5 Electrified Roadway Analysis of Interaction with Renewables The electrified roadway concept offers potential benefits to expand the practical operating range and, by alleviating range anxiety, improve the overall adoption and utility of pure battery, plug-in hybrid, and hybrid electric vehicles. The notion of roadway electrification implicitly suggests a mode of power transfer through inductive (wireless or field-based) or conductive (e.g., catenary) energy transfer used in either a static (at rest) or dynamic (in motion) charging scheme. Oak Ridge National Laboratory recently presented a survey summary of internal research and development efforts aligned with wireless power transfer (WPT) for EV charging [68]. Valuable data has been collected to support the development of standards and to support component development. Infrastructure requirements and roadway electrification are also being studied at Oak Ridge National Laboratory to provide initial cost estimates and provide data to support EV adoption impact projections as well as infrastructure preparedness. The infrastructure for an electrified roadway or for static wireless charging requires a system of power electronics off board the vehicle to convert the AC grid power to the necessary AC transmission frequency or DC supply characteristic. In a long-term scenario, these inverters and electronics would be
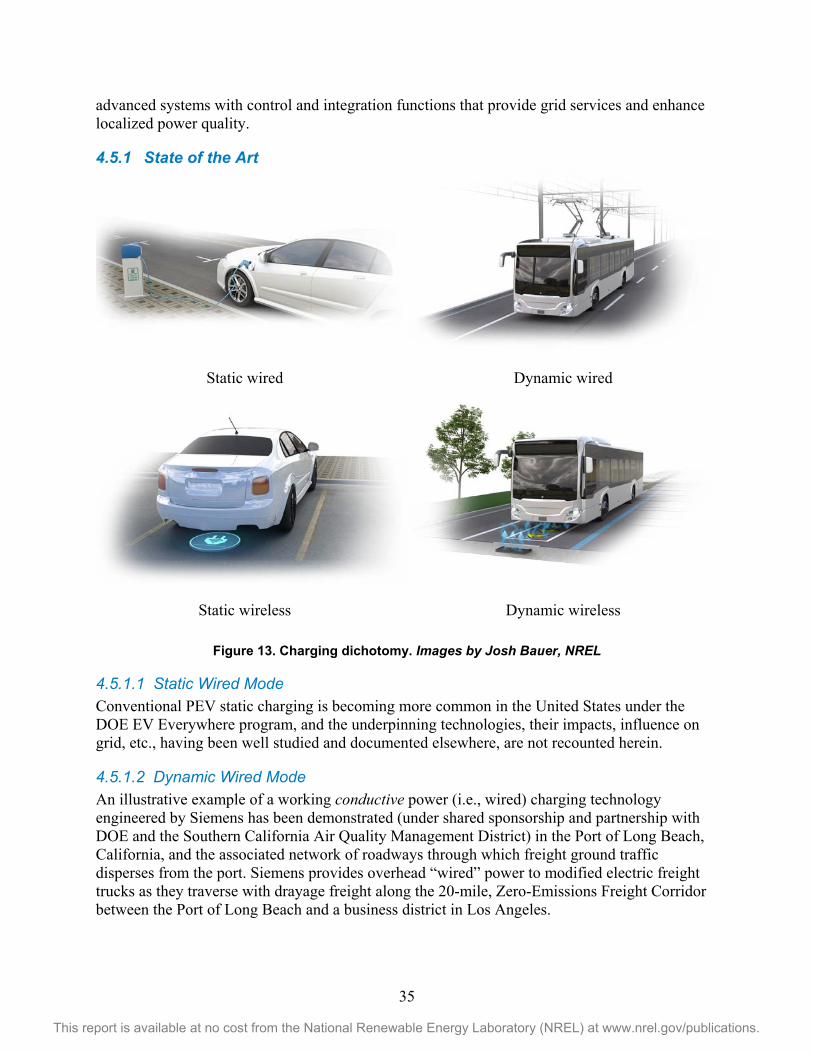
35
This report is available at no cost from the National Renewable Energy Laboratory (NREL) at www.nrel.gov/publications.
advanced systems with control and integration functions that provide grid services and enhance localized power quality.
4.5.1 State of the Art
Static wired Dynamic wired
Static wireless Dynamic wireless
Figure 13. Charging dichotomy. Images by Josh Bauer, NREL
4.5.1.1 Static Wired Mode Conventional PEV static charging is becoming more common in the United States under the DOE EV Everywhere program, and the underpinning technologies, their impacts, influence on grid, etc., having been well studied and documented elsewhere, are not recounted herein.
4.5.1.2 Dynamic Wired Mode An illustrative example of a working conductive power (i.e., wired) charging technology engineered by Siemens has been demonstrated (under shared sponsorship and partnership with DOE and the Southern California Air Quality Management District) in the Port of Long Beach, California, and the associated network of roadways through which freight ground traffic disperses from the port. Siemens provides overhead “wired” power to modified electric freight trucks as they traverse with drayage freight along the 20-mile, Zero-Emissions Freight Corridor between the Port of Long Beach and a business district in Los Angeles.
36
This report is available at no cost from the National Renewable Energy Laboratory (NREL) at www.nrel.gov/publications.
Siemens’ eHighway concept for the electrification of road-freight traffic has three core components:
1. Diesel-electric hybrid technology
2. Power supply via catenary lines and regenerative braking
3. Intelligently controllable pantograph for energy transmission.
The catenary systems are designed as two-pole systems for two-way (bidirectional) electricity transmission (infeed and out feed). The overhead wire is fed from a container substation. The substation used at Siemens’ testing site is equipped with a
• Medium-voltage DC switching system
• Power transformer
• Rectifier 12-diode array
• Controlled inverter (to feed back the electric energy generated by the vehicles’ regenerative braking).
An intelligent pantograph is used for the direct contact transmission of electric power from the overhead wire to the eHighway heavy-duty truck. The actively-controllable pantograph can be easily connected to, and disconnected from, the overhead line at speeds of up to 90 km/h (56 mph). Depending on the operating mode, the connection is made either automatically or manually at the push of a button. The pantograph automatically compensates for any shifts in position within the lane. Moreover, the mobility of the pantograph minimizes the risk of selective wear on the current collector, substantially extending its useful life. The smart current collectors permit overtaking maneuvers and automatic hookup and disconnection. On normal roads without overhead lines, the vehicles make use of a hybrid system that can be operated alternatively with diesel, compressed natural gas, or via a battery [69], [70].
The California-based demonstration is located on a 2-mile (3.2-km) stretch of highway retrofitted with a catenary system for suitably designed electric and hybrid trucks. (Siemens is developing up to four demonstration vehicles with Volvo/Scania.) The objective is to completely eliminate local emissions such as nitrogen oxides, reduce the consumption of fossil fuels, and cut the operating costs of trucks. The test results should be available in the summer of 2016 and will indicate the suitability of the systems for future commercial use. The ports of Los Angeles and Long Beach are also seeking an emission-free solution (“Zero Emission I-710 Project”) for a section of Highway 710, which carries a high proportion of shuttle truck traffic. The 30-km (18.6-mile) route links the two ocean ports and the railroad transshipment centers inland. As part of the installation of the eHighway systems, two lanes of Alameda Street in the city of Carson, California, are being electrified via a catenary system.
A report on a conductive highway project analysis for application in Sweden proposed some scenarios for the grid-side infrastructure elements and for the energy demands on the grid to support vehicles of all sizes [71]. These analyses highlighted the variability in grid power demand as a function of road grade, vehicle speeds, and vehicle size. The design of such systems must account for the broad range of loading scenarios that will be significantly different from the design intent scenario. The dynamic loading of the power delivery components could lead to
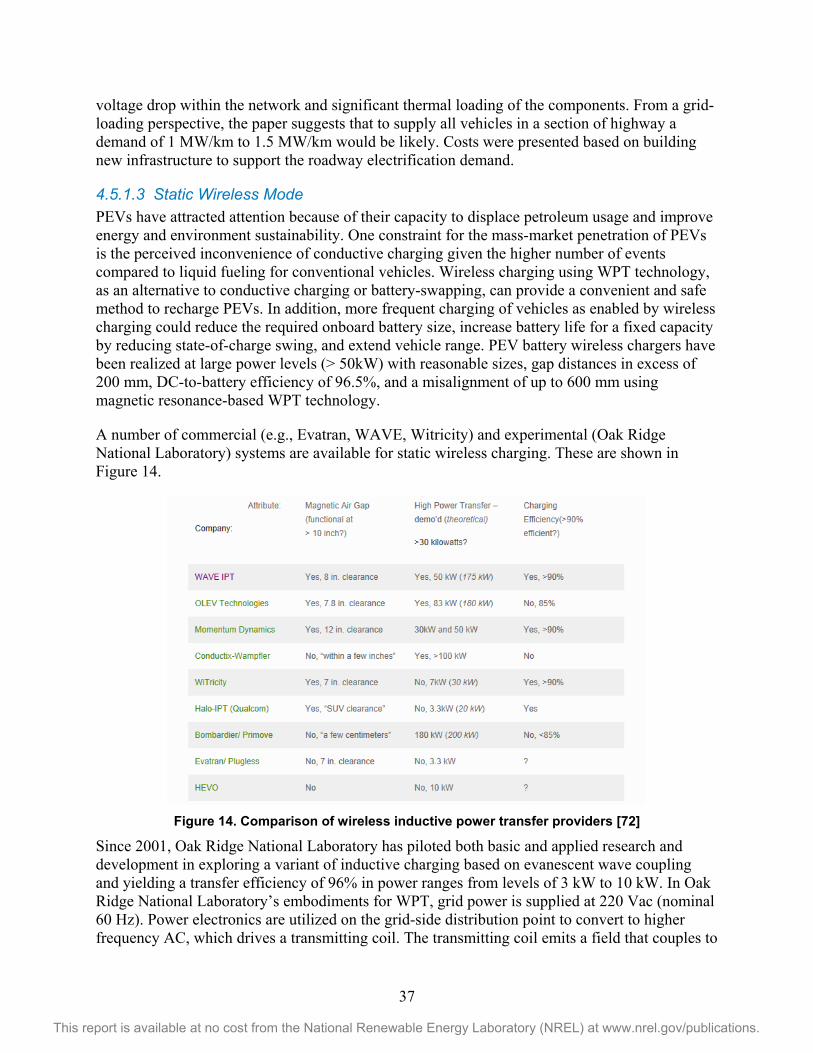
37
This report is available at no cost from the National Renewable Energy Laboratory (NREL) at www.nrel.gov/publications.
voltage drop within the network and significant thermal loading of the components. From a grid-loading perspective, the paper suggests that to supply all vehicles in a section of highway a demand of 1 MW/km to 1.5 MW/km would be likely. Costs were presented based on building new infrastructure to support the roadway electrification demand.
4.5.1.3 Static Wireless Mode PEVs have attracted attention because of their capacity to displace petroleum usage and improve energy and environment sustainability. One constraint for the mass-market penetration of PEVs is the perceived inconvenience of conductive charging given the higher number of events compared to liquid fueling for conventional vehicles. Wireless charging using WPT technology, as an alternative to conductive charging or battery-swapping, can provide a convenient and safe method to recharge PEVs. In addition, more frequent charging of vehicles as enabled by wireless charging could reduce the required onboard battery size, increase battery life for a fixed capacity by reducing state-of-charge swing, and extend vehicle range. PEV battery wireless chargers have been realized at large power levels (> 50kW) with reasonable sizes, gap distances in excess of 200 mm, DC-to-battery efficiency of 96.5%, and a misalignment of up to 600 mm using magnetic resonance-based WPT technology.
A number of commercial (e.g., Evatran, WAVE, Witricity) and experimental (Oak Ridge National Laboratory) systems are available for static wireless charging. These are shown in Figure 14.
Figure 14. Comparison of wireless inductive power transfer providers [72]
Since 2001, Oak Ridge National Laboratory has piloted both basic and applied research and development in exploring a variant of inductive charging based on evanescent wave coupling and yielding a transfer efficiency of 96% in power ranges from levels of 3 kW to 10 kW. In Oak Ridge National Laboratory’s embodiments for WPT, grid power is supplied at 220 Vac (nominal 60 Hz). Power electronics are utilized on the grid-side distribution point to convert to higher frequency AC, which drives a transmitting coil. The transmitting coil emits a field that couples to
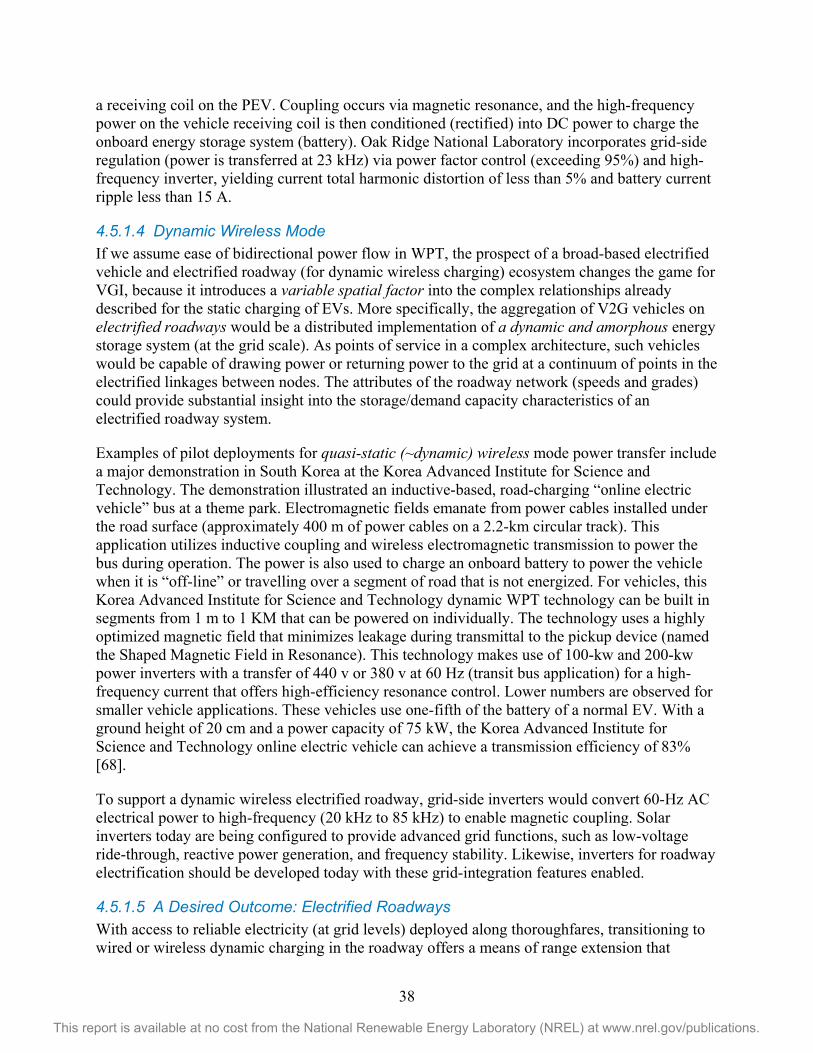
38
This report is available at no cost from the National Renewable Energy Laboratory (NREL) at www.nrel.gov/publications.
a receiving coil on the PEV. Coupling occurs via magnetic resonance, and the high-frequency power on the vehicle receiving coil is then conditioned (rectified) into DC power to charge the onboard energy storage system (battery). Oak Ridge National Laboratory incorporates grid-side regulation (power is transferred at 23 kHz) via power factor control (exceeding 95%) and high-frequency inverter, yielding current total harmonic distortion of less than 5% and battery current ripple less than 15 A.
4.5.1.4 Dynamic Wireless Mode If we assume ease of bidirectional power flow in WPT, the prospect of a broad-based electrified vehicle and electrified roadway (for dynamic wireless charging) ecosystem changes the game for VGI, because it introduces a variable spatial factor into the complex relationships already described for the static charging of EVs. More specifically, the aggregation of V2G vehicles on electrified roadways would be a distributed implementation of a dynamic and amorphous energy storage system (at the grid scale). As points of service in a complex architecture, such vehicles would be capable of drawing power or returning power to the grid at a continuum of points in the electrified linkages between nodes. The attributes of the roadway network (speeds and grades) could provide substantial insight into the storage/demand capacity characteristics of an electrified roadway system.
Examples of pilot deployments for quasi-static (~dynamic) wireless mode power transfer include a major demonstration in South Korea at the Korea Advanced Institute for Science and Technology. The demonstration illustrated an inductive-based, road-charging “online electric vehicle” bus at a theme park. Electromagnetic fields emanate from power cables installed under the road surface (approximately 400 m of power cables on a 2.2-km circular track). This application utilizes inductive coupling and wireless electromagnetic transmission to power the bus during operation. The power is also used to charge an onboard battery to power the vehicle when it is “off-line” or travelling over a segment of road that is not energized. For vehicles, this Korea Advanced Institute for Science and Technology dynamic WPT technology can be built in segments from 1 m to 1 KM that can be powered on individually. The technology uses a highly optimized magnetic field that minimizes leakage during transmittal to the pickup device (named the Shaped Magnetic Field in Resonance). This technology makes use of 100-kw and 200-kw power inverters with a transfer of 440 v or 380 v at 60 Hz (transit bus application) for a high-frequency current that offers high-efficiency resonance control. Lower numbers are observed for smaller vehicle applications. These vehicles use one-fifth of the battery of a normal EV. With a ground height of 20 cm and a power capacity of 75 kW, the Korea Advanced Institute for Science and Technology online electric vehicle can achieve a transmission efficiency of 83% [68].
To support a dynamic wireless electrified roadway, grid-side inverters would convert 60-Hz AC electrical power to high-frequency (20 kHz to 85 kHz) to enable magnetic coupling. Solar inverters today are being configured to provide advanced grid functions, such as low-voltage ride-through, reactive power generation, and frequency stability. Likewise, inverters for roadway electrification should be developed today with these grid-integration features enabled.
4.5.1.5 A Desired Outcome: Electrified Roadways With access to reliable electricity (at grid levels) deployed along thoroughfares, transitioning to wired or wireless dynamic charging in the roadway offers a means of range extension that
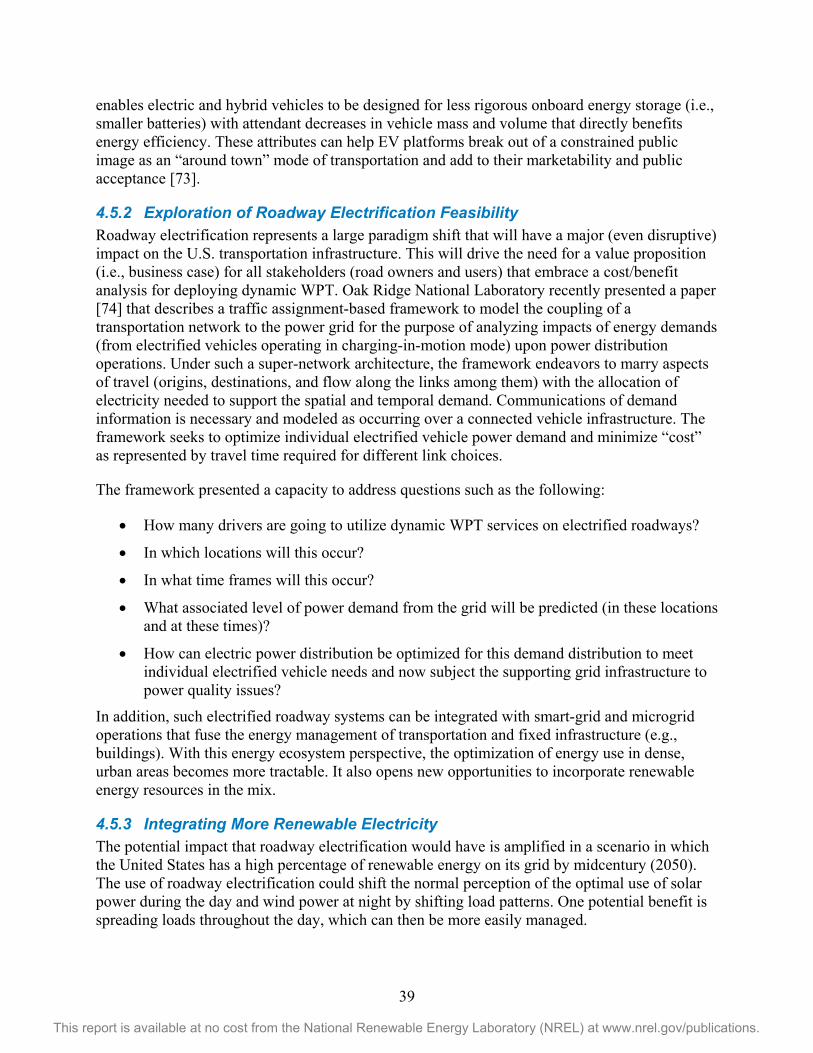
39
This report is available at no cost from the National Renewable Energy Laboratory (NREL) at www.nrel.gov/publications.
enables electric and hybrid vehicles to be designed for less rigorous onboard energy storage (i.e., smaller batteries) with attendant decreases in vehicle mass and volume that directly benefits energy efficiency. These attributes can help EV platforms break out of a constrained public image as an “around town” mode of transportation and add to their marketability and public acceptance [73].
4.5.2 Exploration of Roadway Electrification Feasibility Roadway electrification represents a large paradigm shift that will have a major (even disruptive) impact on the U.S. transportation infrastructure. This will drive the need for a value proposition (i.e., business case) for all stakeholders (road owners and users) that embrace a cost/benefit analysis for deploying dynamic WPT. Oak Ridge National Laboratory recently presented a paper [74] that describes a traffic assignment-based framework to model the coupling of a transportation network to the power grid for the purpose of analyzing impacts of energy demands (from electrified vehicles operating in charging-in-motion mode) upon power distribution operations. Under such a super-network architecture, the framework endeavors to marry aspects of travel (origins, destinations, and flow along the links among them) with the allocation of electricity needed to support the spatial and temporal demand. Communications of demand information is necessary and modeled as occurring over a connected vehicle infrastructure. The framework seeks to optimize individual electrified vehicle power demand and minimize “cost” as represented by travel time required for different link choices.
The framework presented a capacity to address questions such as the following:
• How many drivers are going to utilize dynamic WPT services on electrified roadways?
• In which locations will this occur?
• In what time frames will this occur?
• What associated level of power demand from the grid will be predicted (in these locations and at these times)?
• How can electric power distribution be optimized for this demand distribution to meet individual electrified vehicle needs and now subject the supporting grid infrastructure to power quality issues?
In addition, such electrified roadway systems can be integrated with smart-grid and microgrid operations that fuse the energy management of transportation and fixed infrastructure (e.g., buildings). With this energy ecosystem perspective, the optimization of energy use in dense, urban areas becomes more tractable. It also opens new opportunities to incorporate renewable energy resources in the mix.
4.5.3 Integrating More Renewable Electricity The potential impact that roadway electrification would have is amplified in a scenario in which the United States has a high percentage of renewable energy on its grid by midcentury (2050). The use of roadway electrification could shift the normal perception of the optimal use of solar power during the day and wind power at night by shifting load patterns. One potential benefit is spreading loads throughout the day, which can then be more easily managed.

40
This report is available at no cost from the National Renewable Energy Laboratory (NREL) at www.nrel.gov/publications.
By nature, roadway-distributed renewable-generated electricity (wind, solar) will be DC, offering some practical benefits to transmission and reducing the complexity experienced with AC transmission equipment.
Additionally, power demand from roadway electrification could also make great use out of oversupplies of renewable energy that are often inefficiently dealt with by using curtailment. This should be accounted for when looking at the perceived resource demand associated with deploying roadway electrification. Questions to consider include the following:
• Would the large-scale availability of roadway electrification be significant enough to expand optimal deployment rates of clean vehicles by 2050?
• Would the expansion of roadway electrification infrastructure to such levels be enough to significantly reduce deployment and life-cycle costs?
• What elements of electrified vehicle transportation could renewable-powered roadway electrification help leverage for more significant deployment levels?
• Will roadway electrification synergistically drive/accelerate renewable energy production?
• What are the potential grid-level impacts of roadway electrification?
• What are the critical technology needs and barriers? (For example, given the anticipated usage pattern of WPT, are there implications for design impacts on the requirements of the energy storage systems?)
A recent study conducted by the National Renewable Energy Laboratory examined a scenario in which nearly 50% of the vehicles in Colorado could use an electrified roadway. Results were presented at the Department of Transportation Clean Transportation Systems Initiative meeting [73]. This scenario also included a high penetration level of renewables (approximately 50%). Figure 15 highlights the resulting curtailments of wind and solar generation due to the seasonal variation of renewable generation and typical loads on an hourly basis. Renewable curtailments occur during months other than summer, with solar curtailment during the day and wind following a diurnal cycle.
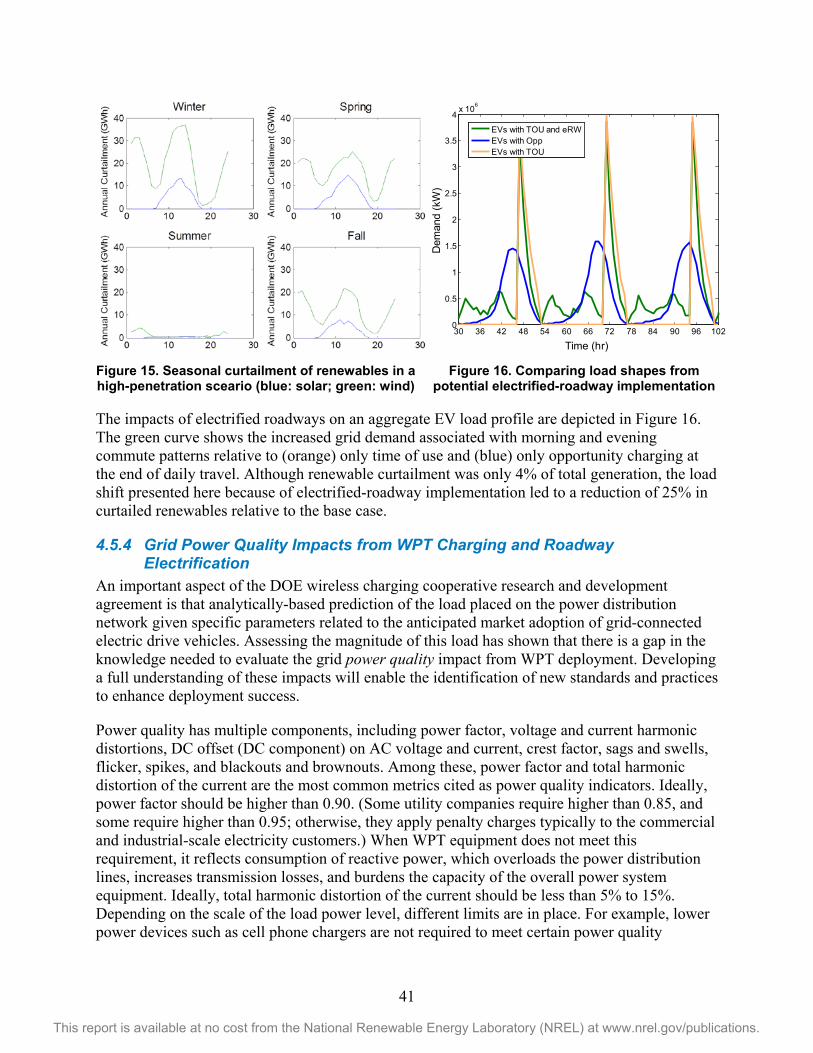
41
This report is available at no cost from the National Renewable Energy Laboratory (NREL) at www.nrel.gov/publications.
Figure 15. Seasonal curtailment of renewables in a high-penetration sceario (blue: solar; green: wind)
Figure 16. Comparing load shapes from potential electrified-roadway implementation
The impacts of electrified roadways on an aggregate EV load profile are depicted in Figure 16. The green curve shows the increased grid demand associated with morning and evening commute patterns relative to (orange) only time of use and (blue) only opportunity charging at the end of daily travel. Although renewable curtailment was only 4% of total generation, the load shift presented here because of electrified-roadway implementation led to a reduction of 25% in curtailed renewables relative to the base case.
4.5.4 Grid Power Quality Impacts from WPT Charging and Roadway Electrification
An important aspect of the DOE wireless charging cooperative research and development agreement is that analytically-based prediction of the load placed on the power distribution network given specific parameters related to the anticipated market adoption of grid-connected electric drive vehicles. Assessing the magnitude of this load has shown that there is a gap in the knowledge needed to evaluate the grid power quality impact from WPT deployment. Developing a full understanding of these impacts will enable the identification of new standards and practices to enhance deployment success.
Power quality has multiple components, including power factor, voltage and current harmonic distortions, DC offset (DC component) on AC voltage and current, crest factor, sags and swells, flicker, spikes, and blackouts and brownouts. Among these, power factor and total harmonic distortion of the current are the most common metrics cited as power quality indicators. Ideally, power factor should be higher than 0.90. (Some utility companies require higher than 0.85, and some require higher than 0.95; otherwise, they apply penalty charges typically to the commercial and industrial-scale electricity customers.) When WPT equipment does not meet this requirement, it reflects consumption of reactive power, which overloads the power distribution lines, increases transmission losses, and burdens the capacity of the overall power system equipment. Ideally, total harmonic distortion of the current should be less than 5% to 15%. Depending on the scale of the load power level, different limits are in place. For example, lower power devices such as cell phone chargers are not required to meet certain power quality
30 36 42 48 54 60 66 72 78 84 90 96 1020
0.5
1
1.5
2
2.5
3
3.5
4x 10⁶
Time (hr)
Dem
and
(kW
)
EVs with TOU and eRWEVs with OppEVs with TOU
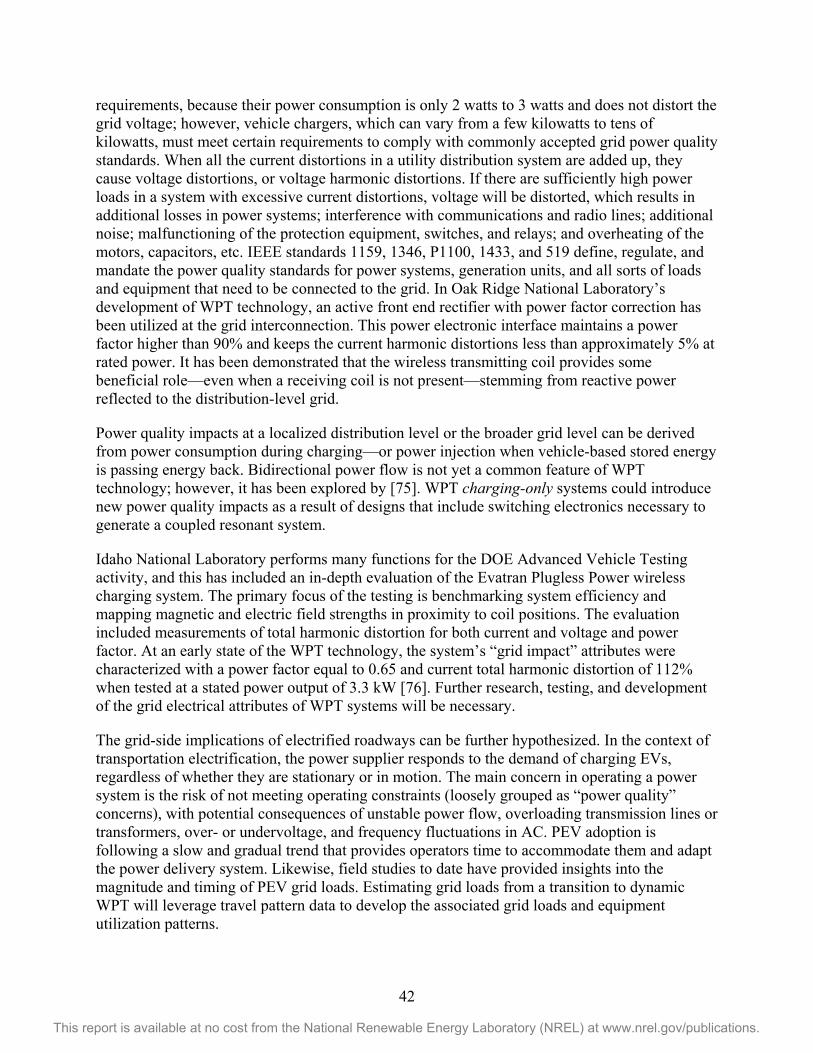
42
This report is available at no cost from the National Renewable Energy Laboratory (NREL) at www.nrel.gov/publications.
requirements, because their power consumption is only 2 watts to 3 watts and does not distort the grid voltage; however, vehicle chargers, which can vary from a few kilowatts to tens of kilowatts, must meet certain requirements to comply with commonly accepted grid power quality standards. When all the current distortions in a utility distribution system are added up, they cause voltage distortions, or voltage harmonic distortions. If there are sufficiently high power loads in a system with excessive current distortions, voltage will be distorted, which results in additional losses in power systems; interference with communications and radio lines; additional noise; malfunctioning of the protection equipment, switches, and relays; and overheating of the motors, capacitors, etc. IEEE standards 1159, 1346, P1100, 1433, and 519 define, regulate, and mandate the power quality standards for power systems, generation units, and all sorts of loads and equipment that need to be connected to the grid. In Oak Ridge National Laboratory’s development of WPT technology, an active front end rectifier with power factor correction has been utilized at the grid interconnection. This power electronic interface maintains a power factor higher than 90% and keeps the current harmonic distortions less than approximately 5% at rated power. It has been demonstrated that the wireless transmitting coil provides some beneficial role—even when a receiving coil is not present—stemming from reactive power reflected to the distribution-level grid.
Power quality impacts at a localized distribution level or the broader grid level can be derived from power consumption during charging—or power injection when vehicle-based stored energy is passing energy back. Bidirectional power flow is not yet a common feature of WPT technology; however, it has been explored by [75]. WPT charging-only systems could introduce new power quality impacts as a result of designs that include switching electronics necessary to generate a coupled resonant system.
Idaho National Laboratory performs many functions for the DOE Advanced Vehicle Testing activity, and this has included an in-depth evaluation of the Evatran Plugless Power wireless charging system. The primary focus of the testing is benchmarking system efficiency and mapping magnetic and electric field strengths in proximity to coil positions. The evaluation included measurements of total harmonic distortion for both current and voltage and power factor. At an early state of the WPT technology, the system’s “grid impact” attributes were characterized with a power factor equal to 0.65 and current total harmonic distortion of 112% when tested at a stated power output of 3.3 kW [76]. Further research, testing, and development of the grid electrical attributes of WPT systems will be necessary.
The grid-side implications of electrified roadways can be further hypothesized. In the context of transportation electrification, the power supplier responds to the demand of charging EVs, regardless of whether they are stationary or in motion. The main concern in operating a power system is the risk of not meeting operating constraints (loosely grouped as “power quality” concerns), with potential consequences of unstable power flow, overloading transmission lines or transformers, over- or undervoltage, and frequency fluctuations in AC. PEV adoption is following a slow and gradual trend that provides operators time to accommodate them and adapt the power delivery system. Likewise, field studies to date have provided insights into the magnitude and timing of PEV grid loads. Estimating grid loads from a transition to dynamic WPT will leverage travel pattern data to develop the associated grid loads and equipment utilization patterns.
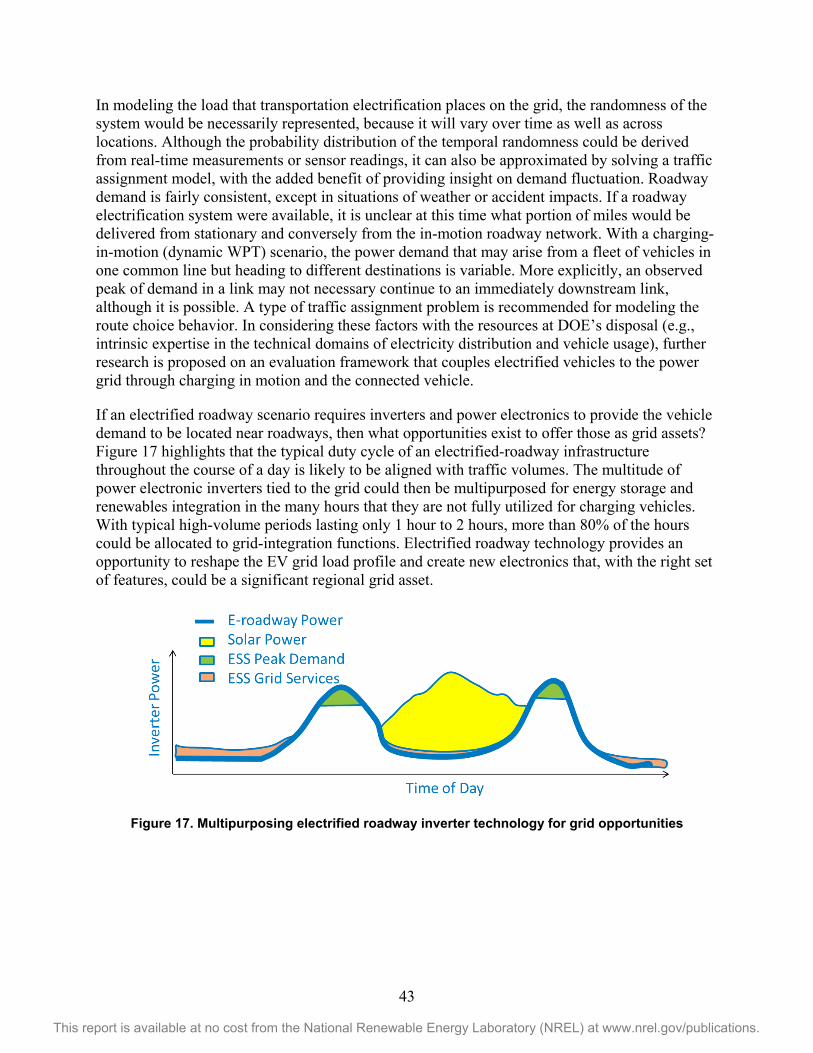
43
This report is available at no cost from the National Renewable Energy Laboratory (NREL) at www.nrel.gov/publications.
In modeling the load that transportation electrification places on the grid, the randomness of the system would be necessarily represented, because it will vary over time as well as across locations. Although the probability distribution of the temporal randomness could be derived from real-time measurements or sensor readings, it can also be approximated by solving a traffic assignment model, with the added benefit of providing insight on demand fluctuation. Roadway demand is fairly consistent, except in situations of weather or accident impacts. If a roadway electrification system were available, it is unclear at this time what portion of miles would be delivered from stationary and conversely from the in-motion roadway network. With a charging-in-motion (dynamic WPT) scenario, the power demand that may arise from a fleet of vehicles in one common line but heading to different destinations is variable. More explicitly, an observed peak of demand in a link may not necessary continue to an immediately downstream link, although it is possible. A type of traffic assignment problem is recommended for modeling the route choice behavior. In considering these factors with the resources at DOE’s disposal (e.g., intrinsic expertise in the technical domains of electricity distribution and vehicle usage), further research is proposed on an evaluation framework that couples electrified vehicles to the power grid through charging in motion and the connected vehicle.
If an electrified roadway scenario requires inverters and power electronics to provide the vehicle demand to be located near roadways, then what opportunities exist to offer those as grid assets? Figure 17 highlights that the typical duty cycle of an electrified-roadway infrastructure throughout the course of a day is likely to be aligned with traffic volumes. The multitude of power electronic inverters tied to the grid could then be multipurposed for energy storage and renewables integration in the many hours that they are not fully utilized for charging vehicles. With typical high-volume periods lasting only 1 hour to 2 hours, more than 80% of the hours could be allocated to grid-integration functions. Electrified roadway technology provides an opportunity to reshape the EV grid load profile and create new electronics that, with the right set of features, could be a significant regional grid asset.
Figure 17. Multipurposing electrified roadway inverter technology for grid opportunities
44
This report is available at no cost from the National Renewable Energy Laboratory (NREL) at www.nrel.gov/publications.
5 Magnitude and Variability of Controllable Capacity Provided by Grid-Connected PEVs
As market penetration of PEVs increases over time, the number of PEVs charging on the electric grid will also increase. As the number of PEVs increases, their ability to collectively impact the grid increases. The idea of a large body of PEVs connected to the grid presents an intriguing possibility. If an aggregator (e.g., a utility or other managing entity) could control PEV charging, it is possible that PEVs would act as a distributed resource to provide grid services. For the sake of brevity and simplicity, the aggregator is assumed to have direct control over PEV charging as a managing entity; however, it is possible that the aggregator could act in a transactive manner. The technology required to control charging is available for modern PEVs; however, a system for the widespread implementation of controllable charging, including robust communication between vehicles and utilities, is not currently present. Therefore, the value of controllable charging must be assessed and weighed against the cost of building and operating such as system.
To grasp the value of PEV charge control to the aggregator, the following must be understood:
1. The magnitude of controllable energy and power capacity available to the aggregator
2. The variability of the controllable capacity from day to day and as the number of PEVs in the market increases.
Controllable capacity represents the load the aggregator can shed by curtailing charging or add by commencing charging. Understanding the variability of controllable capacity is important, because PEVs are not a typical resource. The primary purpose of PEVs is to provide transportation. As a result, the location, connection status, and energy storage capacity of PEVs are continually changing. For PEVs to be a viable grid resource collectively, that resource must be consistent. The more consistent the resource, the more predicable it is from day to day, and the more valuable it is for utilities.
Many factors describing PEV charging should be considered when determining the value of PEV charge control to the aggregator, including the following:
• Direction of power flow
• Magnitude of power flow, as a function of the charge rate of individual vehicles and the total number of vehicles charging
• Location of vehicles when charging
• Time of day when charging occurs
• Aggregator’s level of control over charging.
This section quantifies the magnitude and variability of the controllable capacity of PEVs by analyzing data collected from a large group of PEVs in use in the United States between 2012 and 2014. The analysis focuses on times when PEVs are parked at home and charging during the evening and nighttime hours at the AC Level 2 charge rate. Only power flow from the grid to the
45
This report is available at no cost from the National Renewable Energy Laboratory (NREL) at www.nrel.gov/publications.
vehicle (V1G) is considered. The magnitude and variability of the controllable capacity with respect to other factors, including vehicle-to-grid charging, should be explored in future work.
5.1 Direct Analysis of EV Project Data To quantify the magnitude and variability of controllable capacity when PEVs are charged at home during the evening and nighttime hours, data from the EV Project was analyzed. The EV Project included thousands of Nissan Leaf battery EVs in 17 U.S. metropolitan locations. Owners of these vehicles agreed to allow researchers to collect data from their vehicles. This analysis used data from 430 privately owned Nissan Leafs and in the Seattle area during regular weekdays from October 1, 2012, to October 1, 2013. Regular weekdays are weekdays that are not holidays. The selected data set was used to quantify the magnitude and variability of controllable capacity that can be expected from a group of EVs. These two ideas will be analyzed separately in the sections below.
5.1.1 Magnitude of Controllable Capacity The magnitude of controllable capacity refers to the quantity of energy and power that the aggregator is able to control. The quantity of energy that the aggregator is able to control is referred to as the available charge energy. The quantity of power that the aggregator is able to control is referred to as the available charge power. As mentioned previously, the analysis that follows is limited to unidirectional power flow from the grid to the vehicle. Within this power flow scheme, it is possible to both increase and decrease the net load by controlling the PEV load. To see how this is possible, imagine that the charging of 100 PEVs can be controlled at a given point in time. If each PEV has a maximum charge rate of 3 kW, all 100 PEVs are connected to the grid, and 60 of the 100 PEVs are actively charging, then the net load could be reduced by up to 180 kW by interrupting the charging of those 60 PEVs. Alternatively, the net load could be increased by up to 120 kW by commencing the charging of the 40 PEVs that are not charging (assuming those PEVs’ batteries were not already fully charged).
For a PEV to provide available charge energy or available charge power to the grid, it must be plugged in; therefore, the first step in quantifying the available charge energy and available charge power is to determine the connection state of PEVs over time. This was done by using the EV Project data to calculate the percent of time that PEVs were plugged in at home. Figure 18 shows how the percent of Leafs connected to home EVSE changed throughout the day in Seattle.
The behavior in Figure 18 is consistent with EV Project Leaf drivers in other regions and represents typical at-home plug-in behavior. In general, approximately 65% of Leafs are plugged in at home between 10 p.m. and 6 a.m. every regular weekday. This means that there are a number of PEVs on any given day that are not at their home location or are not plugged in overnight; therefore, they cannot provide grid services. Because not every vehicle is plugged in at night, the results in this analysis are normalized by the total number of PEVs being analyzed, not only those that are plugged in. These normalized results can then act as multipliers for large, hypothetical PEV fleets.
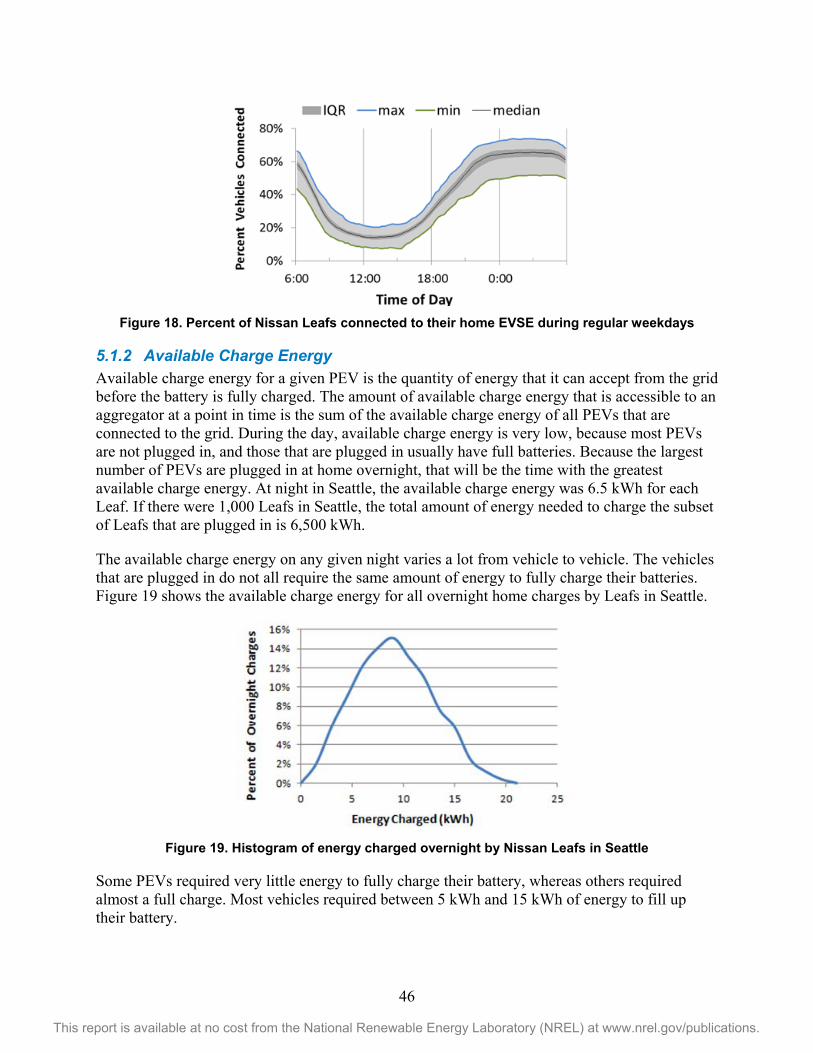
46
This report is available at no cost from the National Renewable Energy Laboratory (NREL) at www.nrel.gov/publications.
Figure 18. Percent of Nissan Leafs connected to their home EVSE during regular weekdays
5.1.2 Available Charge Energy Available charge energy for a given PEV is the quantity of energy that it can accept from the grid before the battery is fully charged. The amount of available charge energy that is accessible to an aggregator at a point in time is the sum of the available charge energy of all PEVs that are connected to the grid. During the day, available charge energy is very low, because most PEVs are not plugged in, and those that are plugged in usually have full batteries. Because the largest number of PEVs are plugged in at home overnight, that will be the time with the greatest available charge energy. At night in Seattle, the available charge energy was 6.5 kWh for each Leaf. If there were 1,000 Leafs in Seattle, the total amount of energy needed to charge the subset of Leafs that are plugged in is 6,500 kWh.
The available charge energy on any given night varies a lot from vehicle to vehicle. The vehicles that are plugged in do not all require the same amount of energy to fully charge their batteries. Figure 19 shows the available charge energy for all overnight home charges by Leafs in Seattle.
Figure 19. Histogram of energy charged overnight by Nissan Leafs in Seattle
Some PEVs required very little energy to fully charge their battery, whereas others required almost a full charge. Most vehicles required between 5 kWh and 15 kWh of energy to fill up their battery.
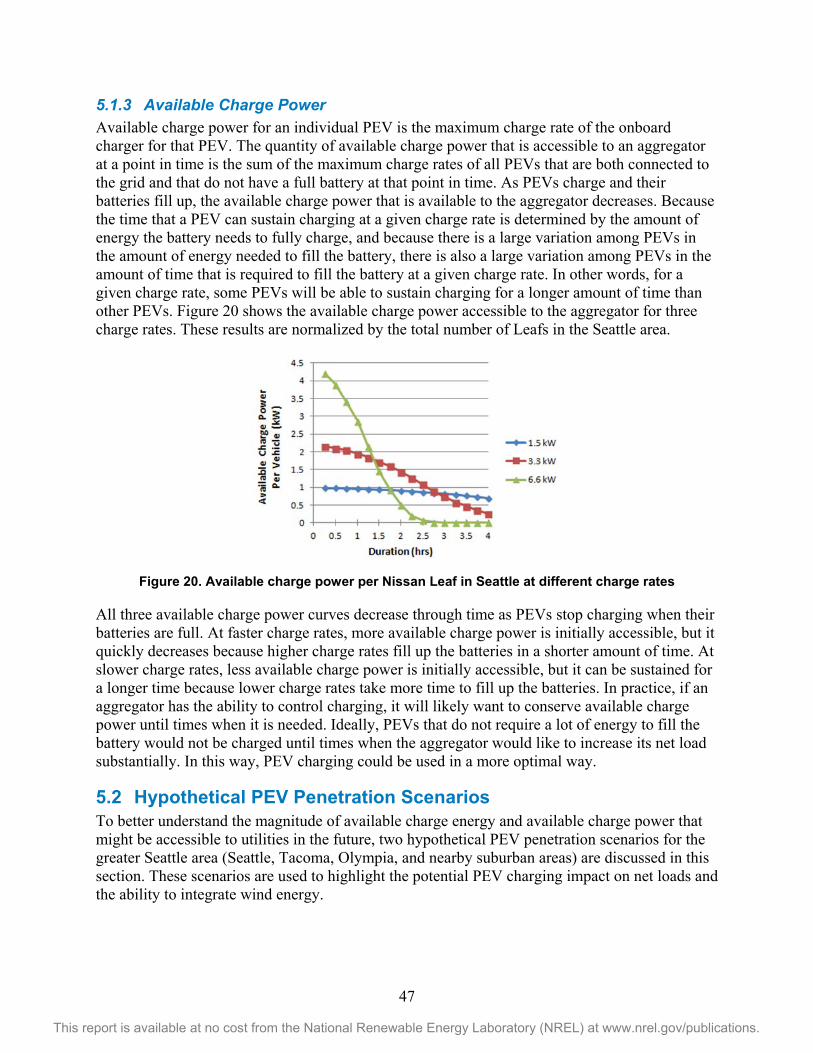
47
This report is available at no cost from the National Renewable Energy Laboratory (NREL) at www.nrel.gov/publications.
5.1.3 Available Charge Power Available charge power for an individual PEV is the maximum charge rate of the onboard charger for that PEV. The quantity of available charge power that is accessible to an aggregator at a point in time is the sum of the maximum charge rates of all PEVs that are both connected to the grid and that do not have a full battery at that point in time. As PEVs charge and their batteries fill up, the available charge power that is available to the aggregator decreases. Because the time that a PEV can sustain charging at a given charge rate is determined by the amount of energy the battery needs to fully charge, and because there is a large variation among PEVs in the amount of energy needed to fill the battery, there is also a large variation among PEVs in the amount of time that is required to fill the battery at a given charge rate. In other words, for a given charge rate, some PEVs will be able to sustain charging for a longer amount of time than other PEVs. Figure 20 shows the available charge power accessible to the aggregator for three charge rates. These results are normalized by the total number of Leafs in the Seattle area.
Figure 20. Available charge power per Nissan Leaf in Seattle at different charge rates
All three available charge power curves decrease through time as PEVs stop charging when their batteries are full. At faster charge rates, more available charge power is initially accessible, but it quickly decreases because higher charge rates fill up the batteries in a shorter amount of time. At slower charge rates, less available charge power is initially accessible, but it can be sustained for a longer time because lower charge rates take more time to fill up the batteries. In practice, if an aggregator has the ability to control charging, it will likely want to conserve available charge power until times when it is needed. Ideally, PEVs that do not require a lot of energy to fill the battery would not be charged until times when the aggregator would like to increase its net load substantially. In this way, PEV charging could be used in a more optimal way.
5.2 Hypothetical PEV Penetration Scenarios To better understand the magnitude of available charge energy and available charge power that might be accessible to utilities in the future, two hypothetical PEV penetration scenarios for the greater Seattle area (Seattle, Tacoma, Olympia, and nearby suburban areas) are discussed in this section. These scenarios are used to highlight the potential PEV charging impact on net loads and the ability to integrate wind energy.
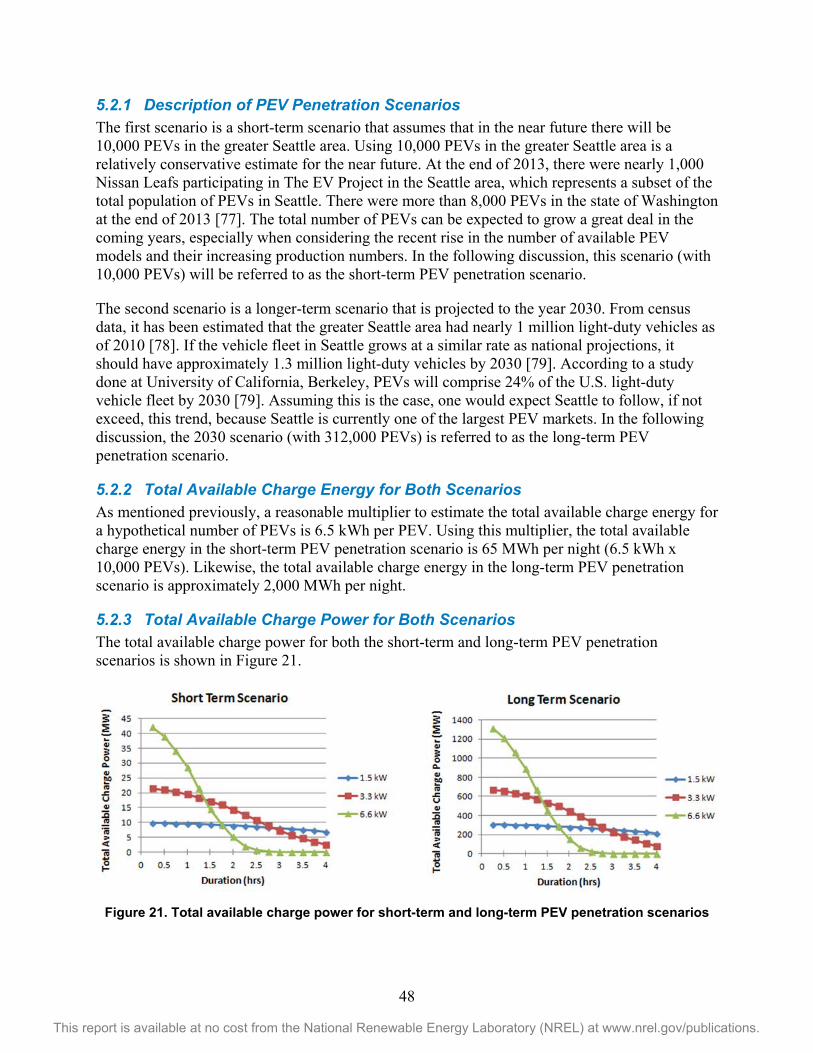
48
This report is available at no cost from the National Renewable Energy Laboratory (NREL) at www.nrel.gov/publications.
5.2.1 Description of PEV Penetration Scenarios The first scenario is a short-term scenario that assumes that in the near future there will be 10,000 PEVs in the greater Seattle area. Using 10,000 PEVs in the greater Seattle area is a relatively conservative estimate for the near future. At the end of 2013, there were nearly 1,000 Nissan Leafs participating in The EV Project in the Seattle area, which represents a subset of the total population of PEVs in Seattle. There were more than 8,000 PEVs in the state of Washington at the end of 2013 [77]. The total number of PEVs can be expected to grow a great deal in the coming years, especially when considering the recent rise in the number of available PEV models and their increasing production numbers. In the following discussion, this scenario (with 10,000 PEVs) will be referred to as the short-term PEV penetration scenario.
The second scenario is a longer-term scenario that is projected to the year 2030. From census data, it has been estimated that the greater Seattle area had nearly 1 million light-duty vehicles as of 2010 [78]. If the vehicle fleet in Seattle grows at a similar rate as national projections, it should have approximately 1.3 million light-duty vehicles by 2030 [79]. According to a study done at University of California, Berkeley, PEVs will comprise 24% of the U.S. light-duty vehicle fleet by 2030 [79]. Assuming this is the case, one would expect Seattle to follow, if not exceed, this trend, because Seattle is currently one of the largest PEV markets. In the following discussion, the 2030 scenario (with 312,000 PEVs) is referred to as the long-term PEV penetration scenario.
5.2.2 Total Available Charge Energy for Both Scenarios As mentioned previously, a reasonable multiplier to estimate the total available charge energy for a hypothetical number of PEVs is 6.5 kWh per PEV. Using this multiplier, the total available charge energy in the short-term PEV penetration scenario is 65 MWh per night (6.5 kWh x 10,000 PEVs). Likewise, the total available charge energy in the long-term PEV penetration scenario is approximately 2,000 MWh per night.
5.2.3 Total Available Charge Power for Both Scenarios The total available charge power for both the short-term and long-term PEV penetration scenarios is shown in Figure 21.
Figure 21. Total available charge power for short-term and long-term PEV penetration scenarios
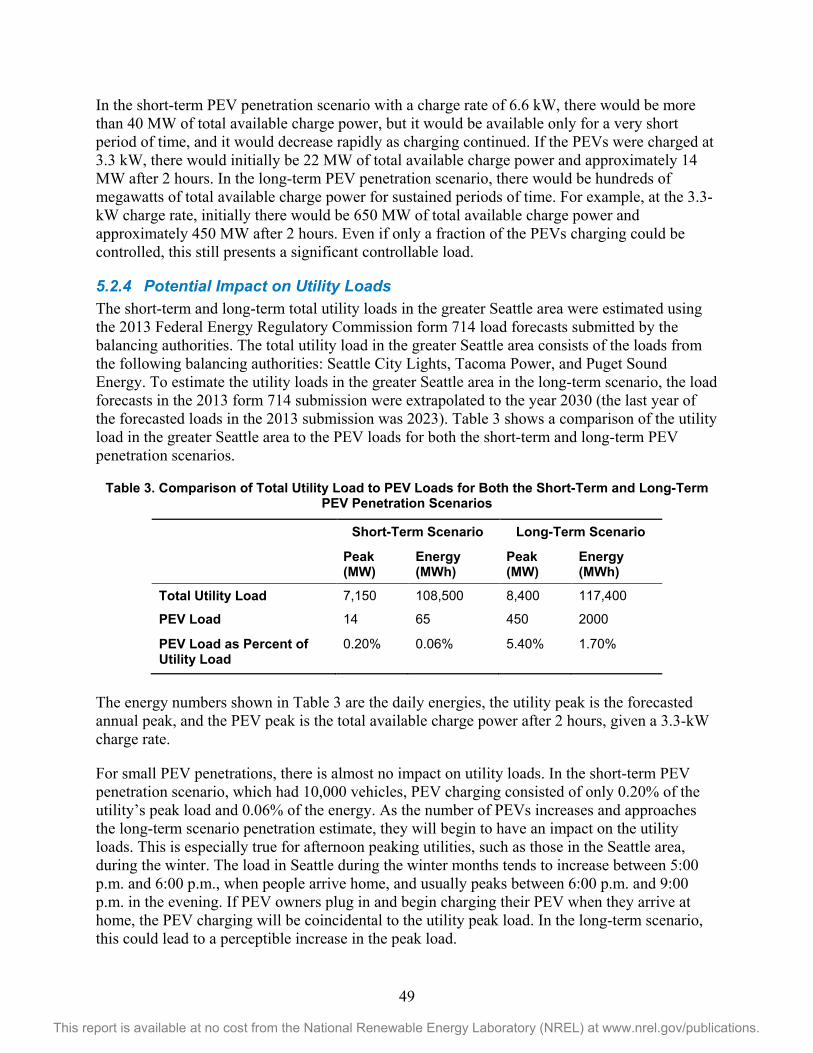
49
This report is available at no cost from the National Renewable Energy Laboratory (NREL) at www.nrel.gov/publications.
In the short-term PEV penetration scenario with a charge rate of 6.6 kW, there would be more than 40 MW of total available charge power, but it would be available only for a very short period of time, and it would decrease rapidly as charging continued. If the PEVs were charged at 3.3 kW, there would initially be 22 MW of total available charge power and approximately 14 MW after 2 hours. In the long-term PEV penetration scenario, there would be hundreds of megawatts of total available charge power for sustained periods of time. For example, at the 3.3-kW charge rate, initially there would be 650 MW of total available charge power and approximately 450 MW after 2 hours. Even if only a fraction of the PEVs charging could be controlled, this still presents a significant controllable load.
5.2.4 Potential Impact on Utility Loads The short-term and long-term total utility loads in the greater Seattle area were estimated using the 2013 Federal Energy Regulatory Commission form 714 load forecasts submitted by the balancing authorities. The total utility load in the greater Seattle area consists of the loads from the following balancing authorities: Seattle City Lights, Tacoma Power, and Puget Sound Energy. To estimate the utility loads in the greater Seattle area in the long-term scenario, the load forecasts in the 2013 form 714 submission were extrapolated to the year 2030 (the last year of the forecasted loads in the 2013 submission was 2023). Table 3 shows a comparison of the utility load in the greater Seattle area to the PEV loads for both the short-term and long-term PEV penetration scenarios.
Table 3. Comparison of Total Utility Load to PEV Loads for Both the Short-Term and Long-Term PEV Penetration Scenarios
Short-Term Scenario Long-Term Scenario
Peak (MW)
Energy (MWh)
Peak (MW)
Energy (MWh)
Total Utility Load 7,150 108,500 8,400 117,400
PEV Load 14 65 450 2000
PEV Load as Percent of Utility Load
0.20% 0.06% 5.40% 1.70%
The energy numbers shown in Table 3 are the daily energies, the utility peak is the forecasted annual peak, and the PEV peak is the total available charge power after 2 hours, given a 3.3-kW charge rate.
For small PEV penetrations, there is almost no impact on utility loads. In the short-term PEV penetration scenario, which had 10,000 vehicles, PEV charging consisted of only 0.20% of the utility’s peak load and 0.06% of the energy. As the number of PEVs increases and approaches the long-term scenario penetration estimate, they will begin to have an impact on the utility loads. This is especially true for afternoon peaking utilities, such as those in the Seattle area, during the winter. The load in Seattle during the winter months tends to increase between 5:00 p.m. and 6:00 p.m., when people arrive home, and usually peaks between 6:00 p.m. and 9:00 p.m. in the evening. If PEV owners plug in and begin charging their PEV when they arrive at home, the PEV charging will be coincidental to the utility peak load. In the long-term scenario, this could lead to a perceptible increase in the peak load.
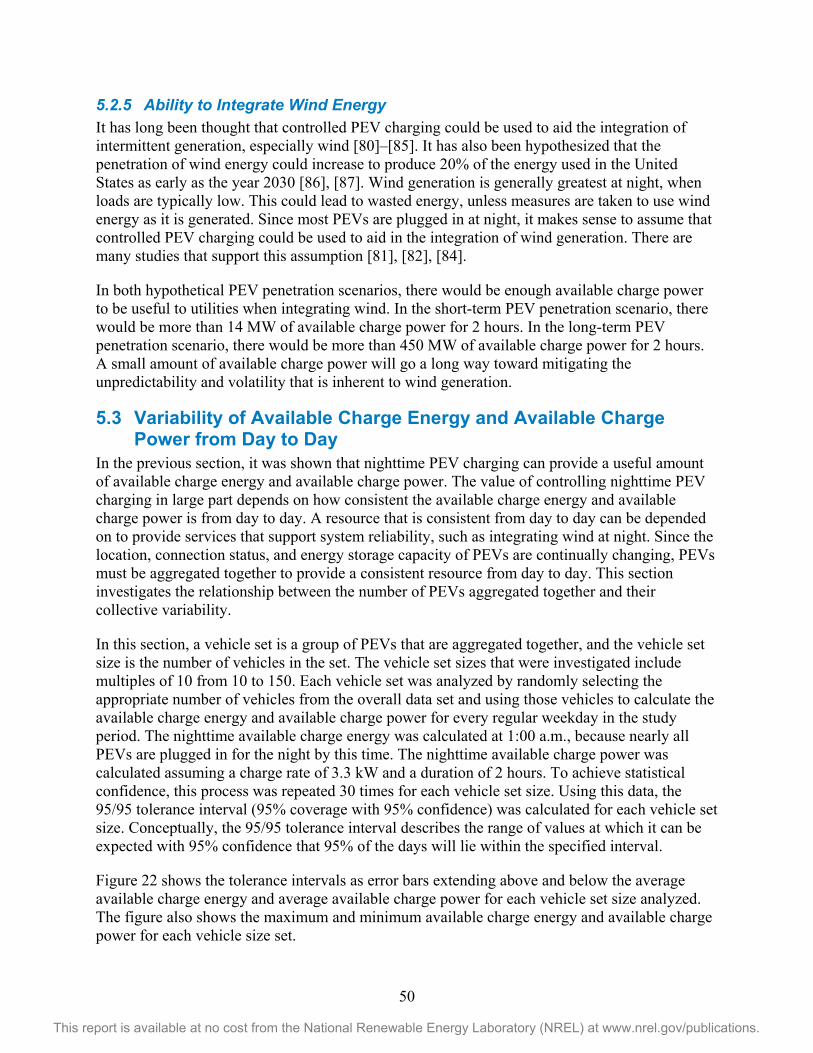
50
This report is available at no cost from the National Renewable Energy Laboratory (NREL) at www.nrel.gov/publications.
5.2.5 Ability to Integrate Wind Energy It has long been thought that controlled PEV charging could be used to aid the integration of intermittent generation, especially wind [80]–[85]. It has also been hypothesized that the penetration of wind energy could increase to produce 20% of the energy used in the United States as early as the year 2030 [86], [87]. Wind generation is generally greatest at night, when loads are typically low. This could lead to wasted energy, unless measures are taken to use wind energy as it is generated. Since most PEVs are plugged in at night, it makes sense to assume that controlled PEV charging could be used to aid in the integration of wind generation. There are many studies that support this assumption [81], [82], [84].
In both hypothetical PEV penetration scenarios, there would be enough available charge power to be useful to utilities when integrating wind. In the short-term PEV penetration scenario, there would be more than 14 MW of available charge power for 2 hours. In the long-term PEV penetration scenario, there would be more than 450 MW of available charge power for 2 hours. A small amount of available charge power will go a long way toward mitigating the unpredictability and volatility that is inherent to wind generation.
5.3 Variability of Available Charge Energy and Available Charge Power from Day to Day
In the previous section, it was shown that nighttime PEV charging can provide a useful amount of available charge energy and available charge power. The value of controlling nighttime PEV charging in large part depends on how consistent the available charge energy and available charge power is from day to day. A resource that is consistent from day to day can be depended on to provide services that support system reliability, such as integrating wind at night. Since the location, connection status, and energy storage capacity of PEVs are continually changing, PEVs must be aggregated together to provide a consistent resource from day to day. This section investigates the relationship between the number of PEVs aggregated together and their collective variability.
In this section, a vehicle set is a group of PEVs that are aggregated together, and the vehicle set size is the number of vehicles in the set. The vehicle set sizes that were investigated include multiples of 10 from 10 to 150. Each vehicle set was analyzed by randomly selecting the appropriate number of vehicles from the overall data set and using those vehicles to calculate the available charge energy and available charge power for every regular weekday in the study period. The nighttime available charge energy was calculated at 1:00 a.m., because nearly all PEVs are plugged in for the night by this time. The nighttime available charge power was calculated assuming a charge rate of 3.3 kW and a duration of 2 hours. To achieve statistical confidence, this process was repeated 30 times for each vehicle set size. Using this data, the 95/95 tolerance interval (95% coverage with 95% confidence) was calculated for each vehicle set size. Conceptually, the 95/95 tolerance interval describes the range of values at which it can be expected with 95% confidence that 95% of the days will lie within the specified interval.
Figure 22 shows the tolerance intervals as error bars extending above and below the average available charge energy and average available charge power for each vehicle set size analyzed. The figure also shows the maximum and minimum available charge energy and available charge power for each vehicle size set.
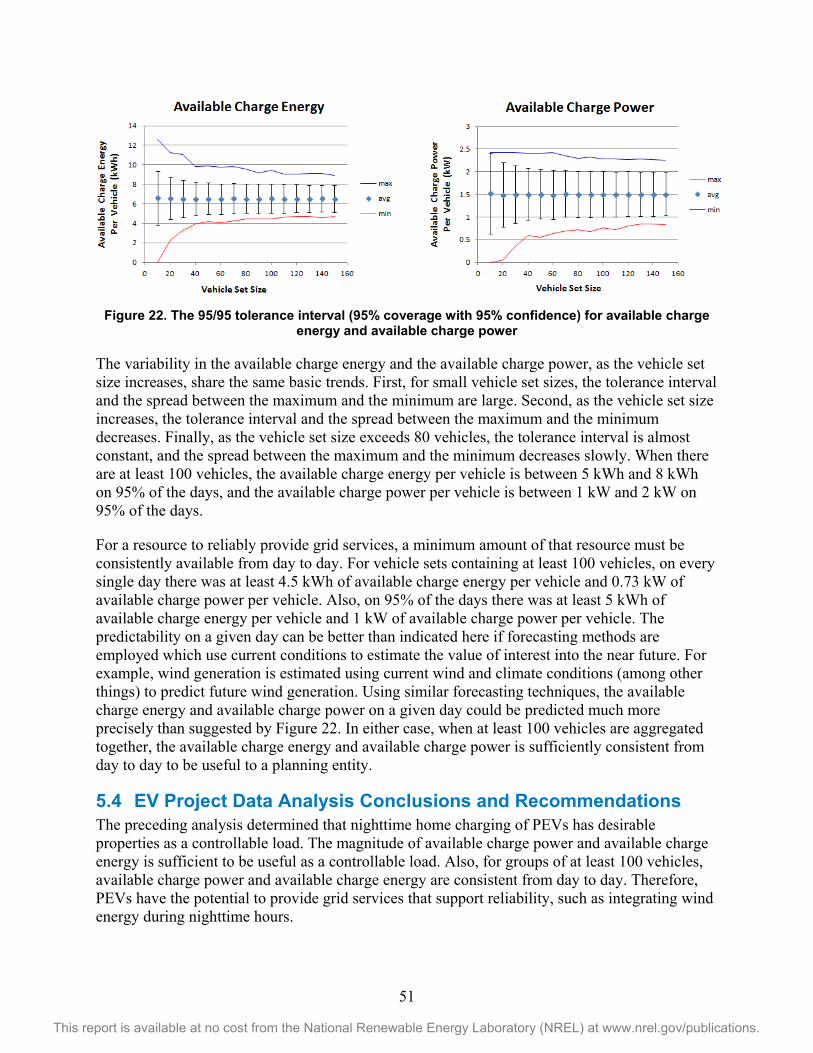
51
This report is available at no cost from the National Renewable Energy Laboratory (NREL) at www.nrel.gov/publications.
Figure 22. The 95/95 tolerance interval (95% coverage with 95% confidence) for available charge
energy and available charge power
The variability in the available charge energy and the available charge power, as the vehicle set size increases, share the same basic trends. First, for small vehicle set sizes, the tolerance interval and the spread between the maximum and the minimum are large. Second, as the vehicle set size increases, the tolerance interval and the spread between the maximum and the minimum decreases. Finally, as the vehicle set size exceeds 80 vehicles, the tolerance interval is almost constant, and the spread between the maximum and the minimum decreases slowly. When there are at least 100 vehicles, the available charge energy per vehicle is between 5 kWh and 8 kWh on 95% of the days, and the available charge power per vehicle is between 1 kW and 2 kW on 95% of the days.
For a resource to reliably provide grid services, a minimum amount of that resource must be consistently available from day to day. For vehicle sets containing at least 100 vehicles, on every single day there was at least 4.5 kWh of available charge energy per vehicle and 0.73 kW of available charge power per vehicle. Also, on 95% of the days there was at least 5 kWh of available charge energy per vehicle and 1 kW of available charge power per vehicle. The predictability on a given day can be better than indicated here if forecasting methods are employed which use current conditions to estimate the value of interest into the near future. For example, wind generation is estimated using current wind and climate conditions (among other things) to predict future wind generation. Using similar forecasting techniques, the available charge energy and available charge power on a given day could be predicted much more precisely than suggested by Figure 22. In either case, when at least 100 vehicles are aggregated together, the available charge energy and available charge power is sufficiently consistent from day to day to be useful to a planning entity.
5.4 EV Project Data Analysis Conclusions and Recommendations The preceding analysis determined that nighttime home charging of PEVs has desirable properties as a controllable load. The magnitude of available charge power and available charge energy is sufficient to be useful as a controllable load. Also, for groups of at least 100 vehicles, available charge power and available charge energy are consistent from day to day. Therefore, PEVs have the potential to provide grid services that support reliability, such as integrating wind energy during nighttime hours.

52
This report is available at no cost from the National Renewable Energy Laboratory (NREL) at www.nrel.gov/publications.
The broader question of whether the value of controllable PEV charging justifies the cost of building and operating a robust system to integrate PEVs with the grid will depend on the future attributes and characteristics of the grid. For the grid to be stable, the balance between load and generation must be maintained at all times. Conceptually, the load-generation balance is maintained by using sources of flexibility to mitigate sources of variability. Some common sources of flexibility are dispatchable generation, energy storage, and loads that can be controlled by the system operator. Some common sources of variability are loads that cannot be controlled by the system operator and intermittent resources such as wind. In the future, the value of PEV charging to a system operator will depend on the need and incremental cost of additional sources of flexibility. This is determined in part by the future resource mix (in particular, the penetration of variable resources such as wind and solar) and the future cost of other forms of controllable load and energy storage. Likely future scenarios should be investigated using PEV/grid simulation tools to inform intermediate decisions.
To make accurate modeling assumptions and to properly understand and validate the results of the simulation tools, work in the following areas is needed.
• Additional analysis of real-world PEV charging data to further explore the magnitude and variability of controllable PEV charging over a wide range of factors, including geography, vehicle type, charging time of day, charging location, and V2G charging.
• An understanding of how current and future PEVs behave as controllable loads on the grid. This requires testing to characterize the steady-state and dynamic electrical interaction of PEVs with the grid. With this knowledge, PEVs can be modeled accurately in a host of PEV/grid simulation tools.
• Studies of the characteristics of the various communications schemes that are currently being developed to facilitate communications between the PEVs and the grid—in particular, the effect of communications latency on the value of PEVs as a controllable resource.
Continued analyses of real-world data and characterization of real hardware are highly recommended to enable accurate simulations of PEVs integrated with the grid.
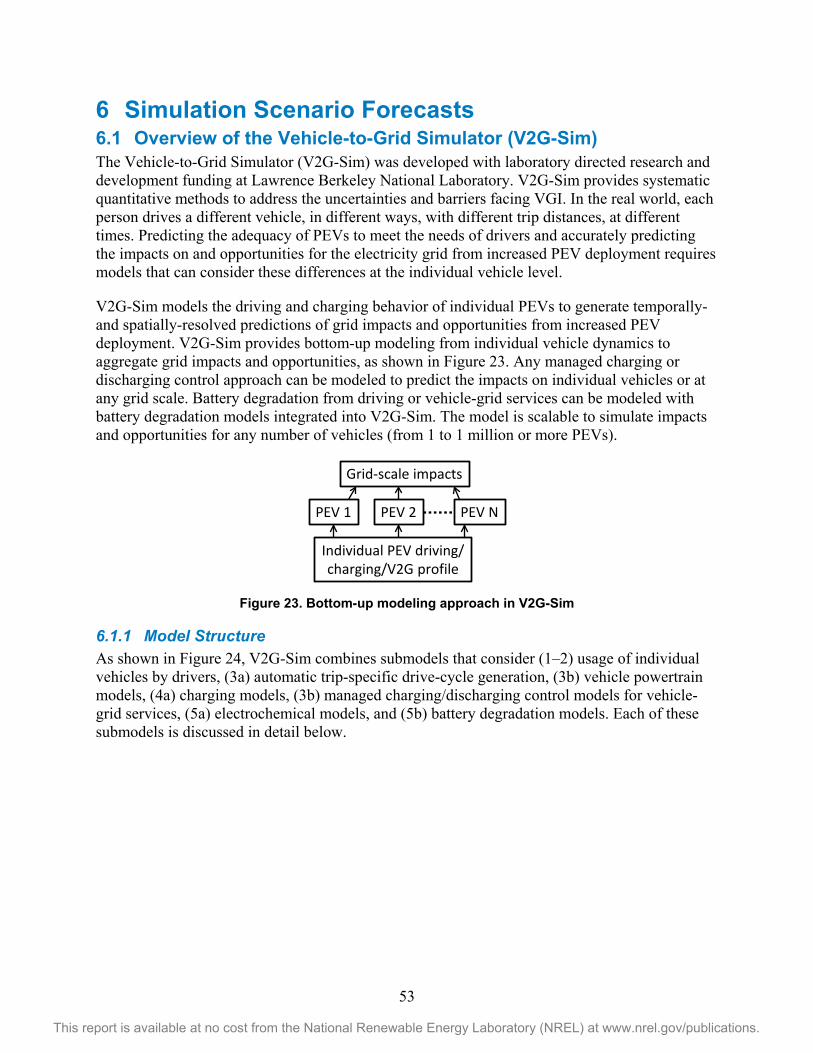
53
This report is available at no cost from the National Renewable Energy Laboratory (NREL) at www.nrel.gov/publications.
6 Simulation Scenario Forecasts 6.1 Overview of the Vehicle-to-Grid Simulator (V2G-Sim) The Vehicle-to-Grid Simulator (V2G-Sim) was developed with laboratory directed research and development funding at Lawrence Berkeley National Laboratory. V2G-Sim provides systematic quantitative methods to address the uncertainties and barriers facing VGI. In the real world, each person drives a different vehicle, in different ways, with different trip distances, at different times. Predicting the adequacy of PEVs to meet the needs of drivers and accurately predicting the impacts on and opportunities for the electricity grid from increased PEV deployment requires models that can consider these differences at the individual vehicle level.
V2G-Sim models the driving and charging behavior of individual PEVs to generate temporally- and spatially-resolved predictions of grid impacts and opportunities from increased PEV deployment. V2G-Sim provides bottom-up modeling from individual vehicle dynamics to aggregate grid impacts and opportunities, as shown in Figure 23. Any managed charging or discharging control approach can be modeled to predict the impacts on individual vehicles or at any grid scale. Battery degradation from driving or vehicle-grid services can be modeled with battery degradation models integrated into V2G-Sim. The model is scalable to simulate impacts and opportunities for any number of vehicles (from 1 to 1 million or more PEVs).
Figure 23. Bottom-up modeling approach in V2G-Sim
6.1.1 Model Structure As shown in Figure 24, V2G-Sim combines submodels that consider (1–2) usage of individual vehicles by drivers, (3a) automatic trip-specific drive-cycle generation, (3b) vehicle powertrain models, (4a) charging models, (3b) managed charging/discharging control models for vehicle-grid services, (5a) electrochemical models, and (5b) battery degradation models. Each of these submodels is discussed in detail below.
Individual PEV driving/charging/V2G profile
PEV 1 PEV 2 PEV N
Grid-scale impacts
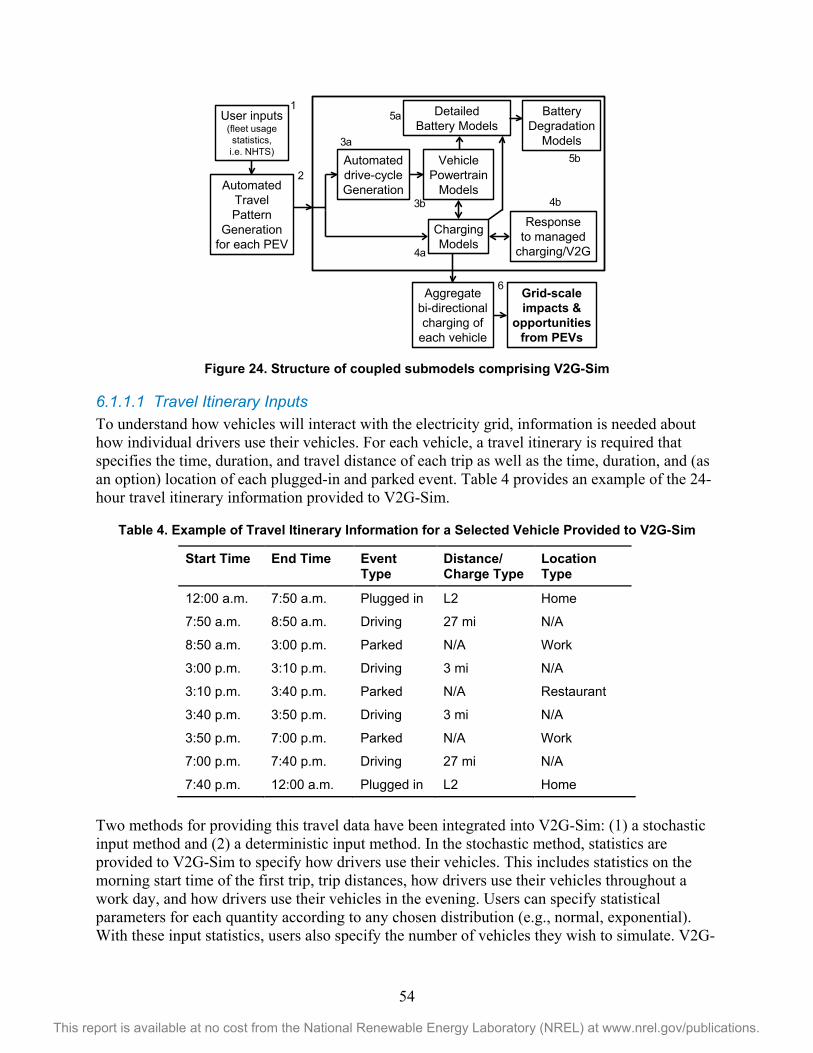
54
This report is available at no cost from the National Renewable Energy Laboratory (NREL) at www.nrel.gov/publications.
Figure 24. Structure of coupled submodels comprising V2G-Sim
6.1.1.1 Travel Itinerary Inputs To understand how vehicles will interact with the electricity grid, information is needed about how individual drivers use their vehicles. For each vehicle, a travel itinerary is required that specifies the time, duration, and travel distance of each trip as well as the time, duration, and (as an option) location of each plugged-in and parked event. Table 4 provides an example of the 24-hour travel itinerary information provided to V2G-Sim.
Table 4. Example of Travel Itinerary Information for a Selected Vehicle Provided to V2G-Sim
Start Time End Time Event Type
Distance/ Charge Type
Location Type
12:00 a.m. 7:50 a.m. Plugged in L2 Home
7:50 a.m. 8:50 a.m. Driving 27 mi N/A
8:50 a.m. 3:00 p.m. Parked N/A Work
3:00 p.m. 3:10 p.m. Driving 3 mi N/A
3:10 p.m. 3:40 p.m. Parked N/A Restaurant
3:40 p.m. 3:50 p.m. Driving 3 mi N/A
3:50 p.m. 7:00 p.m. Parked N/A Work
7:00 p.m. 7:40 p.m. Driving 27 mi N/A
7:40 p.m. 12:00 a.m. Plugged in L2 Home
Two methods for providing this travel data have been integrated into V2G-Sim: (1) a stochastic input method and (2) a deterministic input method. In the stochastic method, statistics are provided to V2G-Sim to specify how drivers use their vehicles. This includes statistics on the morning start time of the first trip, trip distances, how drivers use their vehicles throughout a work day, and how drivers use their vehicles in the evening. Users can specify statistical parameters for each quantity according to any chosen distribution (e.g., normal, exponential). With these input statistics, users also specify the number of vehicles they wish to simulate. V2G-
VehiclePowertrain
Models
ChargingModels
Automateddrive-cycleGenerationAutomated
TravelPattern
Generationfor each PEV
Responseto managed
charging/V2G
User inputs(fleet usagestatistics,i.e. NHTS)
Aggregatebi-directionalcharging of
each vehicle
Grid-scaleimpacts &
opportunitiesfrom PEVs
DetailedBattery Models
BatteryDegradation
Models
1
2
3a
3b
4a
4b
5a
5b
6
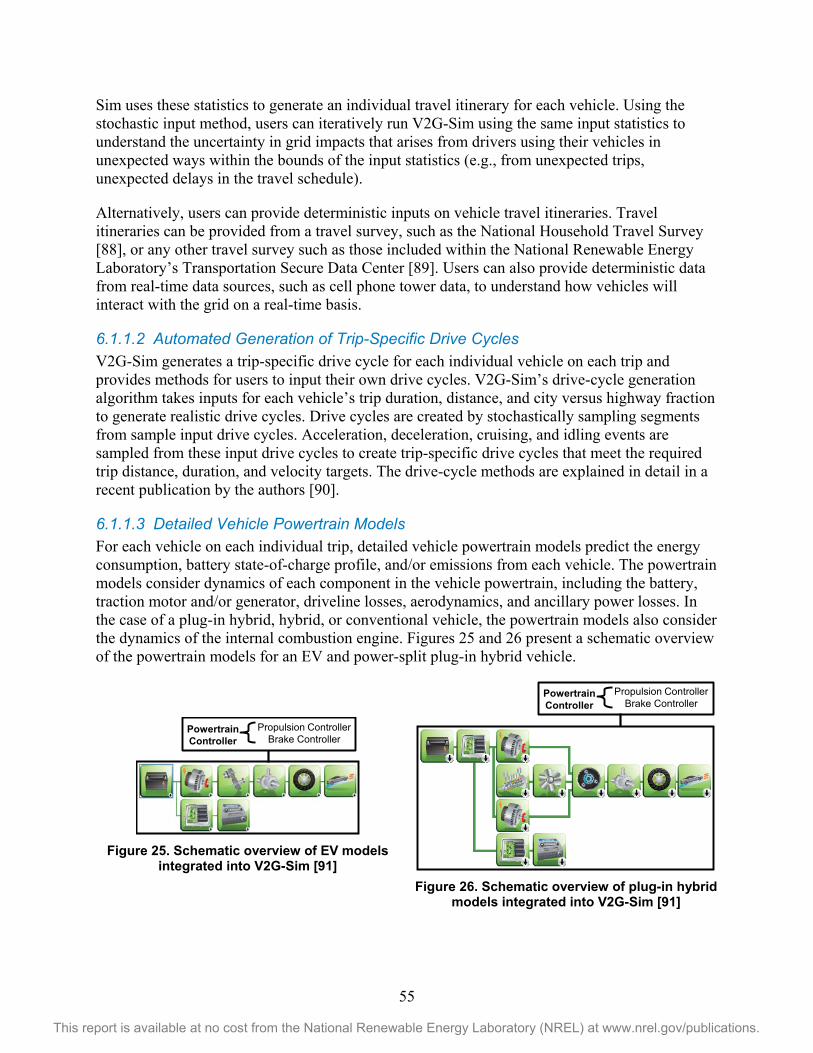
55
This report is available at no cost from the National Renewable Energy Laboratory (NREL) at www.nrel.gov/publications.
Sim uses these statistics to generate an individual travel itinerary for each vehicle. Using the stochastic input method, users can iteratively run V2G-Sim using the same input statistics to understand the uncertainty in grid impacts that arises from drivers using their vehicles in unexpected ways within the bounds of the input statistics (e.g., from unexpected trips, unexpected delays in the travel schedule).
Alternatively, users can provide deterministic inputs on vehicle travel itineraries. Travel itineraries can be provided from a travel survey, such as the National Household Travel Survey [88], or any other travel survey such as those included within the National Renewable Energy Laboratory’s Transportation Secure Data Center [89]. Users can also provide deterministic data from real-time data sources, such as cell phone tower data, to understand how vehicles will interact with the grid on a real-time basis.
6.1.1.2 Automated Generation of Trip-Specific Drive Cycles V2G-Sim generates a trip-specific drive cycle for each individual vehicle on each trip and provides methods for users to input their own drive cycles. V2G-Sim’s drive-cycle generation algorithm takes inputs for each vehicle’s trip duration, distance, and city versus highway fraction to generate realistic drive cycles. Drive cycles are created by stochastically sampling segments from sample input drive cycles. Acceleration, deceleration, cruising, and idling events are sampled from these input drive cycles to create trip-specific drive cycles that meet the required trip distance, duration, and velocity targets. The drive-cycle methods are explained in detail in a recent publication by the authors [90].
6.1.1.3 Detailed Vehicle Powertrain Models For each vehicle on each individual trip, detailed vehicle powertrain models predict the energy consumption, battery state-of-charge profile, and/or emissions from each vehicle. The powertrain models consider dynamics of each component in the vehicle powertrain, including the battery, traction motor and/or generator, driveline losses, aerodynamics, and ancillary power losses. In the case of a plug-in hybrid, hybrid, or conventional vehicle, the powertrain models also consider the dynamics of the internal combustion engine. Figures 25 and 26 present a schematic overview of the powertrain models for an EV and power-split plug-in hybrid vehicle.
Figure 25. Schematic overview of EV models
integrated into V2G-Sim [91] Figure 26. Schematic overview of plug-in hybrid
models integrated into V2G-Sim [91]
PowertrainController
Propulsion ControllerBrake Controller
PowertrainController
Propulsion ControllerBrake Controller
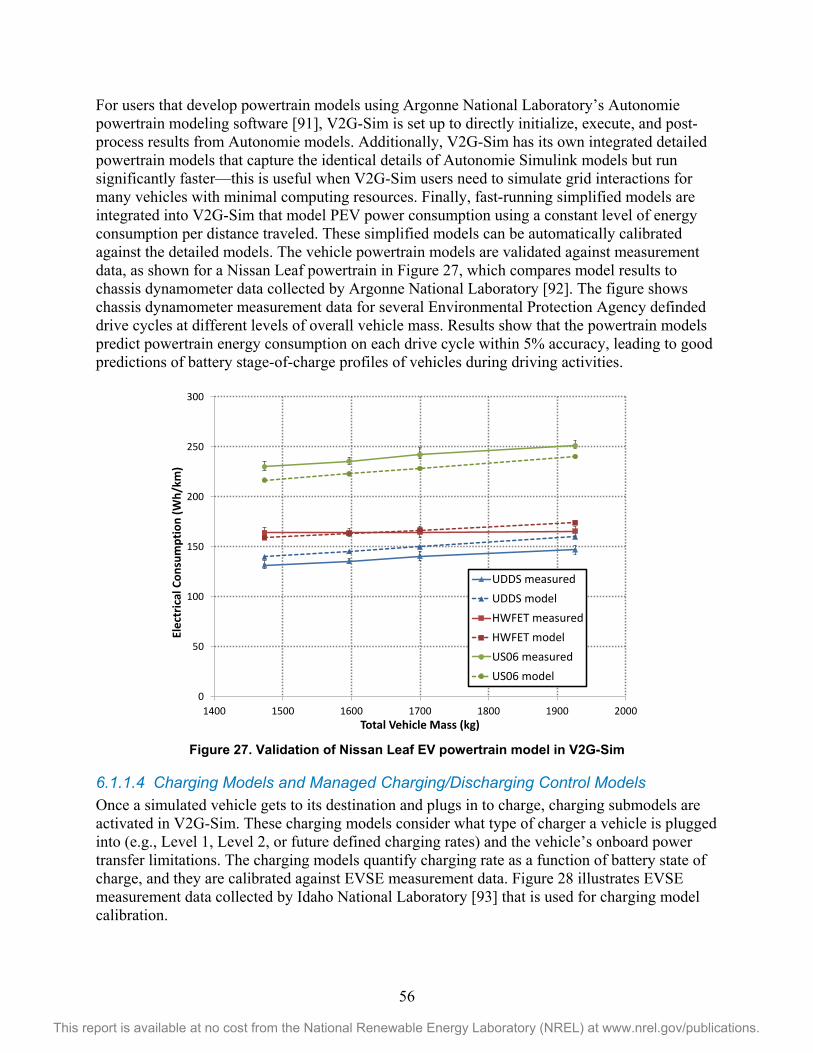
56
This report is available at no cost from the National Renewable Energy Laboratory (NREL) at www.nrel.gov/publications.
For users that develop powertrain models using Argonne National Laboratory’s Autonomie powertrain modeling software [91], V2G-Sim is set up to directly initialize, execute, and post-process results from Autonomie models. Additionally, V2G-Sim has its own integrated detailed powertrain models that capture the identical details of Autonomie Simulink models but run significantly faster—this is useful when V2G-Sim users need to simulate grid interactions for many vehicles with minimal computing resources. Finally, fast-running simplified models are integrated into V2G-Sim that model PEV power consumption using a constant level of energy consumption per distance traveled. These simplified models can be automatically calibrated against the detailed models. The vehicle powertrain models are validated against measurement data, as shown for a Nissan Leaf powertrain in Figure 27, which compares model results to chassis dynamometer data collected by Argonne National Laboratory [92]. The figure shows chassis dynamometer measurement data for several Environmental Protection Agency definded drive cycles at different levels of overall vehicle mass. Results show that the powertrain models predict powertrain energy consumption on each drive cycle within 5% accuracy, leading to good predictions of battery stage-of-charge profiles of vehicles during driving activities.
Figure 27. Validation of Nissan Leaf EV powertrain model in V2G-Sim
6.1.1.4 Charging Models and Managed Charging/Discharging Control Models Once a simulated vehicle gets to its destination and plugs in to charge, charging submodels are activated in V2G-Sim. These charging models consider what type of charger a vehicle is plugged into (e.g., Level 1, Level 2, or future defined charging rates) and the vehicle’s onboard power transfer limitations. The charging models quantify charging rate as a function of battery state of charge, and they are calibrated against EVSE measurement data. Figure 28 illustrates EVSE measurement data collected by Idaho National Laboratory [93] that is used for charging model calibration.
0
50
100
150
200
250
300
1400 1500 1600 1700 1800 1900 2000
Elec
tric
al C
onsu
mpt
ion
(Wh/
km)
Total Vehicle Mass (kg)
UDDS measuredUDDS modelHWFET measuredHWFET modelUS06 measuredUS06 model
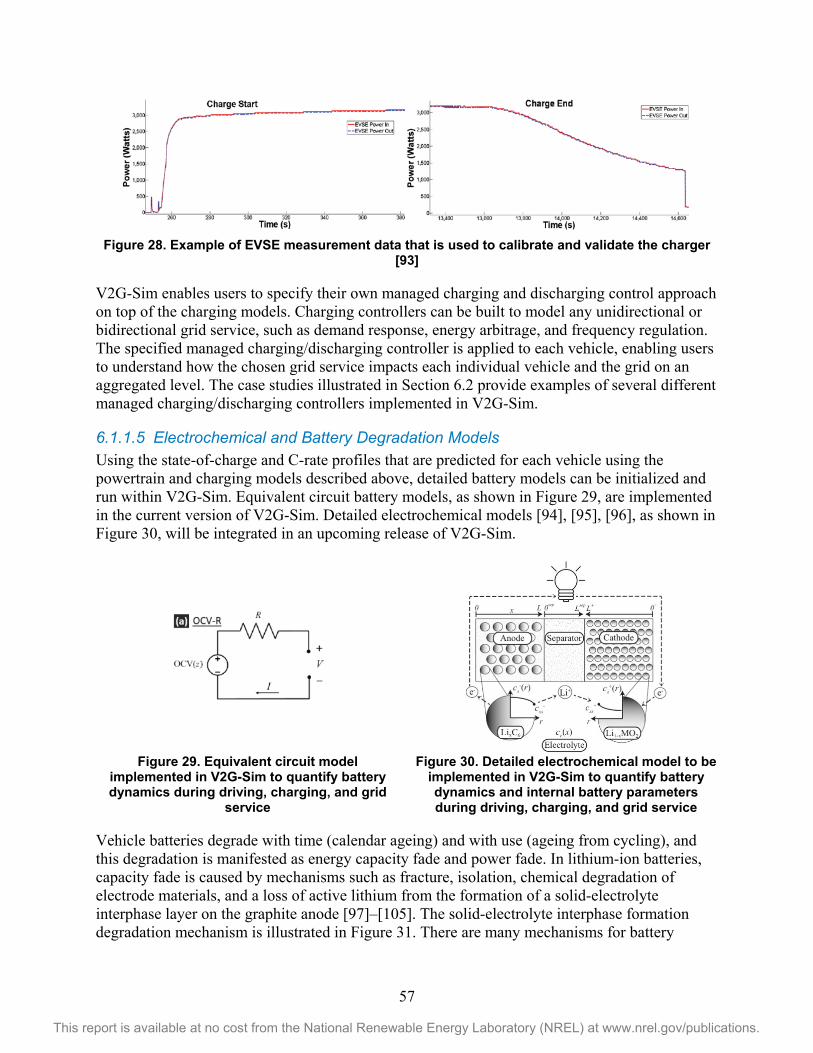
57
This report is available at no cost from the National Renewable Energy Laboratory (NREL) at www.nrel.gov/publications.
Figure 28. Example of EVSE measurement data that is used to calibrate and validate the charger
[93]
V2G-Sim enables users to specify their own managed charging and discharging control approach on top of the charging models. Charging controllers can be built to model any unidirectional or bidirectional grid service, such as demand response, energy arbitrage, and frequency regulation. The specified managed charging/discharging controller is applied to each vehicle, enabling users to understand how the chosen grid service impacts each individual vehicle and the grid on an aggregated level. The case studies illustrated in Section 6.2 provide examples of several different managed charging/discharging controllers implemented in V2G-Sim.
6.1.1.5 Electrochemical and Battery Degradation Models Using the state-of-charge and C-rate profiles that are predicted for each vehicle using the powertrain and charging models described above, detailed battery models can be initialized and run within V2G-Sim. Equivalent circuit battery models, as shown in Figure 29, are implemented in the current version of V2G-Sim. Detailed electrochemical models [94], [95], [96], as shown in Figure 30, will be integrated in an upcoming release of V2G-Sim.
Figure 29. Equivalent circuit model
implemented in V2G-Sim to quantify battery dynamics during driving, charging, and grid
service
Figure 30. Detailed electrochemical model to be implemented in V2G-Sim to quantify battery dynamics and internal battery parameters during driving, charging, and grid service
Vehicle batteries degrade with time (calendar ageing) and with use (ageing from cycling), and this degradation is manifested as energy capacity fade and power fade. In lithium-ion batteries, capacity fade is caused by mechanisms such as fracture, isolation, chemical degradation of electrode materials, and a loss of active lithium from the formation of a solid-electrolyte interphase layer on the graphite anode [97]–[105]. The solid-electrolyte interphase formation degradation mechanism is illustrated in Figure 31. There are many mechanisms for battery
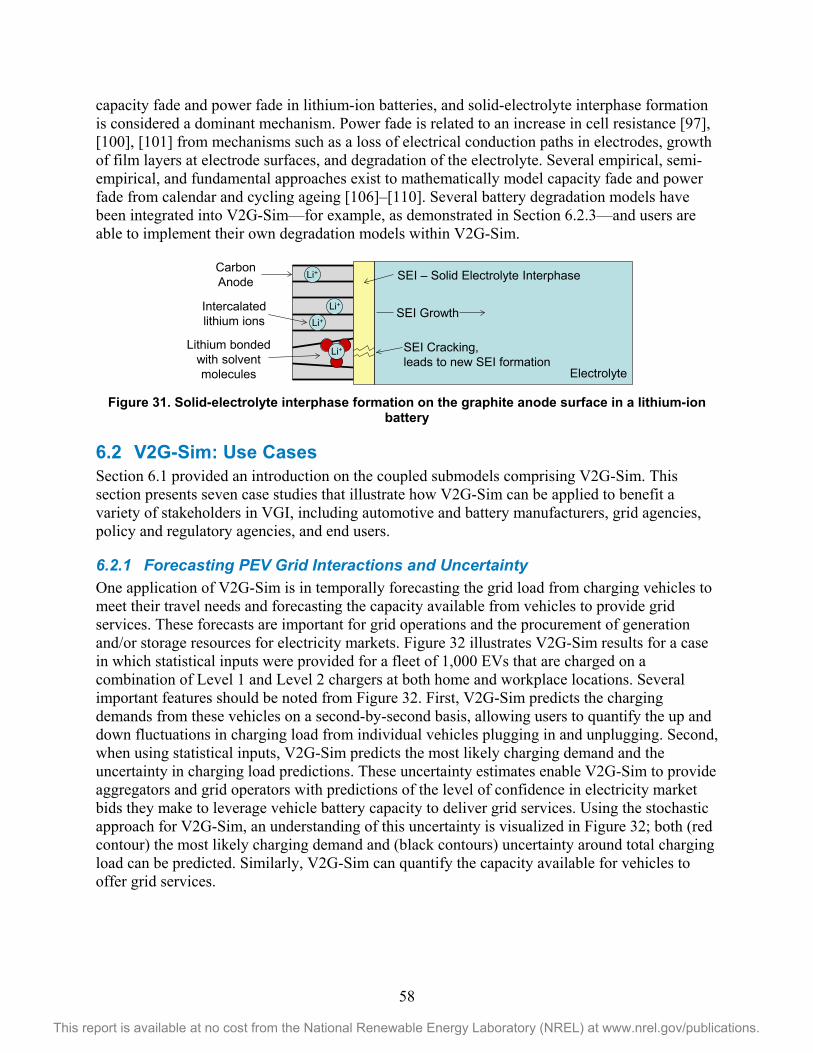
58
This report is available at no cost from the National Renewable Energy Laboratory (NREL) at www.nrel.gov/publications.
capacity fade and power fade in lithium-ion batteries, and solid-electrolyte interphase formation is considered a dominant mechanism. Power fade is related to an increase in cell resistance [97], [100], [101] from mechanisms such as a loss of electrical conduction paths in electrodes, growth of film layers at electrode surfaces, and degradation of the electrolyte. Several empirical, semi-empirical, and fundamental approaches exist to mathematically model capacity fade and power fade from calendar and cycling ageing [106]–[110]. Several battery degradation models have been integrated into V2G-Sim—for example, as demonstrated in Section 6.2.3—and users are able to implement their own degradation models within V2G-Sim.
Figure 31. Solid-electrolyte interphase formation on the graphite anode surface in a lithium-ion
battery
6.2 V2G-Sim: Use Cases Section 6.1 provided an introduction on the coupled submodels comprising V2G-Sim. This section presents seven case studies that illustrate how V2G-Sim can be applied to benefit a variety of stakeholders in VGI, including automotive and battery manufacturers, grid agencies, policy and regulatory agencies, and end users.
6.2.1 Forecasting PEV Grid Interactions and Uncertainty One application of V2G-Sim is in temporally forecasting the grid load from charging vehicles to meet their travel needs and forecasting the capacity available from vehicles to provide grid services. These forecasts are important for grid operations and the procurement of generation and/or storage resources for electricity markets. Figure 32 illustrates V2G-Sim results for a case in which statistical inputs were provided for a fleet of 1,000 EVs that are charged on a combination of Level 1 and Level 2 chargers at both home and workplace locations. Several important features should be noted from Figure 32. First, V2G-Sim predicts the charging demands from these vehicles on a second-by-second basis, allowing users to quantify the up and down fluctuations in charging load from individual vehicles plugging in and unplugging. Second, when using statistical inputs, V2G-Sim predicts the most likely charging demand and the uncertainty in charging load predictions. These uncertainty estimates enable V2G-Sim to provide aggregators and grid operators with predictions of the level of confidence in electricity market bids they make to leverage vehicle battery capacity to deliver grid services. Using the stochastic approach for V2G-Sim, an understanding of this uncertainty is visualized in Figure 32; both (red contour) the most likely charging demand and (black contours) uncertainty around total charging load can be predicted. Similarly, V2G-Sim can quantify the capacity available for vehicles to offer grid services.
CarbonAnode
Li+
Li+
Li+
SEI – Solid Electrolyte Interphase
SEI Growth
Electrolyte
Li+
Intercalatedlithium ions
Lithium bondedwith solventmolecules
SEI Cracking,leads to new SEI formation
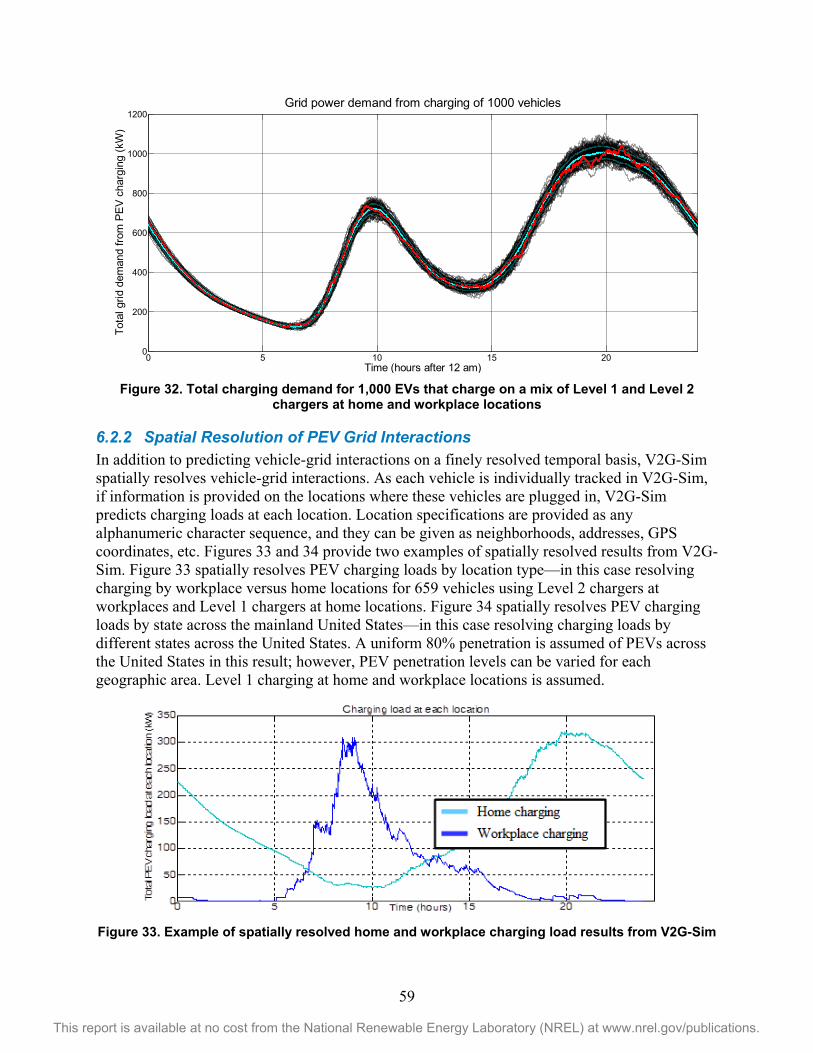
59
This report is available at no cost from the National Renewable Energy Laboratory (NREL) at www.nrel.gov/publications.
Figure 32. Total charging demand for 1,000 EVs that charge on a mix of Level 1 and Level 2
chargers at home and workplace locations
6.2.2 Spatial Resolution of PEV Grid Interactions In addition to predicting vehicle-grid interactions on a finely resolved temporal basis, V2G-Sim spatially resolves vehicle-grid interactions. As each vehicle is individually tracked in V2G-Sim, if information is provided on the locations where these vehicles are plugged in, V2G-Sim predicts charging loads at each location. Location specifications are provided as any alphanumeric character sequence, and they can be given as neighborhoods, addresses, GPS coordinates, etc. Figures 33 and 34 provide two examples of spatially resolved results from V2G-Sim. Figure 33 spatially resolves PEV charging loads by location type—in this case resolving charging by workplace versus home locations for 659 vehicles using Level 2 chargers at workplaces and Level 1 chargers at home locations. Figure 34 spatially resolves PEV charging loads by state across the mainland United States—in this case resolving charging loads by different states across the United States. A uniform 80% penetration is assumed of PEVs across the United States in this result; however, PEV penetration levels can be varied for each geographic area. Level 1 charging at home and workplace locations is assumed.
Figure 33. Example of spatially resolved home and workplace charging load results from V2G-Sim
0 5 10 15 200
200
400
600
800
1000
1200
Time (hours after 12 am)
Tota
l grid
dem
and
from
PEV
cha
rgin
g (k
W)
Grid power demand from charging of 1000 vehicles
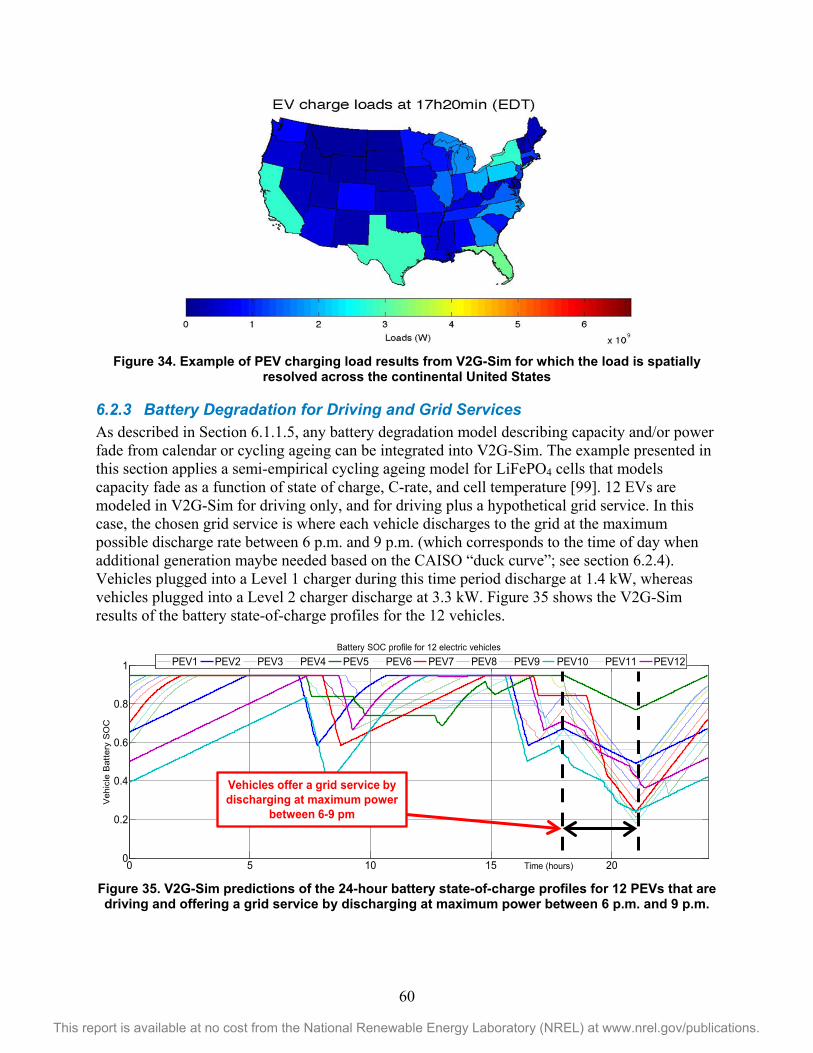
60
This report is available at no cost from the National Renewable Energy Laboratory (NREL) at www.nrel.gov/publications.
Figure 34. Example of PEV charging load results from V2G-Sim for which the load is spatially
resolved across the continental United States
6.2.3 Battery Degradation for Driving and Grid Services As described in Section 6.1.1.5, any battery degradation model describing capacity and/or power fade from calendar or cycling ageing can be integrated into V2G-Sim. The example presented in this section applies a semi-empirical cycling ageing model for LiFePO4 cells that models capacity fade as a function of state of charge, C-rate, and cell temperature [99]. 12 EVs are modeled in V2G-Sim for driving only, and for driving plus a hypothetical grid service. In this case, the chosen grid service is where each vehicle discharges to the grid at the maximum possible discharge rate between 6 p.m. and 9 p.m. (which corresponds to the time of day when additional generation maybe needed based on the CAISO “duck curve”; see section 6.2.4). Vehicles plugged into a Level 1 charger during this time period discharge at 1.4 kW, whereas vehicles plugged into a Level 2 charger discharge at 3.3 kW. Figure 35 shows the V2G-Sim results of the battery state-of-charge profiles for the 12 vehicles.
Figure 35. V2G-Sim predictions of the 24-hour battery state-of-charge profiles for 12 PEVs that are driving and offering a grid service by discharging at maximum power between 6 p.m. and 9 p.m.
0 5 10 15 200
0.2
0.4
0.6
0.8
1
Time (hours)
Veh
icle
Bat
tery
SO
C
Battery SOC profile for 12 electric vehicles
PEV1 PEV2 PEV3 PEV4 PEV5 PEV6 PEV7 PEV8 PEV9 PEV10 PEV11 PEV12
Vehicles offer a grid service by discharging at maximum power
between 6-9 pm
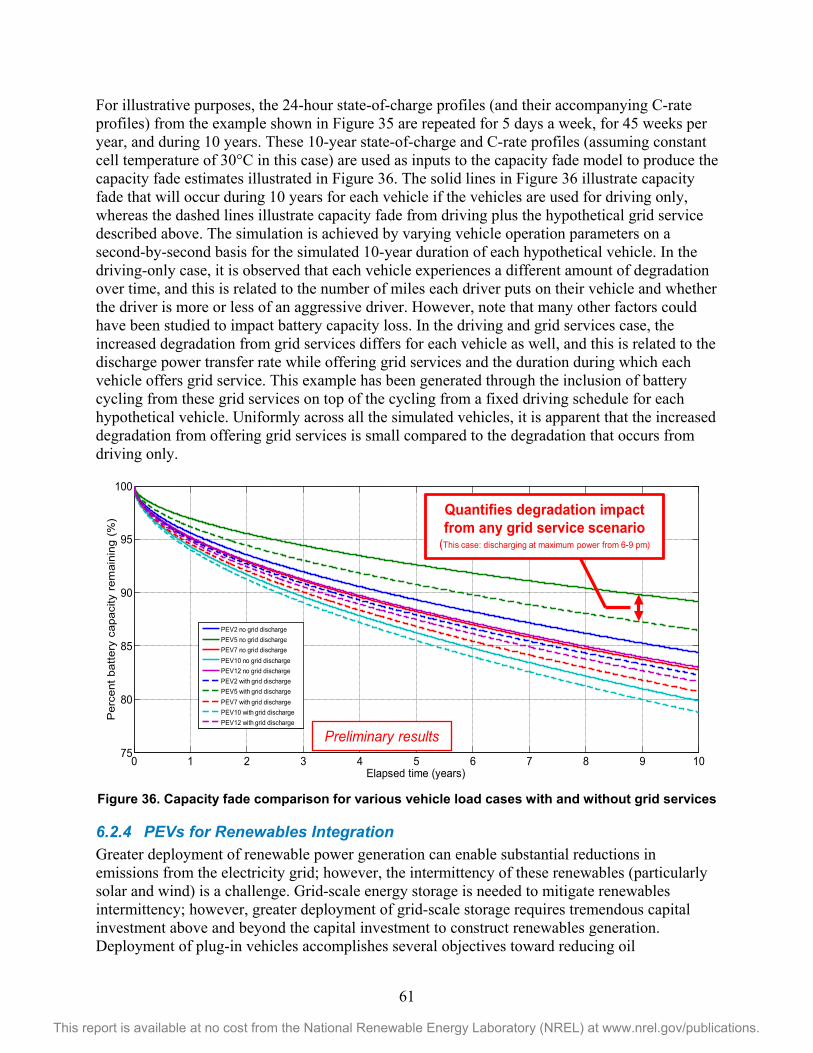
61
This report is available at no cost from the National Renewable Energy Laboratory (NREL) at www.nrel.gov/publications.
For illustrative purposes, the 24-hour state-of-charge profiles (and their accompanying C-rate profiles) from the example shown in Figure 35 are repeated for 5 days a week, for 45 weeks per year, and during 10 years. These 10-year state-of-charge and C-rate profiles (assuming constant cell temperature of 30°C in this case) are used as inputs to the capacity fade model to produce the capacity fade estimates illustrated in Figure 36. The solid lines in Figure 36 illustrate capacity fade that will occur during 10 years for each vehicle if the vehicles are used for driving only, whereas the dashed lines illustrate capacity fade from driving plus the hypothetical grid service described above. The simulation is achieved by varying vehicle operation parameters on a second-by-second basis for the simulated 10-year duration of each hypothetical vehicle. In the driving-only case, it is observed that each vehicle experiences a different amount of degradation over time, and this is related to the number of miles each driver puts on their vehicle and whether the driver is more or less of an aggressive driver. However, note that many other factors could have been studied to impact battery capacity loss. In the driving and grid services case, the increased degradation from grid services differs for each vehicle as well, and this is related to the discharge power transfer rate while offering grid services and the duration during which each vehicle offers grid service. This example has been generated through the inclusion of battery cycling from these grid services on top of the cycling from a fixed driving schedule for each hypothetical vehicle. Uniformly across all the simulated vehicles, it is apparent that the increased degradation from offering grid services is small compared to the degradation that occurs from driving only.
Figure 36. Capacity fade comparison for various vehicle load cases with and without grid services
6.2.4 PEVs for Renewables Integration Greater deployment of renewable power generation can enable substantial reductions in emissions from the electricity grid; however, the intermittency of these renewables (particularly solar and wind) is a challenge. Grid-scale energy storage is needed to mitigate renewables intermittency; however, greater deployment of grid-scale storage requires tremendous capital investment above and beyond the capital investment to construct renewables generation. Deployment of plug-in vehicles accomplishes several objectives toward reducing oil
0 1 2 3 4 5 6 7 8 9 1075
80
85
90
95
100
Elapsed time (years)
Per
cent
bat
tery
cap
acity
rem
aini
ng (
%)
PEV2 no grid dischargePEV5 no grid dischargePEV7 no grid dischargePEV10 no grid dischargePEV12 no grid dischargePEV2 with grid dischargePEV5 with grid dischargePEV7 with grid dischargePEV10 with grid dischargePEV12 with grid discharge
Preliminary results
Quantifies degradation impactfrom any grid service scenario
(This case: discharging at maximum power from 6-9 pm)

62
This report is available at no cost from the National Renewable Energy Laboratory (NREL) at www.nrel.gov/publications.
consumption, urban pollutants, and greenhouse gas emissions from transportation, and simultaneously the batteries from these PEVs can be used to provide grid storage to enable renewables integration. If one-quarter of the light-duty vehicles in the United States were plug-in hybrids, nearly 1,000 GWh of battery storage would be created—which is enough for 1 hour of operation of the U.S. grid if all generation were deactivated [111].
The State of California has mandated the deployment of substantial amounts of renewables generation [112]. Following these renewables deployment targets, CAISO produced forecasts of the wholesale market impact from substantial renewables deployment, commonly referred to as the duck curve [113]. The 2020 system impact forecasts are illustrated as the contour labeled “Original Duck Curve (2020)” in Figure 37. The y-axis in Figure 37 quantifies net load, which is the forecasted load across California minus generation from intermittent renewables (e.g., solar) throughout the day. Between 10 a.m. and 5 p.m., the contour identifies a potential problem with overgeneration in which the daytime levels of net load are lower than the magnitude of generation provided by the base generation in California. Additionally, between 5 p.m. and 8 p.m., the contour identifies a potential problem from steep ramp rates that arise because of evening peak loads coinciding with reduced solar generation from the sun setting.
Overlaid onto the 2020 duck curve in Figure 37 are results from three scenarios in V2G-Sim that quantify the impact of nearly 3 million vehicles on the California wholesale market. The number of PEVs in California was chosen from the high-scenario estimation in [114]; however, note that the low-scenario estimation is 500,000. The vast majority of these 3 million vehicles are plug-in hybrids, and all vehicles are simulated to be charging on Level 2 chargers at home and workplace locations. The three simulated scenarios are for (1) uncontrolled charging, in which vehicles begin charging upon arriving at a charging location and do not finish until they either have a full charge or depart for a trip, (2) smart charging, and (3) smart bidirectional charging (i.e., V2G). Figure 37 shows that uncontrolled charging in the workplace can help mitigate the daytime overgeneration problem; however, the evening ramping problems are exacerbated when the PEVs return home. The smart-charging scenario results show that smart charging enables greater mitigation of the daytime overgeneration problem without worsening the evening ramp problem (the evening smart charging contour overlaps exactly with the original duck curve). Finally, the V2G case shows a further ability to mitigate the daytime valley problem while also substantially mitigating the evening ramping problem from vehicles discharging during the evening period. These results suggest that a large population of PEVs, when properly integrated as a grid resource, can play a substantial role in enabling greater deployment and integration of intermittent renewable generation.
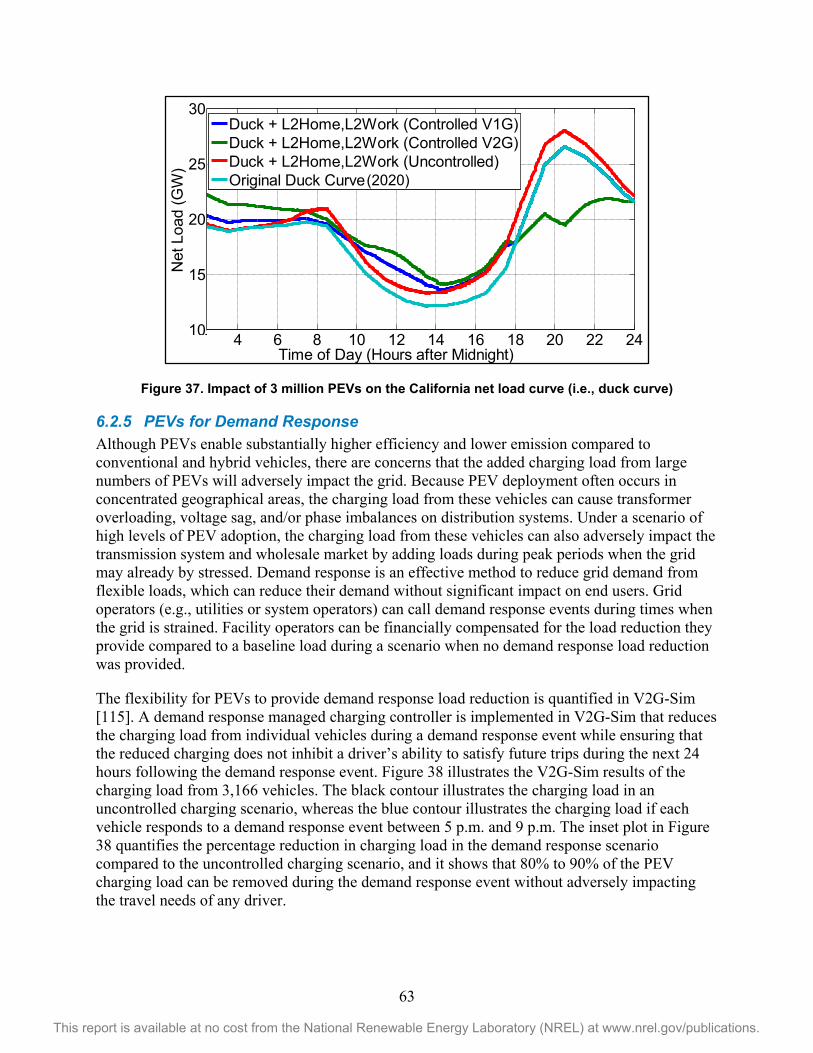
63
This report is available at no cost from the National Renewable Energy Laboratory (NREL) at www.nrel.gov/publications.
Figure 37. Impact of 3 million PEVs on the California net load curve (i.e., duck curve)
6.2.5 PEVs for Demand Response Although PEVs enable substantially higher efficiency and lower emission compared to conventional and hybrid vehicles, there are concerns that the added charging load from large numbers of PEVs will adversely impact the grid. Because PEV deployment often occurs in concentrated geographical areas, the charging load from these vehicles can cause transformer overloading, voltage sag, and/or phase imbalances on distribution systems. Under a scenario of high levels of PEV adoption, the charging load from these vehicles can also adversely impact the transmission system and wholesale market by adding loads during peak periods when the grid may already by stressed. Demand response is an effective method to reduce grid demand from flexible loads, which can reduce their demand without significant impact on end users. Grid operators (e.g., utilities or system operators) can call demand response events during times when the grid is strained. Facility operators can be financially compensated for the load reduction they provide compared to a baseline load during a scenario when no demand response load reduction was provided.
The flexibility for PEVs to provide demand response load reduction is quantified in V2G-Sim [115]. A demand response managed charging controller is implemented in V2G-Sim that reduces the charging load from individual vehicles during a demand response event while ensuring that the reduced charging does not inhibit a driver’s ability to satisfy future trips during the next 24 hours following the demand response event. Figure 38 illustrates the V2G-Sim results of the charging load from 3,166 vehicles. The black contour illustrates the charging load in an uncontrolled charging scenario, whereas the blue contour illustrates the charging load if each vehicle responds to a demand response event between 5 p.m. and 9 p.m. The inset plot in Figure 38 quantifies the percentage reduction in charging load in the demand response scenario compared to the uncontrolled charging scenario, and it shows that 80% to 90% of the PEV charging load can be removed during the demand response event without adversely impacting the travel needs of any driver.
4 6 8 10 12 14 16 18 20 22 24Time of Day (Hours after Midnight)
Duck + L2Home,L2Work (Controlled V1G)Duck + L2Home,L2Work (Controlled V2G)Duck + L2Home,L2Work (Uncontrolled)Original Duck Curve
010
15
20
25
30
Net
Loa
d (G
W)
(2020)
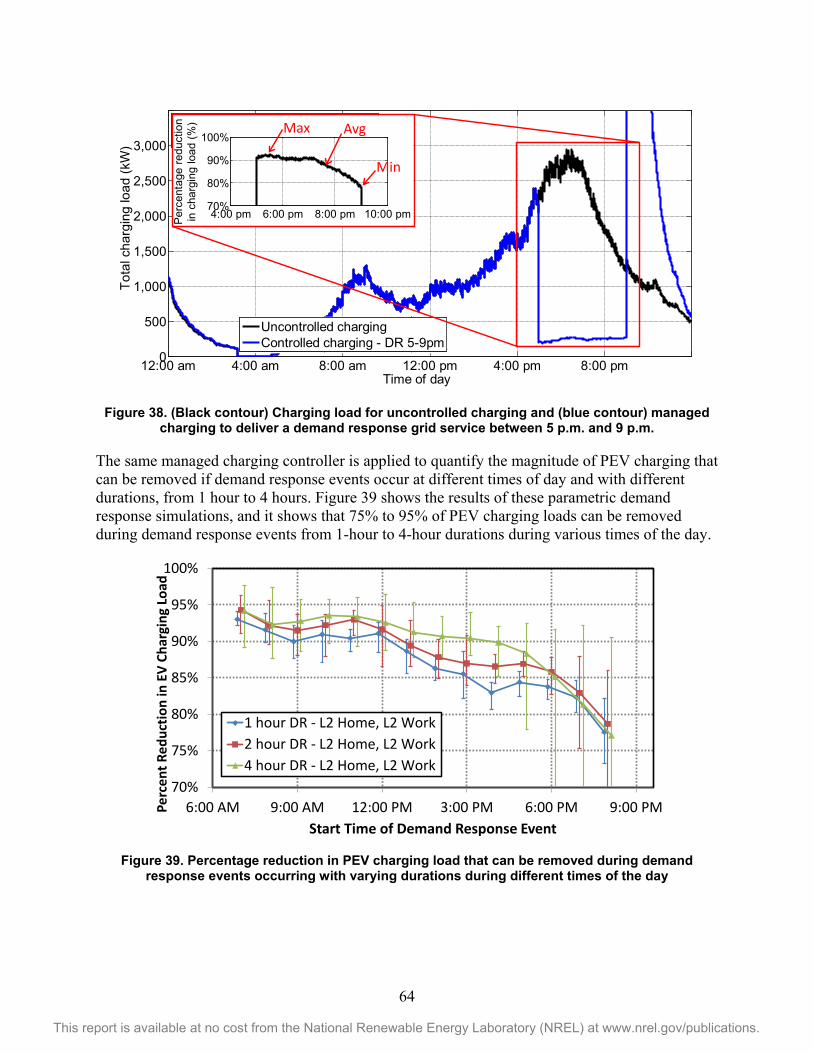
64
This report is available at no cost from the National Renewable Energy Laboratory (NREL) at www.nrel.gov/publications.
Figure 38. (Black contour) Charging load for uncontrolled charging and (blue contour) managed charging to deliver a demand response grid service between 5 p.m. and 9 p.m.
The same managed charging controller is applied to quantify the magnitude of PEV charging that can be removed if demand response events occur at different times of day and with different durations, from 1 hour to 4 hours. Figure 39 shows the results of these parametric demand response simulations, and it shows that 75% to 95% of PEV charging loads can be removed during demand response events from 1-hour to 4-hour durations during various times of the day.
Figure 39. Percentage reduction in PEV charging load that can be removed during demand response events occurring with varying durations during different times of the day
12:00 am 4:00 am 8:00 am 12:00 pm 4:00 pm 8:00 pm0
500
1,000
1,500
2,000
2,500
3,000
Time of day (hours)
g
g (
)
Uncontrolled chargingControlled charging - DR 5-9pm
Uncontrolled chargingControlled charging - DR 5-9pm
4:00 pm 6:00 pm 8:00 pm 10:00 pm70%
80%
90%
100%
Per
cent
age
redu
ctio
nin
cha
rgin
g lo
ad (%
)
Tota
l cha
rgin
g lo
ad (k
W)
Max Avg
Min
70%
75%
80%
85%
90%
95%
100%
6:00 AM 9:00 AM 12:00 PM 3:00 PM 6:00 PM 9:00 PMPerc
ent R
educ
tion
in E
V Ch
argi
ng L
oad
Start Time of Demand Response Event
1 hour DR - L2 Home, L2 Work2 hour DR - L2 Home, L2 Work4 hour DR - L2 Home, L2 Work
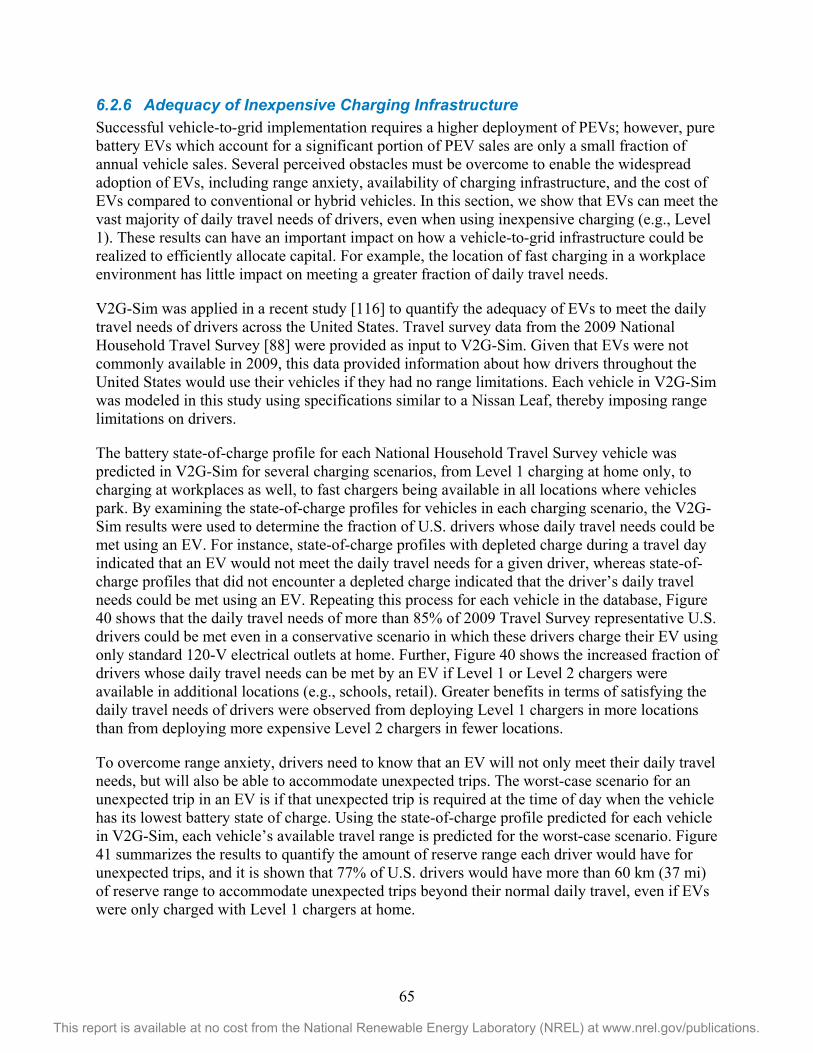
65
This report is available at no cost from the National Renewable Energy Laboratory (NREL) at www.nrel.gov/publications.
6.2.6 Adequacy of Inexpensive Charging Infrastructure Successful vehicle-to-grid implementation requires a higher deployment of PEVs; however, pure battery EVs which account for a significant portion of PEV sales are only a small fraction of annual vehicle sales. Several perceived obstacles must be overcome to enable the widespread adoption of EVs, including range anxiety, availability of charging infrastructure, and the cost of EVs compared to conventional or hybrid vehicles. In this section, we show that EVs can meet the vast majority of daily travel needs of drivers, even when using inexpensive charging (e.g., Level 1). These results can have an important impact on how a vehicle-to-grid infrastructure could be realized to efficiently allocate capital. For example, the location of fast charging in a workplace environment has little impact on meeting a greater fraction of daily travel needs.
V2G-Sim was applied in a recent study [116] to quantify the adequacy of EVs to meet the daily travel needs of drivers across the United States. Travel survey data from the 2009 National Household Travel Survey [88] were provided as input to V2G-Sim. Given that EVs were not commonly available in 2009, this data provided information about how drivers throughout the United States would use their vehicles if they had no range limitations. Each vehicle in V2G-Sim was modeled in this study using specifications similar to a Nissan Leaf, thereby imposing range limitations on drivers.
The battery state-of-charge profile for each National Household Travel Survey vehicle was predicted in V2G-Sim for several charging scenarios, from Level 1 charging at home only, to charging at workplaces as well, to fast chargers being available in all locations where vehicles park. By examining the state-of-charge profiles for vehicles in each charging scenario, the V2G-Sim results were used to determine the fraction of U.S. drivers whose daily travel needs could be met using an EV. For instance, state-of-charge profiles with depleted charge during a travel day indicated that an EV would not meet the daily travel needs for a given driver, whereas state-of-charge profiles that did not encounter a depleted charge indicated that the driver’s daily travel needs could be met using an EV. Repeating this process for each vehicle in the database, Figure 40 shows that the daily travel needs of more than 85% of 2009 Travel Survey representative U.S. drivers could be met even in a conservative scenario in which these drivers charge their EV using only standard 120-V electrical outlets at home. Further, Figure 40 shows the increased fraction of drivers whose daily travel needs can be met by an EV if Level 1 or Level 2 chargers were available in additional locations (e.g., schools, retail). Greater benefits in terms of satisfying the daily travel needs of drivers were observed from deploying Level 1 chargers in more locations than from deploying more expensive Level 2 chargers in fewer locations.
To overcome range anxiety, drivers need to know that an EV will not only meet their daily travel needs, but will also be able to accommodate unexpected trips. The worst-case scenario for an unexpected trip in an EV is if that unexpected trip is required at the time of day when the vehicle has its lowest battery state of charge. Using the state-of-charge profile predicted for each vehicle in V2G-Sim, each vehicle’s available travel range is predicted for the worst-case scenario. Figure 41 summarizes the results to quantify the amount of reserve range each driver would have for unexpected trips, and it is shown that 77% of U.S. drivers would have more than 60 km (37 mi) of reserve range to accommodate unexpected trips beyond their normal daily travel, even if EVs were only charged with Level 1 chargers at home.
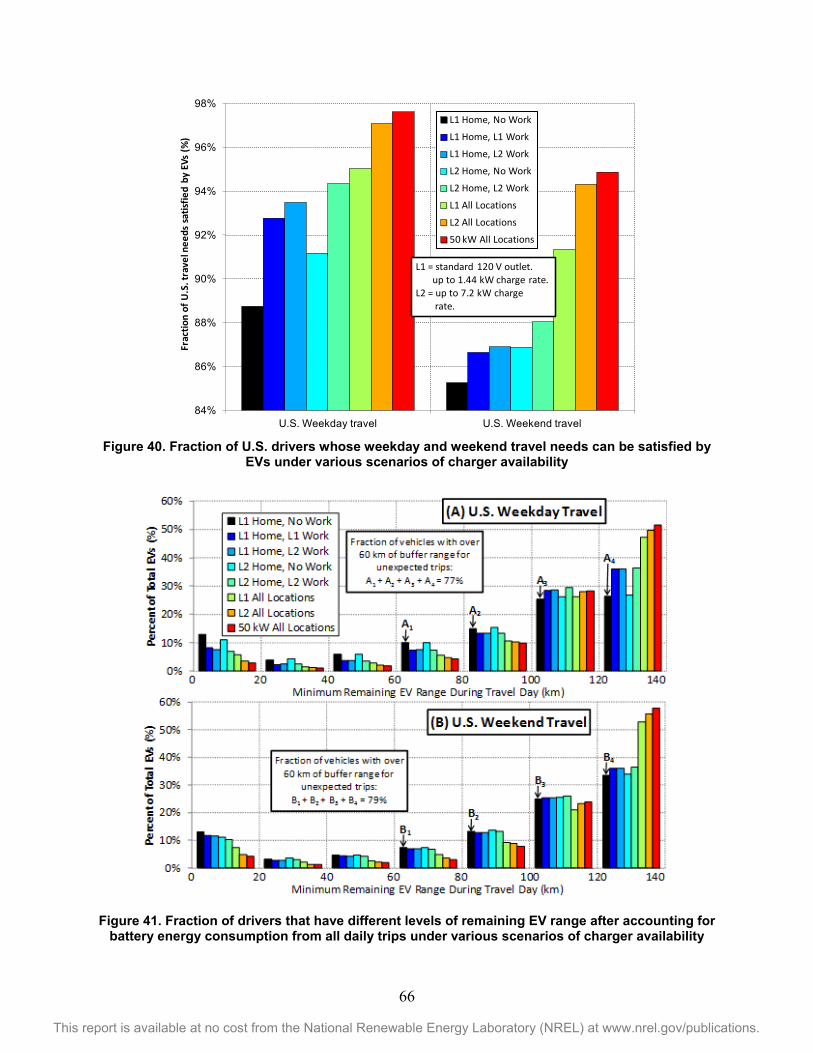
66
This report is available at no cost from the National Renewable Energy Laboratory (NREL) at www.nrel.gov/publications.
Figure 40. Fraction of U.S. drivers whose weekday and weekend travel needs can be satisfied by
EVs under various scenarios of charger availability
Figure 41. Fraction of drivers that have different levels of remaining EV range after accounting for
battery energy consumption from all daily trips under various scenarios of charger availability
84%
86%
88%
90%
92%
94%
96%
98%
U.S. Weekday travel U.S. Weekend travel
Frac
tion
of U
.S. t
rave
l nee
ds s
atisf
ied
by E
Vs (%
)
L1 Home, No Work
L1 Home, L1 Work
L1 Home, L2 Work
L2 Home, No Work
L2 Home, L2 Work
L1 All Locations
L2 All Locations
50 kW All Locations
L1 = standard 120 V outlet. up to 1.44 kW charge rate.
L2 = up to 7.2 kW chargerate.
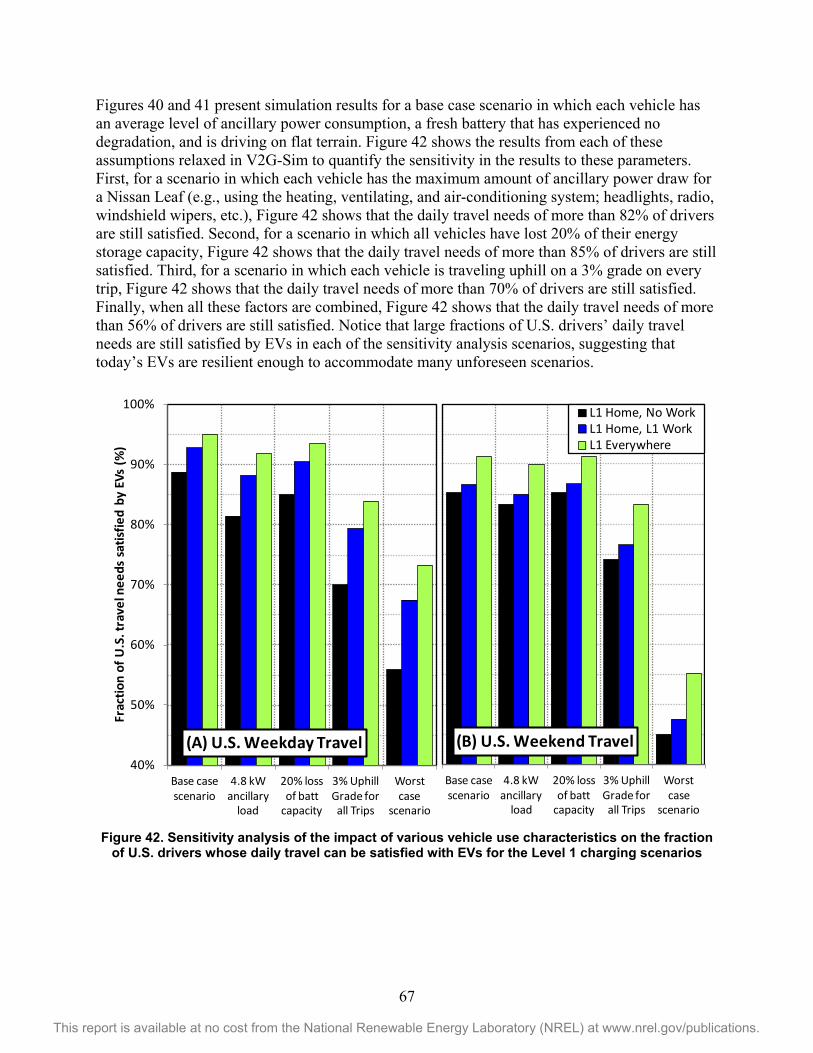
67
This report is available at no cost from the National Renewable Energy Laboratory (NREL) at www.nrel.gov/publications.
Figures 40 and 41 present simulation results for a base case scenario in which each vehicle has an average level of ancillary power consumption, a fresh battery that has experienced no degradation, and is driving on flat terrain. Figure 42 shows the results from each of these assumptions relaxed in V2G-Sim to quantify the sensitivity in the results to these parameters. First, for a scenario in which each vehicle has the maximum amount of ancillary power draw for a Nissan Leaf (e.g., using the heating, ventilating, and air-conditioning system; headlights, radio, windshield wipers, etc.), Figure 42 shows that the daily travel needs of more than 82% of drivers are still satisfied. Second, for a scenario in which all vehicles have lost 20% of their energy storage capacity, Figure 42 shows that the daily travel needs of more than 85% of drivers are still satisfied. Third, for a scenario in which each vehicle is traveling uphill on a 3% grade on every trip, Figure 42 shows that the daily travel needs of more than 70% of drivers are still satisfied. Finally, when all these factors are combined, Figure 42 shows that the daily travel needs of more than 56% of drivers are still satisfied. Notice that large fractions of U.S. drivers’ daily travel needs are still satisfied by EVs in each of the sensitivity analysis scenarios, suggesting that today’s EVs are resilient enough to accommodate many unforeseen scenarios.
Figure 42. Sensitivity analysis of the impact of various vehicle use characteristics on the fraction
of U.S. drivers whose daily travel can be satisfied with EVs for the Level 1 charging scenarios
40%
50%
60%
70%
80%
90%
100%
Base case scenario
4.8 kW ancillary
load
20% loss of batt
capacity
3% Uphill Grade for all Trips
Worst case
scenario
Frac
tion
of U
.S. t
rave
l nee
ds s
atisf
ied
by E
Vs (%
)
Base case scenario
4.8 kW ancillary
load
20% loss of batt
capacity
3% Uphill Grade for all Trips
Worst case
scenario
L1 Home, No WorkL1 Home, L1 WorkL1 Everywhere
(B) U.S. Weekend Travel(A) U.S. Weekday Travel
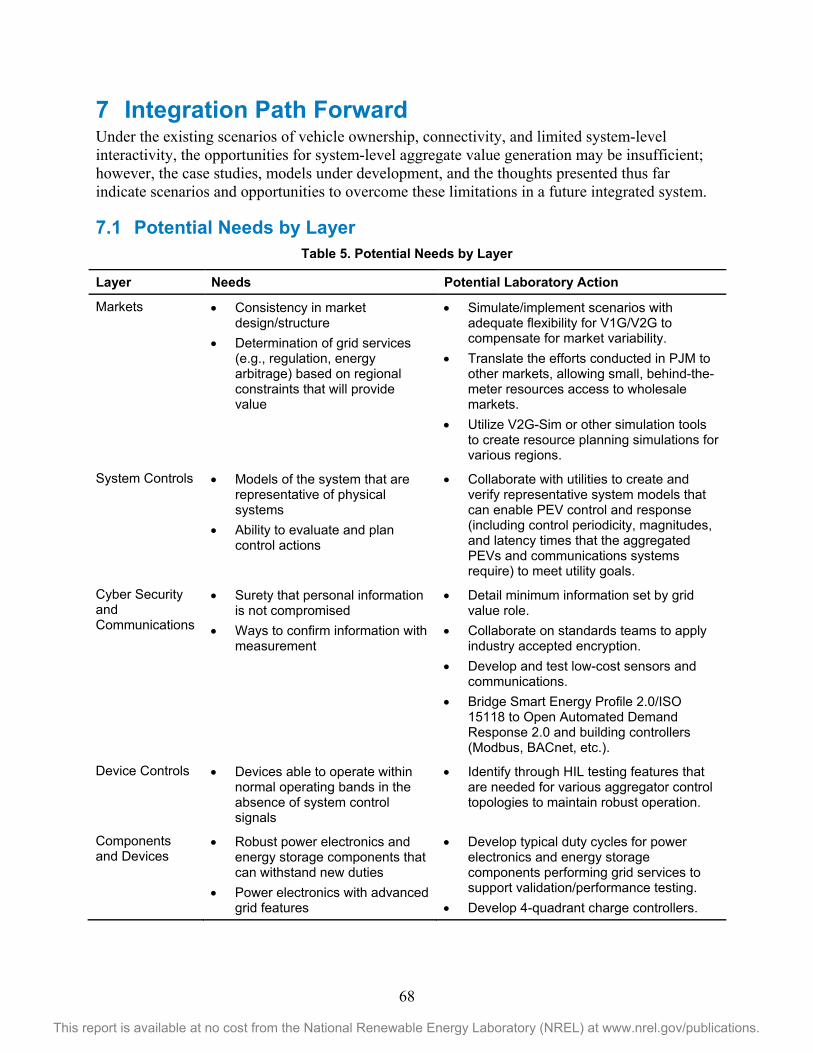
68
This report is available at no cost from the National Renewable Energy Laboratory (NREL) at www.nrel.gov/publications.
7 Integration Path Forward Under the existing scenarios of vehicle ownership, connectivity, and limited system-level interactivity, the opportunities for system-level aggregate value generation may be insufficient; however, the case studies, models under development, and the thoughts presented thus far indicate scenarios and opportunities to overcome these limitations in a future integrated system.
7.1 Potential Needs by Layer Table 5. Potential Needs by Layer
Layer Needs Potential Laboratory Action
Markets • Consistency in market design/structure
• Determination of grid services (e.g., regulation, energy arbitrage) based on regional constraints that will provide value
• Simulate/implement scenarios with adequate flexibility for V1G/V2G to compensate for market variability.
• Translate the efforts conducted in PJM to other markets, allowing small, behind-the-meter resources access to wholesale markets.
• Utilize V2G-Sim or other simulation tools to create resource planning simulations for various regions.
System Controls • Models of the system that are representative of physical systems
• Ability to evaluate and plan control actions
• Collaborate with utilities to create and verify representative system models that can enable PEV control and response (including control periodicity, magnitudes, and latency times that the aggregated PEVs and communications systems require) to meet utility goals.
Cyber Security and Communications
• Surety that personal information is not compromised
• Ways to confirm information with measurement
• Detail minimum information set by grid value role.
• Collaborate on standards teams to apply industry accepted encryption.
• Develop and test low-cost sensors and communications.
• Bridge Smart Energy Profile 2.0/ISO 15118 to Open Automated Demand Response 2.0 and building controllers (Modbus, BACnet, etc.).
Device Controls • Devices able to operate within normal operating bands in the absence of system control signals
• Identify through HIL testing features that are needed for various aggregator control topologies to maintain robust operation.
Components and Devices
• Robust power electronics and energy storage components that can withstand new duties
• Power electronics with advanced grid features
• Develop typical duty cycles for power electronics and energy storage components performing grid services to support validation/performance testing.
• Develop 4-quadrant charge controllers.
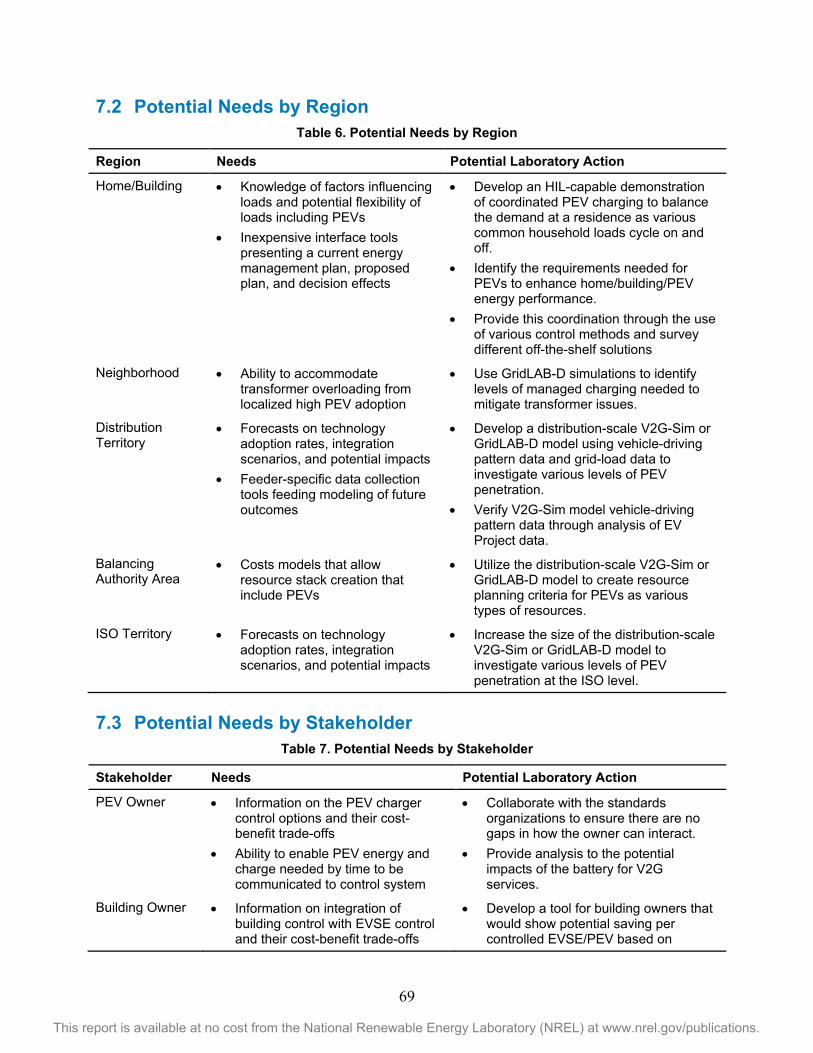
69
This report is available at no cost from the National Renewable Energy Laboratory (NREL) at www.nrel.gov/publications.
7.2 Potential Needs by Region Table 6. Potential Needs by Region
Region Needs Potential Laboratory Action
Home/Building • Knowledge of factors influencing loads and potential flexibility of loads including PEVs
• Inexpensive interface tools presenting a current energy management plan, proposed plan, and decision effects
• Develop an HIL-capable demonstration of coordinated PEV charging to balance the demand at a residence as various common household loads cycle on and off.
• Identify the requirements needed for PEVs to enhance home/building/PEV energy performance.
• Provide this coordination through the use of various control methods and survey different off-the-shelf solutions
Neighborhood • Ability to accommodate transformer overloading from localized high PEV adoption
• Use GridLAB-D simulations to identify levels of managed charging needed to mitigate transformer issues.
Distribution Territory
• Forecasts on technology adoption rates, integration scenarios, and potential impacts
• Feeder-specific data collection tools feeding modeling of future outcomes
• Develop a distribution-scale V2G-Sim or GridLAB-D model using vehicle-driving pattern data and grid-load data to investigate various levels of PEV penetration.
• Verify V2G-Sim model vehicle-driving pattern data through analysis of EV Project data.
Balancing Authority Area
• Costs models that allow resource stack creation that include PEVs
• Utilize the distribution-scale V2G-Sim or GridLAB-D model to create resource planning criteria for PEVs as various types of resources.
ISO Territory • Forecasts on technology adoption rates, integration scenarios, and potential impacts
• Increase the size of the distribution-scale V2G-Sim or GridLAB-D model to investigate various levels of PEV penetration at the ISO level.
7.3 Potential Needs by Stakeholder
Table 7. Potential Needs by Stakeholder
Stakeholder Needs Potential Laboratory Action
PEV Owner • Information on the PEV charger control options and their cost-benefit trade-offs
• Ability to enable PEV energy and charge needed by time to be communicated to control system
• Collaborate with the standards organizations to ensure there are no gaps in how the owner can interact.
• Provide analysis to the potential impacts of the battery for V2G services.
Building Owner • Information on integration of building control with EVSE control and their cost-benefit trade-offs
• Develop a tool for building owners that would show potential saving per controlled EVSE/PEV based on
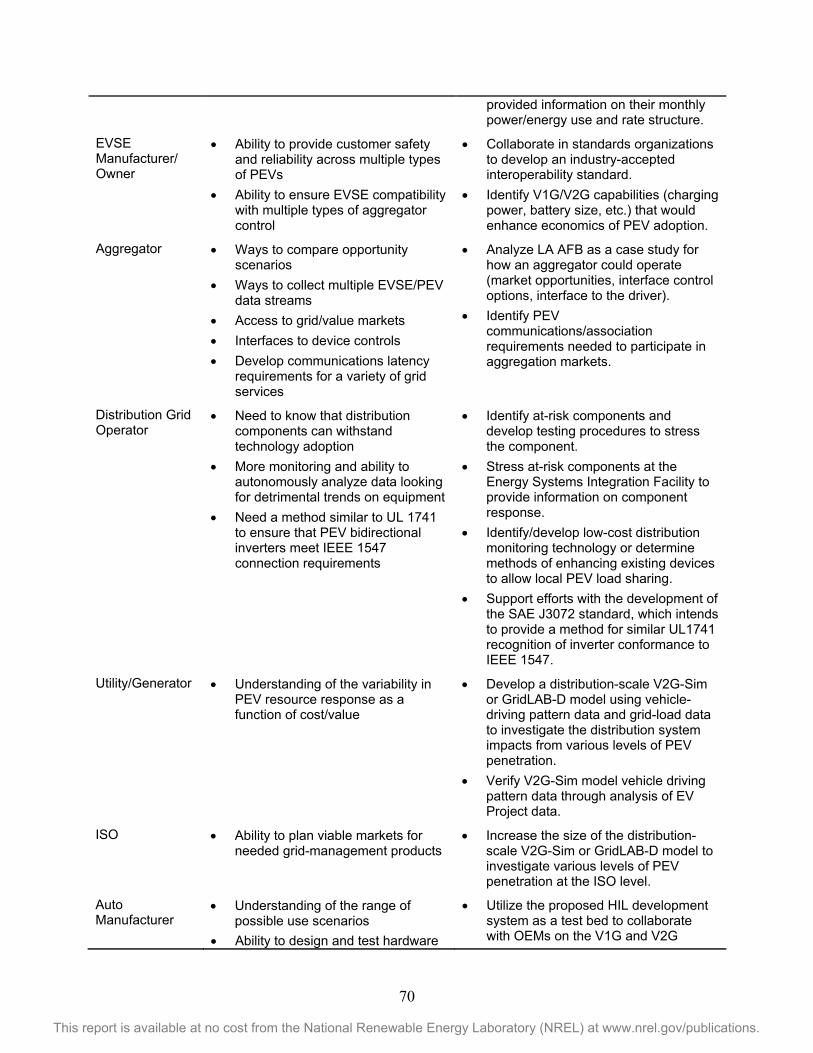
70
This report is available at no cost from the National Renewable Energy Laboratory (NREL) at www.nrel.gov/publications.
provided information on their monthly power/energy use and rate structure.
EVSE Manufacturer/ Owner
• Ability to provide customer safety and reliability across multiple types of PEVs
• Ability to ensure EVSE compatibility with multiple types of aggregator control
• Collaborate in standards organizations to develop an industry-accepted interoperability standard.
• Identify V1G/V2G capabilities (charging power, battery size, etc.) that would enhance economics of PEV adoption.
Aggregator • Ways to compare opportunity scenarios
• Ways to collect multiple EVSE/PEV data streams
• Access to grid/value markets • Interfaces to device controls • Develop communications latency
requirements for a variety of grid services
• Analyze LA AFB as a case study for how an aggregator could operate (market opportunities, interface control options, interface to the driver).
• Identify PEV communications/association requirements needed to participate in aggregation markets.
Distribution Grid Operator
• Need to know that distribution components can withstand technology adoption
• More monitoring and ability to autonomously analyze data looking for detrimental trends on equipment
• Need a method similar to UL 1741 to ensure that PEV bidirectional inverters meet IEEE 1547 connection requirements
• Identify at-risk components and develop testing procedures to stress the component.
• Stress at-risk components at the Energy Systems Integration Facility to provide information on component response.
• Identify/develop low-cost distribution monitoring technology or determine methods of enhancing existing devices to allow local PEV load sharing.
• Support efforts with the development of the SAE J3072 standard, which intends to provide a method for similar UL1741 recognition of inverter conformance to IEEE 1547.
Utility/Generator • Understanding of the variability in PEV resource response as a function of cost/value
• Develop a distribution-scale V2G-Sim or GridLAB-D model using vehicle-driving pattern data and grid-load data to investigate the distribution system impacts from various levels of PEV penetration.
• Verify V2G-Sim model vehicle driving pattern data through analysis of EV Project data.
ISO • Ability to plan viable markets for needed grid-management products
• Increase the size of the distribution-scale V2G-Sim or GridLAB-D model to investigate various levels of PEV penetration at the ISO level.
Auto Manufacturer
• Understanding of the range of possible use scenarios
• Ability to design and test hardware
• Utilize the proposed HIL development system as a test bed to collaborate with OEMs on the V1G and V2G
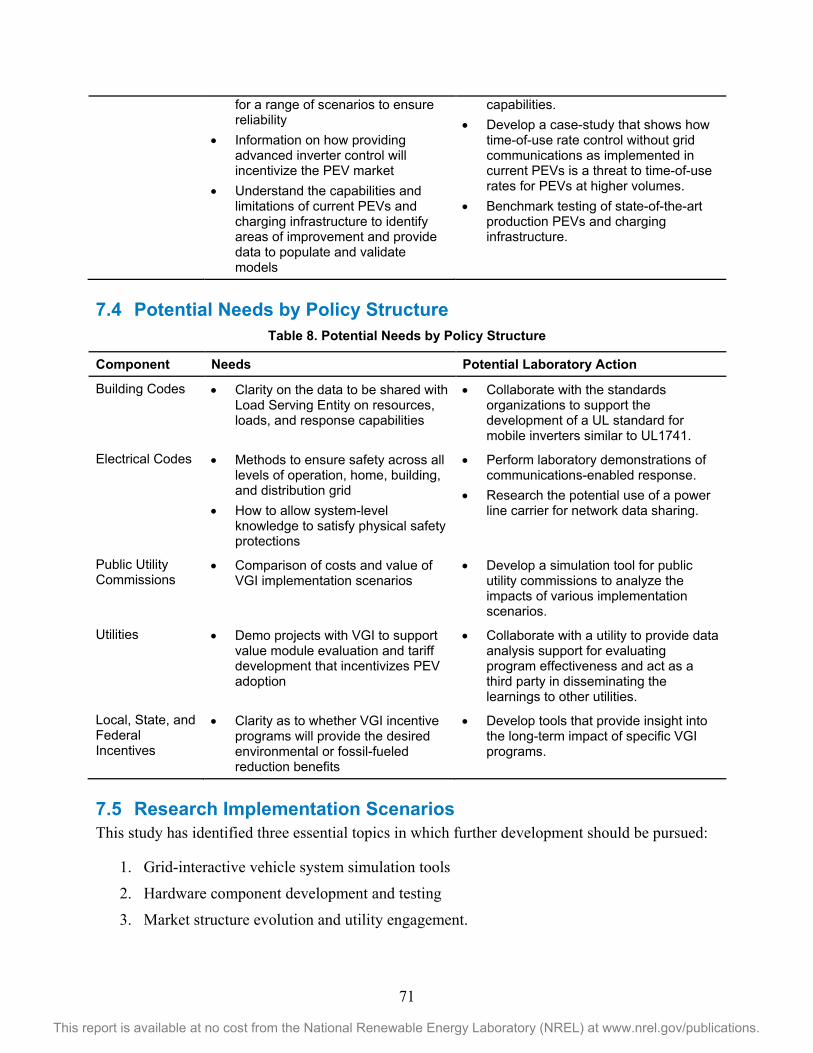
71
This report is available at no cost from the National Renewable Energy Laboratory (NREL) at www.nrel.gov/publications.
for a range of scenarios to ensure reliability
• Information on how providing advanced inverter control will incentivize the PEV market
• Understand the capabilities and limitations of current PEVs and charging infrastructure to identify areas of improvement and provide data to populate and validate models
capabilities. • Develop a case-study that shows how
time-of-use rate control without grid communications as implemented in current PEVs is a threat to time-of-use rates for PEVs at higher volumes.
• Benchmark testing of state-of-the-art production PEVs and charging infrastructure.
7.4 Potential Needs by Policy Structure
Table 8. Potential Needs by Policy Structure
Component Needs Potential Laboratory Action
Building Codes • Clarity on the data to be shared with Load Serving Entity on resources, loads, and response capabilities
• Collaborate with the standards organizations to support the development of a UL standard for mobile inverters similar to UL1741.
Electrical Codes • Methods to ensure safety across all levels of operation, home, building, and distribution grid
• How to allow system-level knowledge to satisfy physical safety protections
• Perform laboratory demonstrations of communications-enabled response.
• Research the potential use of a power line carrier for network data sharing.
Public Utility Commissions
• Comparison of costs and value of VGI implementation scenarios
• Develop a simulation tool for public utility commissions to analyze the impacts of various implementation scenarios.
Utilities • Demo projects with VGI to support value module evaluation and tariff development that incentivizes PEV adoption
• Collaborate with a utility to provide data analysis support for evaluating program effectiveness and act as a third party in disseminating the learnings to other utilities.
Local, State, and Federal Incentives
• Clarity as to whether VGI incentive programs will provide the desired environmental or fossil-fueled reduction benefits
• Develop tools that provide insight into the long-term impact of specific VGI programs.
7.5 Research Implementation Scenarios This study has identified three essential topics in which further development should be pursued:
1. Grid-interactive vehicle system simulation tools
2. Hardware component development and testing
3. Market structure evolution and utility engagement.
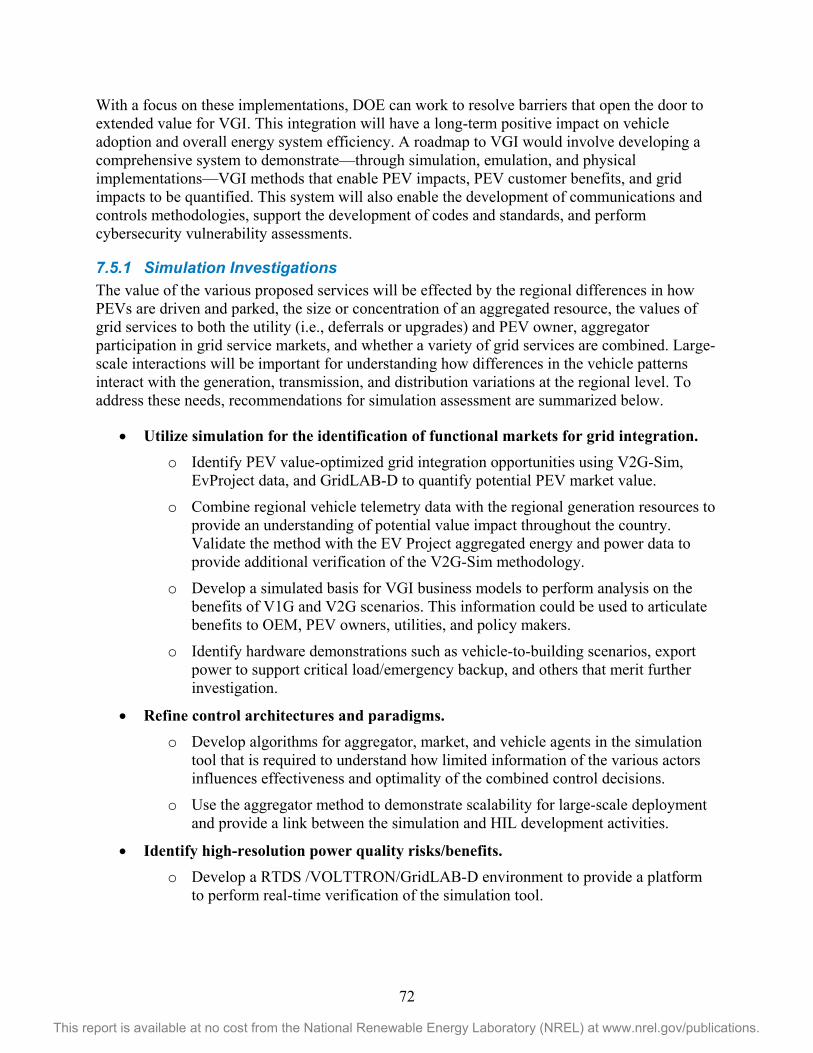
72
This report is available at no cost from the National Renewable Energy Laboratory (NREL) at www.nrel.gov/publications.
With a focus on these implementations, DOE can work to resolve barriers that open the door to extended value for VGI. This integration will have a long-term positive impact on vehicle adoption and overall energy system efficiency. A roadmap to VGI would involve developing a comprehensive system to demonstrate—through simulation, emulation, and physical implementations—VGI methods that enable PEV impacts, PEV customer benefits, and grid impacts to be quantified. This system will also enable the development of communications and controls methodologies, support the development of codes and standards, and perform cybersecurity vulnerability assessments.
7.5.1 Simulation Investigations The value of the various proposed services will be effected by the regional differences in how PEVs are driven and parked, the size or concentration of an aggregated resource, the values of grid services to both the utility (i.e., deferrals or upgrades) and PEV owner, aggregator participation in grid service markets, and whether a variety of grid services are combined. Large-scale interactions will be important for understanding how differences in the vehicle patterns interact with the generation, transmission, and distribution variations at the regional level. To address these needs, recommendations for simulation assessment are summarized below.
• Utilize simulation for the identification of functional markets for grid integration. o Identify PEV value-optimized grid integration opportunities using V2G-Sim,
EvProject data, and GridLAB-D to quantify potential PEV market value.
o Combine regional vehicle telemetry data with the regional generation resources to provide an understanding of potential value impact throughout the country. Validate the method with the EV Project aggregated energy and power data to provide additional verification of the V2G-Sim methodology.
o Develop a simulated basis for VGI business models to perform analysis on the benefits of V1G and V2G scenarios. This information could be used to articulate benefits to OEM, PEV owners, utilities, and policy makers.
o Identify hardware demonstrations such as vehicle-to-building scenarios, export power to support critical load/emergency backup, and others that merit further investigation.
• Refine control architectures and paradigms. o Develop algorithms for aggregator, market, and vehicle agents in the simulation
tool that is required to understand how limited information of the various actors influences effectiveness and optimality of the combined control decisions.
o Use the aggregator method to demonstrate scalability for large-scale deployment and provide a link between the simulation and HIL development activities.
• Identify high-resolution power quality risks/benefits. o Develop a RTDS /VOLTTRON/GridLAB-D environment to provide a platform
to perform real-time verification of the simulation tool.

73
This report is available at no cost from the National Renewable Energy Laboratory (NREL) at www.nrel.gov/publications.
o Create VOLTTRON to RTDS drivers and refine RTDS models for PEVs with V1G and V2G capability to allow for larger system simulations that leverage existing models for renewables generation and distribution system components.
o Analyze high-resolution RTDS data to identify harmonic and transient issues overlooked by simulation.
• Study the impact of dynamic WPT on vehicle and grid design. WPT technology could change the shape of electrified vehicle load profiles to which the grid would need to supply energy. As a result, continued work to understand the attributes of the grid loads will be useful. Application of these load profiles at various levels in the electricity grid and their interaction with variable renewables should be considered, because these devices could serve a secondary purpose when reduced roadway traffic occurs in the middle of the day and at night.
7.5.2 HIL Investigations From the perspective of leveraging resources and capabilities to address the potential actions detailed above, significant value can come from collaboration on HIL test systems. Individual labs can define specific scopes of focus in either hardware or software development that can be integrated.
Figure 43. Potential HIL system for component/control system optimization
Interface standards will be either a significant hurdle or an enabler for VGI. To address these needs, recommendations for standards and technology assessment are summarized below.
• Resolve conflicts at mismatched grid interfaces. Several organizations (e.g., SAE, IEEE, IEC) have independently developed standards for grid connectivity and communications. Seamless integration of devices such as EVs with a charging infrastructure that consists of legacy systems and proprietary networks will require removing the conflicts by harmonizing communications standards and/or developing adapters/translators.
Regenerative Grid Emulator
VOLTRON +SpEC module
Energy Service Provider/Aggregator Server
Demand Response(OpenADR)
Agent-based DC Charging/Discharging Controller
PEV/EVSE test data
Agent-based AC Charging/Discharging Controller
Agent-based DERControllers
Agent-based Electric LoadControllers
Sensor Signals Actuator Signals
J2847/2/3, ISO 15118 J2847/1/3, ISO 15118 IEC 61850, DNP3
EV Fleet Simulator (e.g., V2G-Sim)
Inverter
AC BusDC Bus
HIL Simulator Interface
EV/EVSEPhotovoltaics Wind
Energy storageCampus/Building EnergyManagement System
Electric loadsWeather
MODELS
PEV smart grid integration real-time simulator (Opal-RT or RTDS)
Distribution System Simulation(e.g., GridLAB-D)
74
This report is available at no cost from the National Renewable Energy Laboratory (NREL) at www.nrel.gov/publications.
• Establish control paradigms for power grid management with DERs and PEVs. Grid management with intermittent DERs and mobile PEVs with (potentially) bidirectional power flow capability is a challenge, requiring active and coordinated control to effectively manage the power grid.
o Understand communications latency, synchronicity, and error-handling requirements for stability in each specific grid service.
o Understand these communications aspects in conjunction with the various control methods (agent-based or centralized control).
• Integrate PEV-smart grid networks, building energy management, and control systems. Sensing, monitoring, and cyber security functions implemented in PEV charge and discharge systems are limited, and the AMI is not fully comprehended in PEV charge and discharge applications. Systems integration studies, pilots, and/or demonstrations that include the following would identify gaps in standards and technology at the interfaces and in control systems:
o Standardize technologies for charge and discharge control, active grid management, real-time sensing and monitoring for power grid quality and reliability.
o Use AMI to interface utilities and power consumers.
o Establish cyber security functions to protect devices and grid control systems.
• Enable technology development. o Establish adapters and protocol translators to integrate new standardized devices
with legacy systems and proprietary networks.
o Create open-source software packages for grid integration and smart charging control.
o Implement cost-effective and standardized smart meters, telemetry, and sensors.
o Test compliance procedures and verification tools for connectivity, with communications standards and interoperability.
o Prepare platforms/venues for development, testing, and verification of standard-compliant control software and devices, including:
HIL testing systems for rapid prototyping, evaluation, and optimization of components/control systems
Integrated PEV-grid system using standard control interfaces, i.e., smart bidirectional power control; agent-based distributed and active network management; real-time energy management; online monitoring for grid quality and reliability; and interfaces with utilities and customers for demand response services.
75
This report is available at no cost from the National Renewable Energy Laboratory (NREL) at www.nrel.gov/publications.
References [1] U.S. Energy Information Administration, Annual Energy Outlook 2014, DOE/EIA-0383 (Washington, DC:
2014). [2] Environmental Protection Agency, Inventory of U.S. Greenhouse Gas Emissions and Sinks: 1990–2012,
EPA 430-R-14-003 (Washington, DC: 2014). [3] J. H. Williams, A. DeBenedictis, R. Ghanadan, A. Mahone, J. Moore, W. R. Morrow, S. Price, and M. S.
Torn, “The Technology Path to Deep Greenhouse Gas Emissions Cuts by 2050: The Pivotal Role of Electricity,” Science 335, no. 6064 (2012): 53–59.
[4] DOE, Renewable Portfolio Standard Policies (Washington, DC: March 2015). Accessed April 14, 2015: www.dsireusa.org/resources/detailed-summary-maps/
[5] State of California, The California Global Warming Solutions Act of 2006, Assembly Bill 32 (2006). [6] “California Renewable Energy Overview and Programs,” California Energy Commission (2014). Accessed
October 8, 2014: http://www.energy.ca.gov/renewables/. [7] State of California, Energy Storage Systems, Assembly Bill 2514 (2010).
http://www.leginfo.ca.gov/pub/09-10/bill/asm/ab_2501-2550/ab_2514_bill_20100929_chaptered.pdf. [8] “State Zero-Emission Vehicle Programs: Memorandum of Understanding,” California Air Resources Board
(2013). Accessed December 1, 2014: http://www.arb.ca.gov/newsrel/2013/8s_zev_mou.pdf. [9] DOE, EV Everywhere Grand Challenge: Road to Success, DOE/EE-1024 (Washington, DC: 2014). [10] “Obama Administration Finalizes Historic 54.5 mpg Fuel Efficiency Standards,” U.S. National Highway
Traffic Safety Administration, August 28, 2012. Accessed November 22, 2014: http://www.nhtsa.gov/About+NHTSA/Press+Releases/2012/Obama+Administration+Finalizes+Historic+54.5+mpg+Fuel+Efficiency+Standards.
[11] E. Economy, “China’s Round Two On Electric Cars: Will It Work?” Forbes, April 18, 2014. Accessed November 22, 2014: http://www.forbes.com/sites/elizabetheconomy/2014/04/18/chinas-round-two-on-electric-cars-will-it-work/.
[12] Department of Heavy Industry, National Electric Mobility Mission Plan 2020, Government of India (2013). [13] European Parliament, “Alternative Fuel Stations: Transport Committee Backs Draft Law to Expand
Networks,” November 26, 2013. Accessed November 22, 2014: http://www.europarl.europa.eu/news/en/news-room/content/20131125IPR26108.
[14] C. Weiller, “Plug-In Hybrid Electric Vehicle Impacts on Hourly Electricity Demand in the United States,” Energy Policy 39, no. 6 (2011): 3,766–3,778.
[15] R. Liu, L. Dow, and E. Liu, “A Survey of PEV Impacts on Electric Utilities,” in Innovative Smart Grid Technologies, 2011 IEEE PES (2011): 1–8.
[16] A. Satchwel, A. D. Mills, G. Barbose, R. H. Wiser, P. Cappers and N. Darghouth, Financial Impacts of Net-Metered PV on Utilities and Ratepayers: A Scoping Study of Two Prototypical U.S. Utilities (Berkeley, CA: Lawrence Berkeley National Laboratory, 2014).
[17] W. Kempton and J. Tomić, “Vehicle-to-Grid Power Implementation: From Stabilizing the Grid to Supporting Large-Scale Renewable Energy,” Journal of Power Sources 144, no. 1 (2005): 280–294.
[18] M. D. Galus, M. G. Vayá, T. Krause, and G. Andersson, “The Role of Electric Vehicles in Smart Grids,” Wiley Interdisciplinary Reviews: Energy and Environment 2, no. 4 (2013): 384–400.
[19] J. A. P. Lopes, F. J. Soares, and P. M. R. Almeida, “Integration of Electric Vehicles in the Electric Power System,” Proc. IEEE, 99, no. 1 (2011): 168–183.
[20] “Nissan LEAF Electric Car: 100% Electric. 100% Fun,” Nissan USA. Accessed November 18, 2014: http://www.nissanusa.com/electric-cars/leaf/?next=header.vehicles.postcard.vlp.image.
[21] “New Cars, Trucks, SUVs & Hybrids: Toyota Official Site,” Toyota. Accessed November 18, 2014: www.toyota.com.
[22] S. B. Peterson, J. F. Whitacre, and J. Apt, “The Economics of Using Plug-In Hybrid Electric Vehicle Battery Packs for Grid Storage,” Journal of Power Sources, 195, no. 8 (2010): 2,377–2,384.
[23] The Economist, “The Rise of the Sharing Economy,” March 9, 2013. Accessed February 12, 2015: http://www.economist.com/news/leaders/21573104-internet-everything-hire-rise-sharing-economy.

76
This report is available at no cost from the National Renewable Energy Laboratory (NREL) at www.nrel.gov/publications.
[24] W. M. Warwick, A Primer on Electric Utilities, Deregulation, and Restructuring of U.S. Electricity Markets, PNNL-13906 (Richland, WA: Pacific Northwest National Laboratory May 2002).
[25] W. Kempton and J. Tomic, “Vehicle-to-Grid Power Fundementals: Calculating Capacity and Net Revenue,” in A Test of Vehicle-to-Grid (V2G) for Energy Storage and Frequency Regulation in the PJM System, ed. W. Kempton et al. (Newark, DE: University of Deleware, November 2008). Accessed September 5, 2014: http://www.udel.edu/V2G/resources/test-v2g-in-pjm-jan09.pdf.
[26] C. Quinn, D. Zimmerle, and T. Bradley, “The Effect of Communication Architecture on the Availability, Reliability, and Economics of Plug-In Hybrid Electric Vehicle-to-Grid Ancillary Services,” Journal of Power Sources, 195, no. 5 (March 2010): 1,500–1,509.
[27] C. White and K. Zhang, “Using Vehicle-to-Grid Technology for Frequency Regulation and Peak-Load Reduction,” Journal of Power Sources, 196, no. 8 (2011): 3,972–3,980.
[28] S. Shepard and J. Gartner, Vehicle to Grid Technologies: V2G Applications for Demand Response, Frequency Regulation, Microgrids, Virtual Power Plants, and Renewable Energy Integration (Boulder, CO: Navigant Research, 2013). Accessed September 3, 2014: http://www.navigantresearch.com/research/vehicle-to-grid-technologies.
[29] R. M. Pratt, N. M. Kintner-Meyer, and N. Stanton, PEV/Grid Integration: Value Proposition and Charging Optimization, PNNL-23801 (Richland, WA: Pacific Northwest National Laboratory, October 2014).
[30] F. Tuffner and M. Kintner-Meye, Using Electric Vehicles to Meet Balancing Requirements Associated with Wind Power, PNNL-20501 (Richland, WA: Pacific Northwest National Laboratory, June 2011).
[31] J. Foster, G. Trevino, M. Kuss, and M. Caramanis, “Plug-In Electric Vehicle and Voltage Support for Distributed Solar: Theory and Application,” IEEE Systems Journal 7, no. 4 (2013): 881–888.
[32] M. Kintner-Meyer, P. Balducci, C. Jin, T. Nguyen, M. Elizondo, V. Vishwanathan, X. Guo, and F. Tuffner, Energy Storage for Power Systems Applications: A Regional Assessment for the Northwest Power Pool (NWPP), PNNL-19300 (Richland, WA: Pacific Northwest National Laboratory, April 2010).
[33] ISO/RTO Council, Assessment of Plug-In Electric Vehicle Integration with ISO/RTO Systems (Høvik, Norway: KEMA, Inc., and ISO/RTO Council, March 2010).
[34] P. Balducci, C. Jin, D. Wu, M. Kintner-Meyer, P. Leslie, C. Daitch, and A. Marshall, Assessment of Energy Storage Alternatives in the Puget Sound Energy System—Volume 1: Financial Feasibility Analysis (Richland, WA: Pacific Northwest National Laboratory, December 2013).
[35] D. Wu, C. Jin, P. Balducci, and M. Kintner-Meyer, Assessment of Energy Storage Alternatives in the Puget Sound Energy System—Volume 2: Energy Storage Evaluation Tool (Richland, WA: Pacific Northwest National Laboratory, December 2013).
[36] W. Kempton and J. Tomić, “Vehicle-to-Grid Power Fundamentals: Calculating Capacity and Net Revenue,” Journal of Power Sources, 144, no. 1 (April 2005): 268– 279.
[37] NIST, NIST Framework and Roadmap for Smart Grid Interoperability Standards, Release 3.0 (Gathersburg, MD: February 2014). http://www.nist.gov/smartgrid/upload/NISTDraftFrameworkOct_2013.pdf.
[38] “CEN-CENELEC-ETSI Smart Grid Coordination Group: Smart Grid Reference Architecture,” SG-CG (2012).
[39] IEEE, IEEE Guide for Smart Grid Interoperability of Energy Technology and Information Technology Operation with the Electric Power System (EPS), End-Use Applications, and Loads (Pisacataway, NJ: 2011).
[40] A. Langton and N. Crisostomo, Vehicle—Grid Integration: A Vision for Zero-Emission Transportation Interconnected throughout California’s Electricity System (San Francisco, CA: California Public Utilties Commission: 2013).
[41] CAISO, California Vehicle-Grid Integration (VGI) Roadmap: Enabling Vehicle-Based Grid Services (Folsom, CA: 2014).
[42] N. Matta, R. Rahim-Amoud, L. Merghem-Boulahia, and A. Jrad, “A Cooperative Aggregation-Based Architecture for Vehicle-to-Grid Communications,” Global Information Infrastructure Symposium (GIIS), Da Nang, Vietman (2011).
[43] S. Vandael, T. Holvoet, and G. Deconinck, “A Multi-Agent System for Managing Plug-In Hybrid Vehicles as Primary Reserve Capacity in a Smart Grid,” Tenth International Conference on Autonomous Agents and Multiagent Systems (AAMAS), Taipei (2011).

77
This report is available at no cost from the National Renewable Energy Laboratory (NREL) at www.nrel.gov/publications.
[44] L. A. Wehinger, M. D. Galus, and G. R. Andersson, “Agent-Based Simulator for the German Electricity Wholesale Market Including Wind Power Generation and Widescale PREY Adoption,” 7th International Conference on the European Energy Market, Madrid (2010).
[45] L. A. Wehinger, G. Hug, M. D. Galus, and G. O. Andersson, “Assessing the Effect of Storage Devices and a PHEV Cluster on German Spot Prices by Using Model Predictive and Profit Maximizing Agents,” 17th Power Systems Computation Conference, Stockholm (2011).
[46] M. Vasirani, R. Kota, R. L. G. Cavalcante, S. Ossowski, and N. R. Jennings, “An Agent-Based Approach to Virtual Power Plants of Wind Power Generators and Electric Vehicles,” IEEE Transactions on Smart Grid 4, no. 3 (2013): 1,314–1,322.
[47] M. D. Galus and G. Andersson, “Demand Management of Grid Connected Plug-In Hybrid Electric Vehicles (PHEV),” IEEE Energy 2030, Atlanta (2008).
[48] J. Haack, B. Akyol, N. Tenney, B. Carpenter, R. Pratt, and T. Carroll, “VOLTTRON: An Agent Platform for Integrating Electric Vehicles and Smart Grid,” 2013 International Conference on Connected Vehicles and Expo (ICCVE), Las Vegas (2013).
[49] “VOLTTRON,” GitHub. https://github.com/VOLTTRON/volttron/wiki. [50] E. M. Davidson, M. J. Dolan, G. W. Ault, and S. D. J. McArthur, “AuRA-NMS: An Autonomous Regional
Active Network Management System for EDF Energy and SP Energy Networks," 2010 IEEE Power and Energy Society General Meeting, Minneapolis (2010).
[51] E. M. Davidson, S. D. J. Mcarthur, J. R. Mcdonald, and P. Taylor, “An Architecture for Flexible and Autonomous Network Management Systems,” 20th International Conference on Electricity Distribution, Prague (2009).
[52] S. Johnson, Itron Embedded Sensing: Communication, Collaboration, Control—Extending Intelligence to Grid Assets (Liberty Lake, WA: 2013). https://www.itron.com/PublishedContent/Itron_Embedded_Sensing.pdf.
[53] “IntelliGrid Program,” EPRI. http://smartgrid.epri.com/IntelliGrid.aspx. [54] EPRI, Open Interoperable AMI: A Roadmap from the Utility Perspective (Palo Alto, CA: 2013).
http://www.epri.com/abstracts/Pages/ProductAbstract.aspx?ProductId=000000003002001043. [55] “PAP12: Mapping IEEE 1815 (DNP3) to IEC 61850 Objects,” NIST (2012).
http://collaborate.nist.gov/twiki-sggrid/bin/view/SmartGrid/PAP12DNP361850#Objectives. [56] “PAP-08 CIM/61850 for Distribution Grid Management,” NIST. http://sgip.org/PAP-08-CIM/61850-for-
Distribution-Grid-Management. [57] “Welcome to the Open V2G Project,” OpenV2G. http://openv2g.sourceforge.net/. [58] S. Kazbour, SPIDERS II Vehicle to Grid Demonstrations at Fort Carson, CO.—Final Report (Warren, MI:
U.S. Army Tank Automotive Research, Development Engineering Center: 2014) (internal only). [59] M. Simpson, SPIDERS Bi-Directional Charging Station Interconnection Testing, NREL/TP-5400-60222
(Golden CO: National Renewable Energy Laboratory: 2013). [60] EPRI, “Smart Charging and Vehicle Integration: First Annual California Multi-Agency Update on Vehicle-
Grid Integration Research,” November 19, 2014. Accessed December 22, 2014: http://www.energy.ca.gov/research/notices/2014-11-19_workshop/presentations/Sunil_Chhaya_VGI_Presentation_2014-11-19.pdf.
[61] K. Fehrebacher, “The Father of Vehicle-to-Grid Charges Toward Commercialization,” Gigaom, May 13, 2010. Accessed October 29, 2014: https://gigaom.com/2010/05/13/from-research-to-reality-using-electric-vehicles-to-regulate-the-grid/.
[62] Y. Chow, “AC Propulsion Partners with BMW to Build 500 Electric Vehicles,” November 20, 2008. Accessed October 29, 2014: http://www.acpropulsion.com/pressreleases/11.20.2008%20BMW%20Press%20Release.pdf.
[63] University of Delaware, “Powering Up,” UDaily, April 27, 2013. Accessed October 29, 2014: http://www.udel.edu/udaily/2013/apr/electric-vehicles-042613.html.
[64] J. S. Johansen, Fast-Charging Electric Vehicles (Lyngby, Denmark: Technical University of Denmark: 2013).

78
This report is available at no cost from the National Renewable Energy Laboratory (NREL) at www.nrel.gov/publications.
[65] S. Kamboj, W. Kempton, and K. S. Decker, “Deploying Power Grid-Integrated Electric Vehicles as a Multiagent System,” Proc. of 10th International Conference on Autonomous Agents and Multiagent Systems 1 (2011): 13–20.
[66] S. Chakraborty, W. Kramer, B. Kroposki, G. Martin, P. McNutt, M. Kuss, T. Markel, and A. Hoke, Interim Test Procedures for Evaluating Performance and Grid Integration of Vehicle-to-Grid Applications, NREL/TP-5500-51001 (Golden, CO: National Renewable Energy Laboratory, 2011).
[67] Forward Market Operations, PJM Manual 11: Energy & Ancillary Services Market Operations (Norristown, PA: PJM, August 21, 2014). Accessed October 30, 2014: http://www.pjm.com/~/media/documents/manuals/m11.ashx.
[68] O. Onar and P.T Jones, “Impact of Wireless Power Transfer in Transportation: Future Transportation Enabler, or Near Term Distraction,” IEEE International Electric Vehicle Conference, December 16–19, 2014, Florence, Italy.
[69] Green Car Congress, “SCAQMD Funding Siemens Test of eHighway Overhead Catenary System for Electric Trucks in California,” August 2014. http://www.greencarcongress.com/2014/08/20140806-ehighway.html.
[70] Green Car Congress, “Scania and Siemens to Develop Heavy-Duty Hybrid Vehicles with Trolley-Assist; Enabling the eHighway,” March 2013. http://www.greencarcongress.com/2013/03/siemensscania-20130311.html.
[71] Viktoria Swedish ICT, “Slide-in Electric Road System,” in Conductive Project Report,” October 23 2013. https://www.viktoria.se/sites/default/files/pub/www.viktoria.se/upload/publications/slide-in_conductive_project_report_draft_phase_1_2013-10-18.pdf.
[72] M. Jurjevich, “Large-Scale, Commercial Wireless Inductive Power Transfer (WIPT) for Fixed Route Bus Rapid Transportation,” September 2014. http://electricvehicle.ieee.org/2014/09/02/large-scale-commercial-wireless-inductive-power-transfer-wipt-fixed-route-bus-rapid-transportation/.
[73] T. Markel and P. Chipman, “Electrified Roadways: A Pathway to a Clean Transportation Sector,” presented at the Clean Transportation Systems Initiative, February 2014, Washington, DC.
[74] J.M Li, P.T. Jones, O. Onar, and M.Starke, “Coupling Electric Vehicles and Power Grid through Charging –in-Motion and Connected Vehicle Technology,” IEEE International Electric Vehicle Conference, December 16–19, 2014, Florence, Italy.
[75] D. Thrimawithana, U Madawala, and Y. Shi, “Design of a Bi-Directional Inverter for a Wireless V2G System,” IEEE ICSET 2010 (December 2010).
[76] R. Carlson and B. Normann, “Test Results of the PLUGLESS Inductive Charging System from Evatran Group, Inc.,” SAE International Journal of Alternative Powertrains 3, no. 1 (2014). doi:10.4271/2014-01-1824.
[77] N. Nigro, J. Ye, and M. Frades, Assessing the Electric Vehicle Charging Network in Washington State (Arlington, VA: Center for Climate and Energy Solutions report: September 2014). Accessed December 2014: http://leg.wa.gov/JTC/Documents/Studies/EV/Task1_Final.pdf.
[78] “Number of Vehicles Per Household,” CLRChoice, Inc. (2012). http://www.CLRsearch.com. [79] T. Becker, I. Sidhu, and B. Tenderich, Electric Vehicles in the United States: A New Model with Forecasts
to 2030 (Berkeley, CA: Center for Entrepreneurship and Technology, August 24, 2009). [80] D. B. Richardson, “Electric Vehicles and the Electric Grid: A Review of Modeling Approaches, Impacts,
and Renewable Energy Integration,” Renewable Sustainable Energy Reviews 19 (2013): 247–254. [81] S. Bellekom, R. Benders, S. Pelgrom, and H. Moll, “Electric Cars and Wind Energy: Two Problems, One
Solution? A Study to Combine Wind Energy and Electric Cars in 2020 in The Netherlands,” Energy 45 (September 2012): 859–866.
[82] D. Dallinger, S. Gerda, and M. Wietschel, “Integration of Intermittent Renewable Power Supply Using Grid-Connected Vehicles—A 2030 Case Study for California and Germany,” Applied Energy 104 (2013): 666–682.
[83] C. Jin, X. Sheng, and P. Ghosh, “Optimized Electric Vehicle Charging With Intermittent Renewable Energy Sources,” IEEE Journal of Selected Topics in Signal Processing 8 (2014): 1,063–1,072.
[84] W. Liu, W. Hu, H. Lund, and Z. Chen, “Electric Vehicles and Large-Scale Integration of Wind Power—The Case of Inner Mongolia in China,” Applied Energy 104 (2013): 445–456.

79
This report is available at no cost from the National Renewable Energy Laboratory (NREL) at www.nrel.gov/publications.
[85] A. Saber and G. Venayagamoorthy, “Plug-In Vehicles and Renewable Energy Sources for Cost and Emission Reductions,” IEEE Transactions on Industrial Electronics 58 (April 2011): 1,229–1,238.
[86] DOE, 20% Wind Energy by 2030: Increasing Wind Energy’s Contribution to U.S. Electricity Supply (Golden, CO: National Renewable Energy Laboratory: July 2008. http://www.nrel.gov/docs/fy08osti/41869.pdf.
[87] DOE, 2009 Wind Technologies Market Report (Golden, CO: National Renewable Energy Laboratory: August 2010). http://www.nrel.gov/docs/fy10osti/48666.pdf.
[88] “National Household Travel Survey: 2009,” U.S. Department of Transportation (2009). [89] “Transportation Secured Data Center,” National Renewable Energy Laboratory.
http://www.nrel.gov/transportation/secure_transportation_data.html. [90] K. Fiore and S. Saxena, “A Methodology for Automatic Generation of Trip-Specific Drive Cycles,”
Applied Energy (2014). [91] “Autonomie,” Argonne National Laboratory. http://www.autonomie.net. [92] R. Carlson, H. Lohse-Busch, J. Diez, and J. and Gibbs, “The Measured Impact of Vehicle Mass on Road
Load Forces and Energy Consumption for a BEV, HEV, and ICE Vehicle,” SAE International Journal of Alternative Powertrains (2013).
[93] “Electric Vehicle Supply Equipment (EVSE) Testing,” Idaho National Laboratory. http://avt.inel.gov/evse.shtml.
[94] N. A. Chaturvedi, R. Klein, J. Christensen, J. Ahmed, and and A. Kojic, “Algorithms for Advanced Battery-Management Systems,” IEEE Control Systems Magazine 30, no. 3 (2010): 49–68.
[95] J. C. Forman, S. J. Moura, J. L. Stein, and H. K. Fathy, “Genetic Identification and Fisher Identifiability Analysis of the Doyle-Fuller-Newman Model from Experimental Cycling of a LiFePO4 Cell,” Journal of Power Sources 210 (2012): 263–275.
[96] S. J. Moura and H. Perez, “Better Batteries through Electrochemistry and Controls,” ASME Dynamic Systems and Control Magazine 2, no. 2 (2014): S15–S21.
[97] J. R. Belt, C. D. Ho, C. G. Motloch, T. J. Miller, and T. Q. Duong, “A Capacity and Power Fade Study of Li-Ion Cells During Life Cycle Testing,” Journal of Power Sources 123, no. 2 (2003): 241–246.
[98] B. Liaw, R. Jungst, G. Nagasubramanian, H. Case, and D. H. Doughty, “Modeling Capacity Fade in Lithium-Ion Cells,” Journal of Power Sources 140, no. 1 (2005): 157–161.
[99] J. Wang, P. Liu, J. Hicks-Garner, E. Sherman, S. Soukiazian, M. Verbrugge, H. Tataria, J. Musser, and P. Finamore, “Cycle-Life Model for Graphite-LiFePO4 Cells,” Journal of Power Sources 196, no. 8 (2011): 3,942–3,948.
[100] P. Liu, J. Wang, J. Hicks-Garner, E. Sherman, S. Soukiazian, M. Verbrugge, H. Tataria, J. Musser, and P. Finamore, “Aging Mechanisms of LiFEPO4 Batteries Deduced by Electrochemical and Structural Analysis,” Journal of the Electrochemical Society 157, no. 4 (2010): A499–A507.
[101] Y. Zhang, C-Y Wang, and X. Tang, “Cycling Degradation of an Automotive LiFePO4 Lithium-Ion Battery,” Journal of Power Sources 196, no. 3 (2011): 1,513–1,520.
[102] J. Shim, R. Kostecki, T. Richardson, X Song, and K. A Striebel, “Electrochemical Analysis for Cycle Performance and Capacity Fading of a Lithium-Ion Battery Cycled at Elevated Temperature,” Journal of Power Sources 112, no. 1 (2002): 222–230.
[103] J. Vetter, P. Novák, M. R. Wagner, C. Veit, K.-C. Möller, J. O. Besenhard, M. Winter, M. Wohlfahrt-Mehrens, C. Vogler, and A. Hammouche, “Ageing Mechanisms in Lithium-Ion Batteries,” Journal of Power Sources 147, no. 1–2 (2005): 269–281.
[104] A. Eddahech, O. Briat, E. Woirgard, and J.M. Vinassa, “Remaining Useful Life Prediction of Lithium Batteries in Calendar Ageing for Automotive Applications,” Microelectronics Reliability 52, no. 9–10 (2012): 2,438–2,442.
[105] S. Sankarasubramanian and B. Krishnamurthy, “A Capacity Fade Model for Lithium-Ion Batteries Including Diffusion and Kinetics,” Electrochimica Acta 70 (2012): 248–254.
[106] S. B. Peterson, J. Apt, and J. F. Whitacre, “Lithium-Ion Battery Cell Degradation Resulting from Realistic Vehicle and Vehicle-to-Grid Utilization,” Journal of Power Sources 195, no. 8 (2010): 2,385–2,392.
[107] A. M. Colclasure, K. A. Smith, and R. J. Kee, “Modeling Detailed Chemistry and Transport for Solid-Electrolyte-Interface (SEI) Films in Li-Ion Batteries,” Electrochemica Acta 58 (2011): 33–43.

80
This report is available at no cost from the National Renewable Energy Laboratory (NREL) at www.nrel.gov/publications.
[108] K. Smith, T. Markel, and A. Pesaran, “PHEV Battery Trade-Off Study and Standby Thermal Control,” NREL/PR-540-45048, presentation at the 26th International Battery Seminar and Exhibit (Golden, CO: National Renewable Energy Laboratory, 2009).
[109] K. Smith, G-H Kim, and A Pesaran, “Modeling of Nonuniform Degradation in Large-Format Li-Ion Batteries,” NREL/PO-540-46041, poster at the Advanced Automotive Battery and EC Capacitor Conference (Golden, CO: National Renewable Energy Laboratory, 2009).
[110] K. Smith, G-H Kim, and A. Pesaran, “Modeling of Nonuniform Degradation in Large-Format Li-Ion Batteries,” NREL/PR-540-46031, presentation at the 215th Electrochemical Society Meeting (Golden, CO: National Renewable Energy Laboratory, 2009).
[111] “2012 Key World Energy Statistics,” International Energy Agency. http://www.iea.org/publications/freepublications/publication/kwes.pdf.
[112] “California Renewables Portfolio Standard,” California Public Utilities Commission. http://www.cpuc.ca.gov/PUC/energy/Renewables/.
[113] “Demand Response and Energy Efficiency Roadmap: Maximizing Preferred Resources,” California Independent System Operator. http://www.caiso.com/Documents/DR-EERoadmap.pdf.
[114] California Energy Commission, 2014–2024 Revised Forecast: Volume 1: Statewide Electricity Demand, End-User Natural Gas Demand, and Energy Efficiency (Sacramento, CA: September 2013). http://www.energy.ca.gov/2013publications/CEC-200-2013-004/CEC_200-2013-004-SD-V1-REV.pdf.
[115] S. Saxena, J. MacDonald, D. Black, and S. Kiliccote, “Quantifying the Flexibility for Electric Vehicles to Offer Demand Response to Reduce Grid Impacts Without Compromising Individual Driver Mobility Needs,” SAE 2015-01-0304, 2015 SAE World Congress (2015).
[116] S. Saxena, C. Le Floch, J. MacDonald, and S.Moura, “Quantifying EV Battery End-of-Life through Analysis of Travel Needs with Vehicle Powertrain Models,” Journal of Power Sources 282 (2015): 265–276.