mtg q12013 presentation final
Post on 21-Oct-2014
8.623 views
DESCRIPTION
TRANSCRIPT

1
First Quarter 2013
Financial Results
2
Forward looking statements
Forward-looking information and Safe Harbour Statement under the U.S. Private Securities Litigation
Reform Act of 1995
This report contains forward-looking information based on the current expectation of MTG management.
Although management deems that the expectations presented by such forward-looking information are
reasonable, such forward-looking information is subject to risks and uncertainties and no guarantee can be
given that these expectations will prove correct. Accordingly, the actual future outcome could vary considerably
when compared to what is stated in the forward-looking information, due to such factors as described above in
the Risks & Uncertainties section.
3
Strong Growth in
Emerging Markets
4
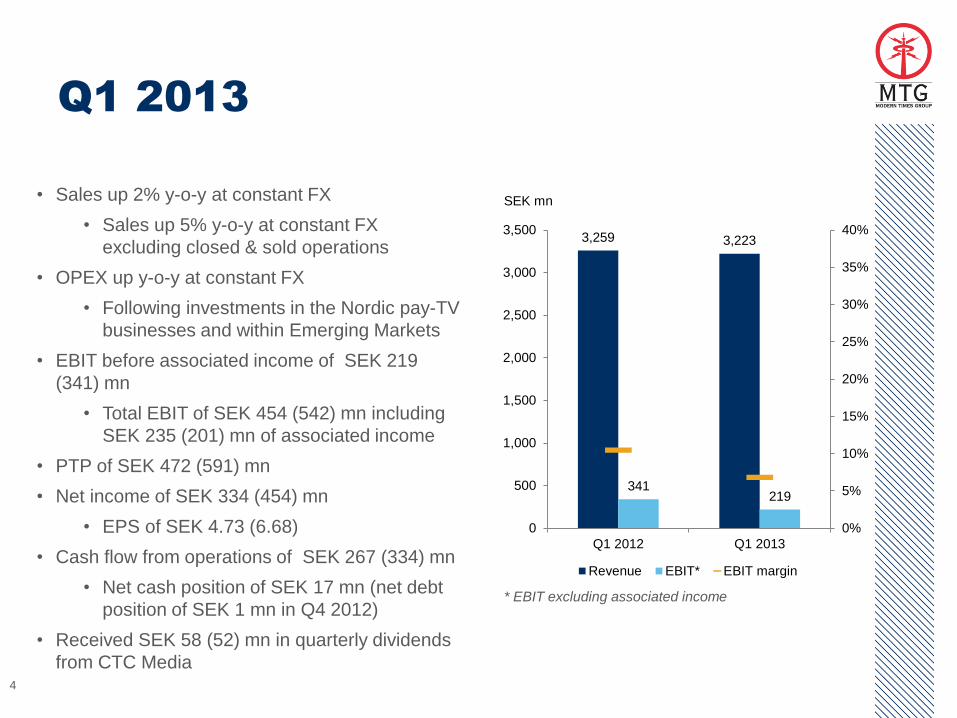
Q1 2013
• Sales up 2% y-o-y at constant FX
• Sales up 5% y-o-y at constant FX
excluding closed & sold operations
• OPEX up y-o-y at constant FX
• Following investments in the Nordic pay-TV
businesses and within Emerging Markets
• EBIT before associated income of SEK 219
(341) mn
• Total EBIT of SEK 454 (542) mn including
SEK 235 (201) mn of associated income
• PTP of SEK 472 (591) mn
• Net income of SEK 334 (454) mn
• EPS of SEK 4.73 (6.68)
• Cash flow from operations of SEK 267 (334) mn
• Net cash position of SEK 17 mn (net debt
position of SEK 1 mn in Q4 2012)
• Received SEK 58 (52) mn in quarterly dividends
from CTC Media
SEK mn
* EBIT excluding associated income
3,259 3,223
341 219
0%
5%
10%
15%
20%
25%
30%
35%
40%
0
500
1,000
1,500
2,000
2,500
3,000
3,500
Q1 2012 Q1 2013
Revenue EBIT* EBIT margin
Forward Expectations
As previously announced, the Group continues to expect its Nordic pay-TV business to
grow its revenues at constant exchange rates in 2013, and to report an operating (EBIT)
margin of approximately 10-12% for the full year 2013. The segment margin is expected
to increase in 2014.
The Group also continues to expect its Emerging Market pay-TV operations to achieve a
breakeven EBIT result for the full year 2013 with rising profitability levels in 2014.
5
6
Operating Review
7
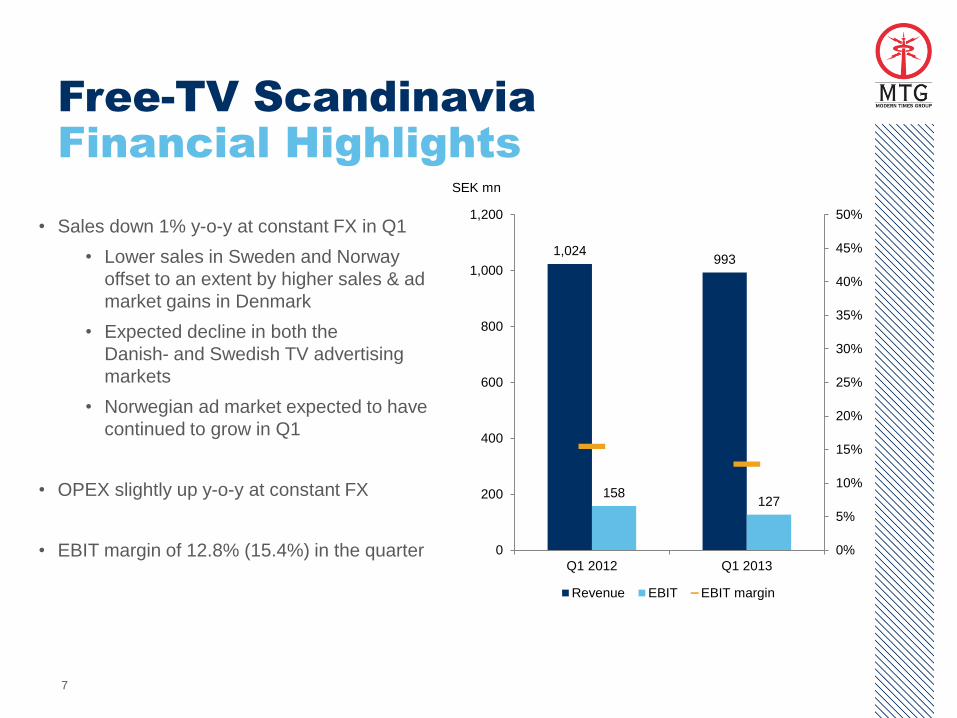
Free-TV Scandinavia
Financial Highlights
• Sales down 1% y-o-y at constant FX in Q1
• Lower sales in Sweden and Norway
offset to an extent by higher sales & ad
market gains in Denmark
• Expected decline in both the
Danish- and Swedish TV advertising
markets
• Norwegian ad market expected to have
continued to grow in Q1
• OPEX slightly up y-o-y at constant FX
• EBIT margin of 12.8% (15.4%) in the quarter
SEK mn
1,024 993
158 127
0%
5%
10%
15%
20%
25%
30%
35%
40%
45%
50%
0
200
400
600
800
1,000
1,200
Q1 2012 Q1 2013
Revenue EBIT EBIT margin
8
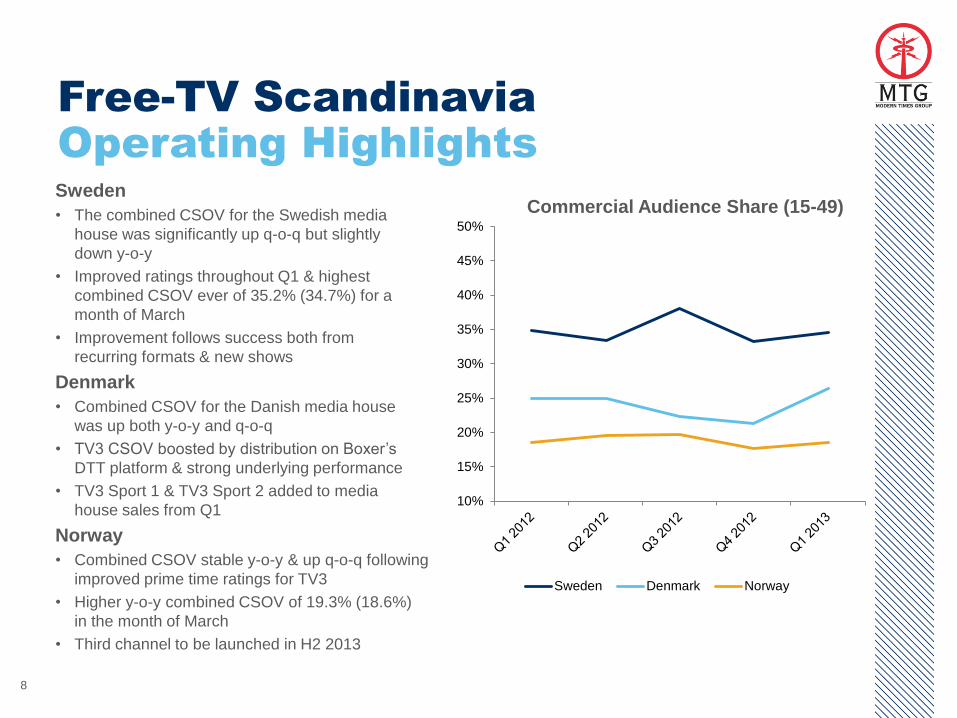
Free-TV Scandinavia
Operating Highlights
Sweden
• The combined CSOV for the Swedish media
house was significantly up q-o-q but slightly
down y-o-y
• Improved ratings throughout Q1 & highest
combined CSOV ever of 35.2% (34.7%) for a
month of March
• Improvement follows success both from
recurring formats & new shows
Denmark
• Combined CSOV for the Danish media house
was up both y-o-y and q-o-q
• TV3 CSOV boosted by distribution on Boxer’s
DTT platform & strong underlying performance
• TV3 Sport 1 & TV3 Sport 2 added to media
house sales from Q1
Norway
• Combined CSOV stable y-o-y & up q-o-q following
improved prime time ratings for TV3
• Higher y-o-y combined CSOV of 19.3% (18.6%)
in the month of March
• Third channel to be launched in H2 2013
Commercial Audience Share (15-49)
10%
15%
20%
25%
30%
35%
40%
45%
50%
Sweden Denmark Norway
9 9
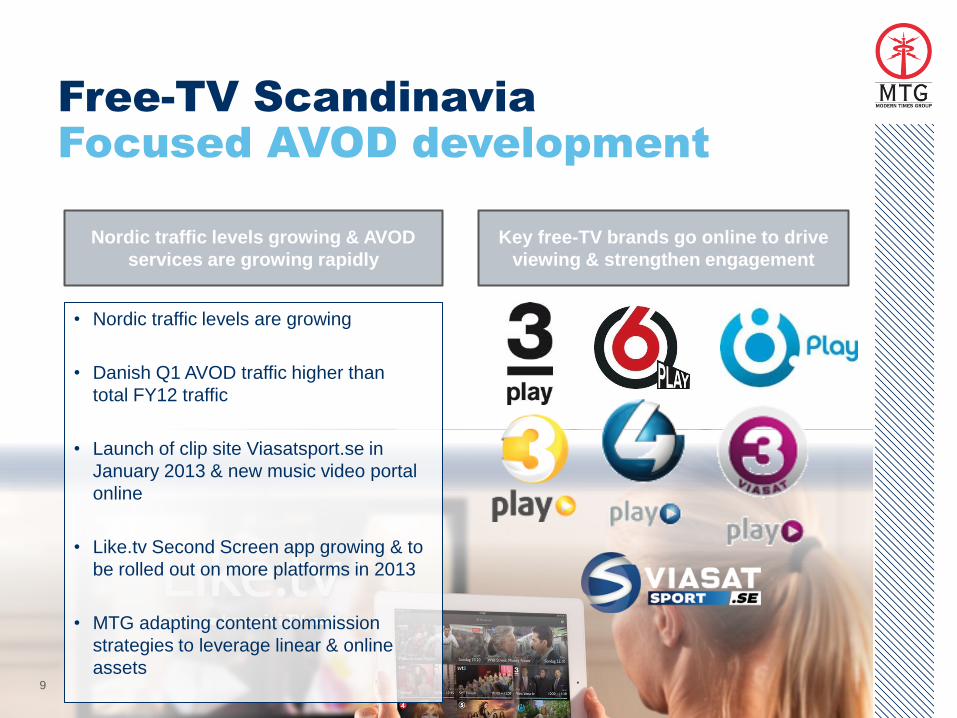
Nordic traffic levels growing & AVOD
services are growing rapidly
Key free-TV brands go online to drive
viewing & strengthen engagement
Free-TV Scandinavia
Focused AVOD development
• Nordic traffic levels are growing
• Danish Q1 AVOD traffic higher than
total FY12 traffic
• Launch of clip site Viasatsport.se in
January 2013 & new music video portal
online
• Like.tv Second Screen app growing & to
be rolled out on more platforms in 2013
• MTG adapting content commission
strategies to leverage linear & online
assets
10
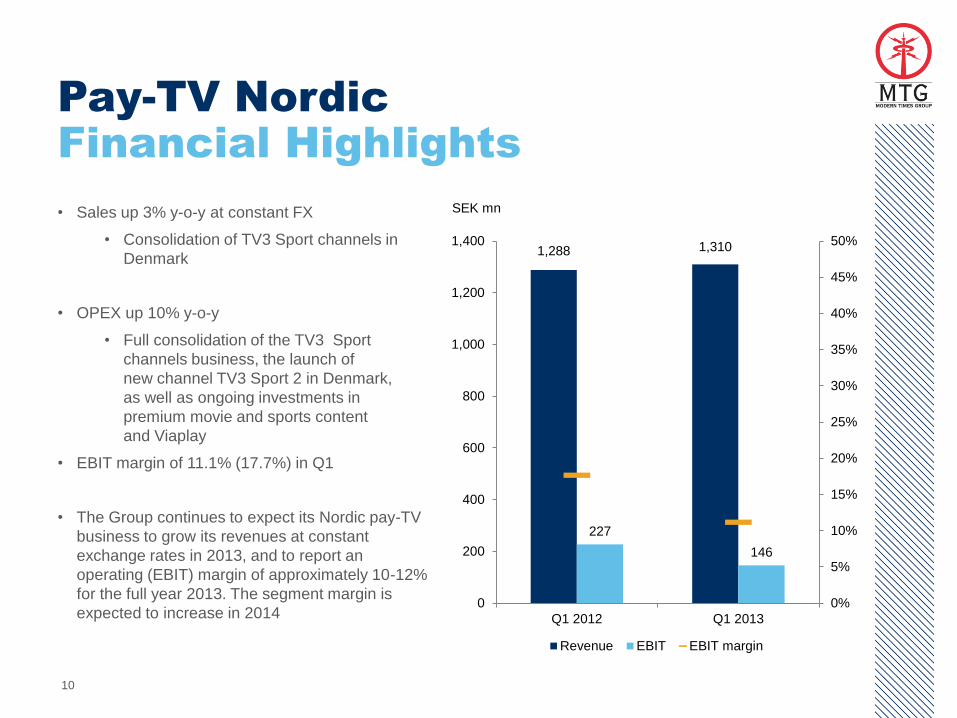
Pay-TV Nordic
Financial Highlights
• Sales up 3% y-o-y at constant FX
• Consolidation of TV3 Sport channels in
Denmark
• OPEX up 10% y-o-y
• Full consolidation of the TV3 Sport
channels business, the launch of
new channel TV3 Sport 2 in Denmark,
as well as ongoing investments in
premium movie and sports content
and Viaplay
• EBIT margin of 11.1% (17.7%) in Q1
• The Group continues to expect its Nordic pay-TV
business to grow its revenues at constant
exchange rates in 2013, and to report an
operating (EBIT) margin of approximately 10-12%
for the full year 2013. The segment margin is
expected to increase in 2014
SEK mn
1,288 1,310
227
146
0%
5%
10%
15%
20%
25%
30%
35%
40%
45%
50%
0
200
400
600
800
1,000
1,200
1,400
Q1 2012 Q1 2013
Revenue EBIT EBIT margin
11
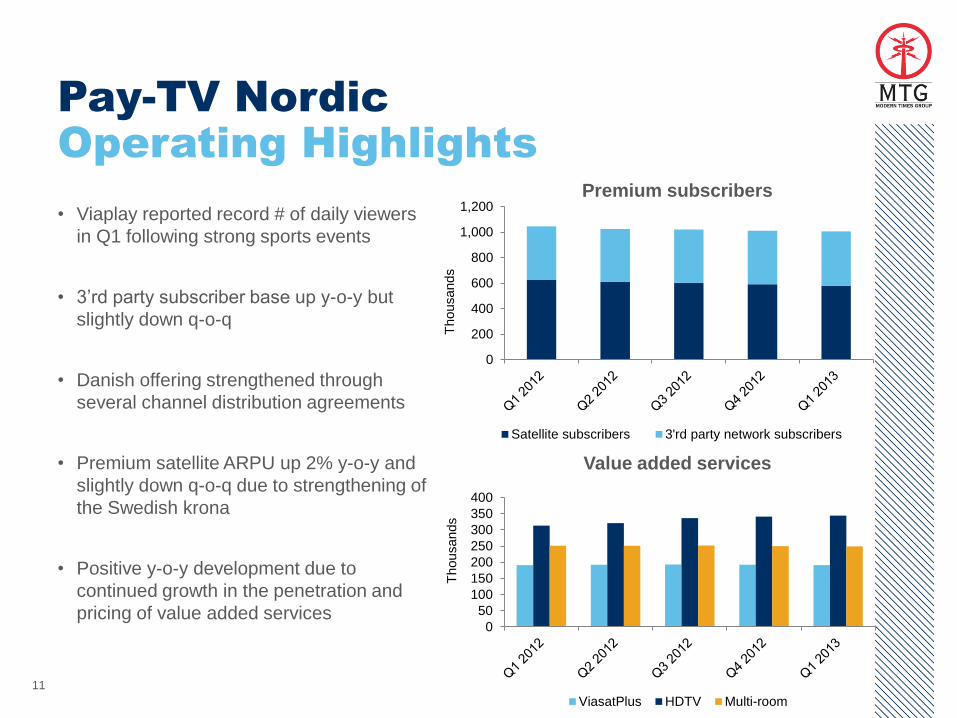
Pay-TV Nordic
Operating Highlights
• Viaplay reported record # of daily viewers
in Q1 following strong sports events
• 3’rd party subscriber base up y-o-y but
slightly down q-o-q
• Danish offering strengthened through
several channel distribution agreements
• Premium satellite ARPU up 2% y-o-y and
slightly down q-o-q due to strengthening of
the Swedish krona
• Positive y-o-y development due to
continued growth in the penetration and
pricing of value added services
Thousands
Thousands
Premium subscribers
Value added services
0
200
400
600
800
1,000
1,200
Satellite subscribers 3'rd party network subscribers
0
50
100
150
200
250
300
350
400
ViasatPlus HDTV Multi-room
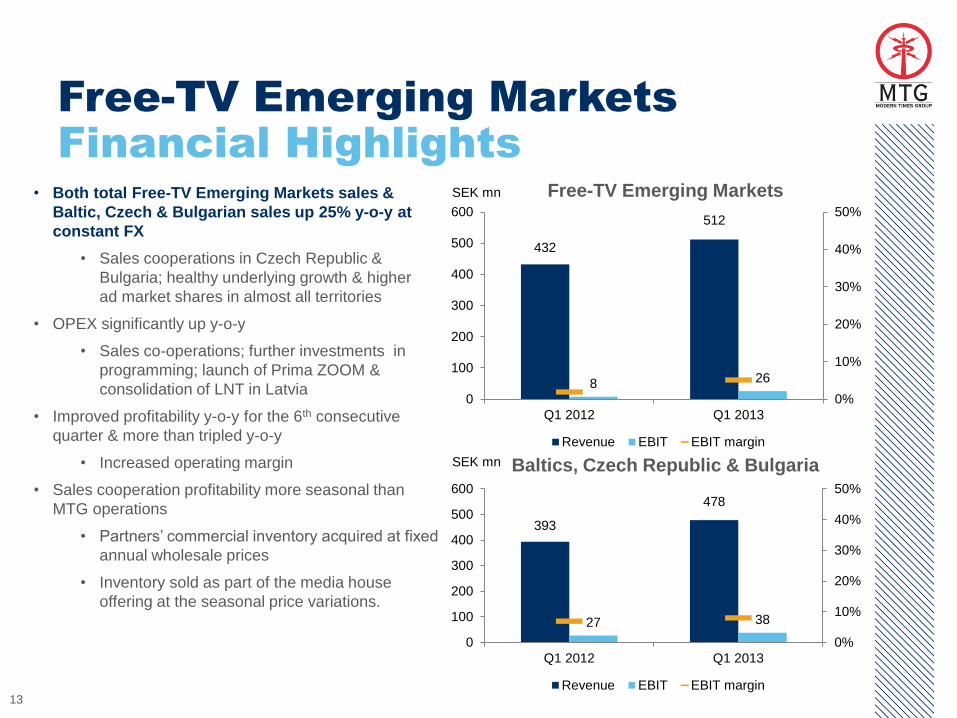
• Both total Free-TV Emerging Markets sales &
Baltic, Czech & Bulgarian sales up 25% y-o-y at
constant FX
• Sales cooperations in Czech Republic &
Bulgaria; healthy underlying growth & higher
ad market shares in almost all territories
• OPEX significantly up y-o-y
• Sales co-operations; further investments in
programming; launch of Prima ZOOM &
consolidation of LNT in Latvia
• Improved profitability y-o-y for the 6th consecutive
quarter & more than tripled y-o-y
• Increased operating margin
• Sales cooperation profitability more seasonal than
MTG operations
• Partners’ commercial inventory acquired at fixed
annual wholesale prices
• Inventory sold as part of the media house
offering at the seasonal price variations.
13
Free-TV Emerging Markets
Financial Highlights
Free-TV Emerging Markets
Baltics, Czech Republic & Bulgaria
SEK mn
SEK mn
432
512
8 26
0%
10%
20%
30%
40%
50%
0
100
200
300
400
500
600
Q1 2012 Q1 2013
Revenue EBIT EBIT margin
393
478
27 38
0%
10%
20%
30%
40%
50%
0
100
200
300
400
500
600
Q1 2012 Q1 2013
Revenue EBIT EBIT margin
14
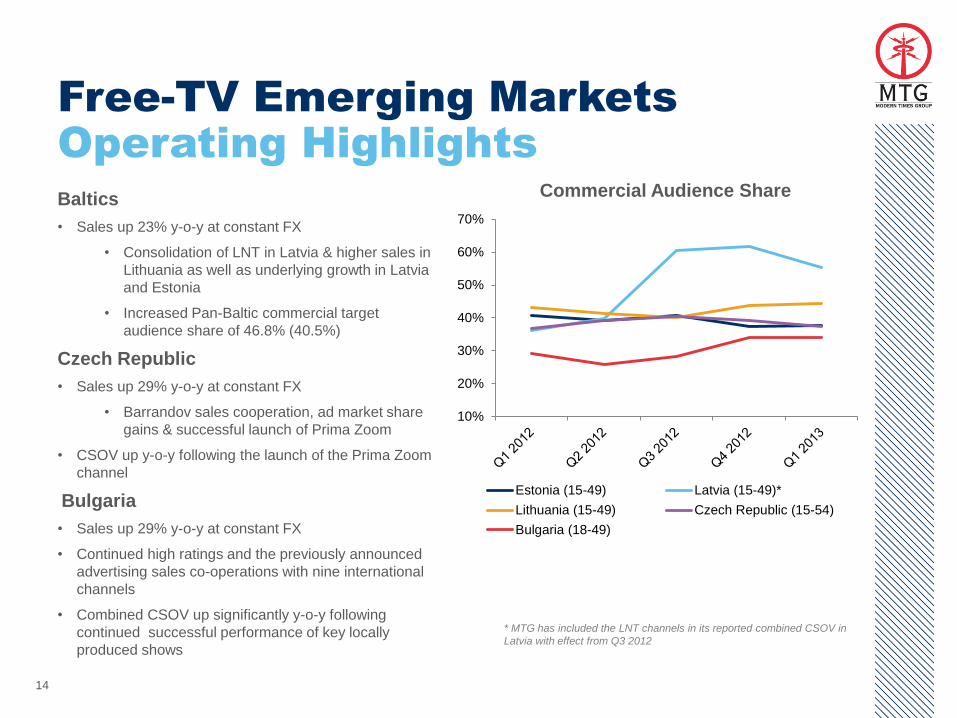
Free-TV Emerging Markets
Operating Highlights
Baltics
• Sales up 23% y-o-y at constant FX
• Consolidation of LNT in Latvia & higher sales in
Lithuania as well as underlying growth in Latvia
and Estonia
• Increased Pan-Baltic commercial target
audience share of 46.8% (40.5%)
Czech Republic
• Sales up 29% y-o-y at constant FX
• Barrandov sales cooperation, ad market share
gains & successful launch of Prima Zoom
• CSOV up y-o-y following the launch of the Prima Zoom
channel
Bulgaria
• Sales up 29% y-o-y at constant FX
• Continued high ratings and the previously announced
advertising sales co-operations with nine international
channels
• Combined CSOV up significantly y-o-y following
continued successful performance of key locally
produced shows
Commercial Audience Share
* MTG has included the LNT channels in its reported combined CSOV in
Latvia with effect from Q3 2012
10%
20%
30%
40%
50%
60%
70%
Estonia (15-49) Latvia (15-49)*
Lithuania (15-49) Czech Republic (15-54)
Bulgaria (18-49)
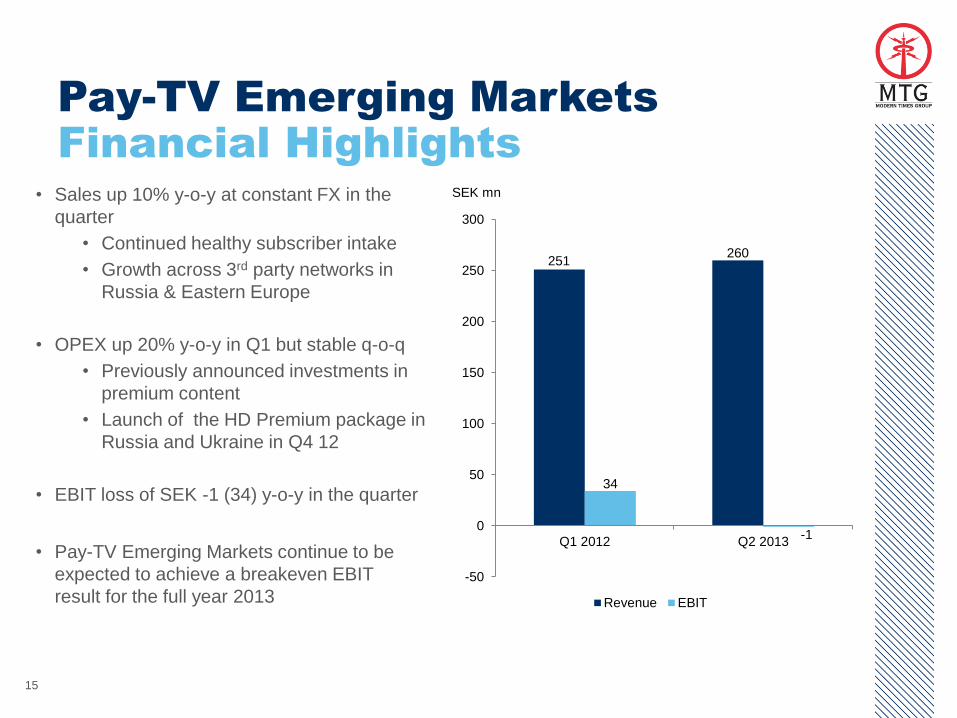
• Sales up 10% y-o-y at constant FX in the
quarter
• Continued healthy subscriber intake
• Growth across 3rd party networks in
Russia & Eastern Europe
• OPEX up 20% y-o-y in Q1 but stable q-o-q
• Previously announced investments in
premium content
• Launch of the HD Premium package in
Russia and Ukraine in Q4 12
• EBIT loss of SEK -1 (34) y-o-y in the quarter
• Pay-TV Emerging Markets continue to be
expected to achieve a breakeven EBIT
result for the full year 2013
15
Pay-TV Emerging Markets
Financial Highlights
SEK mn
251 260
34
-1
-50
0
50
100
150
200
250
300
Q1 2012 Q2 2013
Revenue EBIT
16
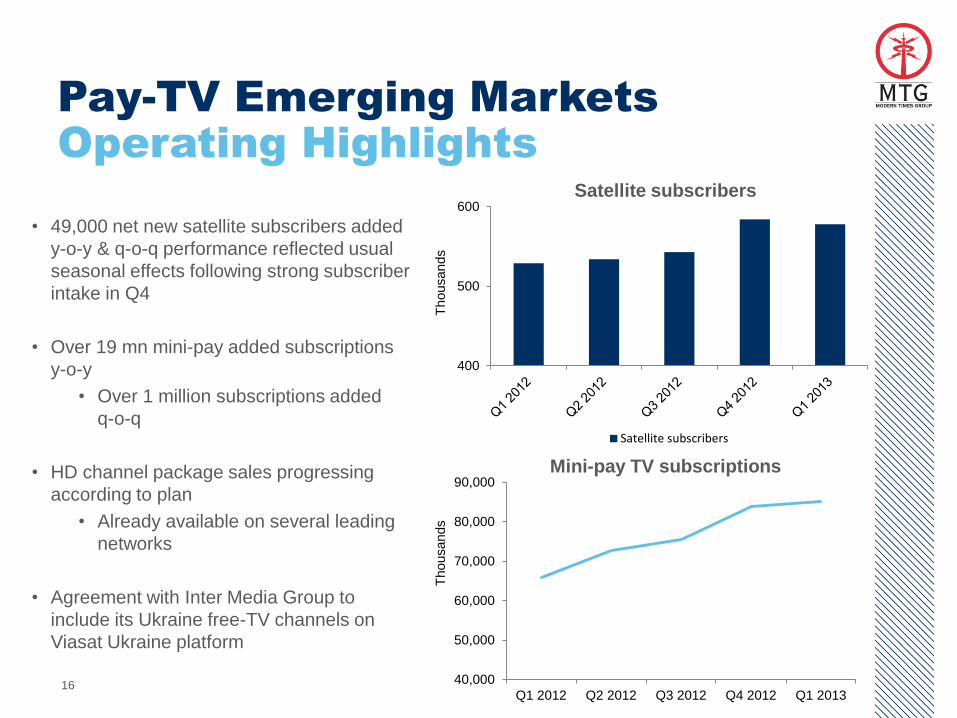
Pay-TV Emerging Markets
Operating Highlights
• 49,000 net new satellite subscribers added
y-o-y & q-o-q performance reflected usual
seasonal effects following strong subscriber
intake in Q4
• Over 19 mn mini-pay added subscriptions
y-o-y
• Over 1 million subscriptions added
q-o-q
• HD channel package sales progressing
according to plan
• Already available on several leading
networks
• Agreement with Inter Media Group to
include its Ukraine free-TV channels on
Viasat Ukraine platform
Satellite subscribers
Mini-pay TV subscriptions
Thousands
Thousands
400
500
600
Satellite subscribers
40,000
50,000
60,000
70,000
80,000
90,000
Q1 2012 Q2 2012 Q3 2012 Q4 2012 Q1 2013
0
2
4
6
8
10
12
14
16
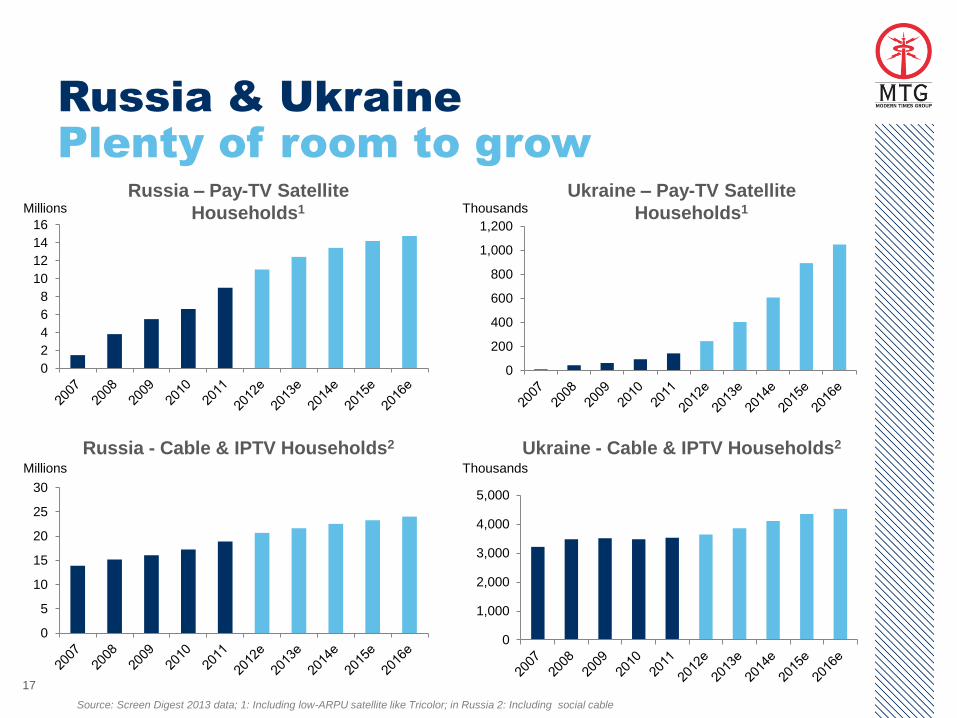
Russia & Ukraine
Plenty of room to grow
17
Millions
Russia – Pay-TV Satellite
Households1
Russia - Cable & IPTV Households2
0
5
10
15
20
25
30
Millions
Ukraine – Pay-TV Satellite
Households1
Ukraine - Cable & IPTV Households2
0
200
400
600
800
1,000
1,200
Thousands
Thousands
0
1,000
2,000
3,000
4,000
5,000
Source: Screen Digest 2013 data; 1: Including low-ARPU satellite like Tricolor; in Russia 2: Including social cable
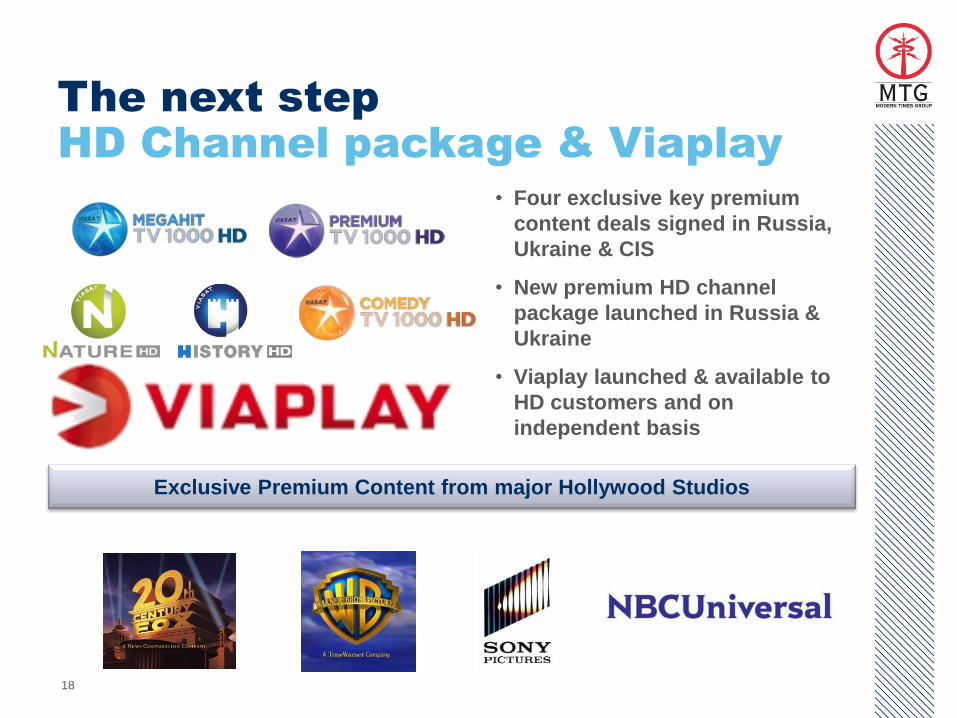
The next step
HD Channel package & Viaplay
18
• Four exclusive key premium
content deals signed in Russia,
Ukraine & CIS
• New premium HD channel
package launched in Russia &
Ukraine
• Viaplay launched & available to
HD customers and on
independent basis
Exclusive Premium Content from major Hollywood Studios
19
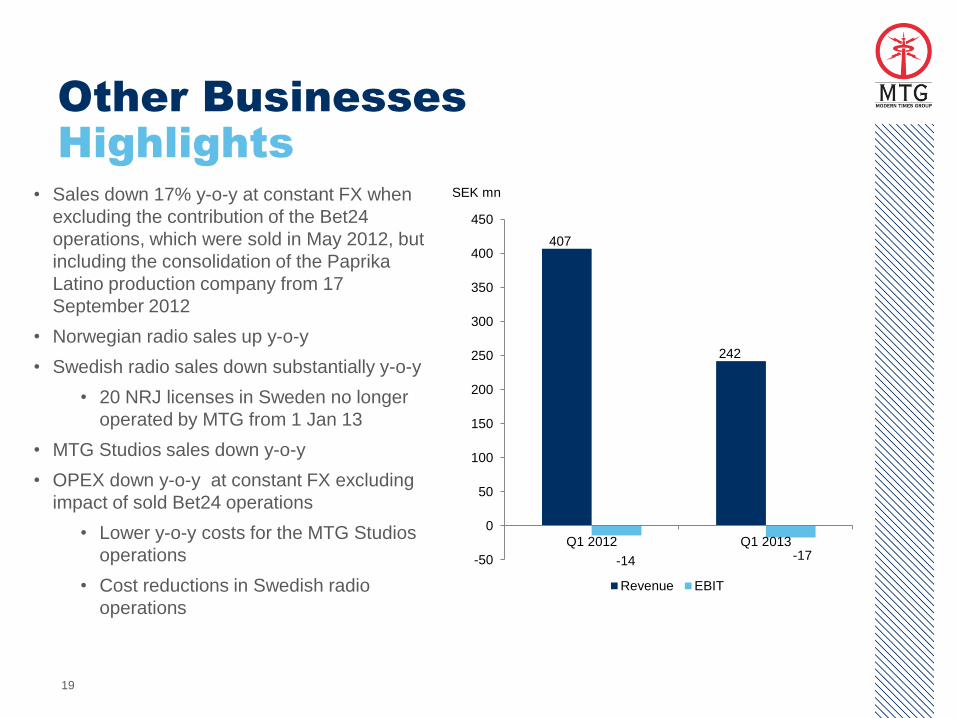
Other Businesses
Highlights
• Sales down 17% y-o-y at constant FX when
excluding the contribution of the Bet24
operations, which were sold in May 2012, but
including the consolidation of the Paprika
Latino production company from 17
September 2012
• Norwegian radio sales up y-o-y
• Swedish radio sales down substantially y-o-y
• 20 NRJ licenses in Sweden no longer
operated by MTG from 1 Jan 13
• MTG Studios sales down y-o-y
• OPEX down y-o-y at constant FX excluding
impact of sold Bet24 operations
• Lower y-o-y costs for the MTG Studios
operations
• Cost reductions in Swedish radio
operations
SEK mn
407
242
-14 -17 -50
0
50
100
150
200
250
300
350
400
450
Q1 2012 Q1 2013
Revenue EBIT
20
Financial Review
21
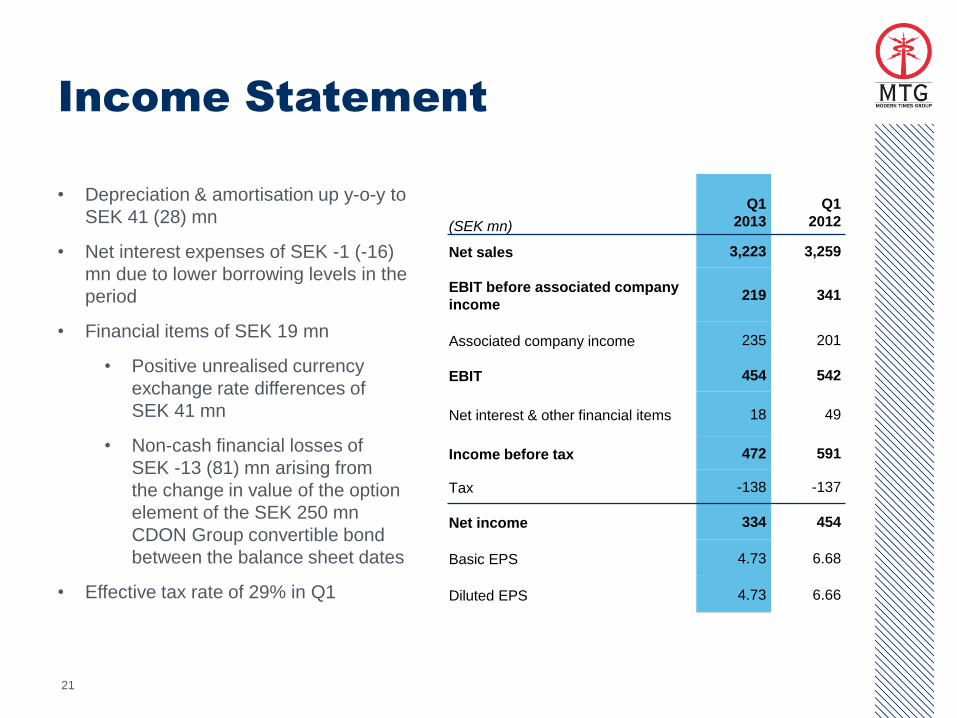
Income Statement
• Depreciation & amortisation up y-o-y to
SEK 41 (28) mn
• Net interest expenses of SEK -1 (-16)
mn due to lower borrowing levels in the
period
• Financial items of SEK 19 mn
• Positive unrealised currency
exchange rate differences of
SEK 41 mn
• Non-cash financial losses of
SEK -13 (81) mn arising from
the change in value of the option
element of the SEK 250 mn
CDON Group convertible bond
between the balance sheet dates
• Effective tax rate of 29% in Q1
(SEK mn)
Q1
2013
Q1
2012
Net sales 3,223 3,259
EBIT before associated company
income 219 341
Associated company income 235 201
EBIT 454 542
Net interest & other financial items 18 49
Income before tax 472 591
Tax -138 -137
Net income 334 454
Basic EPS 4.73 6.68
Diluted EPS 4.73 6.66
22
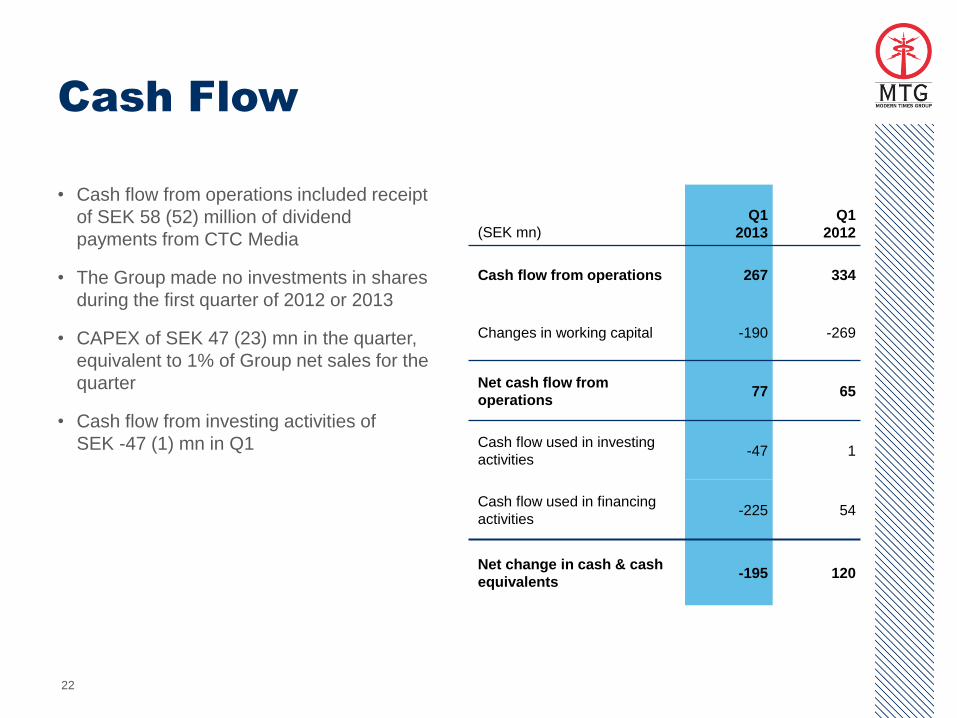
Cash Flow
• Cash flow from operations included receipt
of SEK 58 (52) million of dividend
payments from CTC Media
• The Group made no investments in shares
during the first quarter of 2012 or 2013
• CAPEX of SEK 47 (23) mn in the quarter,
equivalent to 1% of Group net sales for the
quarter
• Cash flow from investing activities of
SEK -47 (1) mn in Q1
(SEK mn)
Q1
2013
Q1
2012
Cash flow from operations 267 334
Changes in working capital -190 -269
Net cash flow from
operations 77 65
Cash flow used in investing
activities -47 1
Cash flow used in financing
activities -225 54
Net change in cash & cash
equivalents -195 120
23
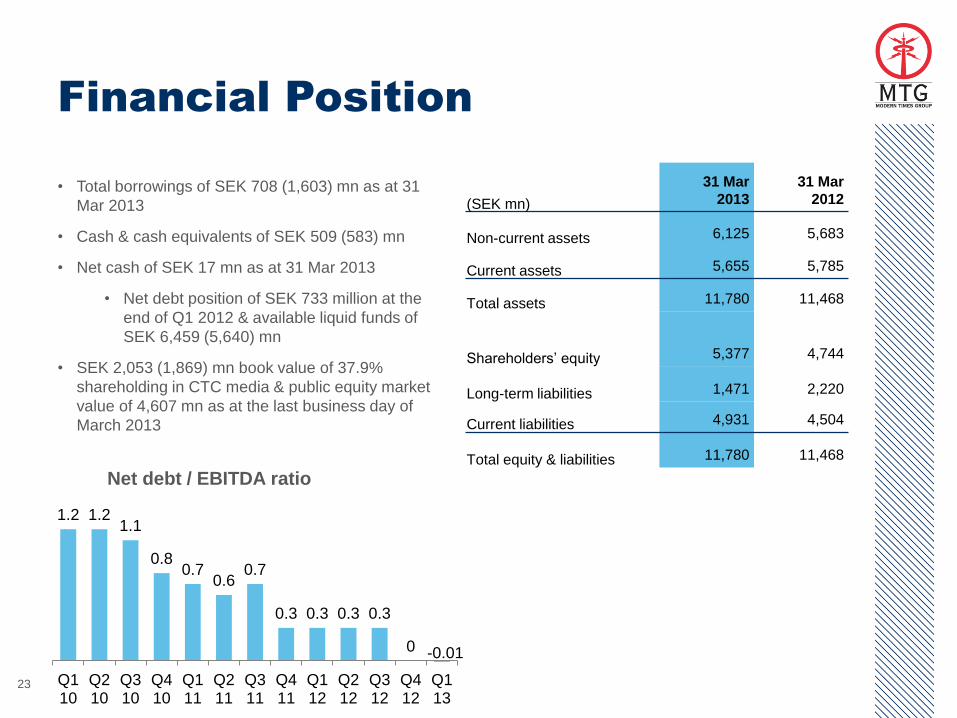
Financial Position
• Total borrowings of SEK 708 (1,603) mn as at 31
Mar 2013
• Cash & cash equivalents of SEK 509 (583) mn
• Net cash of SEK 17 mn as at 31 Mar 2013
• Net debt position of SEK 733 million at the
end of Q1 2012 & available liquid funds of
SEK 6,459 (5,640) mn
• SEK 2,053 (1,869) mn book value of 37.9%
shareholding in CTC media & public equity market
value of 4,607 mn as at the last business day of
March 2013
(SEK mn)
31 Mar
2013
31 Mar
2012
Non-current assets 6,125 5,683
Current assets 5,655 5,785
Total assets 11,780 11,468
Shareholders’ equity 5,377 4,744
Long-term liabilities 1,471 2,220
Current liabilities 4,931 4,504
Total equity & liabilities 11,780 11,468
Net debt / EBITDA ratio
1.2 1.2 1.1
0.8 0.7
0.6 0.7
0.3 0.3 0.3 0.3
0 -0.01
Q110
Q210
Q310
Q410
Q111
Q211
Q311
Q411
Q112
Q212
Q312
Q412
Q113

24
First Quarter 2013
Financial Results
25
Summary
• Strong sales performance in free-TV Emerging Markets driven by
sales cooperations, underlying growth & new channel
• Largest free-TV media house on a quarterly basis in the Czech
Republic for the first time
• Continued investments in pay-TV operations & outlook reiterated
• Audience shares stabilising across the board & improvements in
March
• Taking advertising & audience shares in Denmark
• Viaplay subscriber base is growing & record viewing levels for key
sports events during Q1
• Net cash position provides flexibility for both organic and M&A driven
growth
26
For further information, please visit www.mtg.se or contact:
MTG Investor Relations
Tel: +46 (0) 73 699 2714
Email: [email protected]