msm s 153536_nr6
DESCRIPTION
153536_nr6TRANSCRIPT
Risk Assessments for Offshore Installations in the Operational Phase
(abbreviated version to be presented at ESREL 2003)
Jan Erik Vinnem,
HiS/Preventor, 4349 Bryne
Terje Aven, HiS, 4068 Stavanger
Helle Hundseid, DNV, 1327 Høvik
Kjell-Are Vassmyr Acona Group,
4001 Stavanger
Frank Vollen Safetec Nordic, 7002 Trondheim
Knut Øien, SINTEF Industrial Management, 7465
Trondheim
Contents
1. INTRODUCTION...........................................................................................................................................................1 1.1 BACKGROUND ..........................................................................................................................................................1
1.1.1 Historical review. Regulations ................................................................................................................................................1 1.1.2 Challenges...............................................................................................................................................................................2
1.2 R&D CONTEXT ........................................................................................................................................................3 1.3 PURPOSE OF PAPER ...................................................................................................................................................3
2. OBJECTIVES OF USE OF OPERATIONAL RISK ASSESSMENT........................................................................3 2.1 OVERALL OBJECTIVES...............................................................................................................................................3 2.2 WHAT IS A GOOD RISK ANALYSIS? ...........................................................................................................................4
2.2.1 User/Decision-Maker Satisfaction...........................................................................................................................................5 2.2.2 Requirements by Risk Analysis Discipline...............................................................................................................................5 2.2.3 Analysis Team’s Understanding of Phenomena ......................................................................................................................5 2.2.4 Analysis Team’s Competence in Risk Analysis ........................................................................................................................5 2.2.5 Intermediate results.................................................................................................................................................................6 2.2.6 Results of the analysis .............................................................................................................................................................6
2.3 QUALITATIVE OR QUANTITATIVE ANALYSIS..............................................................................................................6 3. USE OF QUALITATIVE STUDIES .............................................................................................................................7
3.1 OFFSHORE ACTIVITIES ..............................................................................................................................................7 3.2 CURRENT USE OF QUALITATIVE STUDIES...................................................................................................................7
3.2.1 Procedures and Permit to Work System ..................................................................................................................................7 3.2.2 Safe Job Analysis (SJA)...........................................................................................................................................................8 3.2.3 Qualitative Risk Assessment ....................................................................................................................................................8
4. USE OF QUANTITATIVE STUDIES ..........................................................................................................................9 4.1 CURRENT USE OF QUANTITATIVE STUDIES ................................................................................................................9
4.1.1 Use of Quantitative Risk Assessments .....................................................................................................................................9 4.1.2 QRAs during Engineering and Fabrication...........................................................................................................................10 4.1.3 QRAs during Operational Phase ...........................................................................................................................................11
4.2 DECISIONS WHERE QUANTITATIVE INPUT IS REQUIRED ............................................................................................11 4.2.1 Framework ............................................................................................................................................................................11 4.2.2 From a design QRA to an ORA suitable for Decision Support in the Operational Phase .....................................................12
4.3 SHORTFALLS AND DEFICIENCIES IN ORA METHODOLOGY APPLICATION .................................................................13 5. ANALYSIS OF BARRIERS.........................................................................................................................................13
5.1 THE BARRIER CONCEPT AND BARRIER REQUIREMENTS ...........................................................................................13 5.2 POTENTIAL ACHIEVEMENTS USING BARRIER ANALYSIS IN ORA..............................................................................14 5.3 THE MODELLING OF BARRIERS IN CURRENT ANALYSES ..........................................................................................15 5.4 FUTURE ANALYSIS AND MODELLING OF BARRIERS .................................................................................................16 5.5 USE OF INDICATORS................................................................................................................................................17
6. ANALYSIS OF RISK TRANSIENTS .........................................................................................................................17 6.1 REQUIREMENTS ......................................................................................................................................................17 6.2 WHY IS ANALYSIS OF TRANSIENTS IMPORTANT? .....................................................................................................17 6.3 OBJECTIVES OF ACTIVITY BASED MODELLING ........................................................................................................18 6.4 STRUCTURING OF ACTIVITIES AND CONDITIONS ......................................................................................................19
6.4.1 Risk Increasing Activities ......................................................................................................................................................19 6.4.2 Risk Increasing Conditions....................................................................................................................................................19
6.5 CURRENT MODELLING OF ACTIVITIES .....................................................................................................................20 6.6 FUTURE MODELLING OF ACTIVITIES........................................................................................................................20
7. CONCLUSIONS AND RECOMMENDATIONS.......................................................................................................20 7.1 RECOMMENDED USE OF QUALITATIVE STUDIES – OFFSHORE OPERATIONS..............................................................20 7.2 RECOMMENDED USE OF QUANTITATIVE STUDIES ....................................................................................................21 7.3 ANALYSIS OF BARRIERS..........................................................................................................................................21 7.4 ANALYSIS OF RISK TRANSIENTS..............................................................................................................................22
8. ABBREVIATIONS .......................................................................................................................................................22 9. ACKNOWLEDGEMENT ............................................................................................................................................22 10. REFERENCES.........................................................................................................................................................23

ORA paper rev2a.doc
(page left blank intentionally)
ORA paper rev2a.doc 1
1. Introduction
1.1 Background
1.1.1 Historical review. Regulations
The Norwegian safety regime for offshore petroleum installations and operations is founded on internal control. This means that the licensees have the full responsibility for ensuring that the petroleum activities are carried out in compliance with the conditions laid down in the legislation, and the authorities’ supervisory activities aim to ensure that the licensee’s management systems are adequately catering for the safety and working environment aspects in their activities. The initial petroleum legislation from the 1970s was technically oriented, with detailed and prescriptive requirements to both safety and technical solutions. The authorities, with the Norwegian Petroleum Directorate (NPD) in a key role, have gradually changed the legislation to a functional or goal-based orientation. Although regulations concerning internal control and safety were issued as early as 1985, the majority of the ‘new generation’ regulations were issued in the early 1990s. From 1.1.2002 a substantial rationalisation was implemented with 14 regulations reduced to 4. Quantitative risk assessment (QRA) techniques were first given wide application in Norwegian offshore oil and gas industry in the early 1980s. Of particular importance were the NPD regulatory guidelines for concept safety evaluations (CSE) studies, which were introduced in 1980. The guidelines introduced a quantified cut-off criterion related to the impairment frequency for nine types of accidents that could be disregarded in further evaluation processes, the so-called 10-4 criterion (i.e. a criterion of 10-4 per year for the so-called Main Safety Functions and for each accident type, and a total risk of up to nearly 10-3 per year). Introduction of this criterion, which in practice was implemen-ted as a risk acceptance criterion, attracted considerable attention worldwide. Until then, there were few attempts by authorities to approach the sensitive issue by making risk visible and subject to open debate. The development of the Norwegian legislation regime was prompted by a series of serious accidents in the Norwegian Sector including and culminating with the Alexander Kielland capsize in 1980, which resulted in 123 fatalities. A similar development of regulations occurred about 10 years later in the UK, based upon the Piper Alpha inquiring report (Lord Cullen, 1990) following the catastrophic explosion and fire on 6.7.1988, which resulted in 167 fatalities. In the Norwegian regulations relating to implementation and use of risk analyses, which came into force in 1990, focus was on the risk analysis process. The scope of application of the regulations was extended compared to the CSE guidelines. Provisions were laid down for a more integrated and dynamic use of risk analyses, with suitable quality controls on the process, covering the whole life cycle of the petroleum activities. Pursuant to the regulations, risk analyses are to be carried out in order to identify the accidental events that may occur in the activities. Further to evaluate the consequences of such accidental events for people, for the environment and for assets and financial interests. The purpose of the risk analyses is to provide a basis for making decisions with respect to choice of arrangements and risk reducing measures. The operator is to define safety objectives and risk acceptance criteria. The objectives express an ideal safety level. Thereby they ensure that the planning, maintaining and the further enhancement of safety in the activities become a dynamic and forward-looking process. This means that accidental events must be avoided (the realization of any accidental event is unacceptable), the level of risk is kept as low as reasonably practicable (ALARP), and attempts are made to achieve reduction of risk over time, e.g. in view of technological development and experience. The need for risk reducing measures is assessed with reference to the acceptance criteria. The acceptance criteria and their basis are to be documented and auditable.
ORA paper rev2a.doc 2
In 1992 NPD also issued a regulation on emergency preparedness (safety barriers). The most important elements of this regulation was that
• The emergency preparedness of the activity in question shall be established on the basis of some defined situations of hazard and accident (i.e. scenarios definitions)
• The operator shall define specific requirements relating to the effectiveness (performance standards) of the emergency preparedness measures
• Analyses shall be carried out as a basis for the design of the emergency preparedness system. New regulations replaced the old in 2002, but the main requirements related to risk analysis were maintained. However, a stronger focus has been placed on the context and the use of risk analysis, as well as on assessment and monitoring of barrier performance.
1.1.2 Challenges
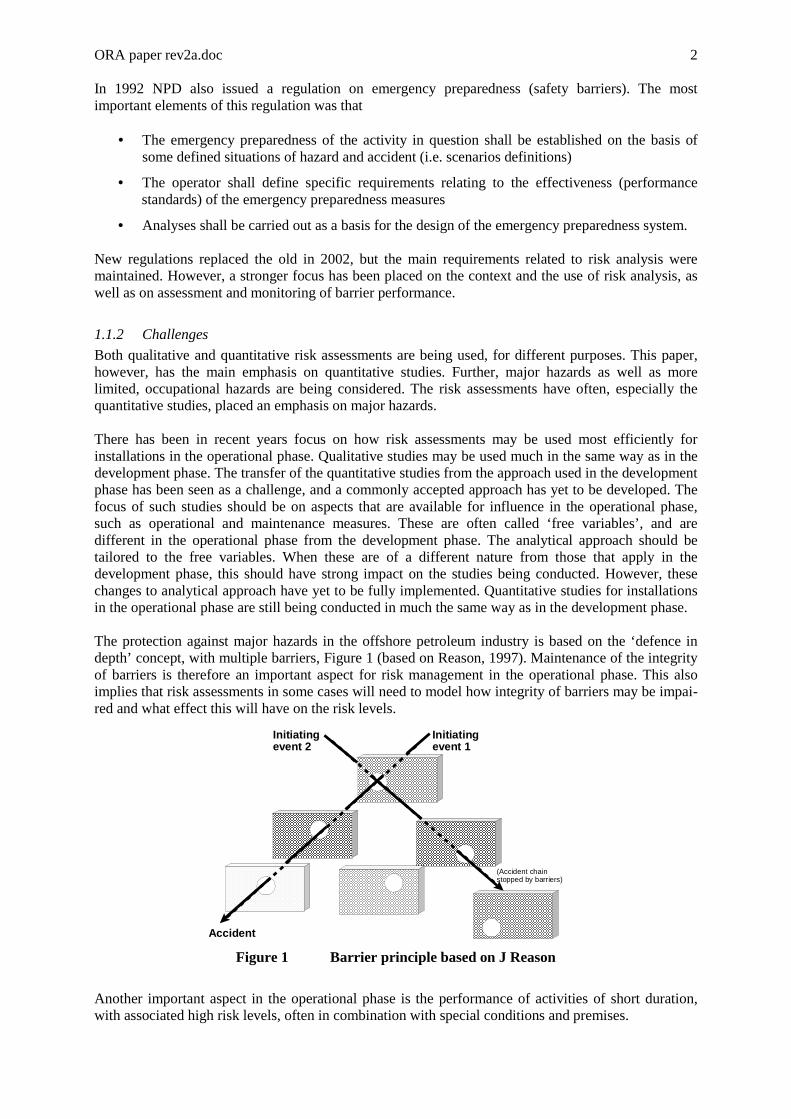
Both qualitative and quantitative risk assessments are being used, for different purposes. This paper, however, has the main emphasis on quantitative studies. Further, major hazards as well as more limited, occupational hazards are being considered. The risk assessments have often, especially the quantitative studies, placed an emphasis on major hazards. There has been in recent years focus on how risk assessments may be used most efficiently for installations in the operational phase. Qualitative studies may be used much in the same way as in the development phase. The transfer of the quantitative studies from the approach used in the development phase has been seen as a challenge, and a commonly accepted approach has yet to be developed. The focus of such studies should be on aspects that are available for influence in the operational phase, such as operational and maintenance measures. These are often called ‘free variables’, and are different in the operational phase from the development phase. The analytical approach should be tailored to the free variables. When these are of a different nature from those that apply in the development phase, this should have strong impact on the studies being conducted. However, these changes to analytical approach have yet to be fully implemented. Quantitative studies for installations in the operational phase are still being conducted in much the same way as in the development phase. The protection against major hazards in the offshore petroleum industry is based on the ‘defence in depth’ concept, with multiple barriers, Figure 1 (based on Reason, 1997). Maintenance of the integrity of barriers is therefore an important aspect for risk management in the operational phase. This also implies that risk assessments in some cases will need to model how integrity of barriers may be impai-red and what effect this will have on the risk levels.
Figure 1 Barrier principle based on J Reason
Another important aspect in the operational phase is the performance of activities of short duration, with associated high risk levels, often in combination with special conditions and premises.
Initiatingevent 2
(Accident chainstopped by barriers)
Initiatingevent 1
Accident
ORA paper rev2a.doc 3
The above challenges are not only relevant for the oil and gas industry in Norway. In for example UK and Australia the safety regime is similar to the Norwegian, and the use of risk analysis in the operational phase is also in these countries a topic for further research and development.
1.2 R&D Context The Norwegian Government has initiated a research program to improve the safety level offshore. The program is led by the Norwegian Research Council and a network of Norwegian institutions have been established to realise the program. The ambition is to obtain more adequate risk analysis tools, in general and for the operational phases in particular. The present work is a part of this program. In coordination with this research program the Association of Norwegian oil companies has initiated a development activity to establish appropriate models of the safety barriers. Together these initiatives are considered to give a strong jump forward for the application of risk analyses in the operational phase. The first phase of this work was conducted in 2002, see Acona Group (2002) and DNV/ScP (2002). This phase 1 considered needs for risk assessments as input to decision-making.
1.3 Purpose of Paper The purpose of the paper is to provide the following documentation:
• Review current status, use and experience • Describe objectives for use of operational risk assessment (ORA) • Identify areas for further improvement • Suggest possible new approaches
Use of risk assessment for other purposes, like risk based inspection, reliability centred maintenance, etc. is not covered.
2. Objectives of Use of Operational Risk Assessment
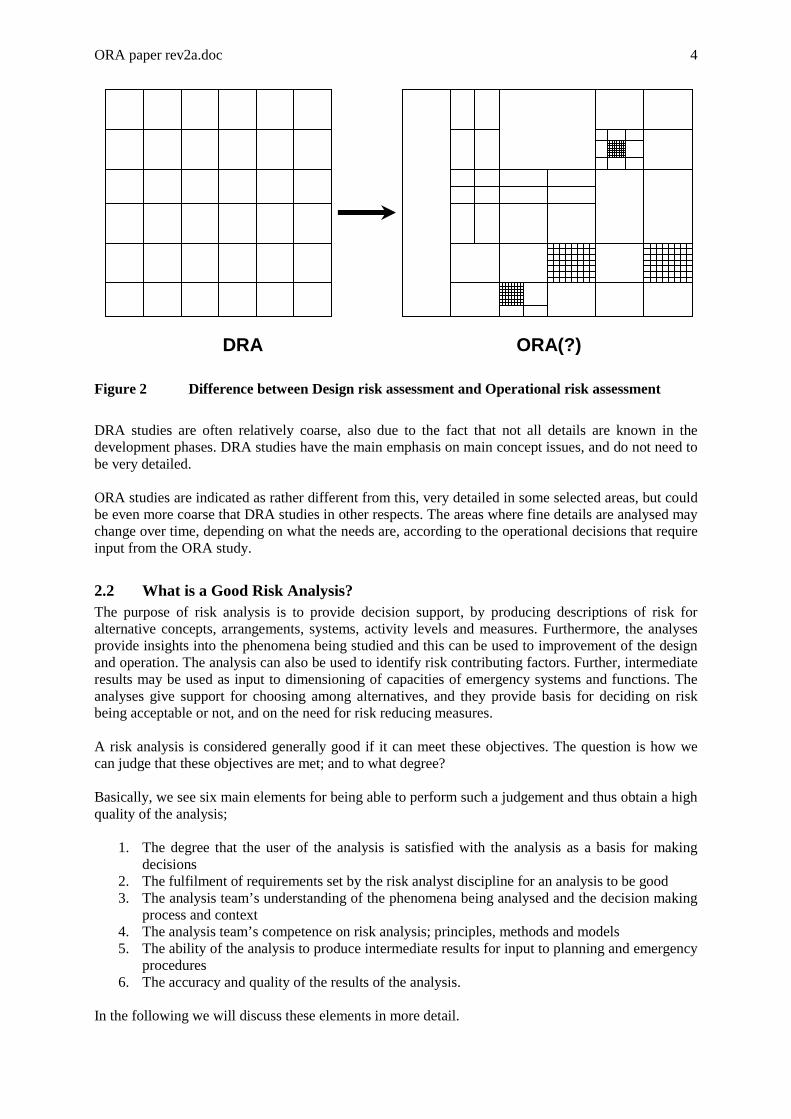
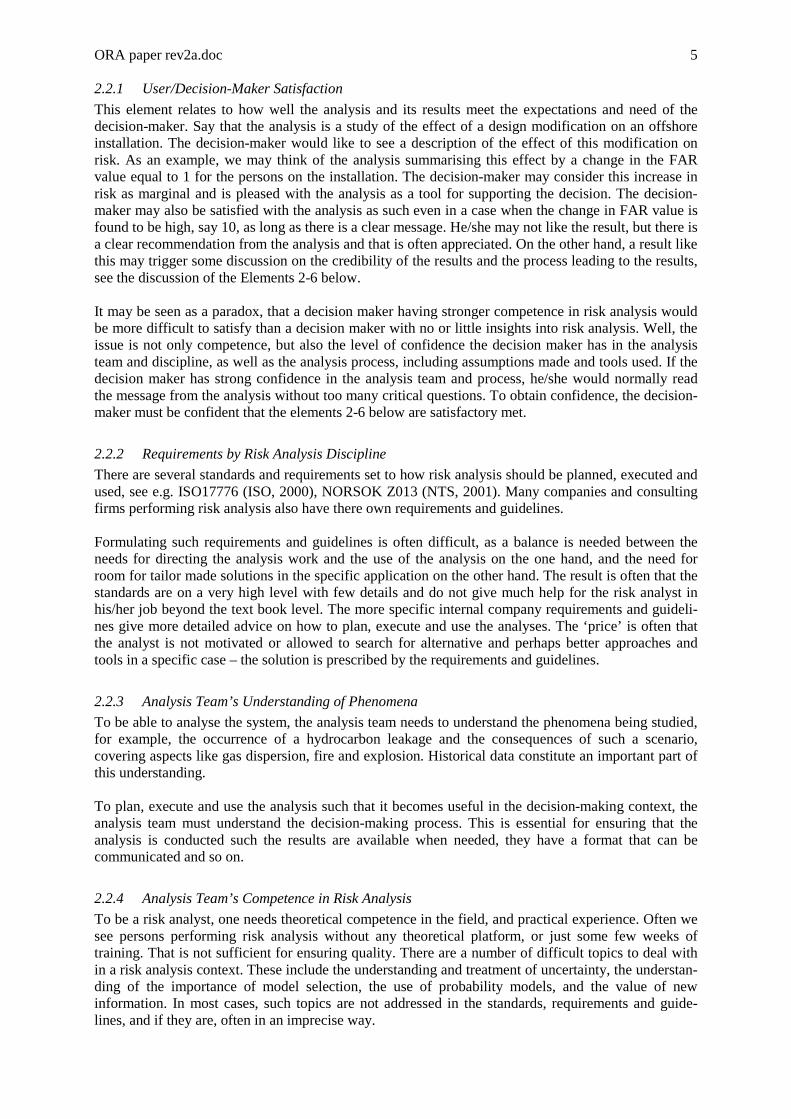
2.1 Overall objectives Proposed objectives for operational risk assessment are as follows: • Assess overall risk level in the operational phase, reflecting modifications and operational status • Identify important improvement areas for operation • Provide input to operational decisions relating to risk issues • Identify how operational tasks and special operations may be safely carried out • Identify adequate maintenance strategies • Assess barrier performance and demonstrate effects on the risk level of barrier deterioration • Communicate risk results and important factors to the workforce ‘Operational risk assessment’ (ORA) is possibly more a ‘family of methods’, rather than one single method, in contrast to Design risk assessment (DRA), by which most people will understand a specific analysis, usually referred to as ‘TRA’, ‘QRA’ or ‘PRA’ in the nuclear power generation industry. The difference between ORA and DRA has been illustrated as shown in Figure 2 (Veire, 2002).
ORA paper rev2a.doc 4
DRA ORA(?)
Figure 2 Difference between Design risk assessment and Operational risk assessment
DRA studies are often relatively coarse, also due to the fact that not all details are known in the development phases. DRA studies have the main emphasis on main concept issues, and do not need to be very detailed. ORA studies are indicated as rather different from this, very detailed in some selected areas, but could be even more coarse that DRA studies in other respects. The areas where fine details are analysed may change over time, depending on what the needs are, according to the operational decisions that require input from the ORA study.
2.2 What is a Good Risk Analysis? The purpose of risk analysis is to provide decision support, by producing descriptions of risk for alternative concepts, arrangements, systems, activity levels and measures. Furthermore, the analyses provide insights into the phenomena being studied and this can be used to improvement of the design and operation. The analysis can also be used to identify risk contributing factors. Further, intermediate results may be used as input to dimensioning of capacities of emergency systems and functions. The analyses give support for choosing among alternatives, and they provide basis for deciding on risk being acceptable or not, and on the need for risk reducing measures. A risk analysis is considered generally good if it can meet these objectives. The question is how we can judge that these objectives are met; and to what degree? Basically, we see six main elements for being able to perform such a judgement and thus obtain a high quality of the analysis;
1. The degree that the user of the analysis is satisfied with the analysis as a basis for making decisions
2. The fulfilment of requirements set by the risk analyst discipline for an analysis to be good 3. The analysis team’s understanding of the phenomena being analysed and the decision making
process and context 4. The analysis team’s competence on risk analysis; principles, methods and models 5. The ability of the analysis to produce intermediate results for input to planning and emergency
procedures 6. The accuracy and quality of the results of the analysis.
In the following we will discuss these elements in more detail.
ORA paper rev2a.doc 5
2.2.1 User/Decision-Maker Satisfaction
This element relates to how well the analysis and its results meet the expectations and need of the decision-maker. Say that the analysis is a study of the effect of a design modification on an offshore installation. The decision-maker would like to see a description of the effect of this modification on risk. As an example, we may think of the analysis summarising this effect by a change in the FAR value equal to 1 for the persons on the installation. The decision-maker may consider this increase in risk as marginal and is pleased with the analysis as a tool for supporting the decision. The decision-maker may also be satisfied with the analysis as such even in a case when the change in FAR value is found to be high, say 10, as long as there is a clear message. He/she may not like the result, but there is a clear recommendation from the analysis and that is often appreciated. On the other hand, a result like this may trigger some discussion on the credibility of the results and the process leading to the results, see the discussion of the Elements 2-6 below. It may be seen as a paradox, that a decision maker having stronger competence in risk analysis would be more difficult to satisfy than a decision maker with no or little insights into risk analysis. Well, the issue is not only competence, but also the level of confidence the decision maker has in the analysis team and discipline, as well as the analysis process, including assumptions made and tools used. If the decision maker has strong confidence in the analysis team and process, he/she would normally read the message from the analysis without too many critical questions. To obtain confidence, the decision-maker must be confident that the elements 2-6 below are satisfactory met.
2.2.2 Requirements by Risk Analysis Discipline
There are several standards and requirements set to how risk analysis should be planned, executed and used, see e.g. ISO17776 (ISO, 2000), NORSOK Z013 (NTS, 2001). Many companies and consulting firms performing risk analysis also have there own requirements and guidelines. Formulating such requirements and guidelines is often difficult, as a balance is needed between the needs for directing the analysis work and the use of the analysis on the one hand, and the need for room for tailor made solutions in the specific application on the other hand. The result is often that the standards are on a very high level with few details and do not give much help for the risk analyst in his/her job beyond the text book level. The more specific internal company requirements and guideli-nes give more detailed advice on how to plan, execute and use the analyses. The ‘price’ is often that the analyst is not motivated or allowed to search for alternative and perhaps better approaches and tools in a specific case – the solution is prescribed by the requirements and guidelines.
2.2.3 Analysis Team’s Understanding of Phenomena
To be able to analyse the system, the analysis team needs to understand the phenomena being studied, for example, the occurrence of a hydrocarbon leakage and the consequences of such a scenario, covering aspects like gas dispersion, fire and explosion. Historical data constitute an important part of this understanding. To plan, execute and use the analysis such that it becomes useful in the decision-making context, the analysis team must understand the decision-making process. This is essential for ensuring that the analysis is conducted such the results are available when needed, they have a format that can be communicated and so on.
2.2.4 Analysis Team’s Competence in Risk Analysis
To be a risk analyst, one needs theoretical competence in the field, and practical experience. Often we see persons performing risk analysis without any theoretical platform, or just some few weeks of training. That is not sufficient for ensuring quality. There are a number of difficult topics to deal with in a risk analysis context. These include the understanding and treatment of uncertainty, the understan-ding of the importance of model selection, the use of probability models, and the value of new information. In most cases, such topics are not addressed in the standards, requirements and guide-lines, and if they are, often in an imprecise way.
ORA paper rev2a.doc 6
Say that the analysis should express the FAR value for an offshore installation. Then a definition of FAR can easily be presented, as well as calculation algorithms. But this does not ensure that the analyst understands what the numbers produced mean.
2.2.5 Intermediate results
A quantitative analysis usually includes many hundreds, if not thousands, end events, characterised by probability and consequences, the latter may be expressed as fatalities. Further each end event usually implies a certain personnel distribution, with respect to people in lifeboats, liferafts, trapped on the installation and so on. These values may be summed up over all possible end events and the results used for input to emergency planning. This is one typical way in which intermediate results may be used. Other ways are also possible.
2.2.6 Results of the analysis
The point here is that the risk results should be in accordance with the real world. This can be viewed in two ways, depending on how risk is understood. If the traditional perspective on risk is adopted, in which risk and probability are considered properties of the real world, the risk estimates produced by the analysis should be accurate relative to the true risk numbers. If a Bayesian type of approach is adopted, the analysis should produce accurate predictions of observable quantities, but in this perspec-tive there exists no correct risk numbers as risk is a judgement of uncertainty of the observable quantities. For the traditional perspective, the problem is however that the true risk is unknown and it is difficult or impossible to make comparisons. Attempts are made in some industries to subjectively assess the uncertainties of the true underlying risk, but this is not straightforward and is often seen as disturbing the message of the analysis. The uncertainty intervals are typically very wide. The result is thus often that the risk estimates are presented without any consideration of associated uncertainties. Hence this point of quality is difficult to verify in practice. Indirectly we can obtain confidence in the results by meeting the objectives of the elements 2-4 above. For a Bayesian perspective, the results are uncertainty assessments, and we cannot judge these as good or bad as such, relative to an objective scale. But of course, these assessments can be considered more or less good depending on what constitute the basis and knowledge for the assessments (cf. Aven, 2003).
2.3 Qualitative or Quantitative Analysis The scope of work in the OLF project (see Acona Group, 2002; DNV/ScP, 2002) was focused on both qualitative as well as quantitative studies. It has been a typical situation that all risk assessment studies that are performed with direct application in the operational phase (except updating of Design QRA studies) have been qualitative studies. This is considered to be a reflection of unsuitable methodologies for quantitative studies for operatio-nal matters, rather than a reflection of correct use of methodologies. In fact some of the authority requirements actually call for quantitative studies in areas where the normal approach currently is basically qualitative studies. One of the purposes of the paper is to define the distinctions between applications of qualitative and quantitative studies. Qualitative and quantitative studies are therefore discussed separately in Section 3-4 below. There are roughly two stages of risk assessment for offshore activities:
• Risk assessment during planning of offshore activities. This is normally undertaken onshore, but with participation of key offshore personnel.
ORA paper rev2a.doc 7
• Risk assessment just prior to execution of an activity. This is undertaken using the Work Permit System, Procedures and Safe Job Analysis.
3. Use of Qualitative Studies For offshore operations, the use of qualitative studies has increased significantly over the last decade. In particular, the introduction of risk based safety management systems has encouraged the use of qualitative studies, both prior to specific offshore operations, and more recently, during all aspects of ‘management of change’. This section concentrates on the use of qualitative studies for offshore activities in the Norwegian sector of the North Sea. Maintenance and inspection planning to ensure adequate integrity of safety barriers have not been evaluated. The findings described in this section are based on the OLF project ‘Operational Risk Analysis, Phase I’ (Acona Group, 2002).
3.1 Offshore Activities Some categories of offshore activities may from time to time be subjected to some form of qualitative studies:
• Drilling and well services • Production, maintenance and minor modifications • Marine operations • Transportation • Organisational changes
Within these 5 categories, there are a number of specific activities that are either executed as a single activity or as part of several activities that are undertaken simultaneously. The risk associated with these activities will be dependent on a number of parameters, such as:
• Type of activity • Technical integrity of equipment and structure • Available documentation • Communication • Organization • Human Factors • External Factors • Extent of simultaneous activities
Each of the above parameters could be split into a number of sub-issues (e.g, competence, experience, complacency, stress, etc. for human factors). Thus, the overall risk picture for a specific activity can be rather complex. The above parameters are included in various checklists that are being used as guidewords to identify hazards during qualitative studies.
3.2 Current use of Qualitative Studies
3.2.1 Procedures and Permit to Work System
Specific procedures have been developed for repeated activities in order to minimize the risk during execution. In many companies, these procedures are being continuously updated. After completion of the activity, any learning points are being communicated to the “owner” of the procedure for continu-ous improvement. A good example is the TOPS system developed by Odfjell Drilling. The procedures, combined with the Work Permit System and toolbox meetings are the final risk evaluation prior to the actual job execution.
ORA paper rev2a.doc 8
3.2.2 Safe Job Analysis (SJA)
If the job is considered to be critical, a number of operators have introduced a more formal qualitative risk evaluation offshore. These are often called Safe Job Analysis (SJA). The definition of critical activity is often described in the work permit system, as well as the operator’s safety management system. Further, any activity is considered to be critical if one of the persons involved, considers it to be critical. SJA is undertaken offshore, and templates for reporting are normally provided. SJA’s are filed offshore, and for similar future operations, these studies can be consulted, but should not be used directly in a ‘copy-paste’ effort. SJA is undertaken in a team oriented session, involving all personnel that are involved in the activity. As an example, BP has defined acceptance criteria for a SJA study as follows (BP Norway, HSE Directive No. 10): “The risk is considered to be acceptable and ALARP if this is the judgement to all the personnel that represents the necessary technical areas and has the required competence and experience to undertake a judgement.”
3.2.3 Qualitative Risk Assessment
There are a number of qualitative risk assessment methods. However, they are all following some common elements:
• The risk evaluation is undertaken in team oriented sessions. One person is facilitating the study, and the results are recorded during the session.
• The hazards are identified using checklists.
• The reporting is typically in a table format, where the risk ranking is done by using a risk matrix. The matrixes used are normally a 5 x 5 matrix with a intolerable, ALARP and negligible region. Each operator has developed their own matrix As an example the Shell EP 95000 HSE guidelines have specified risk matrixes to be used for all Shell EP operating units.
• Although common in nature, each operator has developed their own guidelines. Thus, there is some confusion in terms of definitions and abbreviations, such as TATO, SIMOPS, HAZID, FIREPRAN, HAZOP, SAFOP which are all similar study methodologies but with different checklists and reporting formats.
Important issues to ensure a high quality analysis are:
• Competence and experience in the team • Relevant documentation is available • Timing of the study (in order to ensure implementation of risk reducing measures) • How much time available to undertake the study • Experience and ‘talent’ of the risk team leader • Quality of the records produced • Plan for implementation of risk reducing measures.
The uses of qualitative studies are increasing. Some specific examples are listed below in order to illustrate the variety of studies undertaken, involving risk evaluation of:
• Seismic surveys (specially focus on marine operations) • Helicopter landing on DP operated vessels • Rig move • Pod replacement on subsea template (and various other ROV operations) • Pipe handling for drilling operations • Well completion • Options for drilling through shallow gas zone • Coiled tubing operation
ORA paper rev2a.doc 9
• Lifting operations • Proposed manning reduction • Foam cementing operation • Simultaneous drilling and production • Maintenance activities during shutdown
These are all qualitative studies that are undertaken during planning of major offshore activities. Main operators collect and review studies from world wide operations, thereby being able to develop best practice studies for a number of offshore activities. These best practices have collected hazard scenarios, typical mitigating measures, guidewords for the team session and study requirements (such as required personnel and information). The expression ‘qualitative studies’ should not be misinterpreted to say that no modelling is being undertaken. For a team to make a qualified judgement, the information requirements could include a number of numerical information. Some examples are:
• Modelling of vessel movements due to various weather conditions • Shallow gas simulations • Impact energy of a certain object if dropped
4. Use of Quantitative Studies
4.1 Current Use of Quantitative studies Quantitative Risk Assessment may include quantification of the probability and the consequences of accidental events with respect to one or several of the following risk dimensions; personnel, environment and assets. The study further includes a comparison with quantitative risk acceptance criteria established by the operator. This will typically include quantitative criteria for Fatal Accident Rate (FAR) and/or Individual Risk (IR) and quantitative criteria for safety functions like e.g. support structure, escape ways, evacuation, control room and sheltered area. For effective planning, execution and use of risk analysis reference is given to NORSOK standard Z-013 (NTS, 2001). Current requirements set by the Norwegian Petroleum Directorate makes references to this NORSOK standard.
4.1.1 Use of Quantitative Risk Assessments
The use of quantitative risk assessment studies was often viewed rather negatively at the beginning of the 1980’ies, when this was a new requirement. Some of the main aspects that were focused upon as negative at the time, were:
• lack of frequency data, based on relevant operational experience • lack of risk assessment expertise combined with technical/operational expertise • studies which produced absolute risk estimates that were useless for practical design purposes • difficult to use the results and reports in the operational phase
While some of these points may have been difficult to solve satisfactorily, the general opinion seems to be more consistent today, acknowledging that the QRAs are useful in the search for safety improvements on offshore platforms during design. The following aspects illustrate areas where improvement has been made, related to how quantitative studies are carried out and used:
• The experience database has improved significantly over the years
• Better models have been developed for ignition, smoke and fire and explosion loads
ORA paper rev2a.doc 10
• More dedicated analysis of barriers (see Section 5) has started, but further development is still in great need
• Development of design loads based on consequence analysis, related to dimensions and durations of fire, impact loads in collisions, etc.
• Focus on premises that may be extracted from the studies as design accidental premises and loads
• The possibility to follow up of premises and assumptions from an operational and procedural point of view (often not fully utilized)
• Use of risk indicators (see Section 0) The risk analysis process has for many been proven to be the main benefit, in contrast to the risk analysis results, especially for organisations that involve themselves extensively in the risk analysis process. Many safety professionals will claim that the improvement gained through the 1980ties was conside-rable, but that improvements made during the 1990ties have been marginal. However, initiatives are now taken to further improve QRA study methods and result presentation format.
4.1.2 QRAs during Engineering and Fabrication
The QRA has traditionally been used for optimisation and verification of design. The focus is on technical measures and solutions but significant assumptions are made related to organisational measures (e.g. manning, emergency teams and qualifications), operational measures (e.g. procedures for lifting, maintenance and visiting vessels) and activities (e.g. simultaneous operations, modification and number of helicopter visits). A typical schedule of risk assessment studies during engineering and fabrication phases may be as shown below: Engineering:
• Comparative safety evaluation of alternate concepts is often the first step, intended to provide insight for selection of an optimised concept.
• Several stages of Concept Safety Evaluations, with more refinement, as more concept refine-ment is developed. The hazards covered in these studies are blowouts, riser/pipeline failures, process system leaks, collisions, structural and marine related failures.
• Limited design accidental load studies, reliability/availability studies of safety system design, etc. to clarify detailed solutions, and evaluate whether premises or conditions derived from earlier studies have been implemented in practice.
• Emergency Evacuation studies to assess the expected success rate of the evacuation system and procedures, in order to optimise the emergency evacuation system.
• Collision risk studies to determine what (if any) risk reduction measures that may be required, in order to control this aspect of risk.
• Total Risk Analysis (TRA) at completion of engineering design work, to document the fatality risk level, and provide basis for specification of requirements to operational procedures.
Fabrication:
• Studies concerned with design changes that are performed during fabrication and construction
• Studies concerned with revisions made to procedures for operation or emergency prepared-ness.
ORA paper rev2a.doc 11
NORSOK Z-013, Section 7, (NTS, 2001) gives a presentation of use of risk analysis in the various life cycle phases.
4.1.3 QRAs during Operational Phase
The traditional QRA (see above) assumes ‘normal’ or ‘typical’ operation mode and addresses usually activities in the operational phase only superficially. This makes the QRA often useless during the operational phase to assess the consequences of changes in the activities, new activities, simultaneous operations, manning variations, etc. Further, the traditional QRA makes a number of assumptions (documented and undocumented) related to integrity of safety systems, process systems, structure and support systems, as well as related to well and process parameters. The status of these systems during the operational phase could be difficult to measure, compare and assess up against assumptions made in the QRA. This reflects the fact that the status of many integrity parameters can only be verified during actual accidental scenarios. Based on requirements in the new NPD regulations and the experience from “traditional” QRAs, the QRA studies have lately been improved with respect to usefulness in the operational phase. An example of this is requirements to study chain of causation. To further explore this the Norwegian Oil Industry Association (OLF) have initiated two pilot projects (Ref Acona, 2002 and DNV, 2002) through their ‘Operational Risk Assessment’ project. Both pilot projects have discussed use of quail-tative studies (see Section 3) as well as quantitative studies. During the operational phase the technical solutions are in principle established. If the installation later should experience significant modifications, this will usually initiate an update of the QRA, or require a supplement. The operations’ influence on the risk level (significant modifications not included) will mainly be related to aspects such as those listed in Section 4.2.2.
4.2 Decisions where Quantitative Input is required The decision processes onshore/offshore are complex and are normally related either to economic or safety related aspects. Either the offshore organisation or the onshore organisation takes the initiative to changes. Typical problems where decisions are required in the operational phase and where decision support from a well developed ORA will increase the probability for the ‘correct’ decision, are identified to be:
• Whether the activity should be carried out or not • What restrictions and safety related aspects that should be taken care of in daily operation • What the requirements to the equipment are • What the requirements to the personnel and the competence are • Whether the production should be shut down or not • Whether the manning level must be changed • What simultaneous operations that can be carried out • Whether compensating measures are necessary and which of them are effective • Whether maintenance and improvements could be delayed
Several of the decisions related to the listed problems must be taken on a daily basis, and use of quantitative analyses as a decision support tool will in many situations not be optimal.
4.2.1 Framework
The requirements set by the Norwegian Petroleum Directorate (NPD) with respect to when QRAs shall be carried out in order to identify main contributors to major accidents are as follows, NPD (2001): “Quantitative risk analyses and other necessary analyses to identify contributors to major accident risk shall be carried out, which shall
ORA paper rev2a.doc 12
a) Show the risk connected with planned drilling and well activities, and show which effect these activities have on the total risk on the facility,
b) Show the effect of modifications and the implementation of modifications on the total risk, c) Show the risk connected with transportation of personnel between the continental shelf and shore
and between facilities. The analyses shall in addition be used to define conditions for operation and to classify areas, systems and equipment in relation to risk.” The above points is often interpreted to require an update of or a supplement to the design QRA in the operational phase. This is discussed further in Section 7.2. The above mentioned regulations also require risk acceptance criteria to be formulated. It is consi-dered, however, that the use of risk acceptance criteria should be evaluated carefully, this is briefly mentioned in Section 7.2.
4.2.2 From a design QRA to an ORA suitable for Decision Support in the Operational Phase
The design QRAs focus on technical solutions, but also set premises for the operational phase, e.g. regarding:
• Requirements set to technical safety barriers
• Manning in the different areas
• Activity level with respect to simultaneous operations, hot work operations, drilling opera-tions, crane operations, supply vessel visits etc.
• Requirements to the emergency preparedness organisation In the operational phase the technical solutions are more or less fixed. How the operation will affect the risk level therefore depends on the extent to which the organisation manages to:
a. Maintain and keep important premises for operation set to the installation in the design phase, such as:
• Built-in technical safety functions • Activity level and activity restrictions
b. Identify and control risk conditions related to normal operations, as:
• Planned working operations (working procedures) • “Human-machine” interface • Total activity level • New/changed operations, equipment, chemicals etc.
c. Identify and control risk conditions related to deviation situations, as:
• Non-compliance to procedures • Abnormal manning and competence conditions • Abnormal delays in maintenance work • Periods with abnormal high activity level • Unforeseen operational conditions (reservoir conditions, equipment failure)
The tasks under a) assume a continuity from the design phase to the operational phase with respect to essential results from the design QRA and important aspects here is to know, and to follow the restrictions and assumptions in the design QRA. The delivery from task a) could be additional quantitative analyses to the design QRA. Tasks listed in b) and c) require other methods and approaches than the tasks listed in a). Methods as HAZID/HAZOP are to some extent used in the operational phase, but could be used more extensively. Safe job analysis is a frequently used tool in the operational phase and gives a good local evaluation of
ORA paper rev2a.doc 13
the activities with respect to safety. A weakness with the SJA- performance used today is that partici-pants often have limited knowledge with respect to limitations and assumptions in the design QRA.
4.3 Shortfalls and Deficiencies in ORA Methodology Application There are several shortfalls and deficiencies in the QRA methodology with regard to decision support in the operational phase. They are identified among others to be:
• Focus on long term risk rather than short term risk which is necessary to consider in the operational phase.
• The acceptance criteria are often inappropriate for short term risk.
• Knowledge about QRAs is not sufficiently communicated to offshore personnel.
• QRA teams often consist of risk analysts only with negligible experience from operations. Operational personnel should be involved.
• Often the risk level is not presented in an understandable and trustworthy manner.
• To carry out a QRA is often time consuming and not necessarily adjusted to the time schedule for the decision processes in the operational phase (decisions to be taken on daily basis).
• Relevant data to carry out a QRA in the operational phase (such as data relating to operations) are often difficult to obtain.
• Today the QRA normally only includes technical aspects, but for operational aspects also human, organisational and cultural factors must be taken into account. Human reliability analyses (HRA) are rarely used in offshore QRA's, even though methods exist. It is important to make better use of existing HRA and also to improve these methods in order to succeed in development and use of QRAs in the operational phase.
5. Analysis of Barriers
5.1 The Barrier Concept and Barrier Requirements In the NPD Regulations relating to management in the petroleum activities (the management regulations; NPD, 2001) it is stated (Section 2; Barriers): “The operator or the party responsible for the operation of a facility shall stipulate the strategies and principles on which the design, use and maintenance of barriers shall be based, so that the barrier function is ensured throughout the life span of the facility. It shall be known what barriers have been established and which function they are designed for, cf. Section 1 on risk reduction, second paragraph, and what performance requirements have been defined in respect of the technical, operational or organisational elements which are necessary for the individual barrier to be effective. It shall be known which barriers are non-functional or have been impaired. The party responsible shall initiate necessary actions to correct or compensate for missing or impaired barriers.” Barrier is not a totally new concept in the petroleum industry, but the previous interpretation has usually been restricted to physical measures, e.g., as in MORT (Management Oversight and Risk Tree; Johnsen, 1980). The management regulations (NPD, 2001) emphasise that barriers shall include administrative or organisational measures as well as physical measures, i.e. physical and non-physical barriers. Organisational barriers or safety measures are those measures that shall ensure continuous adequate performance of the technical and human barriers.
ORA paper rev2a.doc 14
Despite the emphasis on the concept of barriers it is not given any strict definition in the regulations. This lack of definition is discussed in a Norwegian Petroleum Directorate project (Husebø et al., 2002), in which they adopt the ISO 17776 definition (ISO, 2000): “Measure, which reduces the probability of realising a hazard’s potential for harm and which reduces its consequence. Note: Barriers may be physical (materials, protective devices, shields, segregation, etc.) or non-physical (procedures, inspection, training, drills, etc.)” Earlier regulations in the offshore industry consisted of specific requirements, including requirements for some of the physical barriers (e.g. safety systems). In today's regulations specific requirements have been replaced with functional requirements, including statements about which aspects of performance that may be considered. In the guidelines to the management regulation (NPD, 2002) it is stated that performance “may, inter alia, refer to capacity, reliability, availability, efficiency, ability to withstand loads, integrity and robustness”.
5.2 Potential Achievements using Barrier Analysis in ORA The management regulations’ requirements on barriers may be broken down in the following parts: 1. Stipulate the strategies and principles on which the design, use and maintenance of barriers shall
be based
2. Know what barriers have been established and which function they are designed for, and what performance requirements have been defined
3. Know which barriers are non-functional or have been impaired
4. Initiate necessary actions to correct or compensate for missing or impaired barriers The connection between the risk assessment and the requirements to barriers could in principle be established based on the QRA; however, partly due to inadequacies of the QRA as an operational risk assessment, there is currently no explicit connection between the QRA and the barrier requirements. Instead requirements are determined on the basis of OLF guideline 070 (OLF, 2001). But these guidelines are limited to programmable systems, and is far from covering all barriers. Thus there is a need to develop the QRA methodology to include a relation to the performance of barriers. A potential future achievement is to provide an explicit connection between the risk assessment and the barrier requirements (in line with the IEC 61508’s ‘intentions’). This will require an adequate operational risk assessment methodology. The second part of the NPD requirements represents a much broader scope than the traditional technical integrity focus, and calls for better integration and co-operation between different disciplines (even within the safety disciplines; risk analysts, technical safety specialists, human factors specialists, human reliability analysts, ergonomics, accident investigators, etc.). One company has focused extensively on this part of the barrier requirements in the so-called TTS project (State of Technical Safety; Sørum et al., 2002), which we will return to in Section 5.3. The third part of the barrier requirements states that it shall be known which barriers are non-functional or have been impaired. This includes adequate awareness and control of overrides and inhibits. A potential future achievement, that requires this knowledge, is the development of ‘living QRA/ORA’ or risk monitoring systems (RMS), commonly used in the nuclear industry (Kafka, 1994). However, nobody has ever attempted such an achievement in the offshore industry, and a discussion of whether this is the preferred way forward is also lacking.
ORA paper rev2a.doc 15
Also risk based configuration control and evaluation/rating of operational events are potential future achievements, utilising knowledge about which barriers (and other systems/ components) are non-functional or have been impaired, provided that an adequate ORA methodology have been developed. The fourth part of the barrier requirements states that the party responsible shall initiate necessary actions to correct or compensate for missing or impaired barriers. The first decision to be made is whether it is necessary to shut down parts or all of the process, alternatively for how long time such an action can be postponed. A potential future achievement attached to this is the development of predefined requirements of so-called allowed outage times (AOT) for all barriers (IAEA, 1998).
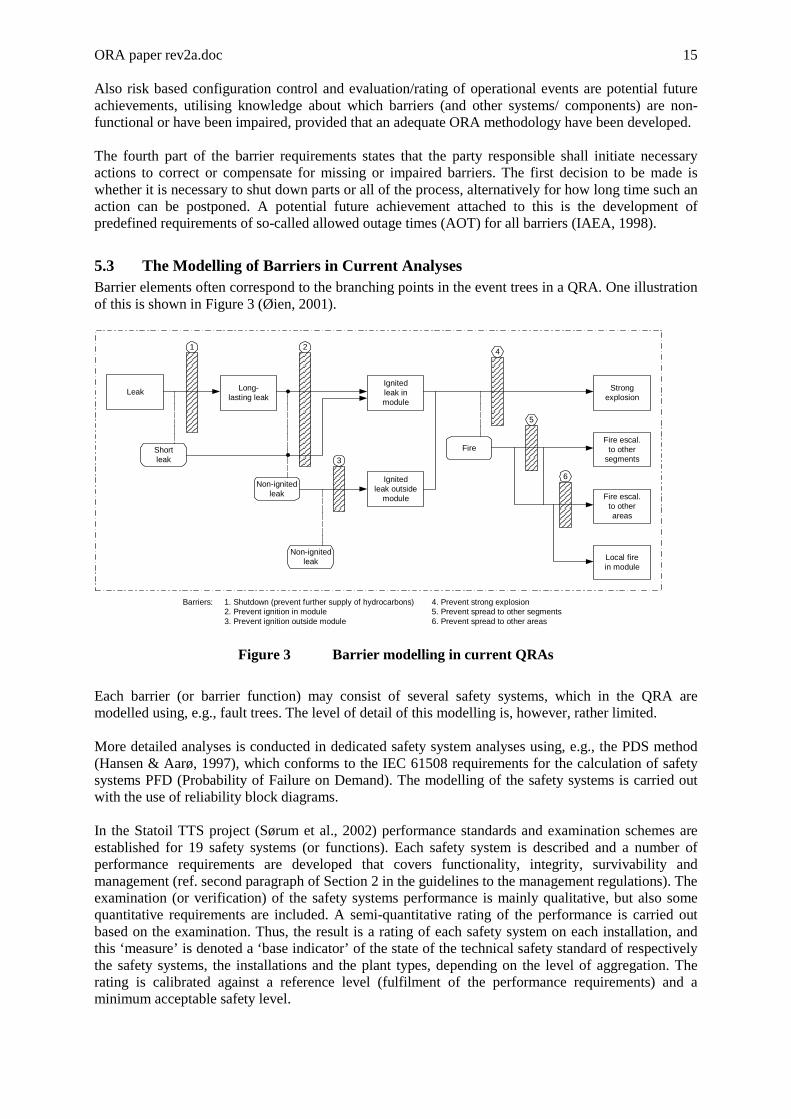
5.3 The Modelling of Barriers in Current Analyses Barrier elements often correspond to the branching points in the event trees in a QRA. One illustration of this is shown in Figure 3 (Øien, 2001).
Leak Long-lasting leak
Shortleak
Ignitedleak inmodule
Ignitedleak outside
module
Fire
Strongexplosion
Fire escal.to other
segments
Fire escal.to otherareas
Local firein module
Non-ignitedleak
Non-ignitedleak
21 4
5
6
3
Barriers: 1. Shutdown (prevent further supply of hydrocarbons)2. Prevent ignition in module3. Prevent ignition outside module
4. Prevent strong explosion5. Prevent spread to other segments6. Prevent spread to other areas
Figure 3 Barrier modelling in current QRAs
Each barrier (or barrier function) may consist of several safety systems, which in the QRA are modelled using, e.g., fault trees. The level of detail of this modelling is, however, rather limited. More detailed analyses is conducted in dedicated safety system analyses using, e.g., the PDS method (Hansen & Aarø, 1997), which conforms to the IEC 61508 requirements for the calculation of safety systems PFD (Probability of Failure on Demand). The modelling of the safety systems is carried out with the use of reliability block diagrams. In the Statoil TTS project (Sørum et al., 2002) performance standards and examination schemes are established for 19 safety systems (or functions). Each safety system is described and a number of performance requirements are developed that covers functionality, integrity, survivability and management (ref. second paragraph of Section 2 in the guidelines to the management regulations). The examination (or verification) of the safety systems performance is mainly qualitative, but also some quantitative requirements are included. A semi-quantitative rating of the performance is carried out based on the examination. Thus, the result is a rating of each safety system on each installation, and this ‘measure’ is denoted a ‘base indicator’ of the state of the technical safety standard of respectively the safety systems, the installations and the plant types, depending on the level of aggregation. The rating is calibrated against a reference level (fulfilment of the performance requirements) and a minimum acceptable safety level.
ORA paper rev2a.doc 16
This assessment of the safety systems corresponds to the second paragraph of the NPD requirement on barriers (stated in Section 5.1); however, it does not include much modelling and analysis of barriers. It is a thorough, qualitative and rather infrequent assessment (all systems being re-assessed within 5 years) of barrier aspects that do not change frequently. Statoil (and other oil companies) are also developing indicators for frequent measuring of the integrity of the safety systems, usually denoted as ‘barrier indicators’. These indicators are briefly described in Section 5.5. The NPD project (Husebø et al., 2002) has in part based their work on the oil companies’ work on barriers, in particular the work of Statoil. They include both a thorough qualitative evaluation of the barriers and a quantitative performance record. The qualitative evaluation covers physical, administra-tive and organisational measures and the different performance attributes (i.e., functionality/efficiency, availability/reliability, and robustness), whereas the quantitative measuring of the barriers is closely connected to the oil companies’ ‘barrier indicators’. An accident investigation method that recently has been introduced in the petroleum industry is the so-called MTO (Human Technology Organisation) analysis (Bento, 1999). This method consists of several parts, including a barrier analysis. The barriers are defined as the technical, administrative or organisational measures, which could have stopped the course of events. These barriers are attached to the events’ failure causes and root causes. Despite the definition, the main focus is on administrative and organisational deficiencies using ten predefined failure cause categories and a set of root causes for each failure cause.
5.4 Future Analysis and Modelling of Barriers A future development toward more detailed modelling of physical barriers (e.g., safety systems) in the risk analysis (ORA) will support the potential achievements mentioned in Section 5.2. This may enable one or several of the following, depending on future decisions about usefulness: • Establishing safety system requirements based on risk assessment, i.e., the reliability of a particu-
lar safety system, may be used as a requirement when the safety integrity level (SIL) is determined for that system (in order to meet the overall risk acceptance criteria)
• Obtain information on risk status for safe daily operation using living risk assessment and RMS • Risk based configuration control, i.e. to manage and control concurrent unavailability of compo-
nents, the possibility of functional alternative components, the outage times of the unavailable components and the frequency of the critical configurations
• Evaluation/rating of operational events, i.e. to carry out an operational events analysis in order to evaluate the safety significance of the events and to establish an event importance ranking
• Establishing allowed outage times for safety systems in order to minimize the risk from equipment unavailability while maintenance is in progress
More details about the last four potential achievements can be found in IAEA (2001). A more detailed modelling of physical barriers may also support risk-informed decision making within maintenance management, e.g., RCM, in-service testing, in-service inspection, etc. The broadening of the concept of barriers, including non-physical elements, as emphasised in the new management regulations, is in line with prevailing thinking about major accident prevention. The notion of organisational accidents (Reason, 1997) underlines the fact that most major accidents are not caused by simple technical failures or human errors but rather organisational deficiencies. To include models of non-physical barriers in risk assessments (e.g., in ORA, QRA, PRA, PSA, etc.) is, however, not an easy task (see e.g., Hale et al., 1998b). For qualitative assessments (audit type of methods) and accident investigations the inclusion of non-physical barriers is more manageable. This is also the area in which works already have been initiated in the petroleum industry, (ref. the TTS project and the MTO-method).
ORA paper rev2a.doc 17
Another challenge for future analysis and modelling of barriers is the adequate treatment of depen-dencies. Some of the dependencies between similar physical components are accounted for in the models. However, dependencies between systems are rarely considered and this is of special relevance with respect to potential organisational dependencies (e.g., same maintenance team using the same (lack of) knowledge, (less than adequate) procedures, etc. working on different systems). This has been addressed by Relcon in a project for NPD (Bäckström & Vinnem, 2003)
5.5 Use of Indicators Control of barrier performance is a requirement in the new management regulations. One means of control is the development and use of indicators (performance indicators, safety performance indicators, risk indicators, etc.). The petroleum industry has several initiatives aiming at the establishment of indicators for barrier control, e.g., Statoil (TTS project), Norsk Hydro (SSS element 23), PPCoN (requirements for important safety functions). These works have also been the basis for the treatment of barriers in the NPD project on the risk level on the Norwegian continental shelf (Husebø et al., 2002). These indicators are sometimes labelled ‘barrier indicators’, and comprise measures of the perfor-mance of individual barrier elements, safety systems, safety system elements or even different classes of safety system elements (e.g., gas point detectors). A typical indicator will be the proportion of failures during testing of the element in question. Some other indicator initiatives that also include the performance of important safety systems are the Norsk Hydro project on KPI for process safety, TotalFinaElf projects (Vinnem, 1998, 1999, 2000), and SINTEF work for NPD, ConocoPhillips Norway and Statoil (Øien et al., 1997, 1998, 1999). Development and use of risk indicators in the petroleum industry will be elaborated on in a separate paper, see Vinnem et al. (2003).
6. Analysis of Risk Transients ‘Transient’ in this context implies short duration activities, say from one hour up to several days duration, that imply increased risk during the time it takes to complete the activities in question.
6.1 Requirements Section 14 (see also Section 4.2.1) of the ‘Management regulations’ (NPD, 2001) requires quantitative assessment of risk in order to identify contributions to major hazard risk from hazards such as:
• Drilling and well operations • Modifications, during and after implementation • Helicopter transportation
Although not explicitly stated, the implicit requirement in this formulation is that transient risk levels need to be addressed. The NPD requirement further state that the effect of these temporary activities on the total risk level shall be presented. It is therefore required that temporary risk levels and durations are analysed and documented.
6.2 Why is Analysis of Transients important? Risk levels in offshore operations have traditionally been analysed as average FAR values for 12 month periods. The only transient that is often considered, is the risk level during transportation of
ORA paper rev2a.doc 18
personnel by helicopter from shore to the installation, which is one of the transients referred to in the regulations (see Section 6.1). But transients are much more than just helicopter transportation, or even the limited number of examples mentioned in Section 6.1 above. What we consider to be the annual average risk level, is probably constituted of many short intervals of relatively high risk within a generally low level risk environment. It is for instance obvious that the probability of fire or explosion is higher when welding (‘hot work’) is carried out in the process area. The fact that severe consequences are more likely when fire water is unavailable can be concluded from comparing the fate of Piper Alpha on 6.7.1988, with the minor consequences to the Brent Alpha platform on the previous day in July 1988. The common element for these two occurrences is the limited gas explosion that was caused by a medium size gas leak followed by fire. One of the significant differences between the two events is that the deluge system was activated prior to ignition in the case of the Brent Alpha leak, whereas it was completely unavailable in the case of the Piper Alpha accident. It could be argued that hydrocarbon oil and gas processing and production is risk free as long as the containment is intact. There is however, a potential for fire or explosion if containment is lost and a combination of oxygen and ignition energy is present together with a failure of other barriers. Some of the barriers are in continuous operational mode, like containment. Most of the barriers are however, ‘dormant’, in the sense that they do not perform any function until containment is lost (or when tested). This is most obvious for the active safety systems, but is also the case for most of the passive safety systems or functions. Variations in the instantaneous risk level will be considerable. The risk level is low when there are no activities with potential to increase the probability of loss of containment or ignition. The risk level may increase considerably when one or more of the following occurs:
• Activities are carried out which may lead to loss of containment. • Activities are carried out which may cause ignition in the case of a leak. • Activities are carried out leaving one or several of the safety systems inoperable.
Some activities are required in order to maintain barriers, i.e. their primary purpose may be to keep the risk level at a low value, although they may cause temporary increase of risk during their execution. The risk increasing activities occur at intervals during operations. Some of these may not be relevant for all types of installations. Variations in manning level and manning distribution are also a cause of variations in risk level.
6.3 Objectives of Activity Based Modelling The objectives of adopting activity or condition based modelling are:
• To allow a representation of risk which shows clearly at least the main variations in risk levels according to the activities or conditions.
• To provide, through the representation of risk, an explicit demonstration of the effects of the dominating risk factors.
• To allow monitoring of risk to address instantaneous risk levels rather than average risk levels.
• To enable risk modelling to be used as a planning tool.
ORA paper rev2a.doc 19
6.4 Structuring of Activities and Conditions
6.4.1 Risk Increasing Activities
The activities included in the list below are associated with either increased chance of loss of hydrocarbon containment or increased chance of ignition, should a leak occur:
• Drilling of production wells • Completion of production wells • Wireline operations, coiled tubing operations • Workover operations • Intervention in process systems • Tripping, starting up, shutting down process systems • Interventions on subsea production equipment • Operation of cranes • ‘Hot work’ activities • Opening of pig launcher in order to launch or receive pig • Dismantling of heavy equipment • Marine operations of supply and other vessels and the associated loading/unloading activities.
Hydrocarbon associated risks are usually the highest contributors to major hazard risk. In most instances this aspect of risk will contribute more than 50 % of the major accident hazard risk (i.e. when occupational accidents are disregarded). There may however, be other operations that are associated with increased non-hydrocarbon risk, such as:
• Crane operation • Erection of scaffolding • Landing of helicopter • Approach of a shuttle tanker • Vessel passing the installation at close distance.
6.4.2 Risk Increasing Conditions
The previous subsection discussed operations which are carried out by humans or initiated by human operators, leading to increase in the risk level. There may also be conditions that are associated with increased chance that the control is lost due to barrier failure or unavailability of equipment or systems if loss of containment occurs. In this context, conditions with known unavailability should be considered separately from those conditions with unknown unavailability. Possible risk increasing conditions with known unavailability include the following:
• Fire water partially or completely unavailable • Inhibited gas or fire detectors • Emergency power partially or completely unavailable • ESD valves (one or some) unavailable • Evacuation means (one or some) unavailable • Flare pilot flame ignited (when not ignited continuously)
Possible risk increasing conditions with unknown unavailability include the following:
• Unrevealed faults of gas or fire detectors • Unrevealed faults in emergency power system • Unrevealed faults in ESD valves (one or some)
ORA paper rev2a.doc 20
The first five conditions are associated with reduced availability of safety systems. The implication of the last item is that a flare pilot flame is a possible ignition source for large leaks. The pilot flame of the flare is in many instances considered a safety feature in itself, because it will ensure ignition of a large gas release if dispersed through the flare system. However the pilot flame may also be a source of risk, in the case of large gas release from other platform systems. The latest arrangement being used offshore is to dispense with the pilot flame and ignite the flare only when it is needed.
6.5 Current Modelling of Activities Usually, not all of the conditions and operations listed above are modelled explicitly in QRA models, but most of these operations are covered at least indirectly. The following example may illustrate this: Risk associated with helicopter landing (or take-off) is often the only element of the helicopter associated risk included in a QRA for a specific installation. The risk contribution is usually calculated based upon the following parameters:
• Annual frequency of landing • Probability of crash per landing • Probability of crashing on helideck, or on other platform areas, or in sea • Probability of fatal accident per crash • Fraction of fatalities per fatal accident
The average annual risk is estimated when these values are multiplied together. However, the information above would also allow estimation of the risk contribution per landing, or per day, etc. Risk estimation for many of the other operations or conditions may be done in the same manner, in order to arrive at models that are operation or condition specific. This is rarely done at all, in fact the only analysis of activities that often is carried out, is the use of qualitative studies, like SJA, HAZOP, etc, as discussed in Section 3.2.
6.6 Future Modelling of Activities Modelling of activity/condition based risk may in the future be based on the following: • Exposure • Specific risk level per activity • Activity plans and forecasts This implies that an activity indicator will be very essential, see further discussion in Vinnem et.al. (2003).
7. Conclusions and Recommendations
7.1 Recommended Use of Qualitative Studies – Offshore Operations Qualitative studies have been established in most operator’s safety and risk management system. It is considered to be a practical and efficient tool to provide essential information for decision making of a practical nature. The method combines utilization of qualified personnel with a systematic approach to identify hazards, assess consequences and probabilities, and evaluate prevention and mitigation mea-sures for the ongoing management of risk. Use of qualitative studies are recommended for the following use:
• Practical risk evaluation during planning of major offshore activities • Practical risk evaluation of simultaneous activities • Practical risk evaluation of organizational changes
ORA paper rev2a.doc 21
Qualitative approaches may not be suitable to evaluate barriers or maintenance strategies and intervals. Further, for design and process modifications, quantitative expressions are appreciated by many as it is easier to compare. Thus, quantitative approaches should be developed to account for such issues, and are discussed in the following.
7.2 Recommended Use of Quantitative Studies As already argued, there are a number of decisions in the operational phase that need a quantitative basis for decision-making. This need appears to be agreeable to most HES management experts. The next issue is whether the oil companies need to know the instantaneous risk level on their installations. It may be argued that this is implied by the new NPD management regulations (NPD, 2001), this would be however, a rather conservative interpretation of the requirements. Also the requirements for risk acceptance criteria in the NPD regulations indirectly call for such a detailed quantitative study, but should nevertheless also be open for debate and discussion. This is a separate subject for a future study. Alter all, maybe a more cost effective and sufficient solution from a HES management perspective, is the approach indicated in Figure 2, whereby the ‘total risk’ level in general is assessed relatively crudely, whereas a number of subjects are assessed in more detail, according to what the need may be. Not all of these detailed studies may be possible to integrate into an overall value, if they do not have a common expression of the consequence dimension. Some of the areas where more detailed modelling often may be required, are:
• Modelling of barriers, their impact on the risk level and interactions with performance of operational and maintenance activities.
• Improved illustration of and insight into different aspects of the risk level.
• Improved modelling and illustration of operational, short term and local risk conditions. When carrying out a quantitative study for the operational phase it is important that the team carrying out the work includes both onshore and offshore personnel covering all relevant aspects. The results must also be presented for the users in an understandable and trustworthy manner. Other decision support tools together with the QRA are also needed to develop a safe daily operation, and it is recommended to evaluate how the different decision tools better can be integrated with each other.
7.3 Analysis of Barriers The analysis of barriers is in need of substantial improvement with respect to:
• More explicit modelling of the various barrier elements, and their contributions to the overall barrier function.
• More explicit modelling of the performance of barriers, in relation to the relevant performance parameters.
• Modelling of barriers which allow dependencies and common causes to be explicitly addressed.
• Explicit modelling of the coupling between barriers and the performance of operational and maintenance activities.
ORA paper rev2a.doc 22
7.4 Analysis of Risk Transients It may be inferred from the discussions in Section 6 that a detailed quantitative analysis of all transi-ents is required. But this is far from an obvious conclusion. The opposite approach would be to perform an overall quantitative assessment which gives the opportunity to compare with general risk acceptance limits, addressing annual accumulated values (often referred to as ‘annual average values’), without considerations of transients. But detailed assessment of some transients may be required for certain conditions: • Particularly critical transient conditions (e.g. activities that have a high risk intensity, but a low
contribution to annual fatality risk dose, because of short duration.) • Transients that are vital in order to identify risk reducing measures and/or actions (e.g. where risk
reducing measures need to be defined relative to the transient conditions rather than ‘average conditions’.)
It is not obvious that risk acceptance criteria need to be available for analysis of such transients. The main conclusion offered here is that analysis of transients may be carried out also when risk acceptance criteria for transient do not exist. The analysis results will in such cases be evaluated in a relative sense, as well as in an ALARP context.
8. Abbreviations ALARP As low as reasonably practicable CSE Concept safety evaluations DRA Design risk assessment FAR Fatal accident rate FIREPRAN Fire protection risk analysis HAZID Hazard identification HAZOP Hazard and operability study HES Health, environment and safety HRA Human reliability analyses IR Individual risk MORT Management Oversight and Risk Tree MTO Human Technology Organisation NPD Norwegian Petroleum Directorate OLF Norwegian Oil Industry Association ORA Operational risk assessment PFD Probability of Failure on Demand PSA Probabilistic safety assessment QRA Quantitative risk assessment RMS Risk Monitoring System SAFOP Safe Operations Analysis SIMOPS Simultaneous operations SJA Safe job analysis TATO “Take two” (“Ta to” in Norwegian) TRA Total Risk Analysis TTS State of Technical Safety
9. Acknowledgement The authors are indebted to NFR for the funding of the work and their parent organisations for the permissions to publish this paper. During the preparation of the paper, a large group of specialists has
ORA paper rev2a.doc 23
been consulted at various stages, orally and in writing. We are obliged to all those that have provided comments, for the time they have taken to review and provide very valuable input to the process.
10. References Aven, T. 2003. How to approach risk and uncertainty to support decision-making. Wiley NY, to appear Acona Group AS, Operational Risk Analysis – Phase I, Report AJ-10260, 2002.07.17 Bäckström, O., Vinnem J E., 2003. (to be presented) Bedford, T., Cooke, R., 2001. Probabilistic Risk Analysis; Foundations and Methods, Cambridge, UK. Bento, J-P., 1999. Human – Technology – Organisation; MTO-analysis of event reports. OD-00-2. (In
Swedish). Restricted. Det Norske Veritas & Scandpower, Operational Risk Analysis – Phase I, DNV Report 2002-0717,
2002.10.04 Hale, A. R., Guldenmund, F., Smit, K., Bellamy, L., 1998. Modification of technical risk assessment
with management weighting factors. In Lydersen, S., Hansen, G., Sandtorv, H. (eds) Safety and Reliability, Proceedings from ESREL'98, Rotterdam, Balkema, pp. 115-120.
Hansen, G. K., Aarø, R., 1997. Reliability Quantification of Computer-Based Safety Systems. An Introduction to PDS. SINTEF report STF38 A97434.
Husebø, T., E. Ravnås, Ø. Lauritsen, E. Lootz, H. Brandanger Haga, M. Haugstøyl, A. Kvitrud, J. E. Vinnem, O. Tveit, T. Aven, K. Haukelid og A. J. Ringstad (2002). Utvikling i risikonivå- norsk sokkel. Fase 2 rapport 2001 (Oljedirektoratet, OD- 02-07, www.npd.no).
IAEA, 1998, IAEA, Draft-document, PSA Applications to Improve NPP Safety, IAEA-J4-97-CT-06876, February 1998, Vienna, Austria.
IAEA (2001). IAEA-TECDOC-1200. Applications of probabilistic safety assessment (PSA) for nuclear power plants. ISSN 1011-4289. IAEA, Vienna, Austria.
IEC 61508. "Functional safety of electrical/electronic/programmable electronic (E/E/PE) safety related systems", part 1-7, Edition 1.0 (various dates).
ISO, 2000. Petroleum and natural gas industry – Offshore production installations – Guidelines on tools and techniques for identification and assessment of hazards, ISO 17776.
Johnson, W. G., 1980. MORT Safety Assurance Systems, Marcel Dekker, New York, USA. Kafka, P., 1994. Living PSA – Risk Monitor: Current Developments. IAEA TCM, Budapest 7-11
Sept. 1992, IAEA-TECDOC-737, March 1994, IAEA, Vienna, Austria. Lord Cullen, 1990. Inquiring into the Piper Alpha Disaster, HMSO 1990 NTS, 2001. NORSOK Standard Z-013, Risk and Emergency Preparedness Analysis, 2001 Norwegian Petroleum Directorate. (2001). Regulations relating to Management in the Petroleum
Activities (the Management Regulations). (http://www.npd.no/regelverk/ r2002/frame_e.htm).
Norwegian Petroleum Directorate. (2002). Guidelines to Regulations relating to Management in the Petroleum Activities (the Management Regulations). (http://www.npd.no/regelverk/ r2002/frame_e.htm).
OLF guideline 070 on the application of IEC 61508 and IEC 61511 in the petroleum activities on the Norwegian Continental Shelf, OLF, Rev. 01, 26-01-2001; (see http://www.itk.ntnu.no/sil).
Reason, J., 1997. Managing the Risks of Organizational Accidents, Ashgate, England. Sørum, M., Firing, F., Endresen, I., Øvrebø, R., Storhoug, O., Berg, F. R., Hvam, C., Holmboe, R. H.,
Austbø, J. S., 2002. Mapping of state of technical safety in Statoil; Main report. (In Norwegian). Restricted.
Veire, G., 2002. Private communication with Gunnar Veire, Statoil Vinnem, J.E., 1998. Use of performance indicators for monitoring HSE operating achievement.
Proceedings of ESREL’98, Trondheim, Norway, 16-19 June: 127-35: Balkema. Vinnem, J.E., 1999. Risk Assessment of Offshore Platforms, Keynote note paper to ESREL 1999, Munich, October, 1999. Vinnem, J.E. 2000. Risk Monitoring for Major Hazards, SPE61283, SPE International Conference on Health, Safety and the Environment in Oil and Gas Exploration and Production in Stavanger, Norway 26–28 June 2000.

ORA paper rev2a.doc 24
Vinnem, J.E., Aven, T., Sørum, M., Øien, K. 2003. Structured approach to risk indicators for major hazards, ESREL2003, Mastricht, 15-18 June, 2003 (to be published) Øien, K., Sklet, S., Nielsen, L., 1997. Risk Level Indicators for Surveillance of Changes in Risk Level.
Proceedings of ESREL’97, Lisbon, Portugal, 17-20 June, Pergamon, pp. 1809-16. Øien, K., Sklet, S., Nielsen, L., 1998. Development of risk level indicators for a petroleum production
platform. Proceedings of the 9th International Symposium of Loss Prevention and Safety Promotion in the Process Industries, 4-7 May, 1998, Barcelona, Spain, pp. 382-393.
Øien, K., Sklet, S., 1999. Risk Control during Operation of Offshore Petroleum Installations. Proceedings of ESREL’99, Munich, Germany, 13-17 September, Springer, pp. 1297-1302.
Øien, K., 2001. Risk Control of Offshore Installations – A Framework for the Establishment of Risk Indicators. NTNU 2001:04, Trondheim, Mai 2001.