mro forecast and market trends - iata · pdf file0 mro forecast and market trends presented...
TRANSCRIPT
0
MRO Forecast and Market Trends
Presented by:
Martin HarrisonManaging Director ICF International
11
Today’s Agenda
Follow the Money
MRO Forecast
Impact of New Technology Aircraft
Trends to Watch:
The Mod Squad
March of the Middle East Titans
Amazon the Disrupter
Training 2.0: Virtual Reality

22
Follow the Money
33
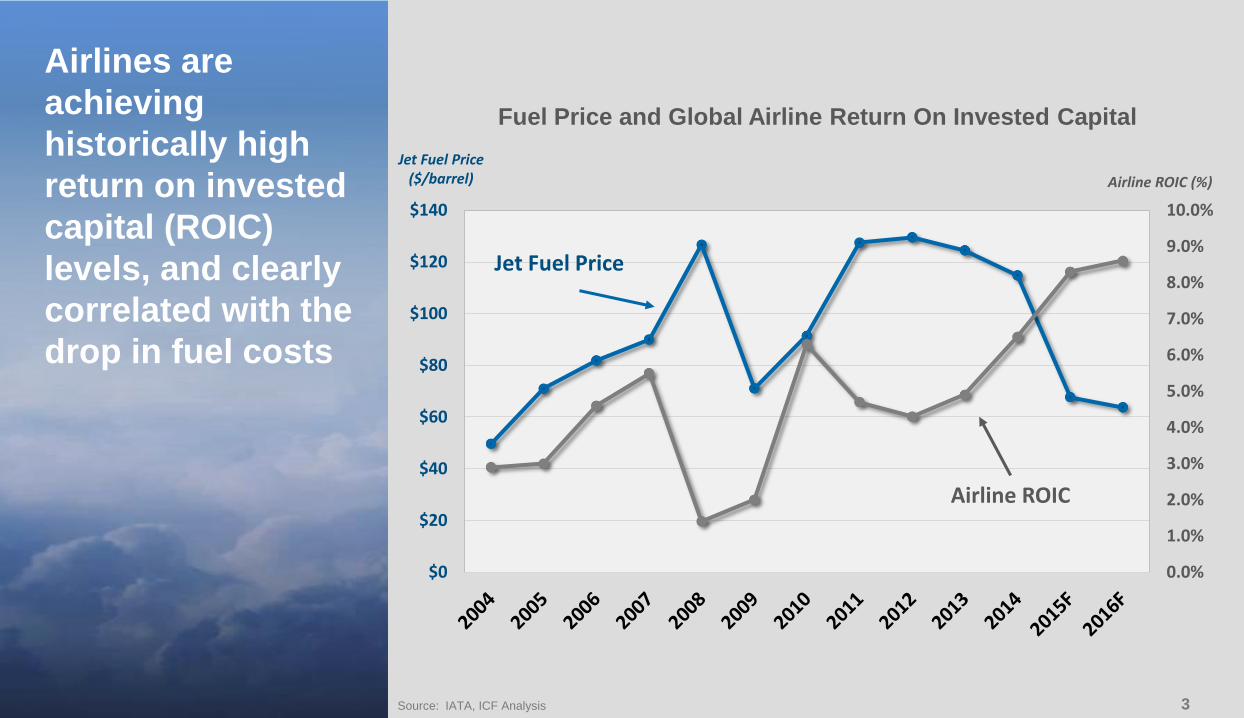
Airlines are
achieving
historically high
return on invested
capital (ROIC)
levels, and clearly
correlated with the
drop in fuel costs
Source: IATA, ICF Analysis
Fuel Price and Global Airline Return On Invested Capital
0.0%
1.0%
2.0%
3.0%
4.0%
5.0%
6.0%
7.0%
8.0%
9.0%
10.0%
$0
$20
$40
$60
$80
$100
$120
$140
Jet Fuel Price ($/barrel) Airline ROIC (%)
Airline ROIC
Jet Fuel Price
44
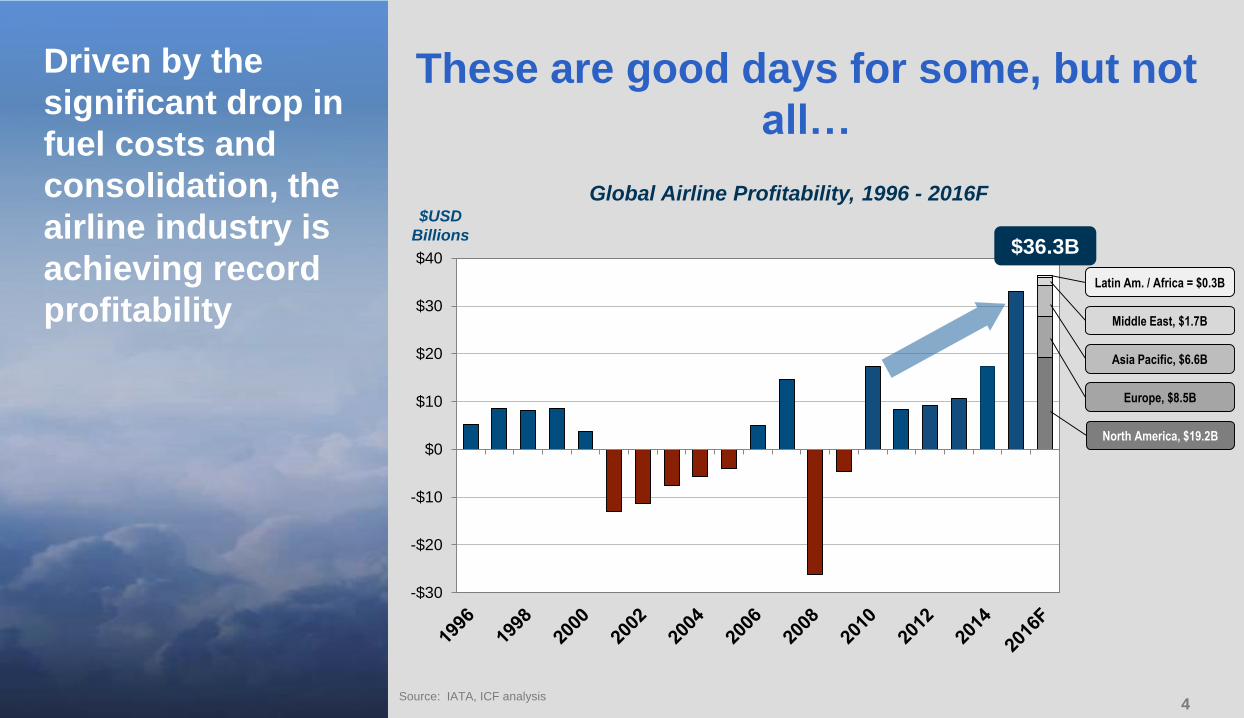
Driven by the
significant drop in
fuel costs and
consolidation, the
airline industry is
achieving record
profitability
Source: IATA, ICF analysis
These are good days for some, but not
all…
Global Airline Profitability, 1996 - 2016F
-$30
-$20
-$10
$0
$10
$20
$30
$40
$USD
Billions$36.3B
Asia Pacific, $6.6B
North America, $19.2B
Europe, $8.5B
Middle East, $1.7B
Latin Am. / Africa = $0.3B
55
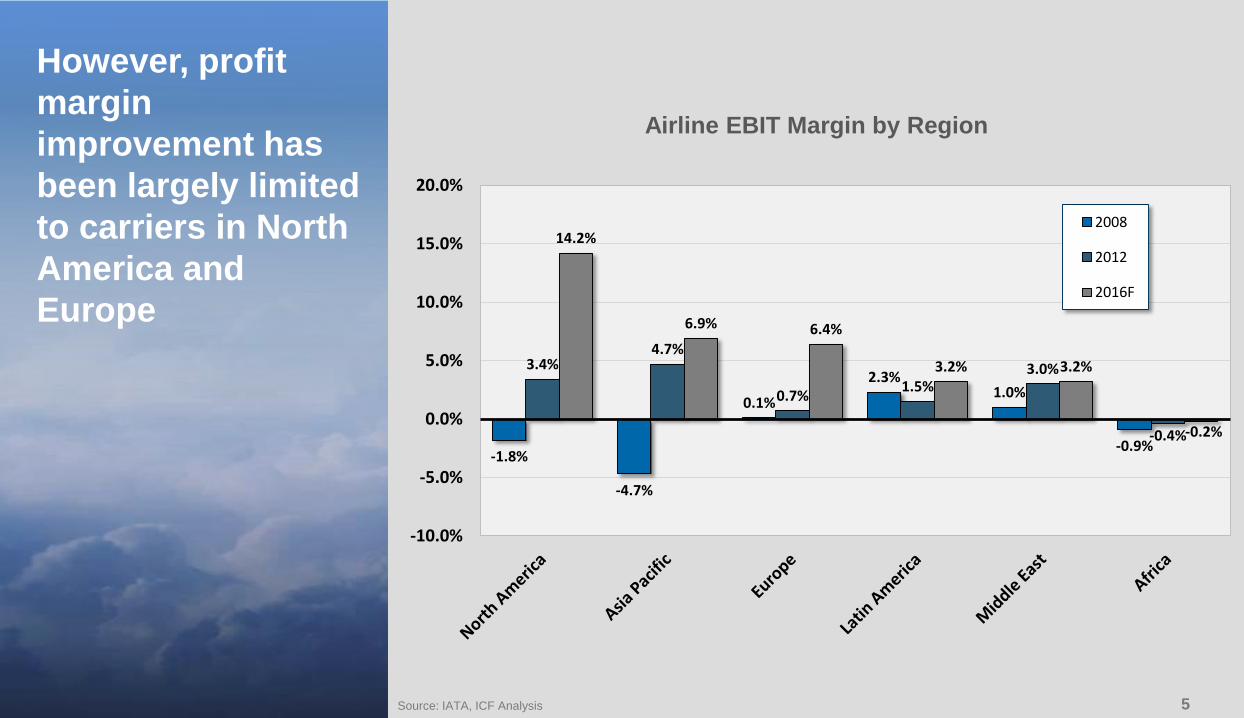
However, profit
margin
improvement has
been largely limited
to carriers in North
America and
Europe
Source: IATA, ICF Analysis
-1.8%
-4.7%
0.1%
2.3%1.0%
-0.9%
3.4%4.7%
0.7%1.5%
3.0%
-0.4%
14.2%
6.9% 6.4%
3.2% 3.2%
-0.2%
-10.0%
-5.0%
0.0%
5.0%
10.0%
15.0%
20.0%
2008
2012
2016F
Airline EBIT Margin by Region
66
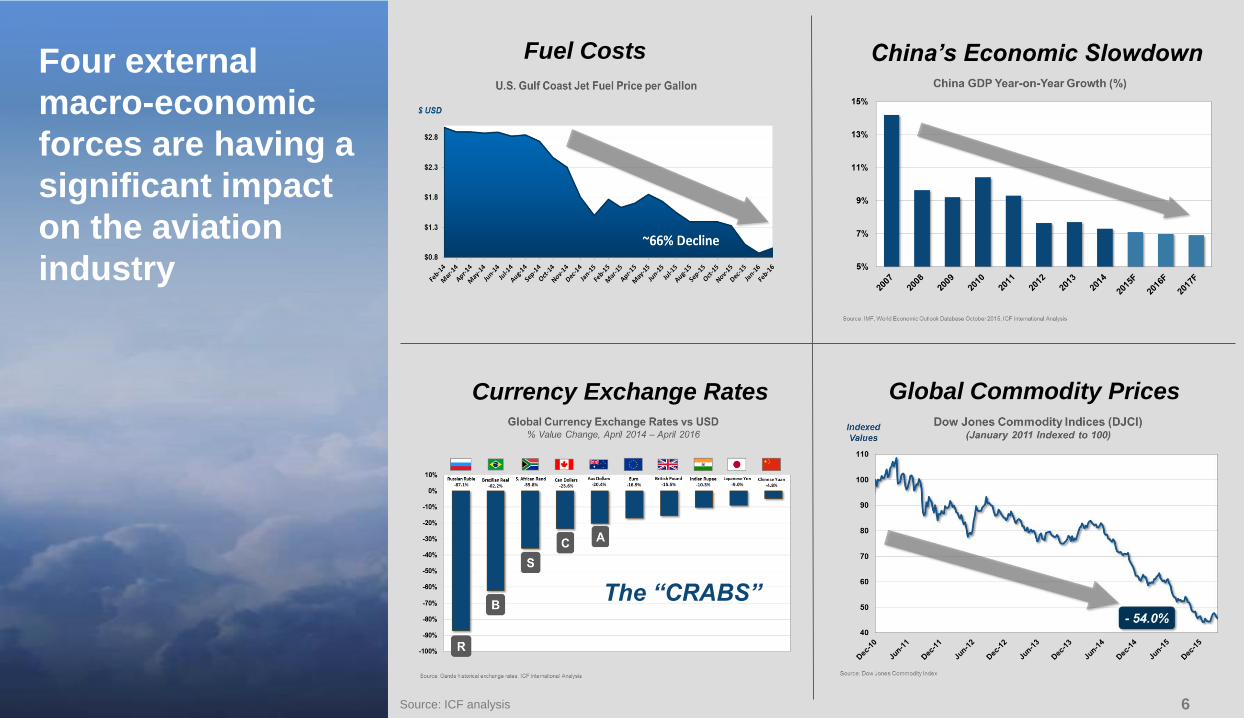
Four external
macro-economic
forces are having a
significant impact
on the aviation
industry
The “CRABS”
Currency Exchange Rates Global Commodity Prices
China’s Economic SlowdownFuel Costs
Source: ICF analysis
77
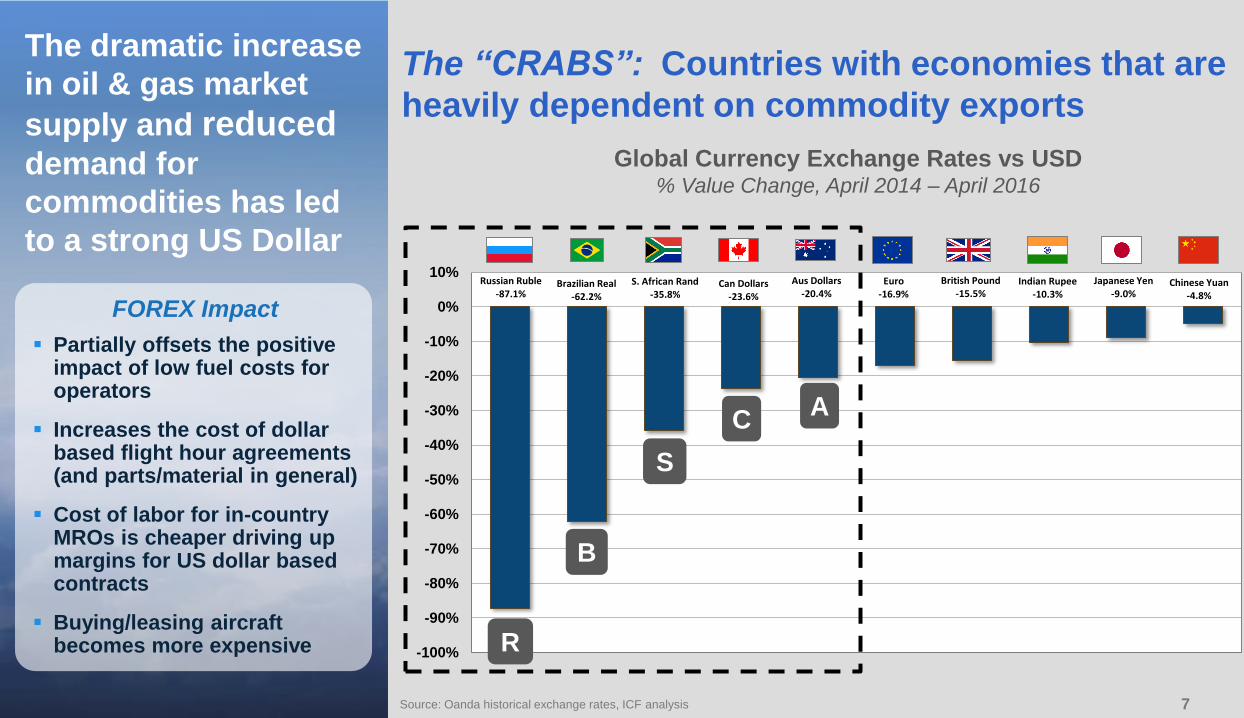
The dramatic increase
in oil & gas market
supply and reduceddemand for
commodities has led
to a strong US Dollar
Partially offsets the positive impact of low fuel costs for operators
Increases the cost of dollar based flight hour agreements (and parts/material in general)
Cost of labor for in-country MROs is cheaper driving up margins for US dollar based contracts
Buying/leasing aircraft becomes more expensive
FOREX Impact
Source: Oanda historical exchange rates, ICF analysis
The “CRABS”: Countries with economies that are
heavily dependent on commodity exports
Global Currency Exchange Rates vs USD% Value Change, April 2014 – April 2016
Russian Ruble-87.1%
Brazilian Real-62.2%
S. African Rand-35.8%
Can Dollars-23.6%
Aus Dollars-20.4%
Euro-16.9%
British Pound-15.5%
Indian Rupee-10.3%
Japanese Yen-9.0%
Chinese Yuan-4.8%
-100%
-90%
-80%
-70%
-60%
-50%
-40%
-30%
-20%
-10%
0%
10%
B
R
C
S
A
88
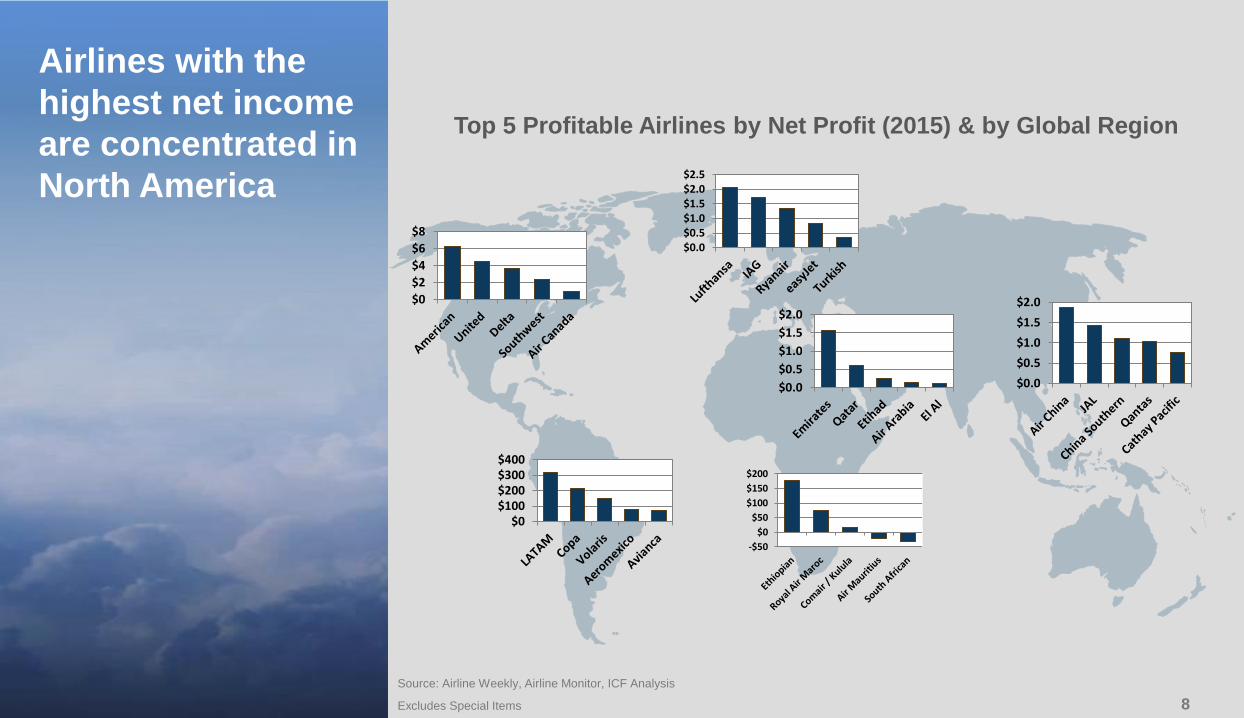
Airlines with the
highest net income
are concentrated in
North America
Source: Airline Weekly, Airline Monitor, ICF Analysis
Excludes Special Items
$0
$2
$4
$6
$8
$0$100$200$300$400
$0.0$0.5$1.0$1.5$2.0$2.5
$0.0
$0.5
$1.0
$1.5
$2.0
-$50
$0
$50
$100
$150
$200
$0.0
$0.5
$1.0
$1.5
$2.0
Tho
usa
nd
s
Top 5 Profitable Airlines by Net Profit (2015) & by Global Region
99
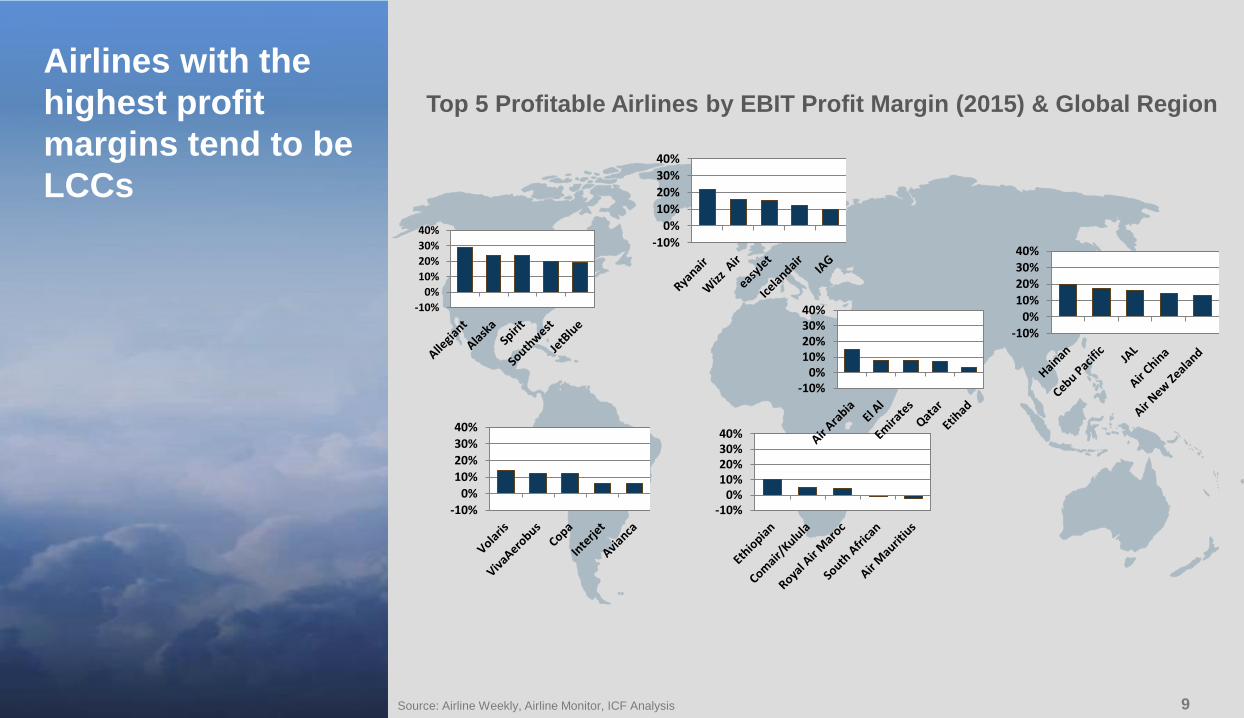
Airlines with the
highest profit
margins tend to be
LCCs
Source: Airline Weekly, Airline Monitor, ICF Analysis
-10%
0%
10%
20%
30%
40%
-10%0%
10%
20%
30%
40%
-10%0%
10%20%30%40%
-10%0%
10%20%30%40%
-10%
0%
10%
20%
30%
40%
-10%0%
10%20%30%40%
Top 5 Profitable Airlines by EBIT Profit Margin (2015) & Global Region
1010
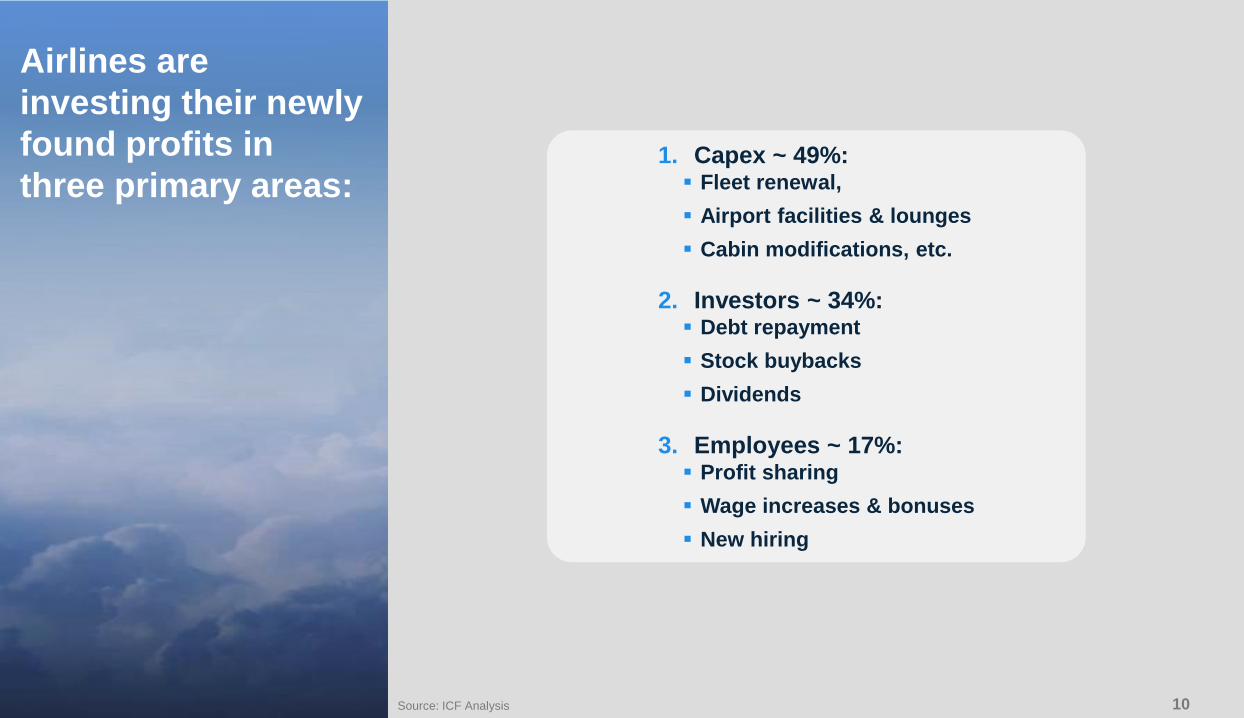
Airlines are
investing their newly
found profits in
three primary areas:
Source: ICF Analysis
1. Capex ~ 49%: Fleet renewal,
Airport facilities & lounges
Cabin modifications, etc.
2. Investors ~ 34%: Debt repayment
Stock buybacks
Dividends
3. Employees ~ 17%: Profit sharing
Wage increases & bonuses
New hiring

1111
MRO Forecast
1212
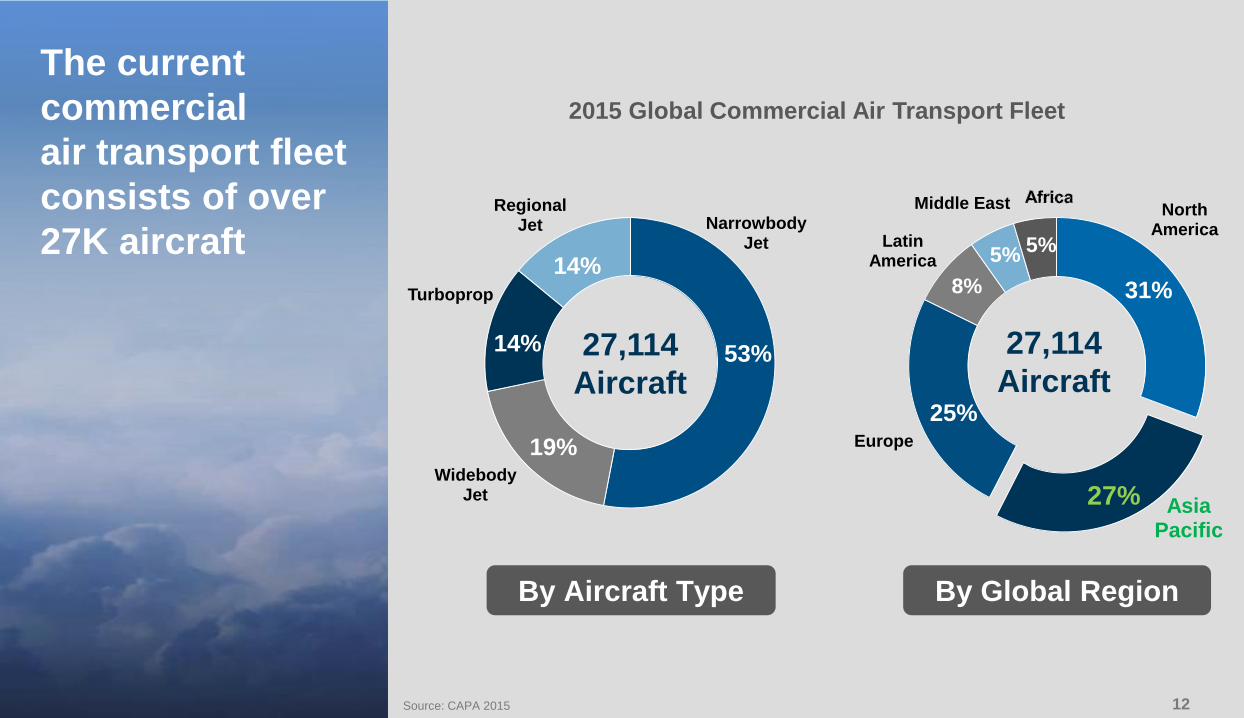
The current
commercial
air transport fleet
consists of over
27K aircraft
Source: CAPA 2015
NarrowbodyJet
WidebodyJet
Turboprop
Regional Jet
27,114
Aircraft
14%
53%14%
19%
By Aircraft Type By Global Region
North America
Asia Pacific
Europe
Latin America
Middle East
31%
27%
25%
8%
5% 5%
27,114
Aircraft
2015 Global Commercial Air Transport Fleet
1313
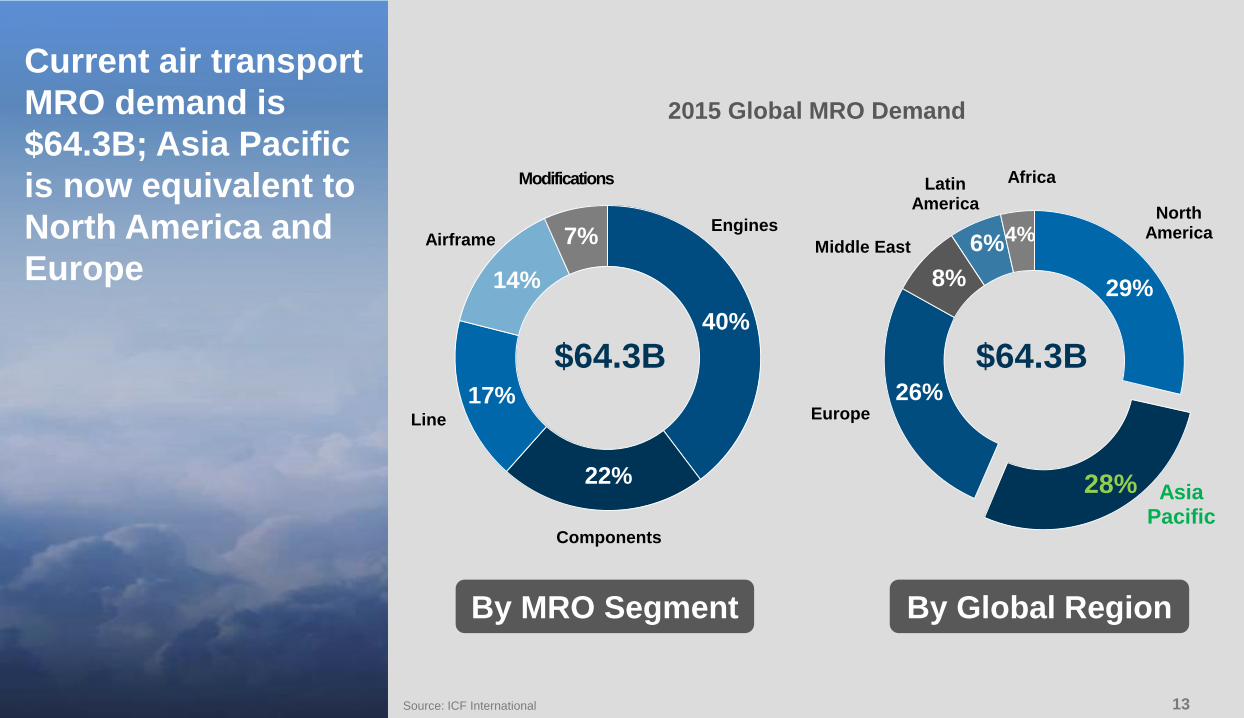
Current air transport
MRO demand is
$64.3B; Asia Pacific
is now equivalent to
North America and
Europe
Source: ICF International
Engines
Components
Line
Airframe
Modifications
14%
17%
22%
40%
7%North
America
Asia Pacific
Europe
Middle East
Latin America
Africa
29%
28%
26%
8%
6%4%
$64.3B$64.3B
By MRO Segment By Global Region
2015 Global MRO Demand
1414
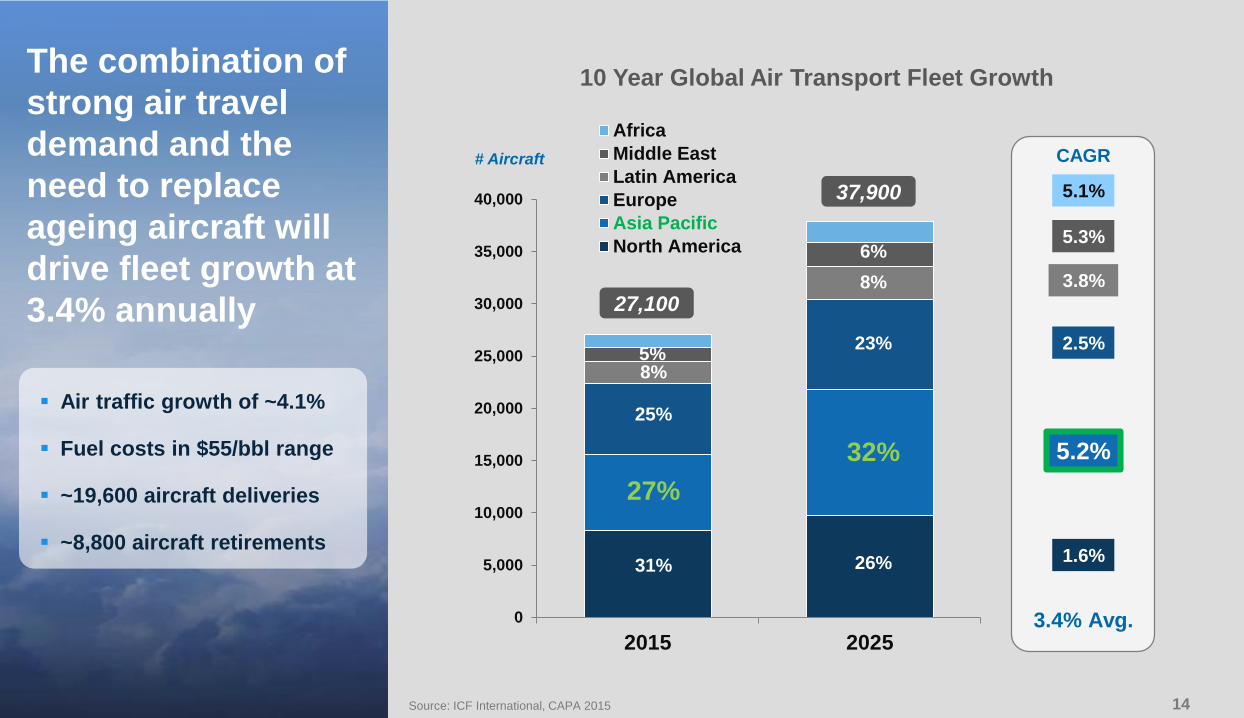
The combination of
strong air travel
demand and the
need to replace
ageing aircraft will
drive fleet growth at
3.4% annually
Source: ICF International, CAPA 2015
Air traffic growth of ~4.1%
Fuel costs in $55/bbl range
~19,600 aircraft deliveries
~8,800 aircraft retirements
0
5,000
10,000
15,000
20,000
25,000
30,000
35,000
40,000
2015 2025
Africa
Middle East
Latin America
Europe
Asia Pacific
North America
27,100
31% 26%
37,900
27%
25%
8%
32%
23%
8%
# Aircraft
3.8%
2.5%
1.6%
5.2%
5.3%
5.1%
CAGR
3.4% Avg.
5%
6%
10 Year Global Air Transport Fleet Growth
1515
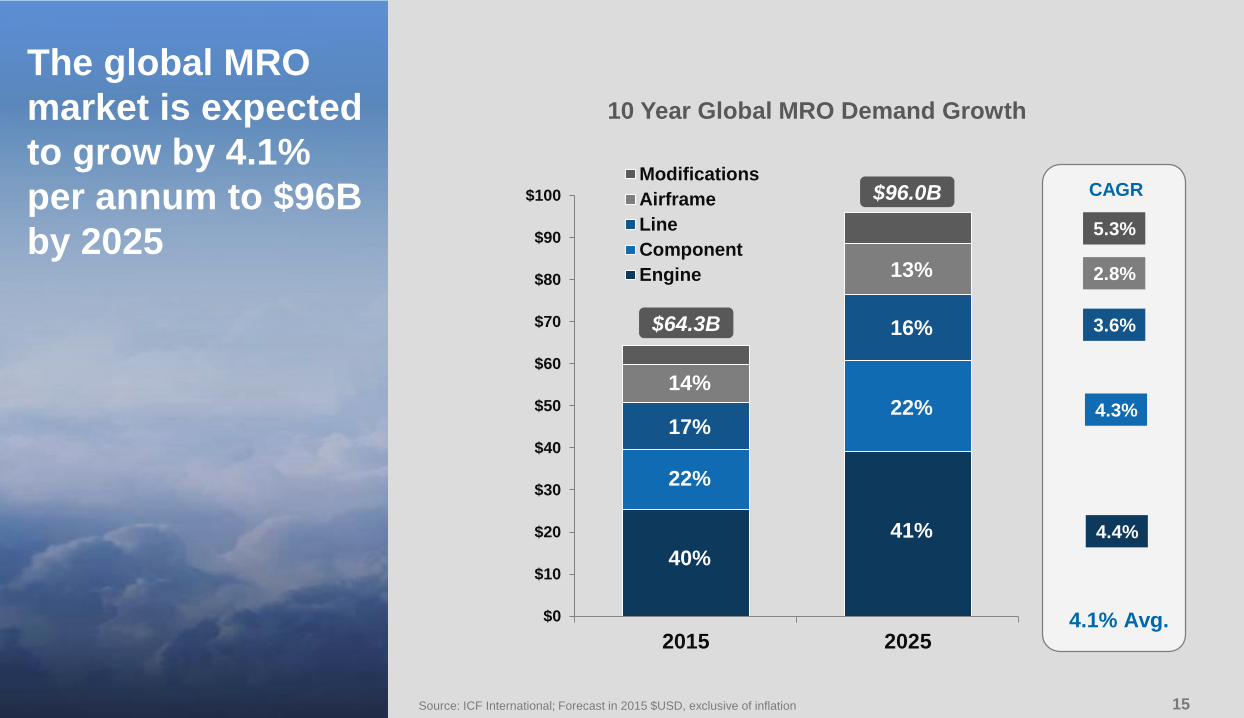
The global MRO
market is expected
to grow by 4.1%
per annum to $96B
by 2025
Source: ICF International; Forecast in 2015 $USD, exclusive of inflation
$0
$10
$20
$30
$40
$50
$60
$70
$80
$90
$100
2015 2025
Modifications
Airframe
Line
Component
Engine
40%
22%
14%
17%
$64.3B
$96.0B
2.8%
3.6%
4.3%
4.4%
CAGR
4.1% Avg.
5.3%
41%
22%
16%
13%
10 Year Global MRO Demand Growth
1616
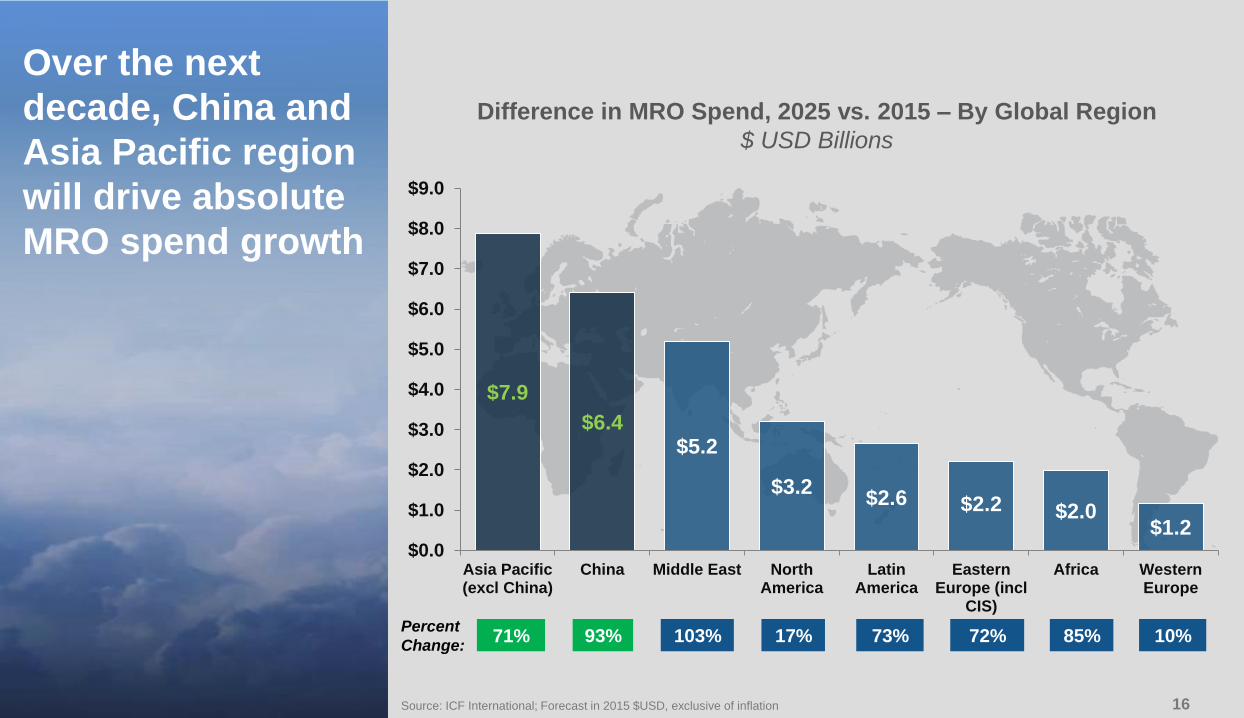
Over the next
decade, China and
Asia Pacific region
will drive absolute
MRO spend growth
Source: ICF International; Forecast in 2015 $USD, exclusive of inflation
Difference in MRO Spend, 2025 vs. 2015 – By Global Region
$ USD Billions
$7.9
$6.4$5.2
$3.2$2.6 $2.2 $2.0
$1.2$0.0
$1.0
$2.0
$3.0
$4.0
$5.0
$6.0
$7.0
$8.0
$9.0
Asia Pacific(excl China)
China Middle East NorthAmerica
LatinAmerica
EasternEurope (incl
CIS)
Africa WesternEurope
71% 93% 103% 17% 73% 72% 85% 10%Percent
Change:
1717
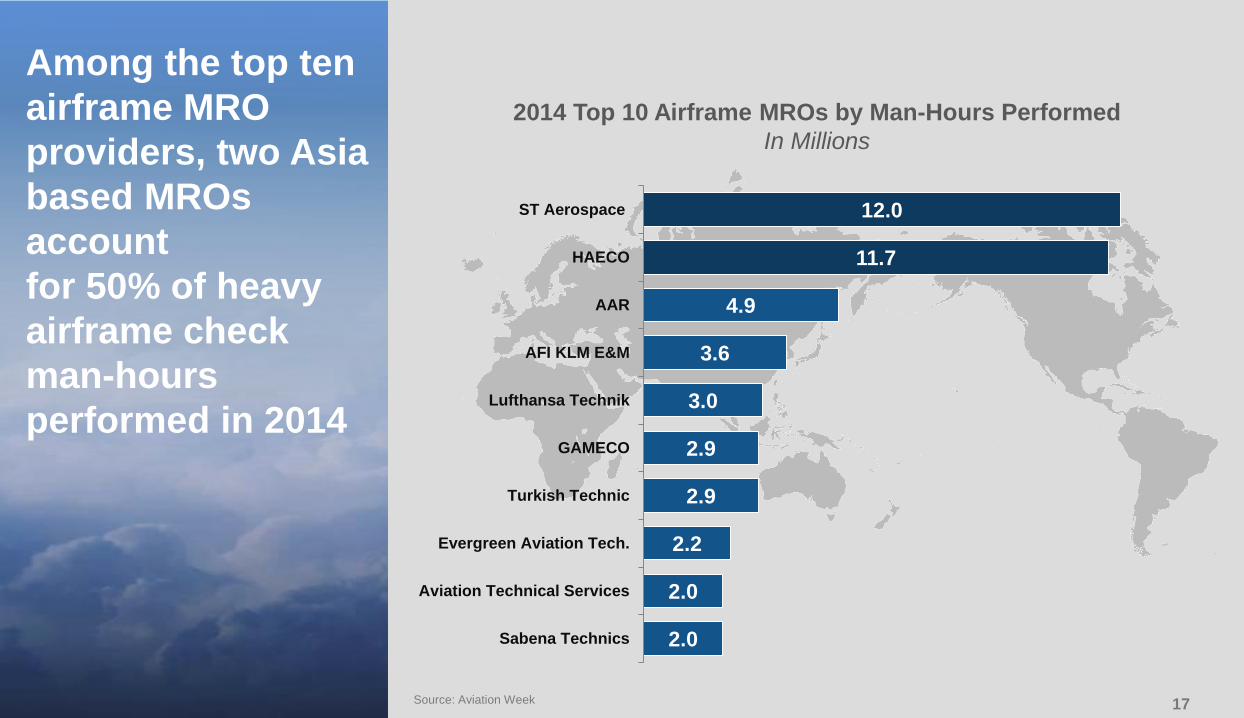
2014 Top 10 Airframe MROs by Man-Hours Performed
In Millions
Among the top ten
airframe MRO
providers, two Asia
based MROs
account
for 50% of heavy
airframe check
man-hours
performed in 2014
Source: Aviation Week
12.0
11.7
4.9
3.6
3.0
2.9
2.9
2.2
2.0
2.0
ST Aerospace
HAECO
AAR
AFI KLM E&M
Lufthansa Technik
GAMECO
Turkish Technic
Evergreen Aviation Tech.
Aviation Technical Services
Sabena Technics

1818
Impact of
New Technology Aircraft
1919
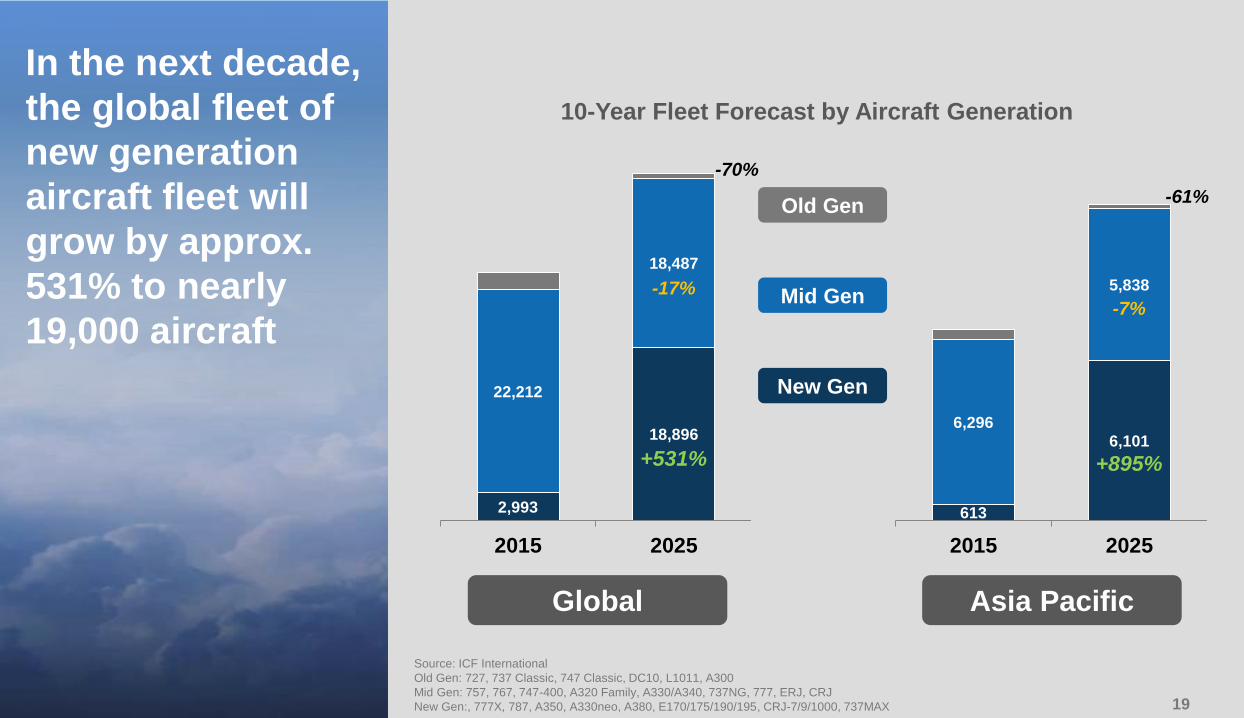
In the next decade,
the global fleet of
new generation
aircraft fleet will
grow by approx.
531% to nearly
19,000 aircraft
10-Year Fleet Forecast by Aircraft Generation
2,993
18,896
22,212
18,487
2015 2025
Global
New Gen
Mid Gen
Old Gen
Source: ICF International
Old Gen: 727, 737 Classic, 747 Classic, DC10, L1011, A300
Mid Gen: 757, 767, 747-400, A320 Family, A330/A340, 737NG, 777, ERJ, CRJ
New Gen:, 777X, 787, A350, A330neo, A380, E170/175/190/195, CRJ-7/9/1000, 737MAX
Asia Pacific
+531%
-70%
-17%
613
6,1016,296
5,838
2015 2025
+895%
-7%
-61%
2020
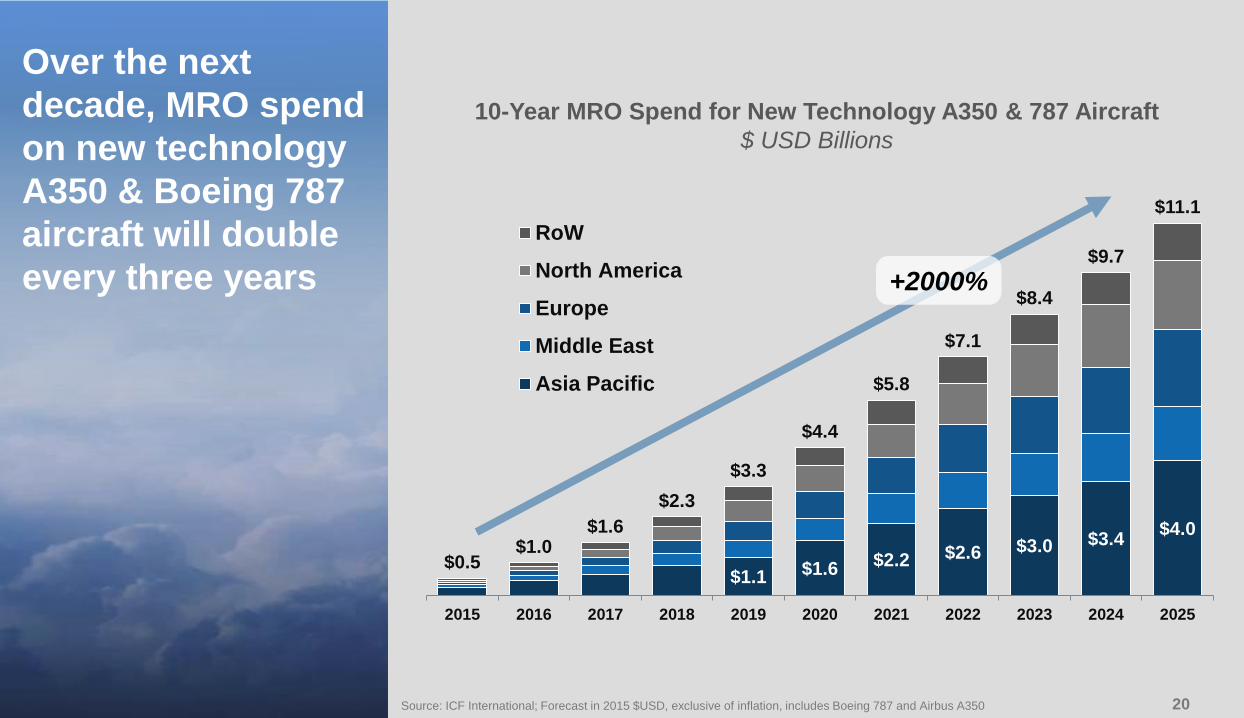
Over the next
decade, MRO spend
on new technology
A350 & Boeing 787
aircraft will double
every three years
Source: ICF International; Forecast in 2015 $USD, exclusive of inflation, includes Boeing 787 and Airbus A350
10-Year MRO Spend for New Technology A350 & 787 Aircraft
$ USD Billions
$1.1 $1.6 $2.2 $2.6 $3.0 $3.4$4.0
$0.5$1.0
$1.6
$2.3
$3.3
$4.4
$5.8
$7.1
$8.4
$9.7
$11.1
2015 2016 2017 2018 2019 2020 2021 2022 2023 2024 2025
RoW
North America
Europe
Middle East
Asia Pacific
+2000%
2121
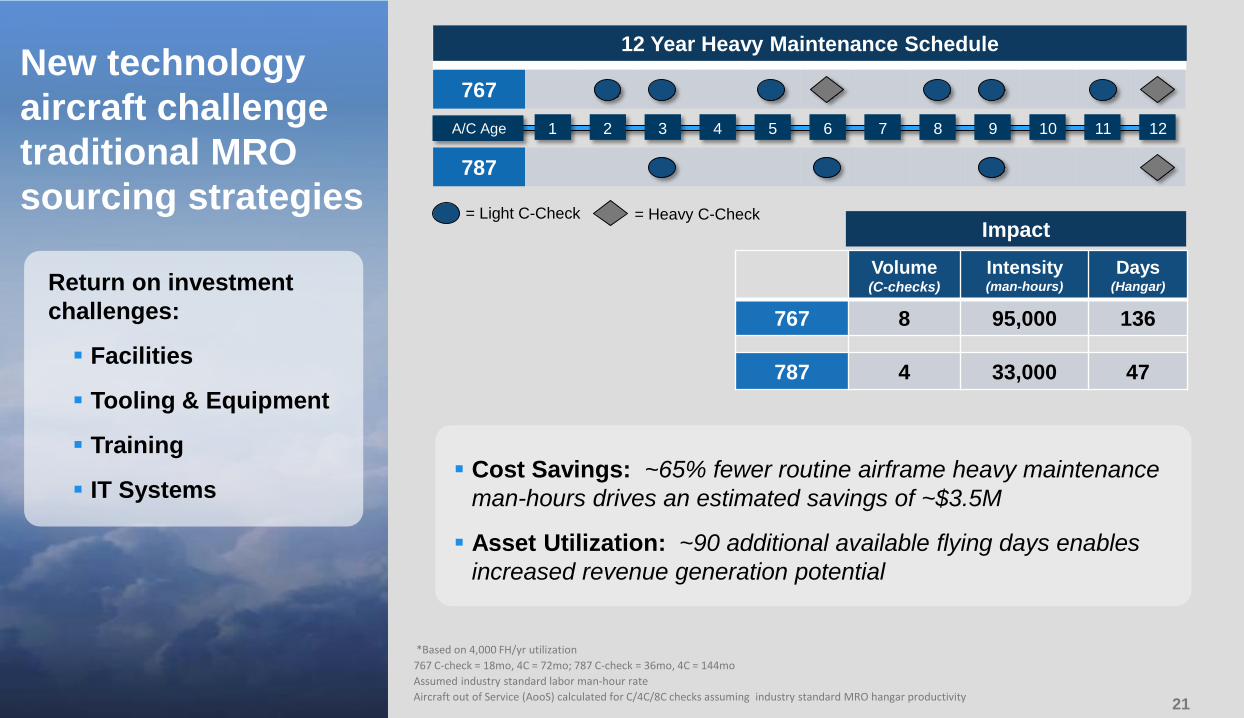
New technology
aircraft challenge
traditional MRO
sourcing strategies= Heavy C-Check= Light C-Check
767
A/C Age 1 2 3 4 5 6 7 8 9 10 11 12
787
Volume(C-checks)
Intensity(man-hours)
Days(Hangar)
767 8 95,000 136
787 4 33,000 47
Impact
Cost Savings: ~65% fewer routine airframe heavy maintenance
man-hours drives an estimated savings of ~$3.5M
Asset Utilization: ~90 additional available flying days enables
increased revenue generation potential
12 Year Heavy Maintenance Schedule
*Based on 4,000 FH/yr utilization
767 C-check = 18mo, 4C = 72mo; 787 C-check = 36mo, 4C = 144mo
Assumed industry standard labor man-hour rate
Aircraft out of Service (AooS) calculated for C/4C/8C checks assuming industry standard MRO hangar productivity
Return on investment
challenges:
Facilities
Tooling & Equipment
Training
IT Systems
2222
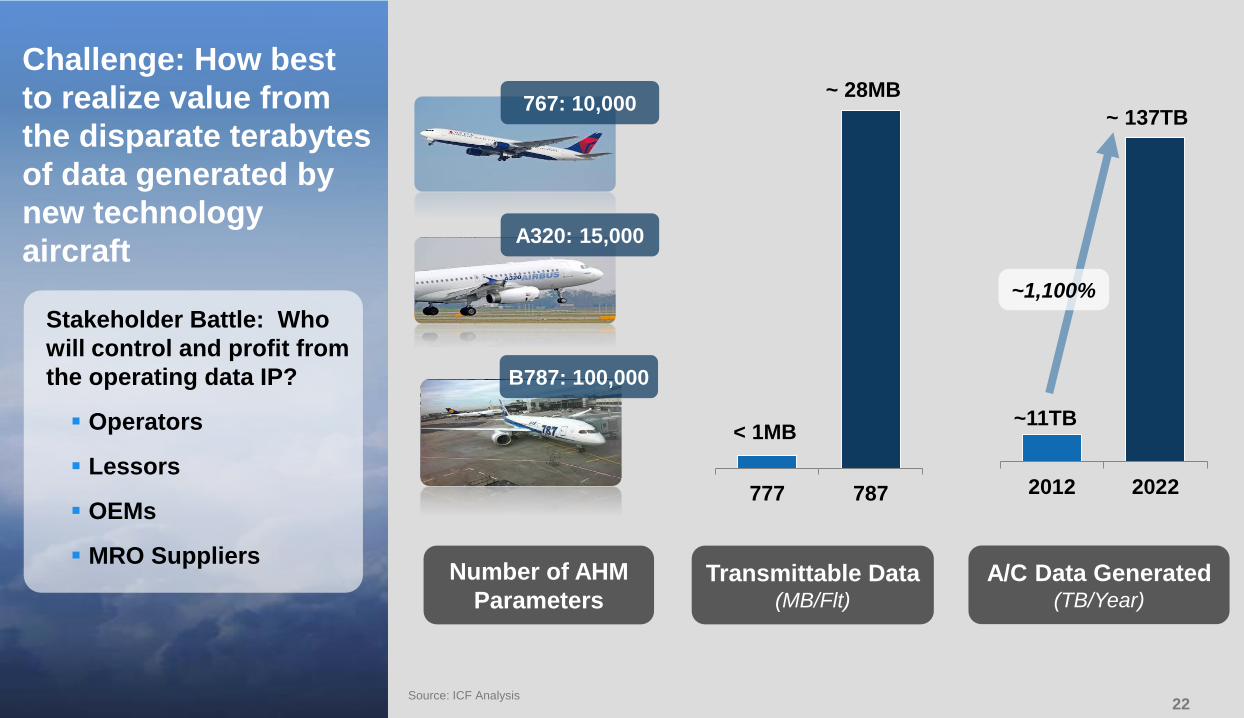
Challenge: How best
to realize value from
the disparate terabytes
of data generated by
new technology
aircraft
Source: ICF Analysis
Number of AHM
Parameters
A320: 15,000
B787: 100,000
2012 2022
~ 137TB
~11TB
777 787
~ 28MB
< 1MB
Stakeholder Battle: Who
will control and profit from
the operating data IP?
Operators
Lessors
OEMs
MRO SuppliersTransmittable Data
(MB/Flt)
A/C Data Generated(TB/Year)
767: 10,000
~1,100%

2323
Trends to Watch…
2424
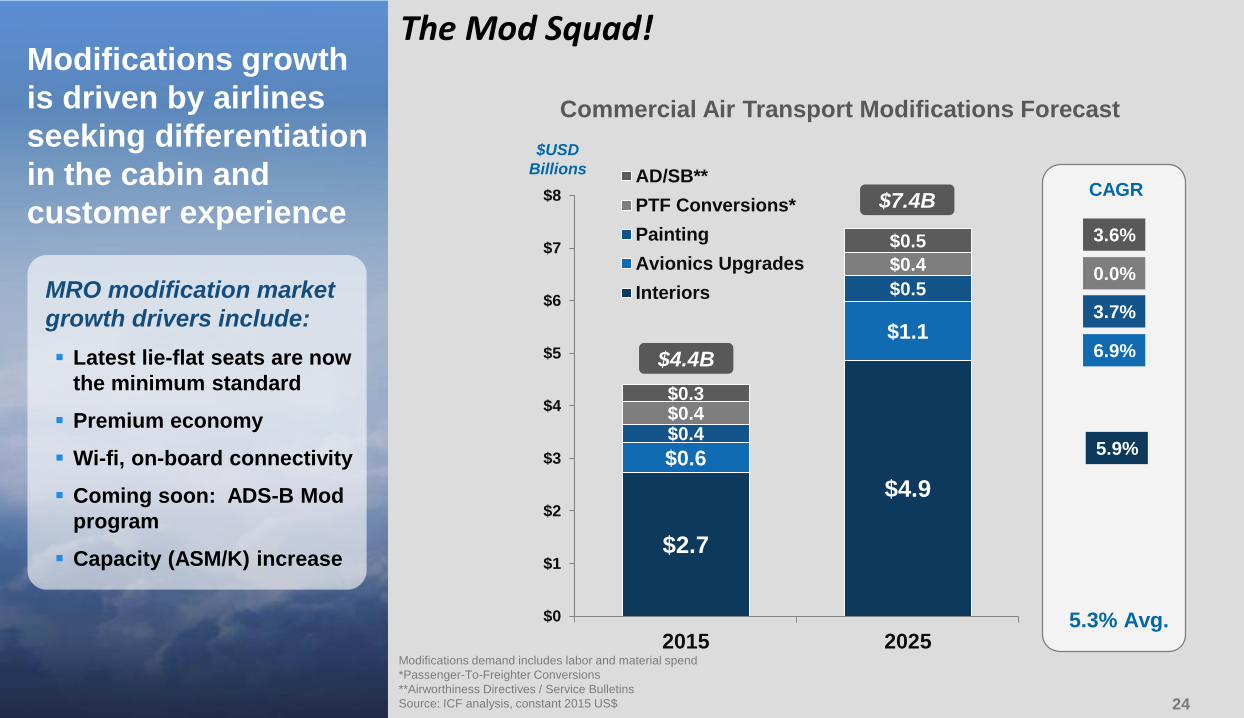
Modifications growth
is driven by airlines
seeking differentiation
in the cabin and
customer experience
Modifications demand includes labor and material spend
*Passenger-To-Freighter Conversions
**Airworthiness Directives / Service Bulletins
Source: ICF analysis, constant 2015 US$
MRO modification market
growth drivers include:
Latest lie-flat seats are now
the minimum standard
Premium economy
Wi-fi, on-board connectivity
Coming soon: ADS-B Mod
program
Capacity (ASM/K) increase
Commercial Air Transport Modifications Forecast
$2.7
$4.9
$0.6
$1.1
$0.4
$0.5
$0.4
$0.4
$0.3
$0.5
$0
$1
$2
$3
$4
$5
$6
$7
$8
2015 2025
AD/SB**
PTF Conversions*
Painting
Avionics Upgrades
Interiors
$4.4B
$7.4B
0.0%
3.7%
6.9%
5.9%
CAGR
5.3% Avg.
3.6%
$USD
Billions
The Mod Squad!
2525
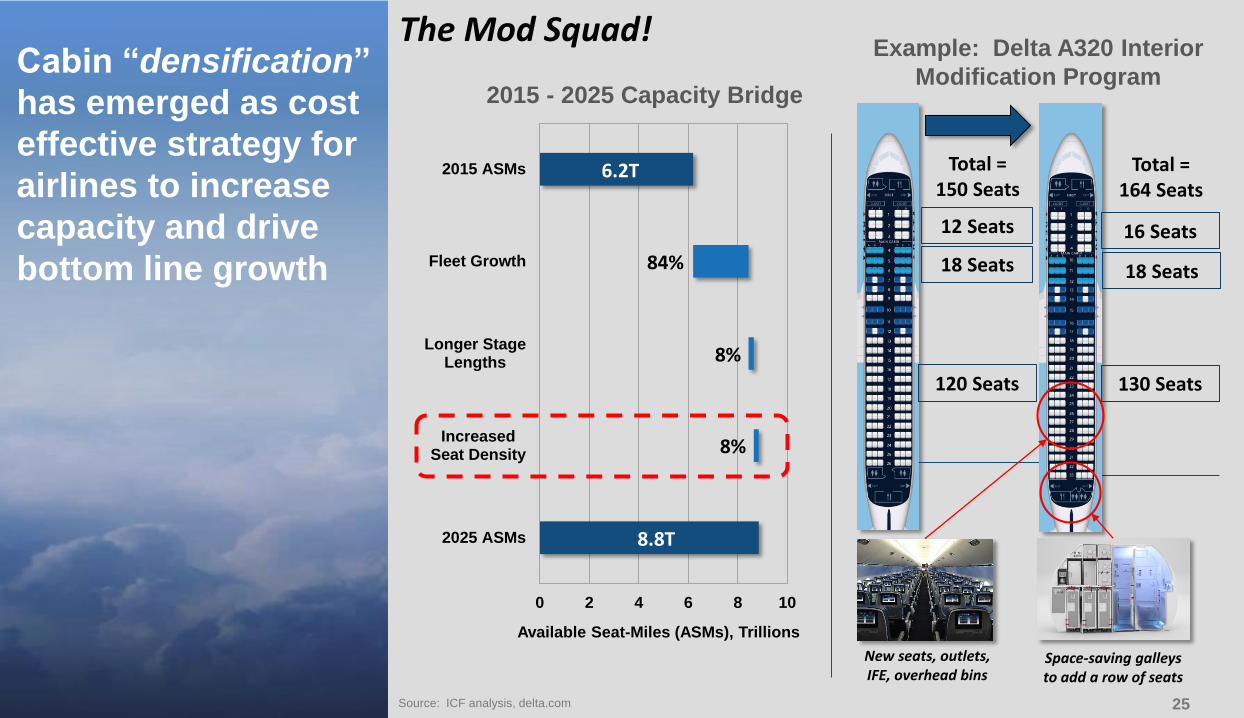
Cabin “densification”
has emerged as cost
effective strategy for
airlines to increase
capacity and drive
bottom line growth
2015 - 2025 Capacity Bridge
0 2 4 6 8 10
2025 ASMs
IncreasedSeat Density
Longer StageLengths
Fleet Growth
2015 ASMs
Available Seat-Miles (ASMs), Trillions
6.2T
8.8T
84%
8%
8%
12 Seats 16 Seats
130 Seats120 Seats
Total = 150 Seats
Total = 164 Seats
Example: Delta A320 Interior
Modification Program
New seats, outlets, IFE, overhead bins
Space-saving galleys to add a row of seats
Source: ICF analysis, delta.com
18 Seats18 Seats
The Mod Squad!
2626
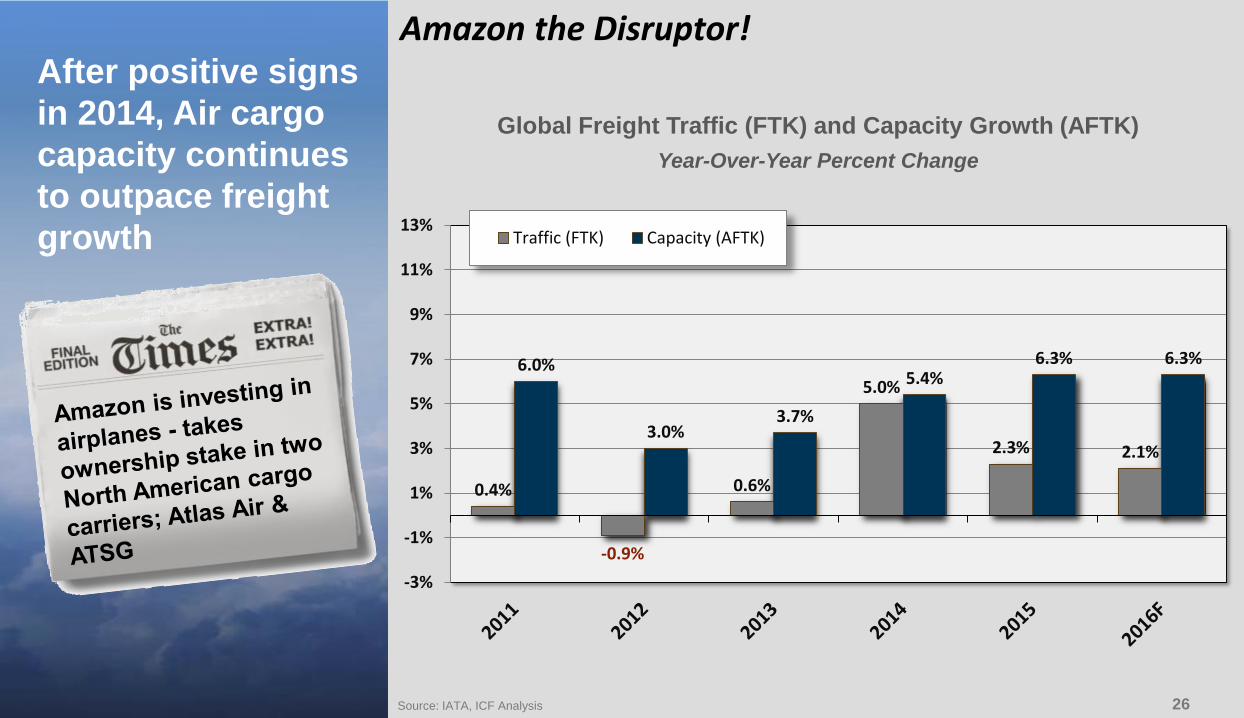
After positive signs
in 2014, Air cargo
capacity continues
to outpace freight
growth
Source: IATA, ICF Analysis
0.4%
-0.9%
0.6%
5.0%
2.3% 2.1%
6.0%
3.0%3.7%
5.4%6.3% 6.3%
-3%
-1%
1%
3%
5%
7%
9%
11%
13%Traffic (FTK) Capacity (AFTK)
Global Freight Traffic (FTK) and Capacity Growth (AFTK)
Year-Over-Year Percent Change
Amazon the Disruptor!
2727
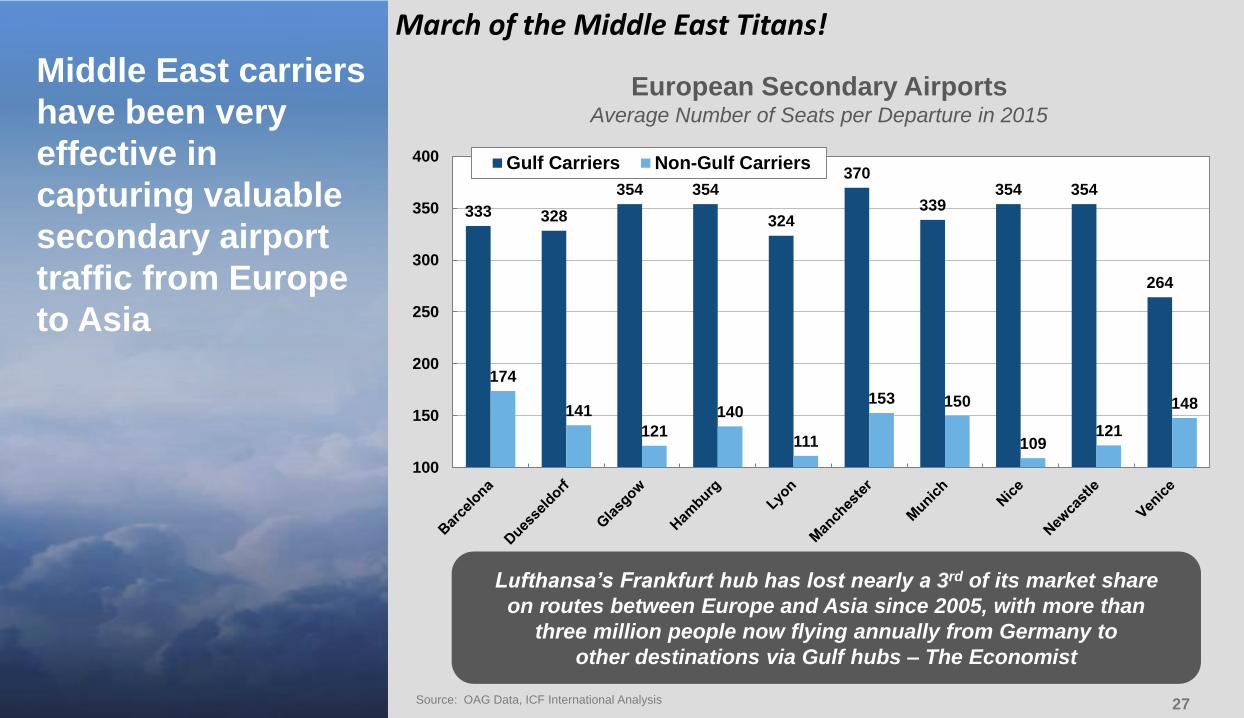
Middle East carriers
have been very
effective in
capturing valuable
secondary airport
traffic from Europe
to Asia
Source: OAG Data, ICF International Analysis
European Secondary AirportsAverage Number of Seats per Departure in 2015
Lufthansa’s Frankfurt hub has lost nearly a 3rd of its market share
on routes between Europe and Asia since 2005, with more than
three million people now flying annually from Germany to
other destinations via Gulf hubs – The Economist
333 328
354 354
324
370
339354 354
264
174
141
121
140
111
153 150
109121
148
100
150
200
250
300
350
400 Gulf Carriers Non-Gulf Carriers
March of the Middle East Titans!
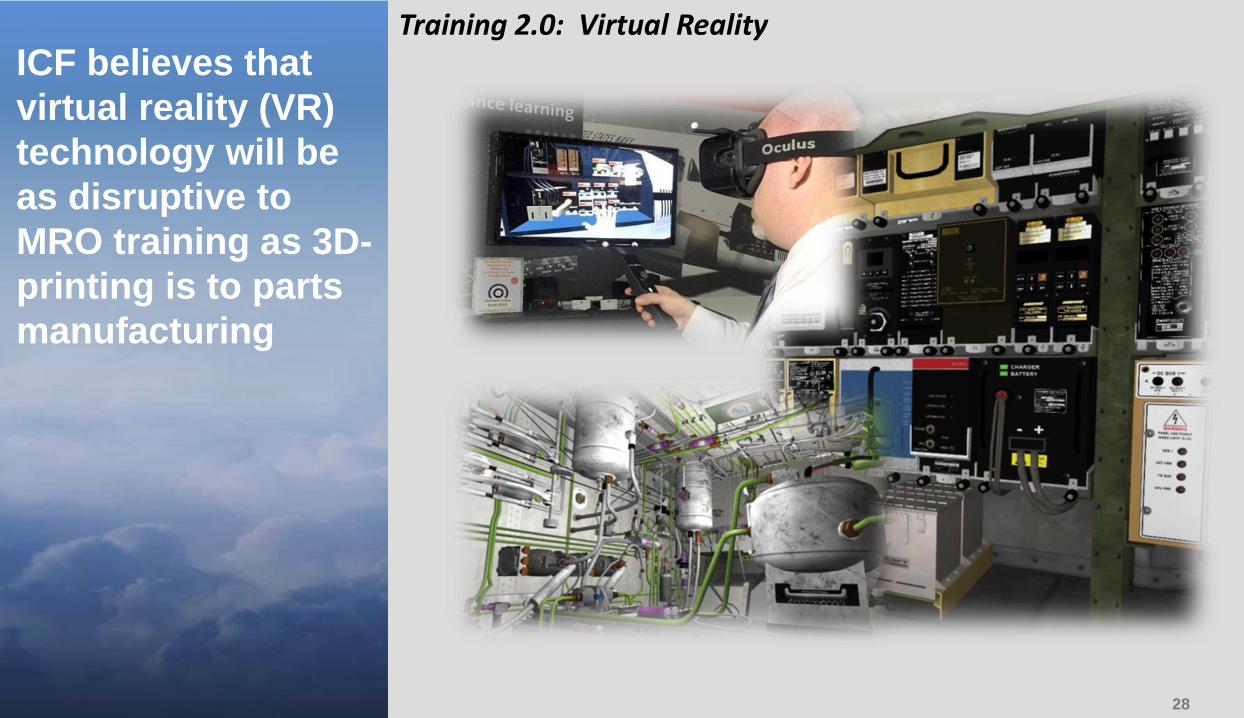
2828
ICF believes that
virtual reality (VR)
technology will be
as disruptive to
MRO training as 3D-
printing is to parts
manufacturing
Training 2.0: Virtual Reality
29
For questions regarding this
presentation, please contact:
Martin Harrison / Jonathan BergerVice President Aerospace & MRO
[email protected] +1 404.819.7669
THANK YOU!
3030
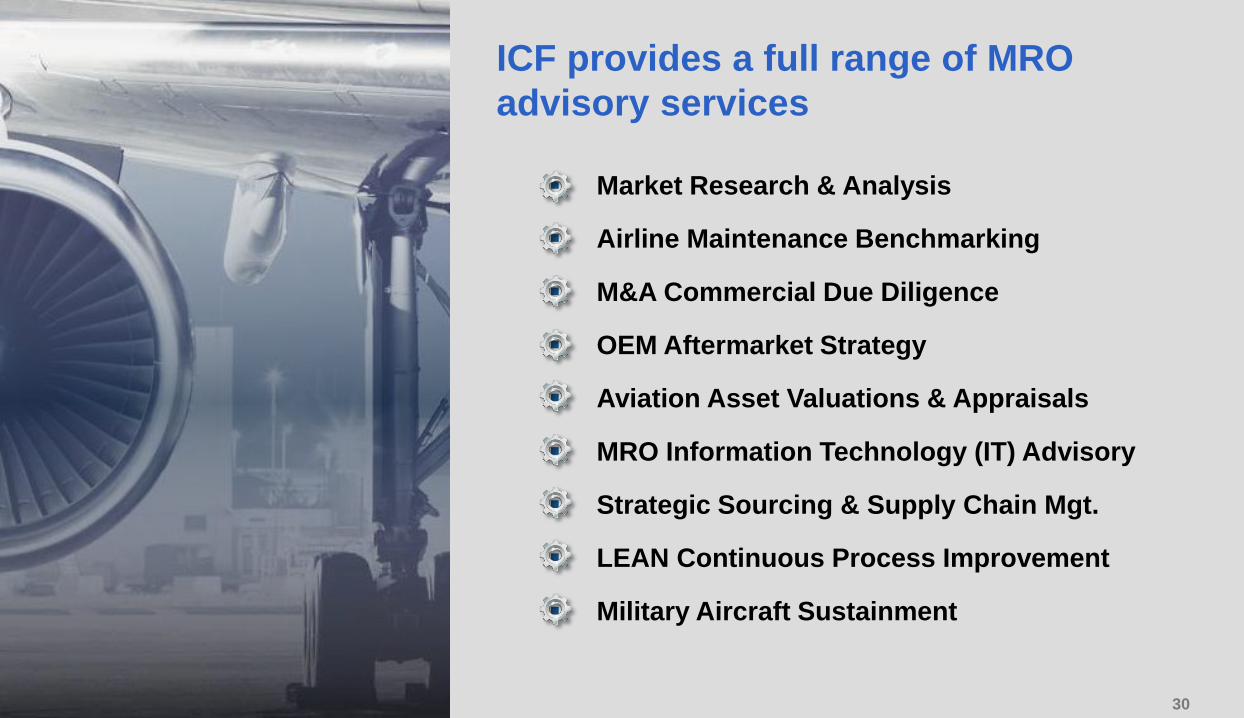
Market Research & Analysis
Airline Maintenance Benchmarking
M&A Commercial Due Diligence
OEM Aftermarket Strategy
Aviation Asset Valuations & Appraisals
MRO Information Technology (IT) Advisory
Strategic Sourcing & Supply Chain Mgt.
LEAN Continuous Process Improvement
Military Aircraft Sustainment
ICF provides a full range of MRO
advisory services
3131
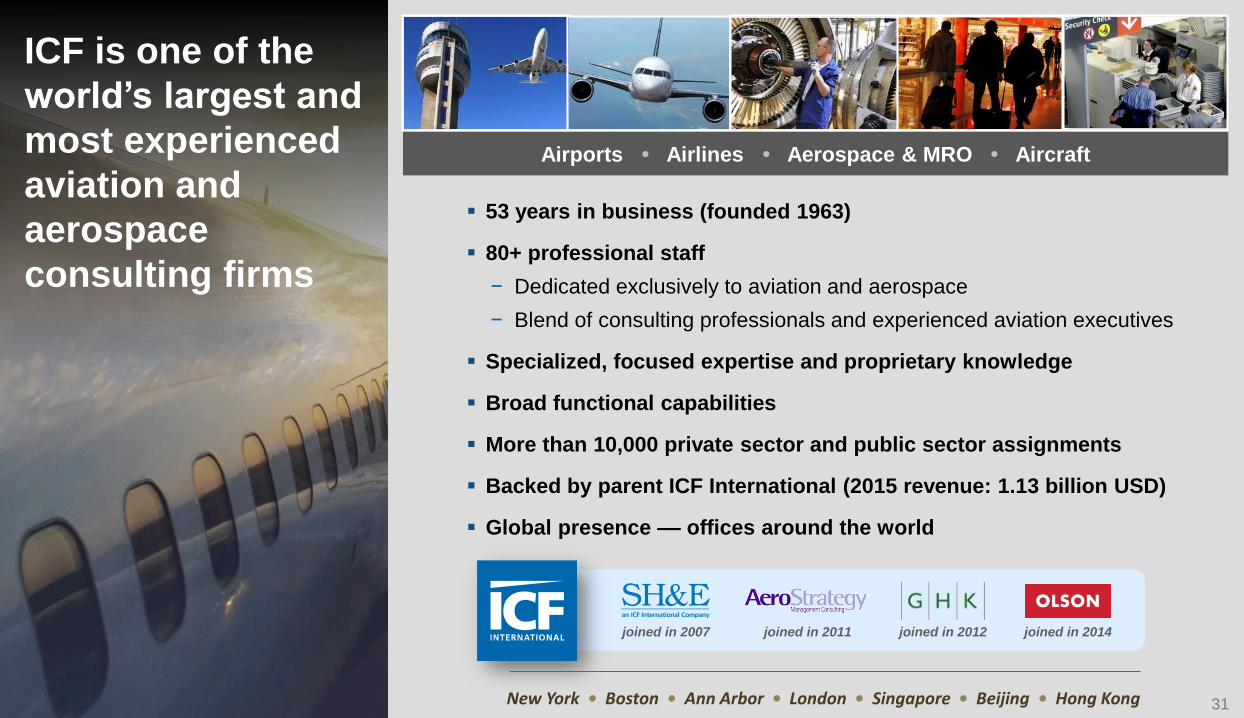
ICF is one of the
world’s largest and
most experienced
aviation and
aerospace
consulting firms
Airports • Airlines • Aerospace & MRO • Aircraft
53 years in business (founded 1963)
80+ professional staff
− Dedicated exclusively to aviation and aerospace
− Blend of consulting professionals and experienced aviation executives
Specialized, focused expertise and proprietary knowledge
Broad functional capabilities
More than 10,000 private sector and public sector assignments
Backed by parent ICF International (2015 revenue: 1.13 billion USD)
Global presence –– offices around the world
joined in 2011joined in 2007 joined in 2012 joined in 2014
New York • Boston • Ann Arbor • London • Singapore • Beijing • Hong Kong