mozambique, october 2011 - biofund · mozambique, october 2011 draft report january 2012 prepared...
TRANSCRIPT

ANNEX 2 OF THE AERIAL SURVEY OF WILDLIFE IN THE NIASSA GAME RESERVE
AERIAL SURVEY OF
QUIRIMBAS NATIONAL PARK AND ADJACENT AREAS
Mozambique, October 2011
DRAFT REPORT January 2012
Prepared for WWF Mozambique
By
G C Craig DG Ecological Consulting cc

AERIAL SURVEY OF QUIRIMBAS NATIONAL PARK AND ADJACENT AREAS;
October 2011 INTRODUCTION An aerial survey of wildlife and other environmental attributes in Cabo Delgado province in Northern Mozambique was undertaken from 19 to 27 October. The survey was carried out in sequence with the survey of Niassa Reserve which ended on the 19 October. The Survey was done under the auspices of the Worldwide fund for Nature to cover Quirimbas National park, a corridor linking Niassa Reserve with Quirimbas NP (referred to here as WWF West or W) and a forest area on the Rovuma River (referred to here as WWF North or N). all wildlife, human impacts and other relevant environmental factors were to be estimated or evaluated. Descriptions of methods are provided in Appendix I. Stratified systematic transect sampling was used (Norton Griffiths, 1978) in a light aircraft (a Cessna 206) flying at a nominal height of 300 feet above the ground. The nominal sampling intensity was 10%. Quirimbas National Park was divided into 2 survey strata, Q1 and Q2, which included a buffer area around the park. The other areas were flown as single strata (Fig. 1). Some transects in stratum W were cut short for logistic reasons and the boundary adjusted accordingly. Transects in Q2 were extended to reach the coast. This interim report covers wildlife populations and human activities. The results section describes estimates and distribution for all attributes. Full results by stratum are given in Appendix II.

2
Figure 1: WWF Survey Strata 2011

3
RESULTS FOR WILDLIFE
For each wildlife species in this section a sighting map is provided along with a table of estimates for each management unit. In the table the “range” refers to the range within which there is a 95% probability that the true number falls (i.e. it is the 95% confidence interval). Strictly, for most species this is actually the range within which 95% of independent estimates made by the same method would fall. The true value is likely to be higher on average because of undercounting bias. “No. seen” is the number of animals seen within sampling strips and “No. out” is the number seen outside of the sampling strips. Where animals were seen only outside of the sampling strips no estimate can be made by this method although the record shows that the species occurs. Wildlife species in this section are arranged in alphabetical order of their common names with the exception of: Elephant, which are placed first; monkeys, which are put next to baboons; crocodiles, which are placed with hippos. At the end other carcasses seen are reported. Under elephants, elephant carcasses are tabulated and carcass ratios are given in the table. Locations of sightings in surveyed areas adjacent to the WWF survey are shown on the maps as well as sightings within the survey area for comparative purposes. Full original results by stratum are given in Appendix II.

4
All Elephants Stratum Pop. est. Range No. seen No. out Dens/km² WWF West 232 49 <> 430 24 25 0.0319 WWF North 58 6 <> 171 6 0 0.0152 Quirimbas NP 517 84 <> 945 54 0 0.0529 Overall WWF Survey Area 807 326 <> 1289 84 25 0.0387
Elephant Bull Stratum Pop. est. Range No. seen No. out Dens/km² WWF West 68 7 <> 148 7 0 0.0093 Quirimbas NP 124 13 <> 309 13 0 0.0127 Overall WWF Survey Area 192 20 <> 390 20 0 0.0092
Elephant in Family Groups Stratum Pop. est. Range No. seen No. out Dens/km² WWF West 164 42 <> 346 17 25 0.0226 WWF North 58 6 <> 171 6 0 0.0152 Quirimbas NP 393 41 <> 785 41 0 0.0402 Overall WWF Survey Area 615 176 <> 1054 64 25 0.0295
Figure 2: Elephant sightings: bulls black; family groups pink

5
All Elephant Carcasses Stratum Pop. est. Range No. seen No. out Dens/km² Rat% WWF West 49 10 <> 88 5 0 0.0066 17.44 WWF North 10 1 <> 29 1 0 0.0025 14.71 Quirimbas NP 86 29 <> 143 9 0 0.0088 14.26 Overall WWF Survey Area 144 73 <> 215 15 0 0.0069 15.14
Rat% = Carcass Ratio. Carcass ratio is 100*carcasses/(carcasses + live). EleCarcass 3 Stratum Pop. est. Range No. seen No. out Dens/km² WWF West 10 1 <> 28 1 0 0.0013 Quirimbas NP 19 2 <> 45 2 0 0.002 Overall WWF Survey Area 29 3 <> 60 3 0 0.0014
EleCarcass 4 Stratum Pop. est. Range No. seen No. out Dens/km² WWF West 39 4 <> 73 4 0 0.0053 WWF North 10 1 <> 29 1 0 0.0025 Quirimbas NP 67 16 <> 118 7 0 0.0068 Overall WWF Survey Area 115 52 <> 179 12 0 0.0055
Figure 3: Carcass sightings: Fresh-recent (1+2) red; old-very old (3+4) black

6
Baboon Stratum Pop. est. Range No. seen No. out Dens/km² WWF West 126 13 <> 258 13 0 0.0173 WWF North 19 2 <> 58 2 0 0.0051 Quirimbas NP 1397 623 <> 2171 146 0 0.1429 Overall WWF Survey Area 1542 766 <> 2317 161 0 0.074
Figure 4: Baboons Monkey Stratum Pop. est. Range No. seen No. out Dens/km² WWF West 145 15 <> 290 15 0 0.02 Quirimbas NP 305 32 <> 614 32 0 0.0312 Overall WWF Survey Area 450 114 <> 786 47 0 0.0216
Figure 5: Monkeys

7
Bushbuck Stratum Pop. est. Range No. seen No. out Dens/km² WWF West 19 2 <> 44 2 0 0.0027 WWF North 29 3 <> 70 3 0 0.0076 Quirimbas NP 153 64 <> 242 16 0 0.0157 Overall WWF Survey Area 201 102 <> 300 21 0 0.0097
Figure 6: Bushbuck Bushpig Stratum Pop. est. Range No. seen No. out Dens/km² WWF West 97 10 <> 225 10 0 0.0133 Quirimbas NP 48 5 <> 137 5 0 0.0049 Overall WWF Survey Area 144 15 <> 298 15 0 0.0069
Figure 7: Bushpig

8
Duiker Stratum Pop. est. Range No. seen No. out Dens/km² WWF West 3109 2401 <> 3817 322 0 0.429 WWF North 184 62 <> 306 19 1 0.0482 Quirimbas NP 938 634 <> 1242 98 1 0.096 Overall WWF Survey Area 4230 3466 <> 4995 439 2 0.2031
Figure 8: Duiker Eland Stratum Pop. est. Range No. seen No. out Dens/km² Quirimbas NP 19 2 <> 44 2 0 0.002 Overall WWF Survey Area 19 2 <> 44 2 0 0.0009
Figure 9: Eland

9
GroundHornbill Stratum Pop. est. Range No. seen No. out Dens/km² WWF West 965 655 <> 1275 100 0 0.1332 WWF North 77 8 <> 179 8 0 0.0203 Quirimbas NP 568 358 <> 777 59 4 0.0581 Overall WWF Survey Area 1610 1231 <> 1990 167 4 0.0773
Figure 10: Ground Hornbill

10
Hartebeest Stratum Pop. est. Range No. seen No. out Dens/km² WWF West 68 7 <> 160 7 0 0.0093 Overall WWF Survey Area 68 7 <> 158 7 0 0.0032
Figure 11: Hartebeest

11
Hippopotamus Stratum Pop. est. Range No. seen No. out Dens/km² WWF North 262 27 <> 611 27 0 0.0685 Overall WWF Survey Area 262 27 <> 594 27 0 0.0126
Figure 12: Hippopotamus
Crocodile Stratum Pop. est. Range No. seen No. out Dens/km² WWF West 19 2 <> 57 2 0 0.0027 Overall WWF Survey Area 19 2 <> 56 2 0 0.0009
Figure 13: Crocodile

12
Kudu Stratum Pop. est. Range No. seen No. out Dens/km² WWF West 251 65 <> 437 26 0 0.0346 Quirimbas NP 182 19 <> 349 19 0 0.0186 Overall WWF Survey Area 433 186 <> 679 45 0 0.0208
Figure 14: kudu
Reedbuck Stratum Pop. est. Range No. seen No. out Dens/km² WWF North 19 2 <> 57 2 0 0.0051 Overall WWF Survey Area 19 2 <> 55 2 0 0.0009
Figure 15: Reedbuck

13
Sable Stratum Pop. est. Range No. seen No. out Dens/km² WWF West 29 3 <> 69 3 0 0.004 WWF North 300 31 <> 657 31 0 0.0787 Quirimbas NP 162 31 <> 417 17 14 0.0166 Overall WWF Survey Area 491 68 <> 915 51 14 0.0236
Figure 16: Sable
Warthog Stratum Pop. est. Range No. seen No. out Dens/km² WWF West 232 67 <> 396 24 0 0.032 WWF North 339 35 <> 662 35 0 0.0888 Quirimbas NP 555 290 <> 820 58 0 0.0568 Overall WWF Survey Area 1126 692 <> 1560 117 0 0.054
Figure 17: Warthog
14
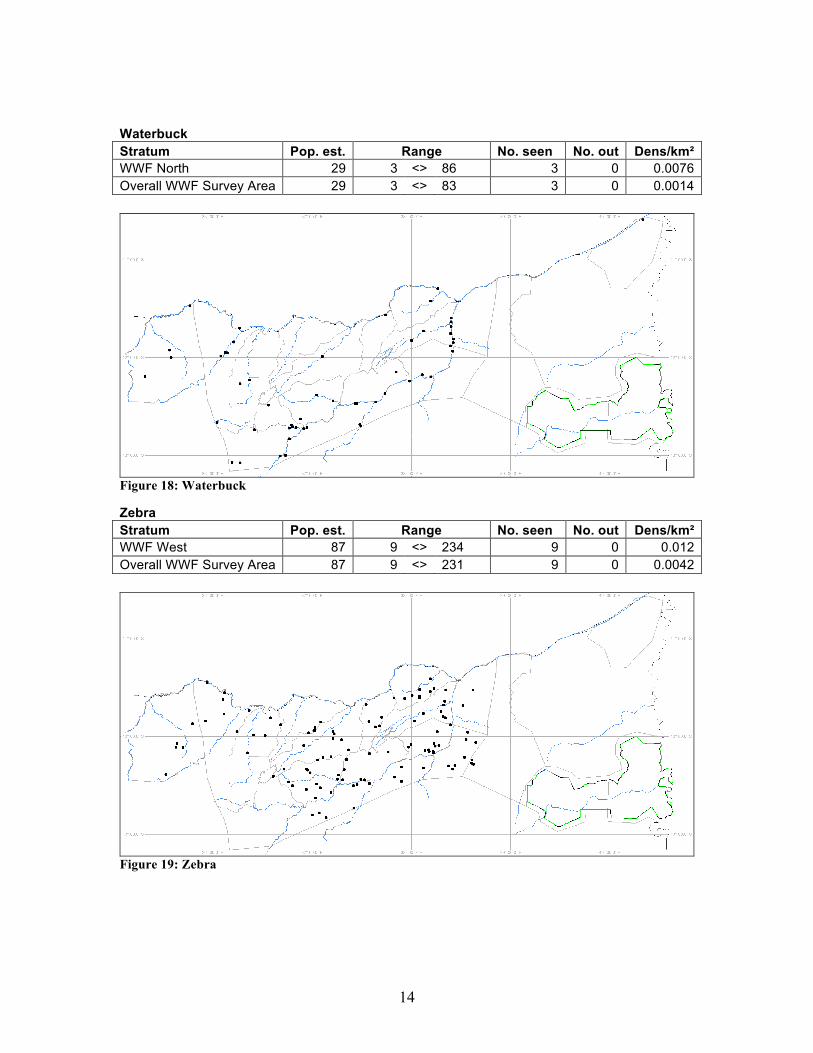
Waterbuck Stratum Pop. est. Range No. seen No. out Dens/km² WWF North 29 3 <> 86 3 0 0.0076 Overall WWF Survey Area 29 3 <> 83 3 0 0.0014
Figure 18: Waterbuck
Zebra Stratum Pop. est. Range No. seen No. out Dens/km² WWF West 87 9 <> 234 9 0 0.012 Overall WWF Survey Area 87 9 <> 231 9 0 0.0042
Figure 19: Zebra

15
OtherCarcass 4 Stratum Pop. est. Range No. seen No. out Dens/km² WWF West 10 1 <> 28 1 0 0.0013 Quirimbas NP 10 1 <> 28 1 0 0.001 Overall WWF Survey Area 19 2 <> 44 2 0 0.0009
Figure 20: Other wildlife carcasses including unknown species

16
OTHER OBSERVATIONS This section describes attributes other than wildlife recorded during the survey. “Estimates” are tabulated for several attributes, including density estimates. Such estimates only refer to observable instances and are not necessarily related to the true number of anything. For example: “villages” does not relate to the number of dwellings or people therein; fields extend beyond the sampling transect and the count does not reflect area; and snare lines also extend beyond the transect but are counted if only part is in. The counts may nevertheless serve as useful indices of occurrence and the estimates are given for so that comparisons can be made between areas. Livestock and logging represent discrete occurrences and these are true estimates. As above, data for surveys adjacent to the survey area are included on the maps. Cattle
Stratum Pop. est. Range No. seen No. out Dens/km² Quirimbas NP 791 86 <> 2031 83 3 0.0809 Overall WWF Survey Area 791 86 <> 2014 83 3 0.038 Sheep/goats Stratum Pop. est. Range No. seen No. out Dens/km² WWF North 155 16 <> 436 16 0 0.0406 Quirimbas NP 1062 391 <> 1732 111 0 0.1087 Overall WWF Survey Area 1217 504 <> 1930 127 0 0.0584
Figure 21: Livestock: Cattle red; Small stock black

17
Fishing camp Stratum Pop. est. Range No. seen No. out Dens/km² WWF West 77 8 <> 166 8 0 0.0107 WWF North 39 4 <> 74 4 0 0.0102 Quirimbas NP 76 20 <> 132 8 0 0.0078 Overall WWF Survey Area 192 83 <> 301 20 0 0.0092
Fishtrap/net Stratum Pop. est. Range No. seen No. out Dens/km² WWF West 154 16 <> 311 16 0 0.0213 WWF North 232 120 <> 345 24 0 0.0609 Quirimbas NP 76 17 <> 136 8 0 0.0078 Overall WWF Survey Area 463 268 <> 659 48 0 0.0222
Canoe Stratum Pop. est. Range No. seen No. out Dens/km² WWF West 77 8 <> 166 8 0 0.0107 WWF North 145 49 <> 241 15 0 0.0381 Quirimbas NP 619 144 <> 1094 65 9 0.0634 Overall WWF Survey Area 842 357 <> 1327 88 9 0.0404
Figure 22: Undifferentiated fishing instances: camps, canoes, nets, traps
18
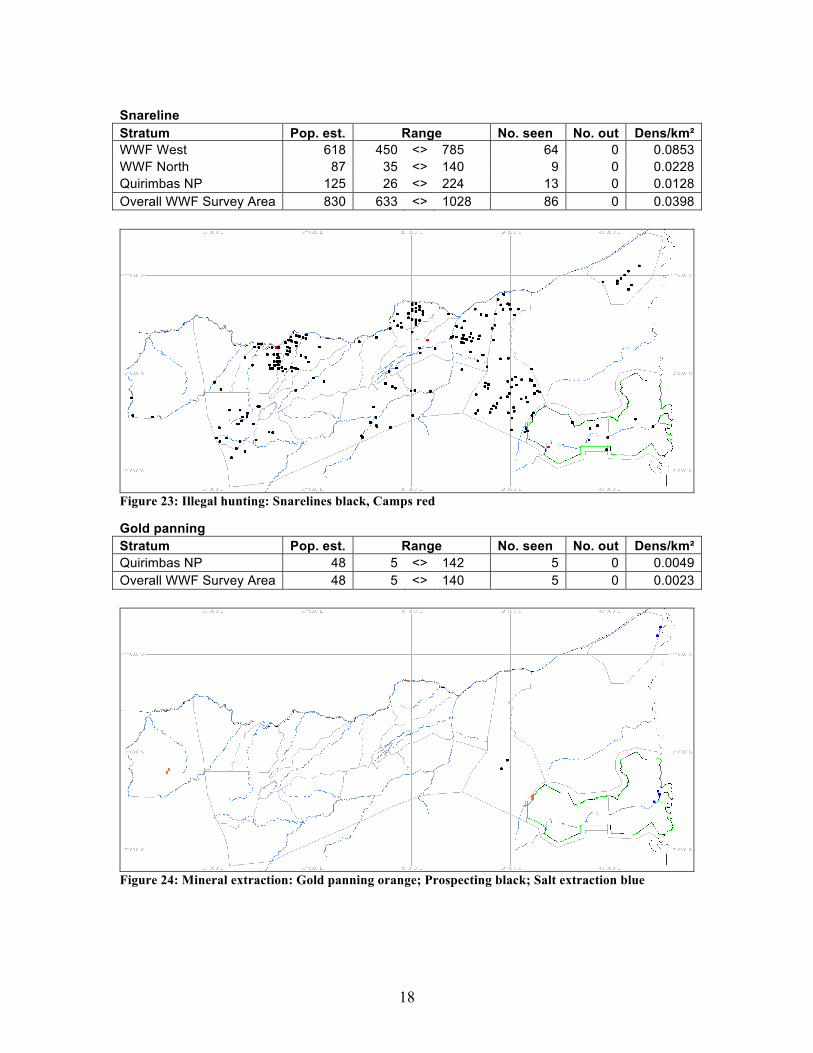
Snareline Stratum Pop. est. Range No. seen No. out Dens/km² WWF West 618 450 <> 785 64 0 0.0853 WWF North 87 35 <> 140 9 0 0.0228 Quirimbas NP 125 26 <> 224 13 0 0.0128 Overall WWF Survey Area 830 633 <> 1028 86 0 0.0398
Figure 23: Illegal hunting: Snarelines black, Camps red
Gold panning Stratum Pop. est. Range No. seen No. out Dens/km² Quirimbas NP 48 5 <> 142 5 0 0.0049 Overall WWF Survey Area 48 5 <> 140 5 0 0.0023
Figure 24: Mineral extraction: Gold panning orange; Prospecting black; Salt extraction blue

19
Logging Stratum Pop. est. Range No. seen No. out Dens/km² WWF West 4596 3620 <> 5571 476 0 0.6342 WWF North 1918 1337 <> 2499 198 0 0.5025 Quirimbas NP 2196 1735 <> 2657 229 0 0.2248 Overall WWF Survey Area 8710 7516 <> 9903 903 0 0.4181
Timber yard Stratum Pop. est. Range No. seen No. out Dens/km² WWF West 126 51 <> 200 13 1 0.0173 WWF North 77 19 <> 136 8 0 0.0203 Quirimbas NP 356 205 <> 506 37 1 0.0364 Overall WWF Survey Area 559 384 <> 733 58 2 0.0268
Bamboo harvesting Stratum Pop. est. Range No. seen No. out Dens/km² WWF North 19 2 <> 45 2 0 0.0051 Quirimbas NP 105 11 <> 202 11 0 0.0107 Overall WWF Survey Area 124 26 <> 223 13 0 0.006 Total
Figure 25: Wood extraction: Logging black; Timber stores red; Timber truck green; Bamboo cutting yellow

20
Cultivation Stratum Pop. est. Range No. seen No. out Dens/km² WWF West 1072 597 <> 1546 111 3 0.1479 WWF North 4175 2526 <> 5824 431 5 1.0939 Quirimbas NP 6657 5448 <> 7866 695 8 0.6813 Overall WWF Survey Area 11903 9880 <> 13927 1237 16 0.5713
Figure 26: Cultivation

21
Village Stratum Pop. est. Range No. seen No. out Dens/km² WWF West 647 392 <> 901 67 7 0.0893 WWF North 1550 1090 <> 2010 160 12 0.4061 Quirimbas NP 2446 1941 <> 2951 255 22 0.2504 Overall WWF Survey Area 4643 3935 <> 5351 482 41 0.2229
Big Village Stratum Pop. est. Range No. seen No. out Dens/km² WWF West 29 7 <> 69 3 4 0.004 WWF North 48 8 <> 129 5 3 0.0127 Quirimbas NP 239 158 <> 320 25 16 0.0244 Overall WWF Survey Area 316 198 <> 434 33 23 0.0152
Figure 27: Habitation: Small settlements black; Major settlements and towns red

22
APPENDIX I: METHODS Methods were the same as in Niassa Surveys. Stratification was according to management units. Transects were orientated along presumed ecological gradients. Transect selection is shown in Fig. 28.
Figure 28: WWF Survey 2011 Transects Survey crew comprised D. le Poidevin and C. Hertzler (Pilots), C. Craig (coordinator and front-seat observer), F. Muroki (left hand observer) and D Chipesi(right hand observer).

23
APPENDIX II: RESULTS Supporting data indicating survey quality are given below.
Figure 29: Tracks flown on WWF survey Stratum Statistics Stratum Area SArea SI NSU V(Knots) Srate Q1 4810.85 498.71 10.37 23 97.03 1.23 Q2 4959.66 520.47 10.49 28 86.66 1.11 WW 7246.5 750.58 10.36 39 97.06 1.24 WN 3816.7 394 10.32 21 95.69 1.22 All 20833.71 2163.77 10.39 111 94.1 1.2
SArea = Sample area; SI = Sampling intensity; NSU = No. of sampling units; V = groundspeed; Srate = Search rate in km2 per minute. The target search rate was 1.1 km2 per minute.

24
Calibration of strip widths The results of the strip width calibration are given below. Messrs Muroki and Chipese were left and right observers respectively. L R Width Corrected Tot W # H in out in out L R L R
1 280 9 28 7 22 200 160 214.2857 171.4286 385.7143 2 220 6 22 7 20 170 140 231.8182 190.9091 422.7273 3 240 1 19 13 27 190 150 237.5 187.5 425 4 250 9 27 5 19 190 150 228 180 408 5 250 5 23 8 23 190 160 228 192 420 6 250 10 26 4 19 170 160 204 192 396 7 220 11 28 2 14 180 130 245.4545 177.2727 422.7273 8 260 19 29 1 15 110 150 126.9231 173.0769 300 9 220 10 26 2 16 170 150 231.8182 204.5455 436.3636
10 250 10 27 4 17 180 140 216 168 384 11 250 11 29 2 14 190 130 228 156 384 12 220 10 29 3 16 200 140 272.7273 190.9091 463.6364 13 220 8 25 4 17 180 140 245.4545 190.9091 436.3636 14 240 9 25 4 20 170 170 212.5 212.5 425 15 250 9 24 5 20 160 160 192 192 384 16 250 12 28 2 17 170 160 204 192 396 17 250 8 24 7 23 170 170 204 204 408 18 250 9 25 5 22 170 180 204 216 420 19 260 8 25 6 21 180 160 207.6923 184.6154 392.3077 20 250 9 25 5 19 170 150 204 180 384 21 260 5 23 9 23 190 150 219.2308 173.0769 392.3077 22 240 10 29 4 19 200 160 250 200 450
218.5184 187.6701 Mn 406.1885 Var 1092.435 SE Mn 7.582651 %CL 3.733562 Maintenance of height The target height was 300 feet above ground. The mean height flown was 305.3 feet. 95% of recorded heights were within 43.4 feet of this value.

25
Observer Bias No.of groups seen in + out Species Left Right Chi2 P% Baboon 5 56 42.639 6.58E-09 **** Buffalo 37 25 2.323 12.75084 Bushbuck 6 31 16.892 0.00396 **** Bushpig 0 13 13 0.03115 *** Crocodile 5 7 0.333 56.37029 Duiker 421 1012 243.741 6.01E-53 **** Eland 23 37 3.267 7.07012 EleCarcass 1 2 2 0 100 EleCarcass 2 9 15 1.5 22.06715 EleCarcass 3 20 11 2.613 10.59976 EleCarcass 4 86 141 13.326 0.02618 *** All Carc 117 169 9.455 0.21063 ** ElephantBull 39 39 0 100 ElephantFamily 92 113 2.151 14.24567 All Eles 131 152 1.558 21.19138 GroundHornbill 93 110 1.424 23.28045 Hartebeest 46 58 1.385 23.93167 Hippopotamus 8 12 0.8 37.10934 Honey Badger 1 1 0 100 Hyaena 0 4 4 4.55003 * Impala 8 18 3.846 4.98602 * Kudu 24 43 5.388 2.0275 * Lion 2 1 0.333 56.37029 Leopard 0 1 1 31.73108 Monkey 1 18 15.211 0.00962 ** Reedbuck 20 39 6.119 1.33763 * Sable 150 195 5.87 1.54049 * Warthog 73 153 28.319 1.03E-05 **** Waterbuck 23 34 2.123 14.51204 Wildebeest 4 9 1.923 16.55179 Zebra 46 65 3.252 7.13254 The above shows that the left observer made significantly fewer sightings than the right when dealing with the more difficult-to-see species.These will be underestimated by the survey. There is no measure of the number of groups the right observer misses. All data from Niassa, Chipanje-Chetu and the WWF survey are included. **** indicates a probability of <1/10000, *** of <1/1000, ** of <1/100 and * of <1/20.

26
Estimates of numbers, densities and confidence limits The following tables give the results for each stratum based on the numbers seen in the sample. Results for all species and attributes counted are given. Column 6 is the 95% confidence limit expressed as a percentage of the estimate.

27
Overall WWF Survey Area Area: 20833.71 km² Mean sampling intensity 10.4%
Pop. No. No.
Variance 95%cl
95%Range Dens
SPECIES est. seen Out %est. /km²
Baboon 1542 161 0 152946.2 50.3 766 <> 2317 0.074 Bushbuck 201 21 0 2492.13 49.1 102 <> 300 0.0097 Bushpig 144 15 0 6056.2 107 15 <> 298 0.0069 Crocodile 19 2 0 342.67 190.1 2 <> 56 0.0009 Duiker 4230 439 2 148700.61 18.1 3466 <> 4995 0.2031 Eland 19 2 0 155.72 128.2 2 <> 44 0.0009 ElephantBull 192 20 0 10022.5 103.6 20 <> 390 0.0092 EleCarcass 3 29 3 0 243.98 107.4 3 <> 60 0.0014 EleCarcass 4 115 12 0 1028.42 55.2 52 <> 179 0.0055 ElephantFamily 615 64 25 48999.88 71.3 176 <> 1054 0.0295 GroundHornbill 1610 167 4 36648.59 23.6 1231 <> 1990 0.0773 Hartebeest 68 7 0 2097.09 134.3 7 <> 158 0.0032 Hippopotamus 262 27 0 28117.99 127.1 27 <> 594 0.0126 Kudu 433 45 0 15416.18 56.9 186 <> 679 0.0208 Monkey 450 47 0 28767.32 74.7 114 <> 786 0.0216 Reedbuck 19 2 0 322.05 183.6 2 <> 55 0.0009 Sable 491 51 14 45675.4 86.2 68 <> 915 0.0236 Warthog 1126 117 0 47970.2 38.6 692 <> 1560 0.054 Waterbuck 29 3 0 734.06 184.8 3 <> 83 0.0014 Zebra 87 9 0 5276.57 165.7 9 <> 231 0.0042 Cattle 791 83 3 380836.06 154.7 86 <> 2014 0.038 Sheep/goats 1217 127 0 129356.54 58.6 504 <> 1930 0.0584 OtherCarcass 4 19 2 0 161.86 131.5 2 <> 44 0.0009 Fishing camp 192 20 0 3008.85 56.6 83 <> 301 0.0092 Fishtrap/net 463 48 0 9767.81 42.3 268 <> 659 0.0222 Canoe 842 88 9 59904.59 57.6 357 <> 1327 0.0404 Snareline 830 86 0 9922.93 23.8 633 <> 1028 0.0398 Gold panning 48 5 0 2158.12 190.9 5 <> 140 0.0023 Logging 8710 903 0 362365.78 13.7 7516 <> 9903 0.4181 Timber yard 559 58 2 7766.14 31.3 384 <> 733 0.0268 Bamboo harvesting 124 13 0 2463.8 79.2 26 <> 223 0.006 Village 4643 482 41 127669.08 15.3 3935 <> 5351 0.2229 Cultivation 11903 1237 16 1041755.9 17 9880 <> 13927 0.5713 Big Village 316 33 23 3531.52 37.3 198 <> 434 0.0152

28
Quirimbas NP Area: 9770.51 km² Mean sampling intensity; 10.4%
Pop. No. No.
Variance 95%cl
95%Range Dens
SPECIES est. seen Out %est. /km²
Baboon 1397 146 0 148326.13 55.4 623 <> 2171 0.1429 Bushbuck 153 16 0 1958.32 58.1 64 <> 242 0.0157 Bushpig 48 5 0 1998.91 188.6 5 <> 137 0.0049 Duiker 938 98 1 22876.89 32.4 634 <> 1242 0.096 Eland 19 2 0 155.72 130 2 <> 44 0.002 ElephantBull 124 13 0 8458.96 149.1 13 <> 309 0.0127 EleCarcass 3 19 2 0 162.62 133.6 2 <> 45 0.002 EleCarcass 4 67 7 0 648.45 76.6 16 <> 118 0.0068 ElephantFamily 393 41 0 38013.63 99.7 41 <> 785 0.0402 GroundHornbill 568 59 4 10824.17 36.8 358 <> 777 0.0581 Kudu 182 19 0 6951.73 92.3 19 <> 349 0.0186 Monkey 305 32 0 23615.34 101.2 32 <> 614 0.0312 Sable 162 17 14 16120.15 157.5 31 <> 417 0.0166 Warthog 555 58 0 17348.32 47.7 290 <> 820 0.0568 Cattle 791 83 3 380836.06 156.8 86 <> 2031 0.0809 Sheep/goats 1062 111 0 111247.55 63.1 391 <> 1732 0.1087 OtherCarcass 4 10 1 0 80.3 189 1 <> 28 0.001 Fishing camp 76 8 0 783.83 73.8 20 <> 132 0.0078 Fishtrap/net 76 8 0 864.51 77.3 17 <> 136 0.0078 Canoe 619 65 9 55846.58 76.7 144 <> 1094 0.0634 Snareline 125 13 0 2448.26 79.5 26 <> 224 0.0128 Gold panning 48 5 0 2158.12 193.6 5 <> 142 0.0049 Logging 2196 229 0 52548.07 21 1735 <> 2657 0.2248 Timber yard 356 37 1 5610.66 42.3 205 <> 506 0.0364 Bamboo harvesting 105 11 0 2313.4 92.1 11 <> 202 0.0107 Village 2446 255 22 63226.48 20.7 1941 <> 2951 0.2504 Cultivation 6657 695 8 361959.26 18.2 5448 <> 7866 0.6813 Big Village 239 25 16 1634.02 34 158 <> 320 0.0244

29
Stratum Q1 Area: 4811 km² Sampling intensity: 10.40%
Pop. No. No.
Variance 95%cl
95%Range Dens
SPECIES est. seen Out %est. /km²
Baboon 444 46 0 41211.09 94.9 46 <> 865 0.0922 Bushbuck 48 5 0 710.88 114.6 5 <> 104 0.01 Duiker 309 32 1 12126.24 74 80 <> 537 0.0642 Eland 19 2 0 155.72 134.1 2 <> 45 0.004 ElephantBull 10 1 0 82.28 195 1 <> 28 0.002 EleCarcass 3 10 1 0 81.48 194.1 1 <> 28 0.002 EleCarcass 4 10 1 0 84.99 198.2 1 <> 29 0.002 ElephantFamily 183 19 0 15973.55 143 19 <> 445 0.0381 GroundHornbill 434 45 4 7926.58 42.5 249 <> 619 0.0902 Kudu 39 4 0 1347.68 197.3 4 <> 115 0.008 Monkey 19 2 0 339.97 198.2 2 <> 58 0.004 Sable 0 0 14 0 0 14 <> 0 0 Warthog 193 20 0 5348.23 78.6 41 <> 345 0.0401 Sheep/goats 318 33 0 30669.66 114.1 33 <> 682 0.0662 Fishtrap/net 19 2 0 166.27 138.6 2 <> 46 0.004 Snareline 96 10 0 2065.94 97.7 10 <> 191 0.0201 Gold panning 48 5 0 2158.12 199.7 5 <> 145 0.01 Logging 1148 119 0 27883.69 30.2 802 <> 1494 0.2386 Timber yard 251 26 1 4727.3 56.9 108 <> 393 0.0521 Bamboo harvesting 10 1 0 87.41 201 1 <> 29 0.002 Village 1331 138 2 50252.17 34.9 866 <> 1796 0.2767 Cultivation 2778 288 2 261371.46 38.2 1718 <> 3838 0.5775 Big Village 48 5 5 334.14 78.6 10 <> 86 0.01

30
Stratum Q2 Area: 4960 km² Sampling intensity: 10.50%
Pop. No. No.
Variance 95%cl
95%Range Dens
SPECIES est. seen Out %est. /km²
Baboon 953 100 0 107115.04 70.5 281 <> 1624 0.1921 Bushbuck 105 11 0 1247.43 69.1 32 <> 177 0.0211 Bushpig 48 5 0 1998.91 192.5 5 <> 139 0.0096 Duiker 629 66 0 10750.65 33.8 416 <> 842 0.1268 ElephantBull 114 12 0 8376.68 164.2 12 <> 302 0.0231 EleCarcass 3 10 1 0 81.14 194 1 <> 28 0.0019 EleCarcass 4 57 6 0 563.45 85.2 8 <> 106 0.0115 ElephantFamily 210 22 0 22040.08 145.3 22 <> 514 0.0423 GroundHornbill 133 14 0 2897.6 82.8 23 <> 244 0.0269 Kudu 143 15 0 5604.05 107.5 15 <> 297 0.0288 Monkey 286 30 0 23275.37 109.5 30 <> 599 0.0576 Sable 162 17 0 16120.15 160.8 17 <> 423 0.0327 Warthog 362 38 0 12000.09 62.1 137 <> 587 0.073 Cattle 791 83 3 380836.07 160.1 86 <> 2057 0.1595 Sheep/goats 743 78 0 80577.9 78.4 161 <> 1326 0.1499 OtherCarcass 4 10 1 0 80.3 192.9 1 <> 28 0.0019 Fishing camp 76 8 0 783.83 75.4 19 <> 134 0.0154 Fishtrap/net 57 6 0 698.23 94.8 6 <> 111 0.0115 Canoe 619 65 9 55846.58 78.3 135 <> 1104 0.1249 Snareline 29 3 0 382.32 140.3 3 <> 69 0.0058 Logging 1048 110 0 24664.39 30.7 726 <> 1370 0.2113 Timber yard 105 11 0 883.36 58.2 44 <> 166 0.0211 Bamboo harvesting 95 10 0 2225.99 101.6 10 <> 192 0.0192 Village 1115 117 20 12974.31 21 881 <> 1349 0.2248 Cultivation 3878 407 6 100587.79 16.8 3228 <> 4529 0.782 Big Village 191 20 11 1299.88 38.8 117 <> 265 0.0384
31
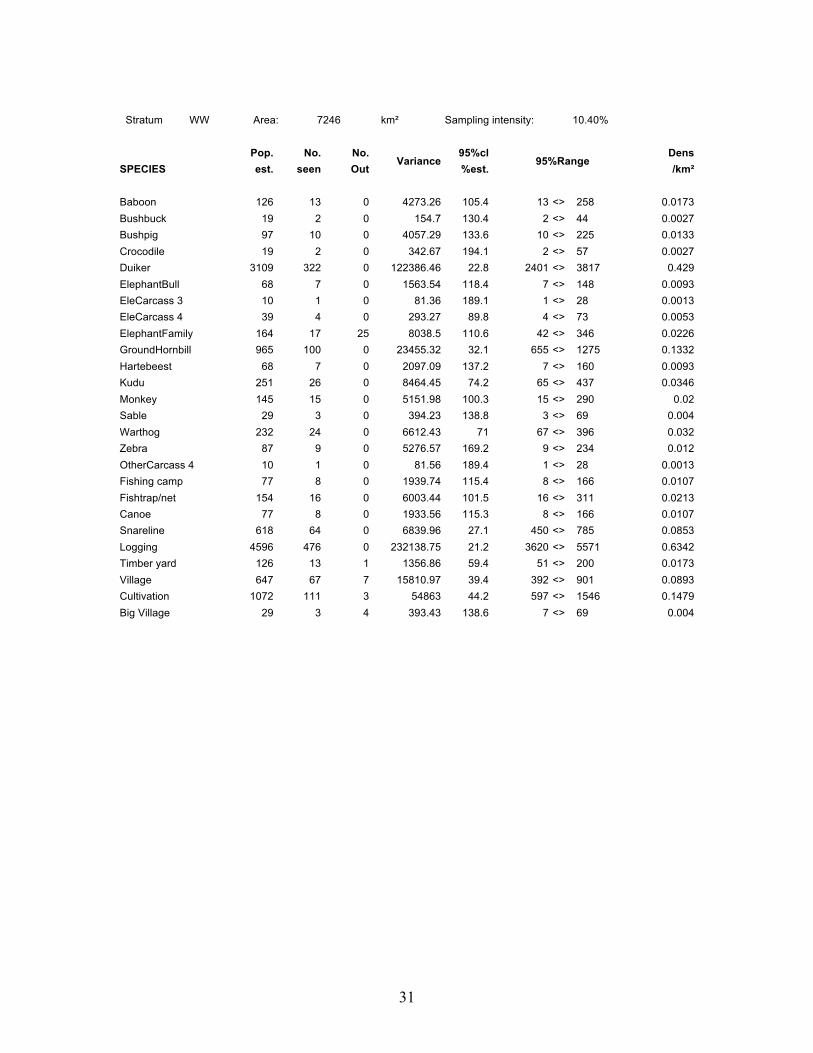
Stratum WW Area: 7246 km² Sampling intensity: 10.40%
Pop. No. No.
Variance 95%cl
95%Range Dens
SPECIES est. seen Out %est. /km²
Baboon 126 13 0 4273.26 105.4 13 <> 258 0.0173 Bushbuck 19 2 0 154.7 130.4 2 <> 44 0.0027 Bushpig 97 10 0 4057.29 133.6 10 <> 225 0.0133 Crocodile 19 2 0 342.67 194.1 2 <> 57 0.0027 Duiker 3109 322 0 122386.46 22.8 2401 <> 3817 0.429 ElephantBull 68 7 0 1563.54 118.4 7 <> 148 0.0093 EleCarcass 3 10 1 0 81.36 189.1 1 <> 28 0.0013 EleCarcass 4 39 4 0 293.27 89.8 4 <> 73 0.0053 ElephantFamily 164 17 25 8038.5 110.6 42 <> 346 0.0226 GroundHornbill 965 100 0 23455.32 32.1 655 <> 1275 0.1332 Hartebeest 68 7 0 2097.09 137.2 7 <> 160 0.0093 Kudu 251 26 0 8464.45 74.2 65 <> 437 0.0346 Monkey 145 15 0 5151.98 100.3 15 <> 290 0.02 Sable 29 3 0 394.23 138.8 3 <> 69 0.004 Warthog 232 24 0 6612.43 71 67 <> 396 0.032 Zebra 87 9 0 5276.57 169.2 9 <> 234 0.012 OtherCarcass 4 10 1 0 81.56 189.4 1 <> 28 0.0013 Fishing camp 77 8 0 1939.74 115.4 8 <> 166 0.0107 Fishtrap/net 154 16 0 6003.44 101.5 16 <> 311 0.0213 Canoe 77 8 0 1933.56 115.3 8 <> 166 0.0107 Snareline 618 64 0 6839.96 27.1 450 <> 785 0.0853 Logging 4596 476 0 232138.75 21.2 3620 <> 5571 0.6342 Timber yard 126 13 1 1356.86 59.4 51 <> 200 0.0173 Village 647 67 7 15810.97 39.4 392 <> 901 0.0893 Cultivation 1072 111 3 54863 44.2 597 <> 1546 0.1479 Big Village 29 3 4 393.43 138.6 7 <> 69 0.004

32
Stratum WN Area: 3817 km² Sampling intensity: 10.3%
Pop. No. No.
Variance 95%cl
95%Range Dens
SPECIES est. seen Out %est. /km²
Baboon 19 2 0 346.81 200.5 2 <> 58 0.0051 Bushbuck 29 3 0 379.11 139.8 3 <> 70 0.0076 Duiker 184 19 1 3437.26 66.4 62 <> 306 0.0482 EleCarcass 4 10 1 0 86.7 200.5 1 <> 29 0.0025 ElephantFamily 58 6 0 2947.75 194.9 6 <> 171 0.0152 GroundHornbill 77 8 0 2369.1 131 8 <> 179 0.0203 Hippopotamus 262 27 0 28117.99 133.7 27 <> 611 0.0685 Reedbuck 19 2 0 322.05 193.2 2 <> 57 0.0051 Sable 300 31 0 29161.02 118.6 31 <> 657 0.0787 Warthog 339 35 0 24009.46 95.3 35 <> 662 0.0888 Waterbuck 29 3 0 734.06 194.5 3 <> 86 0.0076 Sheep/goats 155 16 0 18108.98 181.1 16 <> 436 0.0406 Fishing camp 39 4 0 285.28 90.9 4 <> 74 0.0102 Fishtrap/net 232 24 0 2899.86 48.3 120 <> 345 0.0609 Canoe 145 15 0 2124.45 66.2 49 <> 241 0.0381 Snareline 87 9 0 634.71 60.3 35 <> 140 0.0228 Logging 1918 198 0 77678.96 30.3 1337 <> 2499 0.5025 Timber yard 77 8 0 798.61 76.1 19 <> 136 0.0203 Bamboo harvesting 19 2 0 150.4 132 2 <> 45 0.0051 Village 1550 160 12 48631.63 29.7 1090 <> 2010 0.4061 Cultivation 4175 431 5 624933.68 39.5 2526 <> 5824 1.0939 Big Village 48 5 3 1504.08 167 8 <> 129 0.0127