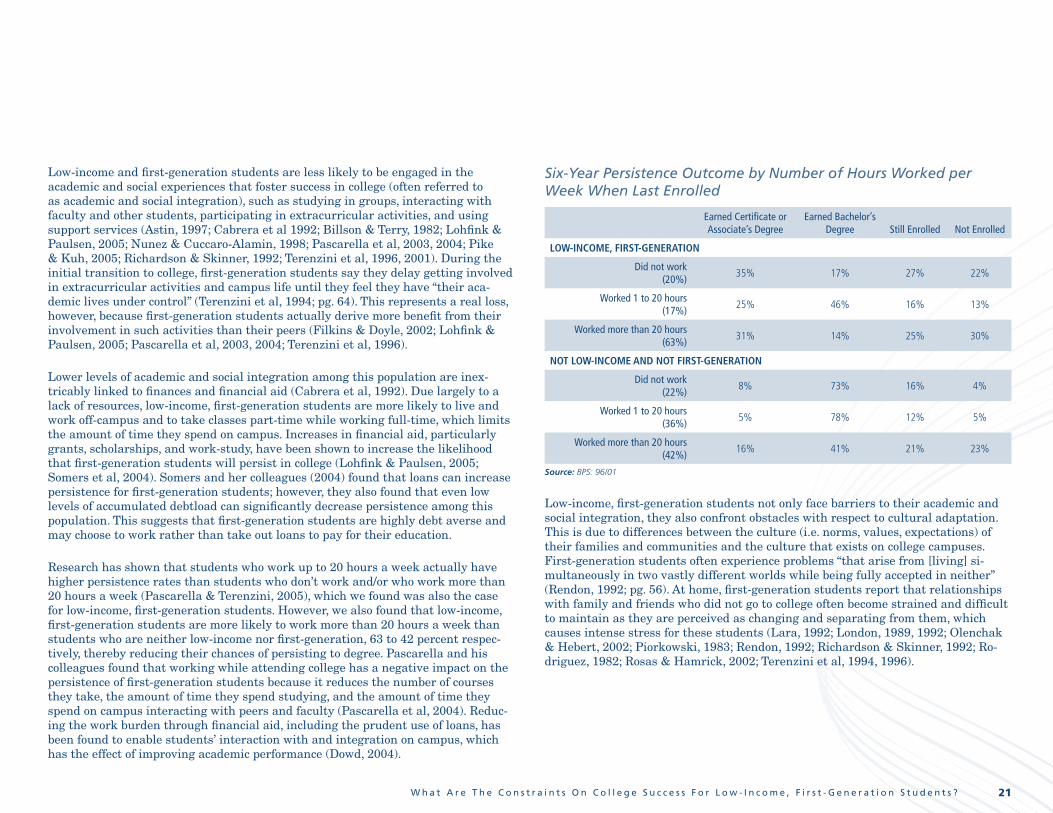
moving beyond access - pell institute€¦ · moving beyond access college success for low-income,...
TRANSCRIPT

Moving Beyond AccessCollege Success For Low-Income, First-Generation Students
20
08
ABOUT THE PELL INSTITUTE
The Pell Institute for the Study of Opportunity in Higher Education, sponsored by the Council for Opportunity in Education, conducts and disseminates research and policy analysis to encourage policymakers, educators, and the
public to improve educational opportunities and outcomes for low-income, first-generation, and disabled college students. The Pell Institute is the first research institute to specifically examine the issues affecting educational opportunity for this growing population.
For Further inFormation contact:
Chandra Taylor Smith, Ph.D., Director
the PeLL inStitute For the Study of Opportunity in Higher Education 1025 Vermont Avenue, NW, Suite 1020 Washington, DC 20005 P: 202.638.2887 F: 202.638.3808www.pellinstitute.org
Senior SchoLarSAdolfo BermeoThomas MortensonLana MuraskinCongressman Louis StokesVincent Tinto
adviSory committeeSonya Anderson, The Oprah Winfrey FoundationEstela Bensimon, University of Southern CaliforniaBetsy Brand, American Youth Policy ForumAlberto Cabrera, University of Maryland - College ParkHeather Eggins, Staffordshire UniversityDavid Evans, Educational Policy ConsultantDonald Heller, Pennsylvania State UniversityScott Miller, Pennsylvania Higher Education Assistance AgencyBarmak Nassirian, American Association of Collegiate Registrars and Admissions OfficersRaymund Paredes, Texas Higher Education Coordinating BoardThomas Wolanin, Institute for Higher Education Policy
Moving Beyond AccessCollege Success For Low-Income, First-Generation Students
Jennifer Engle, Ph.D. Vincent Tinto, Ph.D.
TABLe oF conTenTs
Acknowledgements . . . . . . . . . . . . . . . . . . . . . . . . . . . . . . . . . . . . . . .1
Executive Summary . . . . . . . . . . . . . . . . . . . . . . . . . . . . . . . . . . . . . . . .2
Introduction – Why College Success Matters. . . . . . . . . . . . . . . . . . . .5
Who Are Low-Income, First-Generation Students?. . . . . . . . . . . . . . .8
How Do Low-Income, First-Generation Students Fare in College? . . . . . . . . . . . . . . . . . . . . . . . . . . . . . . . . . .11
What Are the Constraints on College Success for Low-Income, First-Generation Students?. . . . . . . . . . . . . . . . . . .20
How Colleges Can Promote Success for Low-Income, First-Generation Students . . . . . . . . . . . . . . . . . . . . . .25
Conclusions and Recommendations. . . . . . . . . . . . . . . . . . . . . . . . . .28
References . . . . . . . . . . . . . . . . . . . . . . . . . . . . . . . . . . . . . . . . . . . . . .30
1A c k n o w l e d g e m e n t s
AcKnoWLedgeMenTs
This report was written by Jennifer Engle, former Senior Research Analyst, and Vincent Tinto, Senior Scholar at the Pell Institute. The report was edited by Colleen O’Brien, former Director of the Pell Institute, and Susan Trebach,
former Vice President for Communications at the Council for Opportunity in Educa-tion. Ryan Davis, Abby Miller, Brian Estes, and Tiffany Jones at the Pell Institute also provided research assistance for this report.
We would like to thank a number of individuals who provided assistance in the analysis and writing of this report. First, we’d like to thank Lutz Berkner, Senior Research Associate at MPR Associates, for his technical assistance with gaining access to the data for this research. We’d also like to thank Michelle Cooper, Presi-dent of the Institute for Higher Education Policy, and Kenneth Redd, Director of Research and Policy Analysis at the National Association of College and University Business Officers, for providing valuable feedback on the research design and for reviewing the report draft. Finally, we’d like to acknowledge the 3M Foundation for providing support for this study.
We heartily acknowledge the efforts of these individuals in the process of conduct-ing this research. We also recognize that responsibility for the content of this report, including any errors or omissions, lies solely with the authors.
2 M o v i n g B e y o n d A c c e s s
eXecUTive sUMMARy:Moving Beyond Access: College Success for Low-Income, First-Generation Students
Why doeS coLLege SucceSS matter?
With major strides in access to postsecondary education for all students in recent decades, it is tempting to assume that such progress has erased disparities in college enrollment and completion in the United States. Yet
despite having one of the highest college participation rates in the world, large gaps persist in terms of access to and success in higher education in this country, particu-larly for low-income, minority, and first-generation students.
Given the pressure to remain competitive in the global knowledge economy, it is in our shared national interest to act now to increase the number of students who not only enter college, but more importantly earn their degrees, particularly bachelor’s degrees. Due to the changing demographics of the United States, we must focus our efforts on improving postsecondary access and success among those populations who have previously been underrepresented in higher education, namely low-income and minority students, many of whom will be the first in their families to go to college.
In order to inform the efforts of educators and policymakers to improve college access and success, the Pell Institute has produced a report, funded by the 3M Foundation, that examines the current status of low-income, first-generation college students1 in higher education. Using data from the U.S. Department of Educa-tion datasets, we describe the ways in which this population participates in higher education, including persistence and degree attainment rates, and compare their participation to other students, including those who are neither low-income nor first-generation. We discuss the barriers that low-income, first-generation students face to achieving success in college, as well as the strategies that colleges and universities can pursue to address these barriers and improve students’ chances of earning degrees. We also offer recommendations for institutional and government actions that could go a long way towards closing the access and success gaps that exist today for this doubly-disadvantaged population.
1 Low-income status is defined as having a family income below $25,000 and first-generation status includes students whose parents do not have bachelor’s degrees. Here we focus our comparisons between low-income, first-generation students and students who are neither low-income nor first-generation.
hoW do LoW-income, FirSt-generation StudentS Fare in coLLege?
For most of the 4.5 million low-income, first-generation students enrolled in post-secondary education today (approximately 24 percent of the undergraduate popu-lation), the path to the bachelor’s degree will be long, indirect, and uncertain. For many, the journey will end where it begins. Using data from the National Center for Education Statistics’ Beginning Postsecondary Study (BPS:96/01), we found that low-income, first-generation students experience less success than their peers right from the start. Across all institution types:
Low-income, first-generation students were nearly four times more likely – 26 to 7 •percent - to leave higher education after the first year than students who had neither of these risk factors.
Six years later, nearly half (43 percent) of low-income, first-generation students had •left college without earning their degrees. Among those who left, nearly two-thirds (60 percent) did so after the first year.
After six years, only 11 percent of low-income, first-generation students had earned bachelor’s degrees compared to 55 percent of their more advantaged peers. This was due in part to lower graduation rates for low-income, first-generation students in the four-year sector:
In public four-year institutions, only 34 percent of low-income, first-generation stu-•dents earned bachelor’s degrees in six years compared to 66 percent of their peers.
In private, not-for-profit four-year institutions, there was an even larger gap between •low-income, first-generation students and their peers, 43 to 80 percent respectively.
Despite such gaps, low-income, first-generation students were actually more than seven times more likely to earn bachelor’s degrees if they started in four-year insti-tutions, but only 25 percent of them did so. A large number of low-income, first-gen-eration students began - and ended - their studies at public two-year and for-profit institutions.
More advantaged students who began at public two-year institutions went on to attain bachelor’s degrees at nearly five times the rate of low-income, first-generation students, 24 versus 5 percent respectively. This is due largely to higher transfer rates among students who were neither low-income nor first-generation; only 14 percent of low-income, first-generation students attending public two-year and for-profit institutions transferred to four-year institutions within six years compared to 50 percent of their more advantaged peers.
3E x e c u t i v e S u m m a r y
It is worth noting that not all students who attend public two-year and for-profit institutions enroll with the intention of earning bachelor’s degrees. Many of these students plan to and successfully complete certificates and associate’s degrees. How-ever, we found that 63 percent of low-income, first-generation students attending public two-year institutions said they planned to earn at least a bachelor’s degree, with nearly half of these students aspiring to post-baccalaureate degrees. Yet, only 5 percent of them actually earned bachelor’s degrees within six years.
Thus, we see that while public two-year and for-profit institutions are major points of initial access to postsecondary education for low-income, first-generation students, and provide a reasonable opportunity to earn certificates or associate’s degrees, the chances of successfully attaining the increasingly important baccalau-reate degree via these institutions are limited for this population.
What are the conStraintS on coLLege SucceSS For LoW-income, FirSt-generation StudentS?
Our analysis shows low-income, first-generation students face a number of challeng-es that make it difficult for them to be successful in college. They disproportionately come from ethnic and racial minority backgrounds with lower levels of academic preparation. They also tend to be older, less likely to receive financial support from parents, and more likely to have multiple obligations outside college, like family and work, that limit their full participation in the college experience. Research has shown that these factors lower students’ chances of persisting to graduation.
Previous research has also shown, however, that even after taking their demograph-ic backgrounds, enrollment characteristics, and academic preparation into consider-ation, low-income and first-generation students are still at greater risk of failure in postsecondary education. This suggests that the problem is as much the result of the experiences these students have during college as it is attributable to the experi-ences they have before they enroll.
Research has shown that low-income and first-generation students are less likely to be engaged in the academic and social experiences that foster success in college, such as studying in groups, interacting with faculty and other students, participat-ing in extracurricular activities, and using support services. Lower levels of academ-ic and social integration among this population are inextricably linked to finances and financial aid.
Due largely to a lack of resources, low-income, first-generation students are more likely to live and work off-campus and to take classes part-time while working full-time, which limits the amount of time they spend on campus. As our research using data from NCES’ National Postsecondary Student Aid Study (NPSAS:04 UG) shows, unmet financial need – need that remains after applying all financial aid – is a ma-jor problem for low-income, first-generation students. The mean amount of unmet need for low-income, first-generation students is nearly $6,000 (before loans), which represents half of their median annual income of $12,100. As a result, they work and borrow more with negative consequences in terms of college completion.
hoW can We Promote coLLege acceSS and SucceSS For LoW-income, FirSt-generation StudentS?
For too many low-income, first-generation students, the newly-opened door to Amer-ican higher education has been a revolving one. The unavoidable fact is that while college access has increased for this population, the opportunity to successfully earn a college degree, especially the bachelor’s degree, has not. The major barrier to the baccalaureate for low-income, first-generation students is that vast majority of them begin – and end – their studies in two-year and for-profit institutions. Unfortunate-ly, the segregation of low-income students into the less-than-four-year sector has only gotten worse over time.
What can be done to increase the number of low-income, first-generation students who enroll in and graduate from four-year institutions with bachelor’s degrees? We offer the following recommendations to practitioners and policymakers alike:
Improve academic preparation for college: Taking a rigorous high school curriculum, including advanced mathematics, greatly increases the chances that low-income and first-generation students will attend college, particularly four-year institutions. To that end, students and their parents need:
More information and counseling about gateway courses before high school. •
Support to complete challenging coursework given gaps in prior preparation. •
Greater access to rigorous college-preparatory courses with well-prepared teachers. •
A strong college-going culture in their high schools with adequate support •from well-trained counselors.
4 M o v i n g B e y o n d A c c e s s
Provide additional financial aid for college: With adequate resources, more low-income, first-generation students could afford to enroll in four-year institutions or attend full-time, both of which would increase their chances of earning four-year degrees. Unfortunately, funding for the Federal Pell Grant and Work-Study programs has not kept pace while tuition and fees have increased dramatically in recent years. To reduce the impact of financial barriers, low-income, first-generation students need:
Outreach through workshops for students and their parents about the •financial aid process, especially filling out the FAFSA.
Improved financial literacy about their options for covering the cost of •attendance at four-year institutions, including the prudent use of loans.
Increases in grant aid from institutional, state, and federal sources, which will •require a shift away from merit aid at the institutional and state levels.
Greater assistance with covering unmet financial need, such as through •the use of expanded work-study programs.
Increase transfer rates to four-year colleges: Given the economic and other realities that force most low-income, first-generation students to begin their studies in the two-year sector, there needs to be a greater emphasis on increasing transfer rates from two- to four-year colleges by providing:
A clear vision of the long-term pathway from high school to a two-year college •and then to a four-year college through pre-college counseling.
Effective developmental courses to address shortcomings in preparation. •
Strong transfer counseling from advisors as well as favorable articulation policies. •
Adequate financial counseling and aid (e.g. transfer scholarships) as well as •academic and social support to ensure degree completion after transfer.
Ease the transition to college: Low-income, first-generation students need con-siderable support as they make the transition to college. Strategies that have been shown to help include:
Early intervention through bridge and orientation programs. •
Advising, tutoring, and mentoring by faculty and peers. •
Participation in special programs for at-risk populations that “scale down” •the college experience.
Encourage engagement on the college campus: Colleges must remove the bar-riers (primarily financial) that prevent low-income, first-generation students from fully engaging in the experiences associated with success by:
Exposing students to the college environment as early as possible through •college tours and other college planning exercises.
Offering additional opportunities for work-study to increase the amount of •time these students spend on campus while meeting their financial needs.
Focusing on increasing interaction and engagement in the classroom to •make use of the only time many of these students spend on campus.
Promote (re)entry for young and working adults: In order to meet economic competitiveness needs, most states will need to help young and working adults get back on the college track by:
Providing support programs to help adults complete their GED.•
Offering college credit for experiential learning in the workplace.•
Reaching out to students who leave college with a limited number of •credits remaining to graduation.
Expanding financial aid eligibility for part-time students and/or providing •additional resources (e.g. childcare) to promote persistence.
As the United States continues to realize the importance of increasing the educa-tional attainment of its citizens as the key to its future economic stability in the global marketplace, improving postsecondary access and success among underrepre-sented populations, such as low-income, first-generation students, is paramount. As the analysis in this report has shown, there is much work to be done if this growing population is to participate and achieve within higher education similar to their more advantaged peers. Without action by policymakers at all levels, it appears that not only will these students be left behind, but so too will the United States.
5I n t r o d u c t i o n
inTRodUcTionWhy College Retention Matters
On the surface, America’s public commitment to provide access to any indi-vidual who seeks a postsecondary education seems to be gaining ground. The United States’ higher education system has one of the highest participation
rates in the world (OECD, 2007). Nearly 15 million students are currently enrolled as undergraduates in U.S. colleges and universities, a number that has more than doubled in the past 35 years (NCES, 2007a). As overall enrollments have grown, the number of students from historically underrepresented groups participating in higher education, including low-income and first-generation college students, has also risen. For example, the number of low-income students entering college imme-diately after high school has increased by over 60 percent since 1970, with nearly 1.6 million enrolling for the first time in 2005 (Mortenson, 2007). Today, it might seem that access to higher education for all students, including those from low-income and other disadvantaged backgrounds, is greater than ever.
But scratch the surface of this apparent success, and the story about access and opportunity in American higher education is much more complex and a lot less hopeful. Although there have been improvements in terms of access, equality in the attainment of four-year college degrees remains elusive for low-income and first-generation students. The baccalaureate degree attainment rate among young people from low-income families increased from 6 percent in 1970 to 12 percent in 2005; however, the rate among high-income youth increased from 40 percent to 73 percent (Mortenson, 2007). This means that high-income youth are six times more likely to earn a four-year degree than are low-income students, and the gap between them has nearly doubled in the last 35 years.
This disparity in degree attainment reflects the fact that, despite recent gains in access, low-income and first-generation students are still less likely to go to college than their more privileged peers. While the college continuation rate (the percent-age of high school seniors who go on to college immediately) for low-income high school graduates doubled from 26 percent in 1972 to 54 percent in 2005, it still lags considerably behind the 81 percent rate for high-income students (NCES, 2007b). However, the disparity in baccalaureate degree attainment also reflects a persistent and growing gap in degree completion among those who do go to college (Mortenson, 2007). As these data illustrate, it is no longer enough to be concerned only about whether low-income and first-generation students go to college. We also must be concerned about where and how they go to college – and the experiences they have once enrolled – to ensure that this population can stay there through the completion of a degree, particularly the bachelor’s degree.
Why does degree attainment matter? The consequences of this continuing loss of human capital cannot be underestimated. For example, the difference between a high school diploma and a four-year degree in both annual and lifetime earnings is considerable, and the gap has increased significantly over time (U.S. Census Bureau, 2002). Today’s four-year college graduates will earn nearly $1 million more over their working lives than will those who only receive a high school diploma and nearly $500,000 more than those who attend some college and/or earn a two-year degree (College Board, 2007). For the vast majority of low-income individuals, earn-ing a bachelor’s degree is the only way they can increase their earning potential enough to overcome their current economic circumstances (Terenzini et al, 2001). In-creasing the number of bachelor’s degree recipients pays big dividends for society as well, providing much needed tax revenue for states and the nation at large. It also reduces the range of costs the nation now bears for poverty, unemployment, crime, and health, all of which are associated with lower levels of education and income (College Board, 2007; IHEP, 2005).
Furthermore, it has become all too apparent that our nation must improve the educational attainment rates of its citizens in order to increase our competitive-ness in the global knowledge economy. Over the next ten years, 80 percent of the fastest-growing occupations in the U.S. will require at least an associate’s degree; 50 percent will require a bachelor’s degree or higher (Bureau of Labor Statistics, 2005). After leading the world in degree production for decades, overall degree attainment rates have stagnated in the United States while other countries have made rapid gains in recent years. The problem is that while the United States continues to have one of the highest college participation rates in the world (although ground has been lost here too), the nation ranks in the bottom half in terms of degree completion, and ties for last in baccalaureate degree completion (NCPPHE, 2006; OECD, 2007; Reindl, 2007). Simply put, it is in our shared national interest to act now to increase the number of students who not only enter college, but more importantly earn their degrees, particularly baccalaureates.
Yet, due to rapidly changing demographics, the overall educational attainment of the United States is actually expected to decline in the coming years (Kelly, 2005). The fastest growing segments of the population, low-income and minority youth, have historically been the least likely to earn college degrees, and the gaps in degree attainment for these groups have only increased over time (Kelly, 2005; Mortenson, March 2006; WICHE, 2003). Today, there are more than 12 million children living in poverty, two-thirds of whom come from minority backgrounds (U.S. Census Bureau, 2003). Nearly half of all school children (44 percent), the future college-going popu-lation, come from low-income families (as measured by free/reduced price lunch eli-gibility). This number has been on the rise for the last ten years (Mortenson, March
6 M o v i n g B e y o n d A c c e s s
2006). Thus, in order to increase degree attainment rates in this country, there must be a major effort to improve both postsecondary access and success among those populations who have previously been underrepresented in higher education, namely low-income and minority students, many of whom will be the first in their families to go to college.
n n n
This report examines the postsecondary characteristics, experiences, and outcomes of low-income, first-generation college students. Previous research has separately examined how low-income status (see Choy, 2000; Cook & King, 2004) and first-generation status (see Chen, 2005; Nunez & Cuccaro-Alamin, 1998) correlate with a range of factors (i.e. demographic and enrollment characteristics) that lower these students’ chances of successfully earning a college degree. In this report, we aim to show how the combined impact of these two characteristics put students who are both low-income and the first in their families to go to college at the greatest risk of failure in postsecondary education. By focusing on low-income, first-generation students, we hope to increase the amount of attention – and resources – given to improving college success for this doubly-disadvantaged population.
Using data from the U.S. Department of Education datasets, we describe the ways in which this population participates in higher education, including persistence and degree attainment rates, and compare their participation to other students, includ-ing those who are neither low-income nor first-generation. We discuss the barriers that low-income, first-generation students face to achieving success in college, as well as the strategies that colleges and universities can pursue to address these barriers and improve these students’ chances of earning degrees. Finally, we offer recommendations for institutional and government actions that could go a long way towards closing the access and success gaps that exist today.
ABoUT THe dATA
The data presented in this report are drawn from three datasets from the U.S. Department of Education’s National Center for Education Statistics (NCES):
National Postsecondary Student Aid Study (NPSAS)
NPSAS examines how students and their families pay for postsecondary education. The study is based on a nationally representative sample of students in postsecondary education institutions, including undergraduate, graduate, and first-professional students. Students attending all types and levels of institutions are represented, including public and private not-for-profit and for-profit institutions at the less-than-two-year, two-year, and four-year levels. NPSAS includes general demographics and other characteristics of these students, types of aid and amounts received, cost of attending college, combinations of work, study, and borrowing, and enrollment patterns. The data in this report come from the most recent undergraduate NPSAS (NPSAS:04) which was conducted during the 2003-2004 academic year.
Beginning Postsecondary Students (BPS) Study
BPS is a longitudinal study that follows students who enrolled in a postsecondary institution for the first time. A sample of students is surveyed during their first year, and three and six years later, about their undergraduate experiences, persistence in school, transfer between institutions, degree completion, and employment following enrollment. The data in this report come from the most recently completed BPS, which follows students who first enrolled in postsecondary education in 1995-1996 over a six-year period to 2001-2002. The BPS:96/01 sample was drawn from first-time undergraduates participating in the NPSAS:96 study.
Baccalaureate and Beyond (B&B) Study
B&B is a longitudinal study that follows students who have completed their baccalaureate degrees. The data in this report come from the first complete B&B study, which includes about 11,000 students who were identified in the NPSAS:93 study as having earned their bachelor’s degrees in the 1992-93 academic year. These students were surveyed in their last year of undergraduate studies and followed up one (1994), four (1997), and ten (2003) years later. Students were asked questions about their undergraduate education and their educational and employment experiences after graduation.
7I n t r o d u c t i o n
An additional reason for choosing low-income, first-generation students as the focus of this report is that this population is frequently the target audience for many pre-college and in-college support programs. The federally-funded TRIO programs are among the largest and oldest of such programs that provide services directly to this student population. The TRIO programs form a continuum of support for low-income, first-generation, and disabled students that extends from middle school through college. As defined in the Higher Educa-tion Act – the legislation that addresses the majority of the federal government’s invest-ment in higher education – two-thirds of participants in TRIO programs must be both low-income and first-generation; the rest may be either low-income or first-generation. Nationwide, more than 2,800 TRIO programs serve nearly one million students annually.
The talent Search and upward Bound programs provide pre-college services that aim to increase college awareness and preparation among middle- and high-school students. Both programs offer counseling, tutoring, mentoring, and workshops to provide students with information about the college admissions process as well as to provide assistance with obtaining financial aid (e.g. help with filling out the FAFSA) and preparing for college entrance exams. Upward Bound offers a more intensive program that includes supplemen-tal academic instruction in key college-preparatory courses after school and on Saturdays throughout the school year and during a summer program usually held on a college campus. Another program, upward Bound math/Science, helps high school students recognize and develop their potential to excel in math and science and encourages them to pursue postsecondary degrees and careers in these fields.
The educational opportunity centers help adults (over age 19) get back on the college track. The program assists participants by helping them earn their high school equivalency degrees, apply to college and secure financial aid, re-enter college, and/or successfully remain enrolled in college until graduation. The veterans upward Bound program assists adults who have served in the military by helping them transition to postsecondary educa-tion.
The Student Support Services program serves students who are enrolled in two- and four-year institutions. The program provides services aimed at improving college persis-tence and graduation rates among this population as well as increasing transfer rates from two- to four-year institutions. Services include instruction in basic skills, tutoring, academic advising, financial aid and career counseling, transfer and graduate school counseling, and mentoring. Some programs also provide grant aid to participants.
The ronald e. mcnair Post-Baccalaureate achievement Program aims to increase the number of doctoral degrees earned by students from disadvantaged populations (low-income, first-generation, and underrepresented minority students) who have strong academic potential by providing assistance with graduate school preparation, application, and entrance.2
2 For more information on the TRIO programs, visit the Council for Opportunity in Education at www.coenet.us and the U.S. Department of Education, Office for Postsecondary Education at www.ed.gov/about/offices/list/ope/trio/index.html.
TARgeTing LoW-incoMe, FiRsT-geneRATion sTUdenTs:The Federal TRIO Programs
8 M o v i n g B e y o n d A c c e s s
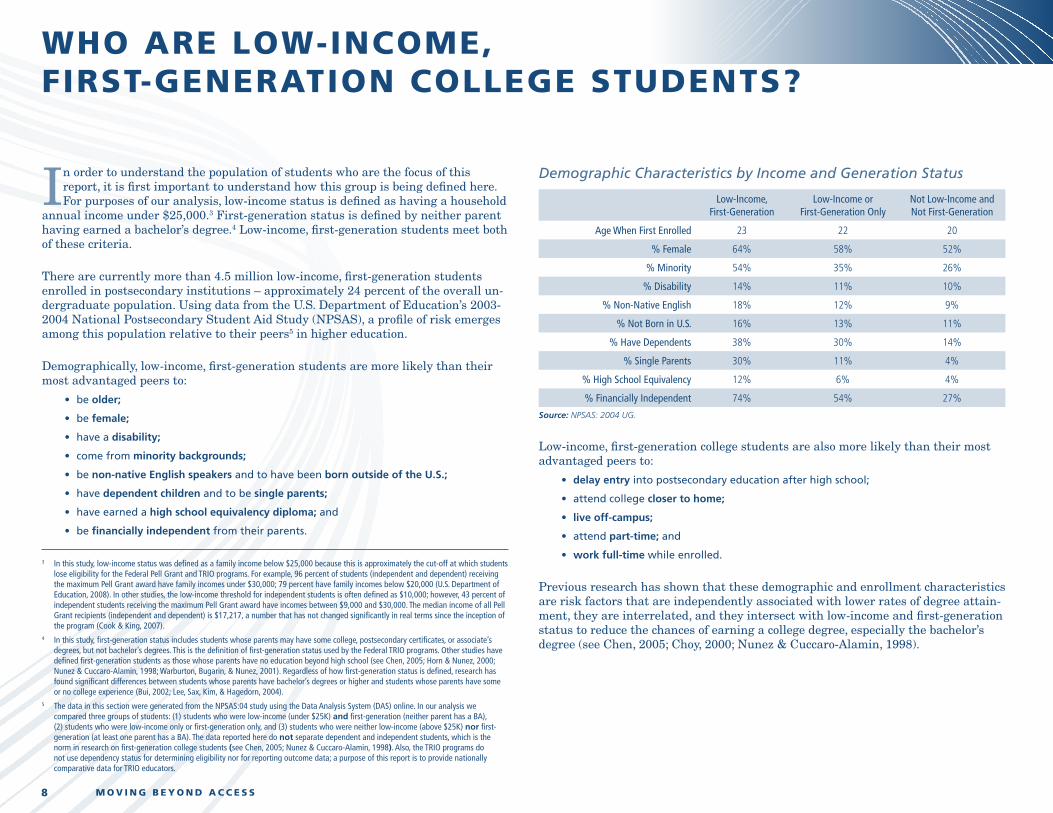
In order to understand the population of students who are the focus of this report, it is first important to understand how this group is being defined here. For purposes of our analysis, low-income status is defined as having a household
annual income under $25,000.3 First-generation status is defined by neither parent having earned a bachelor’s degree.4 Low-income, first-generation students meet both of these criteria.
There are currently more than 4.5 million low-income, first-generation students enrolled in postsecondary institutions – approximately 24 percent of the overall un-dergraduate population. Using data from the U.S. Department of Education’s 2003-2004 National Postsecondary Student Aid Study (NPSAS), a profile of risk emerges among this population relative to their peers5 in higher education.
Demographically, low-income, first-generation students are more likely than their most advantaged peers to:
be • older;
be • female;
have a • disability;
come from • minority backgrounds;
be • non-native english speakers and to have been born outside of the u.S.;
have • dependent children and to be single parents;
have earned a• high school equivalency diploma; and
be • financially independent from their parents.
3 In this study, low-income status was defined as a family income below $25,000 because this is approximately the cut-off at which students lose eligibility for the Federal Pell Grant and TRIO programs. For example, 96 percent of students (independent and dependent) receiving the maximum Pell Grant award have family incomes under $30,000; 79 percent have family incomes below $20,000 (U.S. Department of Education, 2008). In other studies, the low-income threshold for independent students is often defined as $10,000; however, 43 percent of independent students receiving the maximum Pell Grant award have incomes between $9,000 and $30,000. The median income of all Pell Grant recipients (independent and dependent) is $17,217, a number that has not changed significantly in real terms since the inception of the program (Cook & King, 2007).
4 In this study, first-generation status includes students whose parents may have some college, postsecondary certificates, or associate’s degrees, but not bachelor’s degrees. This is the definition of first-generation status used by the Federal TRIO programs. Other studies have defined first-generation students as those whose parents have no education beyond high school (see Chen, 2005; Horn & Nunez, 2000; Nunez & Cuccaro-Alamin, 1998; Warburton, Bugarin, & Nunez, 2001). Regardless of how first-generation status is defined, research has found significant differences between students whose parents have bachelor’s degrees or higher and students whose parents have some or no college experience (Bui, 2002; Lee, Sax, Kim, & Hagedorn, 2004).
5 The data in this section were generated from the NPSAS:04 study using the Data Analysis System (DAS) online. In our analysis we compared three groups of students: (1) students who were low-income (under $25K) and first-generation (neither parent has a BA), (2) students who were low-income only or first-generation only, and (3) students who were neither low-income (above $25K) nor first-generation (at least one parent has a BA). The data reported here do not separate dependent and independent students, which is the norm in research on first-generation college students (see Chen, 2005; Nunez & Cuccaro-Alamin, 1998). Also, the TRIO programs do not use dependency status for determining eligibility nor for reporting outcome data; a purpose of this report is to provide nationally comparative data for TRIO educators.
Demographic Characteristics by Income and Generation Status
Low-Income, First-Generation
Low-Income or First-Generation Only
Not Low-Income and Not First-Generation
Age When First Enrolled 23 22 20
% Female 64% 58% 52%
% Minority 54% 35% 26%
% Disability 14% 11% 10%
% Non-Native English 18% 12% 9%
% Not Born in U.S. 16% 13% 11%
% Have Dependents 38% 30% 14%
% Single Parents 30% 11% 4%
% High School Equivalency 12% 6% 4%
% Financially Independent 74% 54% 27%
Source: NPSAS: 2004 UG.
Low-income, first-generation college students are also more likely than their most advantaged peers to:
delay entry• into postsecondary education after high school;
attend college • closer to home;
live off-campus;•
attend • part-time; and
work• full-time while enrolled.
Previous research has shown that these demographic and enrollment characteristics are risk factors that are independently associated with lower rates of degree attain-ment, they are interrelated, and they intersect with low-income and first-generation status to reduce the chances of earning a college degree, especially the bachelor’s degree (see Chen, 2005; Choy, 2000; Nunez & Cuccaro-Alamin, 1998).
WHo ARe LoW-incoMe, FiRsT-geneRATion coLLege sTUdenTs?
9W h o A r e L o w - I n c o m e , F i r s t - G e n e r a t i o n C o l l e g e S t u d e n t s ?
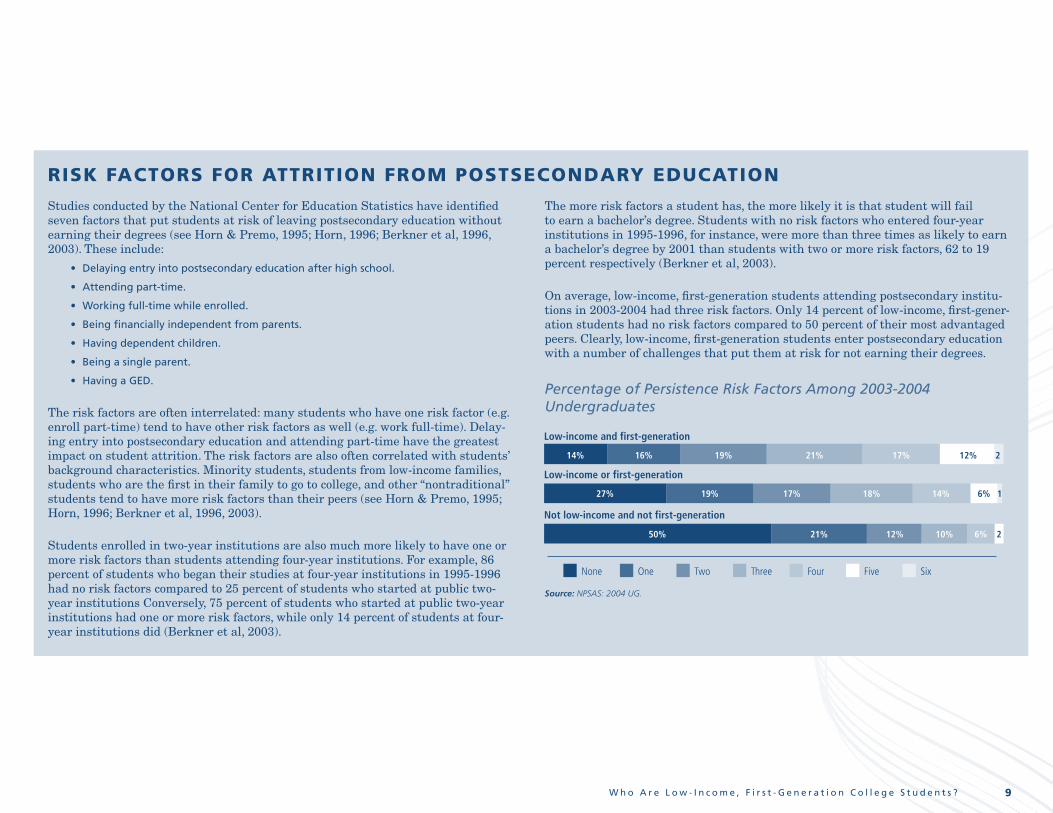
Studies conducted by the National Center for Education Statistics have identified seven factors that put students at risk of leaving postsecondary education without earning their degrees (see Horn & Premo, 1995; Horn, 1996; Berkner et al, 1996, 2003). These include:
Delaying entry into postsecondary education after high school.•
Attending part-time.•
Working full-time while enrolled.•
Being financially independent from parents.•
Having dependent children.•
Being a single parent.•
Having a GED.•
The risk factors are often interrelated: many students who have one risk factor (e.g. enroll part-time) tend to have other risk factors as well (e.g. work full-time). Delay-ing entry into postsecondary education and attending part-time have the greatest impact on student attrition. The risk factors are also often correlated with students’ background characteristics. Minority students, students from low-income families, students who are the first in their family to go to college, and other “nontraditional” students tend to have more risk factors than their peers (see Horn & Premo, 1995; Horn, 1996; Berkner et al, 1996, 2003).
Students enrolled in two-year institutions are also much more likely to have one or more risk factors than students attending four-year institutions. For example, 86 percent of students who began their studies at four-year institutions in 1995-1996 had no risk factors compared to 25 percent of students who started at public two-year institutions Conversely, 75 percent of students who started at public two-year institutions had one or more risk factors, while only 14 percent of students at four-year institutions did (Berkner et al, 2003).
The more risk factors a student has, the more likely it is that student will fail to earn a bachelor’s degree. Students with no risk factors who entered four-year institutions in 1995-1996, for instance, were more than three times as likely to earn a bachelor’s degree by 2001 than students with two or more risk factors, 62 to 19 percent respectively (Berkner et al, 2003).
On average, low-income, first-generation students attending postsecondary institu-tions in 2003-2004 had three risk factors. Only 14 percent of low-income, first-gener-ation students had no risk factors compared to 50 percent of their most advantaged peers. Clearly, low-income, first-generation students enter postsecondary education with a number of challenges that put them at risk for not earning their degrees.
Percentage of Persistence Risk Factors Among 2003-2004 Undergraduates
Not low-income and not first-generation
14%
27%
50% 21% 12% 10% 6% 2
19% 17% 18% 14% 6% 1
16% 19% 21% 17% 12% 2
Low-income or first-generation
Low-income and first-generation
None One Two Three Four Five Six
Source: NPSAS: 2004 UG.
RisK FAcToRs FoR ATTRiTion FRoM PosTsecondARy edUcATion
10 M o v i n g B e y o n d A c c e s s
Enrollment Characteristics by Income and Generation Status
Low-Income, First-Generation
Low-Income or First-Generation Only
Not Low-Income and Not First-Generation
% Delayed Enrollment 53% 41% 24%
Average Distance (miles) from Home 87 116 201
% Live Off-Campus 93% 88% 74%
% Attend Part-Time 52% 56% 43%
% Work Full-Time 37% 38% 26%
Source: NPSAS: 2004 UG.
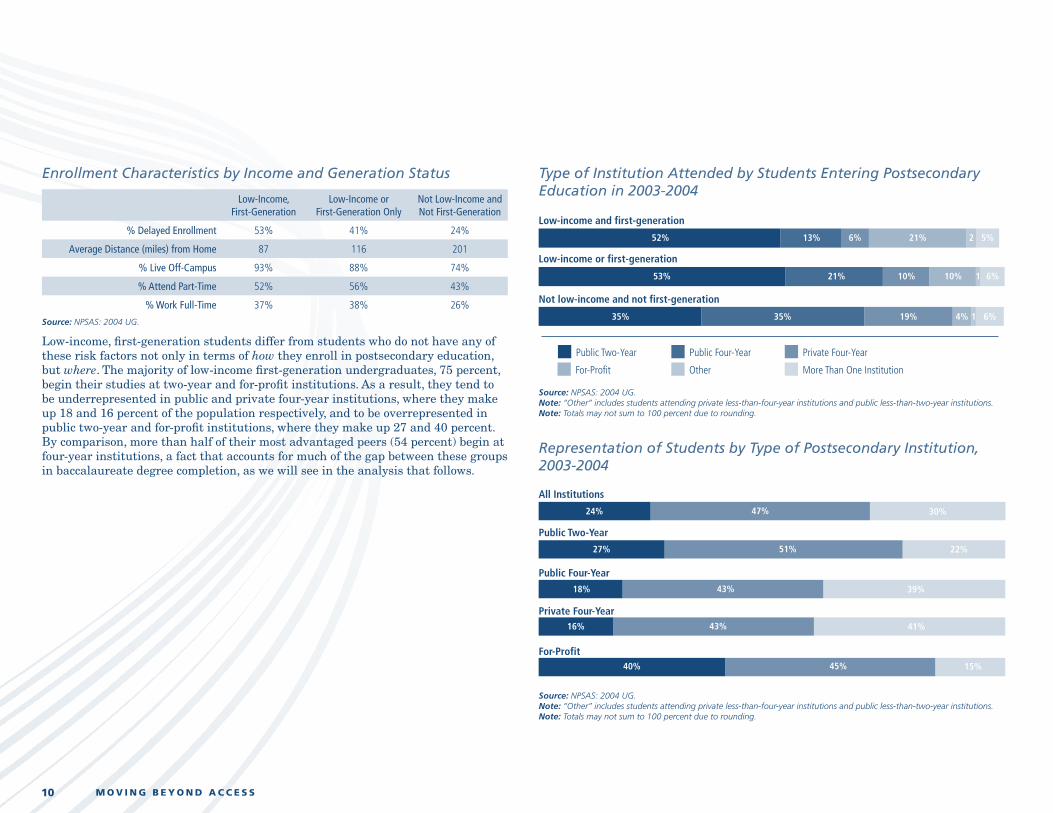
Low-income, first-generation students differ from students who do not have any of these risk factors not only in terms of how they enroll in postsecondary education, but where. The majority of low-income first-generation undergraduates, 75 percent, begin their studies at two-year and for-profit institutions. As a result, they tend to be underrepresented in public and private four-year institutions, where they make up 18 and 16 percent of the population respectively, and to be overrepresented in public two-year and for-profit institutions, where they make up 27 and 40 percent. By comparison, more than half of their most advantaged peers (54 percent) begin at four-year institutions, a fact that accounts for much of the gap between these groups in baccalaureate degree completion, as we will see in the analysis that follows.
Type of Institution Attended by Students Entering Postsecondary Education in 2003-2004
Not low-income and not first-generation
Low-income or first-generation
Low-income and first-generation
Public Two-Year Public Four-Year Private Four-Year
For-Profit Other More Than One Institution
52% 13% 6% 21% 2 5%
53% 21% 10% 10% 1 6%
35% 35% 19% 4% 1 6%
Source: NPSAS: 2004 UG. Note: “Other” includes students attending private less-than-four-year institutions and public less-than-two-year institutions.Note: Totals may not sum to 100 percent due to rounding.
Representation of Students by Type of Postsecondary Institution, 2003-2004
Public Four-Year
Public Two-Year
All Institutions
For-Profit
Private Four-Year
24% 47% 30%
27% 51% 22%
18% 43% 39%
16% 43% 41%
40% 45% 15%
Source: NPSAS: 2004 UG. Note: “Other” includes students attending private less-than-four-year institutions and public less-than-two-year institutions.Note: Totals may not sum to 100 percent due to rounding.
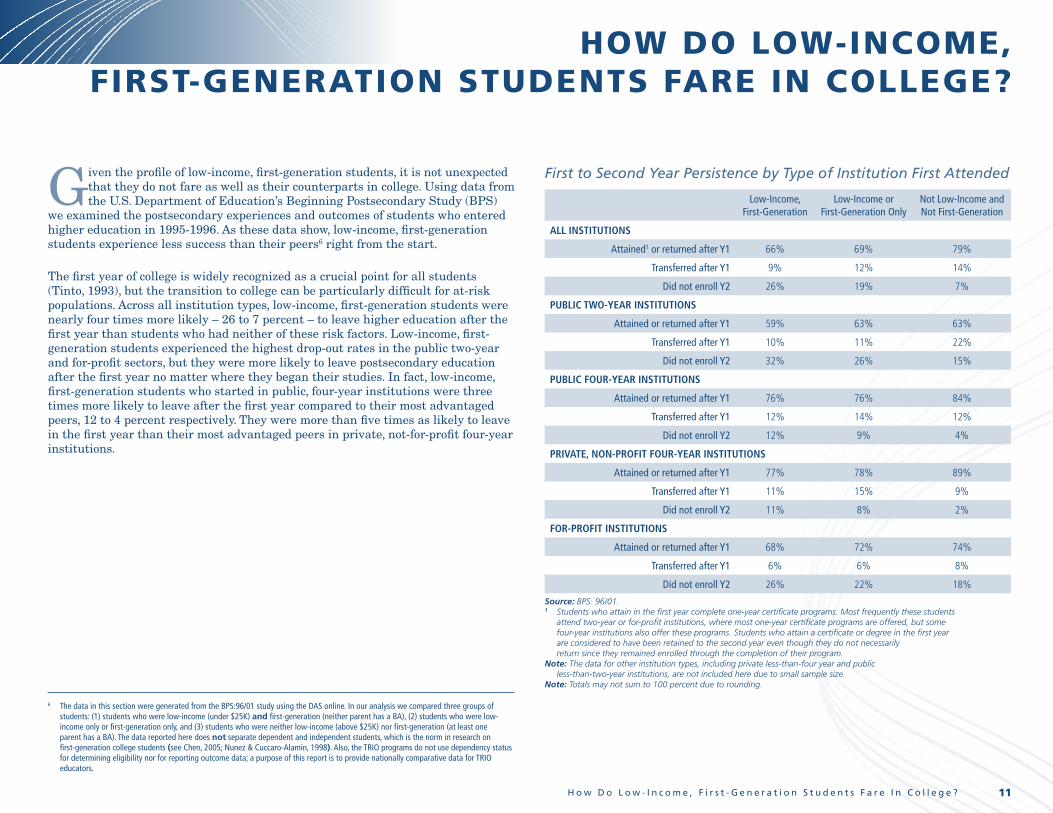
11H o w D o L o w - I n c o m e , F i r s t - G e n e r a t i o n S t u d e n t s F a r e I n C o l l e g e ?
Given the profile of low-income, first-generation students, it is not unexpected that they do not fare as well as their counterparts in college. Using data from the U.S. Department of Education’s Beginning Postsecondary Study (BPS)
we examined the postsecondary experiences and outcomes of students who entered higher education in 1995-1996. As these data show, low-income, first-generation students experience less success than their peers6 right from the start.
The first year of college is widely recognized as a crucial point for all students (Tinto, 1993), but the transition to college can be particularly difficult for at-risk populations. Across all institution types, low-income, first-generation students were nearly four times more likely – 26 to 7 percent – to leave higher education after the first year than students who had neither of these risk factors. Low-income, first-generation students experienced the highest drop-out rates in the public two-year and for-profit sectors, but they were more likely to leave postsecondary education after the first year no matter where they began their studies. In fact, low-income, first-generation students who started in public, four-year institutions were three times more likely to leave after the first year compared to their most advantaged peers, 12 to 4 percent respectively. They were more than five times as likely to leave in the first year than their most advantaged peers in private, not-for-profit four-year institutions.
6 The data in this section were generated from the BPS:96/01 study using the DAS online. In our analysis we compared three groups of students: (1) students who were low-income (under $25K) and first-generation (neither parent has a BA), (2) students who were low-income only or first-generation only, and (3) students who were neither low-income (above $25K) nor first-generation (at least one parent has a BA). The data reported here does not separate dependent and independent students, which is the norm in research on first-generation college students (see Chen, 2005; Nunez & Cuccaro-Alamin, 1998). Also, the TRIO programs do not use dependency status for determining eligibility nor for reporting outcome data; a purpose of this report is to provide nationally comparative data for TRIO educators.
First to Second Year Persistence by Type of Institution First Attended
Low-Income,
First-GenerationLow-Income or
First-Generation OnlyNot Low-Income and Not First-Generation
All InstItutIons
Attained1 or returned after Y1 66% 69% 79%
Transferred after Y1 9% 12% 14%
Did not enroll Y2 26% 19% 7%
PublIc two-YeAr InstItutIons
Attained or returned after Y1 59% 63% 63%
Transferred after Y1 10% 11% 22%
Did not enroll Y2 32% 26% 15%
PublIc Four-YeAr InstItutIons
Attained or returned after Y1 76% 76% 84%
Transferred after Y1 12% 14% 12%
Did not enroll Y2 12% 9% 4%
PrIvAte, non-ProFIt Four-YeAr InstItutIons
Attained or returned after Y1 77% 78% 89%
Transferred after Y1 11% 15% 9%
Did not enroll Y2 11% 8% 2%
For-ProFIt InstItutIons
Attained or returned after Y1 68% 72% 74%
Transferred after Y1 6% 6% 8%
Did not enroll Y2 26% 22% 18%
Source: BPS: 96/01.1 Students who attain in the first year complete one-year certificate programs. Most frequently these students
attend two-year or for-profit institutions, where most one-year certificate programs are offered, but some four-year institutions also offer these programs. Students who attain a certificate or degree in the first year are considered to have been retained to the second year even though they do not necessarily return since they remained enrolled through the completion of their program.
Note: The data for other institution types, including private less-than-four year and public less-than-two-year institutions, are not included here due to small sample size.
Note: Totals may not sum to 100 percent due to rounding.
HoW do LoW-incoMe, FiRsT-geneRATion sTUdenTs FARe in coLLege?
12 M o v i n g B e y o n d A c c e s s
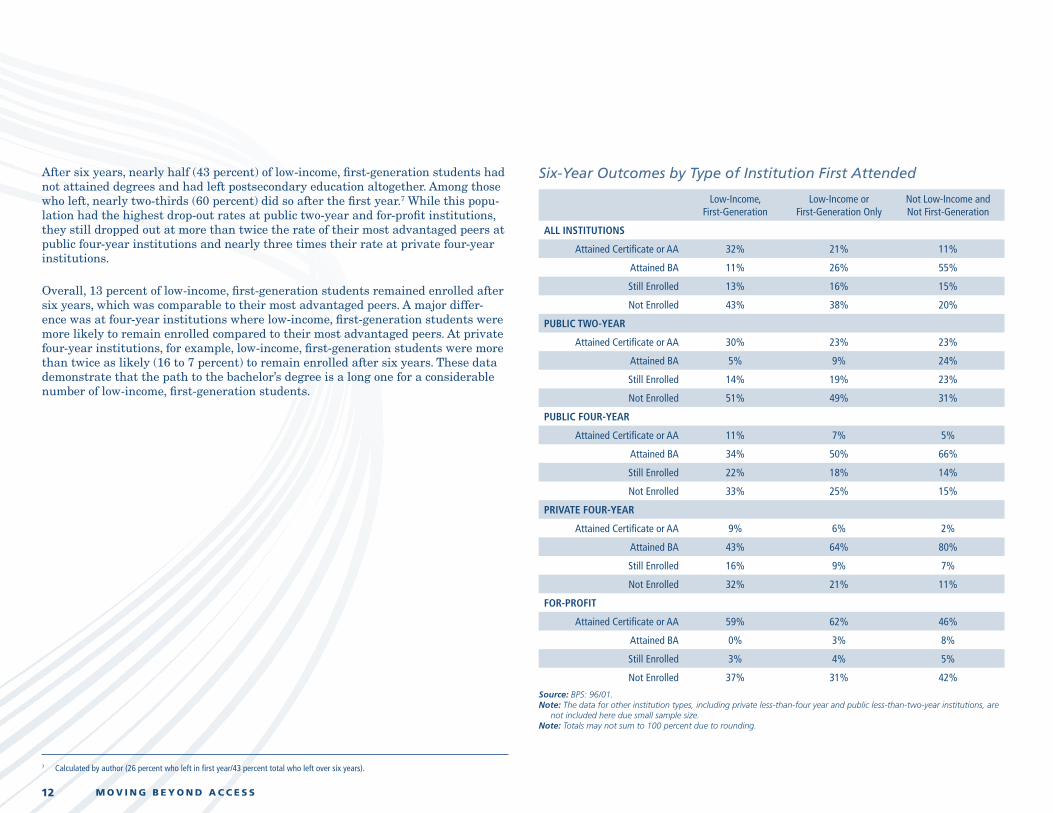
After six years, nearly half (43 percent) of low-income, first-generation students had not attained degrees and had left postsecondary education altogether. Among those who left, nearly two-thirds (60 percent) did so after the first year.7 While this popu-lation had the highest drop-out rates at public two-year and for-profit institutions, they still dropped out at more than twice the rate of their most advantaged peers at public four-year institutions and nearly three times their rate at private four-year institutions.
Overall, 13 percent of low-income, first-generation students remained enrolled after six years, which was comparable to their most advantaged peers. A major differ-ence was at four-year institutions where low-income, first-generation students were more likely to remain enrolled compared to their most advantaged peers. At private four-year institutions, for example, low-income, first-generation students were more than twice as likely (16 to 7 percent) to remain enrolled after six years. These data demonstrate that the path to the bachelor’s degree is a long one for a considerable number of low-income, first-generation students.
7 Calculated by author (26 percent who left in first year/43 percent total who left over six years).
Six-Year Outcomes by Type of Institution First Attended
Low-Income, First-Generation
Low-Income or First-Generation Only
Not Low-Income and Not First-Generation
All InstItutIons
Attained Certificate or AA 32% 21% 11%
Attained BA 11% 26% 55%
Still Enrolled 13% 16% 15%
Not Enrolled 43% 38% 20%
PublIc two-YeAr
Attained Certificate or AA 30% 23% 23%
Attained BA 5% 9% 24%
Still Enrolled 14% 19% 23%
Not Enrolled 51% 49% 31%
PublIc Four-YeAr
Attained Certificate or AA 11% 7% 5%
Attained BA 34% 50% 66%
Still Enrolled 22% 18% 14%
Not Enrolled 33% 25% 15%
PrIvAte Four-YeAr
Attained Certificate or AA 9% 6% 2%
Attained BA 43% 64% 80%
Still Enrolled 16% 9% 7%
Not Enrolled 32% 21% 11%
For-ProFIt
Attained Certificate or AA 59% 62% 46%
Attained BA 0% 3% 8%
Still Enrolled 3% 4% 5%
Not Enrolled 37% 31% 42%
Source: BPS: 96/01.Note: The data for other institution types, including private less-than-four year and public less-than-two-year institutions, are
not included here due small sample size.Note: Totals may not sum to 100 percent due to rounding.
13H o w D o L o w - I n c o m e , F i r s t - G e n e r a t i o n S t u d e n t s F a r e I n C o l l e g e ?
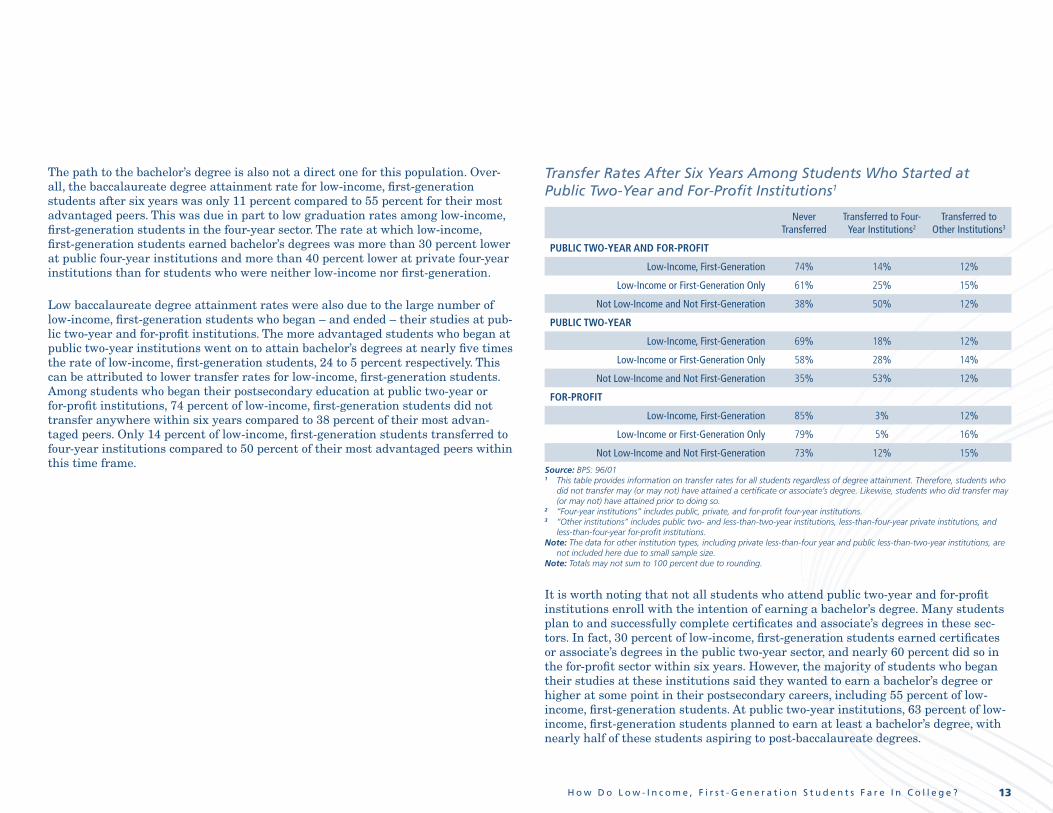
The path to the bachelor’s degree is also not a direct one for this population. Over-all, the baccalaureate degree attainment rate for low-income, first-generation students after six years was only 11 percent compared to 55 percent for their most advantaged peers. This was due in part to low graduation rates among low-income, first-generation students in the four-year sector. The rate at which low-income, first-generation students earned bachelor’s degrees was more than 30 percent lower at public four-year institutions and more than 40 percent lower at private four-year institutions than for students who were neither low-income nor first-generation.
Low baccalaureate degree attainment rates were also due to the large number of low-income, first-generation students who began – and ended – their studies at pub-lic two-year and for-profit institutions. The more advantaged students who began at public two-year institutions went on to attain bachelor’s degrees at nearly five times the rate of low-income, first-generation students, 24 to 5 percent respectively. This can be attributed to lower transfer rates for low-income, first-generation students. Among students who began their postsecondary education at public two-year or for-profit institutions, 74 percent of low-income, first-generation students did not transfer anywhere within six years compared to 38 percent of their most advan-taged peers. Only 14 percent of low-income, first-generation students transferred to four-year institutions compared to 50 percent of their most advantaged peers within this time frame.
Transfer Rates After Six Years Among Students Who Started at Public Two-Year and For-Profit Institutions1
Never Transferred
Transferred to Four-Year Institutions2
Transferred to Other Institutions3
PublIc two-YeAr And For-ProFIt
Low-Income, First-Generation 74% 14% 12%
Low-Income or First-Generation Only 61% 25% 15%
Not Low-Income and Not First-Generation 38% 50% 12%
PublIc two-YeAr
Low-Income, First-Generation 69% 18% 12%
Low-Income or First-Generation Only 58% 28% 14%
Not Low-Income and Not First-Generation 35% 53% 12%
For-ProFIt
Low-Income, First-Generation 85% 3% 12%
Low-Income or First-Generation Only 79% 5% 16%
Not Low-Income and Not First-Generation 73% 12% 15%
Source: BPS: 96/011 This table provides information on transfer rates for all students regardless of degree attainment. Therefore, students who
did not transfer may (or may not) have attained a certificate or associate’s degree. Likewise, students who did transfer may (or may not) have attained prior to doing so.
2 “Four-year institutions” includes public, private, and for-profit four-year institutions.3 “Other institutions” includes public two- and less-than-two-year institutions, less-than-four-year private institutions, and
less-than-four-year for-profit institutions.Note: The data for other institution types, including private less-than-four year and public less-than-two-year institutions, are
not included here due to small sample size.Note: Totals may not sum to 100 percent due to rounding.
It is worth noting that not all students who attend public two-year and for-profit institutions enroll with the intention of earning a bachelor’s degree. Many students plan to and successfully complete certificates and associate’s degrees in these sec-tors. In fact, 30 percent of low-income, first-generation students earned certificates or associate’s degrees in the public two-year sector, and nearly 60 percent did so in the for-profit sector within six years. However, the majority of students who began their studies at these institutions said they wanted to earn a bachelor’s degree or higher at some point in their postsecondary careers, including 55 percent of low-income, first-generation students. At public two-year institutions, 63 percent of low-income, first-generation students planned to earn at least a bachelor’s degree, with nearly half of these students aspiring to post-baccalaureate degrees.
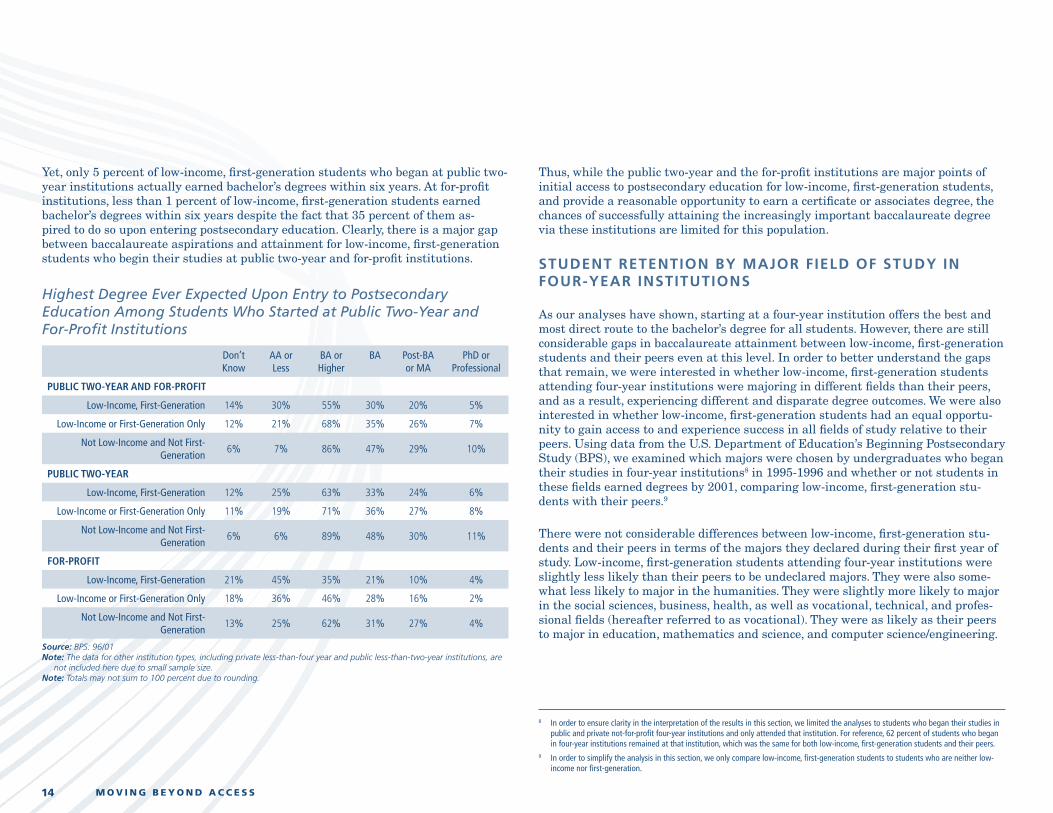
14 M o v i n g B e y o n d A c c e s s
Yet, only 5 percent of low-income, first-generation students who began at public two-year institutions actually earned bachelor’s degrees within six years. At for-profit institutions, less than 1 percent of low-income, first-generation students earned bachelor’s degrees within six years despite the fact that 35 percent of them as-pired to do so upon entering postsecondary education. Clearly, there is a major gap between baccalaureate aspirations and attainment for low-income, first-generation students who begin their studies at public two-year and for-profit institutions.
Highest Degree Ever Expected Upon Entry to Postsecondary Education Among Students Who Started at Public Two-Year and For-Profit Institutions
Don’t Know
AA or Less
BA or Higher
BA Post-BA or MA
PhD or Professional
PublIc two-YeAr And For-ProFIt
Low-Income, First-Generation 14% 30% 55% 30% 20% 5%
Low-Income or First-Generation Only 12% 21% 68% 35% 26% 7%
Not Low-Income and Not First-Generation
6% 7% 86% 47% 29% 10%
PublIc two-YeAr
Low-Income, First-Generation 12% 25% 63% 33% 24% 6%
Low-Income or First-Generation Only 11% 19% 71% 36% 27% 8%
Not Low-Income and Not First-Generation
6% 6% 89% 48% 30% 11%
For-ProFIt
Low-Income, First-Generation 21% 45% 35% 21% 10% 4%
Low-Income or First-Generation Only 18% 36% 46% 28% 16% 2%
Not Low-Income and Not First-Generation
13% 25% 62% 31% 27% 4%
Source: BPS: 96/01Note: The data for other institution types, including private less-than-four year and public less-than-two-year institutions, are
not included here due to small sample size.Note: Totals may not sum to 100 percent due to rounding.
Thus, while the public two-year and the for-profit institutions are major points of initial access to postsecondary education for low-income, first-generation students, and provide a reasonable opportunity to earn a certificate or associates degree, the chances of successfully attaining the increasingly important baccalaureate degree via these institutions are limited for this population.
Student retention By major FieLd oF Study in Four-year inStitutionS
As our analyses have shown, starting at a four-year institution offers the best and most direct route to the bachelor’s degree for all students. However, there are still considerable gaps in baccalaureate attainment between low-income, first-generation students and their peers even at this level. In order to better understand the gaps that remain, we were interested in whether low-income, first-generation students attending four-year institutions were majoring in different fields than their peers, and as a result, experiencing different and disparate degree outcomes. We were also interested in whether low-income, first-generation students had an equal opportu-nity to gain access to and experience success in all fields of study relative to their peers. Using data from the U.S. Department of Education’s Beginning Postsecondary Study (BPS), we examined which majors were chosen by undergraduates who began their studies in four-year institutions8 in 1995-1996 and whether or not students in these fields earned degrees by 2001, comparing low-income, first-generation stu-dents with their peers.9
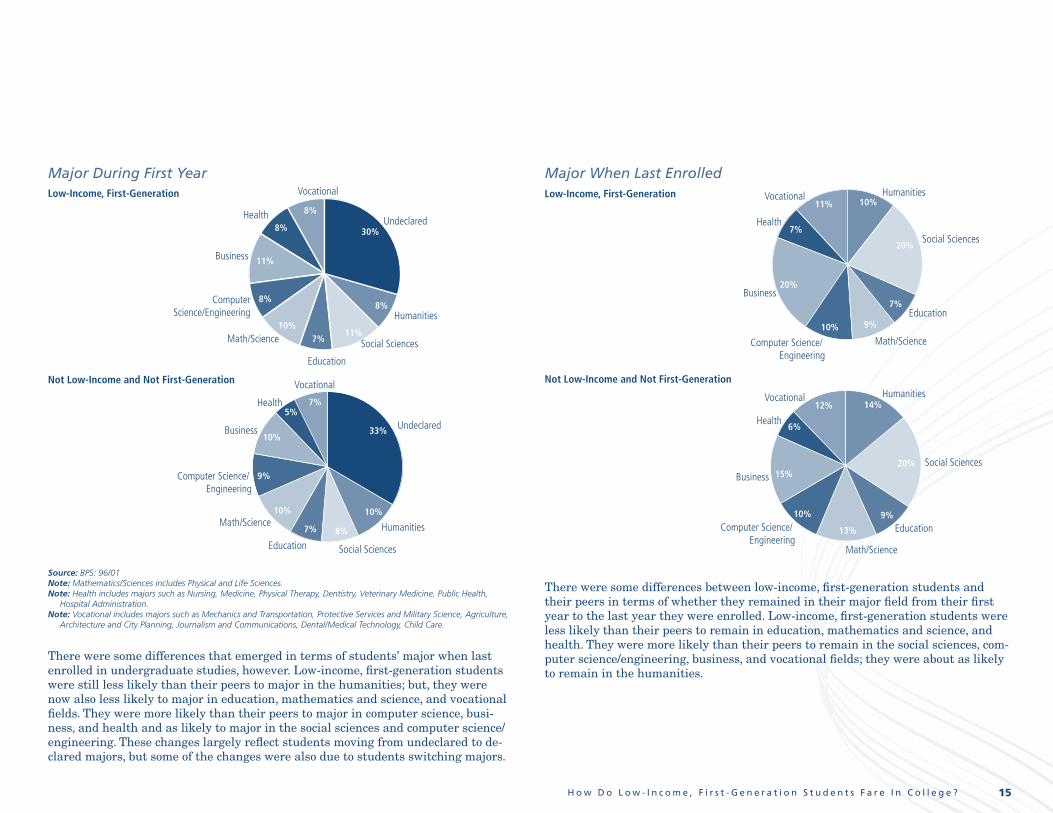
There were not considerable differences between low-income, first-generation stu-dents and their peers in terms of the majors they declared during their first year of study. Low-income, first-generation students attending four-year institutions were slightly less likely than their peers to be undeclared majors. They were also some-what less likely to major in the humanities. They were slightly more likely to major in the social sciences, business, health, as well as vocational, technical, and profes-sional fields (hereafter referred to as vocational). They were as likely as their peers to major in education, mathematics and science, and computer science/engineering.
8 In order to ensure clarity in the interpretation of the results in this section, we limited the analyses to students who began their studies in public and private not-for-profit four-year institutions and only attended that institution. For reference, 62 percent of students who began in four-year institutions remained at that institution, which was the same for both low-income, first-generation students and their peers.
9 In order to simplify the analysis in this section, we only compare low-income, first-generation students to students who are neither low-income nor first-generation.
15H o w D o L o w - I n c o m e , F i r s t - G e n e r a t i o n S t u d e n t s F a r e I n C o l l e g e ?
Major During First YearLow-Income, First-Generation Vocational
Health
Business
ComputerScience/Engineering
Math/Science
Education
Social Sciences
Humanities
Undeclared30%
8%
11%7%
10%
8%
11%
8%
8%
Not Low-Income and Not First-Generation Vocational
Health
Business
Computer Science/ Engineering
Math/Science
Education Social Sciences
Humanities
Undeclared33%
10%
8%7%
10%
9%
10%
5%7%
Source: BPS: 96/01Note: Mathematics/Sciences includes Physical and Life Sciences.Note: Health includes majors such as Nursing, Medicine, Physical Therapy, Dentistry, Veterinary Medicine, Public Health,
Hospital Administration.Note: Vocational includes majors such as Mechanics and Transportation, Protective Services and Military Science, Agriculture,
Architecture and City Planning, Journalism and Communications, Dental/Medical Technology, Child Care.
There were some differences that emerged in terms of students’ major when last enrolled in undergraduate studies, however. Low-income, first-generation students were still less likely than their peers to major in the humanities; but, they were now also less likely to major in education, mathematics and science, and vocational fields. They were more likely than their peers to major in computer science, busi-ness, and health and as likely to major in the social sciences and computer science/engineering. These changes largely reflect students moving from undeclared to de-clared majors, but some of the changes were also due to students switching majors.
Major When Last EnrolledLow-Income, First-Generation Vocational
Health
Business
Computer Science/ Engineering
Math/Science
Education
Social Sciences
Humanities
20%
7%
9%10%
20%
7%
11% 10%
Not Low-Income and Not First-Generation
Vocational
Health
Business
Computer Science/ Engineering
Math/Science
Education
Social Sciences
Humanities
20%
9%
13%
10%
15%
6%
12% 14%
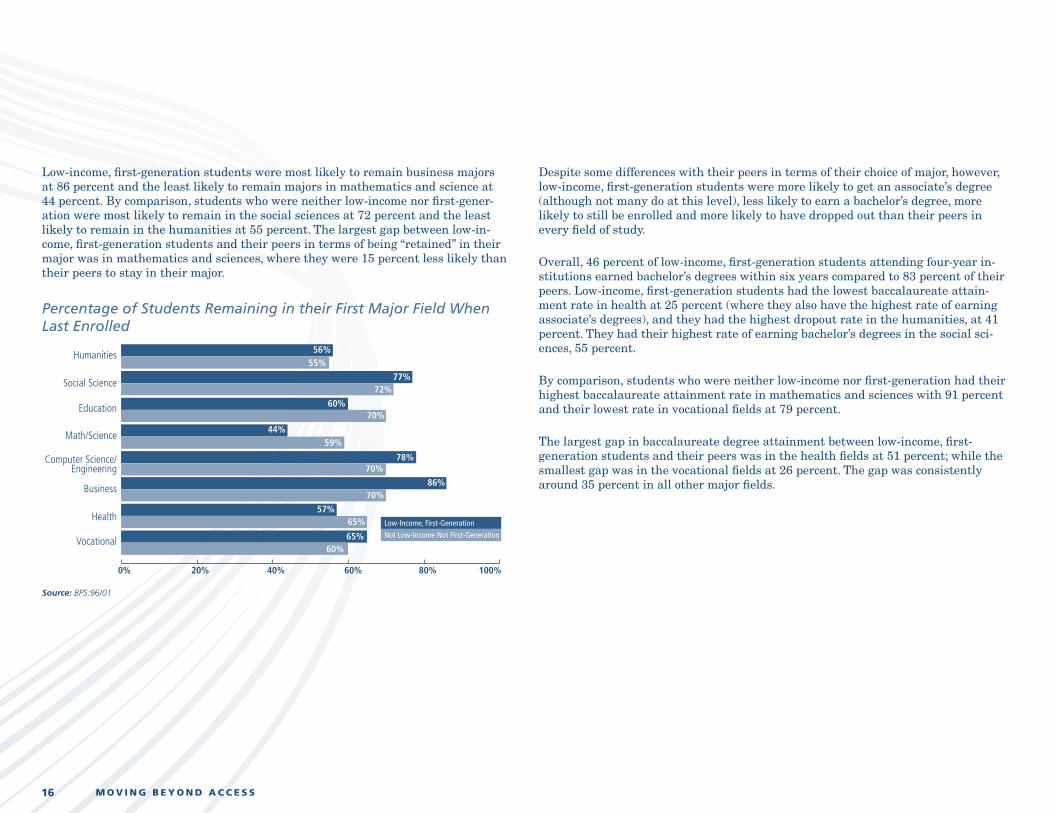
There were some differences between low-income, first-generation students and their peers in terms of whether they remained in their major field from their first year to the last year they were enrolled. Low-income, first-generation students were less likely than their peers to remain in education, mathematics and science, and health. They were more likely than their peers to remain in the social sciences, com-puter science/engineering, business, and vocational fields; they were about as likely to remain in the humanities.
16 M o v i n g B e y o n d A c c e s s
Low-income, first-generation students were most likely to remain business majors at 86 percent and the least likely to remain majors in mathematics and science at 44 percent. By comparison, students who were neither low-income nor first-gener-ation were most likely to remain in the social sciences at 72 percent and the least likely to remain in the humanities at 55 percent. The largest gap between low-in-come, first-generation students and their peers in terms of being “retained” in their major was in mathematics and sciences, where they were 15 percent less likely than their peers to stay in their major.
Percentage of Students Remaining in their First Major Field When Last Enrolled
Vocational
Health
Business
Computer Science/Engineering
Math/Science
Education
Social Science
Humanities 56%55%
77%
Low-Income, First-Generation
Not Low-Income Not First-Generation
72%
60%70%
44%59%
78%70%
86%70%
57%65%
65%60%
100%80%60%40%20%0%
Source: BPS:96/01
Despite some differences with their peers in terms of their choice of major, however, low-income, first-generation students were more likely to get an associate’s degree (although not many do at this level), less likely to earn a bachelor’s degree, more likely to still be enrolled and more likely to have dropped out than their peers in every field of study.
Overall, 46 percent of low-income, first-generation students attending four-year in-stitutions earned bachelor’s degrees within six years compared to 83 percent of their peers. Low-income, first-generation students had the lowest baccalaureate attain-ment rate in health at 25 percent (where they also have the highest rate of earning associate’s degrees), and they had the highest dropout rate in the humanities, at 41 percent. They had their highest rate of earning bachelor’s degrees in the social sci-ences, 55 percent.
By comparison, students who were neither low-income nor first-generation had their highest baccalaureate attainment rate in mathematics and sciences with 91 percent and their lowest rate in vocational fields at 79 percent.
The largest gap in baccalaureate degree attainment between low-income, first-generation students and their peers was in the health fields at 51 percent; while the smallest gap was in the vocational fields at 26 percent. The gap was consistently around 35 percent in all other major fields.
17H o w D o L o w - I n c o m e , F i r s t - G e n e r a t i o n S t u d e n t s F a r e I n C o l l e g e ?
Six Year Outcome by Major When Last EnrolledAttained
Certificate or AA Attained BAStill
Enrolled Not Enrolled
low-Income, FIrst-GenerAtIon
All Majors 6% 46% 12% 37%
Humanities 0% 52% 7% 41%
Social Sciences 2% 55% 14% 29%
Education 2% 49% 12% 37%
Mathematic/Sciences 0% 54% 18% 28%
Computer Science/Engineering 6% 41% 25% 29%
Business 9% 49% 9% 34%
Health 21% 25% 19% 36%
Vocational/Technical/Professional 13% 53% 2% 33%
not low-Income And not FIrst-GenerAtIon
All Majors 1% 83% 5% 11%
Humanities 0% 84% 4% 12%
Social Sciences 0% 87% 3% 11%
Education 0% 84% 4% 13%
Mathematics/Sciences 0% 91% 5% 4%
Computer Science/Engineering 1% 80% 9% 10%
Business 0% 84% 6% 11%
Health 2% 76% 12% 10%
Vocational/Technical/Professional 3% 79% 7% 12%
Source: BPS: 96/01
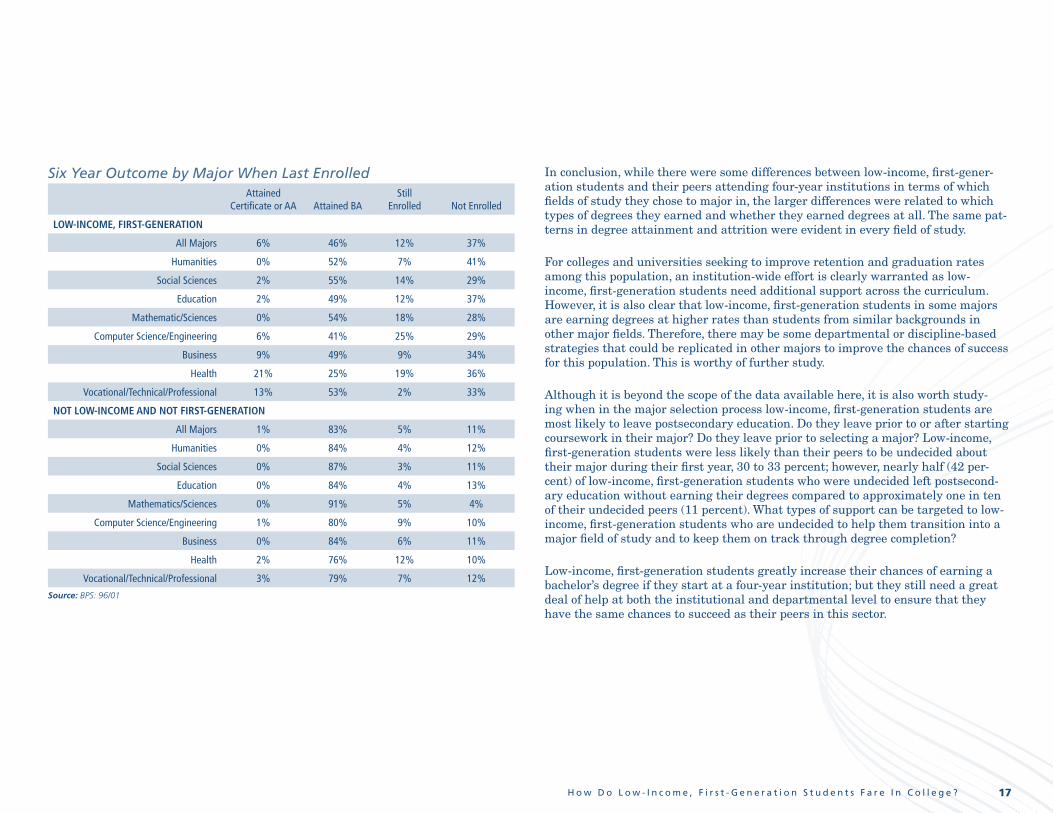
In conclusion, while there were some differences between low-income, first-gener-ation students and their peers attending four-year institutions in terms of which fields of study they chose to major in, the larger differences were related to which types of degrees they earned and whether they earned degrees at all. The same pat-terns in degree attainment and attrition were evident in every field of study.
For colleges and universities seeking to improve retention and graduation rates among this population, an institution-wide effort is clearly warranted as low-income, first-generation students need additional support across the curriculum. However, it is also clear that low-income, first-generation students in some majors are earning degrees at higher rates than students from similar backgrounds in other major fields. Therefore, there may be some departmental or discipline-based strategies that could be replicated in other majors to improve the chances of success for this population. This is worthy of further study.
Although it is beyond the scope of the data available here, it is also worth study-ing when in the major selection process low-income, first-generation students are most likely to leave postsecondary education. Do they leave prior to or after starting coursework in their major? Do they leave prior to selecting a major? Low-income, first-generation students were less likely than their peers to be undecided about their major during their first year, 30 to 33 percent; however, nearly half (42 per-cent) of low-income, first-generation students who were undecided left postsecond-ary education without earning their degrees compared to approximately one in ten of their undecided peers (11 percent). What types of support can be targeted to low-income, first-generation students who are undecided to help them transition into a major field of study and to keep them on track through degree completion?
Low-income, first-generation students greatly increase their chances of earning a bachelor’s degree if they start at a four-year institution; but they still need a great deal of help at both the institutional and departmental level to ensure that they have the same chances to succeed as their peers in this sector.
18 M o v i n g B e y o n d A c c e s s
Beyond the BaccaLaureate: acceSS to advanced degreeS
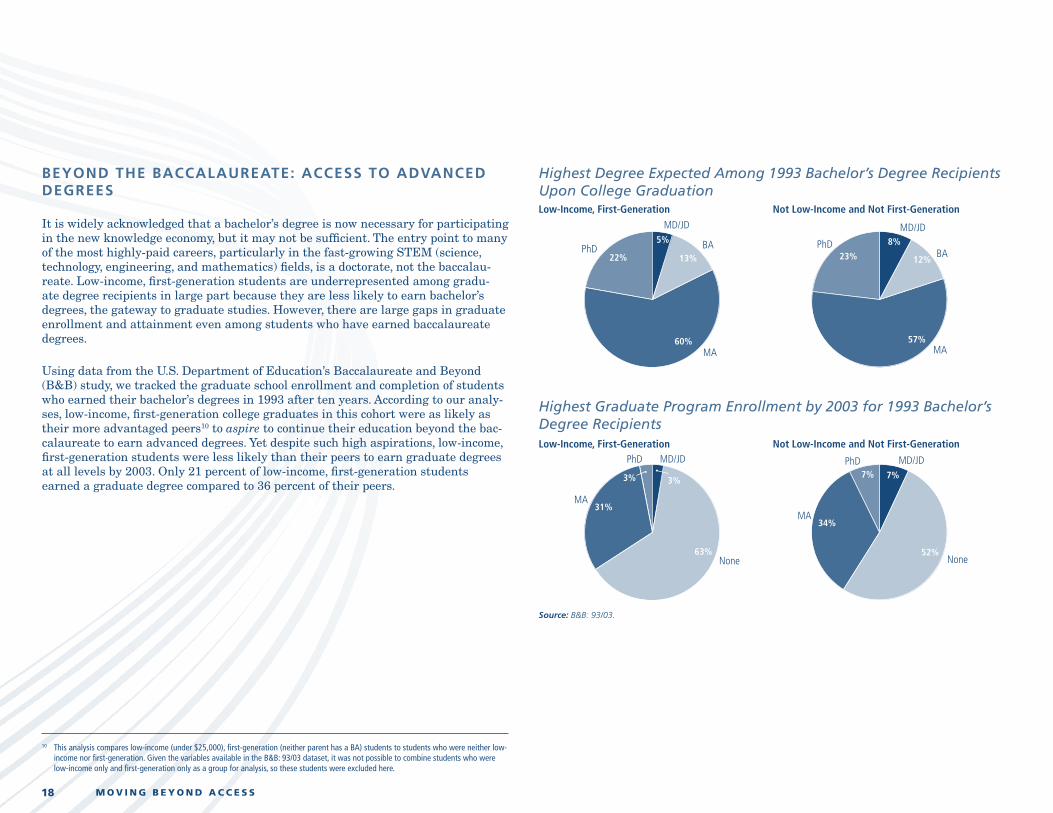
It is widely acknowledged that a bachelor’s degree is now necessary for participating in the new knowledge economy, but it may not be sufficient. The entry point to many of the most highly-paid careers, particularly in the fast-growing STEM (science, technology, engineering, and mathematics) fields, is a doctorate, not the baccalau-reate. Low-income, first-generation students are underrepresented among gradu-ate degree recipients in large part because they are less likely to earn bachelor’s degrees, the gateway to graduate studies. However, there are large gaps in graduate enrollment and attainment even among students who have earned baccalaureate degrees.
Using data from the U.S. Department of Education’s Baccalaureate and Beyond (B&B) study, we tracked the graduate school enrollment and completion of students who earned their bachelor’s degrees in 1993 after ten years. According to our analy-ses, low-income, first-generation college graduates in this cohort were as likely as their more advantaged peers10 to aspire to continue their education beyond the bac-calaureate to earn advanced degrees. Yet despite such high aspirations, low-income, first-generation students were less likely than their peers to earn graduate degrees at all levels by 2003. Only 21 percent of low-income, first-generation students earned a graduate degree compared to 36 percent of their peers.
10 This analysis compares low-income (under $25,000), first-generation (neither parent has a BA) students to students who were neither low-income nor first-generation. Given the variables available in the B&B: 93/03 dataset, it was not possible to combine students who were low-income only and first-generation only as a group for analysis, so these students were excluded here.
Highest Degree Expected Among 1993 Bachelor’s Degree Recipients Upon College GraduationLow-Income, First-Generation Not Low-Income and Not First-Generation
Low-Income, First-Generation Not Low-Income and Not First-Generation
Low-Income, First-Generation Not Low-Income and Not First-Generation
Low-Income, First-Generation Not Low-Income and Not First-Generation
PhD
MD/JD
BA
MA
PhD
MD/JD
BA
MA
PhD
MA
None
MD/JD PhD
MA
None
MD/JD
NotCompleted
Completed
NotCompleted
Completed
MA
PhD
BA
MD/JD
MA
PhD
BA
MD/JD
22%
60%
13%
5%
23%
8%
12%
57%
7%7%
34%
52%63%
31%
3% 3%
50% 50%
36%
64%
27%
3%
64%
6%
79%
18%2%1%
Highest Graduate Program Enrollment by 2003 for 1993 Bachelor’s Degree Recipients
Low-Income, First-Generation Not Low-Income and Not First-Generation
Low-Income, First-Generation Not Low-Income and Not First-Generation
Low-Income, First-Generation Not Low-Income and Not First-Generation
Low-Income, First-Generation Not Low-Income and Not First-Generation
PhD
MD/JD
BA
MA
PhD
MD/JD
BA
MA
PhD
MA
None
MD/JD PhD
MA
None
MD/JD
NotCompleted
Completed
NotCompleted
Completed
MA
PhD
BA
MD/JD
MA
PhD
BA
MD/JD
22%
60%
13%
5%
23%
8%
12%
57%
7%7%
34%
52%63%
31%
3% 3%
50% 50%
36%
64%
27%
3%
64%
6%
79%
18%2%1%
Source: B&B: 93/03.
19H o w D o L o w - I n c o m e , F i r s t - G e n e r a t i o n S t u d e n t s F a r e I n C o l l e g e ?
Degree Completion Rates by 2003 for Graduate School Enrollees
Low-Income, First-Generation Not Low-Income and Not First-Generation
Low-Income, First-Generation Not Low-Income and Not First-Generation
Low-Income, First-Generation Not Low-Income and Not First-Generation
Low-Income, First-Generation Not Low-Income and Not First-Generation
PhD
MD/JD
BA
MA
PhD
MD/JD
BA
MA
PhD
MA
None
MD/JD PhD
MA
None
MD/JD
NotCompleted
Completed
NotCompleted
Completed
MA
PhD
BA
MD/JD
MA
PhD
BA
MD/JD
22%
60%
13%
5%
23%
8%
12%
57%
7%7%
34%
52%63%
31%
3% 3%
50% 50%
36%
64%
27%
3%
64%
6%
79%
18%2%1%
Highest Degree Attained by 2003 for 1993 Bachelor’s Degree Recipients
Low-Income, First-Generation Not Low-Income and Not First-Generation
Low-Income, First-Generation Not Low-Income and Not First-Generation
Low-Income, First-Generation Not Low-Income and Not First-Generation
Low-Income, First-Generation Not Low-Income and Not First-Generation
PhD
MD/JD
BA
MA
PhD
MD/JD
BA
MA
PhD
MA
None
MD/JD PhD
MA
None
MD/JD
NotCompleted
Completed
NotCompleted
Completed
MA
PhD
BA
MD/JD
MA
PhD
BA
MD/JD
22%
60%
13%
5%
23%
8%
12%
57%
7%7%
34%
52%63%
31%
3% 3%
50% 50%
36%
64%
27%
3%
64%
6%
79%
18%2%1%
Source: B&B: 93/03.
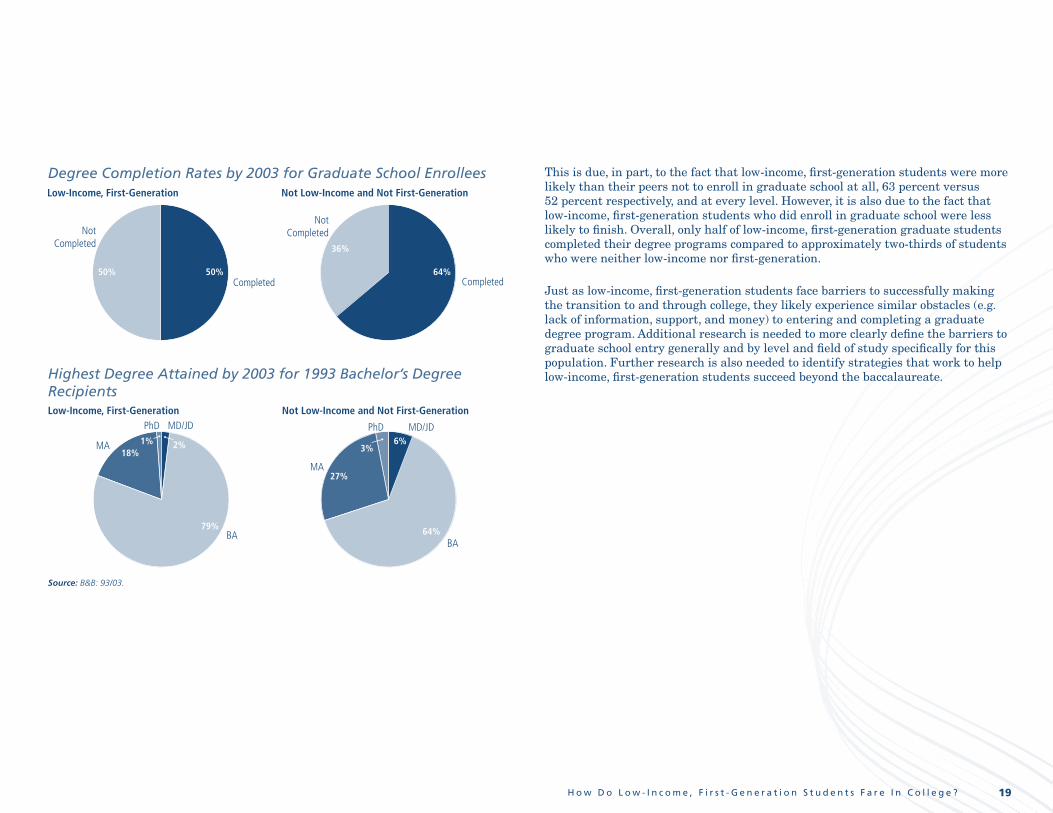
This is due, in part, to the fact that low-income, first-generation students were more likely than their peers not to enroll in graduate school at all, 63 percent versus 52 percent respectively, and at every level. However, it is also due to the fact that low-income, first-generation students who did enroll in graduate school were less likely to finish. Overall, only half of low-income, first-generation graduate students completed their degree programs compared to approximately two-thirds of students who were neither low-income nor first-generation.
Just as low-income, first-generation students face barriers to successfully making the transition to and through college, they likely experience similar obstacles (e.g. lack of information, support, and money) to entering and completing a graduate degree program. Additional research is needed to more clearly define the barriers to graduate school entry generally and by level and field of study specifically for this population. Further research is also needed to identify strategies that work to help low-income, first-generation students succeed beyond the baccalaureate.
20 M o v i n g B e y o n d A c c e s s
What accounts for the fact that low-income, first-generation students are less likely than their peers to complete college, particularly at the baccalaure-ate level? As our analysis shows, they face a number of challenges that
make it difficult for them to be successful in college. They disproportionately come from ethnic and racial minority backgrounds with lower rates of college participa-tion. They also tend to be older, less likely to receive financial support from parents, and more likely to have multiple obligations outside college, like family and work, that limit their full participation in the college experience. They take fewer classes each semester as they balance these multiple obligations, and frequently stop out as family circumstances—such as changes in jobs, finances, and health—dictate. As previously noted, these characteristics have been shown to be risk factors that negatively affect the chances of success in higher education for this population (see Chen, 2005; Choy, 2000; Nunez & Cuccaro-Alamin, 1998).
It’s not just who they are and how they attend college that makes a difference in whether or not low-income, first-generation students succeed, it’s where they go to college as well. According to the preceding analyses, low-income, first-generation students were more than seven times as likely to earn bachelor’s degrees if they started in four-year institutions, but less than 25 percent of them did so. Further-more, only about one in ten of students from this population who entered postsec-ondary education through public two-year and for-profit institutions transferred to four-year institutions within six years compared to half of their most advantaged peers. However, while attending a four-year college or university greatly increased the chances that a low-income, first-generation student earned a bachelor’s degree, it did not guarantee success. Students from this population attending public and private four-year institutions graduated within six years at approximately half the rate of their most advantaged peers.
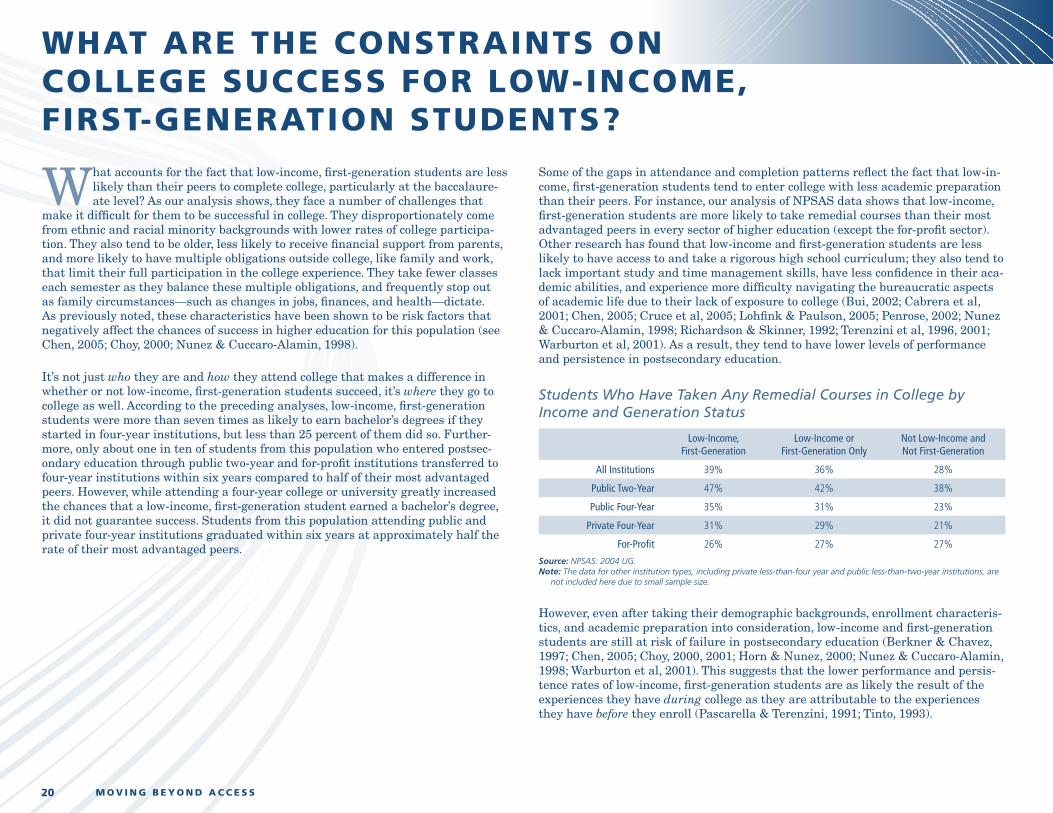
Some of the gaps in attendance and completion patterns reflect the fact that low-in-come, first-generation students tend to enter college with less academic preparation than their peers. For instance, our analysis of NPSAS data shows that low-income, first-generation students are more likely to take remedial courses than their most advantaged peers in every sector of higher education (except the for-profit sector). Other research has found that low-income and first-generation students are less likely to have access to and take a rigorous high school curriculum; they also tend to lack important study and time management skills, have less confidence in their aca-demic abilities, and experience more difficulty navigating the bureaucratic aspects of academic life due to their lack of exposure to college (Bui, 2002; Cabrera et al, 2001; Chen, 2005; Cruce et al, 2005; Lohfink & Paulson, 2005; Penrose, 2002; Nunez & Cuccaro-Alamin, 1998; Richardson & Skinner, 1992; Terenzini et al, 1996, 2001; Warburton et al, 2001). As a result, they tend to have lower levels of performance and persistence in postsecondary education.
Students Who Have Taken Any Remedial Courses in College by Income and Generation Status
Low-Income, First-Generation
Low-Income or First-Generation Only
Not Low-Income and Not First-Generation
All Institutions 39% 36% 28%
Public Two-Year 47% 42% 38%
Public Four-Year 35% 31% 23%
Private Four-Year 31% 29% 21%
For-Profit 26% 27% 27%
Source: NPSAS: 2004 UG.Note: The data for other institution types, including private less-than-four year and public less-than-two-year institutions, are
not included here due to small sample size.
However, even after taking their demographic backgrounds, enrollment characteris-tics, and academic preparation into consideration, low-income and first-generation students are still at risk of failure in postsecondary education (Berkner & Chavez, 1997; Chen, 2005; Choy, 2000, 2001; Horn & Nunez, 2000; Nunez & Cuccaro-Alamin, 1998; Warburton et al, 2001). This suggests that the lower performance and persis-tence rates of low-income, first-generation students are as likely the result of the experiences they have during college as they are attributable to the experiences they have before they enroll (Pascarella & Terenzini, 1991; Tinto, 1993).
WHAT ARe THe consTRAinTs on coLLege sUccess FoR LoW-incoMe, FiRsT-geneRATion sTUdenTs?
21W h a t A r e T h e C o n s t r a i n t s O n C o l l e g e S u c c e s s F o r L o w - I n c o m e , F i r s t - G e n e r a t i o n S t u d e n t s ?
Low-income and first-generation students are less likely to be engaged in the academic and social experiences that foster success in college (often referred to as academic and social integration), such as studying in groups, interacting with faculty and other students, participating in extracurricular activities, and using support services (Astin, 1997; Cabrera et al 1992; Billson & Terry, 1982; Lohfink & Paulsen, 2005; Nunez & Cuccaro-Alamin, 1998; Pascarella et al, 2003, 2004; Pike & Kuh, 2005; Richardson & Skinner, 1992; Terenzini et al, 1996, 2001). During the initial transition to college, first-generation students say they delay getting involved in extracurricular activities and campus life until they feel they have “their aca-demic lives under control” (Terenzini et al, 1994; pg. 64). This represents a real loss, however, because first-generation students actually derive more benefit from their involvement in such activities than their peers (Filkins & Doyle, 2002; Lohfink & Paulsen, 2005; Pascarella et al, 2003, 2004; Terenzini et al, 1996).
Lower levels of academic and social integration among this population are inex-tricably linked to finances and financial aid (Cabrera et al, 1992). Due largely to a lack of resources, low-income, first-generation students are more likely to live and work off-campus and to take classes part-time while working full-time, which limits the amount of time they spend on campus. Increases in financial aid, particularly grants, scholarships, and work-study, have been shown to increase the likelihood that first-generation students will persist in college (Lohfink & Paulsen, 2005; Somers et al, 2004). Somers and her colleagues (2004) found that loans can increase persistence for first-generation students; however, they also found that even low levels of accumulated debtload can significantly decrease persistence among this population. This suggests that first-generation students are highly debt averse and may choose to work rather than take out loans to pay for their education.
Research has shown that students who work up to 20 hours a week actually have higher persistence rates than students who don’t work and/or who work more than 20 hours a week (Pascarella & Terenzini, 2005), which we found was also the case for low-income, first-generation students. However, we also found that low-income, first-generation students are more likely to work more than 20 hours a week than students who are neither low-income nor first-generation, 63 to 42 percent respec-tively, thereby reducing their chances of persisting to degree. Pascarella and his colleagues found that working while attending college has a negative impact on the persistence of first-generation students because it reduces the number of courses they take, the amount of time they spend studying, and the amount of time they spend on campus interacting with peers and faculty (Pascarella et al, 2004). Reduc-ing the work burden through financial aid, including the prudent use of loans, has been found to enable students’ interaction with and integration on campus, which has the effect of improving academic performance (Dowd, 2004).
Six-Year Persistence Outcome by Number of Hours Worked per Week When Last Enrolled
Earned Certificate or Associate’s Degree
Earned Bachelor’s Degree Still Enrolled Not Enrolled
low-Income, FIrst-GenerAtIon
Did not work (20%)
35% 17% 27% 22%
Worked 1 to 20 hours (17%)
25% 46% 16% 13%
Worked more than 20 hours (63%)
31% 14% 25% 30%
not low-Income And not FIrst-GenerAtIon
Did not work (22%)
8% 73% 16% 4%
Worked 1 to 20 hours (36%)
5% 78% 12% 5%
Worked more than 20 hours (42%)
16% 41% 21% 23%
Source: BPS: 96/01
Low-income, first-generation students not only face barriers to their academic and social integration, they also confront obstacles with respect to cultural adaptation. This is due to differences between the culture (i.e. norms, values, expectations) of their families and communities and the culture that exists on college campuses. First-generation students often experience problems “that arise from [living] si-multaneously in two vastly different worlds while being fully accepted in neither” (Rendon, 1992; pg. 56). At home, first-generation students report that relationships with family and friends who did not go to college often become strained and difficult to maintain as they are perceived as changing and separating from them, which causes intense stress for these students (Lara, 1992; London, 1989, 1992; Olenchak & Hebert, 2002; Piorkowski, 1983; Rendon, 1992; Richardson & Skinner, 1992; Ro-driguez, 1982; Rosas & Hamrick, 2002; Terenzini et al, 1994, 1996).
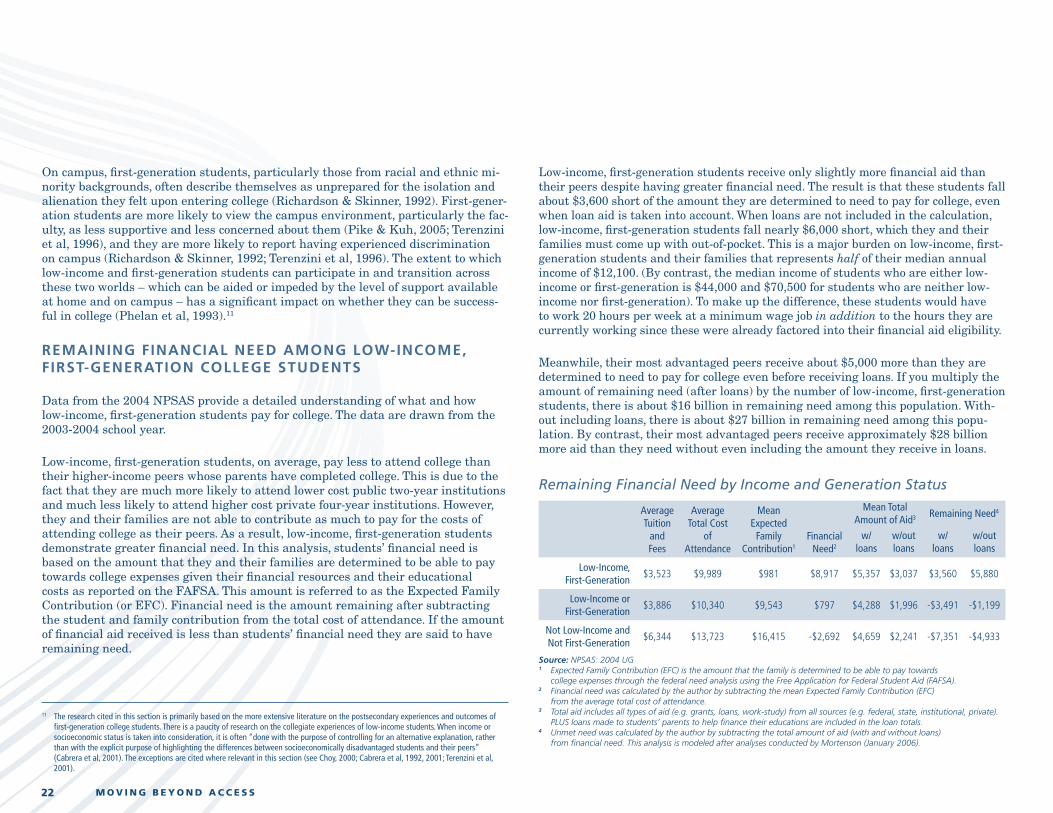
22 M o v i n g B e y o n d A c c e s s
On campus, first-generation students, particularly those from racial and ethnic mi-nority backgrounds, often describe themselves as unprepared for the isolation and alienation they felt upon entering college (Richardson & Skinner, 1992). First-gener-ation students are more likely to view the campus environment, particularly the fac-ulty, as less supportive and less concerned about them (Pike & Kuh, 2005; Terenzini et al, 1996), and they are more likely to report having experienced discrimination on campus (Richardson & Skinner, 1992; Terenzini et al, 1996). The extent to which low-income and first-generation students can participate in and transition across these two worlds – which can be aided or impeded by the level of support available at home and on campus – has a significant impact on whether they can be success-ful in college (Phelan et al, 1993).11
remaining FinanciaL need among LoW-income, FirSt-generation coLLege StudentS
Data from the 2004 NPSAS provide a detailed understanding of what and how low-income, first-generation students pay for college. The data are drawn from the 2003-2004 school year.
Low-income, first-generation students, on average, pay less to attend college than their higher-income peers whose parents have completed college. This is due to the fact that they are much more likely to attend lower cost public two-year institutions and much less likely to attend higher cost private four-year institutions. However, they and their families are not able to contribute as much to pay for the costs of attending college as their peers. As a result, low-income, first-generation students demonstrate greater financial need. In this analysis, students’ financial need is based on the amount that they and their families are determined to be able to pay towards college expenses given their financial resources and their educational costs as reported on the FAFSA. This amount is referred to as the Expected Family Contribution (or EFC). Financial need is the amount remaining after subtracting the student and family contribution from the total cost of attendance. If the amount of financial aid received is less than students’ financial need they are said to have remaining need.
11 The research cited in this section is primarily based on the more extensive literature on the postsecondary experiences and outcomes of first-generation college students. There is a paucity of research on the collegiate experiences of low-income students. When income or socioeconomic status is taken into consideration, it is often “done with the purpose of controlling for an alternative explanation, rather than with the explicit purpose of highlighting the differences between socioeconomically disadvantaged students and their peers” (Cabrera et al, 2001). The exceptions are cited where relevant in this section (see Choy, 2000; Cabrera et al, 1992, 2001; Terenzini et al, 2001).
Low-income, first-generation students receive only slightly more financial aid than their peers despite having greater financial need. The result is that these students fall about $3,600 short of the amount they are determined to need to pay for college, even when loan aid is taken into account. When loans are not included in the calculation, low-income, first-generation students fall nearly $6,000 short, which they and their families must come up with out-of-pocket. This is a major burden on low-income, first-generation students and their families that represents half of their median annual income of $12,100. (By contrast, the median income of students who are either low-income or first-generation is $44,000 and $70,500 for students who are neither low-income nor first-generation). To make up the difference, these students would have to work 20 hours per week at a minimum wage job in addition to the hours they are currently working since these were already factored into their financial aid eligibility.
Meanwhile, their most advantaged peers receive about $5,000 more than they are determined to need to pay for college even before receiving loans. If you multiply the amount of remaining need (after loans) by the number of low-income, first-generation students, there is about $16 billion in remaining need among this population. With-out including loans, there is about $27 billion in remaining need among this popu-lation. By contrast, their most advantaged peers receive approximately $28 billion more aid than they need without even including the amount they receive in loans.
Remaining Financial Need by Income and Generation Status
Average Tuition
and Fees
Average Total Cost
of Attendance
Mean Expected
Family Contribution1
Financial Need2
Mean Total Amount of Aid3 Remaining Need4
w/ loans
w/out loans
w/ loans
w/out loans
Low-Income, First-Generation
$3,523 $9,989 $981 $8,917 $5,357 $3,037 $3,560 $5,880
Low-Income or First-Generation
$3,886 $10,340 $9,543 $797 $4,288 $1,996 -$3,491 -$1,199
Not Low-Income and Not First-Generation
$6,344 $13,723 $16,415 -$2,692 $4,659 $2,241 -$7,351 -$4,933
Source: NPSAS: 2004 UG1 Expected Family Contribution (EFC) is the amount that the family is determined to be able to pay towards
college expenses through the federal need analysis using the Free Application for Federal Student Aid (FAFSA).2 Financial need was calculated by the author by subtracting the mean Expected Family Contribution (EFC)
from the average total cost of attendance.3 Total aid includes all types of aid (e.g. grants, loans, work-study) from all sources (e.g. federal, state, institutional, private).
PLUS loans made to students’ parents to help finance their educations are included in the loan totals.4 Unmet need was calculated by the author by subtracting the total amount of aid (with and without loans)
from financial need. This analysis is modeled after analyses conducted by Mortenson (January 2006).
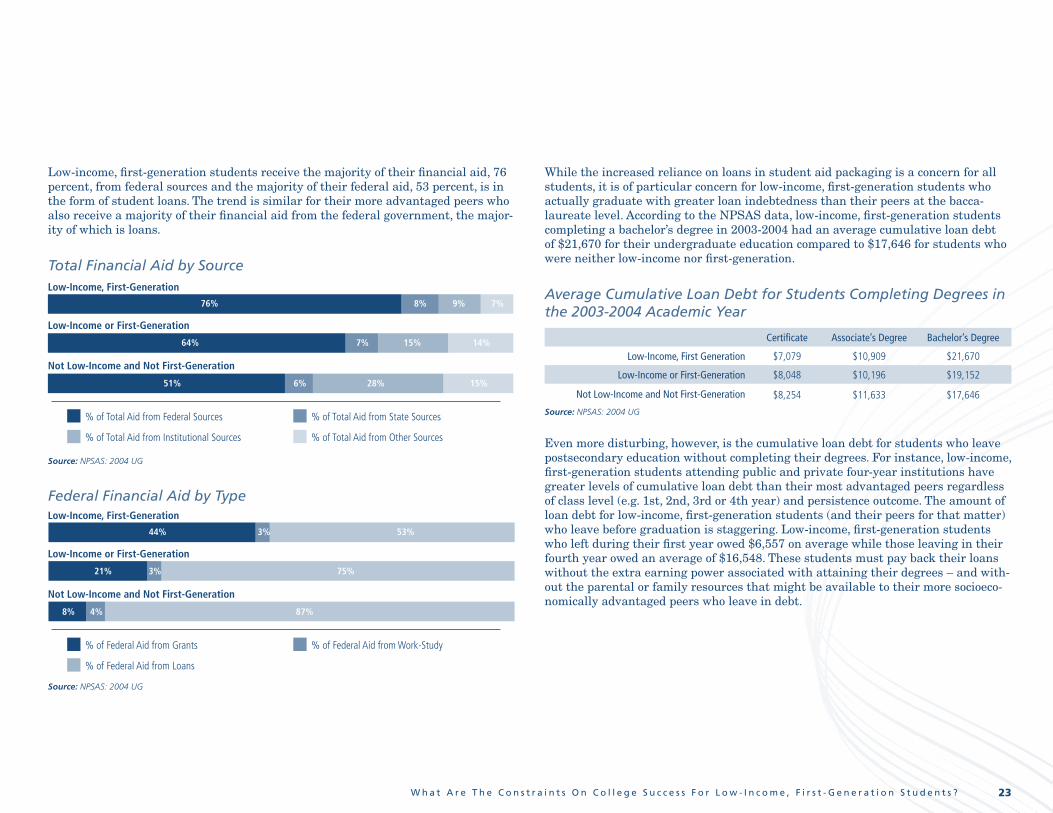
23W h a t A r e T h e C o n s t r a i n t s O n C o l l e g e S u c c e s s F o r L o w - I n c o m e , F i r s t - G e n e r a t i o n S t u d e n t s ?
Low-income, first-generation students receive the majority of their financial aid, 76 percent, from federal sources and the majority of their federal aid, 53 percent, is in the form of student loans. The trend is similar for their more advantaged peers who also receive a majority of their financial aid from the federal government, the major-ity of which is loans.
Total Financial Aid by Source
Not Low-Income and Not First-Generation
Low-Income or First-Generation
Low-Income, First-Generation
% of Total Aid from Federal Sources % of Total Aid from State Sources
% of Total Aid from Institutional Sources % of Total Aid from Other Sources
76% 8% 9% 7%
64% 7% 15% 14%
51% 6% 28% 15%
Not Low-Income and Not First-Generation
Low-Income or First-Generation
Low-Income, First-Generation
% of Grant Aid from Federal Sources % of Grant Aid from State Sources
% of Grant Aid from Institutional Sources % of Grant Aid from Other Sources
63% 15% 15% 7%
32% 15% 35% 18%
10% 12% 61% 17%
Not Low-Income and Not First-Generation
Low-Income or First-Generation
Low-Income, First-Generation
% of Federal Aid from Grants % of Federal Aid from Work-Study
% of Federal Aid from Loans
44% 3% 53%
21% 3% 75%
8% 4% 87%
Source: NPSAS: 2004 UG
Federal Financial Aid by Type
Not Low-Income and Not First-Generation
Low-Income or First-Generation
Low-Income, First-Generation
% of Total Aid from Federal Sources % of Total Aid from State Sources
% of Total Aid from Institutional Sources % of Total Aid from Other Sources
76% 8% 9% 7%
64% 7% 15% 14%
51% 6% 28% 15%
Not Low-Income and Not First-Generation
Low-Income or First-Generation
Low-Income, First-Generation
% of Grant Aid from Federal Sources % of Grant Aid from State Sources
% of Grant Aid from Institutional Sources % of Grant Aid from Other Sources
63% 15% 15% 7%
32% 15% 35% 18%
10% 12% 61% 17%
Not Low-Income and Not First-Generation
Low-Income or First-Generation
Low-Income, First-Generation
% of Federal Aid from Grants % of Federal Aid from Work-Study
% of Federal Aid from Loans
44% 3% 53%
21% 3% 75%
8% 4% 87%
Source: NPSAS: 2004 UG
While the increased reliance on loans in student aid packaging is a concern for all students, it is of particular concern for low-income, first-generation students who actually graduate with greater loan indebtedness than their peers at the bacca-laureate level. According to the NPSAS data, low-income, first-generation students completing a bachelor’s degree in 2003-2004 had an average cumulative loan debt of $21,670 for their undergraduate education compared to $17,646 for students who were neither low-income nor first-generation.
Average Cumulative Loan Debt for Students Completing Degrees in the 2003-2004 Academic Year
Certificate Associate’s Degree Bachelor’s Degree
Low-Income, First Generation $7,079 $10,909 $21,670
Low-Income or First-Generation $8,048 $10,196 $19,152
Not Low-Income and Not First-Generation $8,254 $11,633 $17,646
Source: NPSAS: 2004 UG
Even more disturbing, however, is the cumulative loan debt for students who leave postsecondary education without completing their degrees. For instance, low-income, first-generation students attending public and private four-year institutions have greater levels of cumulative loan debt than their most advantaged peers regardless of class level (e.g. 1st, 2nd, 3rd or 4th year) and persistence outcome. The amount of loan debt for low-income, first-generation students (and their peers for that matter) who leave before graduation is staggering. Low-income, first-generation students who left during their first year owed $6,557 on average while those leaving in their fourth year owed an average of $16,548. These students must pay back their loans without the extra earning power associated with attaining their degrees – and with-out the parental or family resources that might be available to their more socioeco-nomically advantaged peers who leave in debt.
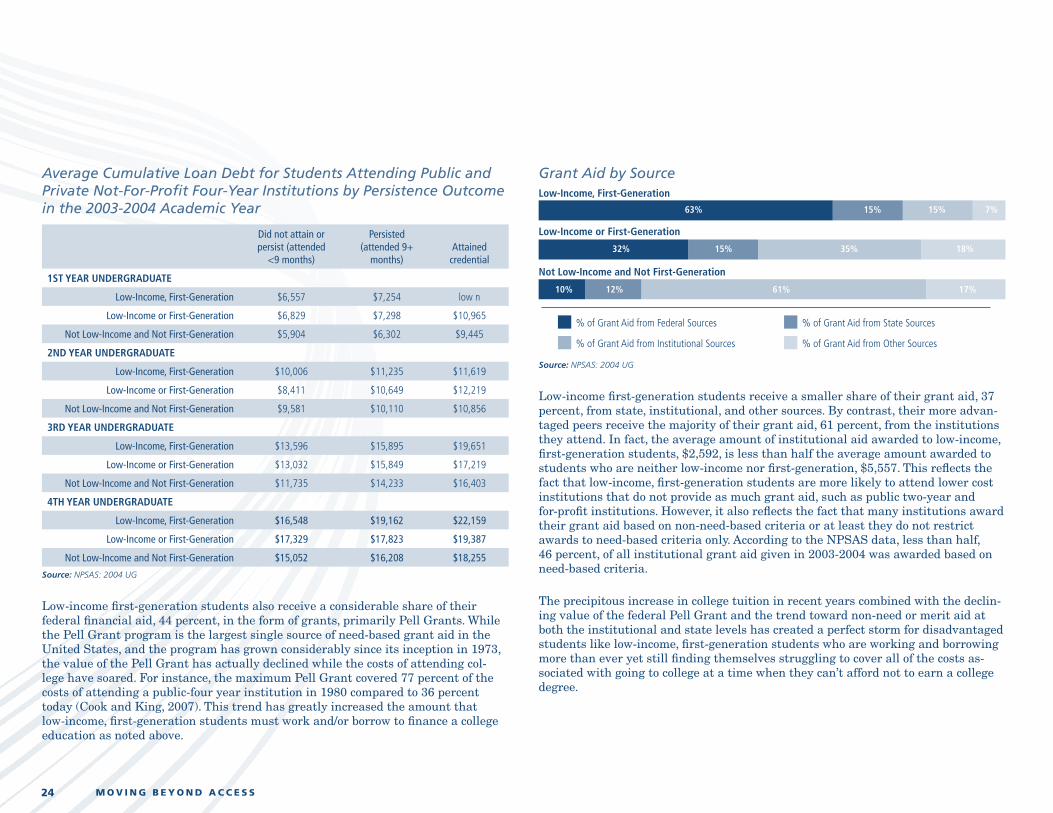
24 M o v i n g B e y o n d A c c e s s
Average Cumulative Loan Debt for Students Attending Public and Private Not-For-Profit Four-Year Institutions by Persistence Outcome in the 2003-2004 Academic Year
Did not attain or persist (attended
<9 months)
Persisted (attended 9+
months)Attained
credential
1st YeAr underGrAduAte
Low-Income, First-Generation $6,557 $7,254 low n
Low-Income or First-Generation $6,829 $7,298 $10,965
Not Low-Income and Not First-Generation $5,904 $6,302 $9,445
2nd YeAr underGrAduAte
Low-Income, First-Generation $10,006 $11,235 $11,619
Low-Income or First-Generation $8,411 $10,649 $12,219
Not Low-Income and Not First-Generation $9,581 $10,110 $10,856
3rd YeAr underGrAduAte
Low-Income, First-Generation $13,596 $15,895 $19,651
Low-Income or First-Generation $13,032 $15,849 $17,219
Not Low-Income and Not First-Generation $11,735 $14,233 $16,403
4th YeAr underGrAduAte
Low-Income, First-Generation $16,548 $19,162 $22,159
Low-Income or First-Generation $17,329 $17,823 $19,387
Not Low-Income and Not First-Generation $15,052 $16,208 $18,255
Source: NPSAS: 2004 UG
Low-income first-generation students also receive a considerable share of their federal financial aid, 44 percent, in the form of grants, primarily Pell Grants. While the Pell Grant program is the largest single source of need-based grant aid in the United States, and the program has grown considerably since its inception in 1973, the value of the Pell Grant has actually declined while the costs of attending col-lege have soared. For instance, the maximum Pell Grant covered 77 percent of the costs of attending a public-four year institution in 1980 compared to 36 percent today (Cook and King, 2007). This trend has greatly increased the amount that low-income, first-generation students must work and/or borrow to finance a college education as noted above.
Grant Aid by Source
Not Low-Income and Not First-Generation
Low-Income or First-Generation
Low-Income, First-Generation
% of Total Aid from Federal Sources % of Total Aid from State Sources
% of Total Aid from Institutional Sources % of Total Aid from Other Sources
76% 8% 9% 7%
64% 7% 15% 14%
51% 6% 28% 15%
Not Low-Income and Not First-Generation
Low-Income or First-Generation
Low-Income, First-Generation
% of Grant Aid from Federal Sources % of Grant Aid from State Sources
% of Grant Aid from Institutional Sources % of Grant Aid from Other Sources
63% 15% 15% 7%
32% 15% 35% 18%
10% 12% 61% 17%
Not Low-Income and Not First-Generation
Low-Income or First-Generation
Low-Income, First-Generation
% of Federal Aid from Grants % of Federal Aid from Work-Study
% of Federal Aid from Loans
44% 3% 53%
21% 3% 75%
8% 4% 87%
Source: NPSAS: 2004 UG
Low-income first-generation students receive a smaller share of their grant aid, 37 percent, from state, institutional, and other sources. By contrast, their more advan-taged peers receive the majority of their grant aid, 61 percent, from the institutions they attend. In fact, the average amount of institutional aid awarded to low-income, first-generation students, $2,592, is less than half the average amount awarded to students who are neither low-income nor first-generation, $5,557. This reflects the fact that low-income, first-generation students are more likely to attend lower cost institutions that do not provide as much grant aid, such as public two-year and for-profit institutions. However, it also reflects the fact that many institutions award their grant aid based on non-need-based criteria or at least they do not restrict awards to need-based criteria only. According to the NPSAS data, less than half, 46 percent, of all institutional grant aid given in 2003-2004 was awarded based on need-based criteria.
The precipitous increase in college tuition in recent years combined with the declin-ing value of the federal Pell Grant and the trend toward non-need or merit aid at both the institutional and state levels has created a perfect storm for disadvantaged students like low-income, first-generation students who are working and borrowing more than ever yet still finding themselves struggling to cover all of the costs as-sociated with going to college at a time when they can’t afford not to earn a college degree.
25H o w C o l l e g e s C a n P r o m o t e S u c c e s s F o r L o w - I n c o m e , F i r s t - G e n e r a t i o n S t u d e n t s
HoW coLLeges cAn PRoMoTe sUccess FoR LoW-incoMe,
FiRsT-geneRATion sTUdenTs
Given the challenges that low-income, first-generation students face, what can be done to increase their chances for success? While low-income, first-gen-eration students confront a number of obstacles to graduating from college,
there is ample evidence that there are actions that postsecondary institutions can take to improve the chances of success for this population, not to mention the rest of the student body.
FocuSing on the FirSt year
“Being a first-generation student confers its greatest liability in [the] initial adjust-ment to, and survival in, postsecondary education” (Pascarella et al, 2003; pg. 429). Analysis for this report showed that 60 percent of low-income, first-generation students who leave postsecondary education without attaining a degree do so after the first year. Implementing strategies such as bridge courses and programs dur-ing the summer between high school and college, orientation sessions and courses before and during the freshman year, and first-year learning communities have all been shown to ease the transition to college by helping students get integrated into the social and academic communities of the institutions and acquire the skills and knowledge needed to become successful learners in those communities (Lotkowski et al, 2004; Pascarella & Terenzini, 2005; Smith et al, 2004; Tinto, 2003; Upcraft et al, 2004). Given the tendency of first-generation students to delay getting involved on campus during the initial transition to college (Terenzini et al, 1994), institutions must make a concerted effort to reach out to these tentative students as early and often as possible during the first year or risk losing them. Retention programs and services are most likely to reach low-income and first-generation students when they are offered to and/or mandatory for all students. However, it is important to recognize and remove the barriers that may limit these students’ participation (e.g. cost) before making such programs mandatory (Pell Institute, 2007).
monitoring Student ProgreSS
Many low-income, first-generation students attend college part-time; as a result, their success is not measured so much by quarters or semesters as one course at a time. Institutions can help keep students on track in their coursework by developing early warning and/or advising systems to monitor student progress and to intervene when necessary. Such systems provide information to faculty, staff, and students in time to take action and improve performance before it’s too late and a student fails or faces academic discipline. Actions triggered by monitoring systems may include performance contracts that commit students to receiving advising, counseling, and tutoring and/or enrolling in study skills workshops/courses (Pell Institute, 2007). In order for such systems to work, there needs to be a high degree of collaboration and information-sharing between faculty in the classroom, staff in academic and social support programs, and the students themselves (AASCU, 2005; Kuh et al, 2005; Pell Institute, 2007). While these programs can help all students succeed in college, they have been found to be particularly effective with at-risk populations like low-income, first-generation students (Abrams et al, 1990; Karp & Logue, 2002-2003; Mann et al, 2003-2004; Volp et al, 1998; Willet, 2002).
Providing additionaL SuPPort For StudentS
Given that low-income, first-generation students tend to enter college less prepared than other students, institutions must provide a wide range of academic support programs – from developmental coursework to learning and tutorial centers to supplemental instruction to learning communities – in order to ensure their suc-cess. Supplemental instruction programs provide peer-assisted academic support to students in introductory “gatekeeping” courses with traditionally high failure rates, while learning communities enroll a cohort of students in two or more classes together to connect learning across courses as well as to establish faculty and peer relationships that support success (Lotkowski et al, 2004; Pascarella & Terenzini, 2005; Upcraft et al, 2004). Developmental education learning communities, which link basic skills courses like writing with content courses such as history, have been shown to be particularly effective with at-risk students (Engstrom & Tinto, 2008). A key feature of effective academic support programs is careful alignment with student learning needs in the classroom. The closer the alignment, the more likely students will be able to translate the support into successful classroom performance.
26 M o v i n g B e y o n d A c c e s s
Considering the personal hurdles that low-income, first-generation students must overcome to succeed in college, they also need and benefit from social support ser-vices, including academic advising, personal and career counseling, and mentoring programs. In particular, they benefit from participation in special programs that target at-risk populations, such as low-income, minority, and first-generation stu-dents. Such programs “scale down” the college experience by providing personalized attention, services, and referrals from dedicated staff who serve as “first responders” to students’ needs. They also provide a “home base” on campus where students can connect with and learn from peers who share common backgrounds and experiences about how to navigate the institution and college life (Muraskin, 1997; Pell Insti-tute, 2007; Richardson & Skinner, 1992). By offering an entry to and a road map through the institution, these programs help low-income, first-generation students become integrated into the campus community, a key factor in college success (Tinto, 1993).
increaSing Student engagement
While support services can greatly improve student performance and persistence, we must remember that success in the classroom is the cornerstone around which success in college is built. This is particularly true for low-income, first-generation college students – many of whom live and work off-campus – since the time they spend in the classroom may be the only time they spend on campus engaging with faculty and their peers. It is well-established that student academic and social engagement is central to student success (Astin, 1997; Kuh et al, 2005; Pascarella & Terenzini, 2005; Tinto, 2003). To the extent that faculty can structure classroom activities in ways that require students to become more involved in the learning process and with their peers, such as using cooperative and problem-based learning, they can improve student engagement and success (Braxton et al, 2000). It follows, however, that institutions must provide professional development for faculty and staff to not only help them acquire a broader range of pedagogical skills, but also learn how to effectively use those skills with at-risk populations, including low-income, first-generation students.
creating a cuLture oF SucceSS
The actions described above are necessary but not sufficient to improve student re-tention. In fact, “the ability of an institution to retain students lies less in the formal programs they devise than in the underlying commitment toward students which directs their activities” (Tinto, 2003; pg. 7). Creating an institutional culture that fosters student success requires strong leadership from top college administrators. Campus leaders must prioritize improving retention as an institutional goal and consistently demonstrate their commitment to it through their words and actions. This means allocating the necessary resources to retention programs even when scarce and providing incentives and rewards to all members of the campus commu-nity to participate in as well as take responsibility for improving retention. Leaders must also strive to organize their retention efforts into an intentional, structured, and proactive campus-wide program that requires coordination and collaboration among all units focused on the shared goal of improving student success (AASCU, 2005; Kuh et al, 2005; Pell Institute, 2007). Otherwise, the sum of their actions to improve retention will be less than their parts.
n n n
Finally, as Thayer (2000) notes, institutions should keep in mind that retention “strategies that are designed for general campus populations without taking into account the special circumstances and characteristics of first-generation and low-income students will not often be successful for the latter.” However, as he contin-ues, “strategies that work for first-generation and low-income students are likely to be successful for the general student population as well.” The academic, social, and financial resources (or lack thereof) that low-income students have available to them affects the extent to which they can utilize retention programs and services available on campus. Institutions must reduce the barriers to their participation in such programs – including lack of information, inability to pay, and/or inconvenient hours that conflict with work schedules – by offering flexible services that take low-income, first-generation students’ special needs into consideration (Pell Institute, 2007).
27H o w C o l l e g e s C a n P r o m o t e S u c c e s s F o r L o w - I n c o m e , F i r s t - G e n e r a t i o n S t u d e n t s
The federally-funded Student Support Services program, one of the Federal TRIO programs, provides services aimed at improving college persistence and graduation rates among low-income, first-generation, and disabled college students at two- and four-year institutions. Such services may include instruction in basic skills; tutoring; academic advising; financial aid, transfer, and career counseling; mentoring; and grant aid. There are currently about 950 SSS programs serving more than 200,000 students at colleges and universities nationwide.
Research has shown that students participating in SSS programs have higher persistence and degree completion rates than similarly disadvantaged peers. Furthermore, the more contact and/or the longer students participate in the program, the more they benefit from it (Cheney et al, 1997; U.S. Department of Education, 2005).
Findings from the “Best Practices” in Student Support Services study (Muraskin, 1997) provide evidence of effective strategies for promoting retention among this population. The study found that SSS programs with strong records of success shared the following five characteristics:
a structured freshman year experience. The programs often serve as the main point of entry for participants and as a “home base” to help students adjust to and integrate into the institution. The programs strongly structure students’ initial educational experiences by playing a major role in course selection and instruction during the first year.
an emphasis on academic support. Most services are focused on giving students the skills and confidence they need to achieve academic success. Programs offer developmental instruction in basic subject areas and study skills through courses, workshops, and com-puter-assisted instructional labs as well as supplemental instruction to provide additional support in introductory courses. Services that emphasize group and interactive approaches to learning such as peer tutoring and study groups are particularly effective at improving student outcomes.
an active and intrusive approach to advising. These programs see their students more often than other programs. They take an active and intrusive approach to advising that includes meeting with students several times per semester, continually tracking student performance and use of services, and checking student progress at mid-term to intervene and make referrals as necessary. Programs also focus on the “whole student” in the advis-ing process using a case management approach.
a plan to promote participation. These programs place requirements on students to ensure they make use of and benefit from available services. Students may be required to demonstrate their commitment to the program through an admissions screening process and/or to sign a contract in which they agree to meet certain requirements to remain in the program. Such programs also provide incentives and rewards for participation as well as try to remove any barriers by offering flexible scheduling of services.
a strong presence on campus. The directors of these programs have often been with their institutions for many years, are well-known and well-respected on campus, and serve in positions (e.g. as administrators or on taskforces) that allow them to exercise influence on institutional policies and practices affecting disadvantaged students. Given their extend-ed tenures, these directors are also able to better link their programs and their students to the institutions and their services. The most successful programs are part of larger service entities such as educational opportunity programs or learning centers rather than stand-alone programs.
BesT PRAcTices FoR ReTAining LoW-incoMe, FiRsT-geneRATion sTUdenTs:Evidence from the Student Support Services Program
28 M o v i n g B e y o n d A c c e s s
concLUsions And RecoMMendATions
For too many low-income, first-generation students, the newly-opened door to American higher education has been a revolving one. The unavoidable fact is that while college access has increased for this population, the opportu-
nity to successfully earn a college degree, especially the bachelor’s degree, has not. The major barrier to the baccalaureate for low-income, first-generation students is that vast majority of them begin - and end - their studies in two-year and for-profit institutions. Unfortunately, the segregation of low-income and other educationally-disadvantaged students into the less-than-four-year sector has only gotten worse over time. For example, the percentage of Pell Grant recipients enrolled in four-year colleges and universities dropped from 62 percent in 1973-74 to 45 percent in 2001-02, where it remains today (U.S. Department of Education, 2007). In other words, nearly one-third of the thirty-year decline in enrollment in four-year institutions among Pell Grant recipients has occurred in just a recent three-year period (Morten-son, 2003).
What can be done to increase the number of low-income, first-generation students who enroll in and graduate from four-year colleges and universities with bachelor’s degrees? We offer the following recommendations to practitioners and policymakers alike:
Improve academic preparation for college: Taking a rigorous high school curriculum, including advanced mathematics, greatly increases the chances that low-income and first-generation students will attend college, particularly four-year institutions (Choy, 2001; Horn & Nunez, 2000). However, to usher low-income, first-generation students into advanced coursework without adequate support is to set these students up for early failure. To that end, students and their parents need:
More information and counseling about gateway courses well before high school •especially since the math track to college starts with eighth grade algebra.
Additional academic and study skill support to successfully complete challenging high •school coursework, including integrating note-taking, higher-order thinking, time management and other academic self-advocacy skills into the core curriculum, given likely gaps in their elementary and middle school preparation.
Greater access to college-preparatory courses, which are either not offered at the •high schools they attend or are offered in watered-down formats that do not do much to prepare them to succeed in college, especially at four-year institutions.
Teachers who are equipped with the training and skills they need to develop •challenging course material and to teach rigorous college-preparatory courses, including Advanced Placement.
Counselors who have more comprehensive knowledge about the college access •process and the support and time they need to work with students on their pathway to college.
The key to achieving these recommendations is for principals, teachers, counselors, and directors of college access programs alike to work together to purposefully cre-ate a college-going culture in the school’s overall environment.
Provide additional financial aid for college: Targeting more financial aid toward this population could greatly expand their options with respect to where and how they go to college. With adequate resources, more low-income, first-generation students could afford to enroll in four-year institutions or attend full-time, both of which would increase their chances of completing college with four-year degrees. Unfortunately, funding for the Federal Pell Grant and Work-Study programs has not kept pace while tuition and fees have increased dramatically in recent years. To reduce the impact of financial barriers, low-income, first-generation students need:
Workshops designed specifically for students - and their parents and guardians -about •the financial aid process, especially filling out the FAFSA.
Additional information to improve their financial literacy about their options for •paying the costs of attendance at four-year institutions, including the prudent use of loans. This includes how to budget and use the banking system, the pros and cons of credit card use, and other forms of financial literacy to help students better acquire and utilize their financial aid.
Increases in grant aid from institutional, state, and federal sources, which will require •a shift away from merit aid at the institutional and state levels.
Greater assistance with covering “remaining” or unmet financial need, such as •through the use of expanded work-study programs.
Increase transfer rates to four-year colleges: Given the economic and other realities that force most low-income, first-generation students to begin their studies in the two-year sector, there needs to be a greater emphasis on increasing transfer rates from two- to four-year colleges. More than 60 percent of low-income, first-gen-eration students who attend public, two-year institutions aspire to earn bachelor’s degrees, yet only 5 percent of them do. To better facilitate their transfer from two-year to four-year institutions, low-income, first-generation students need:
A clear vision of the long-term pathway from high school to a two-year college and •then to a four-year college with guidance from high school teachers and counselors during the college planning and choice process.
Effective developmental courses, particularly in mathematics, to address shortcomings •in their academic preparation.
Strong transfer counseling and planning from academic advisors as well as favorable •articulation policies.
Adequate financial counseling and aid (e.g. transfer scholarships) as well as other aca-•demic and social support to ensure successful degree completion after the transition.
29C o n c l u s i o n s A n d R e c o m m e n d a t i o n s
Ease the transition to college: Low-income, first-generation students need con-siderable support as they make the transition to college. They need validation that not only are they capable of succeeding in college, but that they belong on campus as well (Rendon, 1992; Terenzini et al, 1994). Strategies that have been shown to help low-income and first-generation students include:
Beginning as early as elementary and middle school, exposing students to college tours •and college and career assessment tools to inspire their interest and knowledge about the college environment.
Early intervention through bridge and orientation programs that socializes students to •the expectations of the academic environment; involving parents also helps them to understand the demands of academic life.
Advising, tutoring, and mentoring by faculty and peers that maintain needed support •throughout the college years.
Participation in special programs for at-risk populations that “scale down” the college •experience for low-income, first-generation students by providing them with person-alized attention from staff and a place to connect with supportive peers who share common backgrounds and experiences.
Encourage engagement on the college campus: Colleges and universities must remove the barriers (primarily financial) that prevent low-income, first-generation students from fully participating and engaging in the experiences that are associ-ated with success in college such as living on campus, involvement in extracurricu-lar activities, interaction with faculty outside of class, and use of available support services. To that end, institutions can:
Offer additional opportunities for work-study to increase the amount of time these •students spend on campus while meeting their financial needs.
Focus on increasing interaction and engagement in the classroom in order to make use •of the only time many low-income, first-generation students spend on campus.
Develop cohorts of study groups that foster campus community and provide an aca-•demic and social support system for low-income, first generation students.
Promote (re)entry for young and working adults: According to a recent report by the Council for Adult and Experiential Learning (2008), most states cannot meet the global competitiveness needs of the country by targeting traditional-age stu-dents alone. There must be an effort to help young and working adults get back on the college track, many of whom will likely come from low-income and first-genera-tion backgrounds. Strategies for reengaging these populations include:
Providing support through programs that help adults complete their General Equiva-•lency Diploma, like the Federal TRIO Educational Opportunity Centers.
Offering college credit for experiential learning in the workplace to expedite degree •completion.
Developing programs to reach out to and serve students who leave college with a •limited number of credits remaining to graduation like the program offered by the Oklahoma State Regents for Higher Education.
Expanding financial aid eligibility for part-time students and/or providing additional •resources (e.g. childcare) to promote persistence.
n n n
As the United States continues to realize the importance of increasing the educa-tional attainment of its citizens as the key to its future economic stability in the global marketplace, improving postsecondary access and success among underrepre-sented populations, such as low-income, first-generation students, is paramount. As the analysis in this report has shown, there is much work to be done if this growing population is to participate and achieve within higher education similar to their more advantaged peers. Without action by policymakers and practitioners at all levels, it appears that not only will these students be left behind, but so too will the United States.
30 M o v i n g B e y o n d A c c e s s
ReFeRences
Abrams, B., Krotseng, M., & Hossler, D. (1990). Using retention research in enrollment management. In D. Hossler & J.P. Bean (Eds.), The Strategic Management of College Enrollments (p.p. 202-224). San Francisco: Jossey-Bass.
American Association of State Colleges and Universities (AASCU) (2005). Student Success in State Colleges and Universities: A Matter of Culture and Leadership. Washington, DC: Author.
Astin, A.W. (1997). What Matters in College: Four Critical Years Revisited. San Francisco: Jossey-Bass.
Berkner, L., and Chavez, L. (1997). Access to Postsecondary Education for 1992 High School Graduates. Washington, DC: National Center for Education Statistics.
Berkner, L., Cuccaro-Alamin, S., and McCormick, A. (1996). Descriptive Summary of 1989–90 Beginning Postsecondary Students: Five Years Later. Washington, DC: National Center for Education Statistics.
Berkner, L., He, S., & Cataldi, E.F. (2003). Descriptive Summary of 1995-96 Beginning Postsecondary Students: Six Years Later. Washington, DC: National Center for Education Statistics.
Billson, J.M., & Terry, M.B. (Fall 1982). In search of the silken purse: Factors in attrition among first-generation students. College and University, 57-75.
Bui, K.V.T. (2002). First-generation college students at a four-year university: Background characteristics, reasons for pursuing higher education, and first-year experiences. College Student Journal.
Braxton, J. M., Milem, J. F., & Sullivan, A. S. (2000). The influence of active learning on the college student departure process: Toward a revision of Tinto’s theory. Journal of Higher Education, 71, 569-590.
Bureau of Labor Statistics. (2005). Occupational Employment Projections to 2014. Washington, DC.
Cabrera, A., Nora, A., and Castaneda, M. (1992). The role of finances in the persistence process: A structural model. Research in Higher Education, 33(5), 571-593.
Cabrera, A., La Nasa, S., & Burkum, K. (2001). Pathways to a Four-Year Degree: The higher Education Story of One Generation. University Park, PA: Center for the Study of Higher Education at The Pennsylvania State University.
Chen, X. (2005). First-Generation Students in Postsecondary Education: A Look at their College Transcripts. Washington, DC: National Center for Education Statistics.
Cheney, B., Muraskin, L., Cahalan, M., and Rak, R. (1997). Interim Report National Study of Student Support Services: Third Year Longitudinal Study Results. Washington, DC: U.S. Department of Education.
Choy, S. (2000). Low-Income Students: Who They Are and How They Pay for Their Education. Washington, DC: National Center for Education Statistics.
Choy, S. (2001). Students Whose Parents Did Not Go to College: Postsecondary Access, Persistence, and Attainment. Washington, DC: National Center for Education Statistics.
College Board. (2007). Education Pays 2007: The Benefits of Higher Education for Individuals and Society. New York: Author.
Cook, B. & King, J. (2004). Low-Income Adults in Profile: Improving Lives Through Higher Education. Washington, DC: American Council on Education.
Cook, B. & King, J. (2007). 2007 Status Report on the Pell Grant Program. Washington, DC: American Council on Education.
Council for Adult and Experiential Learning (CAEL) (2008). Adult Learning in Focus: National and State-by-State Data. Author: Chicago, IL.
Cruce, T.M., Kinzie, J.L., Williams, J.M., Morelon, C.L., & Xingming, Y. (2005). The Relationship between First-Generation Status and Academic Self-efficacy among Entering College Students. Paper presented at the 30th Annual Meeting of the Association for the Study of Higher Education (ASHE), Philadelphia, PA, November 17-19, 2005.
Dowd A. (2004). Income and financial aid effects on persistence and degree attainment in public colleges. Education Policy Analysis Archives, 12(21).
Engstrom, C.M. & Tinto, V. (2008). Learning better together: The impact of learning communities on the persistence of low-income students. In Engle, J. (Ed.), Opportunity Matters: A Journal of Research Informing Educational Opportunity Practice and Programs, 1(1).
Filkins, J.W., and Doyle, S.K. (2002). First-Generation and Low-Income Students: Using the NSSE Data to Study Effective Educational Practices and Students’ Self-Reported Gains. Paper presented at the 42nd Annual Forum for the Association for Institutional Research, Toronto, Canada, June 2-5, 2002.
Horn, L., and Nunez, A. (2000). Mapping the Road to College: First-Generation Students’ Math Track, Planning Strategies, and Context of Support. Washington, DC: National Center for Education Statistics.
Horn, L. & Premo, M. (1995). Profile of Undergraduates in U.S. Postsecondary Institutions. Washington, DC: National Center for Education Statistics.
Horn, L. (1996). Nontraditional Undergraduates. Washington, DC: National Center for Education Statistics.
Institute for Higher Education Policy (IHEP). (2005). The Investment Payoff: A 50-State Analysis of the Public and Private Benefits of Higher Education. Washington, DC: Author.
Karp, R. & Logue, R. (2002-2003). Retention initiative for unscheduled sophomores and unscheduled readmits. Journal of College Student Retention: Research, Theory, & Practice,4(2), 147-172.
Kelly, P. (2005). As America Becomes More Diverse: The Impact of State Higher Education Inequality. Boulder, CO: National Center for Higher Education Management Systems (NCHEMS).
Kuh, G. D., Kinzie, J., Schuh, J. H., Whitt, E. J., & Associates. (2005). Student Success in College: Creating Conditions that Matter. San Francisco: Jossey-Bass.
Lara, J. (1992). Reflections: Bridging cultures. In L. S. Zwerling & H. B. London (Eds.), First Generation College Students: Confronting the Cultural Issues. San Francisco, CA: Jossey-Bass Publishers.
Lee, J.J., Sax, L.J., Kim, K.A., & Hagedorn, L.S. (2004). Understanding students’ parental education beyond first-generation status. Community College Review, 32(1), 1-20.
Lohfink, M.M. & Paulsen, M.B. (2005). Comparing the determinants of persistence for first-generation and continuing-generation students. Journal of College Student Development, 46(4), 409-428.
London, H.B. (1989). Breaking away: A study of first-generation college students and their families. American Journal of Education, 97(1), 144-170.
London, H.B. (1992). Transformations: Cultural challenges faced by first generation college students. In L. S. Zwerling & H. B. London (Eds.), First Generation College Students: Confronting the Cultural Issues. San Francisco, CA: Jossey-Bass Publishers.
Lotkowski, V.A., Robbins, S.B., & Noeth, R.J. (2004). The role of academic and non-academic factors in improving college retention. Iowa City, IA: ACT.
Mann, J.R., Hunt, M.D., & Alford, J.G. (2003-2004). Monitored probation: A program that works. Journal of College Student Retention: Research, Theory & Practice, 5(3), 245-254.
Mortenson, T. (2003). Economic Segregation of Higher Education Opportunity, 1973 to 2001. Oskaloosa, IA: Postsecondary Education Opportunity.
Mortenson, T. (January 2006). Unmet financial need of undergraduate students by state, sector, status and income levels 2003-04. Postsecondary Education Opportunity, 163.
Mortenson, T. (March 2006). National school lunch program participation by state FFY 1993 to FFY 2005. Postsecondary Education Opportunity, 165.
Mortenson, T. (2007). Bachelor’s Degree Attainment by Age 24 by Family Income Quartiles, 1970 to 2005. Oskaloosa, IA: Postsecondary Education Opportunity.
Muraskin, L. (1997). “Best Practices” in Student Support Services: A Study of Five Exemplary Sites. Washington, DC: U.S. Department of Education.
National Center for Education Statistics (NCES). (2007a). Digest of Education Statistics 2006. Washington, DC: U.S. Department of Education.
National Center for Education Statistics (NCES). (2007b). The Condition of Education 2007. Washington, DC: U.S. Department of Education.
National Center for Public Policy and Higher Education (NCPPHE). (2006). Measuring Up 2006: The National Report Card on Higher Education. San Jose, CA: Author.
Nunez, A. & Cuccaro-Alamin, S. (1998). First-Generation Students: Undergraduates Whose Parents Never Enrolled in Postsecondary Education. Washington, DC: National Center for Education Statistics.
Olenchak, F.R. & Hebert, T.P. (2002). Endangered academic talent: Lessons learned from gifted first-generation college males. Journal of College Student Development, 43(2), 195-212.
31R e f e r e n c e s
Organisation for Economic Co-operation and Development (OECD). (2007). Education at a Glance 2007. Paris, France.
Pascarella, E. & Terenzini, P. (1991). How College Affects Students: Findings and Insights from Twenty Years of Research. San Francisco: Jossey-Bass.
Pascarella, E.T., Pierson, C.T., Wolniak, G.C. & Terenzini, P.T. (2003). Experiences and outcomes of first-generation students in community colleges. Journal of College Student Development, 44(3), 420-429.
Pascarella, E.T., Pierson, C.T., Wolniak, G.C., & Terenzini, P.T. (2004). First-generation college students: Additional evidence on college experiences and outcomes. The Journal of Higher Education, 75(3), 249-284.
Pascarella, E.T., & Terenzini, P.T. (2005). How College Affects Students: A Third Decade of Research. San Francisco: Jossey-Bass.
The Pell Institute for the Study of Opportunity in Higher Education. (2007). Demography is Not Destiny: Increasing the Graduation Rates of Low-Income College Students at Large Public Universities. Washington, DC: Author.
Penrose, A.M. (2002). Academic literacy perceptions and performance: Comparing first-generation and continuing generation college students. Research in the Teaching of English, 36(4), 437-461.
Phelan, P., Davidson, A.L., & Yu, H.C. (1993). Students’ multiple worlds: Navigating the borders of peer, family, and school cultures. In P. Phelan & A.L. Davidson (Eds.), Renegotiating Cultural Diversity in American Schools (pp. 52-88). New York: Teachers College Press.
Pike, G.R. & Kuh, G.D. (2005). First- and second-generation college students: A comparison of their engagement and intellectual development. The Journal of Higher Education, 76(3), 276-300.
Piorkowski, G.K. (1983). Survivor guilt in the university setting. Personnel & Guidance Journal, 61(10), 620-622.
Reindl, T. (2007). Hitting Home: Quality, Cost, and Access Challenges Confronting Higher Education Today. Boston, MA: Jobs for the Future.
Rendon, L.I. (1992). From the barrio to the academy: Revelations of a Mexican American “scholarship girl.” In L.S. Zwerling & H.B. London (Eds.), First Generation College Students: Confronting the Cultural Issues. San Francisco, CA: Jossey-Bass Publishers.
Richardson, R.C. & Skinner, E.F. (1992). Helping first generation minority students achieve degrees. In L.S. Zwerling & H.B. London (Eds.), First Generation College Students: Confronting the Cultural Issues. San Francisco, CA: Jossey-Bass Publishers.
Rodriguez, R. (1982). Hunger of Memory: The Education of Richard Rodriguez - An Autobiography. New York: Bantam Books.
Rosas, M. & Hamrick, F. (2002). Family influences on academic decision making among women college students of Mexican descent. Equity and Excellence in Education, 35(1),
Somers, P., Woodhouse, S., & Cofer, J. (2004). Pushing the boulder uphill: The persistence of first-generation college students. NASPA Journal, 41(3), 418-435.
Somers, P. (1995). A comprehensive model for examining the impact of financial aid on enrollment and persistence. Journal of Student Financial Aid, 25(1), 13-27.
Smith, B.L., MacGregor, J., Matthews, R., & Gabelnick, F. (2004). Learning Communities: Reforming Undergraduate Education. San Francisco: Jossey-Bass.
Terenzini, P.T., Cabrera, A.F., & Bernal, E.M. (2001). Swimming Against the Tide: The Poor in American Higher Education. New York: College Board.
Terenzini, P.T., Rendon, L.I., Upcraft, M.L., Millar, S.B., Allison, K.W., Gregg, P.L., & Jalomo, R. (1994). The transition to college: Diverse students, diverse stories. Research in Higher Education, 35 (1), 57-73.
Terenzini, P.T., Springer, L., Yaeger, P.M., Pascarella, E.T., & Nora, A. (1996). First generation college students: Characteristics, experiences, and cognitive development. Research in Higher Education, 37 (1), 1-22.
Thayer, P. (May 2000). Retention of students from first-generation and low-income backgrounds. Opportunity Outlook. Washington, DC: Council for Opportunity in Education.
Tinto, V. (1993). Leaving College: Rethinking the Causes and Cures of Student Attrition (2nd Edition). Chicago, IL: University of Chicago Press.
Tinto, V. (2003). Student Success and the Building of Involving Educational Communities. Higher Education Monograph Series, Syracuse University, No. 2.
Upcraft, M.L., Gardner, J.N. & Barefoot, B.O. (2004). Challenging and Supporting the First-Year Student. San Francisco: Jossey-Bass Higher Education Series.
U.S. Census Bureau. (2002). The Big Payoff: Educational Attainment and Synthetic Estimates of Work-Life Earnings. Washington, DC: Author.
U.S. Census Bureau. (2003). Poverty in the United States: 2002. Washington, DC: Author.
U.S. Department of Education. (2005). A Profile of the Student Support Services Program 1998-1999 through 2001-2002. Washington, DC: Author.
U.S. Department of Education. (2007). 2005-2006 Federal Pell Grant Program End-of-Year Report. Washington, DC: Author.
Volp, P. M., Hill, T. L., & Frazier, C. L. (1998). Using telephone calls as examples of care to promote student success and retention. Journal of the Freshman Year Experience & Students in Transition, 10 (1), 73-88.
Warburton, E.C., Bugarin, R., & Nunez, A. (2001). Bridging the Gap: Academic Preparation and Postsecondary Success of First-Generation Students. Washington, DC: National Center for Education Statistics.
Western Interstate Commission for Higher Education (WICHE) (2003). Knocking at the College Door: Projections of High School Graduates By State, Income, and Race/Ethnicity. Boulder, CO: Author.
Willett, T. (2002). Impact of Follow-Up Counseling on Academic Performance and Persistence. Gilroy, CA: Gavilan College Office of Research.

32 M o v i n g B e y o n d A c c e s s
ABoUT THe coUnciL
Established in 1981, the Council for Opportunity in Education is a non-profit organization dedicated to expanding educational opportunity throughout the United States, the Caribbean, and the Pacific Islands. Through its numerous
membership services, the Council works in conjunction with colleges, universities, and agencies that host federally-funded college access programs to specifically help low-income, first-generation, and disabled Americans enter college and graduate.
The mission of the Council is to advance and defend the ideal of equal educational opportunity in postsecondary education. The Council’s focus is assuring that the least advantaged segments of the American population have a realistic chance to enter and graduate from a postsecondary institution.
For Further inFormation contact:
the counciL For oPPortunity in education1025 Vermont Avenue, NW Suite 900Washington, DC 20005P: 202.347.7430 F: 202.347.0786www.coenet.us