moving averages
DESCRIPTION
Moving Averages. OCR Stage 8. Why use them?. Moving Averages, when graphed, allow us to see any trends in data that are cyclical By calculating the average of 2 or more items in the data, any peaks and troughs are smoothed out. 265. 269.25. 265.25. 270.75. 4 Period Moving Average. - PowerPoint PPT PresentationTRANSCRIPT
Moving Averages
OCR Stage 8
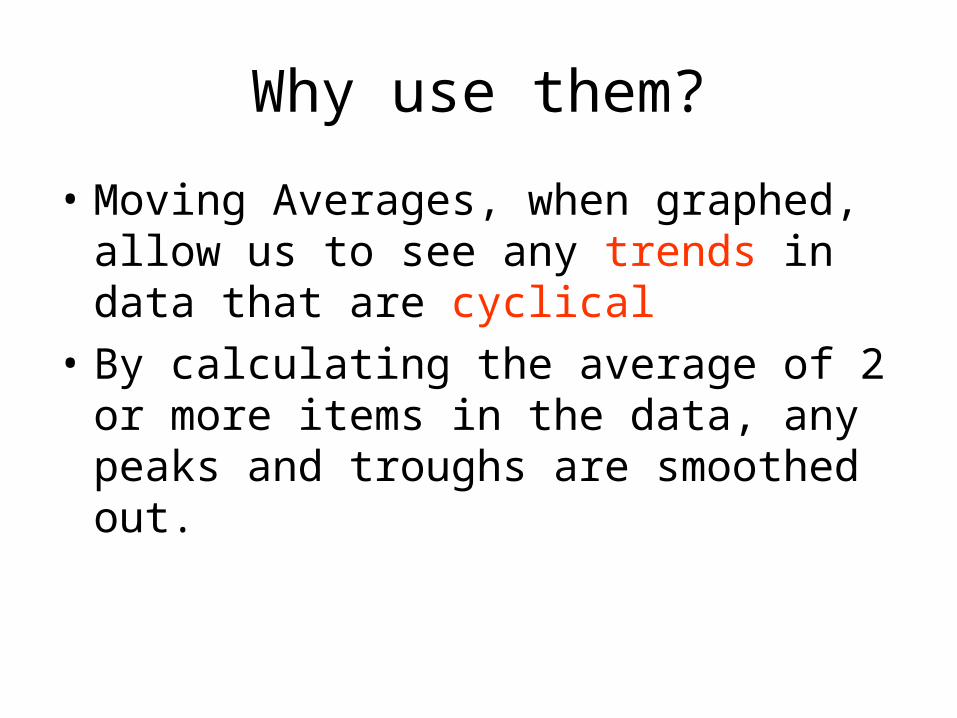
Why use them?
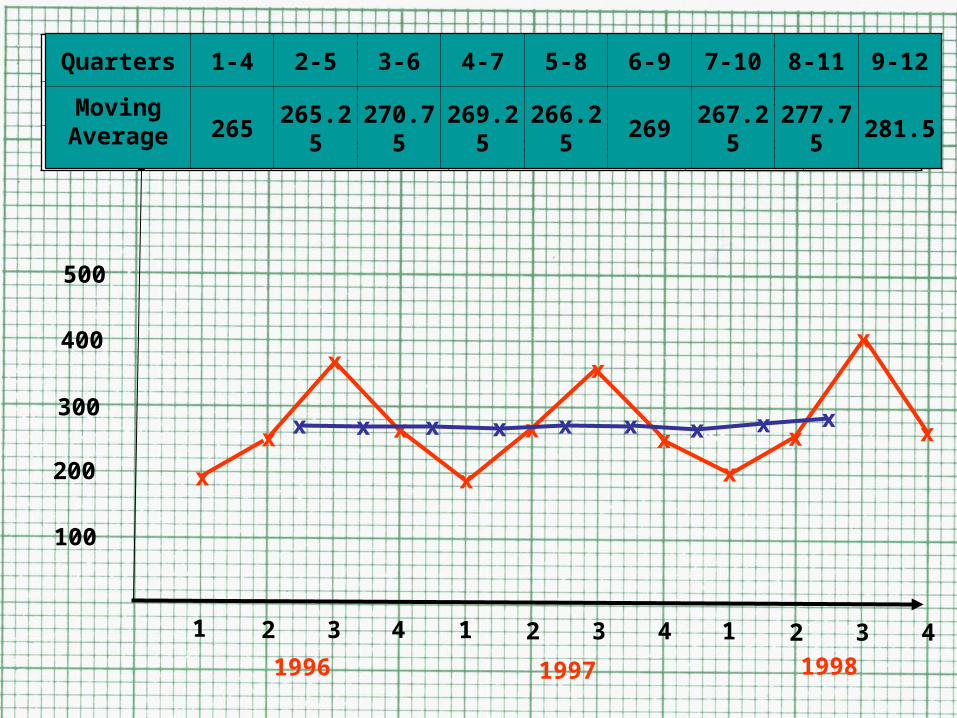
• Moving Averages, when graphed, allow us to see any trends in data that are cyclical
• By calculating the average of 2 or more items in the data, any peaks and troughs are smoothed out.
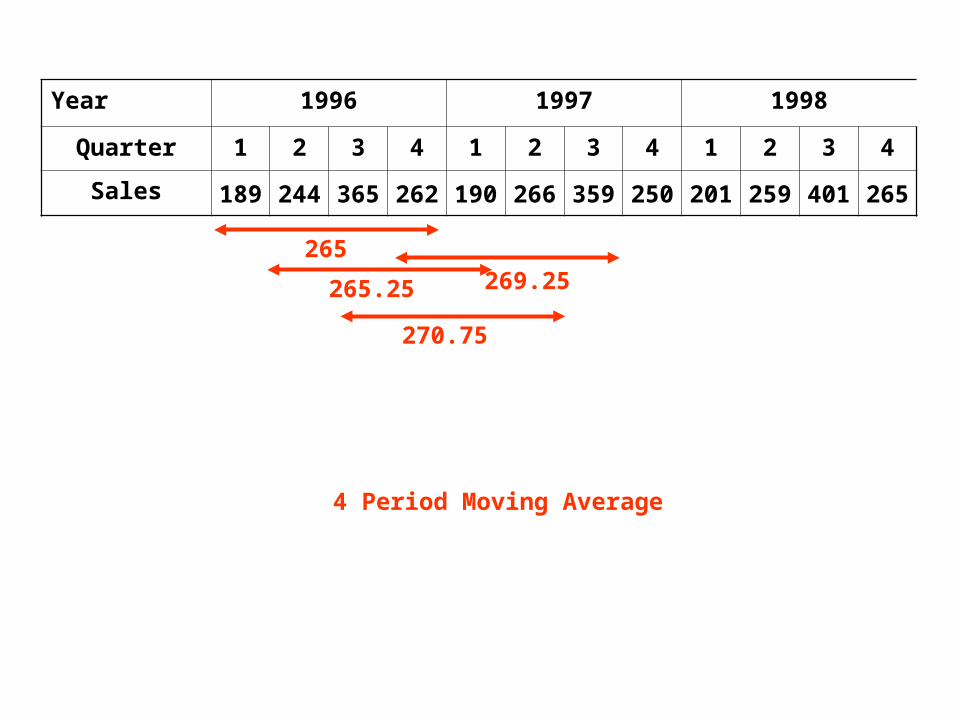
Year 1996 1997 1998
Quarter 1 2 3 4 1 2 3 4 1 2 3 4
Sales 189 244 365 262 190 266 359 250 201 259 401 265
265
265.25
270.75
269.25
4 Period Moving Average
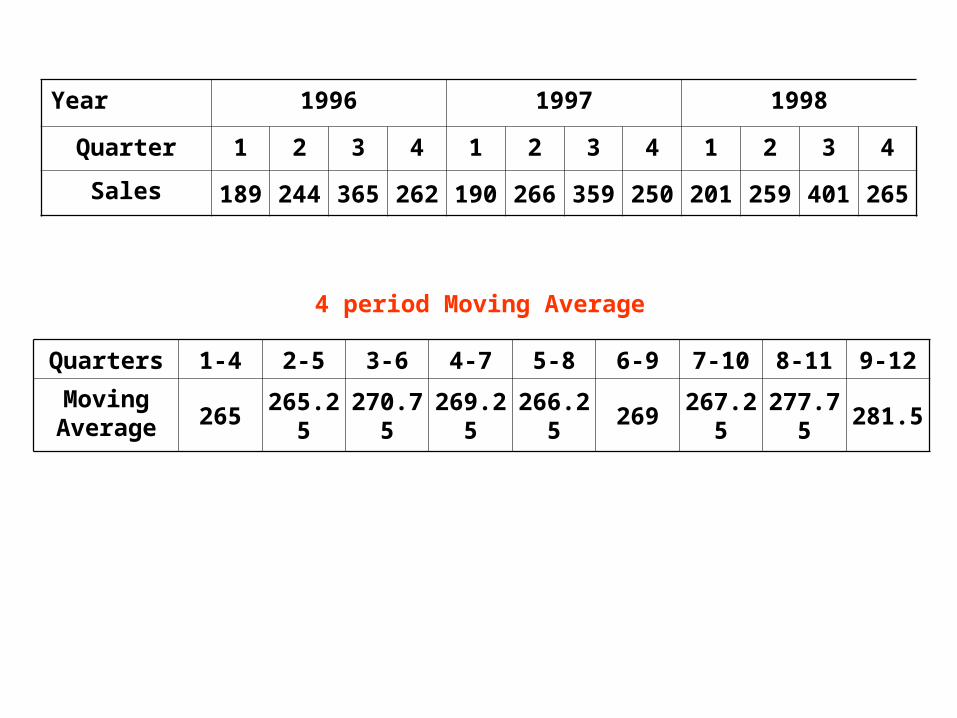
Year 1996 1997 1998
Quarter 1 2 3 4 1 2 3 4 1 2 3 4
Sales 189 244 365 262 190 266 359 250 201 259 401 265
4 period Moving Average
Quarters 1-4 2-5 3-6 4-7 5-8 6-9 7-10 8-11 9-12
Moving Average 265 265.25 270.75 269.25 266.25 269 267.25 277.75 281.5
Year 1996 1997 1998
Quarter 1 2 3 4 1 2 3 4 1 2 3 4
Sales 189 244 365 262 190 266 359 250 201 259 401 265
1 2 3 4 1 2 3 4 1 2 3 4
100
200
300
400
500
x
1996 1997 1998
x
x
x
x
x
x
x
x
x
x
x
Quarters 1-4 2-5 3-6 4-7 5-8 6-9 7-10 8-11 9-12
Moving Average 265 265.25 270.75 269.25 266.25 269 267.25 277.75 281.5
x x x x x x x x x