movement of two nonionic surfactants in wettable and water-repellent soils1
TRANSCRIPT
Movement of Two Nonionic Surfactants in Wettable and Water-Repellent Soils1
W. W. MILLER, N. VALORAS, AND J. LETEY2
ABSTRACT
The movement of two nonionic surfactants (Soil Penetrant3685, Aqua Gro) and their effect on water flow through wetta-ble and water repellent soils was investigated. Surfactant con-centrations of 0, 100, 500, 1,000, 1,600, and 3,200 ppm wereapplied to the top of vertical soil columns and the concentrationof surfactant in the column effluent was measured. When theconcentration of surfactant in the effluent did not significantlychange with time, leaching of the columns with tap water wasinitiated. Both surfactants affected the hydraulic conductivityof the hydrophobic soil. The conductivity effects appeared tobe related to aggregate destabilization, micelle formation, andparticle migration, all of which caused a general decrease offlow rates with time. Adsorptive characteristics were found toaffect greatly the shape of the effluent concentration versus timecurve. Aqua Gro was shown to be more strongly adsorbed andless subject to leaching than was Soil Penetrant. A theoreticalmodel was tested for its ability to qualitatively predict experi-mental effluent concentrations. Allowing for the spreadingeffects of dispersion, there was reasonable agreement betweenmost experimental and theoretical values. The behavior andmovement of surfactants in soils are a function of adsorptionisotherms, mixing or dispersion due to flow velocities, soluteconcentration, and the physical and chemical characteristics ofthe porous medium.
Additional Index Words: water repellency, surfactants, misci-ble displacement, hydrodynamic dispersion.
MANY SOILS have been observed to exhibit varying de-grees of water repellency. This phenomenon has been
shown to be important to moisture transfer mechanisms,infiltration, and erosion (2, 3, 5, 8). Indeed, high surfacerunoff and erosion of many hectares of burned-over water-shed in southern California have been partially attributedto low infiltration due to water repellency of the soils (3,4). It is for these reasons that soil water repellency has be-come an increasingly important consideration in soil-waterresearch.
1 Contribution of the Department of Soil Science & Agri-cultural Engineering, University of California, Riverside 92502.The research leading to this report was supported by the Officeof Water Resources Research, USDI, under the MatchingFunds program of Public Law 88-379, as amended, and by theUniversity of California, Water Resources Center. It is a partof Office of Water Resources Research Projects no. B-072-CAL and B-141-CAL (Water Resources Center ProjectsW-206 and W-332). Received 15 April 1974. Approved 28Aug. 1974.2 Research Assistant, Staff Research Associate, and Profes-sor of Soil Physics, respectively, University of California, River-side. The senior author currently Assistant Professor of SoilEcology and Extension Specialist in Natural Resource Develop-ment, University of Nevada, Reno, Nevada.
A method for characterizing the wettability of plane sur-faces has been the measurement of contact angle betweenthe liquid and the solid. Zisman (11) showed that the con-tact angle is dependent upon the surface tension of theliquid, and generally, a decrease in surface tension resultsin a decrease of the liquid-solid contact angle. Thus, theaddition of a wetting agent to water, which results in a solu-tion that has a lower surface tension than the original water,may also reduce the liquid-solid contact angle of the soil towhich the solution is then applied.
Pelishek, Osborn, and Letey (8) presented an equationrelating the rate of liquid infiltration into a soil column tothe physical properties of the liquid, effective pore radius,and the liquid-solid contact angle. They determined that adecrease in the liquid surface tension should cause a de-crease in infiltration rate, whereas a decrease in the liquid-solid contact angle should cause an increase in infiltrationrate. The net effect of wetting agent on infiltration ratestherefore depends upon which factor predominates: a re-duction due to low surface tension or increase due to alower contact angle. For those soils possessing a largewater-solid contact angle, i.e., water-repellent soils, thebenefits from a decrease in contact angle would exceed thelimitations of a decrease in surface tension and the infiltra-tion rate would be increased.
Application of wetting agents to a water-repellent soil canproduce a beneficial rewet effect. It is assumed that this isaccomplished by the adsorption of the hydrophobic end ofthe surfactant molecule by the soil particles, consequentlyleaving the hydrophillic end of the molecule exposed to thesoil solution for wetting. Valoras et al. (9) and Mustafa andLetey (6) have shown that adsorption of surface-active ma-terials is influenced by the type of organic compound, itsconcentration, and the soil type.
As a surfactant moves down into a water-repellent layer,it is continually adsorbed such that the concentration insolution decreases with depth. If the surfactant is adsorbedout of solution near the soil surface prior to complete wet-ting of the repellent layer, one is again faced with watermovement into a water-repellent system and the effective-ness of the wetting agent is sharply reduced. At the otherextreme, little adsorption of surfactant by the soil increasesthe potential of deep percolation of the organic compound.Hence, information concerning the behavior of a wettingagent in a soil medium is of practical importance for severalreasons: (i) the effectiveness of a particular type of sur-factant applied to the soil is dependent in part, upon itsmovement within the profile since water-repellent layers arenot always located at the soil surface; (ii) the quantity andconcentration of surfactant applied per unit area is impor-tant environmentally as well as economically; and (iii) ad-
11
12 SOIL SCI. SOC. AMER. PROC., VOL. 39, 1975
Table 1—Some characteristics of the soil studied
Organic Surface*pH matter clay area C.E. C.
Pachappa
MorrisDam
Sandyloam
Sandyloam
7.6
5.3
___ $
0.87
8.0
, ____
12.6
7.7
mVg
50
26
meq/lOOg
10.3
21.5•Surface area determined by ethylene glycol method.
sorption and desorption characteristics influence initial sur-factant penetration following application and the potentialhazard of possible ground-water contamination.
The purpose of this investigation was to measure themovement of nonionic surfactants through soil columns byanalyzing the effluent from the bottom of columns and de-termining the effects of the surfactants on water flow. Themeasured results were compared to those calculated by aproposed model.
MATERIALS AND METHODS
Two soils were used in this investigation: (i) Pachappasandy loam (a wettable soil) and (ii) a water-repellent soil alsoof sandy loam texture which will be referred to as Morris Damsoil. Both soils were air dried and passed through a 1-mm sieveprior to use. Some specific soil characteristics are given in Table1. The nonionic surfactants used in this study were Soil Pene-trant 3685, an alkyl polyoxyethylene ethanol, and Aqua Groa mixture of polyoxyethylene ester and polyoxyethylene ether.Aqueous solutions were prepared by mixing various amountsof tap water with the nonionics to obtain surfactant concentra-tions of 0, 100, 500, 1,000, 1,600, and 3,200 ppm.
The soil columns were held in plexiglass tubes 26.9 cm inlength and 2.8 cm in diameter. The soil was supported by aplexiglass sheet, through which holes were drilled and coveredwith a fine mesh copper-wire screen and glass wool filter. Aplexiglass funnel was tooled and joined to the bottom of thecolumn to collect effluent. Copper-wire screen was also placedon the soil surface to prevent algal growth.
Each column was packed by pouring the soil through a funneland then tamping the column sides until maximum settling hadoccurred. The resultant bulk densities were 1.57 and 1.05g/cm3 for Pachappa and Morris Dam soils, respectively.
Aspirator bottles were used to apply solution to the top of thevertical soil columns. A constant head of 6 cm was maintainedthroughout each experiment. The time, /, at which the first dropof effluent emerged from the base of the column was taken ast = 0. When the concentration of surfactant in the effluent solu-tion did not significantly change with time, the head at the topof the column was allowed to decrease to the soil surface andwater was then applied to the soil column.
The effluent was fractionated into 20-ml samples by a presetvolumetric siphon and a GM Chromatography Fractionator.The concentration of surfactant in each sample was determinedby the cobalt thiocyanate method as described by Valoras andLetey (10). Solution flow rates were determined as a functionof time from plots of volume versus time.
Effluent data are presented in terms of C/C0 versus porevolumes of solution (one pore volume represents the total col-umn volume times the porosity and thus assumes the columnwas saturated), where C is the concentration of surfactant inthe effluent and C0 is the concentration of surfactant appliedat the soil surface. The measured results were compared to cal-culated results from a model described in the Theory section.The model, a Continuous System Modeling Program which in-cluded a finite difference subprogram for nonlinear portions ofthe isotherms, was programed in Fortran IV (G) language andcomputations were obtained from an IBM 360/50 system.
THEORY
The model assumes instantaneous equilibrium between solu-tion and adsorbed concentrations and negligible dispersion. Theanalysis was done by dividing the soil column into N layers ofdx thickness. The mass balance equation was applied to eachsection. The equilibrium concentration in any section is given by
« = q-[Seqf-S(/)«]- [1]where Ceq is the equilibrium concentration in solution (mg/cm3), C is the concentration (mg/cm3) entering the section/ at time t, Seq is the equilibrium adsorption concentration(mg/cm3), and 5(7) is the amount already adsorbed (mg/cm3).The subscript i denotes the section and the superscript / thetime. Each time unit is the required time for the solutionin each section to be displaced to the next section assumingpiston flow.
From the adsorption isotherm, one obtains the relationship
so that
Ceqf = q —[/(Ceqp-S(/)f]. [3]
As the solution moves from section i to /+!,
Ceq« = q + { [4]
In other words the equilibrium concentration becomes theincoming concentration in the section below. Similarly
[5]
or the equilibrium adsorbed concentration in section i becomesthe concentration already adsorbed in that section for the nexttime interval.
Calculations were started on the first section using Eq. [3Jwhere Cf equals C0, the applied concentration, and S(I) equalszero. With continuous solution application, the solution in thefirst section is displaced to the next section and Ceq is calcu-lated for that section using Eq. [3], recognizing the relationshipexpressed in Eq. [4] for the incoming concentration. The oper-ation is repeated moving downward from section to section untileither Ceq becomes zero or the bottom of the column is reachedand Ceq represents the concentration in the effluent. Followingthis, the entire procedure is repeated starting at the top and fol-lowing the next increment of solution application down thecolumn. Repetitive calculations are made until the calculatedeffluent concentration equals C0. Calculations on leaching fol-low the same procedures except the incoming concentration inthe first setion is zero.
The calculated effluent concentration was determined foreach pore volume of flow and compared to measured values.
Adsorption isotherm data are required for the analysis (Eq.[2]). Valoras et al. (9) reported adsorption data for varioussoils and surfactants using the "batch" technique. We were alsoable to calculate adsorption isotherms from our effluent meas-urements. Equilibrium between adsorbed and solution surfac-tant was achieved when the effluent concentration equaled theinflow concentration. The total amount of surfactant flowinginto the column minus the total amount leaving the column rep-resents the amount of surfactant in the column. The amount ofsurfactant in solution in the column was calculated by multiply-ing the equilibrium effluent concentration and the volume ofsolution in the column. The amount adsorbed was calculatedby difference. Since several surfactant concentrations were usedin the experiment, data were available to plot an adsorptionisotherm.
MILLER ET AL.: MOVEMENT OF NONIONIC SURFACTANTS IN SOILS 13
MORRIS DAM-SOIL PENETRANT
t 2§ui> I
§
• TAP WATER» 3200 ppmo 1600 ppm• 500 ppmo 100 ppm
x u- - r -\ \.
?-x———x—» TI-JV
100 200TIME (HRS.)
^ 3000o»E
2000
<<r1000
300
3200 ppm1600 ppm500 ppmI 00 ppm
300100 T 200TIME (HRS.)
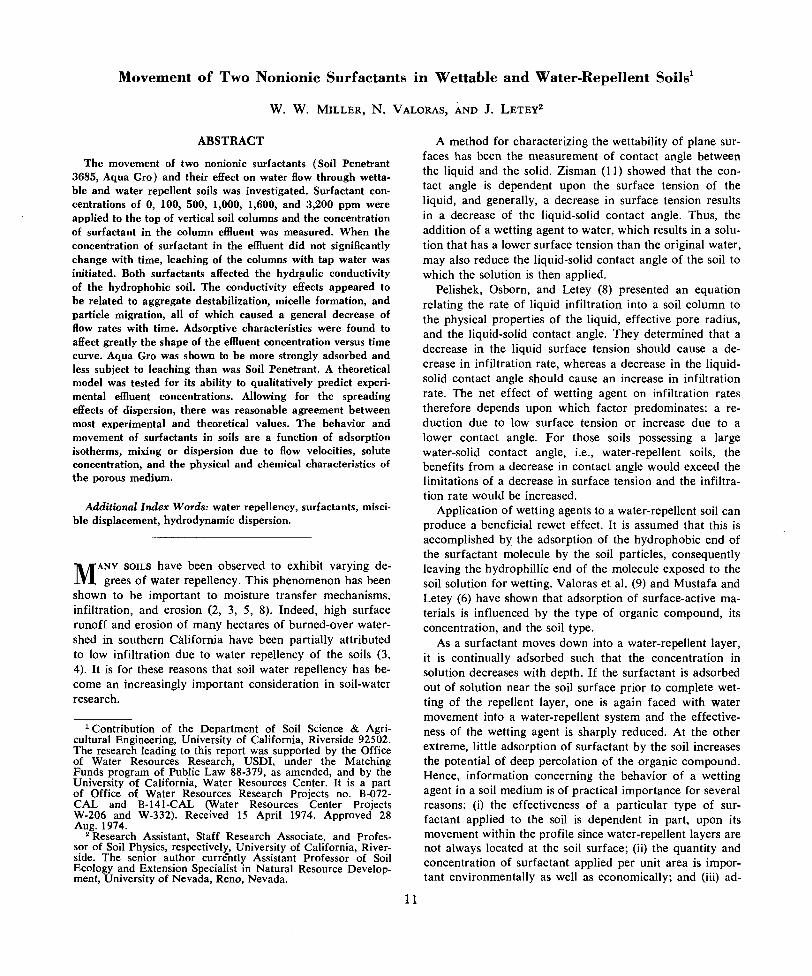
Fig. 1 — Solution flow vs. time and effluent surfactant concen-tration vs. time for tracer-in Morris Dam-Soil Penetrant experi-ments. (Arrows in Fig. 1-4 are used for convenient point ofreference comparison on the two graphs. )
RESULTS AND DISCUSSION
The solution flow rate and effluent concentration areplotted as a function of time for Morris Dam soil and SoilPenetrant and Aqua Gro (in Fig. 1 and 2), respectively(t — 0 represents the time at which the first drop of effluentemerged from the base of the column and not the time thatsolution was applied to the column). The flow rate of un-treated water decreased with time to a constant value. Sincethe soil was initially dry, this decrease of flow with time isattributed to swelling of the soil colloid and organic frac-tions and to particle migration during inital settling of thesoil. As the system became stabilized, it follows that flowrates should become constant as was observed.
During the "tracer-in" experiments (tracer-in will beused to denote surfactant solution application) there wasan initial decrease in solution flow rate through the MorrisDam soil similar to that observed for water (Fig. 1 and 2).With one exception, lower flow rates occurred at higherapplication concentration for the first 24 hours. As surfac-tant concentration is increased, a critical concentration isreached where individual molecules come together forming"molecule-aggregates" (1). This process is commonly re-ferred to as micelle formation and the respective solu-tion concentration as the "critical micelle concentration"(CMC). The CMC for Soil Penetrant ranges between 800ppm-1,000 ppm and Aqua Gro between 200 ppm-500ppm. Hence, as the solution concentration becomes greater,the size and number of micelles increases and may affectsolution flow through soil.
Mustafa and Letey (7) found that surfactant solutiondecreased the aggregate stability of hydrophobic soils. Gen-erally, the higher the solution.concentration the greater theaggregate dispersion value. The observed decrease in flowrates with increasing concentration therefore could be the
IIE 3
MORRIS DAM-AQUA GRO
oo
. TAP WATERx 3200 ppmo 1000 ppm• 500 ppm
100 200TIME (HRS.)
, 3000
3 2000
)-5 1000<Jzoo
300
3200 ppm1000 ppm500 ppm
100 ' t 200 300TIME (HRS.)
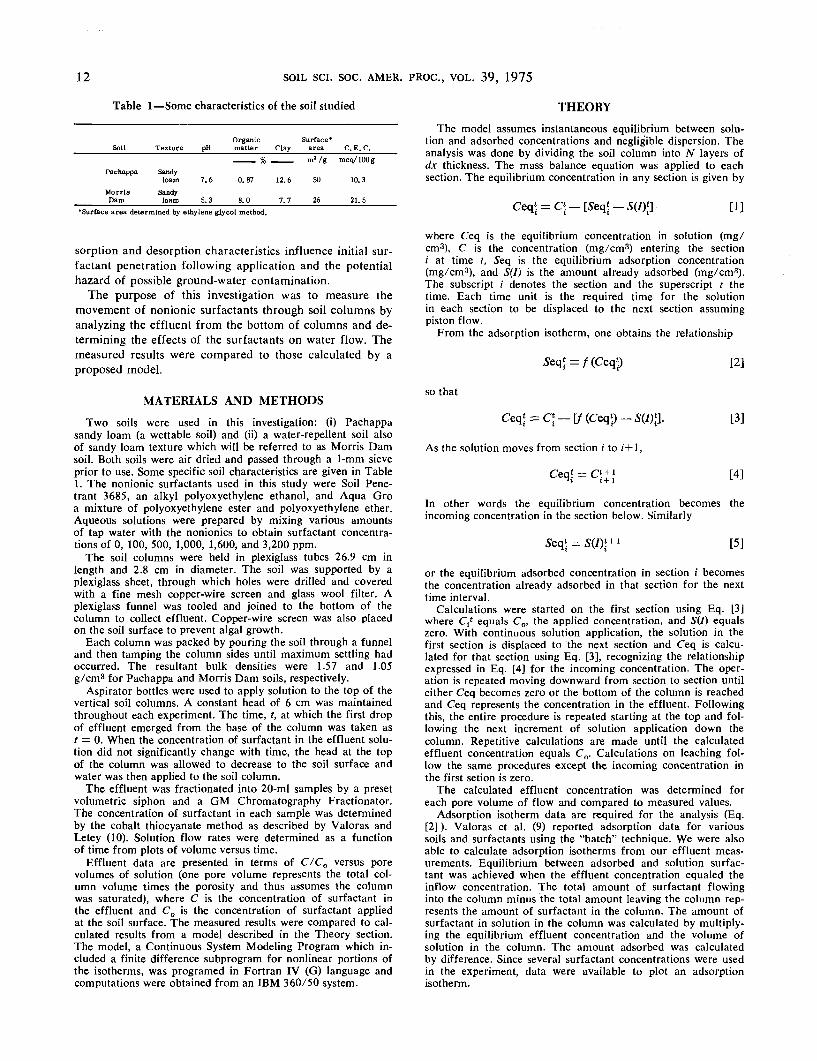
Fig. 2—Solution flow vs. time and effluent surfactant concentra-tion vs. time for tracer-in Morris Dam-Aqua Gro experiments.
result of particle migration, micelle "clogging" of soil pores,and/or the breakdown of soil aggregates. Microbial growthcould also be a contributing factor; however, high concen-trations of surfactant materials generally inhibit microbialactivity.
For the Morris Dam-Soil Penetrant system (Fig. 1) theinitial decrease in flow rate for the two lower concentrationswas followed by a rather sharp increase in flow rate whichthen became constant. The increase in flow rate approxi-mately corresponds to the time surfactant was first detectedin the effluent (arrows on graph). This implies that initially(/ = 0) the columns were not completely saturated and thatthe initial decrease of flow rates with time for the surfactantmaterials was similar to tap water. The major cause of thedelay of saturation is the water repellency of the system. Atfirst there is channeling of solution through the larger poressince movement into smaller voids is restricted due to waterrepellency. As most of the adsorptive sites become satisfiedwith surfactant, the system becomes more wettable andthere is greater movement of solution into and throughsmaller soil pores. As saturation is approached there is anincrease in flow rate as observed.
The flow rate of 1,600 ppm Soil Penetrant through Mor-ris Dam soil may be explained on the combined basis ofmicelle formation and soil wetting. The initially high flowrate could be accounted for by good soil wetting by the sur-factant solution. Adsorption of surfactant by the soil wouldpossibly reduce the solution concentration below the CMCduring early stages of percolation. But as adsorption sitesbecome satisfied the equilibrium concentration would ex-ceed CMC and lead to reduced flow rates.
With respect to the Morris Dam-Aqua Gro system thesame general trends are observed (Fig. 2) except there isno increase in flow rate with time. The stabilized flow ratefor the application concentration lower than the CMC (500ppm) was greater than the flow rate for tap water, whereas
14 SOIL SCI. SOC. AMER. PROC., VOL. 39, 1975
MORRIS DAM-SOIL PENETRANT MORRIS DAM-AQUA GRO
x 3200 ppmo 1600 ppm* 500 ppmo 100 ppm
100 200TIME (HRS.)
300
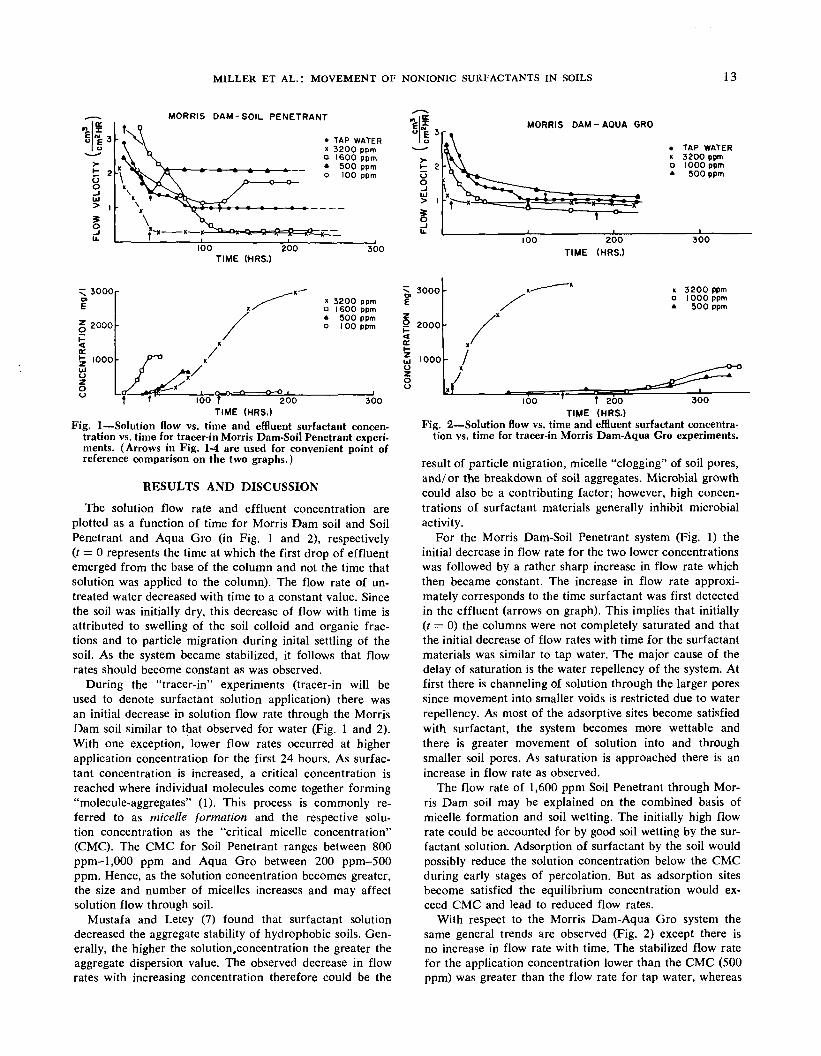
Fig. 3—Solution flow vs. time and effluent surfactant concentra-tion vs. time for tracer-out Morris Dam-Soil Penetrant experi-ments.
concentrations greater than CMC were lower. The differ-ences however are quite small and may not be significant.
The concentration of both surfactants in the effluent wasequal to zero for some period of time after the first drop ofeffluent emerged from the bottom of the soil columns. Thetime lag prior to surfactant breakthrough was generallygreater for the lower concentrations. The application of lowsurfactant concentrations to a thick layer may be ineffectivein wetting that layer. Unusually thick layers of water-repel-lent soils may therefore require either a longer period ofapplication or the application of a greater solution concen-tration.
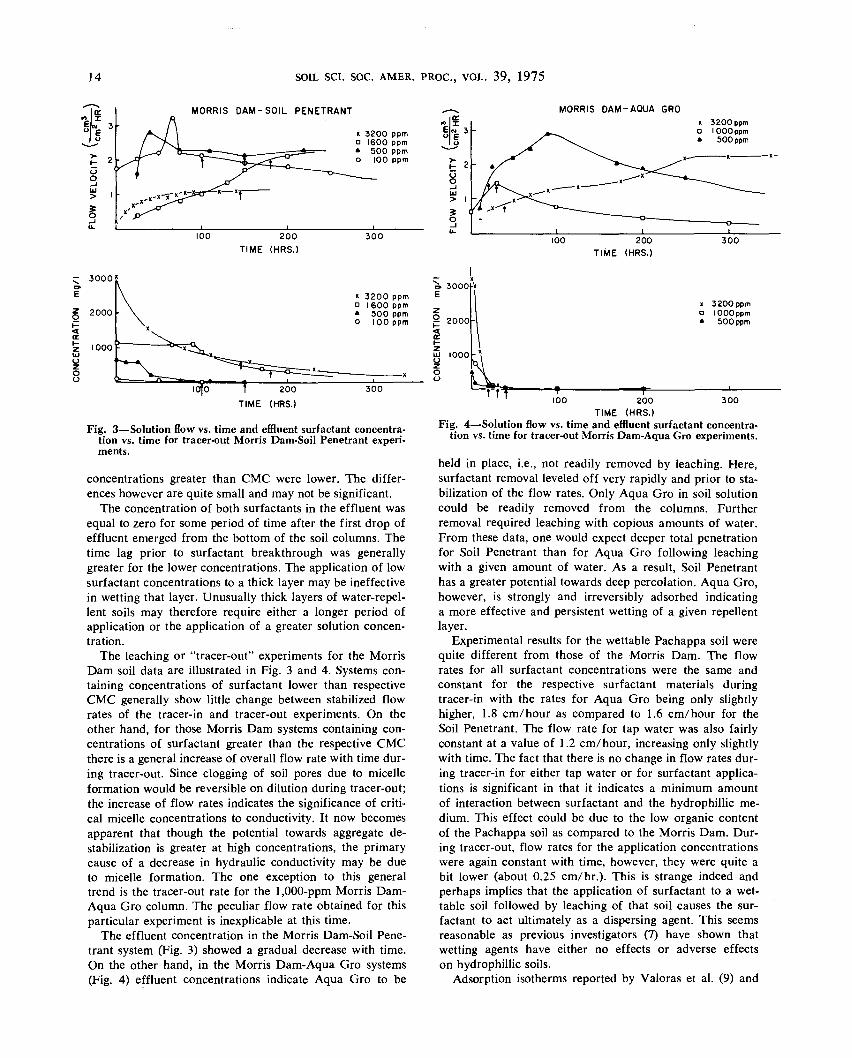
The leaching or "tracer-out" experiments for the MorrisDam soil data are illustrated in Fig. 3 and 4. Systems con-taining concentrations of surfactant lower than respectiveCMC generally show little change between stabilized flowrates of the tracer-in and tracer-out experiments. On theother hand, for those Morris Dam systems containing con-centrations of surfactant greater than the respective CMCthere is a general increase of overall flow rate with time dur-ing tracer-out. Since clogging of soil pores due to micelleformation would be reversible on dilution during tracer-out;the increase of flow rates indicates the significance of criti-cal micelle concentrations to conductivity. It now becomesapparent that though the potential towards aggregate de-stabilization is greater at high concentrations, the primarycause of a decrease in hydraulic conductivity may be dueto micelle formation. The one exception to this generaltrend is the tracer-out rate for the 1,000-ppm Morris Dam-Aqua Gro column. The peculiar flow rate obtained for thisparticular experiment is inexplicable at this time.
The effluent concentration in the Morris Dam-Soil Pene-trant system (Fig. 3) showed a gradual decrease with time.On the other hand, in the Morris Dam-Aqua Gro systems(Fig. 4) effluent concentrations indicate Aqua Gro to be
3 200 ppmI 000 ppm
500 ppm
100 200TIME (HRS.)
^ 3000o»E
§ 2000P<(£
Z IOOOUJ
Z
\
x 3200 ppmo 1 600 ppm• 500 ppmo 100 ppm
k- T^^^^»x^__^
"~*~\. ^===:T:i:::S::?=Sr--xR , —— .-*—_. . T . ——— -IOJO t 200 300
TIME (HRS.)
o. 3000E
z5 2000<H
| IOOO
0- u 1
300
x 3200 ppmo IOOO ppm» SOOppm
100 200 300TIME (HRS.)
Fig. 4—Solution flow vs. time and effluent surfactant concentra-tion vs. time for tracer-out Morris Dam-Aqua Gro experiments.
held in place, i.e., not readily removed by leaching. Here,surfactant removal leveled off very rapidly and prior to sta-bilization of the flow rates. Only Aqua Gro in soil solutioncould be readily removed from the columns. Furtherremoval required leaching with copious amounts of water.From these data, one would expect deeper total penetrationfor Soil Penetrant than for Aqua Gro following leachingwith a given amount of water. As a result, Soil Penetranthas a greater potential towards deep percolation. Aqua Gro,however, is strongly and irreversibly adsorbed indicatinga more effective and persistent wetting of a given repellentlayer.
Experimental results for the wettable Pachappa soil werequite different from those of the Morris Dam. The flowrates for all surfactant concentrations were the same andconstant for the respective surfactant materials duringtracer-in with the rates for Aqua Gro being only slightlyhigher, 1.8 cm/hour as compared to 1.6 cm/hour for theSoil Penetrant. The flow rate for tap water was also fairlyconstant at a value of 1.2 cm/ hour, increasing only slightlywith time. The fact that there is no change in flow rates dur-ing tracer-in for either tap water or for surfactant applica-tions is significant in that it indicates a minimum amountof interaction between surfactant and the hydrophillic me-dium. This effect could be due to the low organic contentof the Pachappa soil as compared to the Morris Dam. Dur-ing tracer-out, flow rates for the application concentrationswere again constant with time, however, they were quite abit lower (about 0.25 cm/hr.). This is strange indeed andperhaps implies that the application of surfactant to a wet-table soil followed by leaching of that soil causes the sur-factant to act ultimately as a dispersing agent. This seemsreasonable as previous investigators (7) have shown thatwetting agents have either no effects or adverse effectson hydrophillic soils.
Adsorption isotherms reported by Valoras et al. (9) and
MILLER ET AL.: MOVEMENT OF NONIONIC SURFACTANTS IN SOILS 15
Q 2UJm<Eoino4
10
PACHAPPA-SOIL PENETRANT
——VALORAS——CALCULATED 10
MORRIS DAM-SOIL PENETRANT MORRIS DAM - SOIL PENETRANT
1.0 2.0 1.0 2.0
mg/ml EQUILIBRIUM CONCENTRATION
PACHAPPA-AQUA 6RO MORRIS DAM-AQUA GRO
16 -
1.0 2.0 1.0 2.0
mg/ml EQUILIBRIUM CONCENTRATION
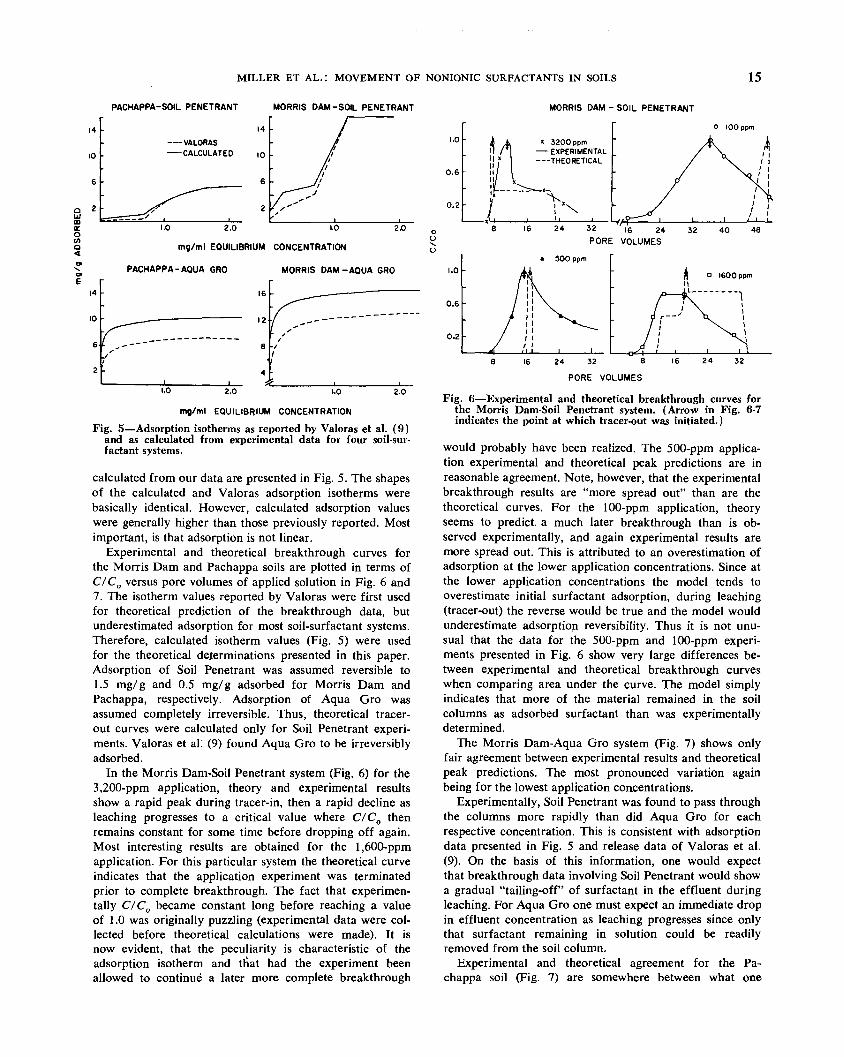
Fig. 5—Adsorption isotherms as reported by Valoras et al. (9)and as calculated from experimental data for four soil-sur-factant systems.
calculated from our data are presented in Fig. 5. The shapesof the calculated and Valoras adsorption isotherms werebasically identical. However, calculated adsorption valueswere generally higher than those previously reported. Mostimportant, is that adsorption is not linear.
Experimental and theoretical breakthrough curves forthe Morris Dam and Pachappa soils are plotted in terms ofC/C0 versus pore volumes of applied solution in Fig. 6 and7. The isotherm values reported by Valoras were first usedfor theoretical prediction of the breakthrough data, butunderestimated adsorption for most soil-surfactant systems.Therefore, calculated isotherm values (Fig. 5) were usedfor the theoretical determinations presented in this paper.Adsorption of Soil Penetrant was assumed reversible to1.5 mg/g and 0.5 mg/g adsorbed for Morris Dam andPachappa, respectively. Adsorption of Aqua Gro wasassumed completely irreversible. Thus, theoretical tracer-out curves were calculated only for Soil Penetrant experi-ments. Valoras et al: (9) found Aqua Gro to be irreversiblyadsorbed.
In the Morris Dam-Soil Penetrant system (Fig. 6) for the3,200-ppm application, theory and experimental resultsshow a rapid peak during tracer-in, then a rapid decline asleaching progresses to a critical value where C/C0 thenremains constant for some time before dropping off again.Most interesting results are obtained for the 1,600-ppmapplication. For this particular system the theoretical curveindicates that the application experiment was terminatedprior to complete breakthrough. The fact that experimen-tally C/C0 became constant long before reaching a valueof 1.0 was originally puzzling (experimental data were col-lected before theoretical calculations were made). It isnow evident, that the peculiarity is characteristic of theadsorption isotherm and tliat had the experiment beenallowed to continue a later more complete breakthrough
oo
1.0
0.6
0.2
1.0
0.6
0.2
* 3200ppmll /'I ——EXPERIMENTAL
——THEORETICAL
o 100 ppm
24 32 |6 24 32
PORE VOLUMES
500 ppm
24 32 8
PORE VOLUMES
32
Fig. 6—Experimental and theoretical breakthrough curves forthe Morris Dam-Soil Penetrant system. (Arrow in Fig. 6-7indicates the point at which tracer-out was initiated.)
would probably have been realized. The 500-ppm applica-tion experimental and theoretical peak predictions are inreasonable agreement. Note, however, that the experimentalbreakthrough results are "more spread out" than are thetheoretical curves. For the 100-ppm application, theoryseems to predict, a much later breakthrough than is ob-served experimentally, and again experimental results aremore spread out. This is attributed to an overestimation ofadsorption at the lower application concentrations. Since atthe lower application concentrations the model tends tooverestimate initial surfactant adsorption, during leaching(tracer-out) the reverse would be true and the model wouldunderestimate adsorption reversibility. Thus it is not unu-sual that the data for the 500-ppm and 100-ppm experi-ments presented in Fig. 6 show very large differences be-tween experimental and theoretical breakthrough curveswhen comparing area under the curve. The model simplyindicates that more of the material remained in the soilcolumns as adsorbed surfactant than was experimentallydetermined.
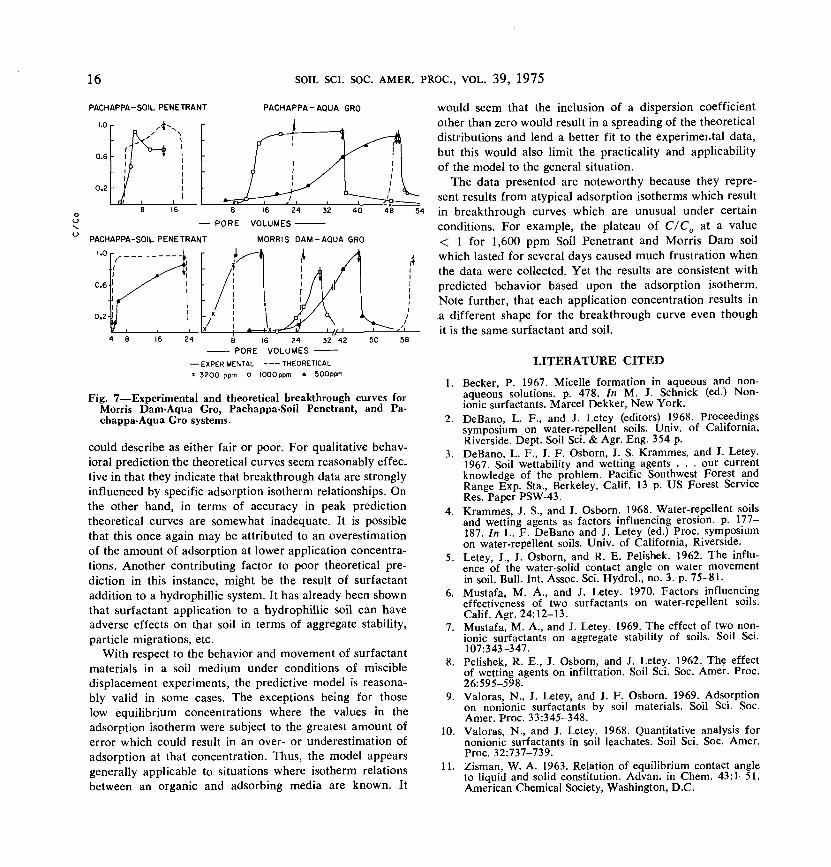
The Morris Dam-Aqua Gro system (Fig. 7) shows onlyfair agreement between experimental results and theoreticalpeak predictions. The most pronounced variation againbeing for the lowest application concentrations.
Experimentally, Soil Penetrant was found to pass throughthe columns more rapidly than did Aqua Gro for eachrespective concentration. This is consistent with adsorptiondata presented in Fig. 5 and release data of Valoras et al.(9). On the basis of this information, one would expectthat breakthrough data involving Soil Penetrant would showa gradual "tailing-off" of surfactant in the effluent duringleaching. For Aqua Gro one must expect an immediate dropin effluent concentration as leaching progresses since onlythat surfactant remaining in solution could be readilyremoved from the soil column.
Experimental and theoretical agreement for the Pa-chappa soil (Fig. 7) are somewhere between what one
16 SOIL SCI. SOC. AMER. PROC., VOL. 39, 1975
PACHAPPA-SOIL PENETRANT
'•Or ,-K
0.6
0.2
PACHAPPA-AQUA GRO
8 32 4016 24
— PORE VOLUMES ————
PACHAPPA-SOIL PENETRANT MORRIS DAM-AQUA GRO
48
1.0
0.6
J^ll
8 16 24PORE VOLUMES
— EXPERIMENTAL ——THEORETICAL« 3200 ppm o 1000 ppm • SOOppm
Fig. 7—Experimental and theoretical breakthrough curves forMorris Dam-Aqua Gro, Pachappa-Soil Penetrant, and Pa-chappa-Aqua Gro systems.
could describe as either fair or poor. For qualitative behav-ioral prediction the theoretical curves seem reasonably effec.live in that they indicate that breakthrough data are stronglyinfluenced by specific adsorption isotherm relationships. Onthe other hand, in terms of accuracy in peak predictiontheoretical curves are somewhat inadequate. It is possiblethat this once again may be attributed to an overestimationof the amount of adsorption at lower application concentra-tions. Another contributing factor to poor theoretical pre-diction in this instance, might be the result of surfactantaddition to a hydrophillic system. It has already been shownthat surfactant application to a hydrophillic soil can haveadverse effects on that soil in terms of aggregate stability,particle migrations, etc.
With respect to the behavior and movement of surfactantmaterials in a soil medium under conditions of miscibledisplacement experiments, the predictive model is reasona-bly valid in some cases. The exceptions being for thoselow equilibrium concentrations where the values in theadsorption isotherm were subject to the greatest amount oferror which could result in an over- or underestimation ofadsorption at that concentration. Thus, the model appearsgenerally applicable to situations where isotherm relationsbetween an organic and adsorbing media are known. It
would seem that the inclusion of a dispersion coefficientother than zero would result in a spreading of the theoreticaldistributions and lend a better fit to the experimental data,but this would also limit the practicality and applicabilityof the model to the general situation.
The data presented are noteworthy because they repre-sent results from atypical adsorption isotherms which resultin breakthrough curves which are unusual under certainconditions. For example, the plateau of C/C0 at a value< 1 for 1,600 ppm Soil Penetrant and Morris Dam soilwhich lasted for several days caused much frustration whenthe data were collected. Yet the results are consistent withpredicted behavior based upon the adsorption isotherm.Note further, that each application concentration results ina different shape for the breakthrough curve even thoughit is the same surfactant and soil.