movement and degradation of aldicarb residues in south carolina loamy sand soil
TRANSCRIPT
Agriculture, Ecosystems and Environment, 20 (1988) 303-315 303 Elsevier Science Publishers B.V., Amsterdam - - Printed in The Netherlands
Movement and Degradat ion of Aldicarb Residues in South Carol ina Loamy Sand Soil 1
RICHARD O. HEGG', WILLIAM H. SHELLEY', RUSSELL L. JONES 2 and R.R. ROMINE 2
1Clemson University, Clemson, SC 29634 (U.S.A.) 2Union Carbide Agricultural Products Co. Inc., Research Triangle Park, NC 27709 (U.S.A.)
(Accepted for publication 12 February 1988)
ABSTRACT
Hegg, R.O., Shelley, W.H., Jones, R.L. and Romine R.R., 1988. Movement and degradation of aldicarb residues in South Carolina loamy sand soil. Agric. Ecosystems Environ., 20: 303-315.
The movement and degradation of aldicarb (2-methyl-2-(methylthio)propionaldehyde O- (methylcarbamoyl) oxime) residues was measured in a Dotham loamy sand soil in Barnwell County in southern South Carolina. The experiment was designed to compare movement in a fallow plot versus a soya bean plot and to compare residue results from soil suction lysimeters and soil sam- ples. The soil sample data indicate that aldicarb degraded at a rate corresponding to a half life of approximately 9 days with essentially no residues present 4 months after application. This deg- radation rate is faster than the 14-39-day half-life measured in nearby states. Because this rela- tively rapid degradation rate generally constrained residue movement to the upper 0.3 m in both plots (resulting in no significant residues in the lysimeters and monitoring wells), comparison between data from soil cores and suction lysimeters was not possible and the reduced evapotran- spiration in the fallow plot had little effect on residue movement. Simulations using the unsatu- rated zone model PRZM with rainfall records from 15 years were used to illustrate that aldicarb residues should be limited to the upper 1.5 m, regardless of year-to-year variations in rainfall.
INTRODUCTION
Aldicarb (2-methyl -2 (m e thy l t h io )p rop iona ldehyde O- (methy lca rba- moyl ) oxime ) is an effective nemat ic ide and insecticide for several crops grown in Sou th Carol ina including pecans, peanuts , soya beans, co t ton and sorghum. Since the discovery of aldicarb residue in Long Is land wells in 1979 (Zaki et al., 1982), its env i ronmen ta l fate has been the subject of m u c h research by universi ty , gove rnmen t and indus t ry scientists.
'Joint contribution from Department of Agricultural Engineering, Clemson University, Clemson, SC 29634-0357, and Union Carbide Agricultural Products Company, Inc., P.O. Box 12014, Re- search Triangle Park, NC 27709. Technical Contribution No. 2517 of the South Carolina Agri- cultural Experiment Station.
0167-8809/88/$03.50 © 1988 Elsevier Science Publishers B.V.
304
The movement and degradation of aldicarb residues in the saturated and unsaturated zones has been summarized elsewhere (Jones, 1986a). Although field studies have been conducted in over a third of the states including many southeastern coastal states: Florida (Hornsby et al., 1983; Jones and Back, 1984), Georgia (Carsel et al., 1985b), North Carolina (Jones et al., 1986c), and Virginia (Jones et al., 1986c), no field research programs had been con- ducted with aldicarb in South Carolina before the onset of the work described in this paper.
Unsaturated-zone field research studies have usually been conducted by col- lection of soil samples, although some field work has been performed with soil suction lysimeters (Brasino and Hoopes, 1985). Advantages of the soil-sam- pling procedure include the ability to take enough replicates to determine field- average concentrations better, collection of all water in the soil regardless of pore size, and the ability to take samples directly from undisturbed treated bands. Disadvantages include possible contamination of lower strata from res- idues in higher strata during sampling and the amount of labor required to collect replicate samples. Advantages of using soil suction lysimeters include the ability to monitor a particular spot repeatedly, collection of samples (after installation of the lysimeter) requires less labor, and water samples from the lysimeters are generally easier to analyze than soil samples. Disadvantages of soil suction lysimetry include the difficulty of installation (usually making it impossible to obtain enough replicates to define field-average concentrations), preferential collection of water from larger soil pores, necessity for the soil water content to be above the wilting point for collection of a sample, difficulty in taking samples from the middle of undisturbed treated bands, and potential channeling caused by puddles around the top of the lysimeter. This study was designed to compare the results obtained by the two methods.
This study also included a comparison of aldicarb movement and degrada- tion in fallow plot and soya bean plots. Because water losses by plant transpir- ation are usually greater than those from soil evaporation, and since water movement is proportional to the difference between the sum of rainfall and irrigation and the sum of soil evaporation and plant transpiration, potential for pesticide movement will be greater under fallow conditions.
EXPERIMENTAL PROCEDURES
Site description
The project was conducted at the Edisto Research and Education Center of Clemson University in Barnwell County, South Carolina. The soil, classified as a Dothan loamy sand (fine-loamy, siliceous, thermic Plinthic Paleudulps) with 2-6% slope, was selected because it is representative of one of South Car- olina's dominant agricultural soils. The research site consisted of two plots 9
305
by 27 m with about as 5-m buffer zone between the plots. Both plots were chisel plowed to a depth of 0.3 m and soya beans were planted on 2 May 1985 using a 0.9-m row spacing in the plot on which a crop was grown. The tractor was driven through the fallow plot as if soya beans were being planted to duplicate soil compaction conditions. Aldicarb was applied on 9 May 1985 at a rate of 3.4 kg ha -1 of active ingredient (the maximum labeled rate for soya beans) incorporated in a 0.15-m band over the center of the seed row using a push type, ground-wheel driven Gandy granular applicator. Weeds in the plots were controlled by glyphosate herbicide applications and manual removal. Neither plot was irrigated during the study period.
Soil suction lysimeters and groundwater monitoring wells
The soil suction lysimeters consisted of a 3.8-cm porous ceramic cup (Soil Moisture Equipment Company, part No. 653× 1-B2M2, 2 bar) coupled with 5.1 cm PVC pipe. A black rubber stopper through which a 12-cm length of 6.0- mm i.d. copper tubing had been inserted served as the cap on each lysimeter. Tygon flexible tubing was clamped onto the copper tubing and pinchcock tub- ing clamps were used to close the Tygon tubing after vacuum had been applied during the sampling process. The groundwater monitoring wells were also con- structed of 5.1-cm PVC pipe to which a 0.9-m long slotted PVC well screen had been attached.
The lysimeters and the monitoring wells were installed prior to application of aldicarb with a rotary-drilling machine equipped with 10-cm augers. As soil came out of the holes, it was separated by color. After the pipe had been in- serted, a portion of the soil was firmly packed around the pipe in proper se- quence to minimize the disturbance in the soil layers around the pipe. To prevent seepage along the pipe, a clay seal was installed around the pipe in the upper 0.45 m of soil.
Nine soil-suction lysimeters and 3 groundwater monitoring wells were in- stalled in the fallow plot using a randomized complete block design. In each of 3 rows, soil-suction lysimeters were placed in the unsaturated zone at depths of 1, 2 and 3 m along with a well installed 8.5-m deep. Three additional ground- water wells were placed at the edges of the plot. The distance between lysi- meters or wells in a row was 1.8 m and the rows were spaced 6.8-m apart. Aldicarb was applied so that the treated bands were within 5 cm of each row of lysimeters.
The wells and lysimeters were sampled 3 times at weekly intervals prior to aldicarb applications and 13 times after application (weekly intervals for 9 times followed by 4 samplings at monthly intervals). The procedure used for sampling the lysimeters consisted of pulling a vacuum for 3-4 days prior to the sampling date, inserting a 3.0-mm i.d. nylon tube to the bottom of the pipe and using a vacuum of 50 kPa to pull the sample into a glass filtering flask. Up to 0.5 1 of the sample was placed in a polyethylene bottle. The tubing and flask
306
were rinsed with distilled deionized water after each sample. Wells were sam- pled by evacuating approximately 81 of water or pumping the well dry (which- ever occurred first) using a submersible air-driven pump and then collecting a 0.5-1 sample with a bucket bailer after fresh water had recharged the well. Plas- tic ground covers were used to prevent hoses from touching the treated soil surface at all times. All water samples were placed in a cooler after collection until the end of the day, when they were repackaged into 0.125-1 polypropylene bottles and frozen until analysis.
Soil samples
Soil samples were collected from both plots prior to application of aldicarb and 35, 70 and 131 days after treatment. Pretreatment samples consisted of 4 cores, two from each plot. For post-treatment sampling each plot was divided into 4 subplots for replicate sampling. At each sampling interval, 16 cores (4 cores from each subplot) were taken from each plot down to a maximum depth of 1.8 m. Soil cores were always taken through the middle of the treated band using an 8.3-cm bucket auger and separated into 0.3-m increments above 0.6 m and 0.6 m increments below 0.6 m. Between strata, the auger was washed with clean water and scrubbed to avoid residue transfer between samples. Also, to avoid contamination, the top 5 cm of soil in each auger were discarded with the exception of the first auger from each core. Augers of soil from each core stratum were placed separately in a plastic mixing bag, which was shaken and kneaded to thoroughly mix the soil. A new mixing bag was used for each sam- ple. An aliquot, which corresponded to approximately half the soil removed from a 0.3-m increment or approximately a quarter of the soil from a 0.6-m increment, was then transferred to a ziplock plastic bag. This bag was then put into a pre-labeled cloth bag. Soil samples were kept cool until the end of the day, and then frozen until analyzed.
Sample analyses
All soil and water samples were analyzed for total carbamate residues (al- dicarb, aldicarb sulfoxide, and aldicarb sulfone) by HPLC procedure utilizing post-column reactions and fluorescence detection (similar to that described by Krause, 1979 ) with a sensitivity of 1/~g kg- 1 for soil samples and 1/lg l - 1 for water samples. Soil water content and pH were also measured on all soil sam- ples and mechanical analyses and organic-matter determinations were made on pretreatment samples.
Data analysis
Soil-residue data were used to obtain half-life estimates by least squares on the transformed first-order rate equation (ln ( C / C o ) = - Kt) using a calcu-
307
lated starting concentration based on the average application rate per hectare This starting concentration is the best field-average concentration available during the study because the application rate is determined by the actual weight of the material applied. Because the residue data taken through the middle of the treated band were assumed to represent field-average concentrations (as a way of dealing with the effects of lateral dispersion), this procedure results in a half-life estimate that may be too long. This procedure for calculating half- lives also more heavily weights the amount of residues in later sampling periods than the residue levels in earlier periods. Residue concentrations from banded applications to row crops in later sampling periods will usually be closer to actual field-average concentrations owing to increased lateral dispersion and mechanical dispersion owing to tillage and harvesting operations. Because the time elapsed between application and the last sampling interval encompassed several half-lives, variations in this measured residue level produce much smaller changes in the estimated half-life. An alternative to this procedure would be to estimate field-average concentrations by taking samples outside the treated band. Because of the variability associated with soil application of granular pesticides (Jones et al., 1986b), this would increase the number of soil samples required by a factor of four. Considering that the difference in the soil-residue concentrations and actual field-average concentrations is greatest in earlier sampling intervals which least influence the estimated half-life, and since any error would tend towards predicting too long a half-life, the addi- tional effort of collecting and analyzing the increased number of samples was deemed unnecessary to meet the study objective.
RESULTS
This section summarizes the data collected from the two plots. A supplement providing individual soil and water analyses and daily weather data is available upon request from the authors.
Soil characteristics
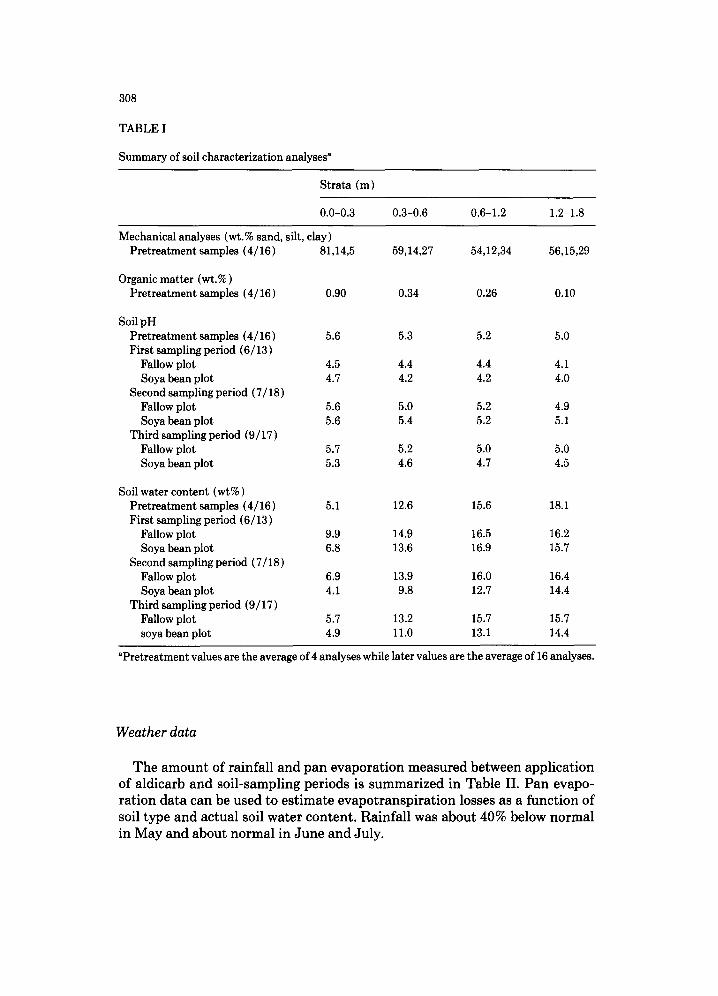
Soil characterization data obtained from the pretreatment and post-treat- ment soil samples are reported in Table I. The mechanical analyses show the upper 0.3 m is classified as a loamy sand while the deeper strata are classified as a sandy clay loam. Organic matter averaged 0.9 wt percent in the upper 0.3 m dropping to an average of 0.1 wt percent in the 1.2-1.8-m stratum. Soil pH ranged from 4.5 to 5.7 in the upper 0.3 m and dropped 0.4-0.8 units in deeper strata. Soil moisture content was always higher in the fallow plot than in the soya bean plot, reflecting the increased transpiration losses owing to the pres- ence of the crop.
308
TABLE I
Summary of soil characterization analyses a
Strata (m)
0.0-0.3 0.3-0.6 0.6-1.2 1.2-1.8
Mechanical analyses (wt.% sand, silt, clay) Pretreatment samples (4/16) 81,14,5
Organic matter (wt.%) Pretreatment samples (4/16)
59,14,27 5 4 , 1 2 , 3 4 56,15,29
0.90 0.34 0.26 0.10
Soil pH Pretreatment samples (4/16) 5.6 5.3 5.2 5.0 First sampling period (6/13)
Fallow plot 4.5 4.4 4.4 4.1 Soya bean plot 4.7 4.2 4.2 4.0
Second sampling period (7/18) Fallow plot 5.6 5.0 5.2 4.9 Soya bean plot 5.6 5.4 5.2 5.1
Third sampling period (9/17) Fallow plot 5.7 5.2 5.0 5.0 Soya bean plot 5.3 4.6 4.7 4.5
Soil water content (wt%) Pretreatment samples (4/16) 5.1 12.6 15.6 18.1 First sampling period (6/13)
Fallow plot 9.9 14.9 16.5 16.2 Soya bean plot 6.8 13.6 16.9 15.7
Second sampling period (7/18) Fallow plot 6.9 13.9 16.0 16.4 Soya bean plot 4.1 9.8 12.7 14.4
Third sampling period (9/17) Fallow plot 5.7 13.2 15.7 15.7 soya bean plot 4.9 11.0 13.1 14.4
aPretreatment values are the average of 4 analyses while later values are the average of 16 analyses.
Weather data
T h e a m o u n t of ra infa l l a n d p a n e v a p o r a t i o n m e a s u r e d be tween app l i ca t ion of a ld icarb a n d so i l - sampl ing per iods is s u m m a r i z e d in Tab l e II. P a n evapo- r a t ion da t a can be used to e s t i m a t e e v a p o t r a n s p i r a t i o n losses as a func t ion of soil t ype a n d ac tua l soil wa t e r con ten t . Ra in fa l l was a b o u t 40% below n o r m a l in M a y a n d a b o u t n o r m a l in J u n e a n d July .
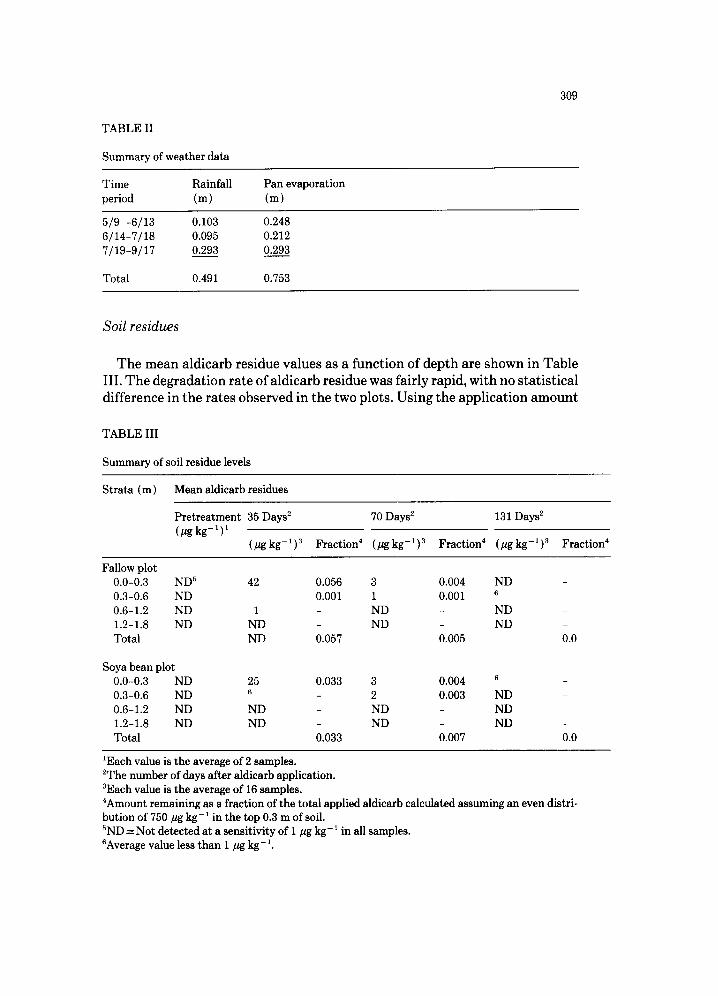
TABLE II
Summary of weather data
309
Time Rainfall Pan evaporat ion period (m) (m)
5 /9 -6 /13 0.103 0.248 6 / 1 4 - 7 / 1 8 0.095 0.212 7 /19 -9 /17 0.293 0.293
Total 0.491 0.753
Soil residues
The mean aldicarb residue values as a function of depth are shown in Table III. The degradation rate of aldicarb residue was fairly rapid, with no statistical difference in the rates observed in the two plots. Using the application amount
TABLE III
Summary of soil residue levels
St ra ta (m) Mean aldicarb residues
P re t r ea tmen t 35 Days 2 70 Days 2 131 Days 2 (#g k g - ' ) '
(#g kg-1) 3 Fract ion 4 ( # g k g - 1 ) 3 Fract ion 4 ( t t gkg-1 ) 3 Fract ion 4
Fallow plot 0.0-0.3 ND ~ 42 0.056 3 0.004 ND - 0.3-0.6 ND 0.001 1 0.001 6 _ 0.6-1.2 ND 1 ND ND - 1.2-1.8 ND ND ND ND - Total ND 0.057 0.005 0.0
Soya bean plot 0.0-0.3 ND 25 0.033 3 0.004 6 _ 0.3-0.6 ND s 2 0.003 ND - 0.6-1.2 ND ND ND ND - 1.2-1.8 ND ND ND ND - Total 0.033 0.007 0.0
'Each value is the average of 2 samples. 2The number of days after aldicarb application. 3Each value is the average of 16 samples. 4Amount remaining as a fract ion of the total applied aldicarb calculated assuming an even distri- but ion of 750 #g kg - ' in the top 0.3 m of soil. 5ND = Not detected a t a sensi t ivi ty of i #g kg - 1 in all samples. 6Average value less t h a n i ~g kg - '.
310
and the residue levels at the first two post-treatment soil-sampling periods, a half-life of 9 days was calculated with a 95% confidence interval of approxi- mately + 1 day. This degradation rate is more rapid than that measured in field studies in neighboring states (North Carolina, half-life of 39 days; Flor- ida, half-life of 17 days in surface soils; Georgia, half-life of 14 days (Jones, 1986a; R.F. Carsel, personal communication) ). Variations in soil constituents, agricultural practices and weather conditions are probably responsible for these differences in degradation rates. Degradation rates measured throughout the U.S.A. ranged from half-lives of 0.3 to 3.3 months (Jones, 1986a) with soil temperature appearing to be the dominant variable.
Field research (summarized by Jones, 1986c) has shown that the degrada- tion rate of aldicarb residues in the unsaturated zone does not usually change with depth (with the exception of areas in which subsoils are acidic, coarse sands as in Long Island and central Florida). Therefore, the half-life measured in this year is likely to be applicable to other years with different rainfall pat- terns and thus different depths of residue movement. This lack of significant changes in degradation rate with depth is consistent with laboratory studies which indicate that soil-catalyzed hydrolysis is the primary mechanism for degradation of aldicarb residues to non-carbamate compounds (Lightfood et al., 1987).
The rapid degradation rate observed in this study, limits the presence of aldicarb residues to the upper 0.3 m of soil. Average residue concentrations did not exceed 5 pg kg -1 below this depth at any sampling interval (Table III). Because of the rapid degradation rate, no significant downward movement was observed in either of the two plots so the effect of differences in evapotran- spiration losses on residue movement could not be demonstrated.
Soil suction lysimeters
Analysis of water samples from the soil suction lysimeters installed in the fallow plot confirm that residues are confined to the upper portion of the soil. Isolated low-level residues (maximum of 4 pg l-1) were detected in 6 of the 93 samples including one pretreatment sample. There was no pattern associated with these 6 which included samples from each of the 3 depths and each of the 3 rows. No residues were observed in samples collected 2 months after appli- cation. Since it is unlikely that even low-level residues will persist from year to year given the rapid rate of degradation, these residues are probably the results of contamination during sampling or shipping (early water samples were transferred to different bottles before shipment; also sample bottles were not re-used in later samples). Since residue levels in these samples were also confirmed by an alternate gas chromatography method with a Florisil cleanup step to remove potential interfering peaks, analytical error is a less likely explanation.
311
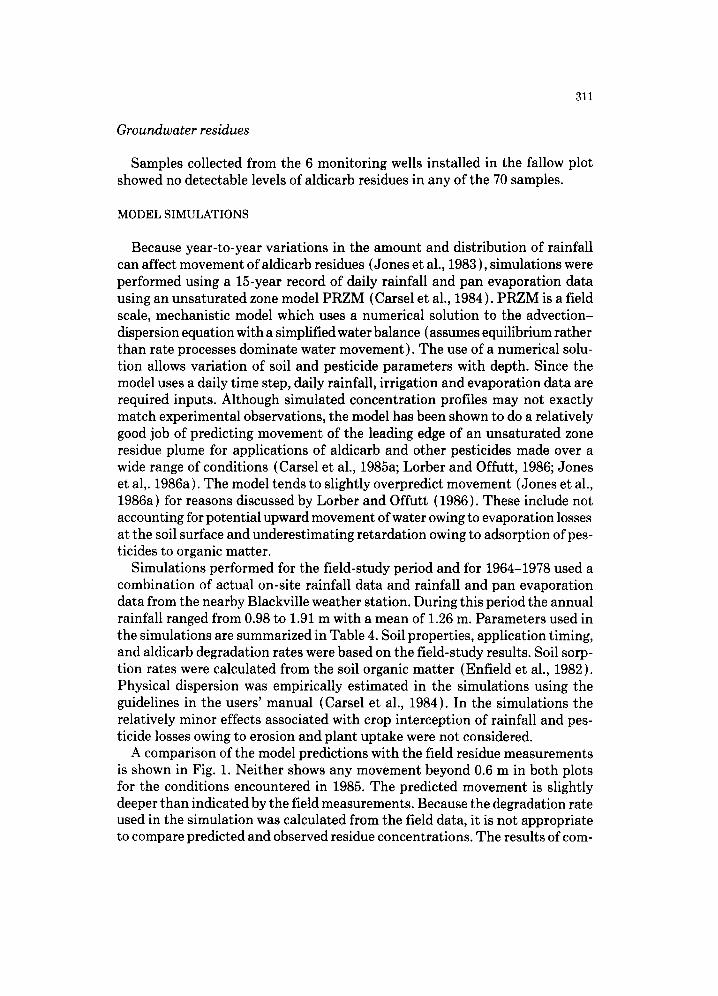
Groundwater residues
Samples collected from the 6 monitoring wells installed in the fallow plot showed no detectable levels of aldicarb residues in any of the 70 samples.
MODEL SIMULATIONS
Because year-to-year variations in the amount and distribution of rainfall can affect movement of aldicarb residues (Jones et al., 1983 ), simulations were performed using a 15-year record of daily rainfall and pan evaporation data using an unsaturated zone model PRZM (Carsel et al., 1984). PRZM is a field scale, mechanistic model which uses a numerical solution to the advection- dispersion equation with a simplified water balance (assumes equilibrium rather than rate processes dominate water movement) . The use of a numerical solu- tion allows variation of soil and pesticide parameters with depth. Since the model uses a daily time step, daily rainfall, irrigation and evaporation data are required inputs. Although simulated concentration profiles may not exactly match experimental observations, the model has been shown to do a relatively good job of predicting movement of the leading edge of an unsaturated zone residue plume for applications of aldicarb and other pesticides made over a wide range of conditions (Carsel et al., 1985a; Lorber and Offutt, 1986; Jones et al,. 1986a). The model tends to slightly overpredict movement (Jones et al., 1986a) for reasons discussed by Lorber and Offutt (1986). These include not accounting for potential upward movement of water owing to evaporation losses at the soil surface and underestimating retardation owing to adsorption of pes- ticides to organic matter.
Simulations performed for the field-study period and for 1964-1978 used a combination of actual on-site rainfall data and rainfall and pan evaporation data from the nearby Blackville weather station. During this period the annual rainfall ranged from 0.98 to 1.91 m with a mean of 1.26 m. Parameters used in the simulations are summarized in Table 4. Soil properties, application timing, and aldicarb degradation rates were based on the field-study results. Soil sorp- tion rates were calculated from the soil organic matter (Enfield et al., 1982). Physical dispersion was empirically estimated in the simulations using the guidelines in the users' manual {Carsel et al., 1984). In the simulations the relatively minor effects associated with crop interception of rainfall and pes- ticide losses owing to erosion and plant uptake were not considered.
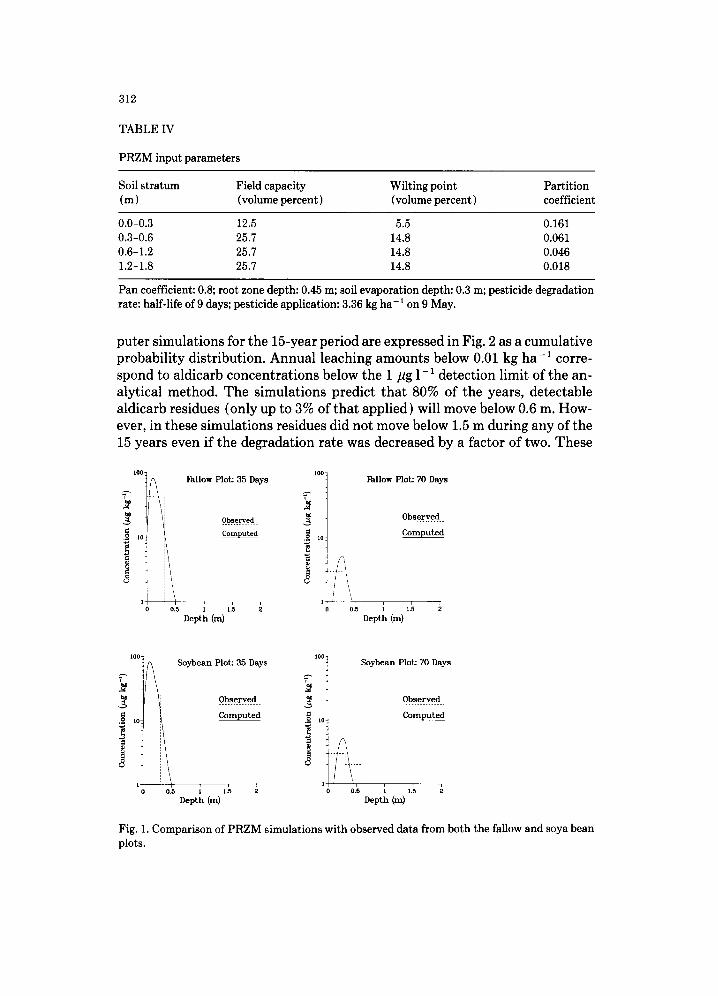
A comparison of the model predictions with the field residue measurements is shown in Fig. 1. Neither shows any movement beyond 0.6 m in both plots for the conditions encountered in 1985. The predicted movement is slightly deeper than indicated by the field measurements. Because the degradation rate used in the simulation was calculated from the field data, it is not appropriate to compare predicted and observed residue concentrations. The results of com-
312
TABLE IV
PRZM input parameters
Soil stratum Field capacity Wilting point (m) (volume percent ) (volume percent )
Partition coefficient
0.0-0.3 12.5 5.5 0.161 0.3-0.6 25.7 14.8 0.061 0.6-1.2 25.7 14.8 0.046 1.2-1.8 25.7 14.8 0.018
Pan coefficient: 0.8; root zone depth: 0.45 m; soil evaporation depth: 0.3 m; pesticide degradation rate: half-life of 9 days; pesticide application: 3.36 kg ha-1 on 9 May.
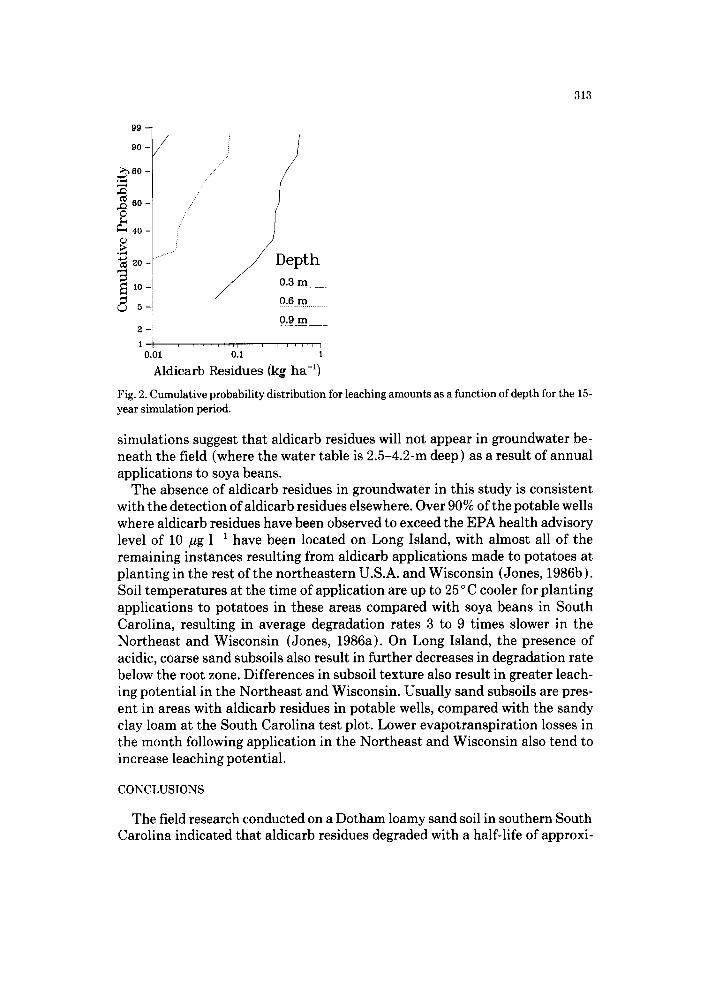
puter simulations for the 15-year period are expressed in Fig. 2 as a cumulative probability distribution. Annual leaching amounts below 0.01 kg ha-1 corre- spond to aldicarb concentrations below the 1/~g l - 1 detection limit of the an- alytical method. The simulations predict that 80% of the years, detectable aldicarb residues (only up to 3% of that applied) will move below 0.6 m. How- ever, in these simulations residues did not move below 1.5 m during any of the 15 years even if the degradation rate was decreased by a factor of two. These
100:
0 [0
,i I 0 0 .5
Fallow Plot: 35 Days
Observed
Computed
100=
T
0 i0
Fallow Plot: 70 Days
Observed
Computed
i L~ ~ 0:5 i I.~ Depth(m) Depth(m)
I00=
<
1 0 0.5
Soybean Plot: 35 Days
Observed
Computed
100:
. o~ 10
Soybean Plot: 70 Days
Observed
Computed
Depth(m) Depth(m)
Fig. 1. Comparison of PRZM simulations with observed data from both the fallow and soya bean plots.
313
99-
/ 90 - /
~80 -
.~0 60-
• . . . . . . . . . .
"~ 20
2 1
0.01
/ // /"/////
th
0.3 m
0.6 m
0.9 m
....... o:i ........ i
Aldicarb Residues (kg ha -1)
Fig. 2. Cumulative probability distribution for leaching amounts as a function of depth for the 15- year simulation period.
simulations suggest that aldicarb residues will not appear in groundwater be- neath the field (where the water table is 2.5-4.2-m deep ) as a result of annual applications to soya beans.
The absence of aldicarb residues in groundwater in this study is consistent with the detection of aldicarb residues elsewhere. Over 90% of the potable wells where aldicarb residues have been observed to exceed the EPA health advisory level of 10 ~g l-1 have been located on Long Island, with almost all of the remaining instances resulting from aldicarb applications made to potatoes at planting in the rest of the northeastern U.S.A. and Wisconsin (Jones, 1986b). Soil temperatures at the time of application are up to 25 o C cooler for planting applications to potatoes in these areas compared with soya beans in South Carolina, resulting in average degradation rates 3 to 9 times slower in the Northeast and Wisconsin (Jones, 1986a). On Long Island, the presence of acidic, coarse sand subsoils also result in further decreases in degradation rate below the root zone. Differences in subsoil texture also result in greater leach- ing potential in the Northeast and Wisconsin. Usually sand subsoils are pres- ent in areas with aldicarb residues in potable wells, compared with the sandy clay loam at the South Carolina test plot. Lower evapotranspiration losses in the month following application in the Northeast and Wisconsin also tend to increase leaching potential.
CONCLUSIONS
The field research conducted on a Dotham loamy sand soil in southern South Carolina indicated that aldicarb residues degraded with a half-life of approxi-
314
mately 9 days. As a result of the relatively rapid degradation rate, most residues were observed in the upper 0.3 m of soil, with no aldicarb residues detected below 0.6 m. Model simulations suggest that movement of aldicarb residues in this soil should be limited to the upper 1.5 m, regardless of year-to-year vari- ations in rainfall.
REFERENCES
Brasino, J.S. and Hoopes, J.A., 1985. Comparison of unsaturated zone movement between tracer potassium bromide and pesticide aldicarb. Proceedings of the Characterization and Monitor- ing of the Vadose (Unsaturated) Zone, Denver, 19-21 November National Water Well Association.
Carsel, R.F., Mulkey, L.A., Lorber, M.N. and Baskin, L.B., 1985a. The pesticide root zone model (PRZM): A procedure for evaluating pesticide leaching threats to groundwater Ecol. Modell- ing, 30: 49-69.
Carsel, R.F., Smith, C.N., Mul.key, L.A., Dean, J.D. and Jowise, P., 1984. Users Manual for the Pesticide Root Zone Model (PRZM) Release 1. EPA-600/3-84-109.
Carsel, R.F., Smith, C.N., Parrish, R.S., Mulkey, L.A. and Payne Jr., W.R., 1985b. Design of a Field Study to Evaluate Spatial Variability of Pesticide Leaching in Agricultural Soils. ACS Symposium on Evaluation of Pesticides in Groundwater, Miami Beach, 28 April-1 May. ACS Division of Pesticide Chemistry Abstract No. 22.
Enfield, C.G., Carsel R.F., Cohen, S.Z., Phan, T. and Waiters, D.M., 1982. Approximating pollu- tant transport to ground water. Ground Water, 6" 711-722.
Hornsby, A.G., Rao, P.S.C., Wheeler, W.B., Nkedi-Kizza, P. and Jones, R.L., 1983. Fate of aldi- carb in Florida citrus soils: 1. Field and laboratory studies. In: D.M. Nielson and M. Curl (Editors), Proceedings of the Characterizaton and Monitoring of the Va dose (Unsaturated) Zone, Las Vegas, 8-10 December. National Water Well Association, Worthington, OH, pp. 936- 958.
Jones, R.L., 1986a. Field, laboratory, and modeling studies on the degradation and transport of aldicarb residues in soil and groundwater. Evaluation of pesticides in groundwater. In: W.Y. Garner, R.C. Honeycutt and H.N. Niggs (Editors), ACS Symposium Series, 315: 197-215.
Jones, R.L., 1986b. The Aldicarb Experience. Soil Science Society of America Workshop on Per- spectives on the Contamination of groundwater for Agriculture, 5-6 Dec.; New Orleans.
Jones, R.L. and Back, R.C., 1984. Monitoring aldicarb residues in Florida soil and water. Environ. Toxicol. Chem., 3" 9-20.
Jones, R.L., Rao, P.S.C. and Hornsby, A.G., 1983. Fate of aldicarb in Florida citrus soil: 2. Model evaluation. In: D.M. Nielson and M. Curl (Editors), Proceedings of the characterization and Monitoring of the Vadose (Unsaturated) Zone, Las Vegas, 8-10 December. National Water Well Association, Worthington, OH, pp. 959-979.
Jones, R.L., Black, G.W. and Estes, T.L., 1986a. Comparison of computer model predictions with unsaturated zone field data for aldicarb and aldoxycarb. Environ. Toxicol. Chem., 5: 1027- 1037.
Jones, R.L., Rourke, R.V. and Hansen, J.L., 1986b. Effect of application methods on movement and degradation of aldicarb residues in Maine potato fields. Environ. Toxicol. Chem., 5: 167- 173.
Jones, R.L., Hansen, J.L., Romine R.R. and Marquardt, T.E., 1986c. Unsaturated zone studies on the degradation and movement of aldicarb and aldoxycarb residues. Environ. Toxicol. Chem., 5: 361-372.
Krause, R.T., 1979. Resolution, sensitivity and selectivity of a high-performance liquid chromat-
315
ographic post-column fluorometric labeling technique for determination of carbamate insec- ticides. J. Chromatogr., 185: 615-626.
Lightfoot, E.N., Thorne, P.S. Jones, R.L., Hansen, J.L. and Romine, R.R., 1987. Laboratory studies on mechanism for the degradation of aldicarb, aldicarb sulfoxide, and aldicarb sulfone. Environ. Toxicol. Chem., 6: 377-394.
Lorber, M.N. and Offutt, C.K., 1986. A method for the assessment of groundwater contamination potential utilizing PRZM. A pesticide root zone model for the unsaturated zone In: W.Y. Gar- ner, R.C. Honeycutt and H.N. Nigg, (Editors), Evaluation of Pesticides in Groundwater. ACS Symposium Series 315: 342-365.
Zaki, M.H., Moran, D. and Harris, D., 1982. Pesticides in groundwater: The aidicarb story in Suffolk county, NY. Am. J. Public Health., 72: 1391-1395.