move congress 2015: the fastest growing physical activity trend - running
TRANSCRIPT
MOVE 2015 Congress
Copenhagen
Jeroen ScheerderUniversity of Leuven
i.c.w. Koen Breedveld (Mulier Institute)and Julie Borgers (Univ of Leuven)
EUROPE ON THE MOVE TO RUNTHE RISE AND SIZE OF ONE OF THE MOST POPULAR PHYSICAL
LEISURE ACTIVITIES

Introduction
• In Europe/worldwide leisure-time running
= very popular PA
• Lack of international and cross-national
data/comparisons, esp. time trend data
• Lack of studies on running from a
governance perspective
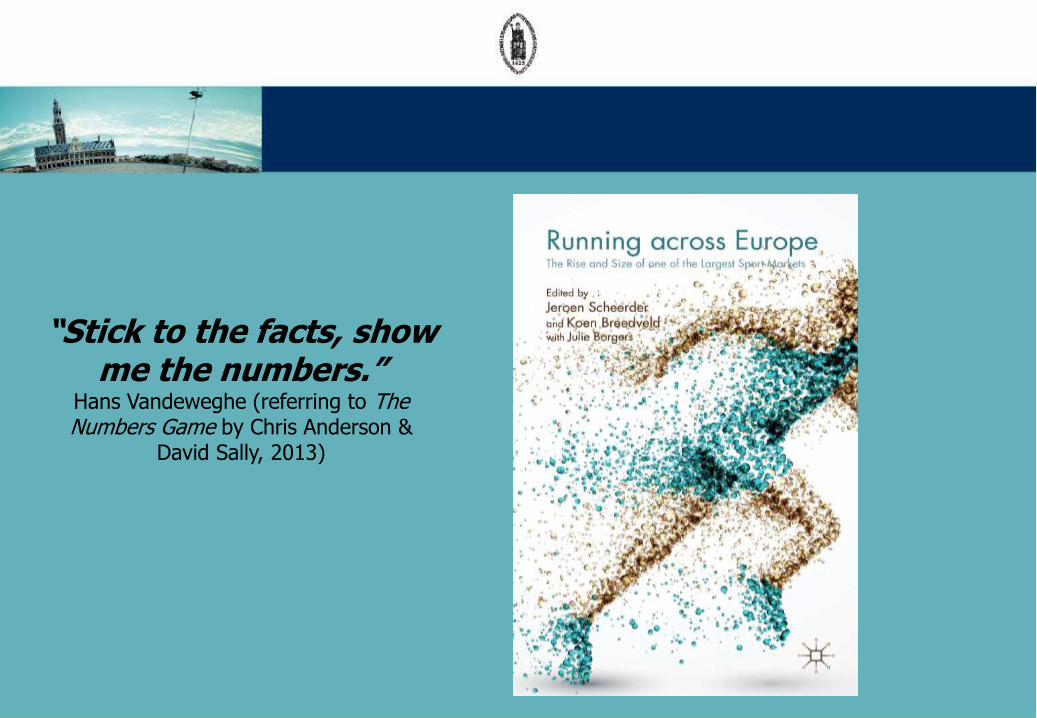
“Stick to the facts, show me the numbers.”
Hans Vandeweghe (referring to The Numbers Game by Chris Anderson &
David Sally, 2013)
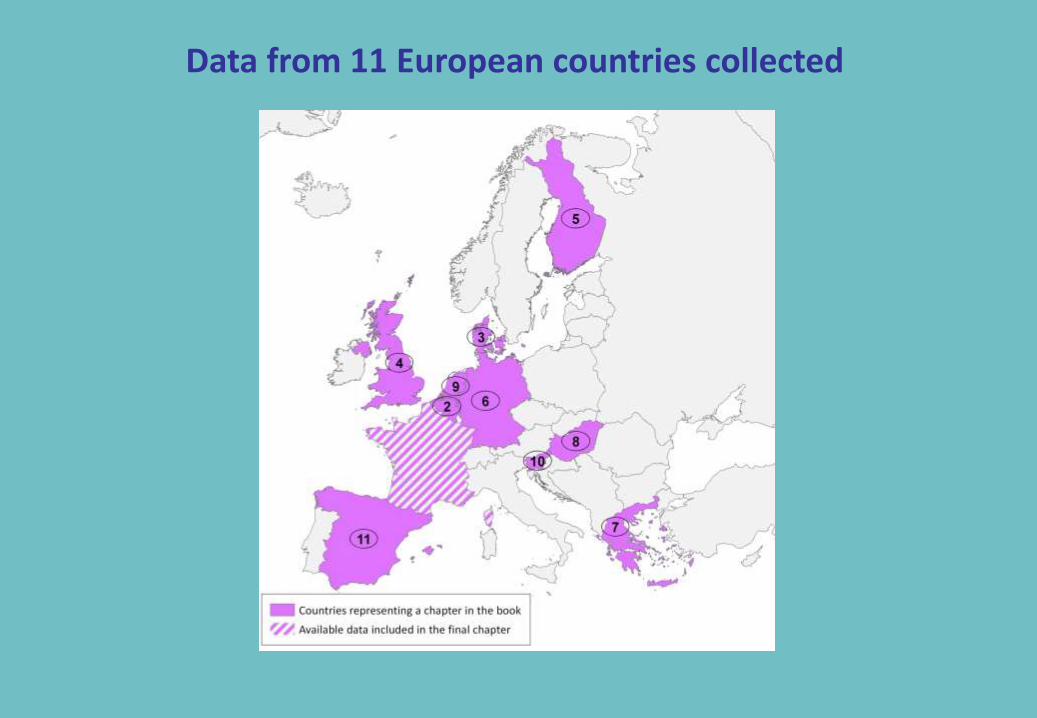
Data from 11 European countries collected
Participatory level

0
200,000
400,000
600,000
800,000
1,000,000
1,200,000
1,400,000
1,600,000
1,800,000
19
60
19
62
19
64
19
66
19
68
19
70
19
72
19
74
19
76
19
78
19
80
19
82
19
84
19
86
19
88
19
90
19
92
19
94
19
96
19
98
20
00
20
02
20
04
20
06
20
08
20
10
20
12
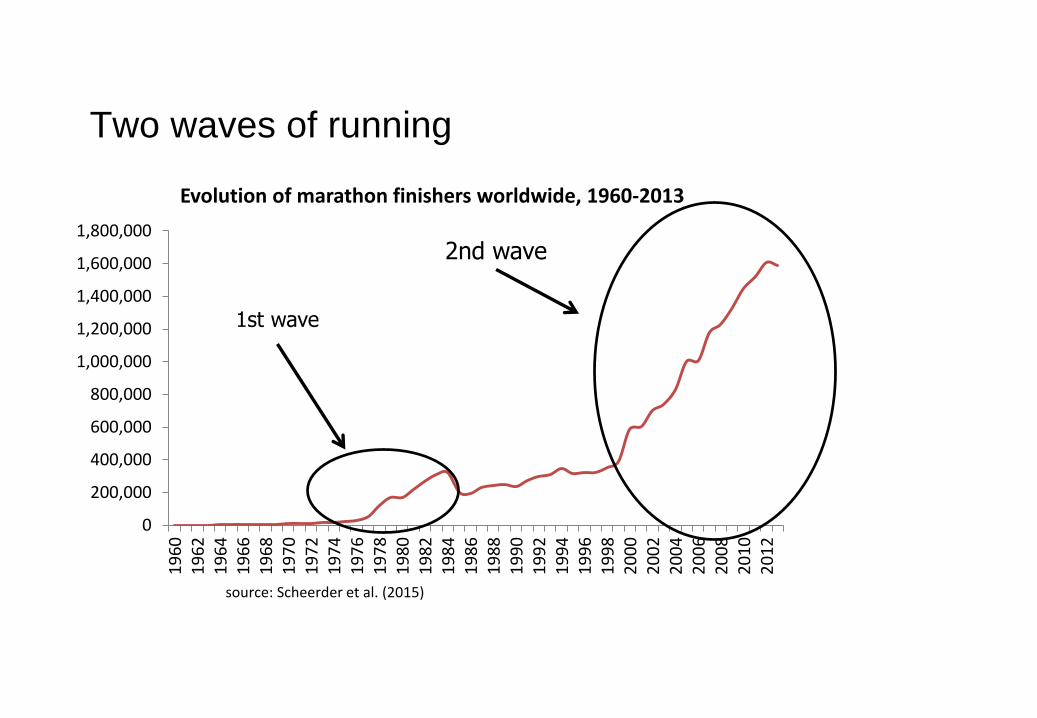
Evolution of marathon finishers worldwide, 1960-2013
source: Scheerder et al. (2015)
Two waves of running
1st wave
0
200,000
400,000
600,000
800,000
1,000,000
1,200,000
1,400,000
1,600,000
1,800,000
19
60
19
62
19
64
19
66
19
68
19
70
19
72
19
74
19
76
19
78
19
80
19
82
19
84
19
86
19
88
19
90
19
92
19
94
19
96
19
98
20
00
20
02
20
04
20
06
20
08
20
10
20
12
Evolution of marathon finishers worldwide, 1960-2013
source: Scheerder et al. (2015)
Two waves of running
1st wave
2nd wave

0
200,000
400,000
600,000
800,000
1,000,000
1,200,000
1,400,000
1,600,000
1,800,000
2001 2002 2003 2004 2005 2006 2007 2008 2009 2010 2011 2012
Evolution of finishers at 20 largest road races worldwide, 2001-2012
source: Scheerder et al. (2015)
0
100,000
200,000
300,000
400,000
500,000
600,000
700,000
19
60
19
62
19
64
19
66
19
68
19
70
19
72
19
74
19
76
19
78
19
80
19
82
19
84
19
86
19
88
19
90
19
92
19
94
19
96
19
98
20
00
20
02
20
04
20
06
20
08
20
10
20
12
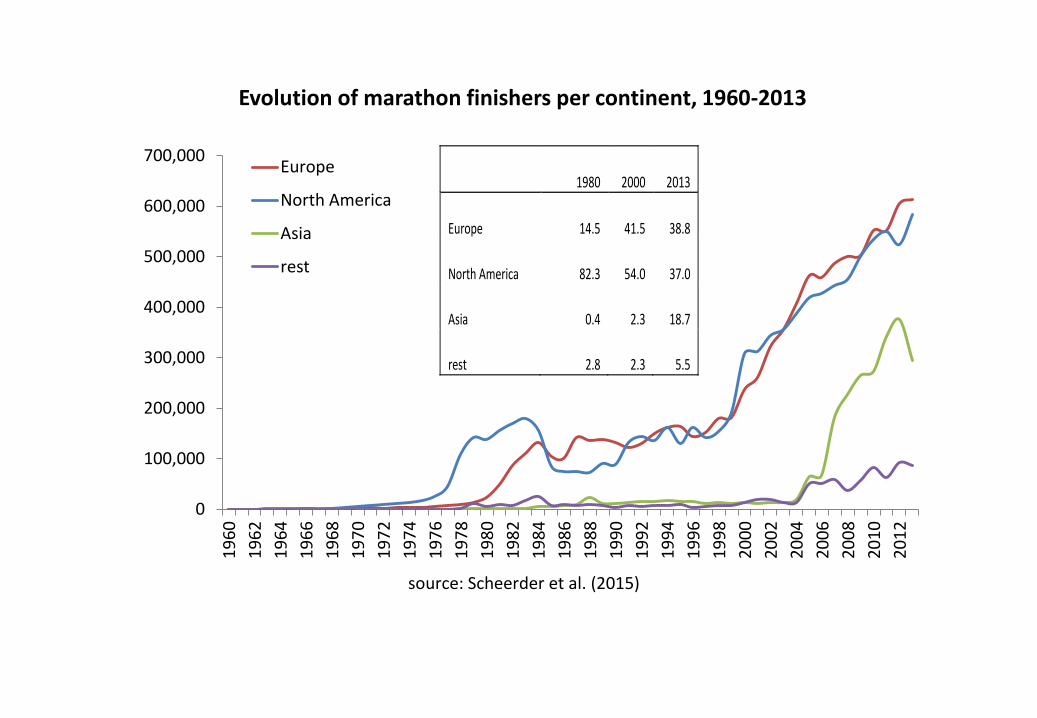
Evolution of marathon finishers per continent, 1960-2013
Europe
North America
Asia
rest
source: Scheerder et al. (2015)
1980 2000 2013
Europe 14.5 41.5 38.8
North America 82.3 54.0 37.0
Asia 0.4 2.3 18.7
rest 2.8 2.3 5.5
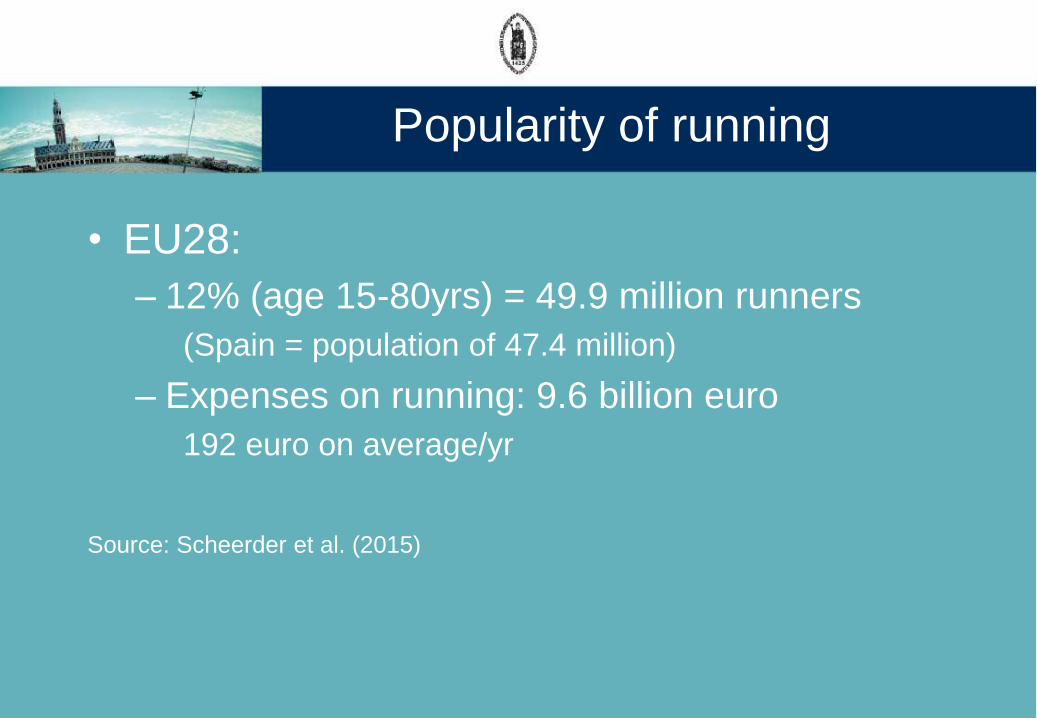
Popularity of running
• EU28:
– 12% (age 15-80yrs) = 49.9 million runners
(Spain = population of 47.4 million)
– Expenses on running: 9.6 billion euro
192 euro on average/yr
Source: Scheerder et al. (2015)

Popularity of running across EU28
countries
EU28 member state Runners (% of population)
Denmark 31
Germany 25
Belgium, France, Luxembourg 19
Netherlands 18
Austria, Finland, Sweden 15
Slovenia 12
Estonia, Hungary, Ireland, Malta, Poland 10
Other EU28 member states <10
Source: Scheerder et al. (2015)

Popularity of running
• 3 phases in popularisation of running
– Pre-1st wave:
• Running only practiced in a private T&F club
• Running in public was ‘unworldly’
• Processes of informalisation and de-
institutionalisation
– 1960s-1980s (wave 1)
• Cultural and fitness revolution
– 1990s-present (wave 2)
• Social revolution (females, elderly)

3rd wave of running?

New segments

New running products
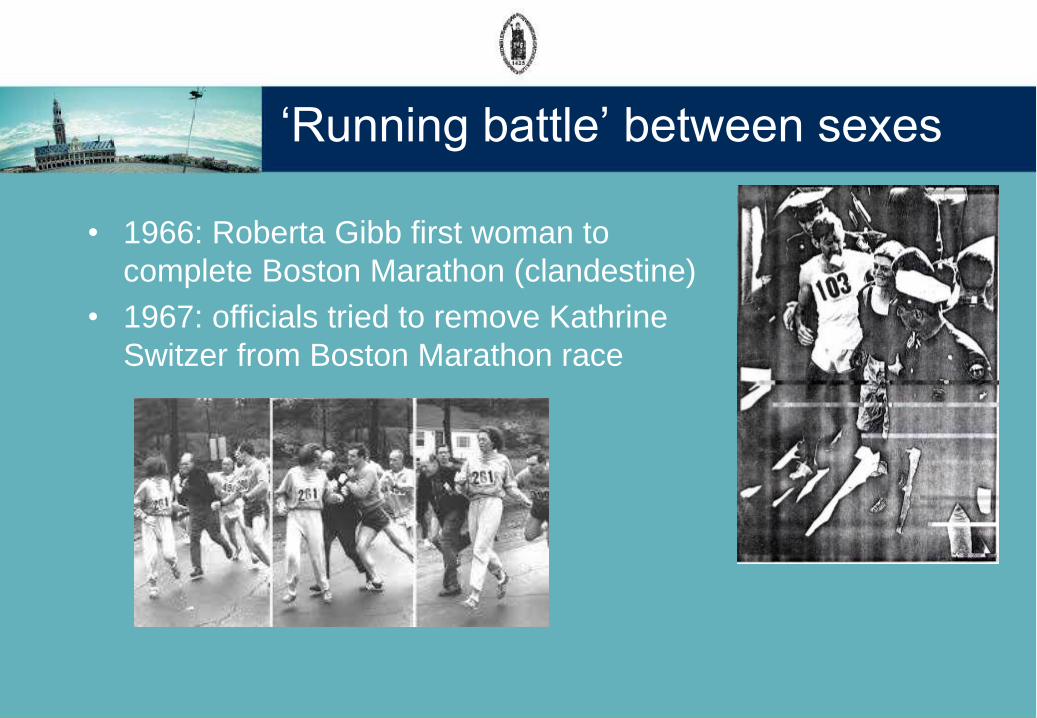
‘Running battle’ between sexes
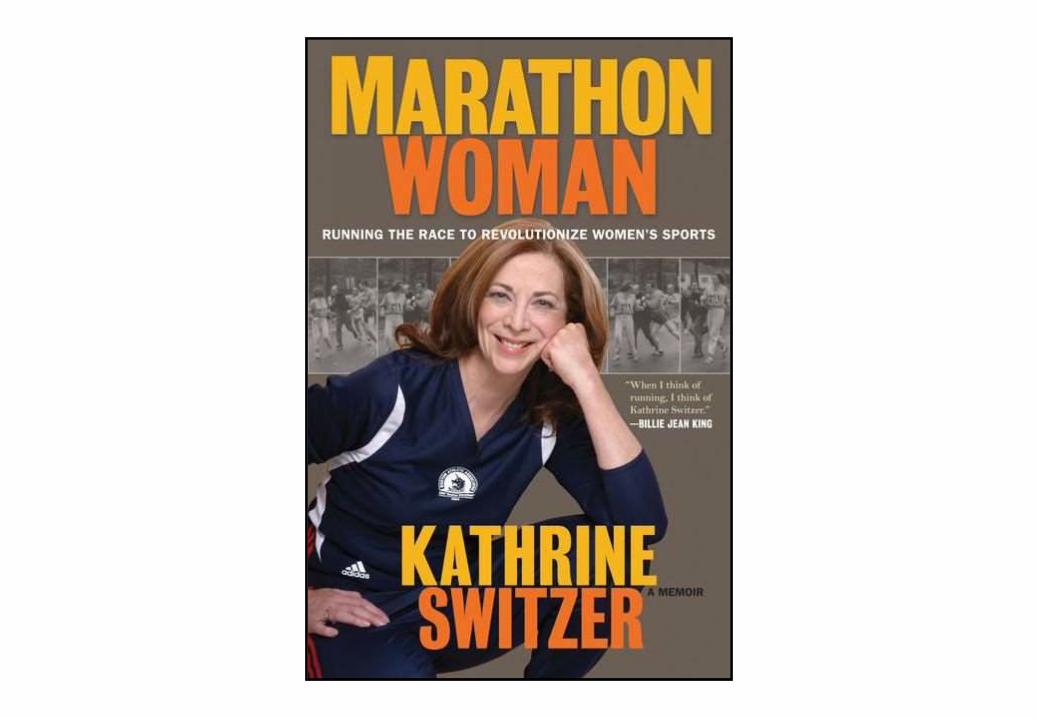
• 1966: Roberta Gibb first woman to
complete Boston Marathon (clandestine)
• 1967: officials tried to remove Kathrine
Switzer from Boston Marathon race

• 1984: first marathon at Olympics for women
Joan Benoit winning the LA Olympic marathon
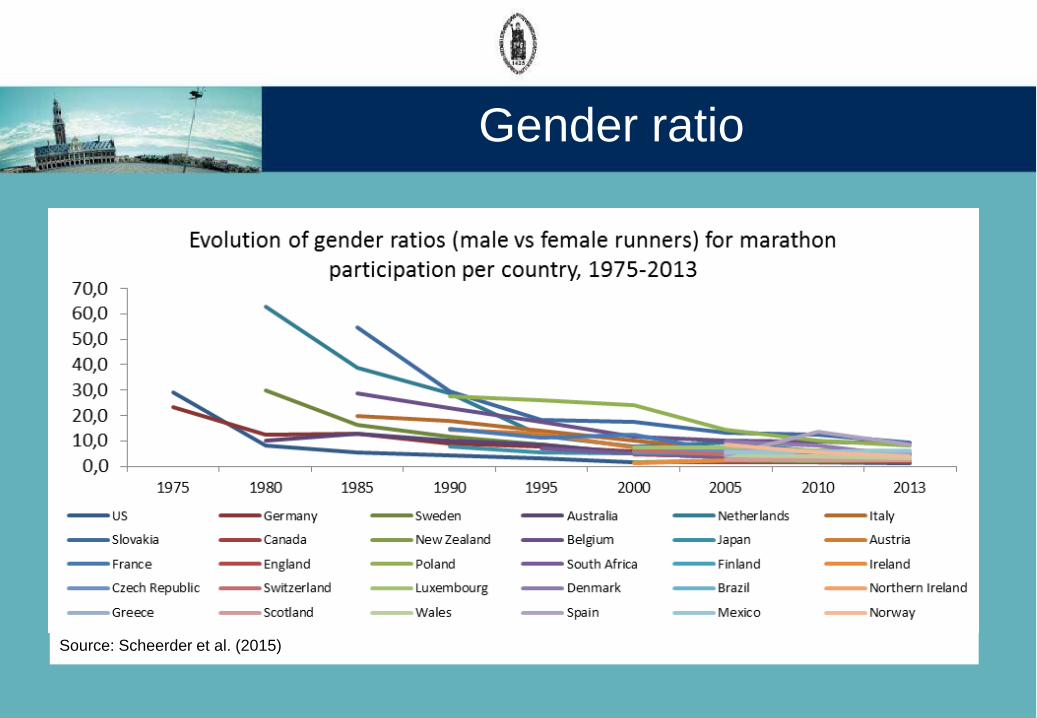
Gender ratio
Source: Scheerder et al. (2015)

Age
Table 12.1 Age groups with highest levels of running participants
Denmark 20-39
Greece * 30-39
Hungary * 30-39
Netherlands 35-49
Slovenia * 31-40
Spain 25-34
UK 26-29
Belgium (Flanders) 40-49
* Statistics for a specific running event; all other data come from population surveys.
Source: Scheerder et al. (2015)

Level of education
Participation in running by level of education (indices, lowest level of education = 100), in six
European countries, 2009-2013
-
100
200
300
400
500
600
Denmark Germany Netherlands * Spain Belgium(Flanders)
UK **
Lowest Highest
Source: Scheerder et al. (2015)
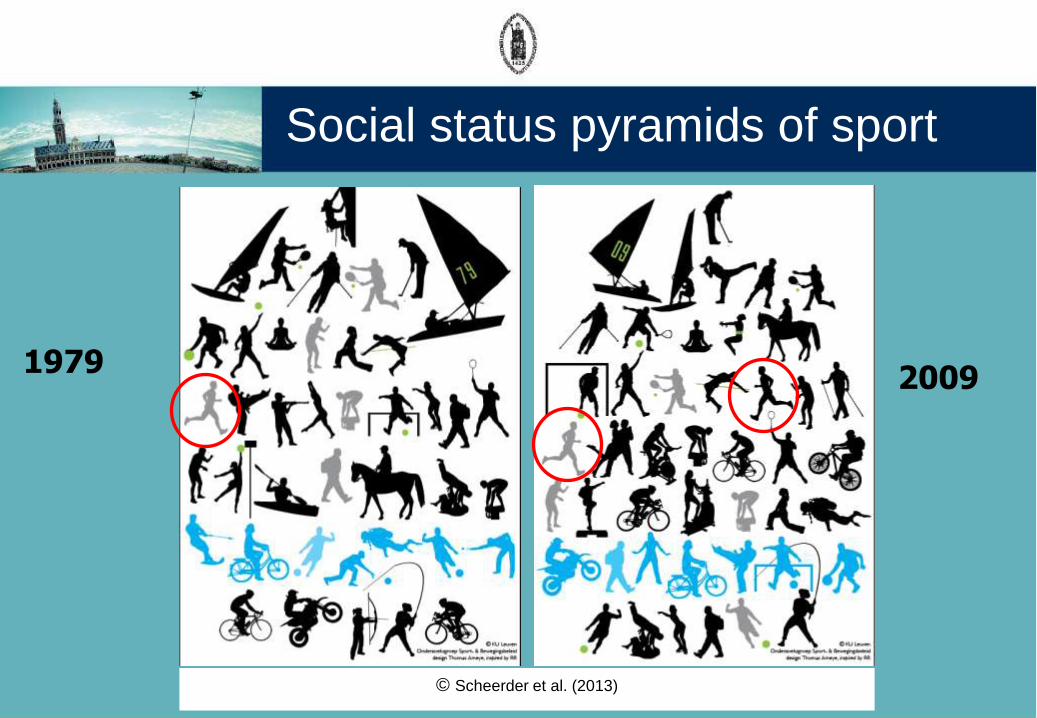
© Scheerder et al. (2013)
Social status pyramids of sport
19792009

Organisational level

Popularity of running: two waves of
running
Evolution of N of marathon events/finishers worldwide (1960-2013)
Source: Scheerder et al. (2015)

Non-membership of formal running-clubs, in eight European countries, in percentages of runners
8893 95 94
60
80
93 96
0
20
40
60
80
100
120
Non club
Belgium (Flanders)
Denmark
France *
Germany
Greece **
Hungary **
Netherlands
UK
Source: Scheerder et al. (2015)

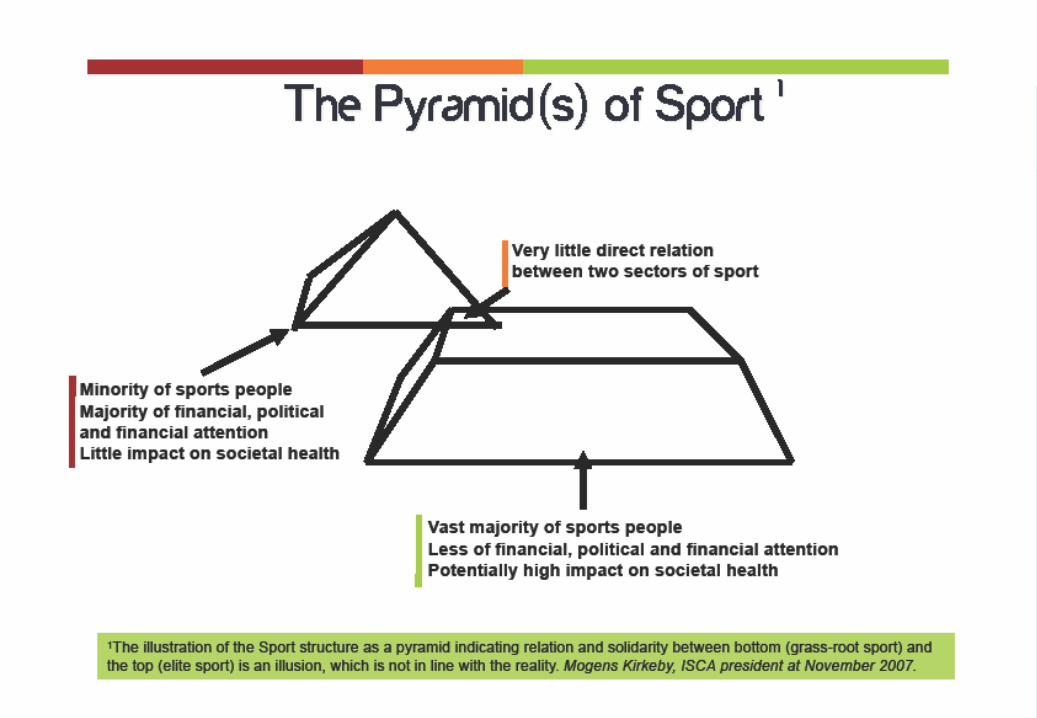
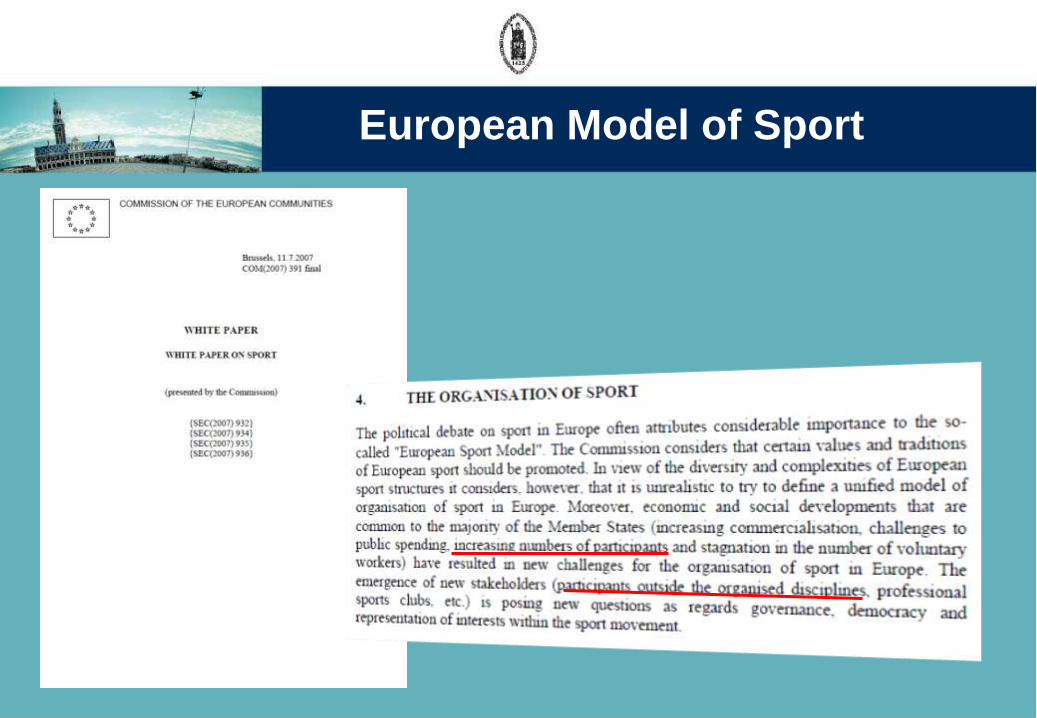
European Model of Sport
Source: European Commission (1999)

European Model of Sport
1998

Pyramid model
(Eichberg, 2008):
- monopolistic
- centralistic
- hierarchical
model of competition
model of organisation
CLAIM OF POWER
Eichberg (2008):
“The description of the
world of sports by
applying the pyramid
model doesn’t take into
account the existence of
a rich spectrum of
[sport] practice all over
Europe.”
e.g.: street soccer,
dance, outdoor
activities, jogging, city
runs, recreational
walking, etc.
European Model of Sport

From pyramid model to church model
ELITE SPORT
COMPETITIVE SPORT
RECREATIONAL SPORT
COMPETITIVE SPORT
=
PERFORMANCE SPORT
RECREATIONAL SPORT
=
PARTICIPATION SPORT
ELITE SPORT
COMPETITIVE SPORT
AT HIGH LEVEL
Source: Scheerder (2007)

Church model of sport applied to running
Source: Scheerder (2015)
• Church model not only conceptual
framework
• Useful from governance perspective also
• Which agent governs the world of running?
• IAAF
– For long time ignored mass running
– Athletic associations and federations ‘missed
the boat’ (Van Bottenburg et al., 2010)

Two possible models for governing
running
• Model 1:
– IAAF/EAA as natural running authority
– Not only for T&F, but including mass running
– Regain of market share is needed
– Promising example: World Half Marathon
Championship in April 2014 not only elite athletes
participating!
“The fun is in the back of the pack.”
or
“Slow is the new fast.”
• Model 2: Multi-governance structure
– IAAF/EAA competition
– Sport for All organisations recreational
– EU, WHO socio-cultural and health values
Private and public organisations
Tripartite model (cf. Eichberg, 2008)
To represent diversity of running
Partnerships with road running industry
needed!
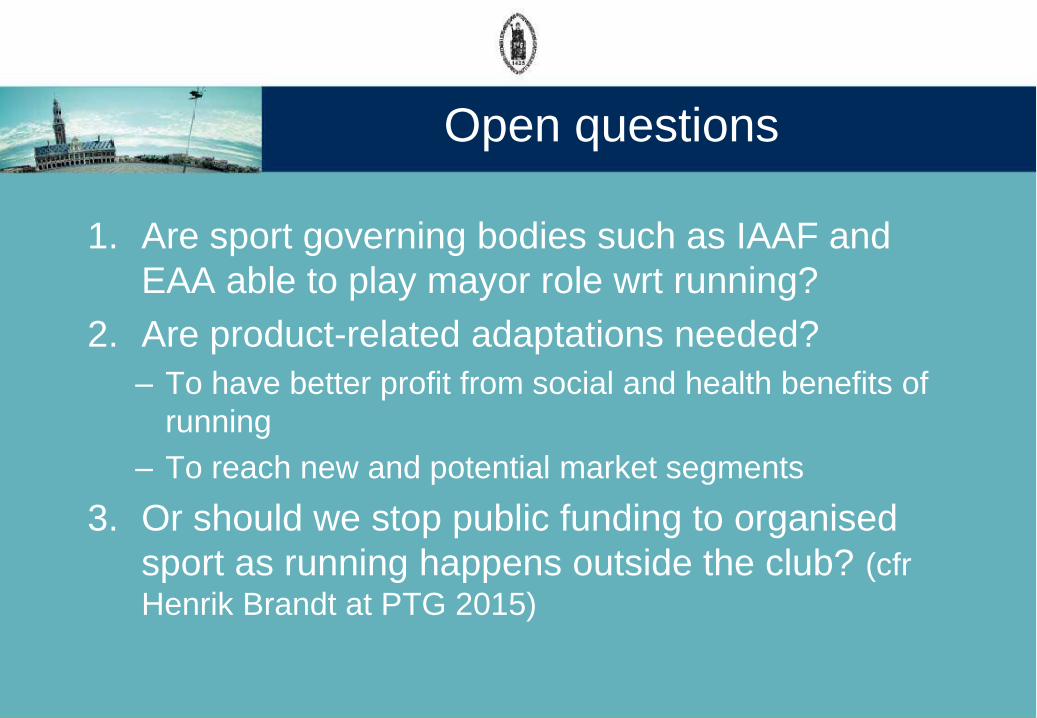
Open questions
1. Are sport governing bodies such as IAAF and
EAA able to play mayor role wrt running?
2. Are product-related adaptations needed?
– To have better profit from social and health benefits of
running
– To reach new and potential market segments
3. Or should we stop public funding to organised
sport as running happens outside the club? (cfr
Henrik Brandt at PTG 2015)


- First woman to participate the a marathon as a numbered entry- Race officials attempted to remove her from the 1967 Boston Marathon- Kathrine Switzer succeeded and finished

Boston Marathon Explosions, 14th April 2013 Patriot’s Day
People running for their lives ...
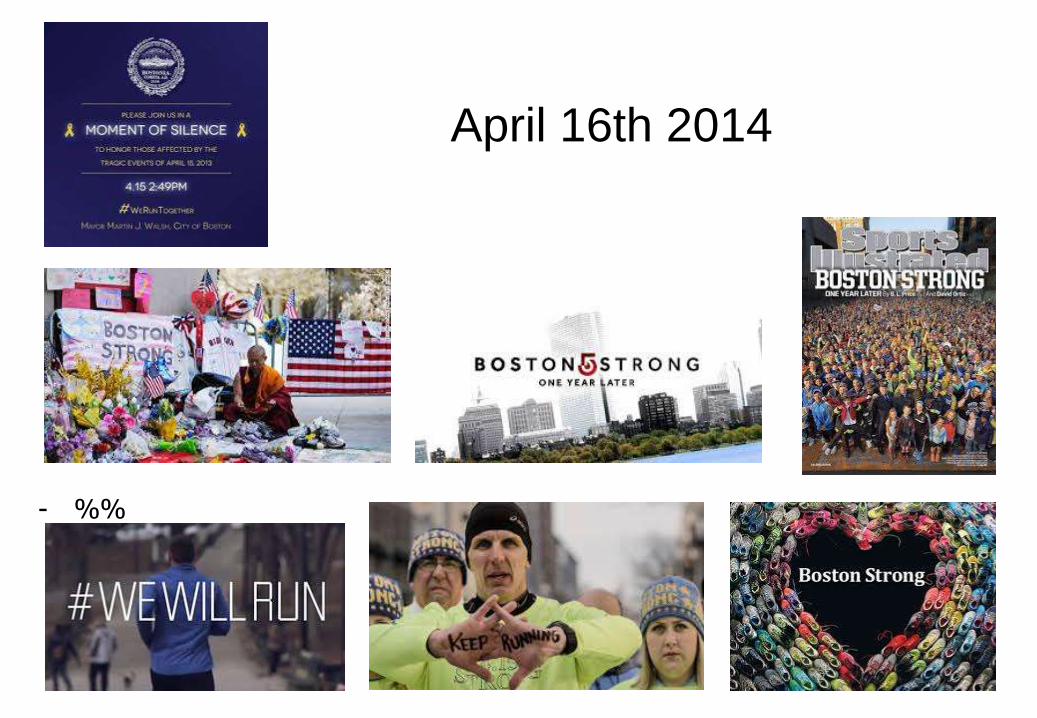
April 16th 2014
- %%

April 13th 2014
- Runners from 27 countries took part- Accompanied by patriotic music, but no brands, cameras, flags, etc.- Crowd of 42,000 spectators at Kim Il-sung stadium