motilal oswal financial services...
TRANSCRIPT
Motilal Oswal Financial Services Ltd
Investor Presentation | Dec 2015
Bloomberg: MOFS:IN ● Reuters: MOFS.BO ● www.motilaloswal.com
Efforts into building competencies & capabilities leading to tangible business results
Group’s Evolution
Strategic Imperatives
Performance against Strategy
Industry Trends & the Savings Story
Presentation Plan
Group’s Evolution - from a pure brokerage into a financial services firm
Strategic Imperatives
Performance against Strategy
Industry Trends & the Savings Story
Presentation Plan
Synopsis
Data as on Dec 2015* through Motilal Oswal Securities Limited
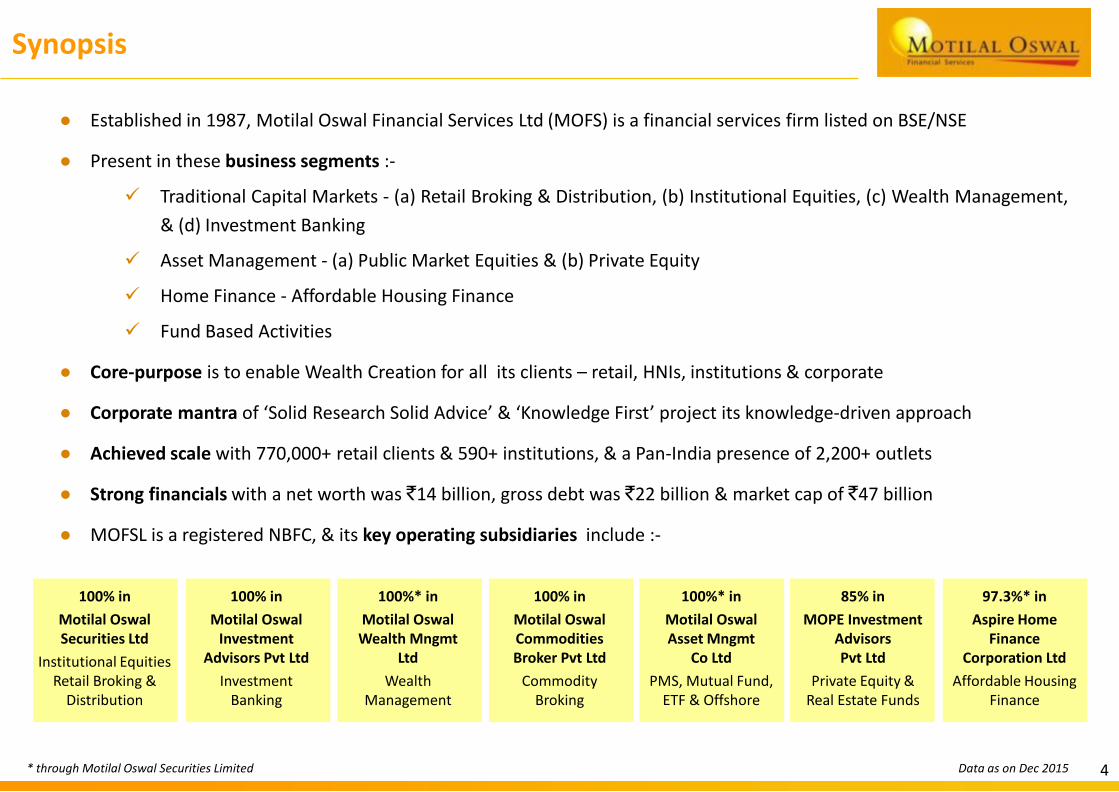
● Established in 1987, Motilal Oswal Financial Services Ltd (MOFS) is a financial services firm listed on BSE/NSE
● Present in these business segments :-
Traditional Capital Markets - (a) Retail Broking & Distribution, (b) Institutional Equities, (c) Wealth Management,
& (d) Investment Banking
Asset Management - (a) Public Market Equities & (b) Private Equity
Home Finance - Affordable Housing Finance
Fund Based Activities
● Core-purpose is to enable Wealth Creation for all its clients – retail, HNIs, institutions & corporate
● Corporate mantra of ‘Solid Research Solid Advice’ & ‘Knowledge First’ project its knowledge-driven approach
● Achieved scale with 770,000+ retail clients & 590+ institutions, & a Pan-India presence of 2,200+ outlets
● Strong financials with a net worth was `14 billion, gross debt was `22 billion & market cap of `47 billion
● MOFSL is a registered NBFC, & its key operating subsidiaries include :-
100% in
Motilal Oswal Securities Ltd
Institutional EquitiesRetail Broking &
Distribution
100% in
Motilal Oswal Investment
Advisors Pvt Ltd
Investment Banking
100%* in
Motilal Oswal Wealth Mngmt
Ltd
Wealth Management
100%* in
Motilal Oswal Asset Mngmt
Co Ltd
PMS, Mutual Fund, ETF & Offshore
85% in
MOPE Investment Advisors Pvt Ltd
Private Equity & Real Estate Funds
97.3%* in
Aspire Home Finance
Corporation Ltd
Affordable Housing Finance
100% in
Motilal Oswal Commodities Broker Pvt Ltd
Commodity Broking
4
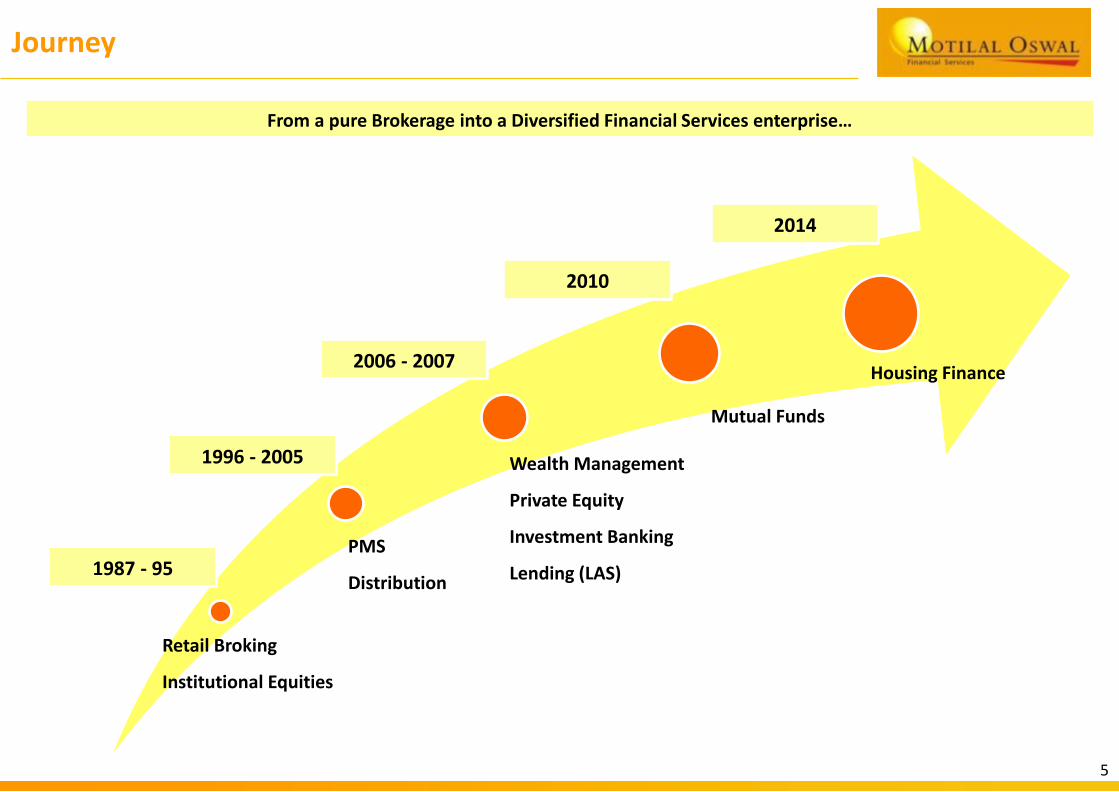
Journey
5
Retail Broking
Institutional Equities
PMS
Distribution
Wealth Management
Private Equity
Investment Banking
Lending (LAS)
Mutual Funds
Housing Finance
1987 - 95
2006 - 2007
1996 - 2005
2014
2010
From a pure Brokerage into a Diversified Financial Services enterprise…
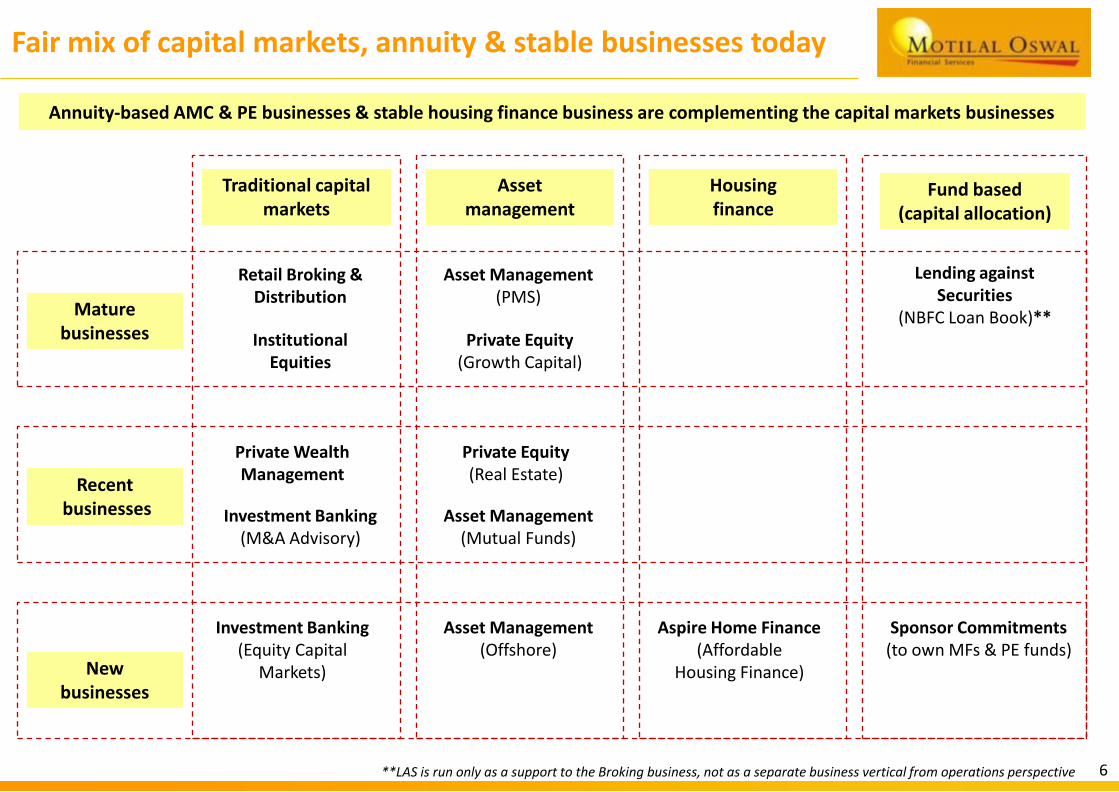
Fair mix of capital markets, annuity & stable businesses today
Aspire Home Finance (Affordable
Housing Finance)
Asset Management (PMS)
Asset Management (Mutual Funds)
Private Equity (Real Estate)
Private Wealth Management
Retail Broking & Distribution
Institutional Equities
Investment Banking (M&A Advisory)
Investment Banking (Equity Capital
Markets)
6
Mature businesses
Recentbusinesses
Housing finance
Asset management
Traditional capital markets
Asset Management (Offshore)
New businesses
**LAS is run only as a support to the Broking business, not as a separate business vertical from operations perspective
Private Equity (Growth Capital)
Fund based (capital allocation)
Lending against Securities
(NBFC Loan Book)**
Sponsor Commitments (to own MFs & PE funds)
Annuity-based AMC & PE businesses & stable housing finance business are complementing the capital markets businesses
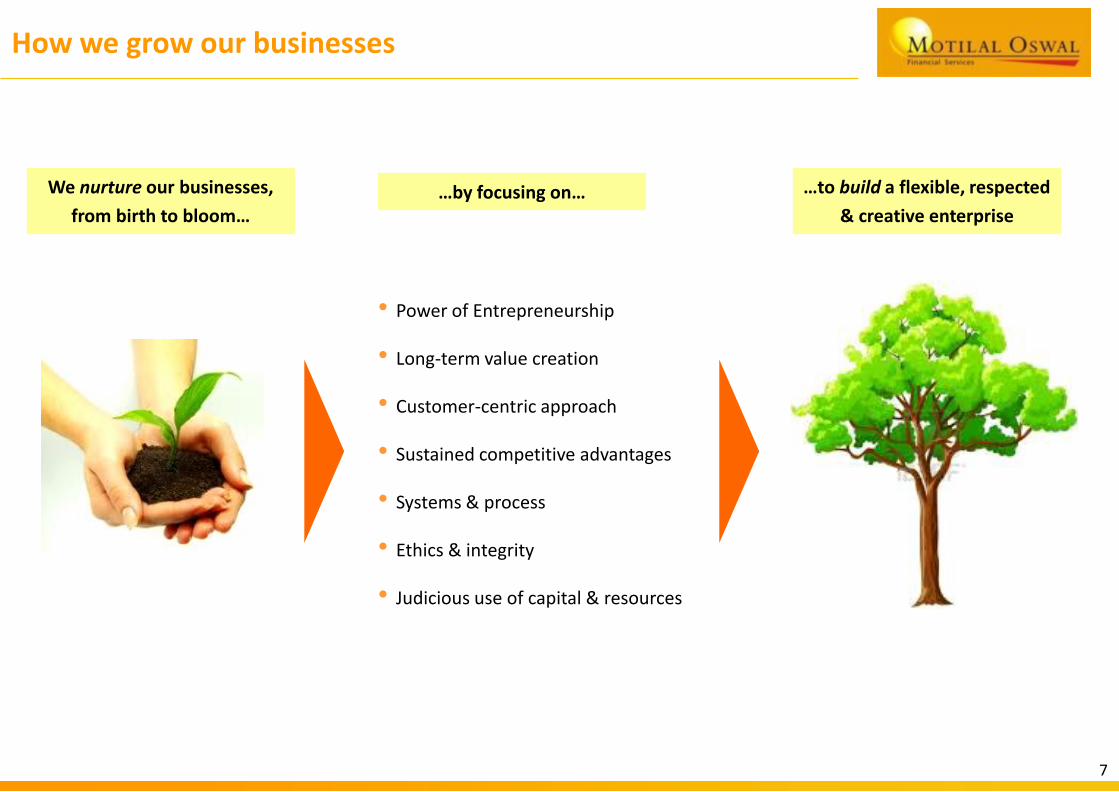
…to build a flexible, respected
& creative enterprise
How we grow our businesses
7
…by focusing on…
• Power of Entrepreneurship
• Long-term value creation
• Customer-centric approach
• Sustained competitive advantages
• Systems & process
• Ethics & integrity
• Judicious use of capital & resources
We nurture our businesses,
from birth to bloom……by focusing on…
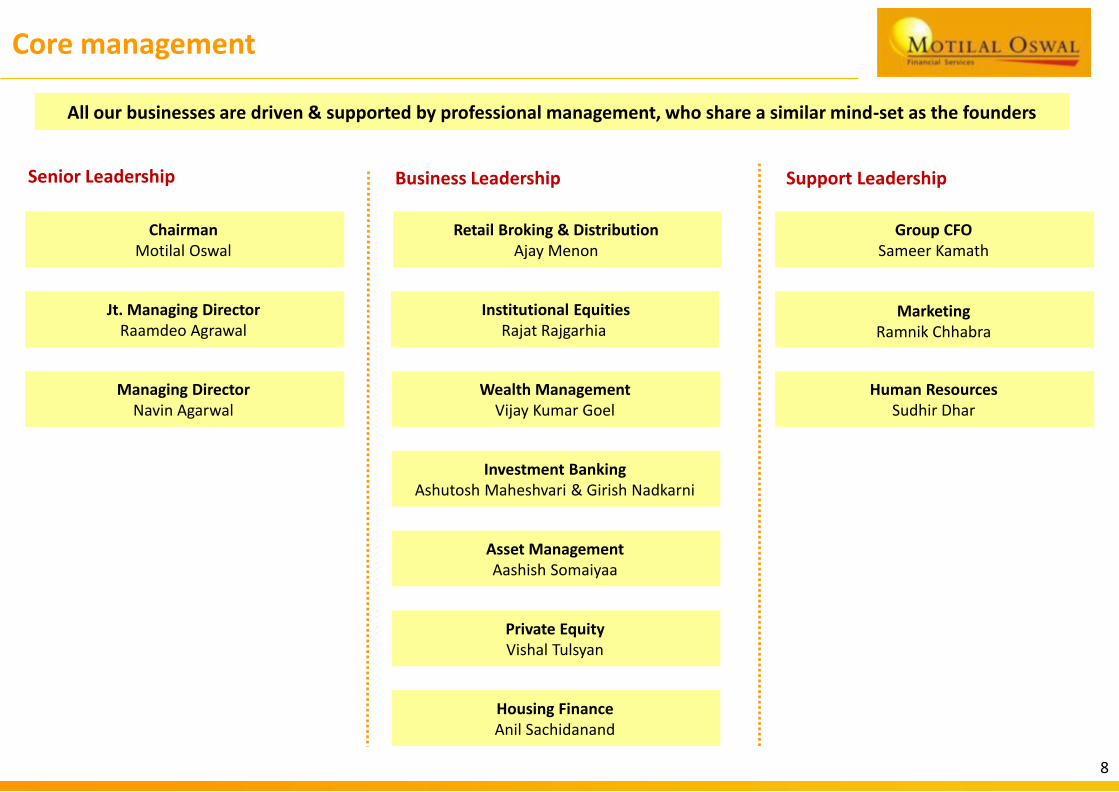
Core management
8
Business Leadership Support LeadershipSenior Leadership
ChairmanMotilal Oswal
Jt. Managing DirectorRaamdeo Agrawal
Managing DirectorNavin Agarwal
Group CFOSameer Kamath
MarketingRamnik Chhabra
Human ResourcesSudhir Dhar
Retail Broking & DistributionAjay Menon
Institutional EquitiesRajat Rajgarhia
Wealth ManagementVijay Kumar Goel
Investment BankingAshutosh Maheshvari & Girish Nadkarni
Asset Management Aashish Somaiyaa
Private EquityVishal Tulsyan
Housing FinanceAnil Sachidanand
All our businesses are driven & supported by professional management, who share a similar mind-set as the founders
Corporate governance
● MOFSL is committed to ensuring compliance with
the best practices in corporate governance
● Composition of MOFSL’s Board of Directors:
o The Board currently consists of 6 Directors with
50% composition of Independent Directors
(3 Independent & 3 Non Independent)
● MOFSL has some major Board level Committees :
o Audit Committee
o Stakeholders Relationship Committee
o Nomination & Remuneration/Compensation
Committee
o Corporate Social Responsibility Committee;
o Risk Management Committee
o Asset Liability Management Committee
o ESOP Committee
o Debenture Committee
9
Independent Directors
• Ms Sharda Agarwal co-founded a strategy marketing consulting
firm in 2005 where she consulted 100+ companies in ~175
assignments. She also set up a consulting oriented market
research firm ‘Market Gate Dimensions’ in 2011
• Mr Vivek Paranjpe is an HR consultant with companies like
Reliance Industries, Blackstone etc. Prior to this, he was the
Director, HR Operations at HP Singapore, & has also worked with
Hotel Corp, Johnson & Johnson, Hindustan Lever etc
• Mr Praveen Tripathi is the CEO of Magic9 Media & Consumer
Knowledge Pvt Ltd. He is the Chairman of the National Consumer
Classification System Committee & has also worked with Pidilite,
Hansa Consulting, Zenithmedia, Starcom/Leo Burnett etc
• Ms Rekha Shah is the founder of Analyze N Control, which
provides solutions to capital markets. Prior to this, she had 16
years experience in the manufacturing & financial sector
• Mr Praveen Tripathi is the CEO of Magic9 Media & Consumer
Knowledge Pvt Ltd. He is the Chairman of the National Consumer
Classification System Committee & has also worked with Pidilite,
Hansa Consulting, Zenithmedia, Starcom/Leo Burnett etc
Independent Directors – Motilal Oswal Financial Services LtdBoard & Committees
Independent Directors – Motilal Oswal Securities Ltd
Data as on Dec 2015
Group’s Evolution
Strategic Imperatives: Concentrating on Scale, Efficiencies, Competitiveness
Performance against Strategy
Industry Trends & the Savings Story
Presentation Plan
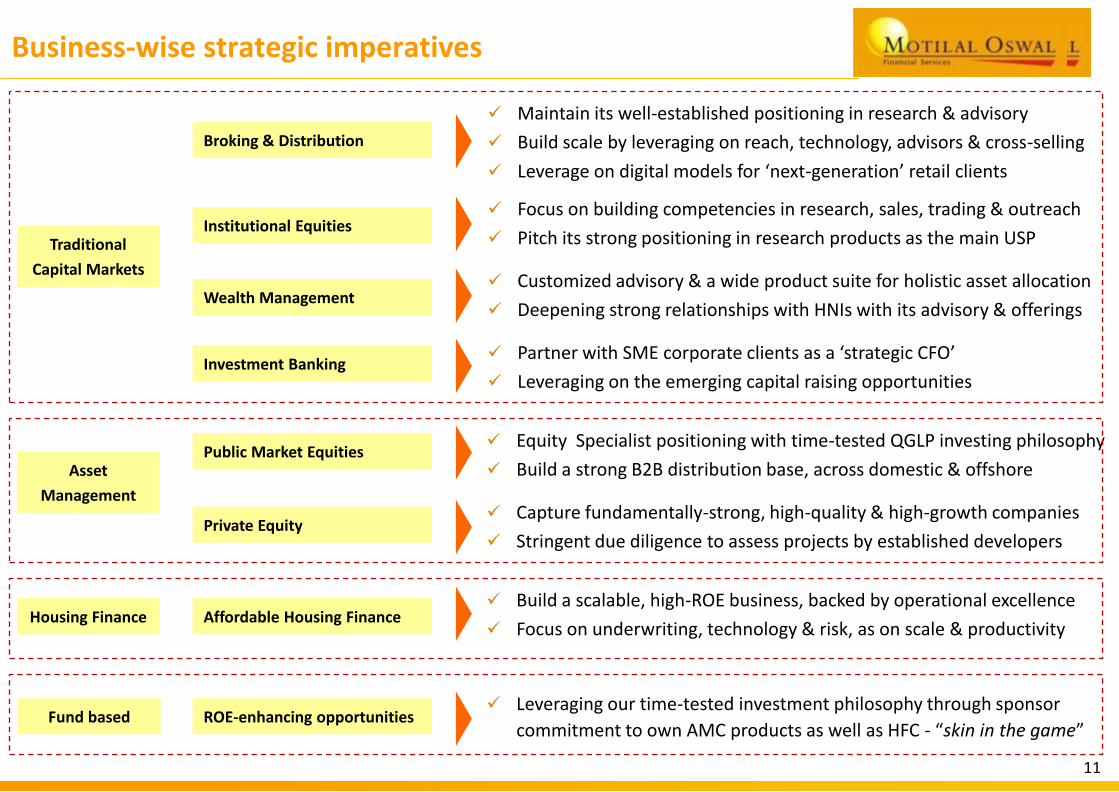
Business-wise strategic imperatives
Broking & Distribution
Institutional Equities
Private Equity
Public Market Equities
Investment Banking
Wealth Management
Affordable Housing Finance
ROE-enhancing opportunities
Traditional
Capital Markets
Asset
Management
Housing Finance
Fund based
11
Maintain its well-established positioning in research & advisory
Build scale by leveraging on reach, technology, advisors & cross-selling
Leverage on digital models for ‘next-generation’ retail clients
Focus on building competencies in research, sales, trading & outreach
Pitch its strong positioning in research products as the main USP
Customized advisory & a wide product suite for holistic asset allocation
Deepening strong relationships with HNIs with its advisory & offerings
Partner with SME corporate clients as a ‘strategic CFO’
Leveraging on the emerging capital raising opportunities
Equity Specialist positioning with time-tested QGLP investing philosophy
Build a strong B2B distribution base, across domestic & offshore
Capture fundamentally-strong, high-quality & high-growth companies
Stringent due diligence to assess projects by established developers
Build a scalable, high-ROE business, backed by operational excellence
Focus on underwriting, technology & risk, as on scale & productivity
Leveraging our time-tested investment philosophy through sponsor
commitment to own AMC products as well as HFC - “skin in the game”

Retail Broking: Time-tested model poised for scale
‘Knowledge’ as a differentiator
● Simplified research customized for retail
● Dedicated advisory-desk per client-type
● Certification/tests for advisor quality
● Investor education seminars/trainings
Portfolio product-based approach
● Investment strategies are packaged
into product portfolios
● System-driven trading products are
developed in-house
‘Partnering For Growth’ Franchisee Model
● Leveraging entrepreneurial talent to
expand across India’s hinterland
● Several franchisees have grown manifold
in their scale of business
Profile-based advisory
● Targeted advisory based on client profile
● Disciplined trading system for stock ideas
Cross-selling of products
● Offering a bouquet of products to
deepen client engagement:-
Equity broking (Cash, F&O)
Commodity broking
Currency trading
Mutual Funds
PMS
Bonds
Insurance
Real Estate broking
Leveraging on Technology
● Revamping Digital initiatives across
delivery, engagement & back-end
● Reduces cost of servicing & enables client
convenience
12
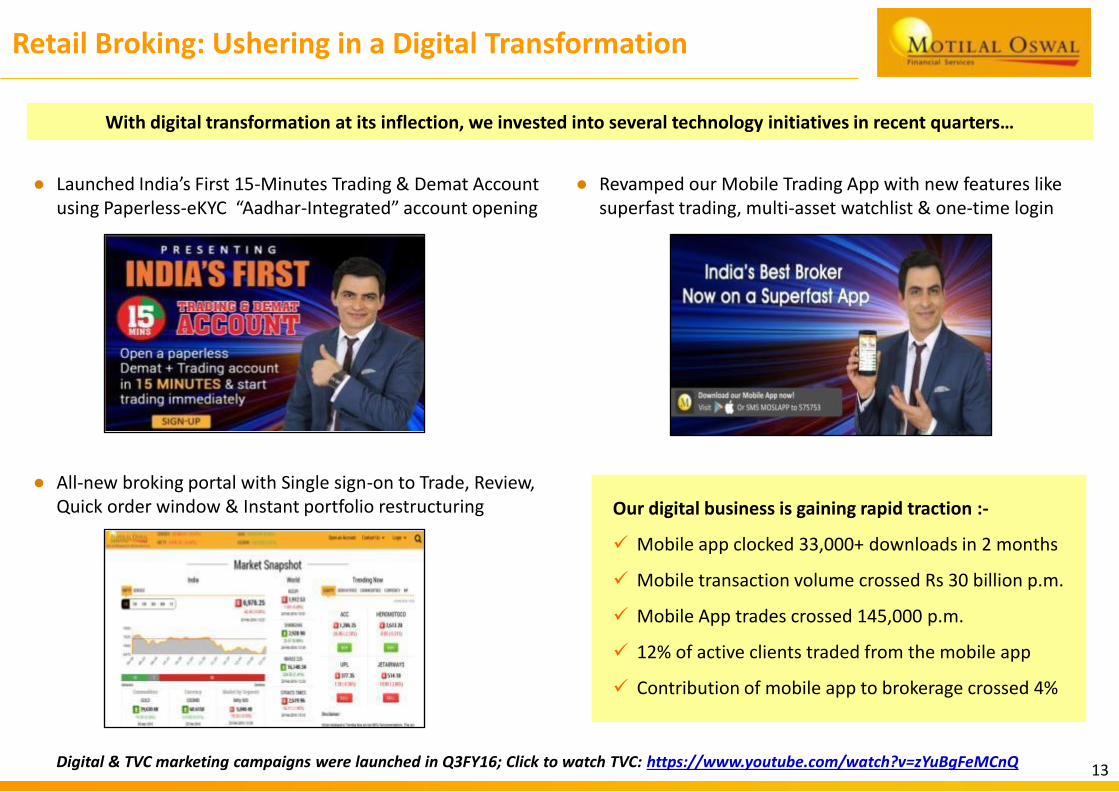
Retail Broking: Ushering in a Digital Transformation
● Launched India’s First 15-Minutes Trading & Demat Account using Paperless-eKYC “Aadhar-Integrated” account opening
● All-new broking portal with Single sign-on to Trade, Review, Quick order window & Instant portfolio restructuring
13
With digital transformation at its inflection, we invested into several technology initiatives in recent quarters…
● Revamped our Mobile Trading App with new features like superfast trading, multi-asset watchlist & one-time login
Our digital business is gaining rapid traction :-
Mobile app clocked 33,000+ downloads in 2 months
Mobile transaction volume crossed Rs 30 billion p.m.
Mobile App trades crossed 145,000 p.m.
12% of active clients traded from the mobile app
Contribution of mobile app to brokerage crossed 4%
Digital & TVC marketing campaigns were launched in Q3FY16; Click to watch TVC: https://www.youtube.com/watch?v=zYuBgFeMCnQ
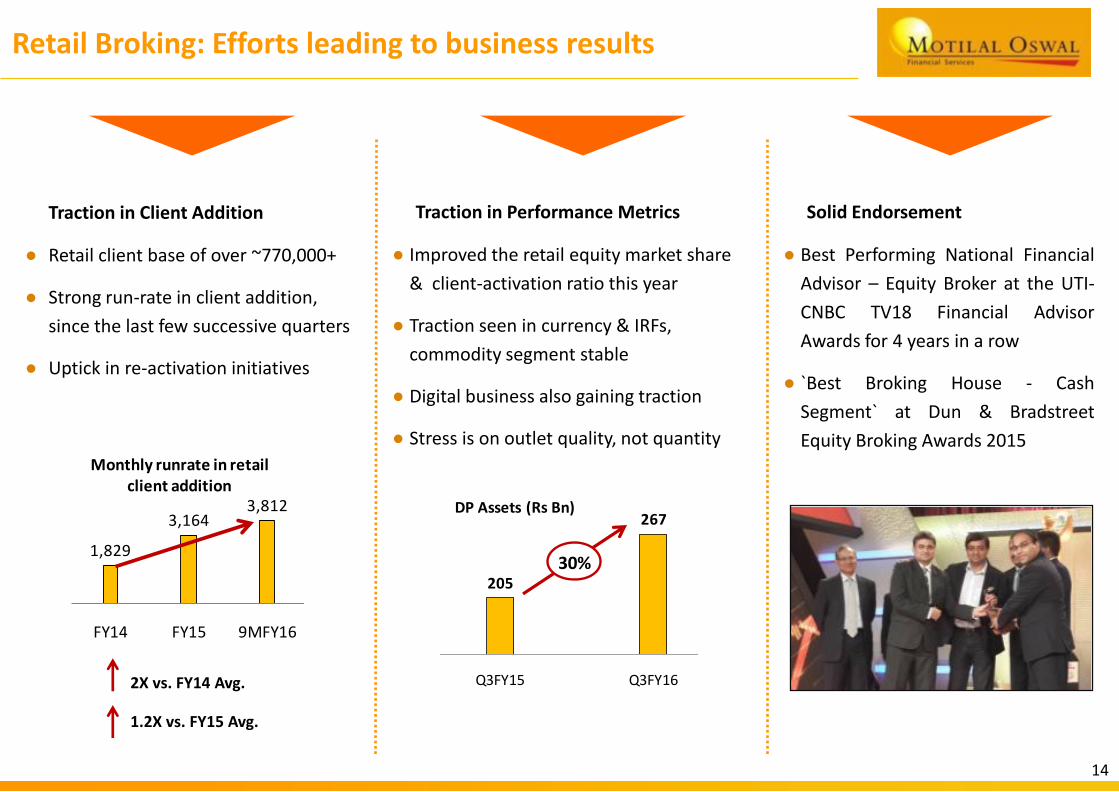
Retail Broking: Efforts leading to business results
Traction in Client Addition
● Retail client base of over ~770,000+
● Strong run-rate in client addition,
since the last few successive quarters
● Uptick in re-activation initiatives
Traction in Performance Metrics
● Improved the retail equity market share
& client-activation ratio this year
● Traction seen in currency & IRFs,
commodity segment stable
● Digital business also gaining traction
● Stress is on outlet quality, not quantity
Solid Endorsement
● Best Performing National Financial
Advisor – Equity Broker at the UTI-
CNBC TV18 Financial Advisor
Awards for 4 years in a row
● `Best Broking House - Cash
Segment` at Dun & Bradstreet
Equity Broking Awards 2015
14
205
267
Q3FY15 Q3FY16
DP Assets (Rs Bn)
30%
2X vs. FY14 Avg.
1.2X vs. FY15 Avg.
3,8123,164
1,829
9MFY16FY15FY14
Monthly runrate in retail client addition
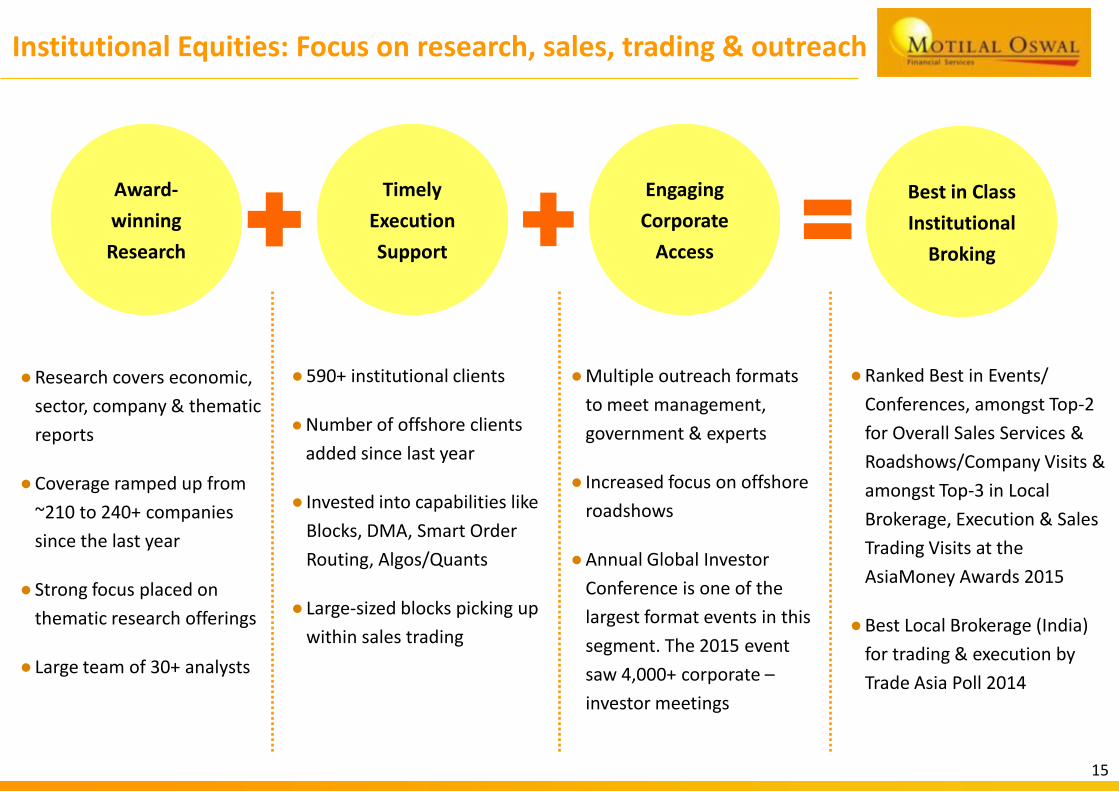
Institutional Equities: Focus on research, sales, trading & outreach
15
Award-
winning
Research
Timely
Execution
Support
Engaging
Corporate
Access
Best in Class
Institutional
Broking
●Research covers economic,
sector, company & thematic
reports
●Coverage ramped up from
~210 to 240+ companies
since the last year
● Strong focus placed on
thematic research offerings
● Large team of 30+ analysts
●590+ institutional clients
● Number of offshore clients
added since last year
● Invested into capabilities like
Blocks, DMA, Smart Order
Routing, Algos/Quants
● Large-sized blocks picking up
within sales trading
●Multiple outreach formats
to meet management,
government & experts
● Increased focus on offshore
roadshows
●Annual Global Investor
Conference is one of the
largest format events in this
segment. The 2015 event
saw 4,000+ corporate –
investor meetings
●Ranked Best in Events/
Conferences, amongst Top-2
for Overall Sales Services &
Roadshows/Company Visits &
amongst Top-3 in Local
Brokerage, Execution & Sales
Trading Visits at the
AsiaMoney Awards 2015
●Best Local Brokerage (India)
for trading & execution by
Trade Asia Poll 2014
16
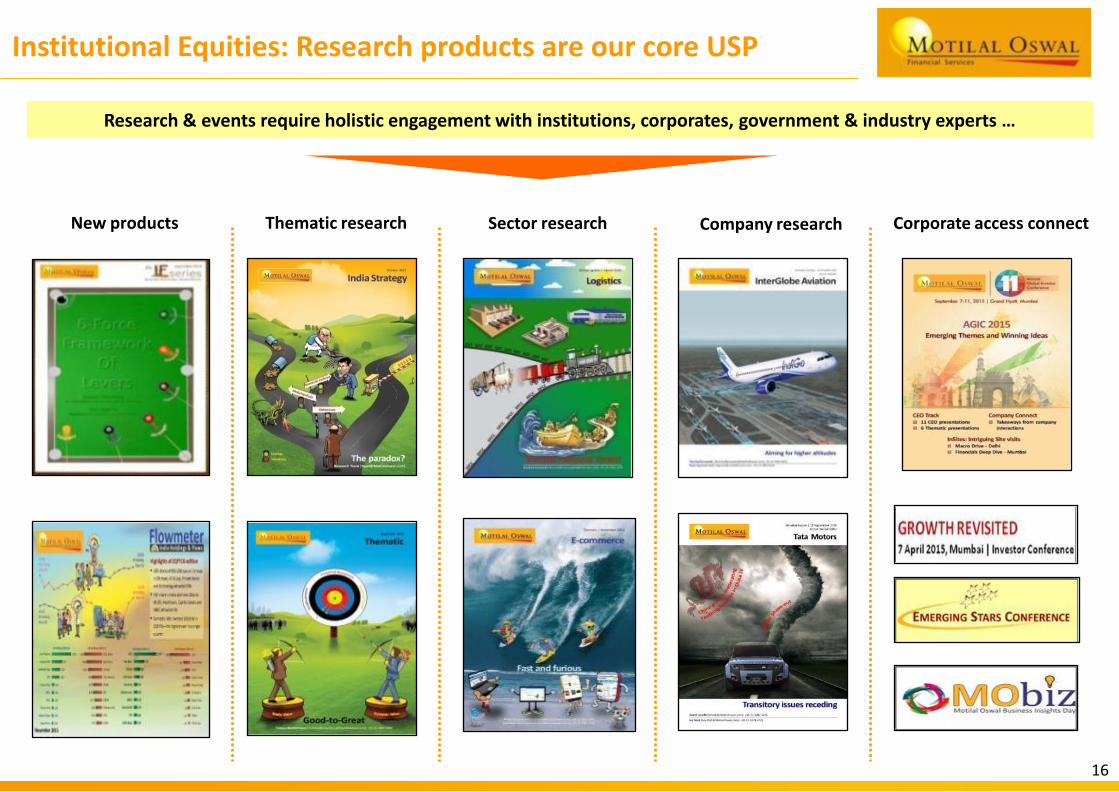
Thematic research Sector research Company researchNew products Corporate access connect
Research & events require holistic engagement with institutions, corporates, government & industry experts …
Institutional Equities: Research products are our core USP
17
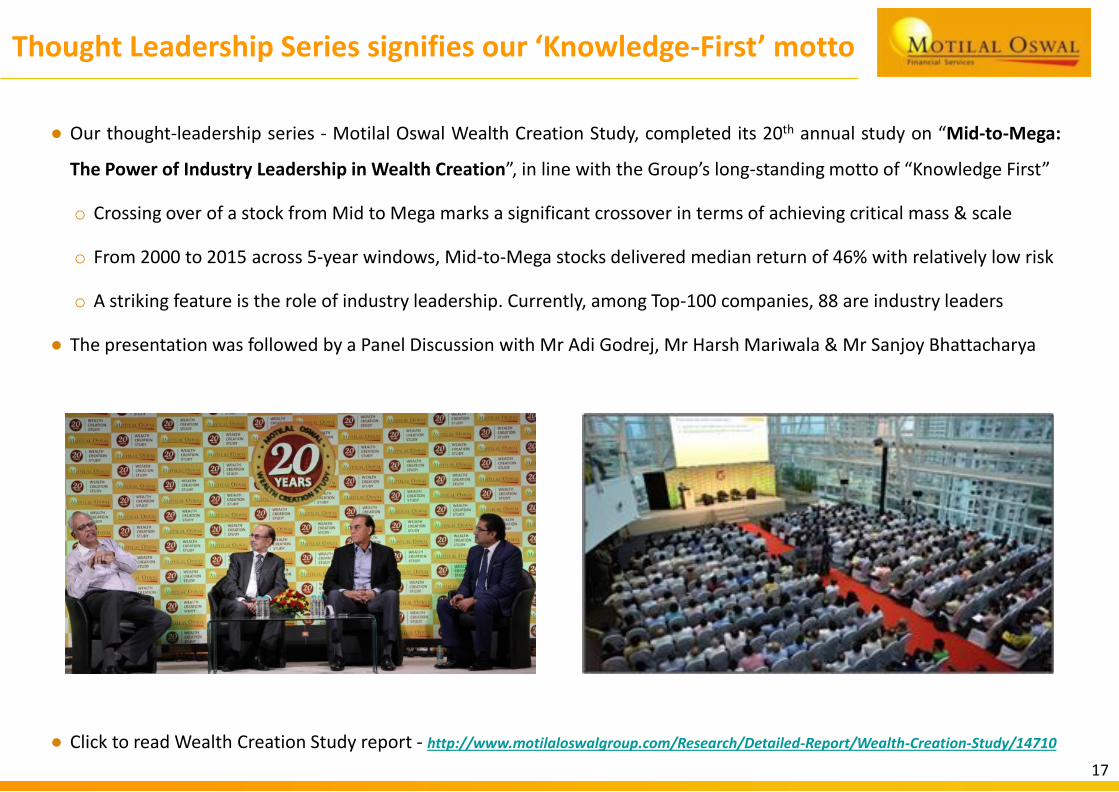
Thought Leadership Series signifies our ‘Knowledge-First’ motto
● Our thought-leadership series - Motilal Oswal Wealth Creation Study, completed its 20th annual study on “Mid-to-Mega:
The Power of Industry Leadership in Wealth Creation”, in line with the Group’s long-standing motto of “Knowledge First”
o Crossing over of a stock from Mid to Mega marks a significant crossover in terms of achieving critical mass & scale
o From 2000 to 2015 across 5-year windows, Mid-to-Mega stocks delivered median return of 46% with relatively low risk
o A striking feature is the role of industry leadership. Currently, among Top-100 companies, 88 are industry leaders
● The presentation was followed by a Panel Discussion with Mr Adi Godrej, Mr Harsh Mariwala & Mr Sanjoy Bhattacharya
● Click to read Wealth Creation Study report - http://www.motilaloswalgroup.com/Research/Detailed-Report/Wealth-Creation-Study/14710
● Wealth management AUM stood at ~`61 billion as of Dec 2015, a growth of 68% on a YoY basis
● The business has turned significantly profitable last year
● Our yield is better than peers due to the higher proportion of equity assets within the AUM mix
Private Wealth: Deepening client relationships with advisory
18
● Expanding Coverage:-
68-member sales & advisory team as of Dec 2015,
up from 64 in Sep 2015 & 43 in Dec 2014
Continued traction in assets under management
Expanded to 8 metro s to capitalize on growth prospects
Continued to ramp up the advisory & sales capabilities
Few large clients added, which should push traction in AUM
Diversifying the client base, in terms of AUM concentration
● Client-centric Focus-
A unique product offering, given the combination of
open-architecture along with strong manufacturing
capabilities in public market equities & real estate
Investing into providing a seamless execution platform
Deepening relationships by supporting clients through
life events, especially younger-age clientele
Added new services like family office & estate planning
Investment Banking: Focusing on emerging opportunities
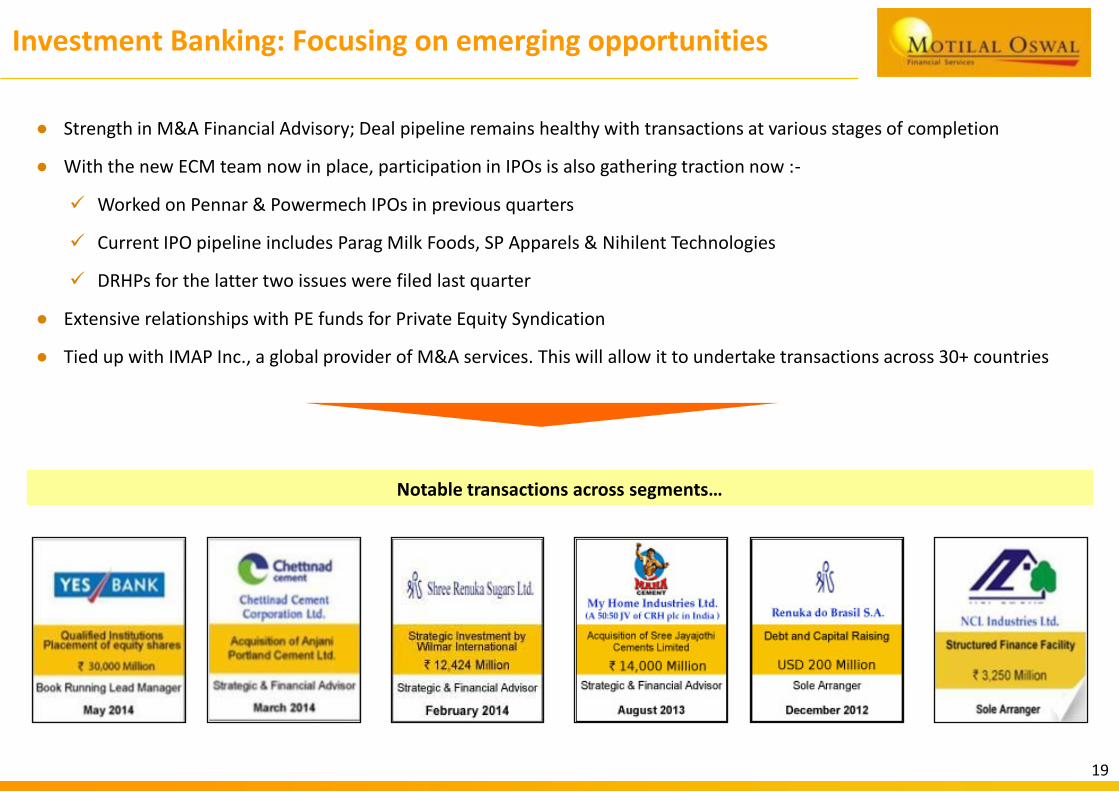
● Strength in M&A Financial Advisory; Deal pipeline remains healthy with transactions at various stages of completion
● With the new ECM team now in place, participation in IPOs is also gathering traction now :-
Worked on Pennar & Powermech IPOs in previous quarters
Current IPO pipeline includes Parag Milk Foods, SP Apparels & Nihilent Technologies
DRHPs for the latter two issues were filed last quarter
● Extensive relationships with PE funds for Private Equity Syndication
● Tied up with IMAP Inc., a global provider of M&A services. This will allow it to undertake transactions across 30+ countries
Notable transactions across segments…
19
Asset Management: Positioned as equity specialists
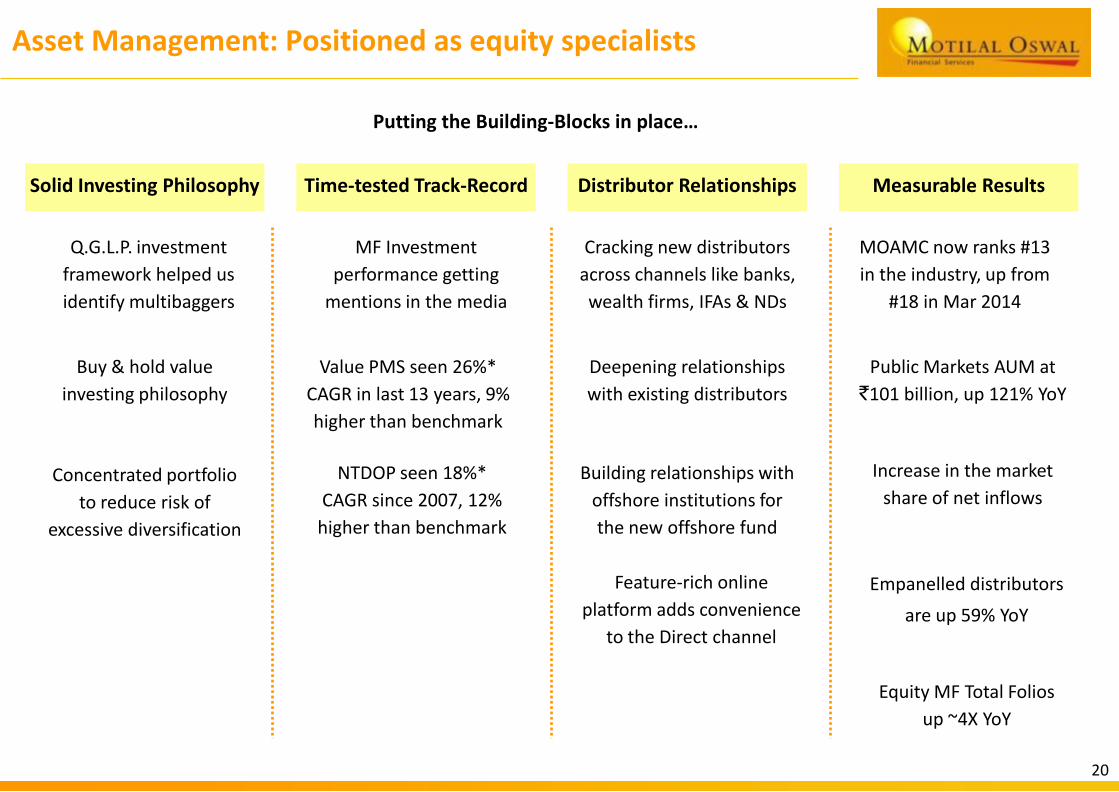
Putting the Building-Blocks in place…
Solid Investing Philosophy
Q.G.L.P. investment
framework helped us
identify multibaggers
Cracking new distributors
across channels like banks,
wealth firms, IFAs & NDs
MOAMC now ranks #13
in the industry, up from
#18 in Mar 2014
Public Markets AUM at
`101 billion, up 121% YoY
Buy & hold value
investing philosophy
MF Investment
performance getting
mentions in the media
Value PMS seen 26%*
CAGR in last 13 years, 9%
higher than benchmark
Empanelled distributors
are up 59% YoY
Time-tested Track-Record Distributor Relationships
Deepening relationships
with existing distributors
Building relationships with
offshore institutions for
the new offshore fund
Concentrated portfolio
to reduce risk of
excessive diversification
NTDOP seen 18%*
CAGR since 2007, 12%
higher than benchmark
Measurable Results
Feature-rich online
platform adds convenience
to the Direct channel
Equity MF Total Folios
up ~4X YoY
Increase in the market
share of net inflows
20
Asset Management: Equity products for all client-types
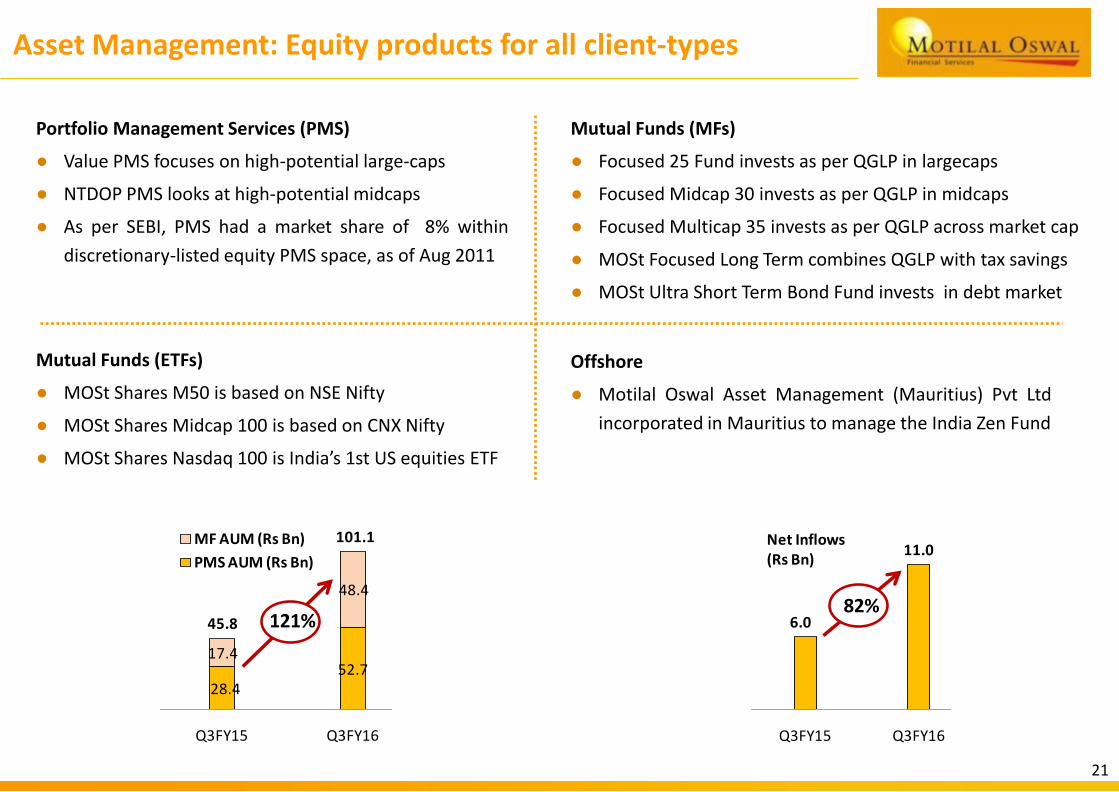
Portfolio Management Services (PMS)
● Value PMS focuses on high-potential large-caps
● NTDOP PMS looks at high-potential midcaps
● As per SEBI, PMS had a market share of 8% within
discretionary-listed equity PMS space, as of Aug 2011
Offshore
● Motilal Oswal Asset Management (Mauritius) Pvt Ltd
incorporated in Mauritius to manage the India Zen Fund
Mutual Funds (MFs)
● Focused 25 Fund invests as per QGLP in largecaps
● Focused Midcap 30 invests as per QGLP in midcaps
● Focused Multicap 35 invests as per QGLP across market cap
● MOSt Focused Long Term combines QGLP with tax savings
● MOSt Ultra Short Term Bond Fund invests in debt market
Mutual Funds (ETFs)
● MOSt Shares M50 is based on NSE Nifty
● MOSt Shares Midcap 100 is based on CNX Nifty
● MOSt Shares Nasdaq 100 is India’s 1st US equities ETF
21
28.452.7
17.4
48.4
Q3FY15 Q3FY16
MF AUM (Rs Bn)
PMS AUM (Rs Bn)
121%
101.1
45.8 6.0
11.0
Q3FY15 Q3FY16
82%
Net Inflows (Rs Bn)
Asset Management: Building Brand Awareness
22
Click to watch TVC: https://www.youtube.com/watch?v=cDYZx4cS2R0
Click to watch TVC: https://www.youtube.com/watch?v=oJt9whsMjuY
Click to watch TVC: https://www.youtube.com/watch?v=L7QAJgGIWlI
Our maiden marketing campaign “Sirf Ek Sawaal: Why not Motilal Oswal” was launched across Digital, Print & TVC, to reach
out to a large, untapped base of investors & make them aware of our Brand
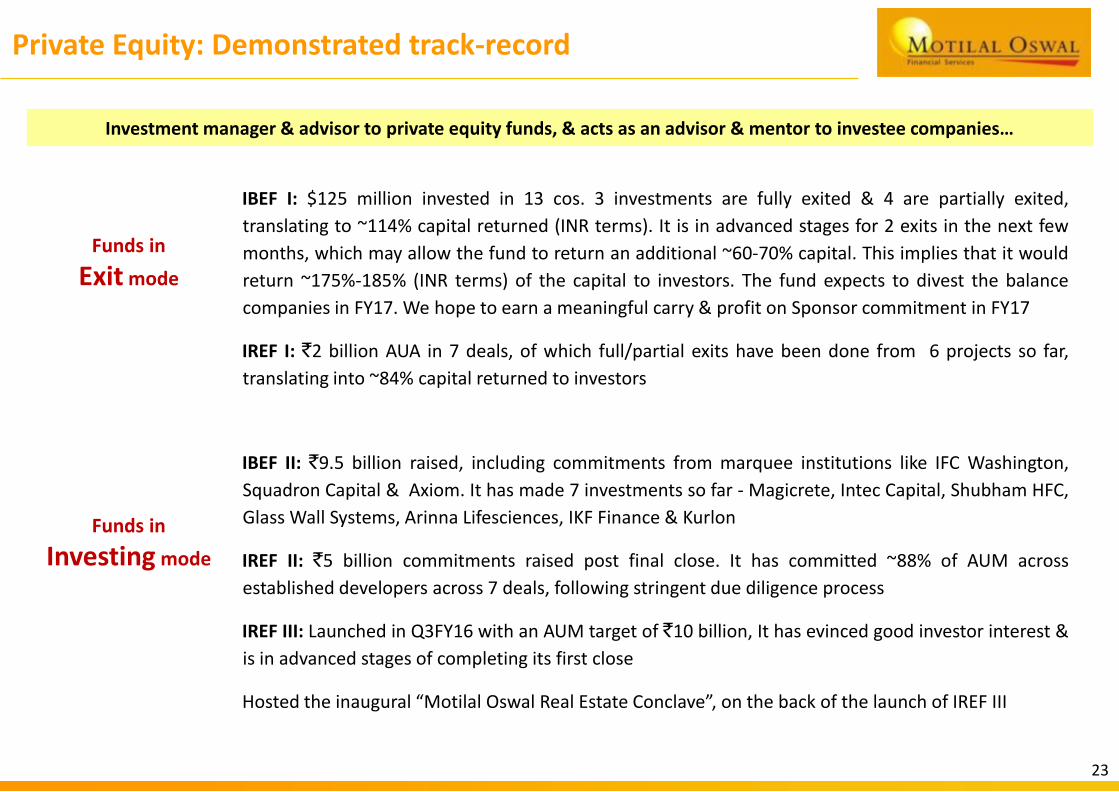
Private Equity: Demonstrated track-record
23
Investment manager & advisor to private equity funds, & acts as an advisor & mentor to investee companies…
IBEF I: $125 million invested in 13 cos. 3 investments are fully exited & 4 are partially exited,
translating to ~114% capital returned (INR terms). It is in advanced stages for 2 exits in the next few
months, which may allow the fund to return an additional ~60-70% capital. This implies that it would
return ~175%-185% (INR terms) of the capital to investors. The fund expects to divest the balance
companies in FY17. We hope to earn a meaningful carry & profit on Sponsor commitment in FY17
IREF I: `2 billion AUA in 7 deals, of which full/partial exits have been done from 6 projects so far,
translating into ~84% capital returned to investors
Funds in
Exit mode
Funds in
Investing mode
IBEF II: `9.5 billion raised, including commitments from marquee institutions like IFC Washington,
Squadron Capital & Axiom. It has made 7 investments so far - Magicrete, Intec Capital, Shubham HFC,
Glass Wall Systems, Arinna Lifesciences, IKF Finance & Kurlon
IREF II: `5 billion commitments raised post final close. It has committed ~88% of AUM across
established developers across 7 deals, following stringent due diligence process
IREF III: Launched in Q3FY16 with an AUM target of `10 billion, It has evinced good investor interest &
is in advanced stages of completing its first close
Hosted the inaugural “Motilal Oswal Real Estate Conclave”, on the back of the launch of IREF III
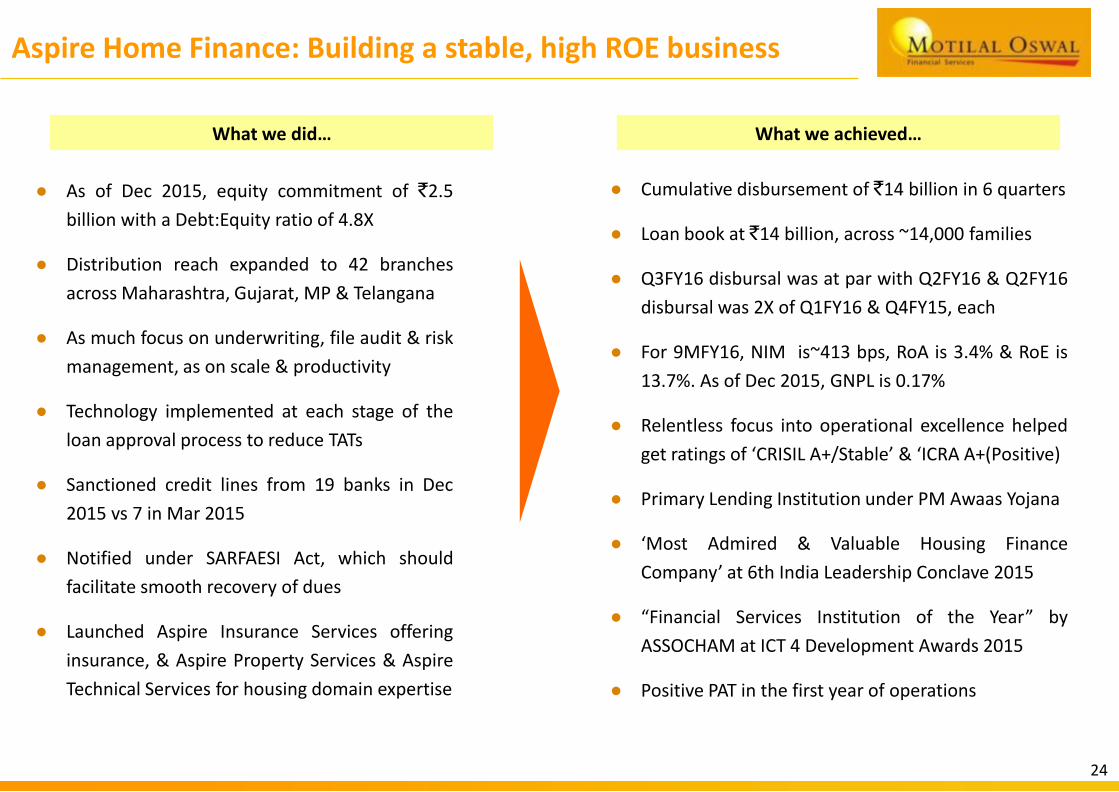
Aspire Home Finance: Building a stable, high ROE business
● As of Dec 2015, equity commitment of `2.5
billion with a Debt:Equity ratio of 4.8X
● Distribution reach expanded to 42 branches
across Maharashtra, Gujarat, MP & Telangana
● As much focus on underwriting, file audit & risk
management, as on scale & productivity
● Technology implemented at each stage of the
loan approval process to reduce TATs
● Sanctioned credit lines from 19 banks in Dec
2015 vs 7 in Mar 2015
● Notified under SARFAESI Act, which should
facilitate smooth recovery of dues
● Launched Aspire Insurance Services offering
insurance, & Aspire Property Services & Aspire
Technical Services for housing domain expertise
● Cumulative disbursement of `14 billion in 6 quarters
● Loan book at `14 billion, across ~14,000 families
● Q3FY16 disbursal was at par with Q2FY16 & Q2FY16
disbursal was 2X of Q1FY16 & Q4FY15, each
● For 9MFY16, NIM is~413 bps, RoA is 3.4% & RoE is
13.7%. As of Dec 2015, GNPL is 0.17%
● Relentless focus into operational excellence helped
get ratings of ‘CRISIL A+/Stable’ & ‘ICRA A+(Positive)
● Primary Lending Institution under PM Awaas Yojana
● ‘Most Admired & Valuable Housing Finance
Company’ at 6th India Leadership Conclave 2015
● “Financial Services Institution of the Year” by
ASSOCHAM at ICT 4 Development Awards 2015
● Positive PAT in the first year of operations
What we achieved…What we did…
24
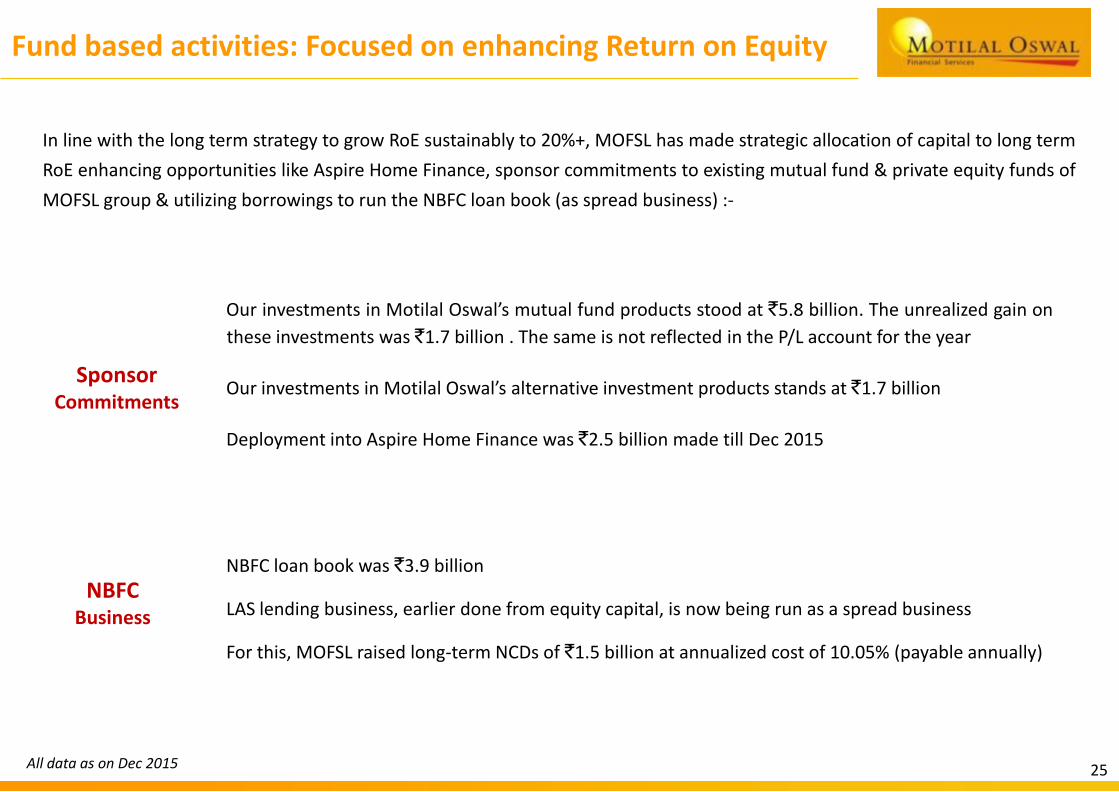
Fund based activities: Focused on enhancing Return on Equity
25
In line with the long term strategy to grow RoE sustainably to 20%+, MOFSL has made strategic allocation of capital to long term
RoE enhancing opportunities like Aspire Home Finance, sponsor commitments to existing mutual fund & private equity funds of
MOFSL group & utilizing borrowings to run the NBFC loan book (as spread business) :-
Our investments in Motilal Oswal’s mutual fund products stood at `5.8 billion. The unrealized gain on
these investments was `1.7 billion . The same is not reflected in the P/L account for the year
Our investments in Motilal Oswal’s alternative investment products stands at `1.7 billion
Deployment into Aspire Home Finance was `2.5 billion made till Dec 2015
Sponsor Commitments
NBFC Business
NBFC loan book was `3.9 billion
LAS lending business, earlier done from equity capital, is now being run as a spread business
For this, MOFSL raised long-term NCDs of `1.5 billion at annualized cost of 10.05% (payable annually)
All data as on Dec 2015
Group’s Evolution
Strategic Imperatives
Performance against Strategy: Strategic & Financial performance
Industry Trends & the Savings Story
Presentation Plan
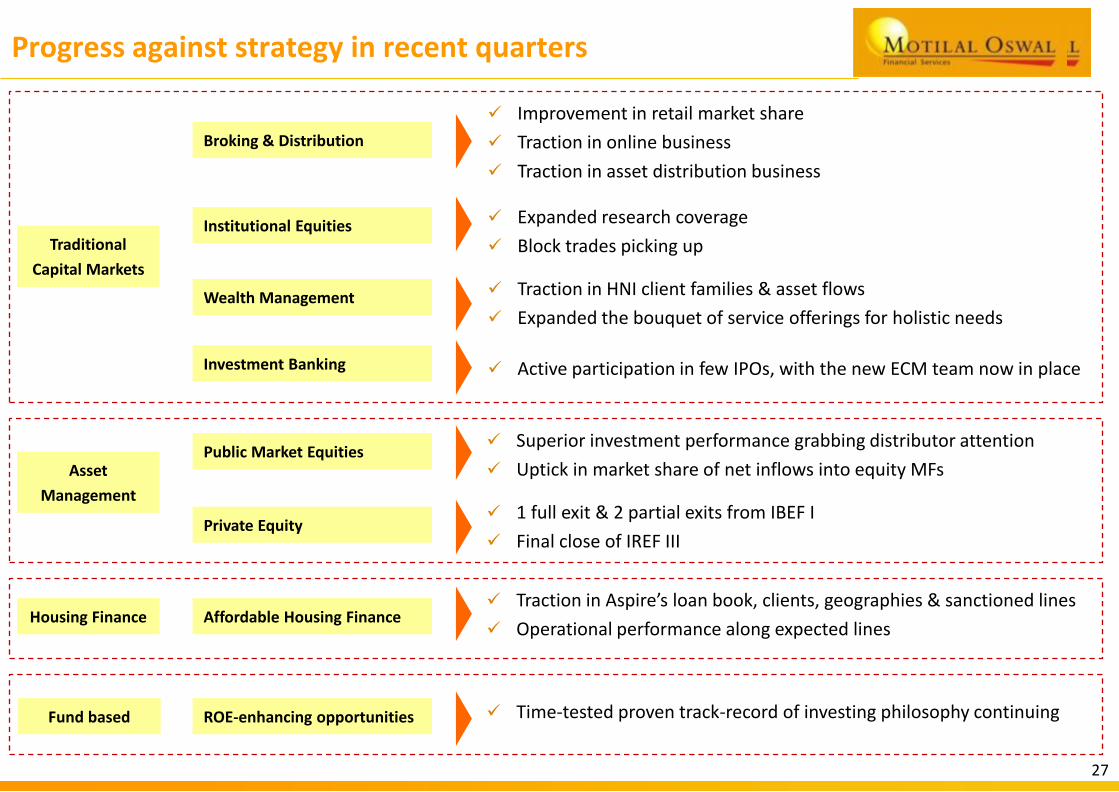
Progress against strategy in recent quarters
Broking & Distribution
Institutional Equities
Private Equity
Public Market Equities
Investment Banking
Wealth Management
Affordable Housing Finance
ROE-enhancing opportunities
Traditional
Capital Markets
Asset
Management
Housing Finance
Fund based
Improvement in retail market share
Traction in online business
Traction in asset distribution business
Expanded research coverage
Block trades picking up
Traction in HNI client families & asset flows
Expanded the bouquet of service offerings for holistic needs
Active participation in few IPOs, with the new ECM team now in place
Superior investment performance grabbing distributor attention
Uptick in market share of net inflows into equity MFs
1 full exit & 2 partial exits from IBEF I
Final close of IREF III
Traction in Aspire’s loan book, clients, geographies & sanctioned lines
Operational performance along expected lines
Time-tested proven track-record of investing philosophy continuing
27
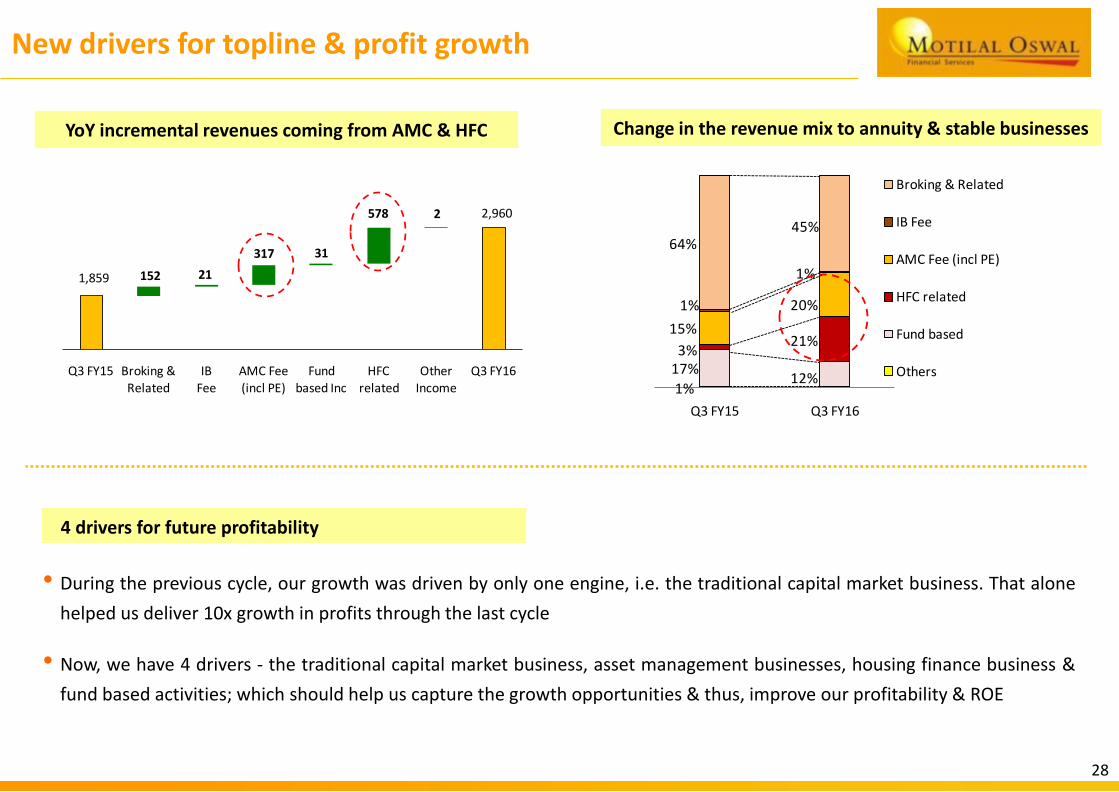
New drivers for topline & profit growth
28
• During the previous cycle, our growth was driven by only one engine, i.e. the traditional capital market business. That alone
helped us deliver 10x growth in profits through the last cycle
• Now, we have 4 drivers - the traditional capital market business, asset management businesses, housing finance business &
fund based activities; which should help us capture the growth opportunities & thus, improve our profitability & ROE
1,859
2,960
Q3 FY15 Broking &Related
IB Fee
AMC Fee (incl PE)
Fund based Inc
HFCrelated
OtherIncome
Q3 FY16
152
317
21
2
31
578
1%12%
17%
21%3%
20%
15%
1%
1%
45%64%
Q3 FY16Q3 FY15
Broking & Related
IB Fee
AMC Fee (incl PE)
HFC related
Fund based
Others
YoY incremental revenues coming from AMC & HFC Change in the revenue mix to annuity & stable businesses
4 drivers for future profitability
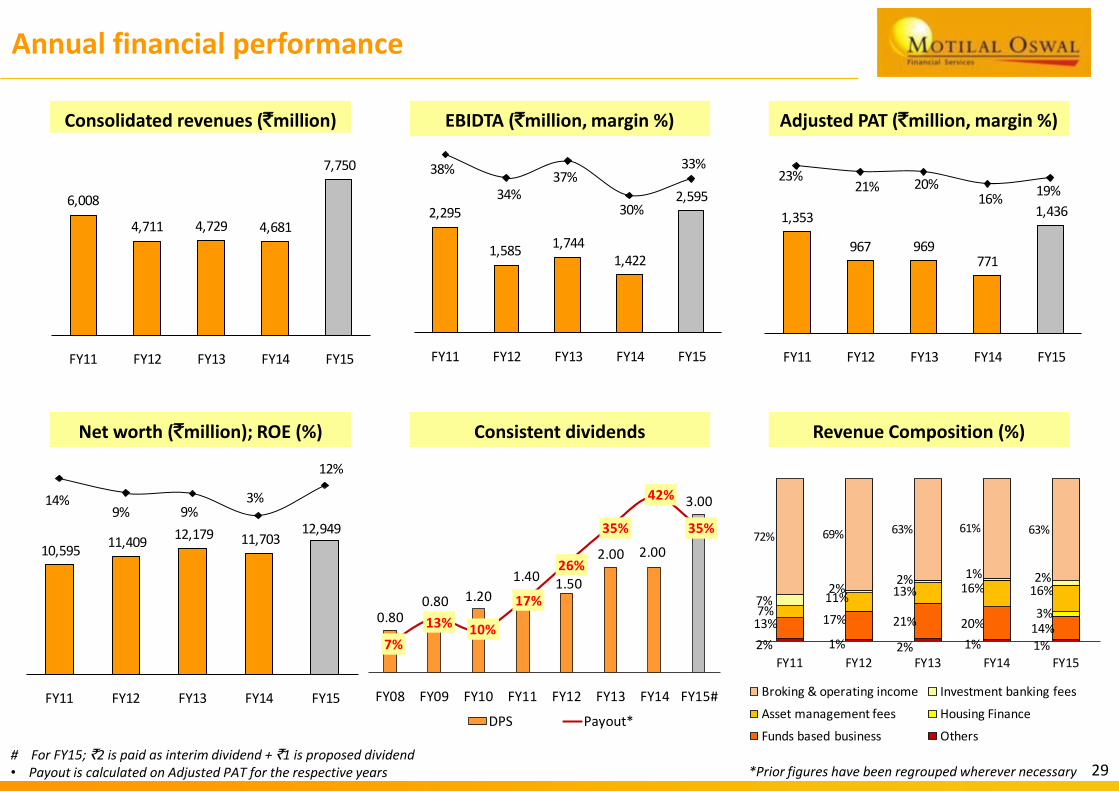
10,595 11,409
12,179 11,703 12,949
14%9% 9%
3%
12%
FY11 FY12 FY13 FY14 FY15
Adjusted PAT (`million, margin %)EBIDTA (`million, margin %)
Annual financial performance
*Prior figures have been regrouped wherever necessary 29# For FY15; `2 is paid as interim dividend + `1 is proposed dividend• Payout is calculated on Adjusted PAT for the respective years
Consolidated revenues (`million)
Revenue Composition (%)Consistent dividendsNet worth (`million); ROE (%)
0.800.80 1.20
1.401.50
2.00 2.00
3.00
7%
13% 10%
17%
26%
35%
42%
35%
FY08 FY09 FY10 FY11 FY12 FY13 FY14 FY15#
DPS Payout*
6,008
4,711 4,729 4,681
7,750
FY11 FY12 FY13 FY14 FY15
2,295
1,5851,744
1,422
2,595
38%
34%37%
30%
33%
FY11 FY12 FY13 FY14 FY15
1,353
967 969771
1,436
23%21% 20%
16%19%
FY11 FY12 FY13 FY14 FY15
2% 1% 2% 1% 1%
13% 17% 21% 20% 14%3%7%
11% 13% 16% 16%7%
2%2% 1% 2%
72% 69% 63% 61% 63%
FY11 FY12 FY13 FY14 FY15
Broking & operating income Investment banking fees
Asset management fees Housing Finance
Funds based business Others
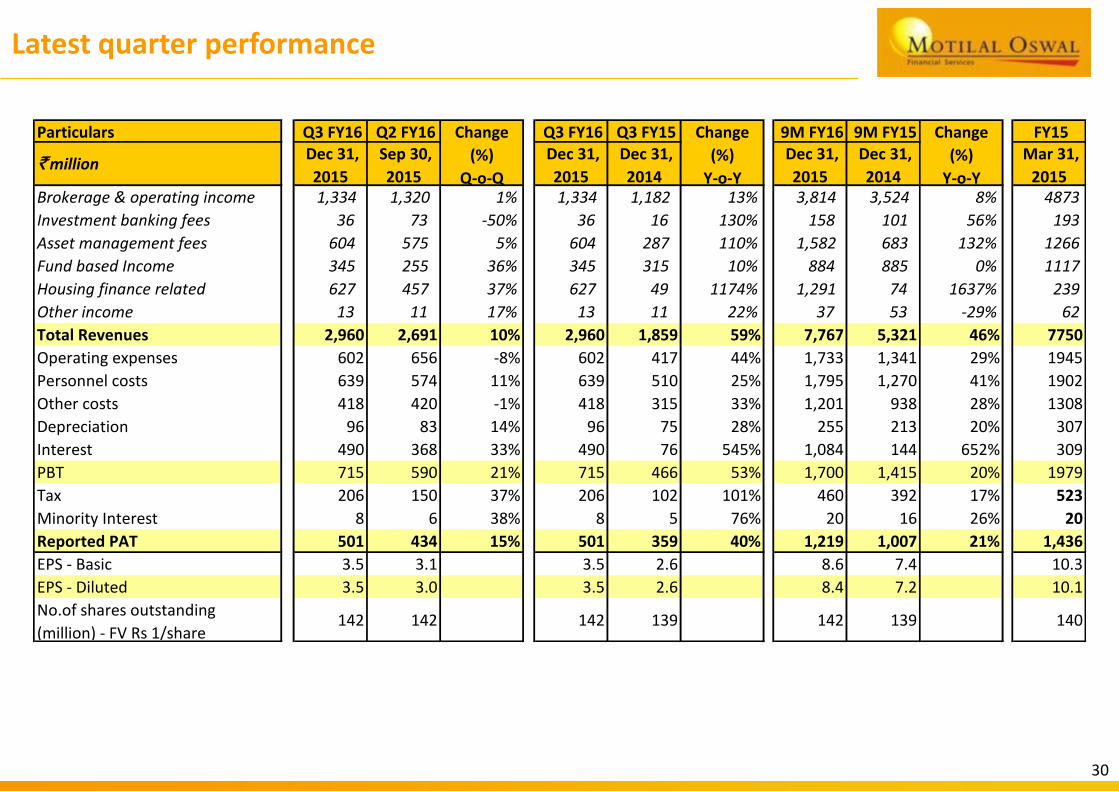
Latest quarter performance
30
Particulars Q3 FY16 Q2 FY16 Q3 FY16 Q3 FY15 9M FY16 9M FY15 FY15
`million Dec 31,
2015
Sep 30,
2015
Dec 31,
2015
Dec 31,
2014
Dec 31,
2015
Dec 31,
2014
Mar 31,
2015 Brokerage & operating income 1,334 1,320 1% 1,334 1,182 13% 3,814 3,524 8% 4873
Investment banking fees 36 73 -50% 36 16 130% 158 101 56% 193
Asset management fees 604 575 5% 604 287 110% 1,582 683 132% 1266
Fund based Income 345 255 36% 345 315 10% 884 885 0% 1117
Housing finance related 627 457 37% 627 49 1174% 1,291 74 1637% 239
Other income 13 11 17% 13 11 22% 37 53 -29% 62
Total Revenues 2,960 2,691 10% 2,960 1,859 59% 7,767 5,321 46% 7750
Operating expenses 602 656 -8% 602 417 44% 1,733 1,341 29% 1945
Personnel costs 639 574 11% 639 510 25% 1,795 1,270 41% 1902
Other costs 418 420 -1% 418 315 33% 1,201 938 28% 1308
Depreciation 96 83 14% 96 75 28% 255 213 20% 307
Interest 490 368 33% 490 76 545% 1,084 144 652% 309
PBT 715 590 21% 715 466 53% 1,700 1,415 20% 1979
Tax 206 150 37% 206 102 101% 460 392 17% 523
Minority Interest 8 6 38% 8 5 76% 20 16 26% 20
Reported PAT 501 434 15% 501 359 40% 1,219 1,007 21% 1,436
EPS - Basic 3.5 3.1 3.5 2.6 8.6 7.4 10.3
EPS - Diluted 3.5 3.0 3.5 2.6 8.4 7.2 10.1
No.of shares outstanding
(million) - FV Rs 1/share142 142 142 139 142 139 140
Change
(%)
Y-o-Y
Change
(%)
Q-o-Q
Change
(%)
Y-o-Y
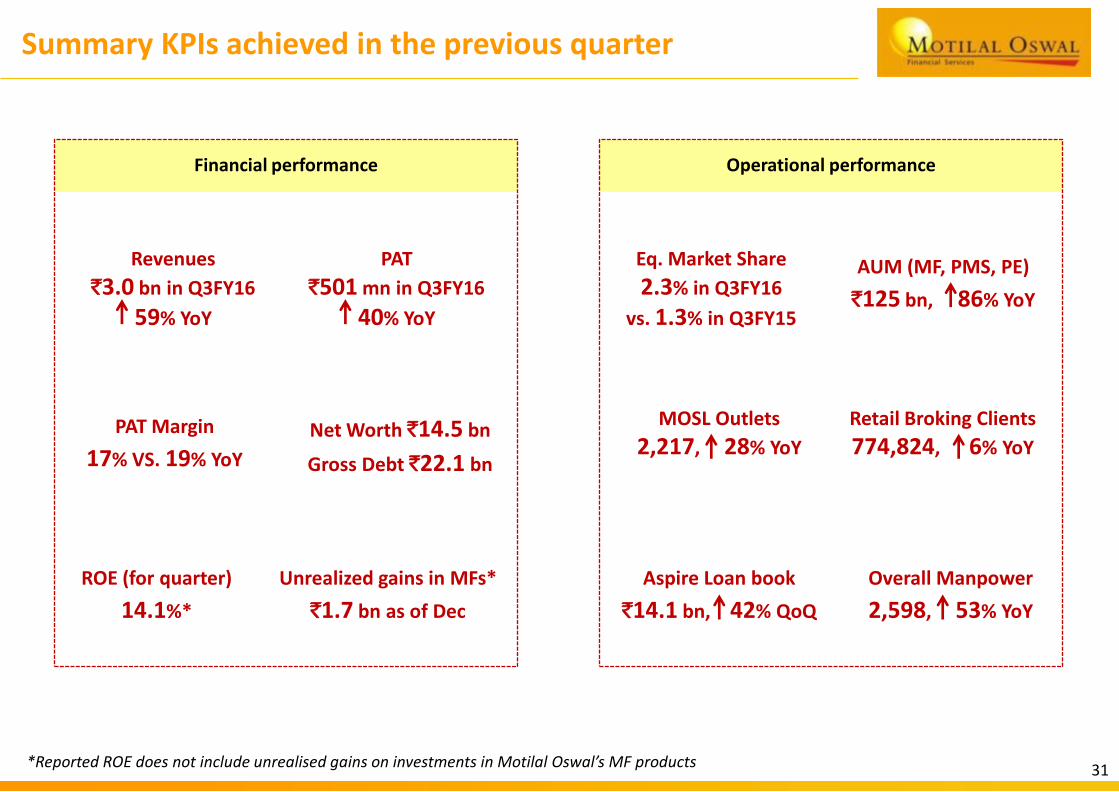
Summary KPIs achieved in the previous quarter
Revenues
`3.0 bn in Q3FY16
59% YoY
ROE (for quarter)
14.1%*
PAT Margin
17% VS. 19% YoY
Unrealized gains in MFs*
`1.7 bn as of Dec
*Reported ROE does not include unrealised gains on investments in Motilal Oswal’s MF products
Eq. Market Share
2.3% in Q3FY16
vs. 1.3% in Q3FY15
MOSL Outlets
2,217, 28% YoY
Retail Broking Clients
774,824, 6% YoY
Aspire Loan book
`14.1 bn, 42% QoQ
Overall Manpower
2,598, 53% YoY
AUM (MF, PMS, PE)
`125 bn, 86% YoY
Operational performanceFinancial performance
Net Worth `14.5 bn
Gross Debt `22.1 bn
PAT
`501 mn in Q3FY16
40% YoY
31
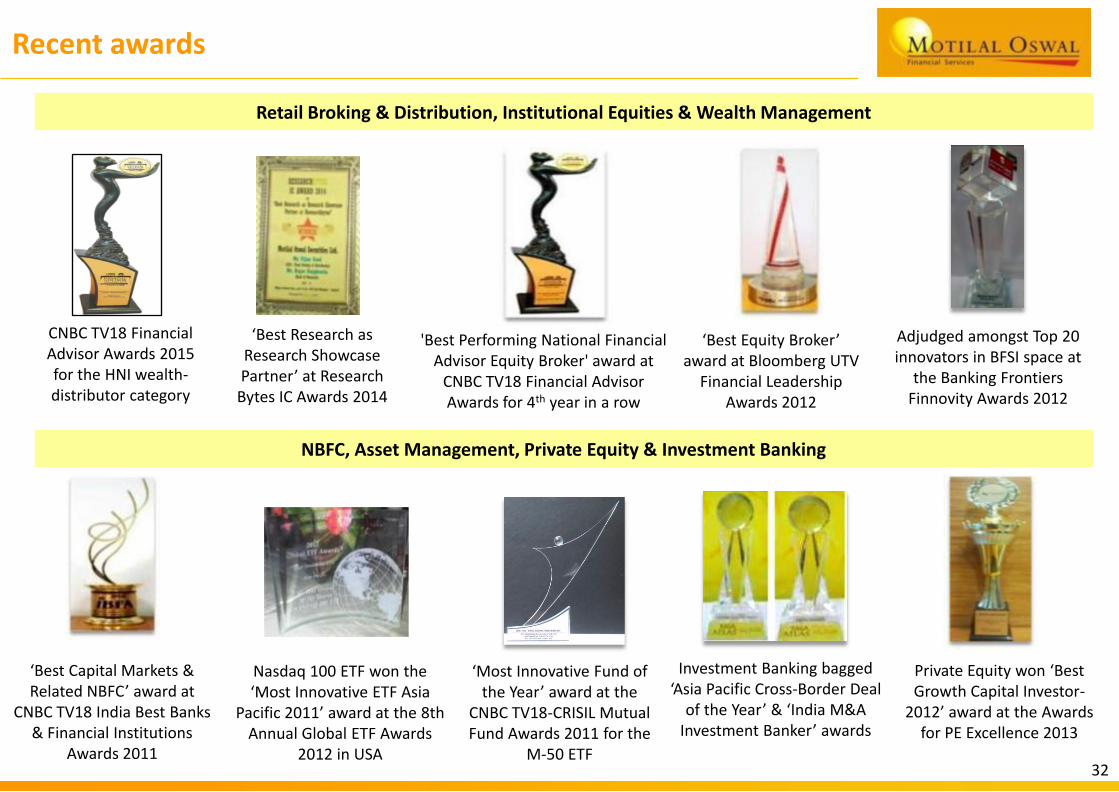
Recent awards
‘Best Capital Markets & Related NBFC’ award at
CNBC TV18 India Best Banks & Financial Institutions
Awards 2011
‘Most Innovative Fund of the Year’ award at the
CNBC TV18-CRISIL Mutual Fund Awards 2011 for the
M-50 ETF
'Best Performing National Financial Advisor Equity Broker' award at
CNBC TV18 Financial Advisor Awards for 4th year in a row
Investment Banking bagged ‘Asia Pacific Cross-Border Deal
of the Year’ & ‘India M&A Investment Banker’ awards
‘Best Equity Broker’ award at Bloomberg UTV
Financial Leadership Awards 2012
Private Equity won ‘Best Growth Capital Investor-
2012’ award at the Awards for PE Excellence 2013
Nasdaq 100 ETF won the ‘Most Innovative ETF Asia
Pacific 2011’ award at the 8th Annual Global ETF Awards
2012 in USA
Adjudged amongst Top 20 innovators in BFSI space at
the Banking Frontiers Finnovity Awards 2012
‘Best Research as Research Showcase Partner’ at Research
Bytes IC Awards 2014
Retail Broking & Distribution, Institutional Equities & Wealth Management
NBFC, Asset Management, Private Equity & Investment Banking
32
CNBC TV18 Financial Advisor Awards 2015 for the HNI wealth-distributor category
Group’s Evolution
Strategic Imperatives
Performance against Strategy
Industry Trends: Rationale for India’s savings story remains strong
Presentation Plan
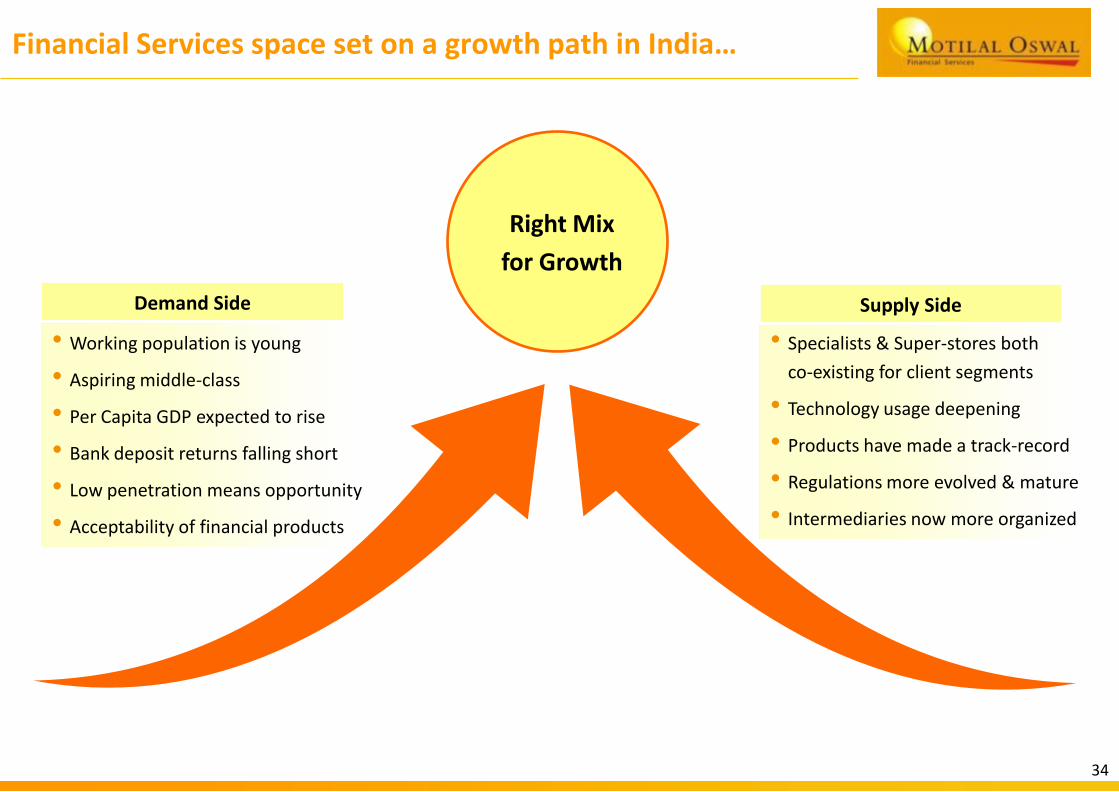
• Specialists & Super-stores both
co-existing for client segments
• Technology usage deepening
• Products have made a track-record
• Regulations more evolved & mature
• Intermediaries now more organized
• Working population is young
• Aspiring middle-class
• Per Capita GDP expected to rise
• Bank deposit returns falling short
• Low penetration means opportunity
• Acceptability of financial products
Right Mix
for Growth
Financial Services space set on a growth path in India…
34
Demand Side Supply Side
-6%
-5%
-4%
-3%
-2%
-1%
0%
1%
2%
3%
4%
5%
6%
(12.0)
(10.0)
(8.0)
(6.0)
(4.0)
(2.0)
-
2.0
4.0
6.0
8.0
10.0
12.0
FY9
6
FY9
7
FY9
8
FY9
9
FY0
0
FY0
1
FY0
2
FY0
3
FY0
4
FY0
5
FY0
6
FY0
7
FY0
8
FY0
9
FY1
0
FY1
1
FY1
2
FY1
3
Differential between WPI Inflation % and Per Capita Income growth %
Changes in Fin. Assets - Shares & Debentures (Rs Bn)
7% 8%
4%
7%8%
4%5%
4%
8%7%
9% 10% 9%
7%
9% 9%
7%
4%
24%
30%
47%
68%
FY9
6
FY9
7
FY9
8
FY9
9
FY0
0
FY0
1
FY0
2
FY0
3
FY0
4
FY0
5
FY0
6
FY0
7
FY0
8
FY0
9
FY1
0
FY1
1
FY1
2
FY1
3
YoY Growth % in GDP (GDP at Constant Prices)
Gross Domestic Savings (GDS) as % of GDP
Household Financial Savings as % of Total Household Savings
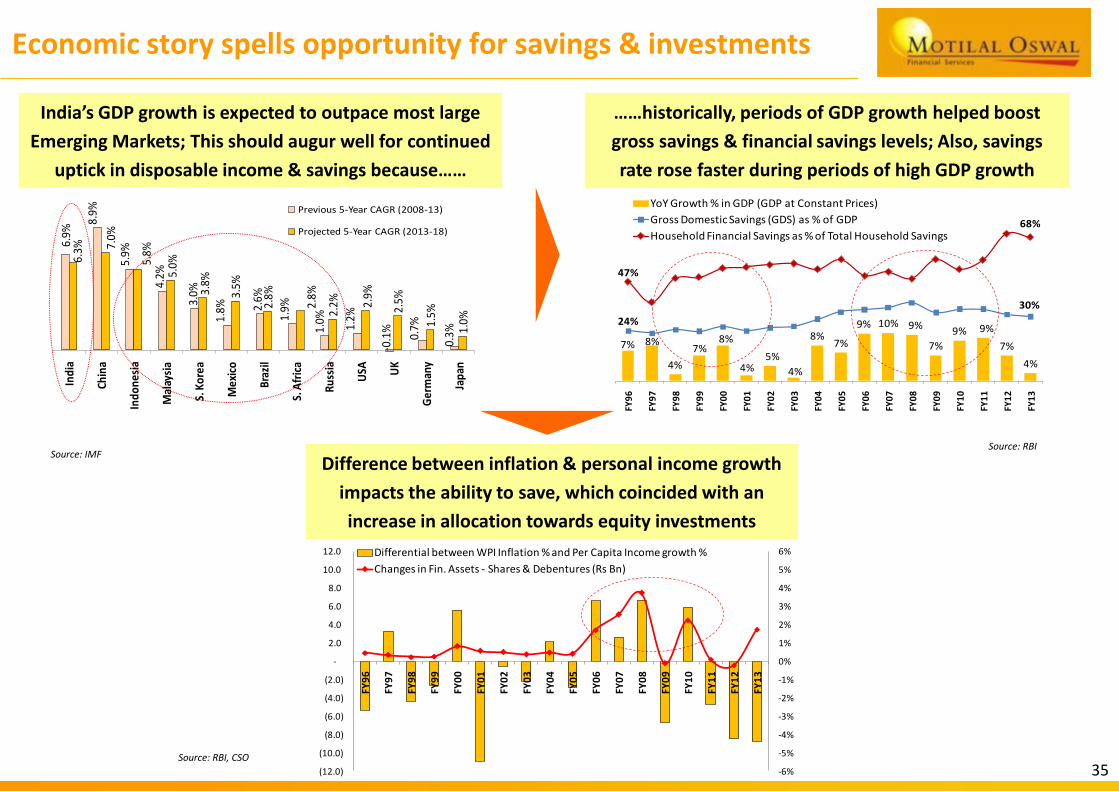
India’s GDP growth is expected to outpace most large
Emerging Markets; This should augur well for continued
uptick in disposable income & savings because……
Economic story spells opportunity for savings & investments
Source: RBISource: IMF
35
……historically, periods of GDP growth helped boost
gross savings & financial savings levels; Also, savings
rate rose faster during periods of high GDP growth
6.9%
8.9%
5.9%
4.2%
3.0%
1.8% 2.
6%
1.9%
1.0% 1.2%
-0.1
%
0.7%
0.3%
6.3% 7.
0%
5.8%
5.0%
3.8%
3.5%
2.8%
2.8%
2.2% 2.
9%
2.5%
1.5%
1.0%
Ind
ia
Chin
a
Ind
on
esia
Mal
aysi
a
S. K
ore
a
Mex
ico
Bra
zil
S. A
fric
a
Rus
sia
USA U
K
Ger
man
y
Japa
n
Previous 5-Year CAGR (2008-13)
Projected 5-Year CAGR (2013-18)
Difference between inflation & personal income growth
impacts the ability to save, which coincided with an
increase in allocation towards equity investments
Source: RBI, CSO
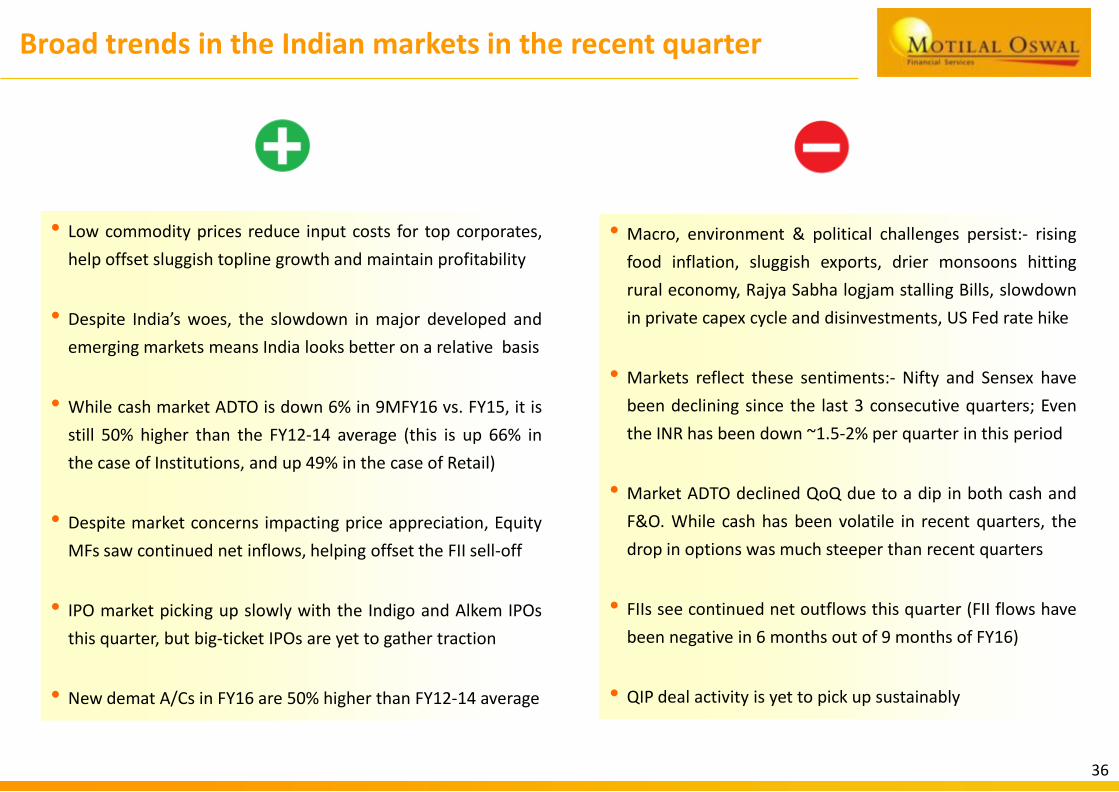
Broad trends in the Indian markets in the recent quarter
• Low commodity prices reduce input costs for top corporates,
help offset sluggish topline growth and maintain profitability
• Despite India’s woes, the slowdown in major developed and
emerging markets means India looks better on a relative basis
• While cash market ADTO is down 6% in 9MFY16 vs. FY15, it is
still 50% higher than the FY12-14 average (this is up 66% in
the case of Institutions, and up 49% in the case of Retail)
• Despite market concerns impacting price appreciation, Equity
MFs saw continued net inflows, helping offset the FII sell-off
• IPO market picking up slowly with the Indigo and Alkem IPOs
this quarter, but big-ticket IPOs are yet to gather traction
• New demat A/Cs in FY16 are 50% higher than FY12-14 average
36
• Macro, environment & political challenges persist:- rising
food inflation, sluggish exports, drier monsoons hitting
rural economy, Rajya Sabha logjam stalling Bills, slowdown
in private capex cycle and disinvestments, US Fed rate hike
• Markets reflect these sentiments:- Nifty and Sensex have
been declining since the last 3 consecutive quarters; Even
the INR has been down ~1.5-2% per quarter in this period
• Market ADTO declined QoQ due to a dip in both cash and
F&O. While cash has been volatile in recent quarters, the
drop in options was much steeper than recent quarters
• FIIs see continued net outflows this quarter (FII flows have
been negative in 6 months out of 9 months of FY16)
• QIP deal activity is yet to pick up sustainably
31%
69% Q3FY15
29%
71%Q3FY16
Delivery to Cash Volumes Intraday to Cash Volumes
76% 77% 78% 83% 77% 74%
16%16% 15%
12%16% 18%
5% 5% 4%4%
5% 5%2% 2% 2% 2% 2% 2%
FY13 FY14 FY15 Q3FY15 Q2FY16 Q3FY16
Delivery Intraday Futures Options
39 40 65 62 62 5592 93 149 135 146 133275 325513 470 518 456
1,2741,565
2,614 3,1692,423
1,832
FY13 FY14 FY15 Q3FY15 Q2FY16 Q3FY16
Options Futures Intraday Delivery
3,836
2,022
3,340
1,679
3,148
2,476
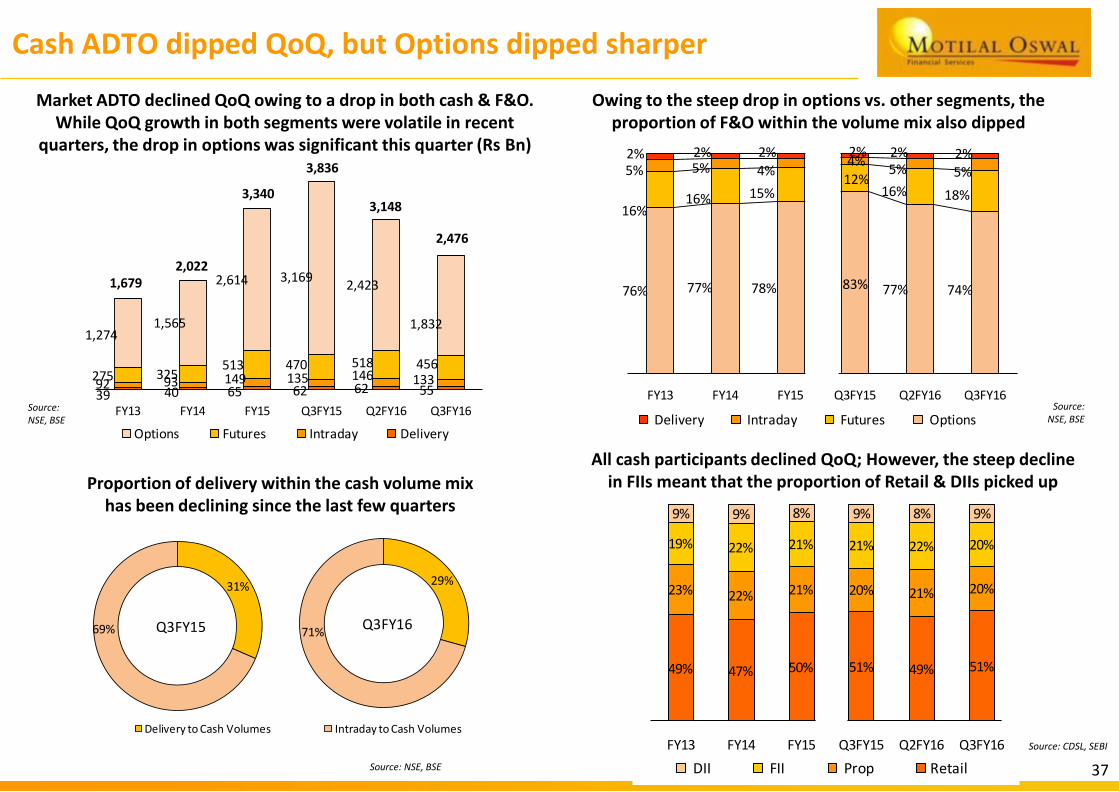
Cash ADTO dipped QoQ, but Options dipped sharper
Source: NSE, BSE
Source: NSE, BSE
37Source: NSE, BSE
Owing to the steep drop in options vs. other segments, the proportion of F&O within the volume mix also dipped
Proportion of delivery within the cash volume mix has been declining since the last few quarters
Market ADTO declined QoQ owing to a drop in both cash & F&O. While QoQ growth in both segments were volatile in recent
quarters, the drop in options was significant this quarter (Rs Bn)
All cash participants declined QoQ; However, the steep decline in FIIs meant that the proportion of Retail & DIIs picked up
Source: CDSL, SEBI
49% 47% 50% 51% 49% 51%
23% 22% 21% 20% 21% 20%
19% 22% 21% 21% 22% 20%
9% 9% 8% 9% 8% 9%
FY13 FY14 FY15 Q3FY15 Q2FY16 Q3FY16
DII FII Prop Retail
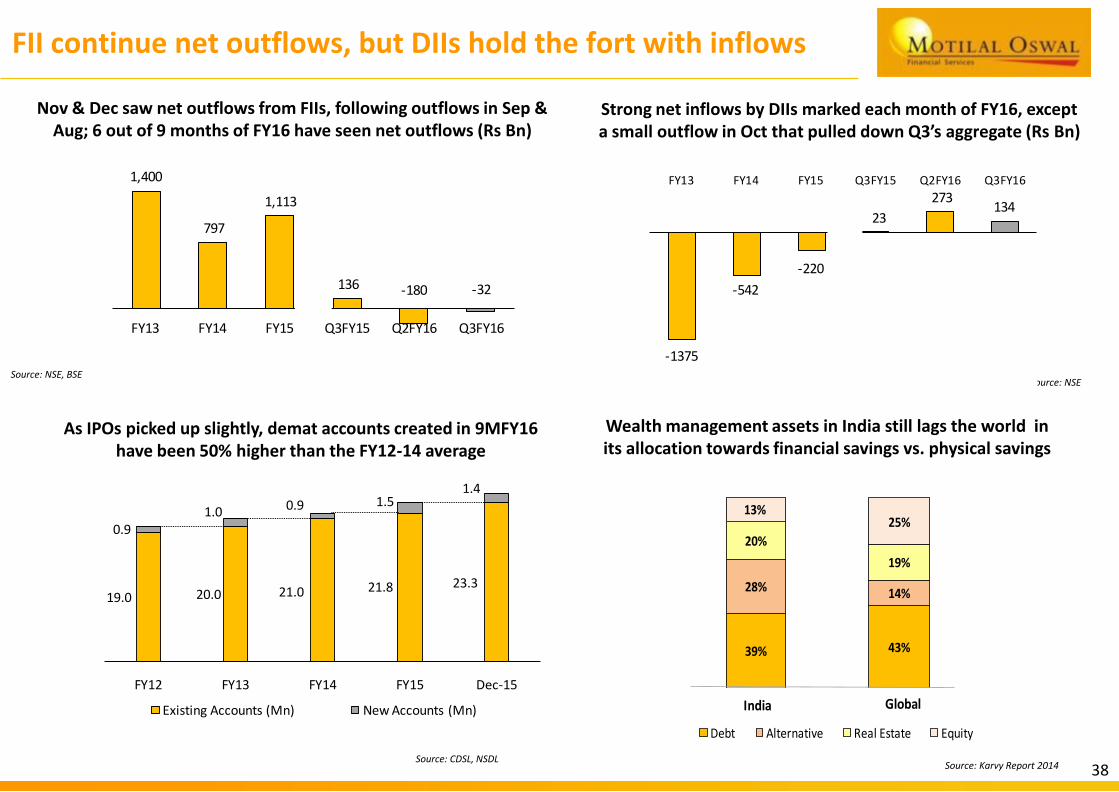
FII continue net outflows, but DIIs hold the fort with inflows
Source: NSE
Strong net inflows by DIIs marked each month of FY16, except a small outflow in Oct that pulled down Q3’s aggregate (Rs Bn)
38
As IPOs picked up slightly, demat accounts created in 9MFY16 have been 50% higher than the FY12-14 average
Source: CDSL, NSDL
Source: NSE, BSE
Nov & Dec saw net outflows from FIIs, following outflows in Sep & Aug; 6 out of 9 months of FY16 have seen net outflows (Rs Bn)
Wealth management assets in India still lags the world in its allocation towards financial savings vs. physical savings
39% 43%
28% 14%
20%
19%
13%25%
Debt Alternative Real Estate Equity
India Global
Source: Karvy Report 2014
1,400
797
1,113
136 -180 -32
FY13 FY14 FY15 Q3FY15 Q2FY16 Q3FY16
-1375
-542
-220
23
273134
FY13 FY14 FY15 Q3FY15 Q2FY16 Q3FY16
19.0 20.0 21.0 21.8 23.3
0.91.0 0.9 1.5
1.4
FY12 FY13 FY14 FY15 Dec-15
Existing Accounts (Mn) New Accounts (Mn)
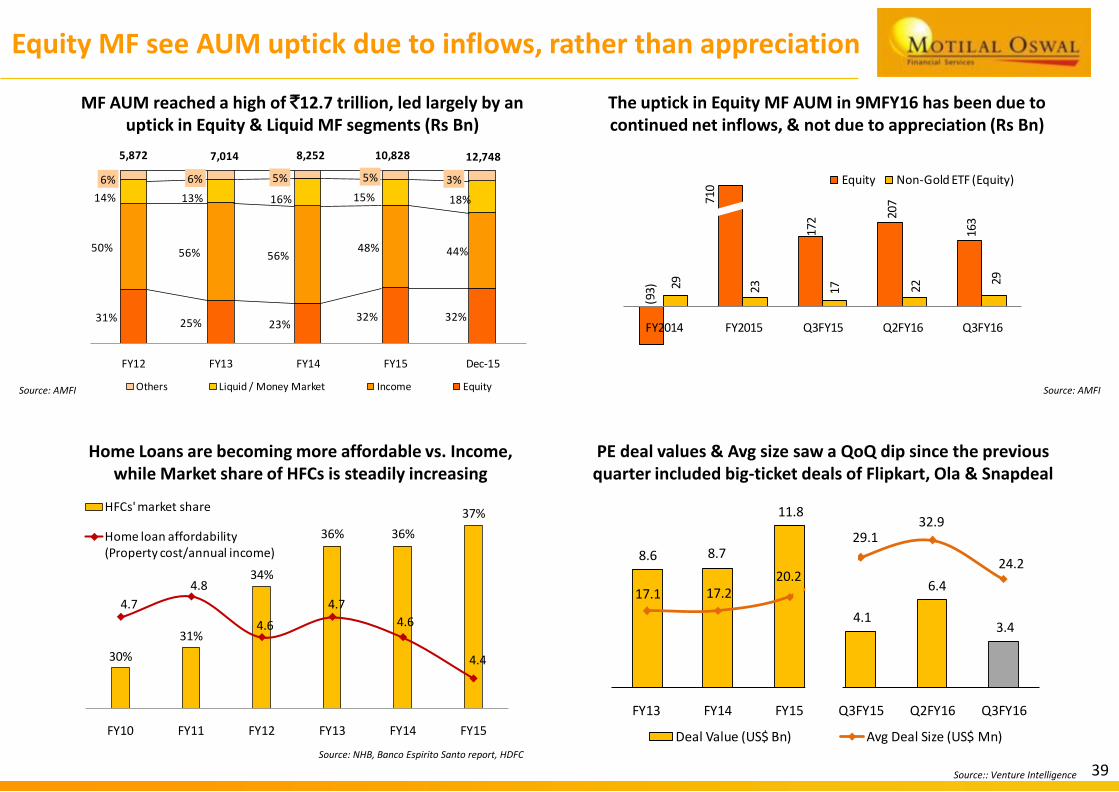
8.6 8.7
11.8
4.1
6.4
3.4
17.1 17.220.2
29.132.9
24.2
FY13 FY14 FY15 Q3FY15 Q2FY16 Q3FY16
Deal Value (US$ Bn) Avg Deal Size (US$ Mn)
31% 25% 23%32% 32%
50% 56% 56%48% 44%
14% 13% 16% 15% 18%
6% 6% 5% 5% 3%
FY12 FY13 FY14 FY15 Dec-15
Others Liquid / Money Market Income Equity
5,872 7,014 8,252 10,828 12,748
30%
31%
34%
36% 36%
37%
4.7
4.8
4.6
4.7
4.6
4.4
FY10 FY11 FY12 FY13 FY14 FY15
HFCs' market share
Home loan affordability (Property cost/annual income)
Equity MF see AUM uptick due to inflows, rather than appreciation
Source: AMFI
The uptick in Equity MF AUM in 9MFY16 has been due to continued net inflows, & not due to appreciation (Rs Bn)
Source: NHB, Banco Espirito Santo report, HDFC
Source: AMFI
MF AUM reached a high of `12.7 trillion, led largely by an uptick in Equity & Liquid MF segments (Rs Bn)
Home Loans are becoming more affordable vs. Income, while Market share of HFCs is steadily increasing
Source:: Venture Intelligence
PE deal values & Avg size saw a QoQ dip since the previous quarter included big-ticket deals of Flipkart, Ola & Snapdeal
39
(93)
172 20
7
163
29
23
17
22 29
FY2014 FY2015 Q3FY15 Q2FY16 Q3FY16
Equity Non-Gold ETF (Equity)
710
This report is for information purposes only and does not construe to be any investment, legal or taxation advice. It is not intended as an offer or
solicitation for the purchase or sale of any financial instrument. Any action taken by you on the basis of the information contained herein is your
responsibility alone and MOFSL and its subsidiaries or its employees or directors, associates will not be liable in any manner for the consequences
of such action taken by you. We have exercised due diligence in checking the correctness and authenticity of the information contained herein,
but do not represent that it is accurate or complete. MOFSL or any of its subsidiaries or associates or employees shall not be in any way
responsible for any loss or damage that may arise to any person from any inadvertent error in the information contained in this publication. The
recipient of this report should rely on their own investigations. MOFSL and/or its subsidiaries and/or directors, employees or associates may have
interests or positions, financial or otherwise in the securities mentioned in this report.
Thank You
Contact:
Sameer Kamath
Group Chief Financial Officer
Motilal Oswal Financial Services Limited
Tel: 91-22-3982-5500 / 91-22-39825554
Fax: 91-22-2282-3499
Email: [email protected]
Sourajit Aiyer
AVP - Investor Relations & Corporate Planning
Motilal Oswal Financial Services Limited
Tel: 91-22-3982-5500 / 91-22-39825510
Fax: 91-22-2282-3499
Email: [email protected] /