motilal oswal financial services ltd · 2009-06-04 · motilal oswal financial services ltd. 2 ......
TRANSCRIPT
Earnings Update – Q4 FY09 and FY09Audited Results
Motilal Oswal Financial Services Ltd
2
• Q4 FY09 and FY09 Performance highlights
• MOFSL Financials (Consolidated)
• Business snapshots
• About us
3
Q4 FY09 and FY09 Performance highlights
4
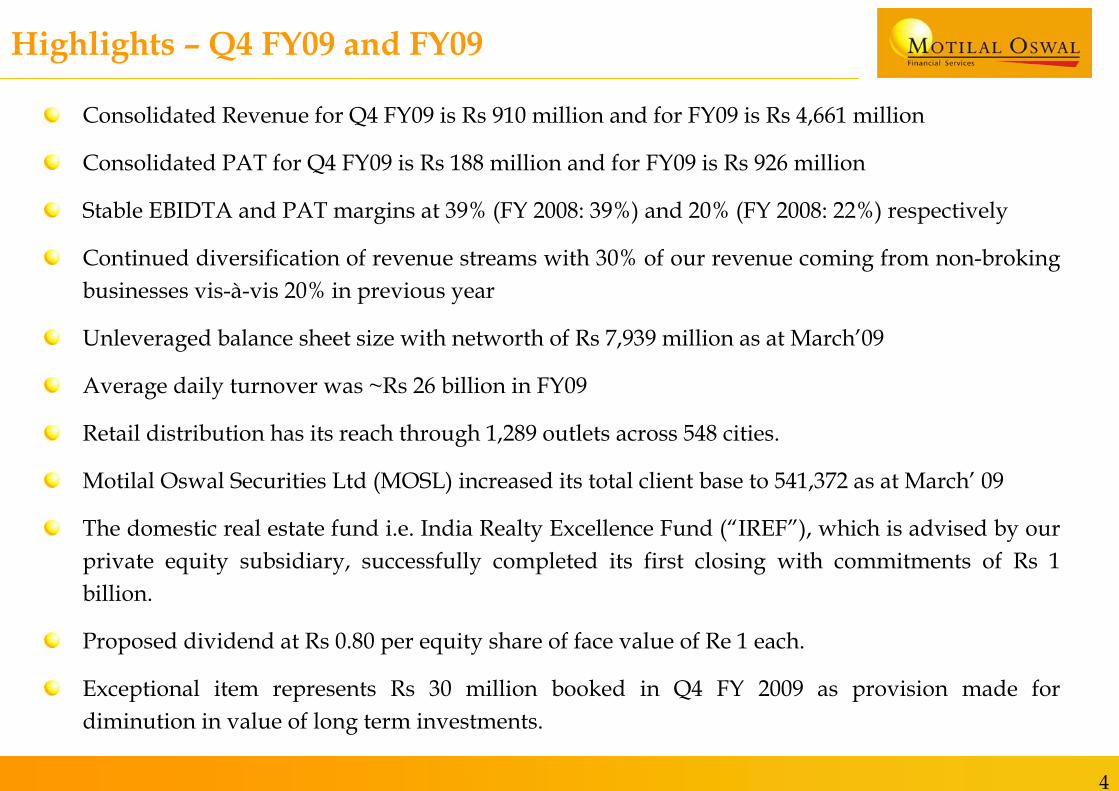
Consolidated Revenue for Q4 FY09 is Rs 910 million and for FY09 is Rs 4,661 million
Consolidated PAT for Q4 FY09 is Rs 188 million and for FY09 is Rs 926 million
Stable EBIDTA and PAT margins at 39% (FY 2008: 39%) and 20% (FY 2008: 22%) respectively
Continued diversification of revenue streams with 30% of our revenue coming from non-broking businesses vis-à-vis 20% in previous year
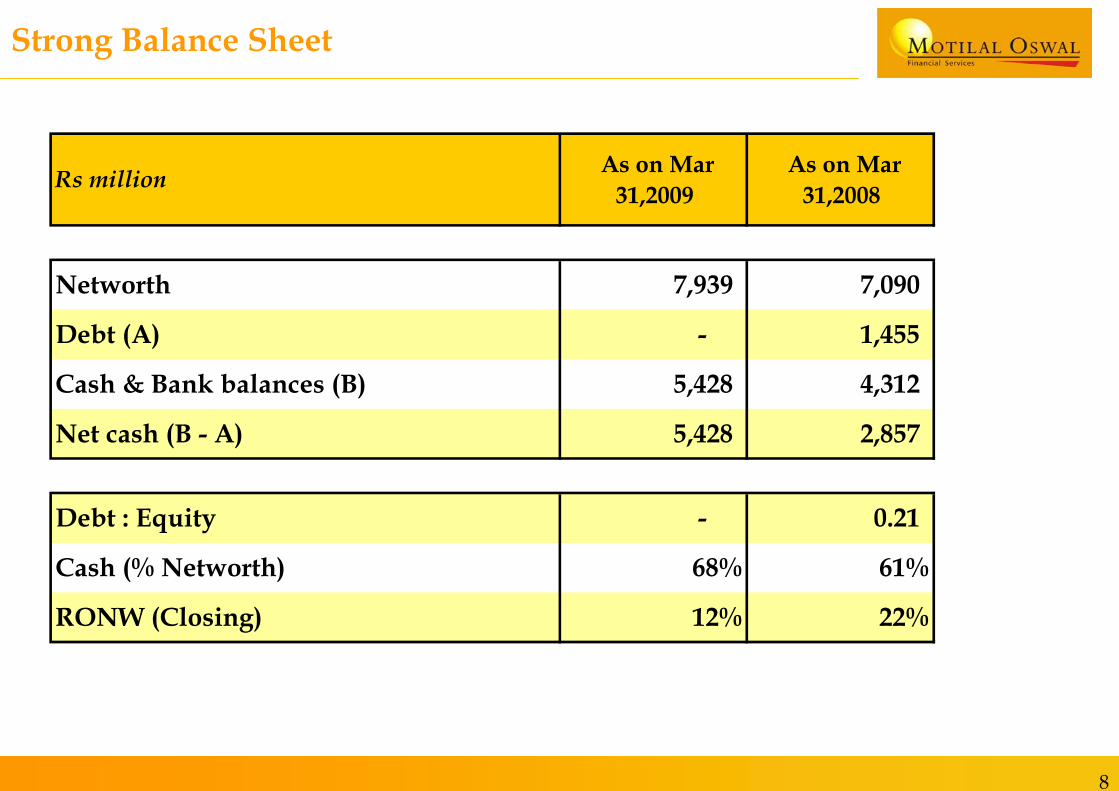
Unleveraged balance sheet size with networth of Rs 7,939 million as at March’09
Average daily turnover was ~Rs 26 billion in FY09
Retail distribution has its reach through 1,289 outlets across 548 cities.
Motilal Oswal Securities Ltd (MOSL) increased its total client base to 541,372 as at March’ 09
The domestic real estate fund i.e. India Realty Excellence Fund (“IREF”), which is advised by our private equity subsidiary, successfully completed its first closing with commitments of Rs 1 billion.
Proposed dividend at Rs 0.80 per equity share of face value of Re 1 each.
Exceptional item represents Rs 30 million booked in Q4 FY 2009 as provision made for diminution in value of long term investments.
Highlights – Q4 FY09 and FY09
5
Consolidated Financials
6
Consolidated Financials
Particulars Q4 FY09 Q3 FY09 Q4 FY09 Q4 FY08 FY09 FY08
Rs million As on Mar 31,2009
As on Dec 31,2008
As on Mar 31,2009
As on Mar 31,2008
As on Mar 31,2009
As on Mar 31,2008
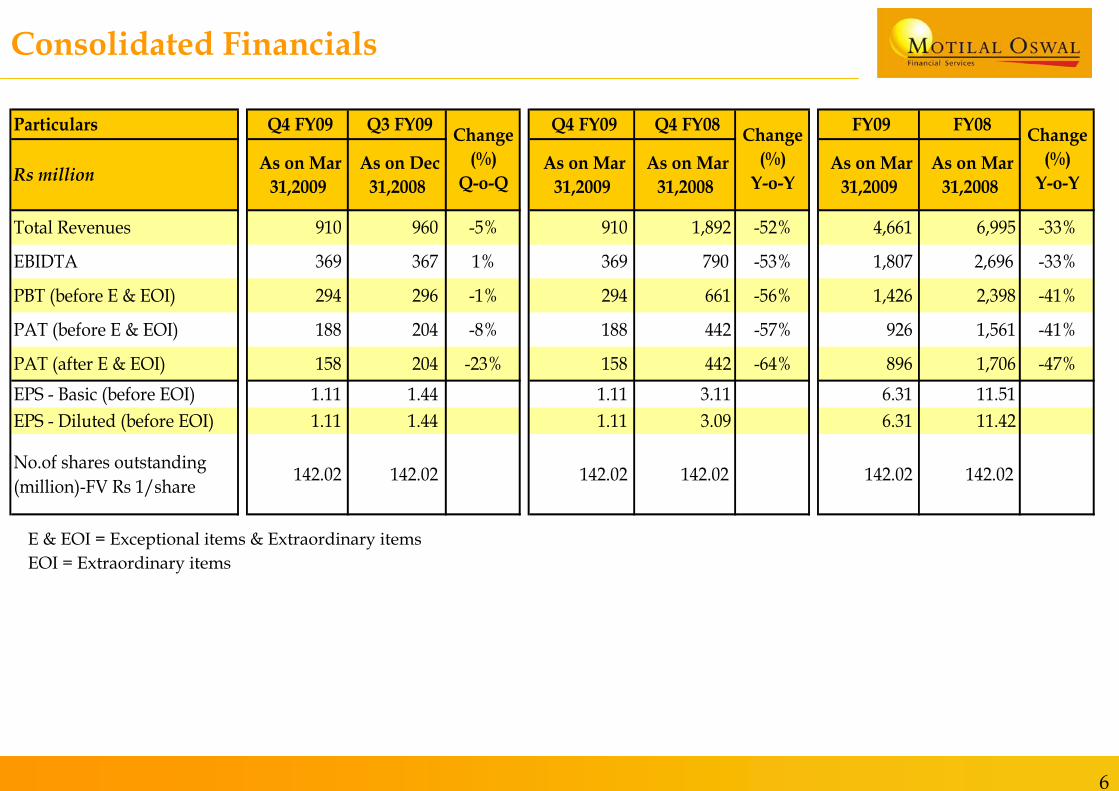
Total Revenues 910 960 -5% 910 1,892 -52% 4,661 6,995 -33%
EBIDTA 369 367 1% 369 790 -53% 1,807 2,696 -33%
PBT (before E & EOI) 294 296 -1% 294 661 -56% 1,426 2,398 -41%
PAT (before E & EOI) 188 204 -8% 188 442 -57% 926 1,561 -41%
PAT (after E & EOI) 158 204 -23% 158 442 -64% 896 1,706 -47%EPS - Basic (before EOI) 1.11 1.44 1.11 3.11 6.31 11.51 EPS - Diluted (before EOI) 1.11 1.44 1.11 3.09 6.31 11.42
No.of shares outstanding (million)-FV Rs 1/share 142.02 142.02 142.02 142.02 142.02 142.02
Change (%)
Q-o-Q
Change (%)
Y-o-Y
Change (%)
Y-o-Y
E & EOI = Exceptional items & Extraordinary itemsEOI = Extraordinary items
7
Revenue composition
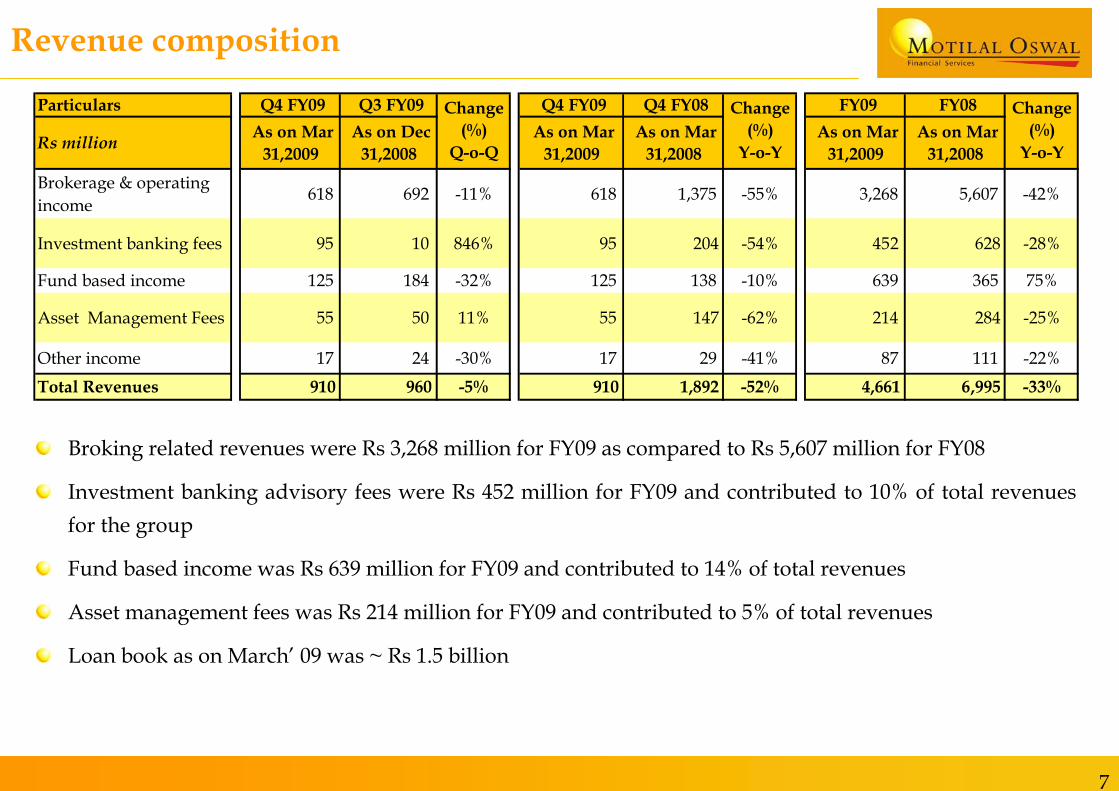
Broking related revenues were Rs 3,268 million for FY09 as compared to Rs 5,607 million for FY08
Investment banking advisory fees were Rs 452 million for FY09 and contributed to 10% of total revenues for the group
Fund based income was Rs 639 million for FY09 and contributed to 14% of total revenues
Asset management fees was Rs 214 million for FY09 and contributed to 5% of total revenues
Loan book as on March’ 09 was ~ Rs 1.5 billion
Particulars Q4 FY09 Q3 FY09 Q4 FY09 Q4 FY08 FY09 FY08
Rs million As on Mar 31,2009
As on Dec 31,2008
As on Mar 31,2009
As on Mar 31,2008
As on Mar 31,2009
As on Mar 31,2008
Brokerage & operating income 618 692 -11% 618 1,375 -55% 3,268 5,607 -42%
Investment banking fees 95 10 846% 95 204 -54% 452 628 -28%
Fund based income 125 184 -32% 125 138 -10% 639 365 75%
Asset Management Fees 55 50 11% 55 147 -62% 214 284 -25%
Other income 17 24 -30% 17 29 -41% 87 111 -22%Total Revenues 910 960 -5% 910 1,892 -52% 4,661 6,995 -33%
Change (%)
Q-o-Q
Change (%)
Y-o-Y
Change (%)
Y-o-Y
8
Strong Balance Sheet
Rs million As on Mar 31,2009
As on Mar 31,2008
Networth 7,939 7,090
Debt (A) - 1,455
Cash & Bank balances (B) 5,428 4,312
Net cash (B - A) 5,428 2,857
Debt : Equity - 0.21
Cash (% Networth) 68% 61%
RONW (Closing) 12% 22%
9
Business Snapshot
10
MOSL
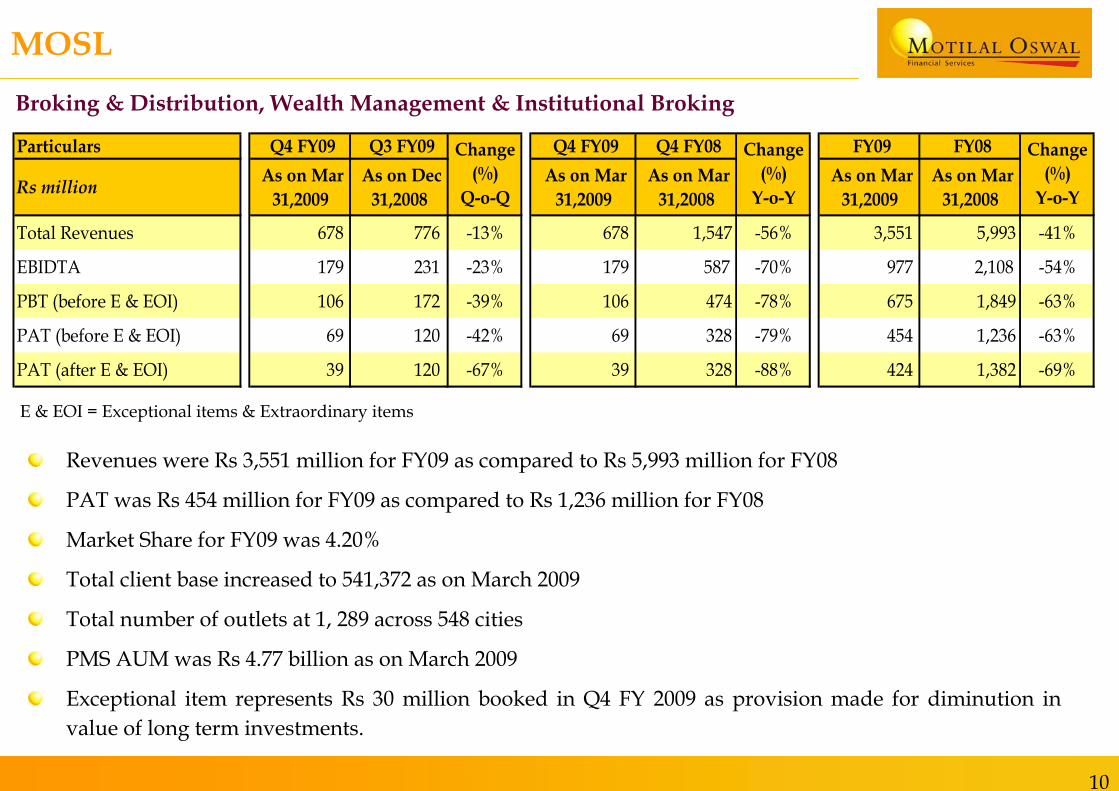
Revenues were Rs 3,551 million for FY09 as compared to Rs 5,993 million for FY08
PAT was Rs 454 million for FY09 as compared to Rs 1,236 million for FY08
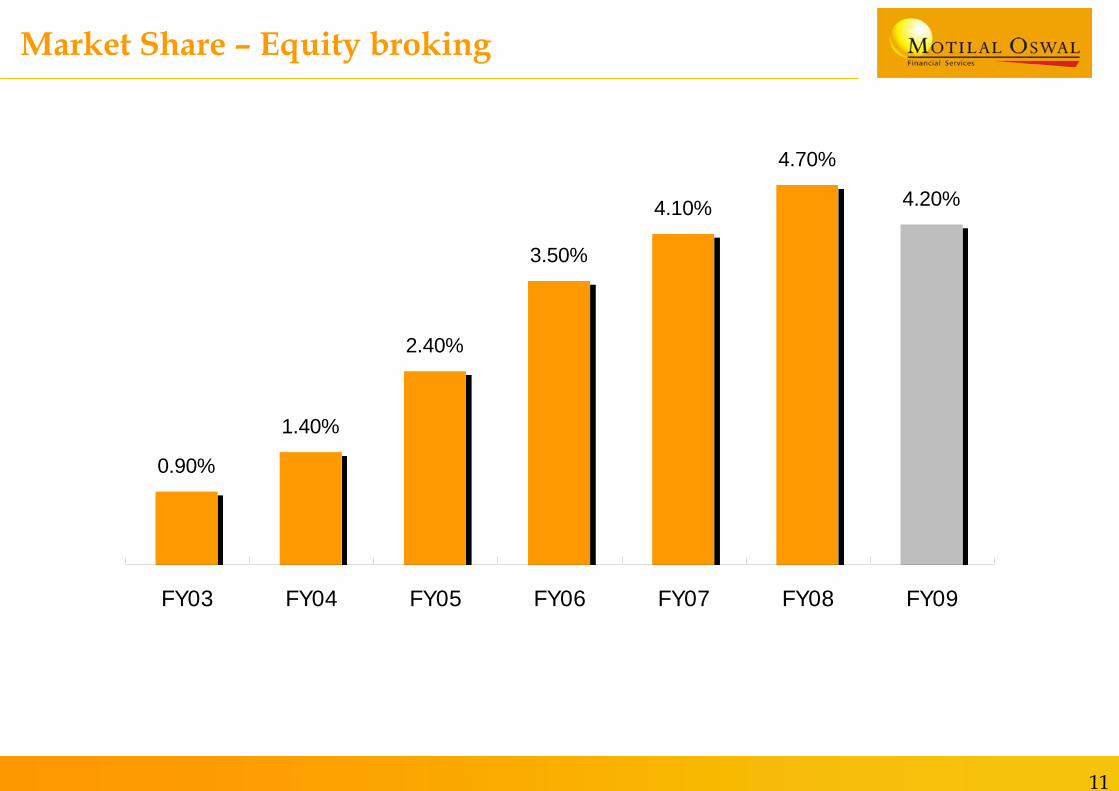
Market Share for FY09 was 4.20%
Total client base increased to 541,372 as on March 2009
Total number of outlets at 1, 289 across 548 cities
PMS AUM was Rs 4.77 billion as on March 2009
Exceptional item represents Rs 30 million booked in Q4 FY 2009 as provision made for diminution in value of long term investments.
E & EOI = Exceptional items & Extraordinary items
Broking & Distribution, Wealth Management & Institutional Broking
Particulars Q4 FY09 Q3 FY09 Q4 FY09 Q4 FY08 FY09 FY08
Rs million As on Mar 31,2009
As on Dec 31,2008
As on Mar 31,2009
As on Mar 31,2008
As on Mar 31,2009
As on Mar 31,2008
Total Revenues 678 776 -13% 678 1,547 -56% 3,551 5,993 -41%
EBIDTA 179 231 -23% 179 587 -70% 977 2,108 -54%
PBT (before E & EOI) 106 172 -39% 106 474 -78% 675 1,849 -63%
PAT (before E & EOI) 69 120 -42% 69 328 -79% 454 1,236 -63%
PAT (after E & EOI) 39 120 -67% 39 328 -88% 424 1,382 -69%
Change (%)
Q-o-Q
Change (%)
Y-o-Y
Change (%)
Y-o-Y
11
Market Share – Equity broking
0.90%
1.40%
2.40%
3.50%
4.10%
4.70%
4.20%
FY03 FY04 FY05 FY06 FY07 FY08 FY09
12
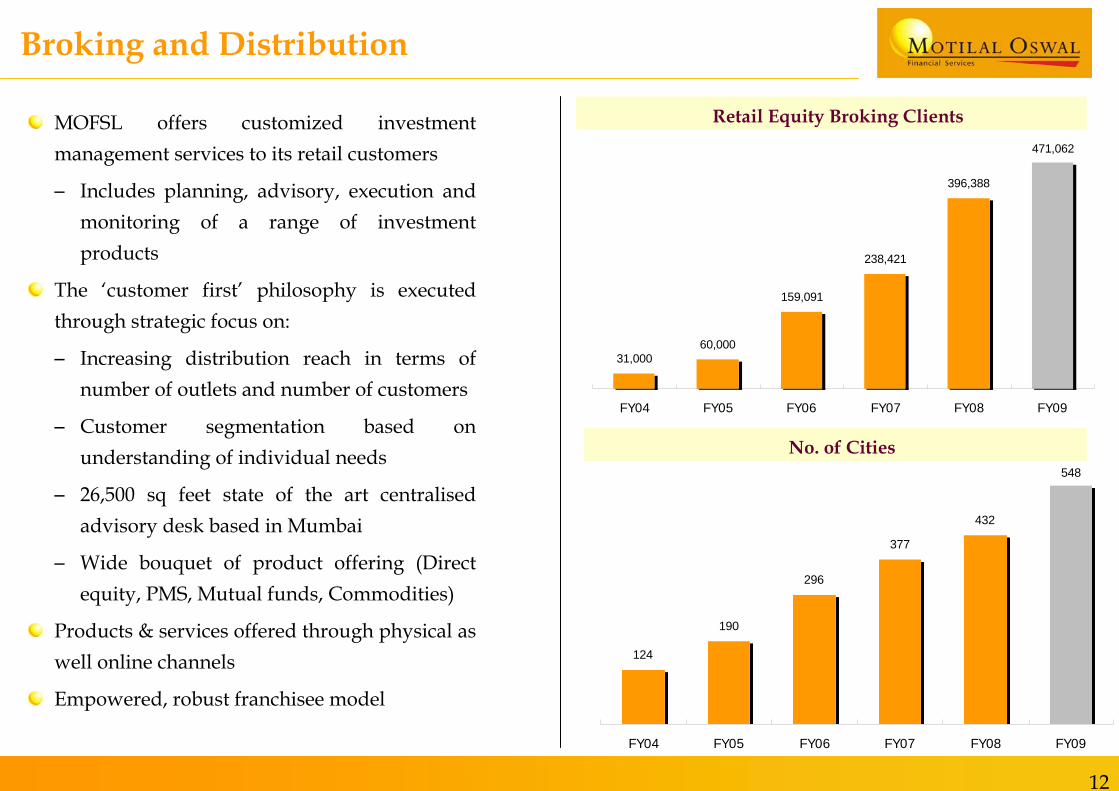
124
190
296
377
432
548
FY04 FY05 FY06 FY07 FY08 FY09
No. of Cities
Broking and Distribution
MOFSL offers customized investment management services to its retail customers
– Includes planning, advisory, execution and monitoring of a range of investment products
The ‘customer first’ philosophy is executed through strategic focus on:
– Increasing distribution reach in terms of number of outlets and number of customers
– Customer segmentation based on understanding of individual needs
– 26,500 sq feet state of the art centralised advisory desk based in Mumbai
– Wide bouquet of product offering (Direct equity, PMS, Mutual funds, Commodities)
Products & services offered through physical as well online channels
Empowered, robust franchisee model
Retail Equity Broking Clients
31,00060,000
159,091
238,421
396,388
471,062
FY04 FY05 FY06 FY07 FY08 FY09
13
Broking and Distribution
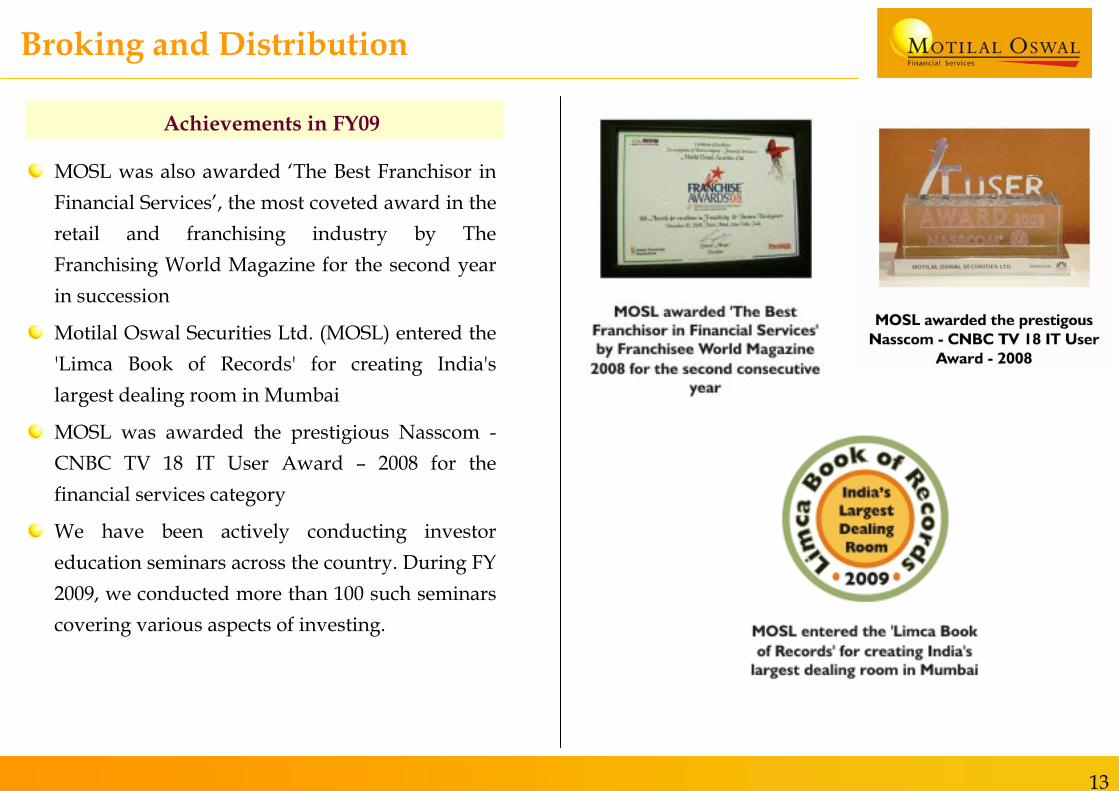
MOSL was also awarded ‘The Best Franchisor in Financial Services’, the most coveted award in the retail and franchising industry by The Franchising World Magazine for the second year in succession
Motilal Oswal Securities Ltd. (MOSL) entered the 'Limca Book of Records' for creating India's largest dealing room in Mumbai
MOSL was awarded the prestigious Nasscom -CNBC TV 18 IT User Award – 2008 for the financial services category
We have been actively conducting investor education seminars across the country. During FY 2009, we conducted more than 100 such seminars covering various aspects of investing.
Achievements in FY09
14
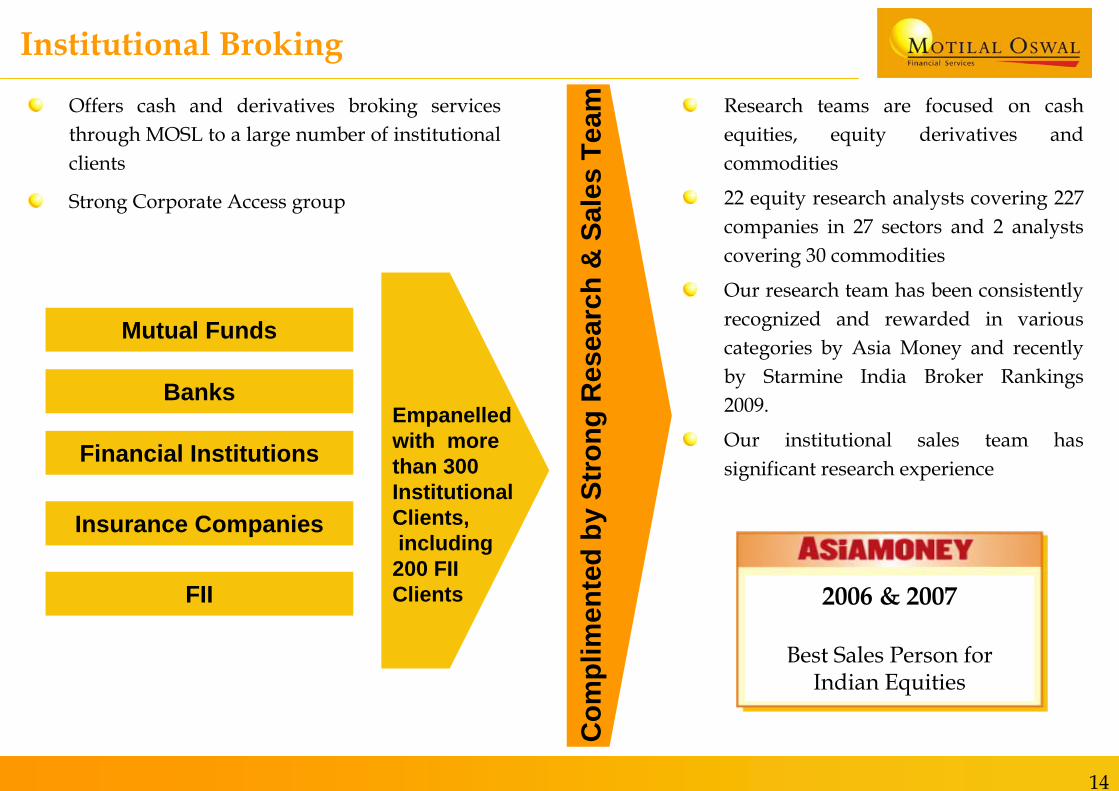
Research teams are focused on cash equities, equity derivatives and commodities
22 equity research analysts covering 227 companies in 27 sectors and 2 analysts covering 30 commodities
Our research team has been consistently recognized and rewarded in various categories by Asia Money and recently by Starmine India Broker Rankings 2009.
Our institutional sales team has significant research experience
Institutional Broking
Offers cash and derivatives broking services through MOSL to a large number of institutional clients
Strong Corporate Access group
Mutual Funds
Banks
Financial Institutions
Insurance Companies
FII
Empanelledwith more than 300 Institutional Clients,including
200 FII Clients
Com
plim
ente
d by
Str
ong
Res
earc
h &
Sal
es T
eam
2006 & 2007
Best Sales Person for Indian Equities
15
Wealth Management
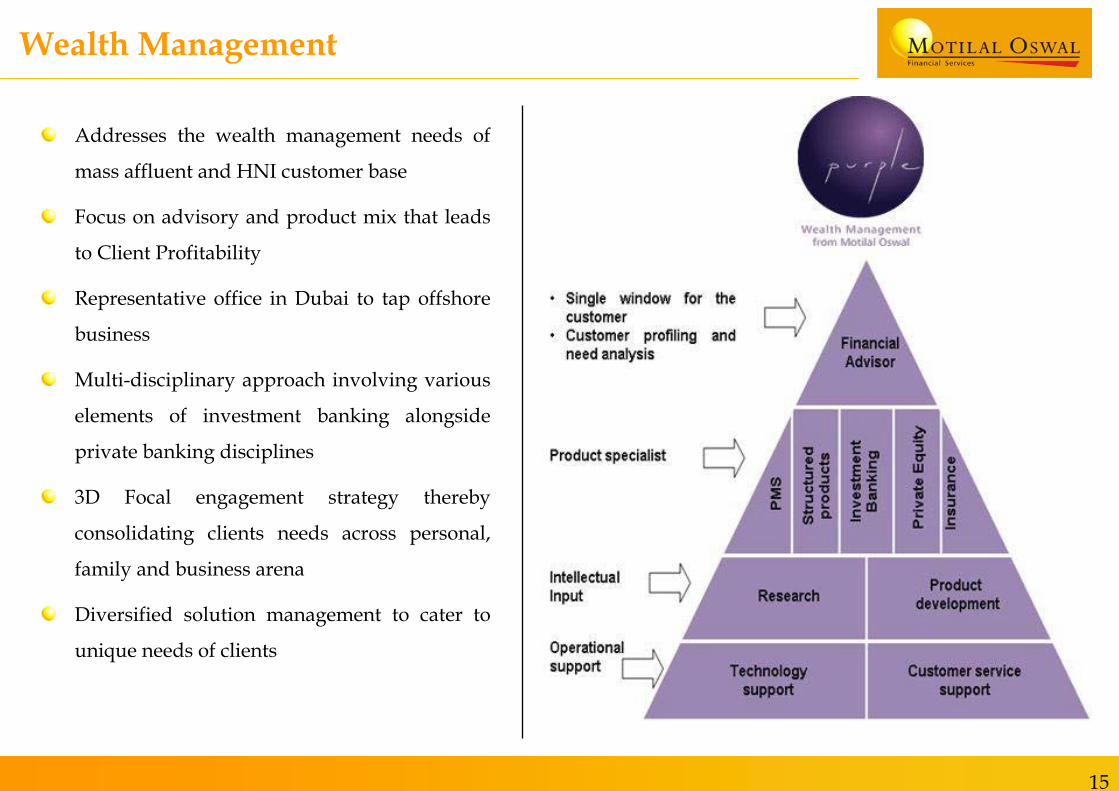
Addresses the wealth management needs of
mass affluent and HNI customer base
Focus on advisory and product mix that leads
to Client Profitability
Representative office in Dubai to tap offshore
business
Multi-disciplinary approach involving various
elements of investment banking alongside
private banking disciplines
3D Focal engagement strategy thereby
consolidating clients needs across personal,
family and business arena
Diversified solution management to cater to
unique needs of clients
16
Private Equity
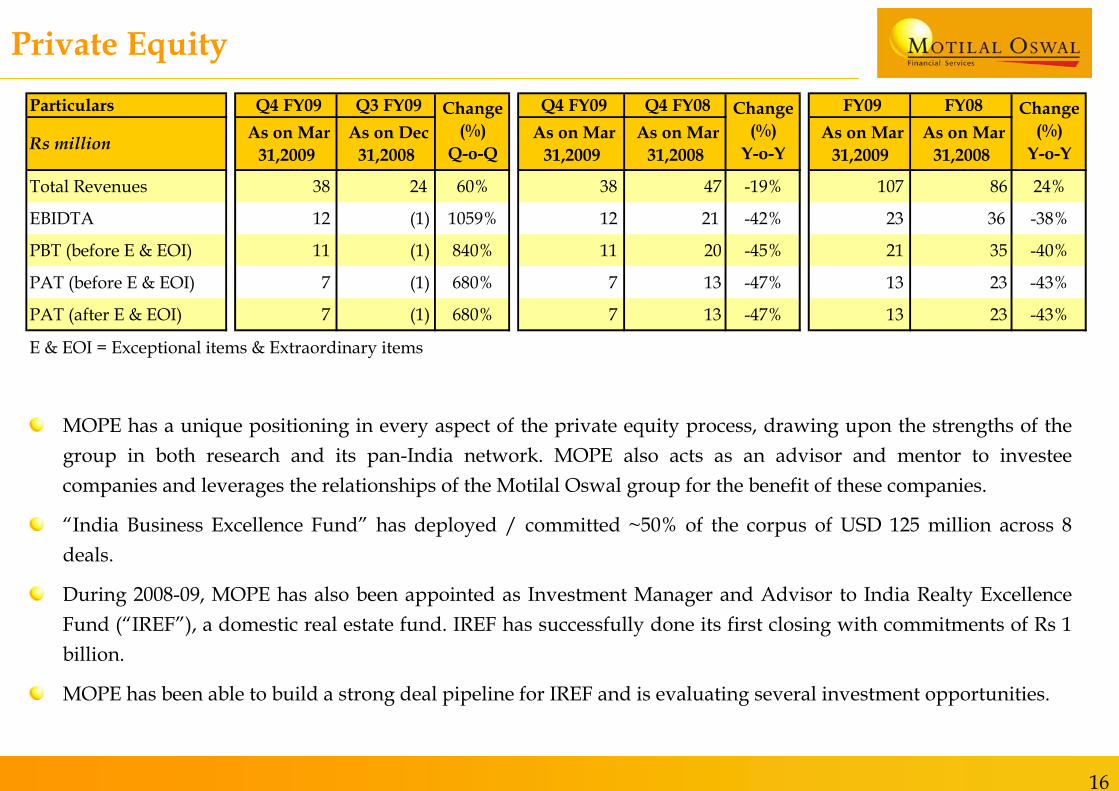
MOPE has a unique positioning in every aspect of the private equity process, drawing upon the strengths of the group in both research and its pan-India network. MOPE also acts as an advisor and mentor to investee companies and leverages the relationships of the Motilal Oswal group for the benefit of these companies.
“India Business Excellence Fund” has deployed / committed ~50% of the corpus of USD 125 million across 8 deals.
During 2008-09, MOPE has also been appointed as Investment Manager and Advisor to India Realty Excellence Fund (“IREF”), a domestic real estate fund. IREF has successfully done its first closing with commitments of Rs 1 billion.
MOPE has been able to build a strong deal pipeline for IREF and is evaluating several investment opportunities.
E & EOI = Exceptional items & Extraordinary items
Particulars Q4 FY09 Q3 FY09 Q4 FY09 Q4 FY08 FY09 FY08
Rs million As on Mar 31,2009
As on Dec 31,2008
As on Mar 31,2009
As on Mar 31,2008
As on Mar 31,2009
As on Mar 31,2008
Total Revenues 38 24 60% 38 47 -19% 107 86 24%
EBIDTA 12 (1) 1059% 12 21 -42% 23 36 -38%
PBT (before E & EOI) 11 (1) 840% 11 20 -45% 21 35 -40%
PAT (before E & EOI) 7 (1) 680% 7 13 -47% 13 23 -43%
PAT (after E & EOI) 7 (1) 680% 7 13 -47% 13 23 -43%
Change (%)
Q-o-Q
Change (%)
Y-o-Y
Change (%)
Y-o-Y
17
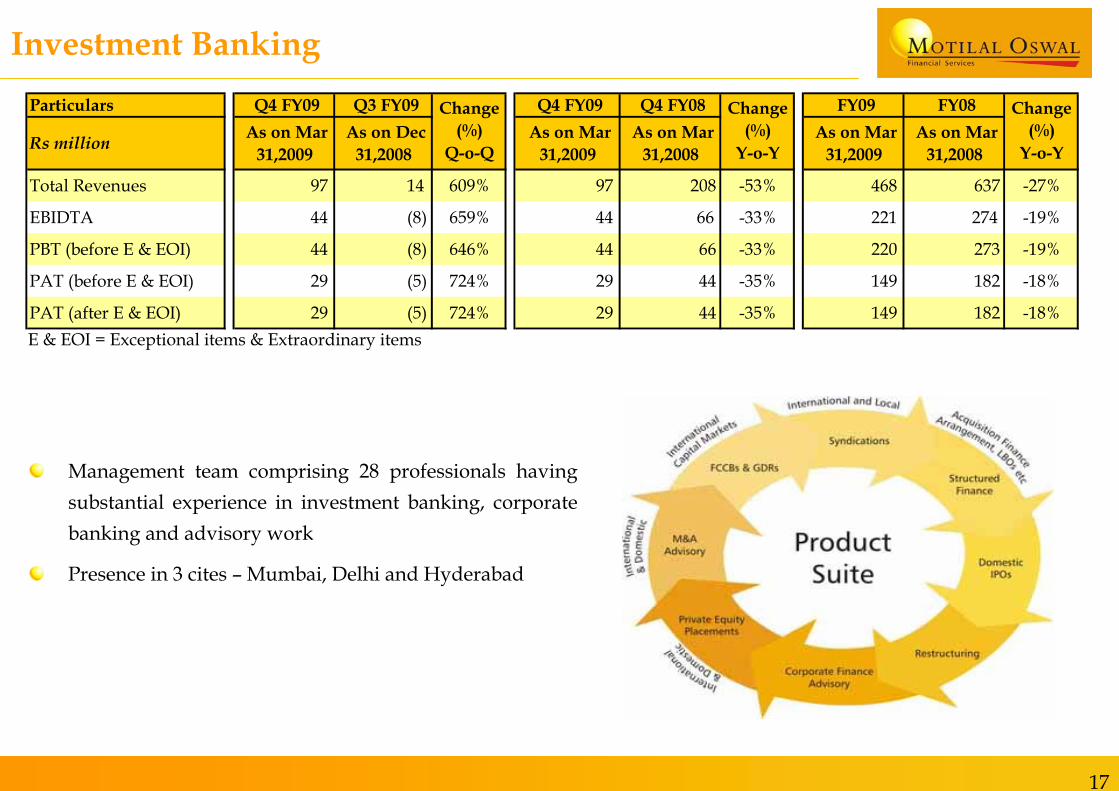
Investment Banking
Management team comprising 28 professionals having substantial experience in investment banking, corporate banking and advisory work
Presence in 3 cites – Mumbai, Delhi and Hyderabad
E & EOI = Exceptional items & Extraordinary items
Particulars Q4 FY09 Q3 FY09 Q4 FY09 Q4 FY08 FY09 FY08
Rs million As on Mar 31,2009
As on Dec 31,2008
As on Mar 31,2009
As on Mar 31,2008
As on Mar 31,2009
As on Mar 31,2008
Total Revenues 97 14 609% 97 208 -53% 468 637 -27%
EBIDTA 44 (8) 659% 44 66 -33% 221 274 -19%
PBT (before E & EOI) 44 (8) 646% 44 66 -33% 220 273 -19%
PAT (before E & EOI) 29 (5) 724% 29 44 -35% 149 182 -18%
PAT (after E & EOI) 29 (5) 724% 29 44 -35% 149 182 -18%
Change (%)
Q-o-Q
Change (%)
Y-o-Y
Change (%)
Y-o-Y

18
About Us
19
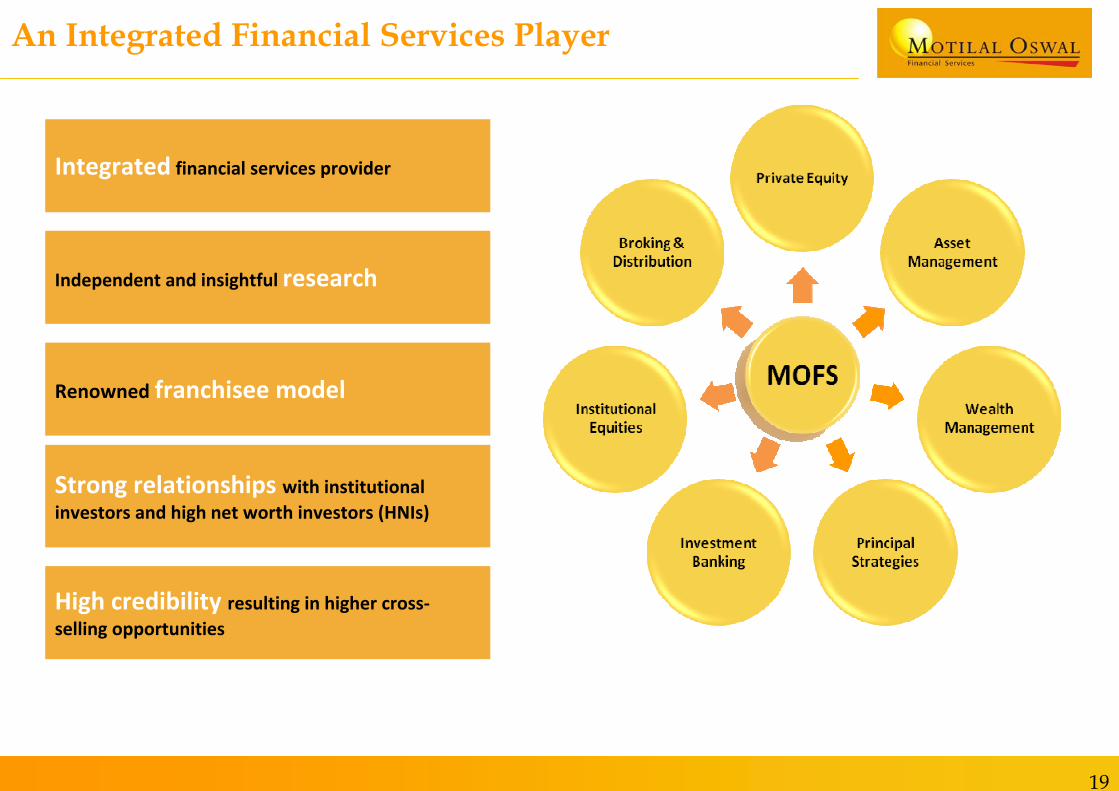
An Integrated Financial Services Player
Independent and insightful research
Renowned franchisee model
Strong relationships with institutional investors and high net worth investors (HNIs)
High credibility resulting in higher cross‐selling opportunities
Integrated financial services provider
20
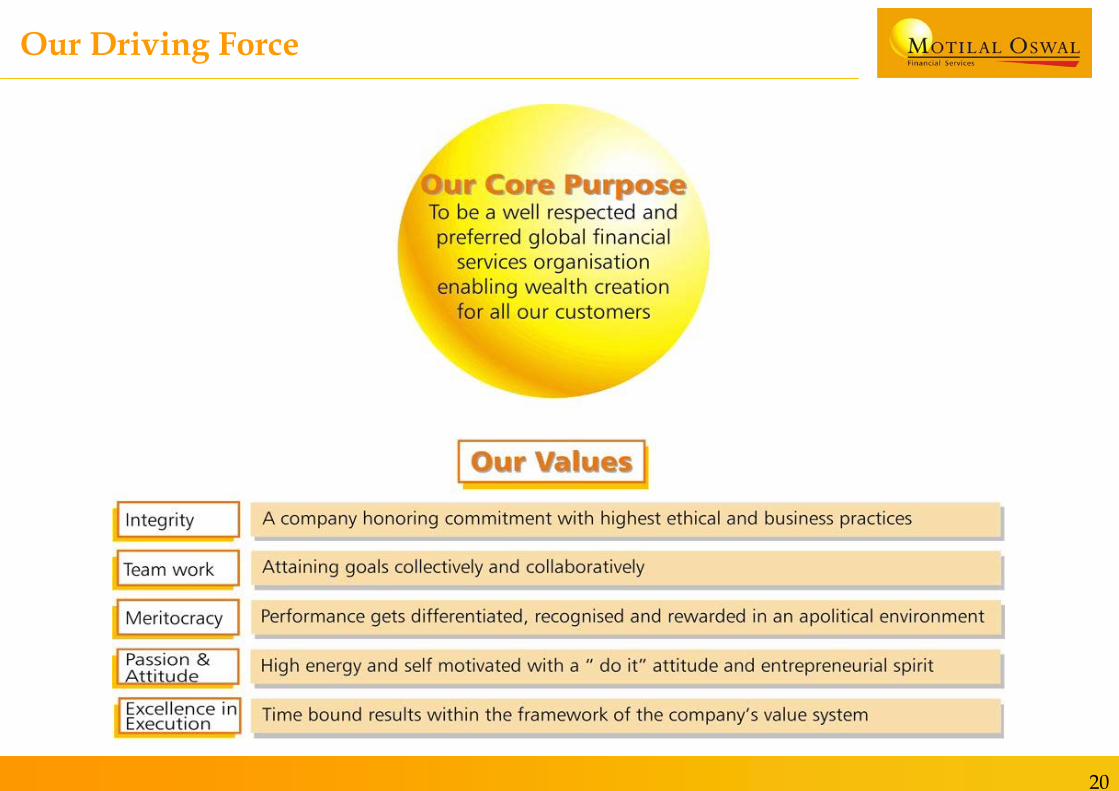
Our Driving Force
21
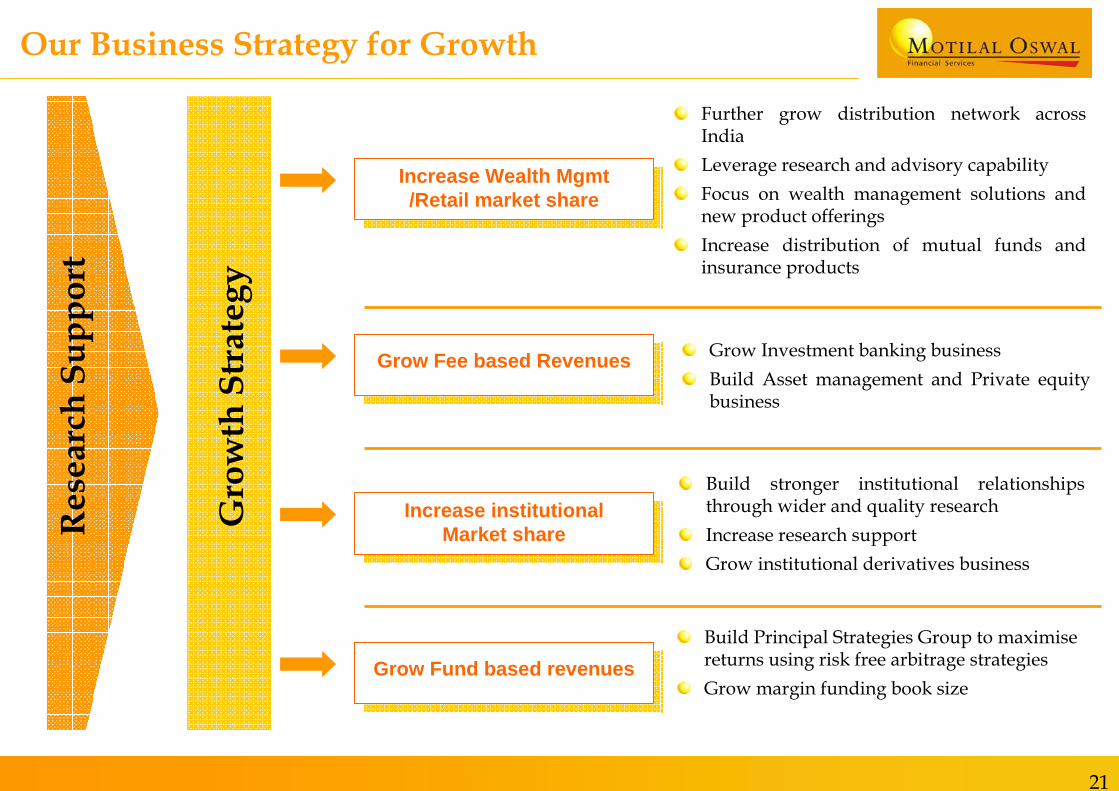
Build stronger institutional relationships through wider and quality researchIncrease research supportGrow institutional derivatives business
Further grow distribution network across IndiaLeverage research and advisory capabilityFocus on wealth management solutions and new product offeringsIncrease distribution of mutual funds and insurance products
Grow Investment banking businessBuild Asset management and Private equity business
Build Principal Strategies Group to maximise returns using risk free arbitrage strategiesGrow margin funding book size
Our Business Strategy for GrowthR
esea
rch
Supp
ort
Gro
wth
Str
ateg
y
Increase Wealth Mgmt/Retail market share
Grow Fee based Revenues
Increase institutionalMarket share
Grow Fund based revenues
22
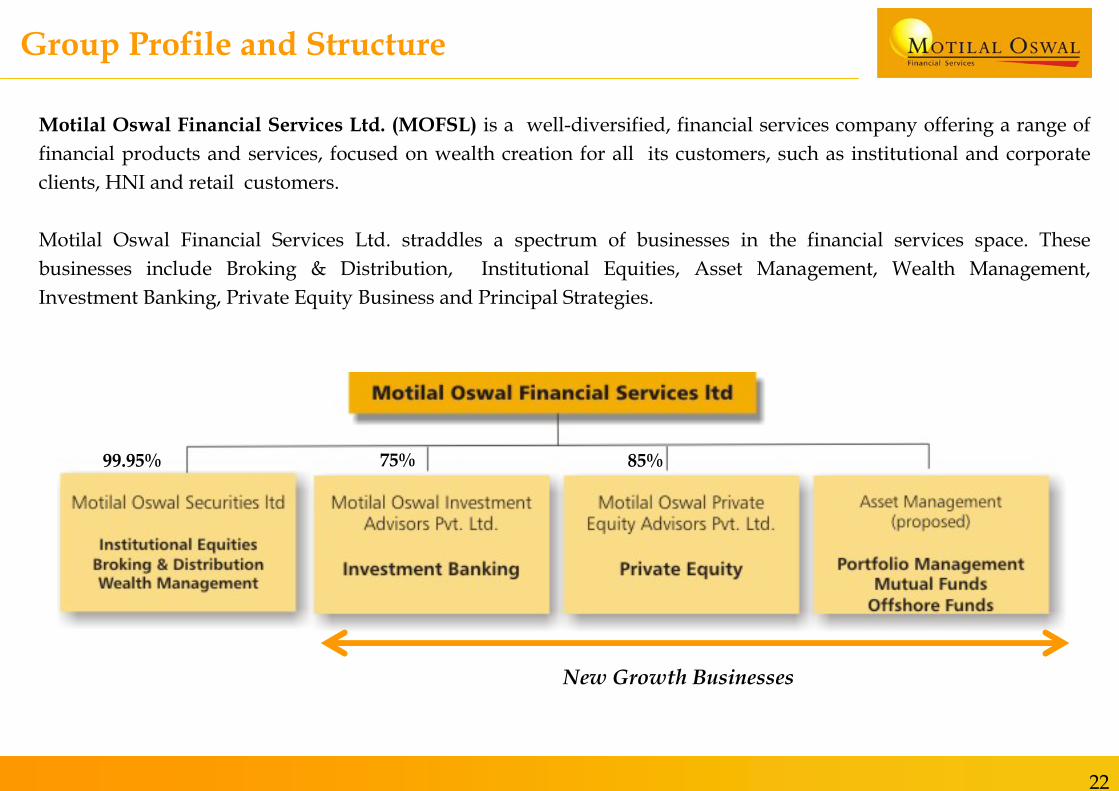
Group Profile and Structure
Motilal Oswal Financial Services Ltd. (MOFSL) is a well-diversified, financial services company offering a range of financial products and services, focused on wealth creation for all its customers, such as institutional and corporate clients, HNI and retail customers.
Motilal Oswal Financial Services Ltd. straddles a spectrum of businesses in the financial services space. These businesses include Broking & Distribution, Institutional Equities, Asset Management, Wealth Management, Investment Banking, Private Equity Business and Principal Strategies.
New Growth Businesses
99.95% 75% 85%
23
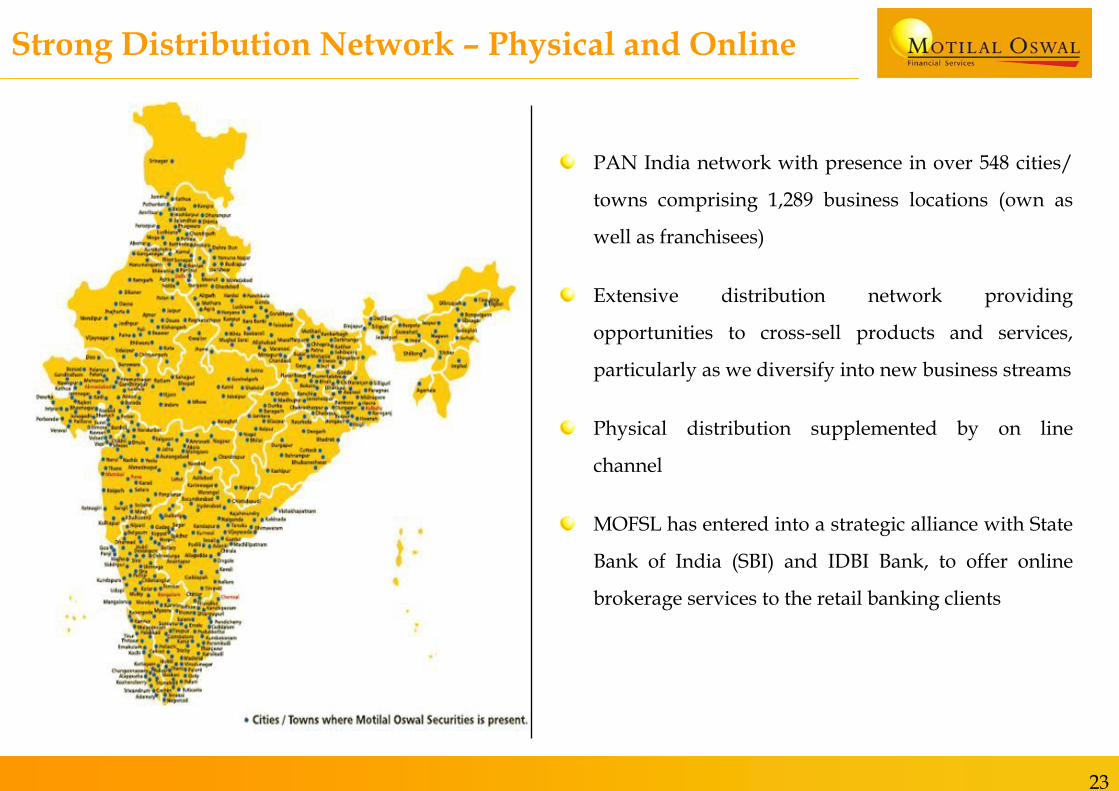
Strong Distribution Network – Physical and Online
PAN India network with presence in over 548 cities/
towns comprising 1,289 business locations (own as
well as franchisees)
Extensive distribution network providing
opportunities to cross-sell products and services,
particularly as we diversify into new business streams
Physical distribution supplemented by on line
channel
MOFSL has entered into a strategic alliance with State
Bank of India (SBI) and IDBI Bank, to offer online
brokerage services to the retail banking clients
24
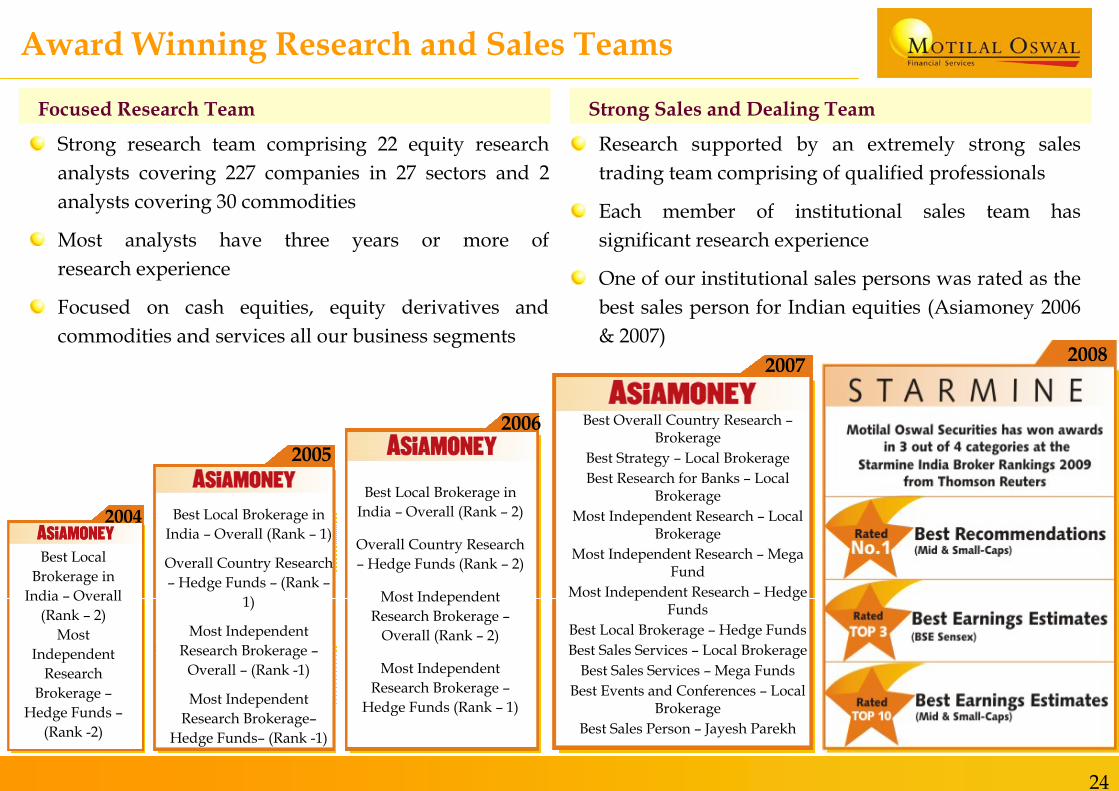
Award Winning Research and Sales Teams
Strong research team comprising 22 equity research analysts covering 227 companies in 27 sectors and 2 analysts covering 30 commodities
Most analysts have three years or more of research experience
Focused on cash equities, equity derivatives and commodities and services all our business segments
Focused Research Team Strong Sales and Dealing Team
Research supported by an extremely strong sales trading team comprising of qualified professionals
Each member of institutional sales team has significant research experience
One of our institutional sales persons was rated as the best sales person for Indian equities (Asiamoney 2006 & 2007)
2007
Best Overall Country Research –Brokerage
Best Strategy – Local BrokerageBest Research for Banks – Local
BrokerageMost Independent Research – Local
BrokerageMost Independent Research – Mega
FundMost Independent Research – Hedge
FundsBest Local Brokerage – Hedge FundsBest Sales Services – Local Brokerage
Best Sales Services – Mega FundsBest Events and Conferences – Local
BrokerageBest Sales Person – Jayesh Parekh
2006
Best Local Brokerage in India – Overall (Rank – 2)
Overall Country Research – Hedge Funds (Rank – 2)
Most Independent Research Brokerage –
Overall (Rank – 2)
Most Independent Research Brokerage –
Hedge Funds (Rank – 1)
2005
Best Local Brokerage in India – Overall (Rank – 1)
Overall Country Research – Hedge Funds – (Rank –
1)
Most Independent Research Brokerage –
Overall – (Rank -1)
Most Independent Research Brokerage–
Hedge Funds– (Rank -1)
Best Local Brokerage in
India – Overall (Rank – 2)
Most Independent
Research Brokerage –
Hedge Funds –(Rank -2)
2004
2008
25
Motilal Oswal Financial Services Ltd – Summary
New products and services offered to changing needs of the market
Management Team: Highly experienced and passionate
Reach: Wide network spread across 548 cities and towns comprising 1,289 business locations
complemented by online platform
Research: Creating value for customers across all our business segments.
26
This report is for information purposes only and does not construe to be any investment, legal or taxation advice. It is not intended as an offer or solicitation for the purchase or sale of any financial instrument. Any action taken by you on the basis of the information contained herein is your responsibility alone and MOFSL and its subsidiaries or its employees or directors, associates will not be liable in any manner for the consequences of such action taken by you. We have exercised due diligence in checking the correctness and authenticity of the information contained herein, but do not represent that it is accurate or complete. MOFSL or any of its subsidiaries or associates or employees shall not be in any way responsible for any loss or damage that may arise to any person from any inadvertent error in the information contained in this publication. The recipient of this report should rely on their own investigations. MOFSL and/or its subsidiaries and/or directors, employees or associates may have interests or positions, financial or otherwise in the securities mentioned in this report.
Contact:Sameer KamathHead – Corporate Planning and Investor RelationsMotilal Oswal Financial Services LimitedTel: 91-22-3982-5500 / 91-22-39825554Fax: 91-22-2282-3499Email: [email protected] / [email protected]
Thank You
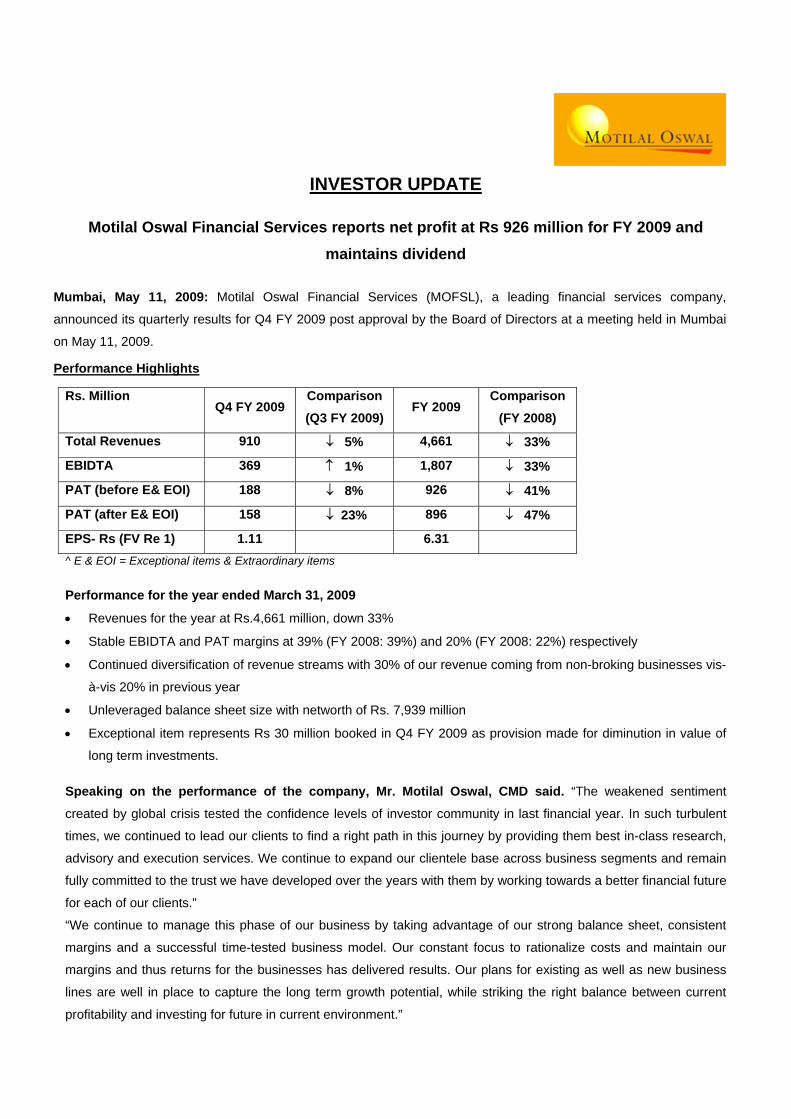
INVESTOR UPDATE
Motilal Oswal Financial Services reports net profit at Rs 926 million for FY 2009 and maintains dividend
Mumbai, May 11, 2009: Motilal Oswal Financial Services (MOFSL), a leading financial services company,
announced its quarterly results for Q4 FY 2009 post approval by the Board of Directors at a meeting held in Mumbai
on May 11, 2009.
Performance Highlights
Rs. Million Q4 FY 2009
Comparison (Q3 FY 2009)
FY 2009 Comparison
(FY 2008)
Total Revenues 910 ↓ 5% 4,661 ↓ 33%
EBIDTA 369 ↑ 1% 1,807 ↓ 33%
PAT (before E& EOI) 188 ↓ 8% 926 ↓ 41%
PAT (after E& EOI) 158 ↓ 23% 896 ↓ 47%
EPS- Rs (FV Re 1) 1.11 6.31 ^ E & EOI = Exceptional items & Extraordinary items
Performance for the year ended March 31, 2009
• Revenues for the year at Rs.4,661 million, down 33%
• Stable EBIDTA and PAT margins at 39% (FY 2008: 39%) and 20% (FY 2008: 22%) respectively
• Continued diversification of revenue streams with 30% of our revenue coming from non-broking businesses vis-
à-vis 20% in previous year
• Unleveraged balance sheet size with networth of Rs. 7,939 million
• Exceptional item represents Rs 30 million booked in Q4 FY 2009 as provision made for diminution in value of
long term investments.
Speaking on the performance of the company, Mr. Motilal Oswal, CMD said. “The weakened sentiment
created by global crisis tested the confidence levels of investor community in last financial year. In such turbulent
times, we continued to lead our clients to find a right path in this journey by providing them best in-class research,
advisory and execution services. We continue to expand our clientele base across business segments and remain
fully committed to the trust we have developed over the years with them by working towards a better financial future
for each of our clients.”
“We continue to manage this phase of our business by taking advantage of our strong balance sheet, consistent
margins and a successful time-tested business model. Our constant focus to rationalize costs and maintain our
margins and thus returns for the businesses has delivered results. Our plans for existing as well as new business
lines are well in place to capture the long term growth potential, while striking the right balance between current
profitability and investing for future in current environment.”
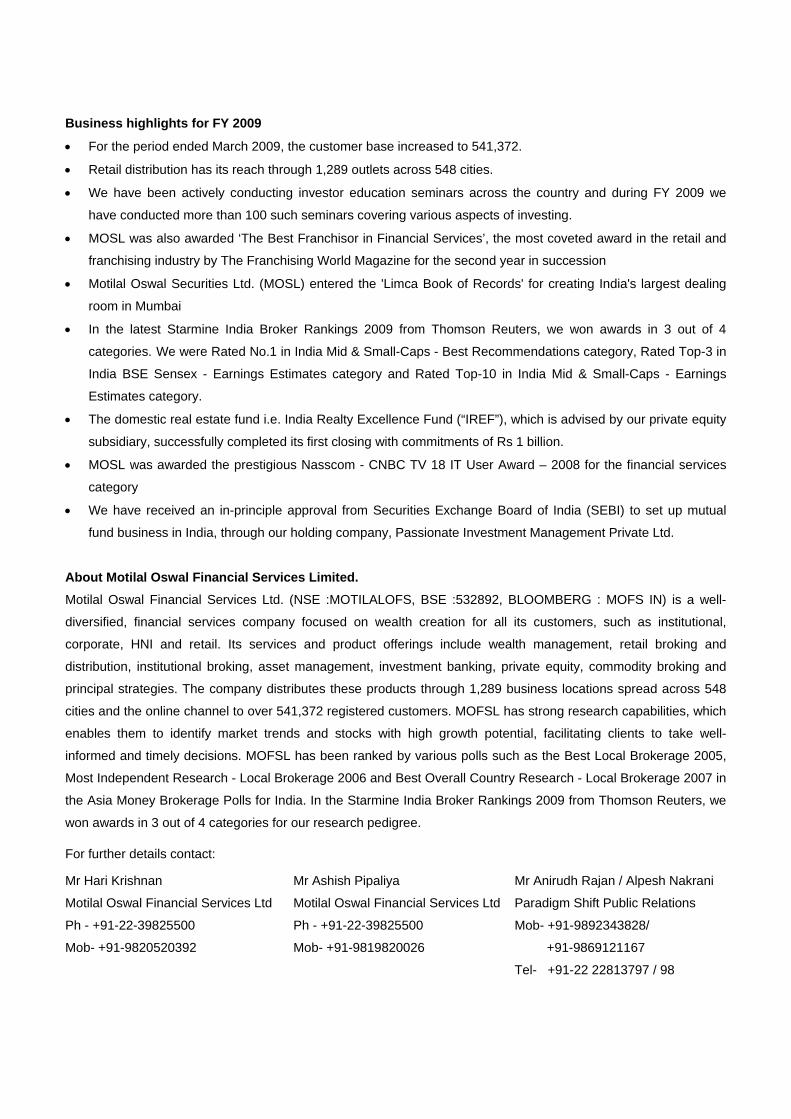
Business highlights for FY 2009
• For the period ended March 2009, the customer base increased to 541,372.
• Retail distribution has its reach through 1,289 outlets across 548 cities.
• We have been actively conducting investor education seminars across the country and during FY 2009 we
have conducted more than 100 such seminars covering various aspects of investing.
• MOSL was also awarded ‘The Best Franchisor in Financial Services’, the most coveted award in the retail and
franchising industry by The Franchising World Magazine for the second year in succession
• Motilal Oswal Securities Ltd. (MOSL) entered the 'Limca Book of Records' for creating India's largest dealing
room in Mumbai
• In the latest Starmine India Broker Rankings 2009 from Thomson Reuters, we won awards in 3 out of 4
categories. We were Rated No.1 in India Mid & Small-Caps - Best Recommendations category, Rated Top-3 in
India BSE Sensex - Earnings Estimates category and Rated Top-10 in India Mid & Small-Caps - Earnings
Estimates category.
• The domestic real estate fund i.e. India Realty Excellence Fund (“IREF”), which is advised by our private equity
subsidiary, successfully completed its first closing with commitments of Rs 1 billion.
• MOSL was awarded the prestigious Nasscom - CNBC TV 18 IT User Award – 2008 for the financial services
category
• We have received an in-principle approval from Securities Exchange Board of India (SEBI) to set up mutual
fund business in India, through our holding company, Passionate Investment Management Private Ltd.
About Motilal Oswal Financial Services Limited. Motilal Oswal Financial Services Ltd. (NSE :MOTILALOFS, BSE :532892, BLOOMBERG : MOFS IN) is a well-
diversified, financial services company focused on wealth creation for all its customers, such as institutional,
corporate, HNI and retail. Its services and product offerings include wealth management, retail broking and
distribution, institutional broking, asset management, investment banking, private equity, commodity broking and
principal strategies. The company distributes these products through 1,289 business locations spread across 548
cities and the online channel to over 541,372 registered customers. MOFSL has strong research capabilities, which
enables them to identify market trends and stocks with high growth potential, facilitating clients to take well-
informed and timely decisions. MOFSL has been ranked by various polls such as the Best Local Brokerage 2005,
Most Independent Research - Local Brokerage 2006 and Best Overall Country Research - Local Brokerage 2007 in
the Asia Money Brokerage Polls for India. In the Starmine India Broker Rankings 2009 from Thomson Reuters, we
won awards in 3 out of 4 categories for our research pedigree.
For further details contact:
Mr Hari Krishnan
Motilal Oswal Financial Services Ltd
Ph - +91-22-39825500
Mob- +91-9820520392
Mr Ashish Pipaliya
Motilal Oswal Financial Services Ltd
Ph - +91-22-39825500
Mob- +91-9819820026
Mr Anirudh Rajan / Alpesh Nakrani
Paradigm Shift Public Relations
Mob- +91-9892343828/
+91-9869121167
Tel- +91-22 22813797 / 98
Email:[email protected]
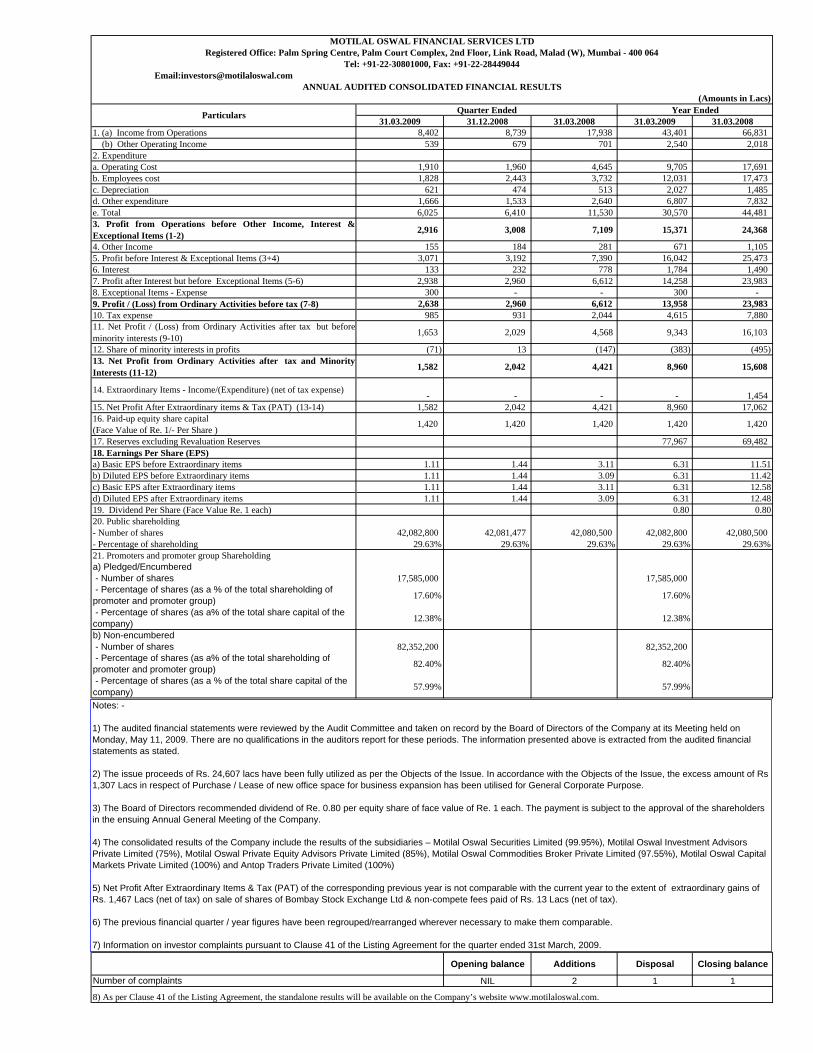
(Amounts in Lacs)
31.03.2009 31.12.2008 31.03.2008 31.03.2009 31.03.20081. (a) Income from Operations 8,402 8,739 17,938 43,401 66,831 (b) Other Operating Income 539 679 701 2,540 2,018 2. Expenditurea. Operating Cost 1,910 1,960 4,645 9,705 17,691 b. Employees cost 1,828 2,443 3,732 12,031 17,473 c. Depreciation 621 474 513 2,027 1,485 d. Other expenditure 1,666 1,533 2,640 6,807 7,832 e. Total 6,025 6,410 11,530 30,570 44,481 3. Profit from Operations before Other Income, Interest &Exceptional Items (1-2) 2,916 3,008 7,109 15,371 24,368
4. Other Income 155 184 281 671 1,105 5. Profit before Interest & Exceptional Items (3+4) 3,071 3,192 7,390 16,042 25,473 6. Interest 133 232 778 1,784 1,490 7. Profit after Interest but before Exceptional Items (5-6) 2,938 2,960 6,612 14,258 23,983 8. Exceptional Items - Expense 300 - - 300 - 9. Profit / (Loss) from Ordinary Activities before tax (7-8) 2,638 2,960 6,612 13,958 23,983 10. Tax expense 985 931 2,044 4,615 7,880 11. Net Profit / (Loss) from Ordinary Activities after tax but beforeminority interests (9-10) 1,653 2,029 4,568 9,343 16,103
12. Share of minority interests in profits (71) 13 (147) (383) (495) 13. Net Profit from Ordinary Activities after tax and MinorityInterests (11-12) 1,582 2,042 4,421 8,960 15,608
14. Extraordinary Items - Income/(Expenditure) (net of tax expense) - - - - 1,454 15. Net Profit After Extraordinary items & Tax (PAT) (13-14) 1,582 2,042 4,421 8,960 17,062 16. Paid-up equity share capital(Face Value of Re. 1/- Per Share )17. Reserves excluding Revaluation Reserves 77,967 69,482 18. Earnings Per Share (EPS)a) Basic EPS before Extraordinary items 1.11 1.44 3.11 6.31 11.51 b) Diluted EPS before Extraordinary items 1.11 1.44 3.09 6.31 11.42 c) Basic EPS after Extraordinary items 1.11 1.44 3.11 6.31 12.58 d) Diluted EPS after Extraordinary items 1.11 1.44 3.09 6.31 12.48 19. Dividend Per Share (Face Value Re. 1 each) 0.80 0.80 20. Public shareholding- Number of shares 42,082,800 42,081,477 42,080,500 42,082,800 42,080,500 - Percentage of shareholding 29.63% 29.63% 29.63% 29.63% 29.63%21. Promoters and promoter group Shareholdinga) Pledged/Encumbered - Number of shares 17,585,000 17,585,000 - Percentage of shares (as a % of the total shareholding of promoter and promoter group) 17.60% 17.60%
- Percentage of shares (as a% of the total share capital of the company) 12.38% 12.38%
b) Non-encumbered - Number of shares 82,352,200 82,352,200 - Percentage of shares (as a% of the total shareholding of promoter and promoter group) 82.40% 82.40%
- Percentage of shares (as a % of the total share capital of the company) 57.99% 57.99%
Opening balance Additions Disposal Closing balance
NIL 2 1 1
8) As per Clause 41 of the Listing Agreement, the standalone results will be available on the Company’s website www.motilaloswal.com.
Year EndedParticulars
MOTILAL OSWAL FINANCIAL SERVICES LTDRegistered Office: Palm Spring Centre, Palm Court Complex, 2nd Floor, Link Road, Malad (W), Mumbai - 400 064
Tel: +91-22-30801000, Fax: +91-22-28449044
ANNUAL AUDITED CONSOLIDATED FINANCIAL RESULTS
Quarter Ended
1,420 1,420 1,420 1,420
Number of complaints
1,420
Notes: -
1) The audited financial statements were reviewed by the Audit Committee and taken on record by the Board of Directors of the Company at its Meeting held on Monday, May 11, 2009. There are no qualifications in the auditors report for these periods. The information presented above is extracted from the audited financial statements as stated.
2) The issue proceeds of Rs. 24,607 lacs have been fully utilized as per the Objects of the Issue. In accordance with the Objects of the Issue, the excess amount of Rs 1,307 Lacs in respect of Purchase / Lease of new office space for business expansion has been utilised for General Corporate Purpose.
3) The Board of Directors recommended dividend of Re. 0.80 per equity share of face value of Re. 1 each. The payment is subject to the approval of the shareholders in the ensuing Annual General Meeting of the Company.
4) The consolidated results of the Company include the results of the subsidiaries – Motilal Oswal Securities Limited (99.95%), Motilal Oswal Investment Advisors Private Limited (75%), Motilal Oswal Private Equity Advisors Private Limited (85%), Motilal Oswal Commodities Broker Private Limited (97.55%), Motilal Oswal Capital Markets Private Limited (100%) and Antop Traders Private Limited (100%)
5) Net Profit After Extraordinary Items & Tax (PAT) of the corresponding previous year is not comparable with the current year to the extent of extraordinary gains of Rs. 1,467 Lacs (net of tax) on sale of shares of Bombay Stock Exchange Ltd & non-compete fees paid of Rs. 13 Lacs (net of tax).
6) The previous financial quarter / year figures have been regrouped/rearranged wherever necessary to make them comparable.
7) Information on investor complaints pursuant to Clause 41 of the Listing Agreement for the quarter ended 31st March, 2009.
(Amounts in Lacs) Particulars
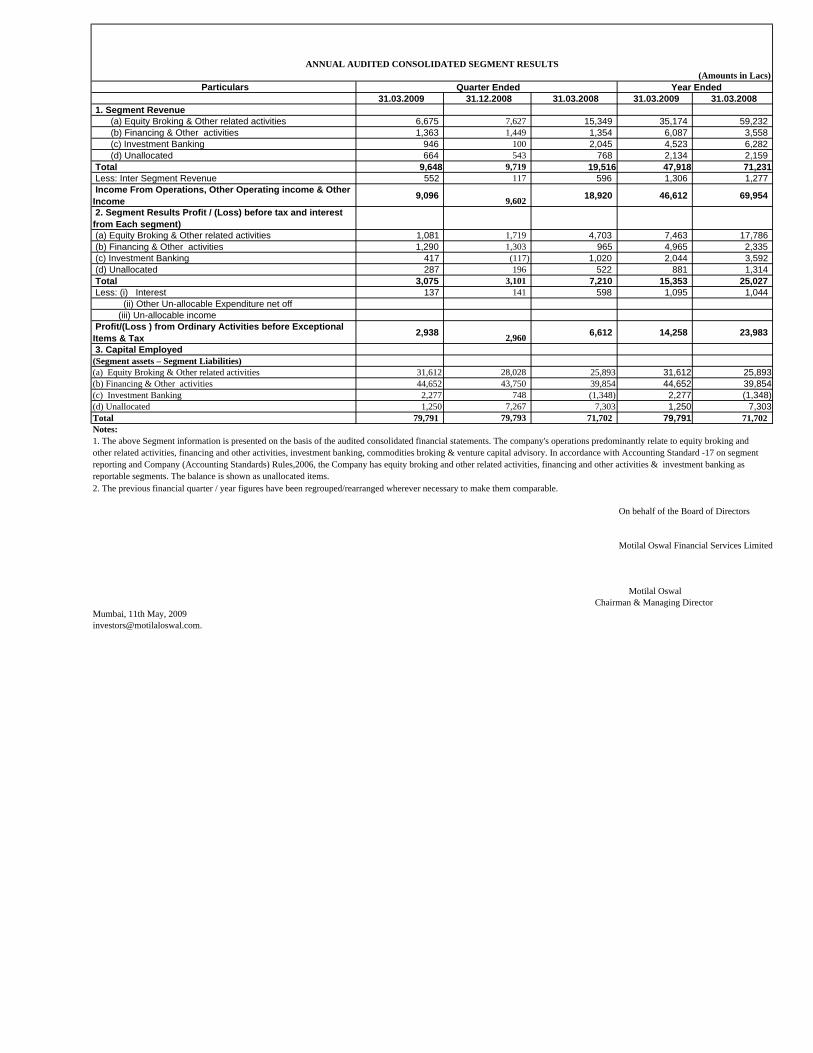
31.03.2009 31.12.2008 31.03.2008 31.03.2009 31.03.2008 1. Segment Revenue
(a) Equity Broking & Other related activities 6,675 7,627 15,349 35,174 59,232 (b) Financing & Other activities 1,363 1,449 1,354 6,087 3,558 (c) Investment Banking 946 100 2,045 4,523 6,282 (d) Unallocated 664 543 768 2,134 2,159
Total 9,648 9,719 19,516 47,918 71,231 Less: Inter Segment Revenue 552 117 596 1,306 1,277 Income From Operations, Other Operating income & Other Income 9,096 9,602 18,920 46,612 69,954
2. Segment Results Profit / (Loss) before tax and interest from Each segment) (a) Equity Broking & Other related activities 1,081 1,719 4,703 7,463 17,786 (b) Financing & Other activities 1,290 1,303 965 4,965 2,335 (c) Investment Banking 417 (117) 1,020 2,044 3,592 (d) Unallocated 287 196 522 881 1,314 Total 3,075 3,101 7,210 15,353 25,027 Less: (i) Interest 137 141 598 1,095 1,044 (ii) Other Un-allocable Expenditure net off
(iii) Un-allocable income Profit/(Loss ) from Ordinary Activities before Exceptional Items & Tax 2,938 2,960 6,612 14,258 23,983
3. Capital Employed (Segment assets – Segment Liabilities)(a) Equity Broking & Other related activities 31,612 28,028 25,893 31,612 25,893 (b) Financing & Other activities 44,652 43,750 39,854 44,652 39,854 (c) Investment Banking 2,277 748 (1,348) 2,277 (1,348)(d) Unallocated 1,250 7,267 7,303 1,250 7,303 Total 79,791 79,793 71,702 79,791 71,702 Notes:
2. The previous financial quarter / year figures have been regrouped/rearranged wherever necessary to make them comparable.
On behalf of the Board of Directors
Motilal Oswal Financial Services Limited
Motilal Oswal Chairman & Managing Director
Mumbai, 11th May, [email protected].
1. The above Segment information is presented on the basis of the audited consolidated financial statements. The company's operations predominantly relate to equity broking and other related activities, financing and other activities, investment banking, commodities broking & venture capital advisory. In accordance with Accounting Standard -17 on segment reporting and Company (Accounting Standards) Rules,2006, the Company has equity broking and other related activities, financing and other activities & investment banking as reportable segments. The balance is shown as unallocated items.
Quarter Ended Year Ended
ANNUAL AUDITED CONSOLIDATED SEGMENT RESULTS