mortimer locality profile - understanding.herefordshire.gov.uk · 2011 census area profile mortimer...
TRANSCRIPT
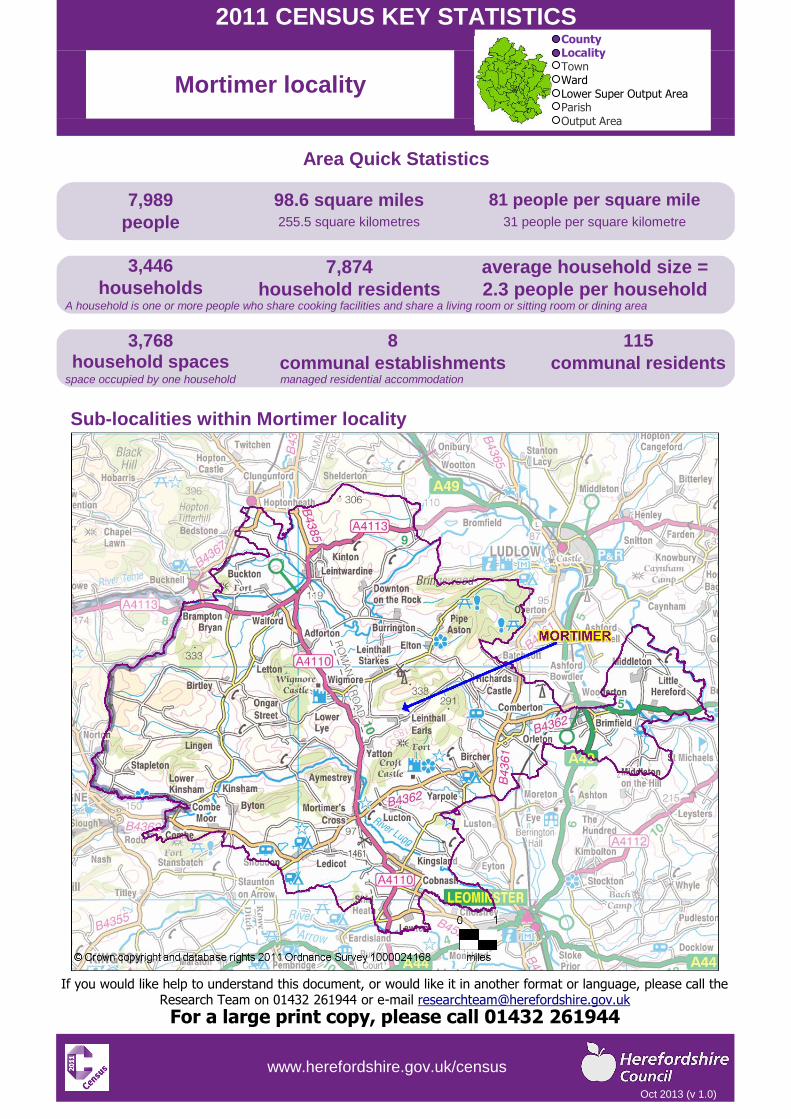
A household is one or more people who share cooking facilities and share a living room or sitting room or dining area
space occupied by one household managed residential accommodation
Sub-localities within Mortimer locality
W
W
W
W
W
W
W
W
W
W
W
W
W
W
W
W
people 255.5 square kilometres 31 people per square kilometre
3,446 7,874 average household size =
2011 CENSUS KEY STATISTICS
Mortimer locality
Area Quick Statistics
7,989 98.6 square miles 81 people per square mile
household spaces communal establishments communal residents
households household residents 2.3 people per household
3,768 8 115
If you would like help to understand this document, or would like it in another format or language, please call the Research Team on 01432 261944 or e-mail [email protected]
For a large print copy, please call 01432 261944
Oct 2013 (v 1.0)
www.herefordshire.gov.uk/census
County Locality Town Ward Lower Super Output Area Parish Output Area
2011 Census Area Profile Mortimer Ward
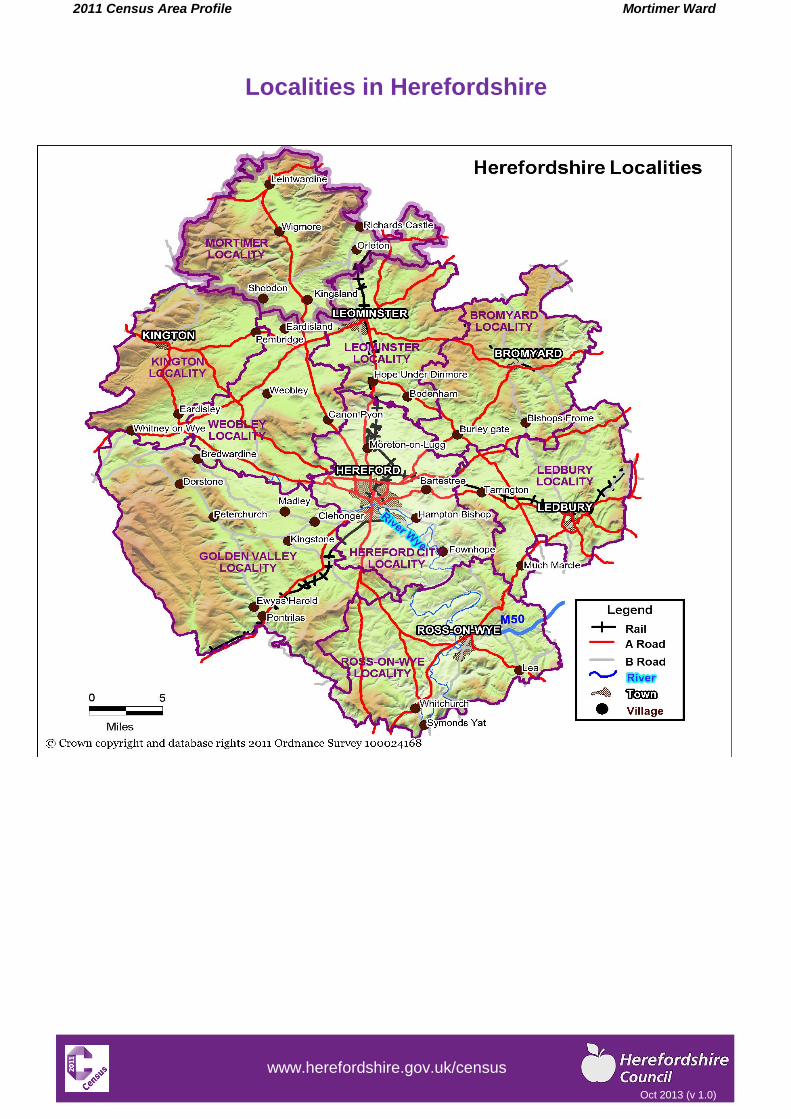
Localities in Herefordshire
Oct 2013 (v 1.0)
www.herefordshire.gov.uk/census
2011 Census Area Profile Mortimer Ward
No.
%
No.
%
No.
%
No.
%
Area:
square kilometres
square miles
Population density:
Number of students whose family home is in the area, who are living away from home during term-time
NON-RESIDENTS table QS105
226 3,080
84
persons per square mile 81 218
persons per square kilometre 31
98.6 842
POPULATION DENSITY table KS102
255.5 2,180
183,477
100% 100%Total
7,989
39,016
25% 21%65 and over
2,004
112,946
59% 62%16-64
4,692
1,293 31,515
16% 17%
Mortimer locality Herefordshire
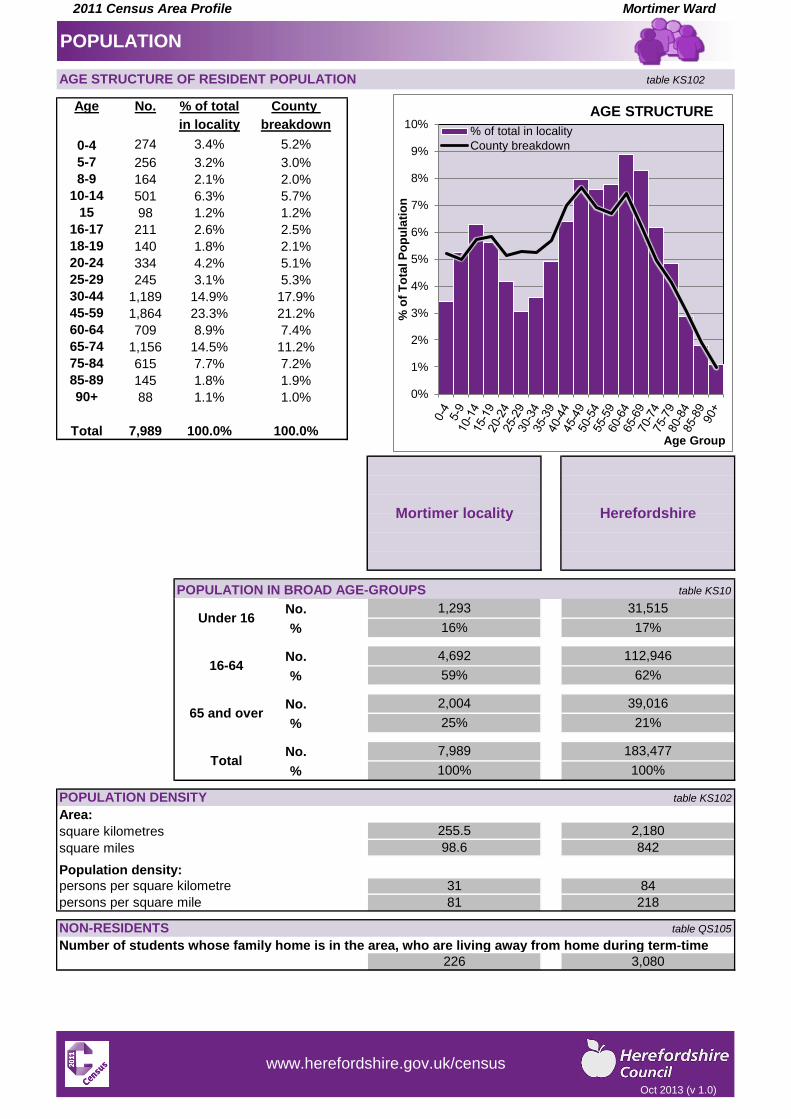
POPULATION IN BROAD AGE-GROUPS
table KS10
Under 16
Total 7,989 100.0% 100.0%
85-89 145 1.8% 1.9%
90+ 88 1.1% 1.0%
65-74 1,156 14.5% 11.2%
75-84 615 7.7% 7.2%
45-59 1,864 23.3% 21.2%
60-64 709 8.9% 7.4%
25-29 245 3.1% 5.3%
30-44 1,189 14.9% 17.9%
18-19 140 1.8% 2.1%
20-24 334 4.2% 5.1%
15 98 1.2% 1.2%
16-17 211 2.6% 2.5%
8-9 164 2.1% 2.0%
10-14 501 6.3% 5.7%
0-4 274 3.4% 5.2%
5-7 256 3.2% 3.0%
Age No. % of total County
in locality breakdown
POPULATION
AGE STRUCTURE OF RESIDENT POPULATION table KS102
0%
1%
2%
3%
4%
5%
6%
7%
8%
9%
10%
% o
f T
ota
l P
op
ula
tio
n
Age Group
AGE STRUCTURE
% of total in locality
County breakdown
Oct 2013 (v 1.0)
www.herefordshire.gov.uk/census
2011 Census Area Profile Mortimer Ward
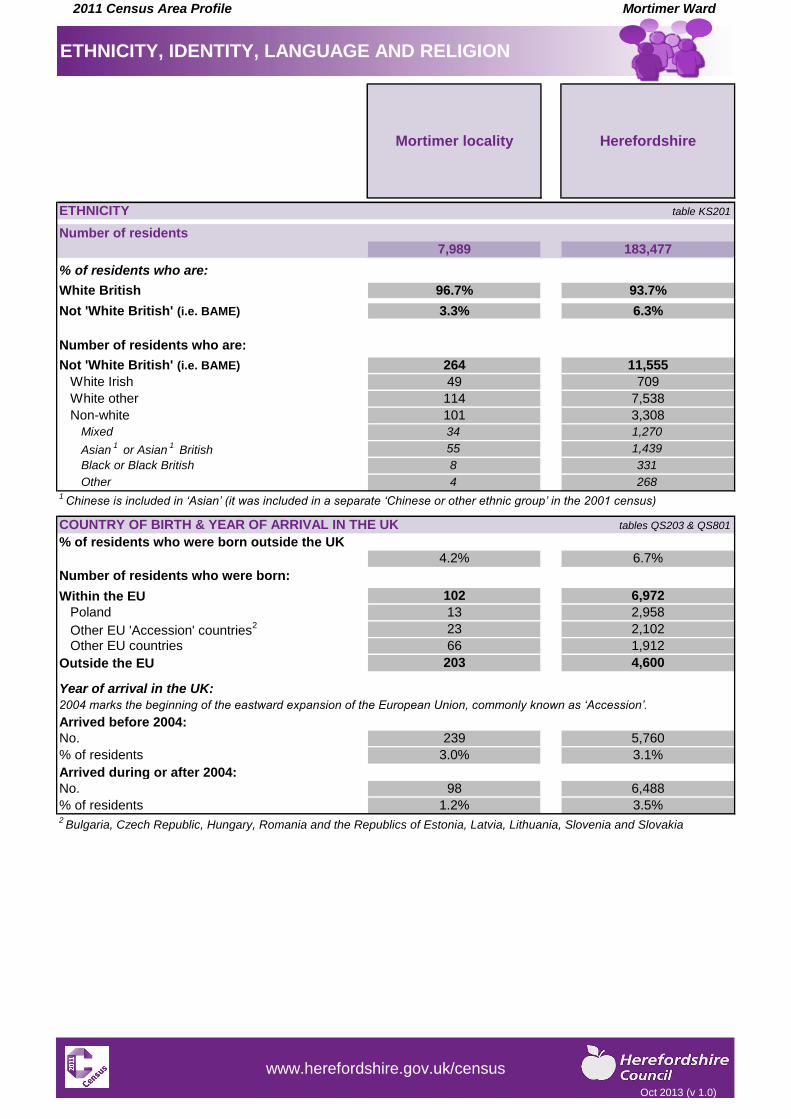
Number of residents
% of residents who are:
Number of residents who are:
1Chinese is included in ‘Asian’ (it was included in a separate ‘Chinese or other ethnic group’ in the 2001 census)
% of residents who were born outside the UK
Number of residents who were born:
Within the EU
Outside the EU
Year of arrival in the UK:
2004 marks the beginning of the eastward expansion of the European Union, commonly known as ‘Accession’.
Arrived before 2004:
Arrived during or after 2004:
2Bulgaria, Czech Republic, Hungary, Romania and the Republics of Estonia, Latvia, Lithuania, Slovenia and Slovakia
6,488
% of residents 1.2% 3.5%
No. 98
5,760
% of residents 3.0% 3.1%
No. 239
1,912
203 4,600
Other EU countries 66
2,958
Other EU 'Accession' countries2 23 2,102
Poland 13
102 6,972
COUNTRY OF BIRTH & YEAR OF ARRIVAL IN THE UK tables QS203 & QS801
4.2% 6.7%
331
Other 4 268
Black or Black British 8
1,270
Asian1 or Asian
1 British 55 1,439
Mixed 34
7,538
Non-white 101 3,308
White other 114
11,555
White Irish 49 709
Not 'White British' (i.e. BAME) 264
93.7%
Not 'White British' (i.e. BAME) 3.3% 6.3%
White British 96.7%
ETHNICITY table KS201
7,989 183,477
ETHNICITY, IDENTITY, LANGUAGE AND RELIGION
Mortimer locality Herefordshire
Oct 2013 (v 1.0)
www.herefordshire.gov.uk/census
2011 Census Area Profile Mortimer Ward
Number of households (one person or a group of people with common housekeeping)
Households with no people that have English as a main (i.e.first or preferred) language
No.
%
Number of residents aged 3 and over
Residents aged 3 and over whose first or preferred language is:
No.
%
No.
%
No.
%
No.
%
No.
%
Residents aged 3 and over who cannot speak English well or at all:
No.
%3Bulgaria, Czech Republic, Hungary, Romania and the Republics of Estonia, Latvia, Lithuania, Slovenia and Slovakia
Number of residents
% of residents who are:
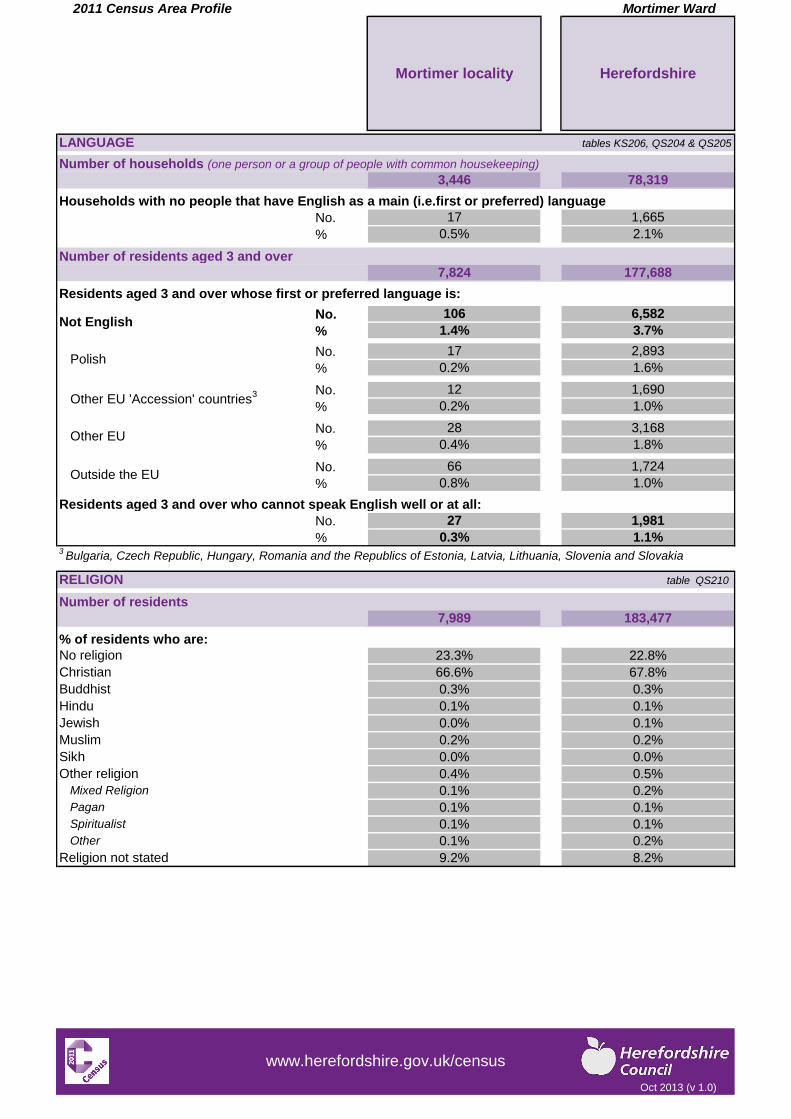
8.2%Religion not stated 9.2%
0.1%
Other 0.1% 0.2%
Spiritualist 0.1%
0.2%
Pagan 0.1% 0.1%
Mixed Religion 0.1%
0.0%
Other religion 0.4% 0.5%
Sikh 0.0%
0.1%
Muslim 0.2% 0.2%
Jewish 0.0%
0.3%
Hindu 0.1% 0.1%
Buddhist 0.3%
22.8%
Christian 66.6% 67.8%
No religion 23.3%
RELIGION table QS210
7,989 183,477
0.3% 1.1%
27 1,981
1,724
0.8% 1.0%Outside the EU
66
3,168
0.4% 1.8%Other EU
28
1,690
0.2% 1.0%Other EU 'Accession' countries
3 12
2,893
0.2% 1.6%Polish
17
6,582
1.4% 3.7%Not English
106
7,824 177,688
0.5% 2.1%
17 1,665
LANGUAGE tables KS206, QS204 & QS205
3,446 78,319
Mortimer locality Herefordshire
March 2013 (v 1.0)
www.herefordshire.gov.uk/census
Oct 2013 (v 1.0)
www.herefordshire.gov.uk/census
2011 Census Area Profile Mortimer Ward
Total number of communal establishments
Total number of residents in communal establishments
Number of residents in :
Medical and care establishments
Care home with nursing
Care home without nursing
Other medical and care
Other establishments
Education
Defense
Other
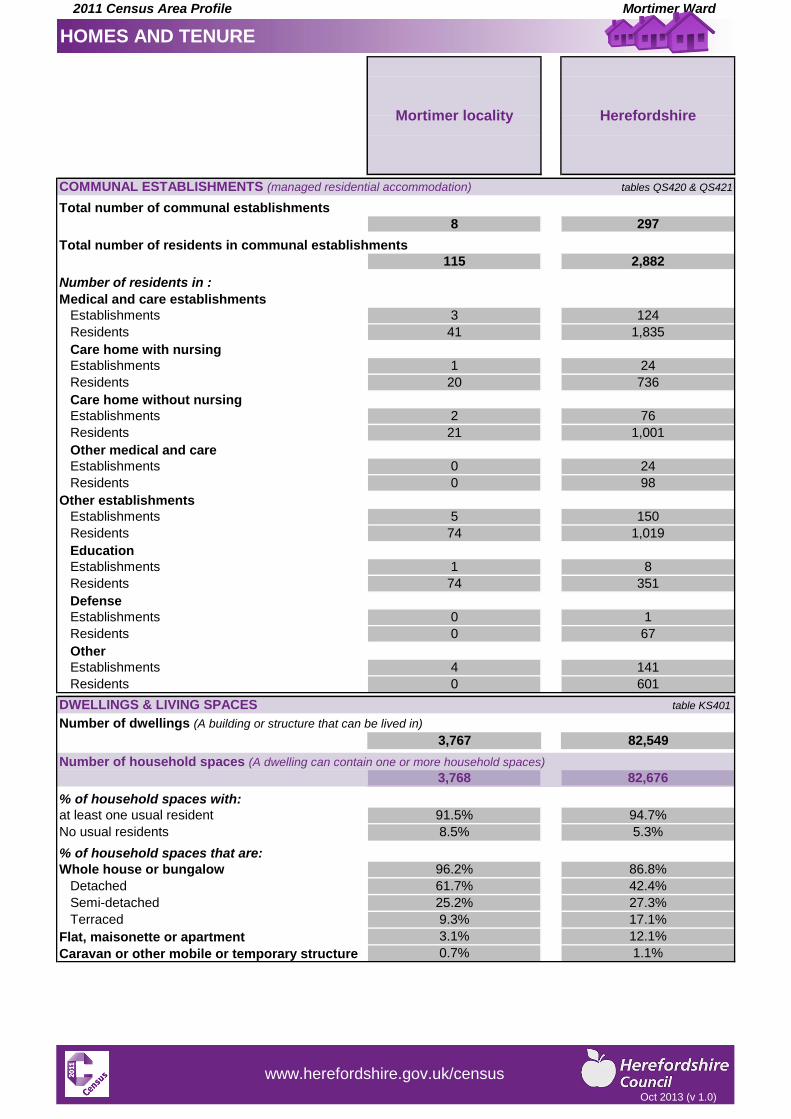
Number of dwellings (A building or structure that can be lived in)
Number of household spaces (A dwelling can contain one or more household spaces)
% of household spaces with:
% of household spaces that are:
Flat, maisonette or apartment
Caravan or other mobile or temporary structure 0.7% 1.1%
3.1% 12.1%
27.3%
Terraced 9.3% 17.1%
Semi-detached 25.2%
86.8%
Detached 61.7% 42.4%
Whole house or bungalow 96.2%
94.7%
No usual residents 8.5% 5.3%
at least one usual resident 91.5%
3,768 82,676
DWELLINGS & LIVING SPACES table KS401
3,767 82,549
141
Residents 0 601
Establishments 4
1
Residents 0 67
Establishments 0
8
Residents 74 351
Establishments 1
150
Residents 74 1,019
Establishments 5
24
Residents 0 98
Establishments 0
76
Residents 21 1,001
Establishments 2
24
Residents 20 736
Establishments 1
124
Residents 41 1,835
Establishments 3
115 2,882
COMMUNAL ESTABLISHMENTS (managed residential accommodation) tables QS420 & QS421
8 297
HOMES AND TENURE
Mortimer locality Herefordshire
Oct 2013 (v 1.0)
www.herefordshire.gov.uk/census
2011 Census Area Profile Mortimer Ward
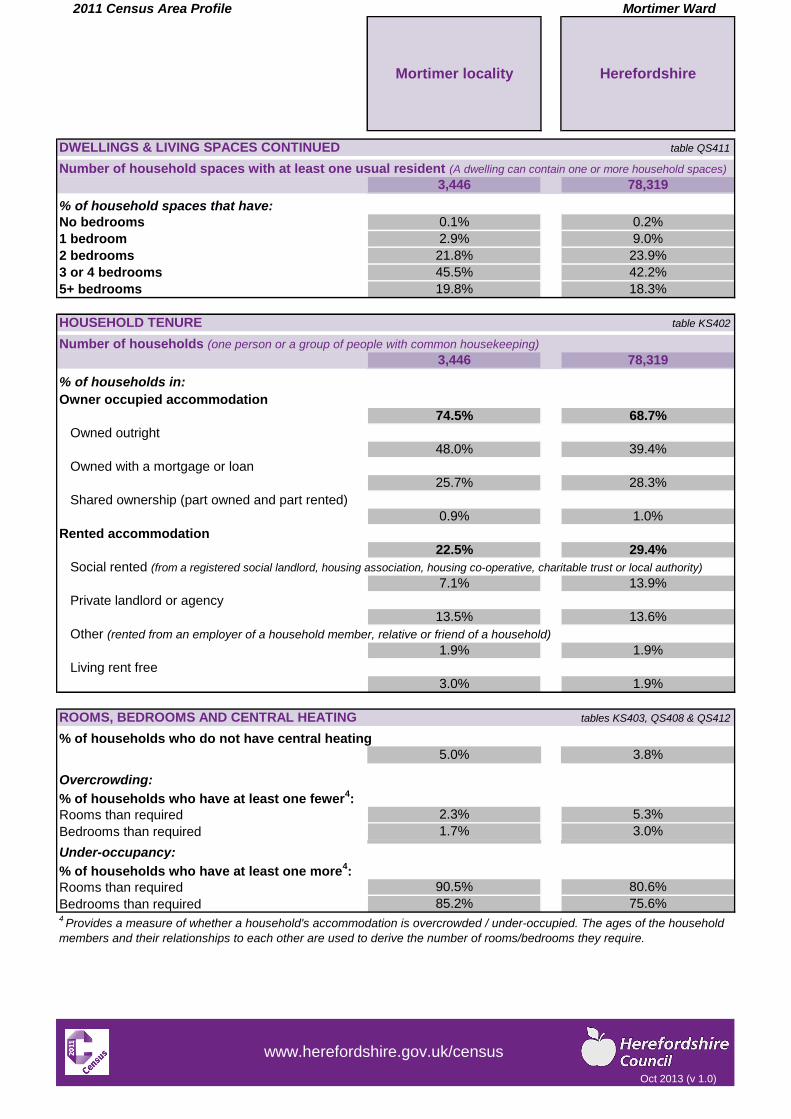
Number of household spaces with at least one usual resident (A dwelling can contain one or more household spaces)
% of household spaces that have:
Number of households (one person or a group of people with common housekeeping)
% of households in:
Owner occupied accommodation
Owned outright
Owned with a mortgage or loan
Shared ownership (part owned and part rented)
Rented accommodation
Social rented (from a registered social landlord, housing association, housing co-operative, charitable trust or local authority)
Private landlord or agency
Other (rented from an employer of a household member, relative or friend of a household)
Living rent free
% of households who do not have central heating
Overcrowding:
% of households who have at least one fewer4:
Rooms than required
Bedrooms than required
Under-occupancy:
% of households who have at least one more4:
Rooms than required
Bedrooms than required4Provides a measure of whether a household's accommodation is overcrowded / under-occupied. The ages of the household
members and their relationships to each other are used to derive the number of rooms/bedrooms they require.
85.2% 75.6%
90.5% 80.6%
1.7% 3.0%
2.3% 5.3%
ROOMS, BEDROOMS AND CENTRAL HEATING tables KS403, QS408 & QS412
5.0% 3.8%
3.0% 1.9%
1.9% 1.9%
13.5% 13.6%
7.1% 13.9%
22.5% 29.4%
0.9% 1.0%
25.7% 28.3%
48.0% 39.4%
74.5% 68.7%
18.3%
HOUSEHOLD TENURE table KS402
3,446 78,319
5+ bedrooms 19.8%
23.9%
3 or 4 bedrooms 45.5% 42.2%
2 bedrooms 21.8%
0.2%
1 bedroom 2.9% 9.0%
No bedrooms 0.1%
DWELLINGS & LIVING SPACES CONTINUED table QS411
3,446 78,319
Mortimer locality Herefordshire
Oct 2013 (v 1.0)
www.herefordshire.gov.uk/census
2011 Census Area Profile Mortimer Ward
Number of residents aged 16 and over
% of residents aged 16 and over:
Single (never married or never registered a same-sex civil partnership)
Married
In a registered same-sex civil partnership
Separated (but still legally married or still legally in a same-sex civil partnership)
Divorced or formerly in a same-sex civil partnership which is now legally dissolved
Widowed or surviving partner from a same-sex civil partnership
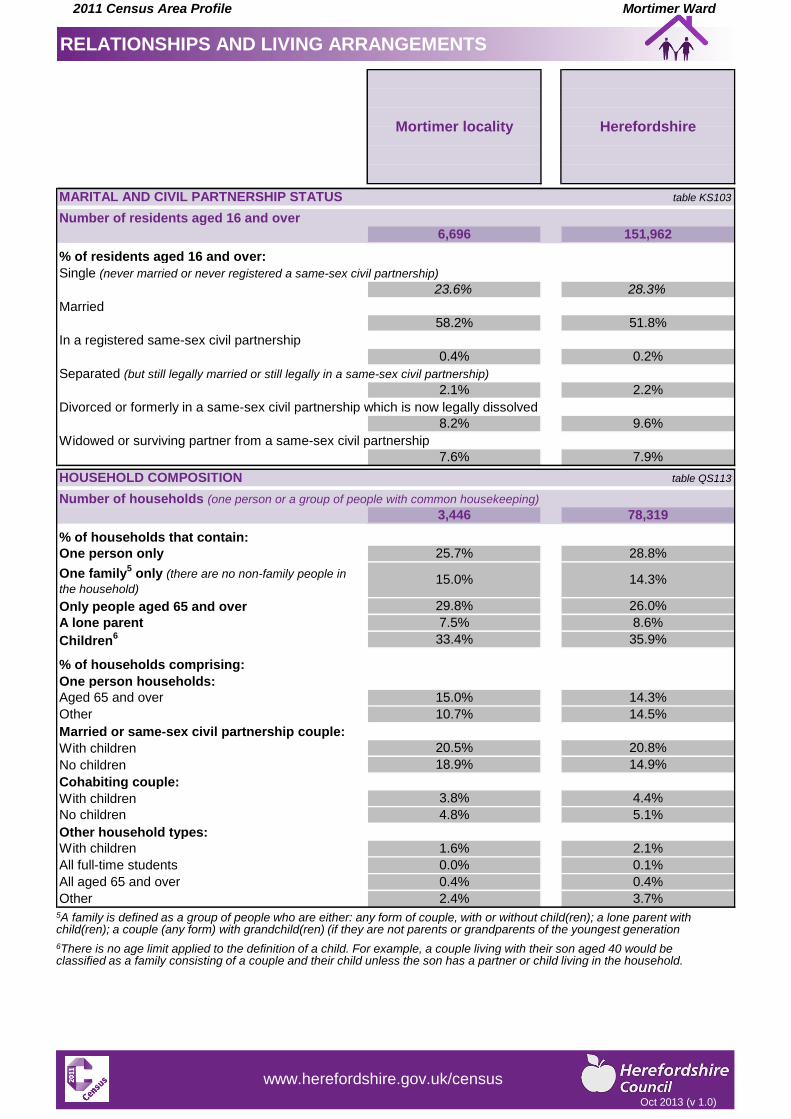
Number of households (one person or a group of people with common housekeeping)
% of households that contain:
Only people aged 65 and over
% of households comprising:
One person households:
Married or same-sex civil partnership couple:
With children
No children
Cohabiting couple:
With children
Other household types:
3.7%Other 2.4%
0.1%
All aged 65 and over 0.4% 0.4%
All full-time students 0.0%
5.1%
With children 1.6% 2.1%
No children 4.8%
3.8% 4.4%
18.9% 14.9%
20.5% 20.8%
14.3%
Other 10.7% 14.5%
Aged 65 and over 15.0%
8.6%
Children6 33.4% 35.9%
A lone parent 7.5%
29.8% 26.0%
28.8%
One family5 only (there are no non-family people in
the household)15.0% 14.3%
One person only 25.7%
HOUSEHOLD COMPOSITION table QS113
3,446 78,319
7.6% 7.9%
8.2% 9.6%
2.1% 2.2%
0.4% 0.2%
58.2% 51.8%
23.6% 28.3%
MARITAL AND CIVIL PARTNERSHIP STATUS table KS103
6,696 151,962
RELATIONSHIPS AND LIVING ARRANGEMENTS
Mortimer locality Herefordshire
5A family is defined as a group of people who are either: any form of couple, with or without child(ren); a lone parent with child(ren); a couple (any form) with grandchild(ren) (if they are not parents or grandparents of the youngest generation
6There is no age limit applied to the definition of a child. For example, a couple living with their son aged 40 would be classified as a family consisting of a couple and their child unless the son has a partner or child living in the household.
Oct 2013 (v 1.0)
www.herefordshire.gov.uk/census
2011 Census Area Profile Mortimer Ward
Number of households (one person or a group of people with common housekeeping)
Number of households with dependent children
Number of households that comprise:
One family7 only with dependent children
One dependent child
Two or more dependent children
% of households with one family7 only with:
Dependent children
One dependent child
Two or more dependent children
No children
% of households with more than one family7 or other household types with dependent children:
In part-time employment
In full-time employment
Not in employment
2222222222
2
2
2
2
2
7A family is defined as a group of people who are either: any form of couple, with or without child(ren); a lone parent with
child(ren); a couple (any form) with grandchild(ren) (if they are not parents or grandparents of the youngest generation).
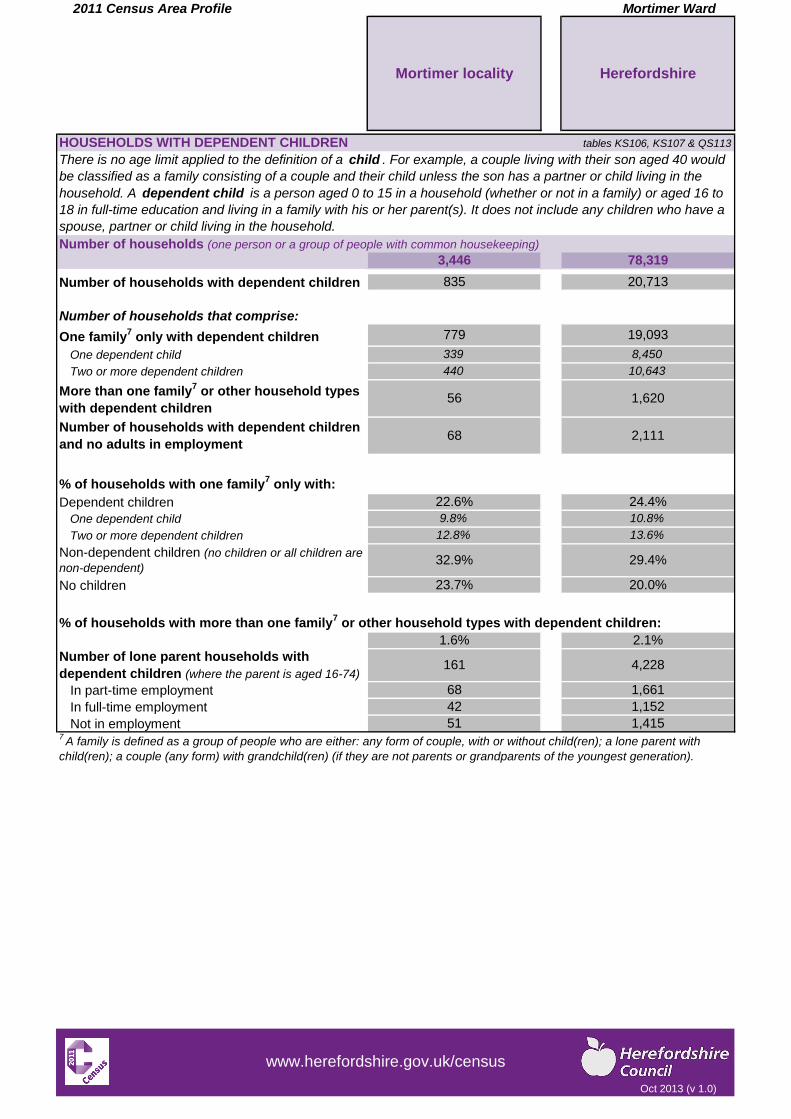
51 1,415
42 1,152
4,228
68 1,661
Number of lone parent households with
dependent children (where the parent is aged 16-74) 161
1.6% 2.1%
29.4%
23.7% 20.0%
Non-dependent children (no children or all children are
non-dependent)32.9%
12.8% 13.6%
9.8% 10.8%
22.6% 24.4%
1,620
Number of households with dependent children
and no adults in employment68 2,111
More than one family7 or other household types
with dependent children56
440 10,643
339 8,450
779 19,093
835 20,713
HOUSEHOLDS WITH DEPENDENT CHILDREN tables KS106, KS107 & QS113
There is no age limit applied to the definition of a child . For example, a couple living with their son aged 40 would
be classified as a family consisting of a couple and their child unless the son has a partner or child living in the
household. A dependent child is a person aged 0 to 15 in a household (whether or not in a family) or aged 16 to
18 in full-time education and living in a family with his or her parent(s). It does not include any children who have a
spouse, partner or child living in the household.
3,446 78,319
Mortimer locality Herefordshire
Oct 2013 (v 1.0)
www.herefordshire.gov.uk/census
2011 Census Area Profile Mortimer Ward 2
Number of residents aged 16 and over
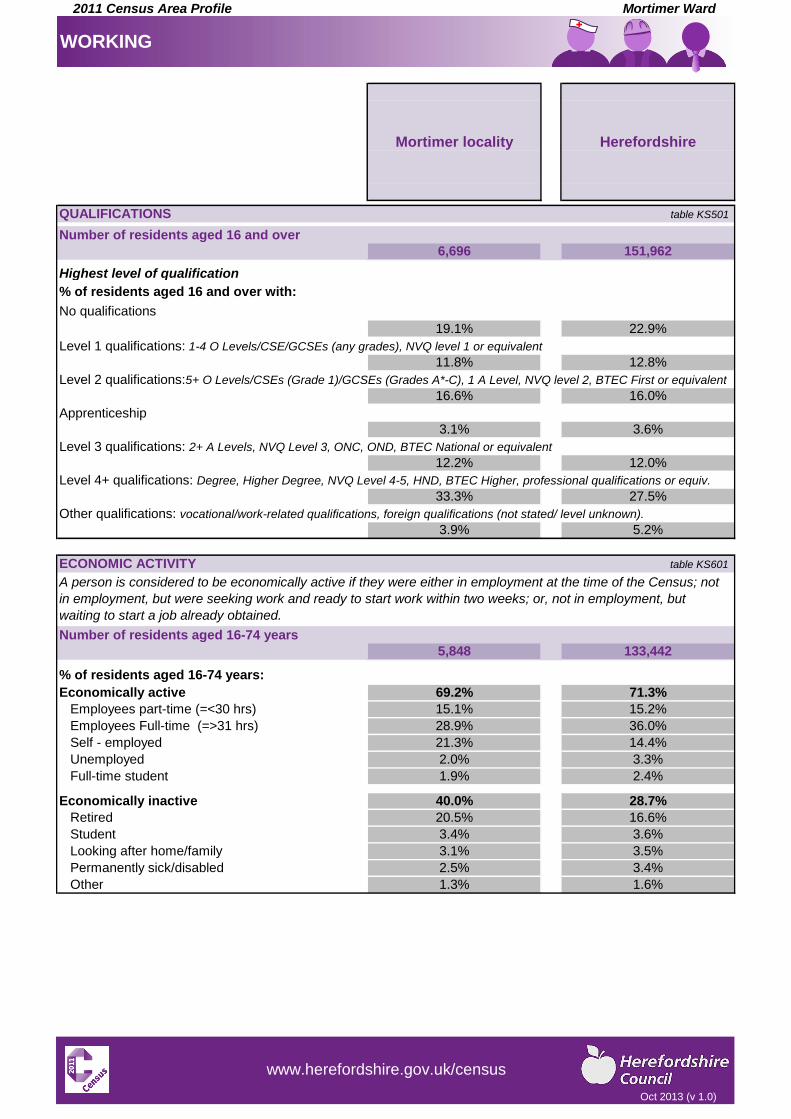
Highest level of qualification
% of residents aged 16 and over with:
No qualifications
Level 1 qualifications: 1-4 O Levels/CSE/GCSEs (any grades), NVQ level 1 or equivalent
Level 2 qualifications:5+ O Levels/CSEs (Grade 1)/GCSEs (Grades A*-C), 1 A Level, NVQ level 2, BTEC First or equivalent
Apprenticeship
Level 3 qualifications: 2+ A Levels, NVQ Level 3, ONC, OND, BTEC National or equivalent
Level 4+ qualifications: Degree, Higher Degree, NVQ Level 4-5, HND, BTEC Higher, professional qualifications or equiv.
Other qualifications: vocational/work-related qualifications, foreign qualifications (not stated/ level unknown).
Number of residents aged 16-74 years
% of residents aged 16-74 years:
3.4%
Other 1.3% 1.6%
Permanently sick/disabled 2.5%
3.6%
Looking after home/family 3.1% 3.5%
Student 3.4%
28.7%
Retired 20.5% 16.6%
Economically inactive 40.0%
3.3%
Full-time student 1.9% 2.4%
Unemployed 2.0%
36.0%
Self - employed 21.3% 14.4%
Employees Full-time (=>31 hrs) 28.9%
71.3%
Employees part-time (=<30 hrs) 15.1% 15.2%
Economically active 69.2%
ECONOMIC ACTIVITY table KS601
A person is considered to be economically active if they were either in employment at the time of the Census; not
in employment, but were seeking work and ready to start work within two weeks; or, not in employment, but
waiting to start a job already obtained.
5,848 133,442
3.9% 5.2%
33.3% 27.5%
12.2% 12.0%
3.1% 3.6%
16.6% 16.0%
11.8% 12.8%
19.1% 22.9%
QUALIFICATIONS table KS501
6,696 151,962
WORKING
Mortimer locality Herefordshire
Oct 2013 (v 1.0)
www.herefordshire.gov.uk/census
2011 Census Area Profile Mortimer Ward
Number of residents aged 16-74 in employment
% of residents aged 16-74 in employment working in:
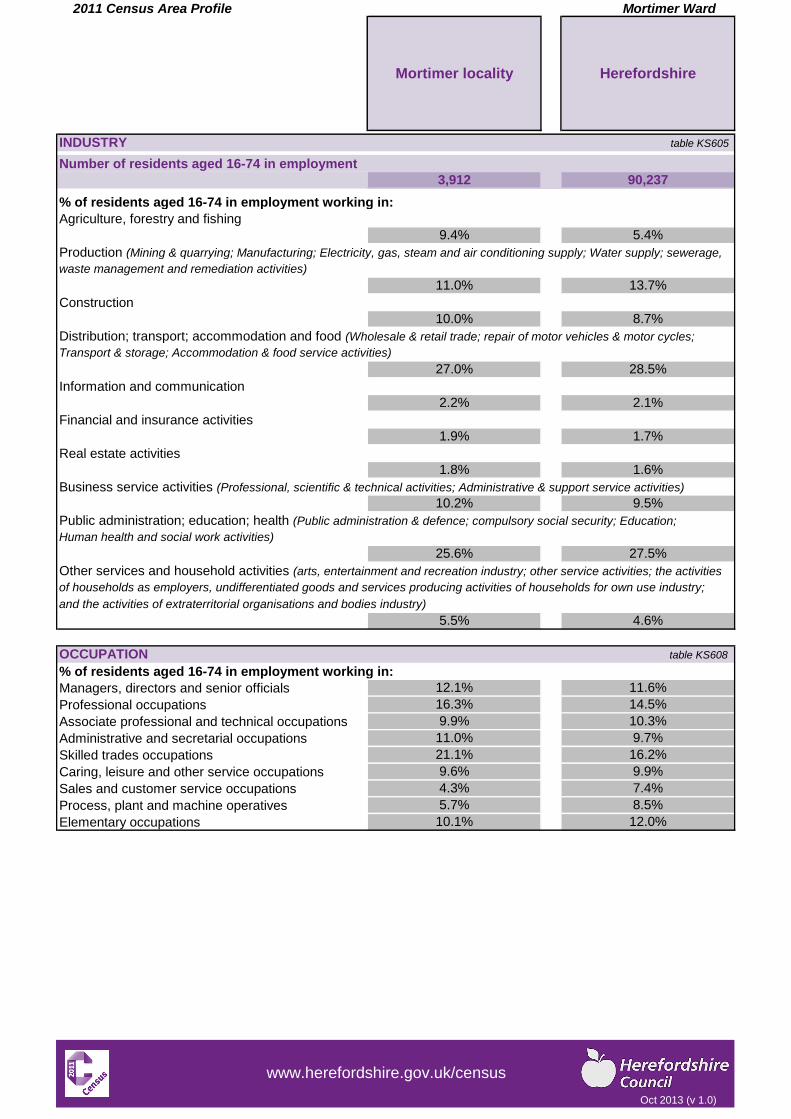
Agriculture, forestry and fishing
Production (Mining & quarrying; Manufacturing; Electricity, gas, steam and air conditioning supply; Water supply; sewerage,
waste management and remediation activities)
Construction
Distribution; transport; accommodation and food (Wholesale & retail trade; repair of motor vehicles & motor cycles;
Transport & storage; Accommodation & food service activities)
Information and communication
Financial and insurance activities
Real estate activities
Business service activities (Professional, scientific & technical activities; Administrative & support service activities)
Public administration; education; health (Public administration & defence; compulsory social security; Education;
Human health and social work activities)
Other services and household activities (arts, entertainment and recreation industry; other service activities; the activities
of households as employers, undifferentiated goods and services producing activities of households for own use industry;
and the activities of extraterritorial organisations and bodies industry)
% of residents aged 16-74 in employment working in:
Managers, directors and senior officials
Professional occupations
Associate professional and technical occupations
Administrative and secretarial occupations
Skilled trades occupations
Caring, leisure and other service occupations
Sales and customer service occupations
Process, plant and machine operatives
Elementary occupations 10.1% 12.0%
5.7% 8.5%
4.3% 7.4%
9.6% 9.9%
21.1% 16.2%
11.0% 9.7%
9.9% 10.3%
16.3% 14.5%
OCCUPATION table KS608
12.1% 11.6%
27.5%
5.5% 4.6%
25.6%
1.6%
10.2% 9.5%
1.8%
2.1%
1.9% 1.7%
2.2%
8.7%
27.0% 28.5%
10.0%
5.4%
11.0% 13.7%
9.4%
INDUSTRY table KS605
3,912 90,237
Mortimer locality Herefordshire
Oct 2013 (v 1.0)
www.herefordshire.gov.uk/census
2011 Census Area Profile Mortimer Ward
Number of residents aged 16-74 years and over
% of residents aged 16-74 in:
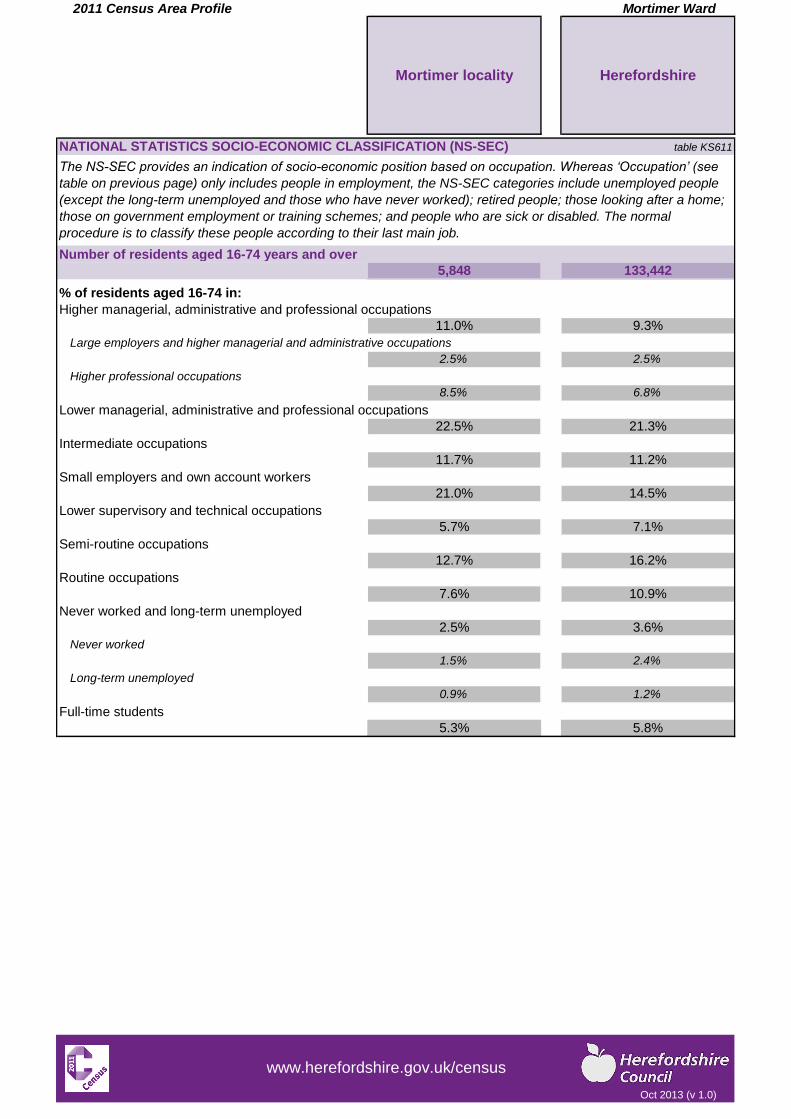
Higher managerial, administrative and professional occupations
Large employers and higher managerial and administrative occupations
Higher professional occupations
Lower managerial, administrative and professional occupations
Intermediate occupations
Small employers and own account workers
Lower supervisory and technical occupations
Semi-routine occupations
Routine occupations
Never worked and long-term unemployed
Never worked
Long-term unemployed
Full-time students
5.3% 5.8%
0.9% 1.2%
1.5% 2.4%
2.5% 3.6%
7.6% 10.9%
12.7% 16.2%
5.7% 7.1%
21.0% 14.5%
11.7% 11.2%
22.5% 21.3%
8.5% 6.8%
2.5% 2.5%
11.0% 9.3%
NATIONAL STATISTICS SOCIO-ECONOMIC CLASSIFICATION (NS-SEC) table KS611
The NS-SEC provides an indication of socio-economic position based on occupation. Whereas ‘Occupation’ (see
table on previous page) only includes people in employment, the NS-SEC categories include unemployed people
(except the long-term unemployed and those who have never worked); retired people; those looking after a home;
those on government employment or training schemes; and people who are sick or disabled. The normal
procedure is to classify these people according to their last main job.
5,848 133,442
Mortimer locality Herefordshire
Oct 2013 (v 1.0)
www.herefordshire.gov.uk/census
2011 Census Area Profile Mortimer Ward
Number of residents aged 16-74 years and over
% of residents aged 16-74 who:
Number of residents aged 16 to 74 who travel to work
% of residents aged 16 to 74 who travel to work and get there by:
Number of households (one person or a group of people with common housekeeping)
% of households with access to the following number of cars or vans:
Number of cars or vans in the area
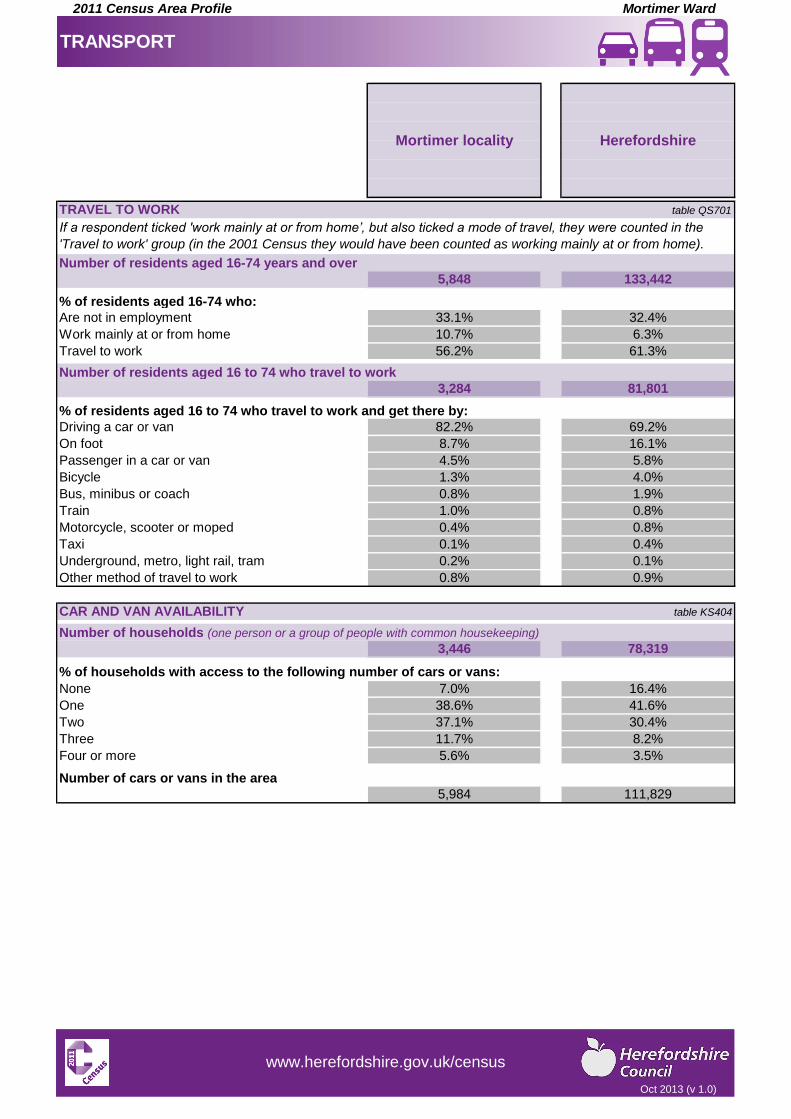
3.5%
5,984 111,829
Four or more 5.6%
30.4%
Three 11.7% 8.2%
Two 37.1%
16.4%
One 38.6% 41.6%
None 7.0%
CAR AND VAN AVAILABILITY table KS404
3,446 78,319
0.1%
Other method of travel to work 0.8% 0.9%
Underground, metro, light rail, tram 0.2%
0.8%
Taxi 0.1% 0.4%
Motorcycle, scooter or moped 0.4%
1.9%
Train 1.0% 0.8%
Bus, minibus or coach 0.8%
5.8%
Bicycle 1.3% 4.0%
Passenger in a car or van 4.5%
69.2%
On foot 8.7% 16.1%
Driving a car or van 82.2%
61.3%
3,284 81,801
Travel to work 56.2%
32.4%
Work mainly at or from home 10.7% 6.3%
Are not in employment 33.1%
TRAVEL TO WORK table QS701
If a respondent ticked 'work mainly at or from home’, but also ticked a mode of travel, they were counted in the
'Travel to work' group (in the 2001 Census they would have been counted as working mainly at or from home).
5,848 133,442
TRANSPORT
Mortimer locality Herefordshire
Oct 2013 (v 1.0)
www.herefordshire.gov.uk/census
2011 Census Area Profile Mortimer Ward
Number of residents
% of residents with limiting long term illness:
Daily activities limited:
Daily activities limited:
Health is a self-assessment of a person’s general state of health.
% of residents whose health was:
Number of residents providing unpaid care:
% of residents who provide unpaid care for:
1 to 19 hours
20 to 49 hours
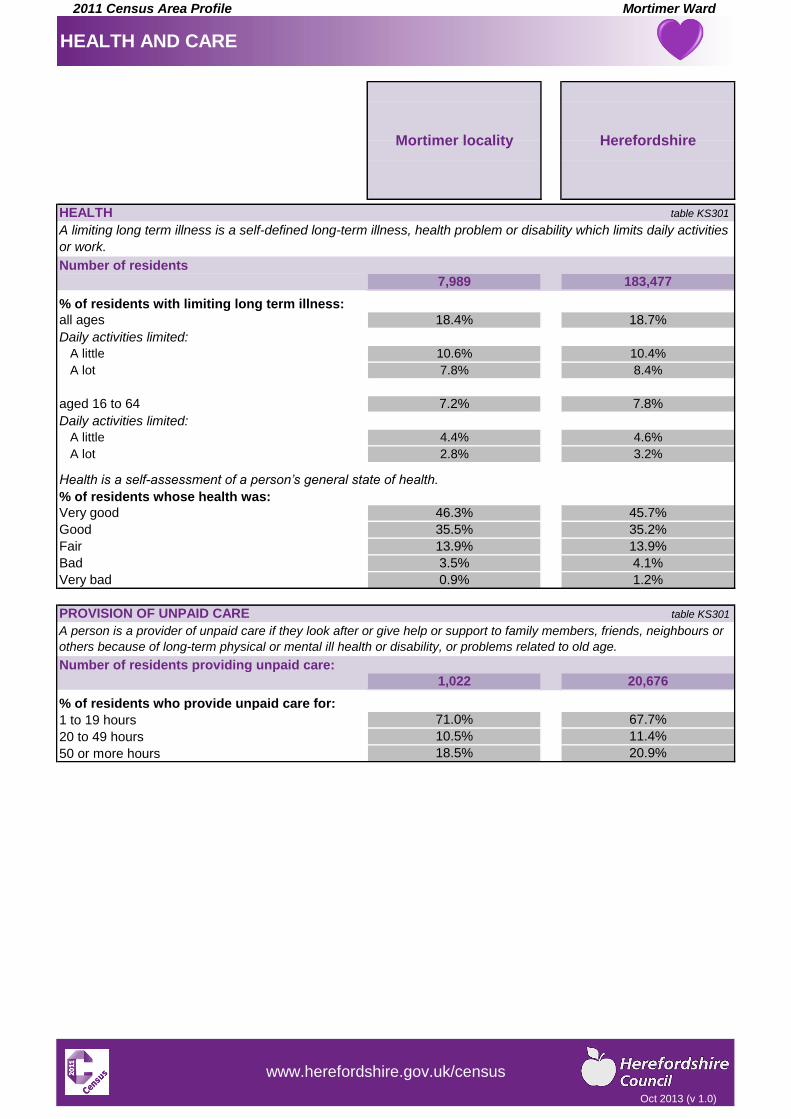
50 or more hours 18.5% 20.9%
10.5% 11.4%
71.0% 67.7%
1.2%
PROVISION OF UNPAID CARE table KS301
A person is a provider of unpaid care if they look after or give help or support to family members, friends, neighbours or
others because of long-term physical or mental ill health or disability, or problems related to old age.
1,022 20,676
Very bad 0.9%
13.9%
Bad 3.5% 4.1%
Fair 13.9%
45.7%
Good 35.5% 35.2%
Very good 46.3%
4.6%
A lot 2.8% 3.2%
A little 4.4%
8.4%
aged 16 to 64 7.2% 7.8%
A lot 7.8%
18.7%
A little 10.6% 10.4%
all ages 18.4%
HEALTH table KS301
A limiting long term illness is a self-defined long-term illness, health problem or disability which limits daily activities
or work.
7,989 183,477
HEALTH AND CARE
Mortimer locality Herefordshire
Oct 2013 (v 1.0)
www.herefordshire.gov.uk/census