morningstar direct · morningstar direct. if you save an investment list, search criteria, or...
TRANSCRIPT
MorningstarDirect
SoftwareTutorial
June 2006
SM
Designed for institutional use, Morningstar DirectSM is an Internet-based research
platform that enables you to perform in-depth investment analysis.
It powers sophisticated holdings- and returns-based style analysis, insightful
peer/competitive analysis, thorough manager performance evaluation,
and efficient investment monitoring and reporting. Morningstar Direct fully inte-
grates all investment universes to enable cross-universe analysis. It is
the exclusive source for underlying details on proprietary Morningstar statistics.
Use Morningstar Direct to conduct a manager search and selection across
investment types, conduct fund line-up reporting, deconstruct Morningstar’s propri-
etary methodologies, support new product development, explore and highlight
the differences and similarities among investments, and create insightful reports
and presentations in sales and education situations.
The objective of this tutorial is to get you started quickly on the most
commonly used features in Morningstar Direct. The application’s help menu
provides more detailed assistance.
At Morningstar we strive to exceed your expectations.
Welcome

Overview
Searches and Lists
Reports and Charts
Data Sets and Customization
5 Product Layout
6 Navigating the File Area
7 Navigating the Data Area
8 Getting Started
11 Dynamic Search Criteria
14 Static Investment Lists
19 Portfolio Holdings
21 Pre-defined Reports
22 Report Builder
24 Charts
27 Data Sets
28 Custom Data Points
31 Custom Investments

Overview
Product Layout 5
Navigating the File Area 6
Navigating the Data Area 7
Getting Started 8
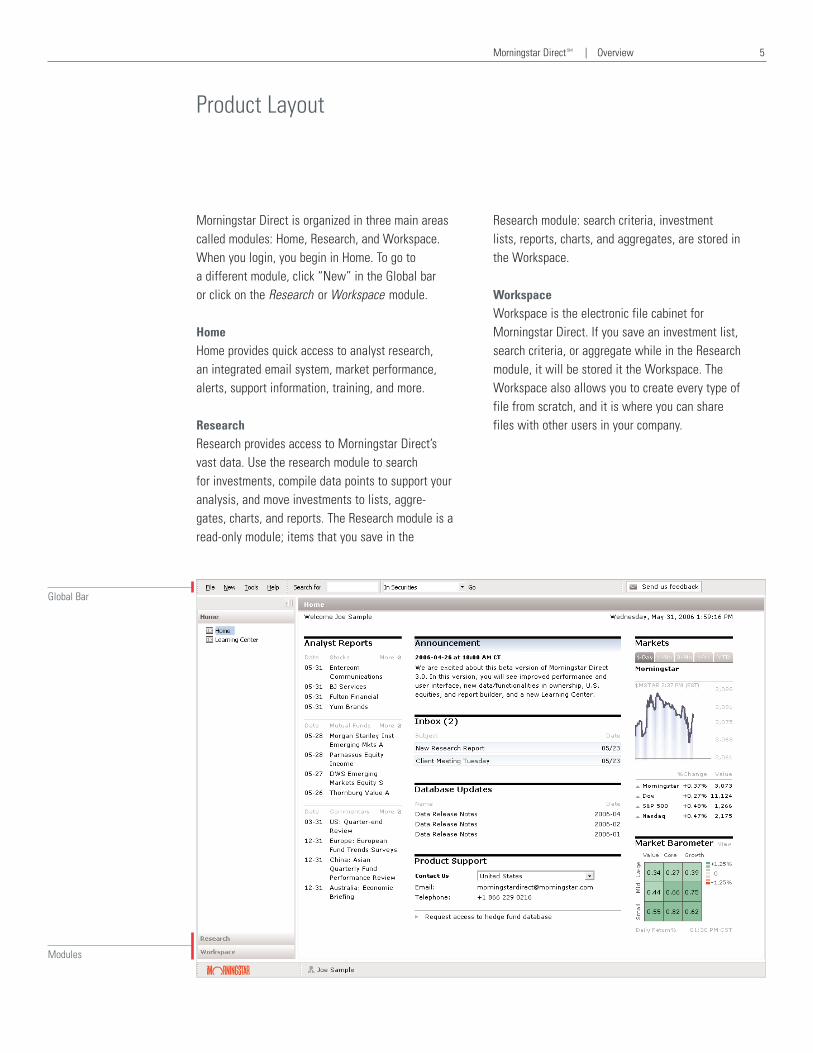
Morningstar Direct is organized in three main areascalled modules: Home, Research, and Workspace.When you login, you begin in Home. To go to a different module, click “New” in the Global bar or click on the Research or Workspace module.
HomeHome provides quick access to analyst research,an integrated email system, market performance,alerts, support information, training, and more.
ResearchResearch provides access to Morningstar Direct’s vast data. Use the research module to search for investments, compile data points to support youranalysis, and move investments to lists, aggre-gates, charts, and reports. The Research module is a read-only module; items that you save in the
Research module: search criteria, investment lists, reports, charts, and aggregates, are stored in the Workspace.
WorkspaceWorkspace is the electronic file cabinet forMorningstar Direct. If you save an investment list,search criteria, or aggregate while in the Researchmodule, it will be stored it the Workspace. TheWorkspace also allows you to create every type of file from scratch, and it is where you can share files with other users in your company.
Product Layout
Morningstar DirectSM | Overview 5
Modules
Global Bar

File Area vs. Data AreaThe menus and capabilities of Morningstar Directchange between File and Data sections, so it is important to know the difference. In Research, fileareas contain investment universes, and data areas contain investments. In Workspace, file areascontain lists of saved files of the same type, and data areas display the file.
File Area OverviewTo reach a file area, select an item from the left-handpane. The file area contains the list of content associated with the item. Examples of file areas arethe different universes inside the Research module,and the lists of saved files in the Workspace. Use the grey bar between the menu bar and the action bar to determine what file and data window you areviewing. Click on the file area segment in this bar toreturn to the file area.
Global BarThe global bar does not change regardless of whereyou are in the application. It allows you to performtasks such as changing application settings, creatingnew files, launching tools, and accessing the helpmenu. You can use the ‘Search for’ bar to quickly locateinformation on a specific investment.
Menu BarThe Menu bar in each window let’s you perform actionsspecific to the list of files—for example, here you can create a new list of open end funds. Shortcut Iconson the Action bar represent the most commonly used tasks.
Navigating the File Area
Morningstar DirectSM | Overview 6
Filter List Alphabetically
Global Bar
Menu Bar and Shortcut Icons
Click to Sort
Click here to select all

Data AreaTo reach a data area click on the file name from the list in the file area.
Menu BarThe Menu bar contains the Action button, which allowsyou to add selected investments to Investment Listsand Aggregates, select a benchmark, and add a simpleaverage line. You can also press Action/X-Ray to view a report on an equally weighted portfolio of the selected investments.
Next to the Action button are shortcut buttons tocommonly-used tasks. These vary depending on whattype of the data area you are using.
Navigating the Data Area
Morningstar DirectSM | Overview 7
Global Bar
Filter List Alphabetically
Use the Action button to generateReports, Charts, and more
Getting Started Morningstar Direct SM | Overview 8
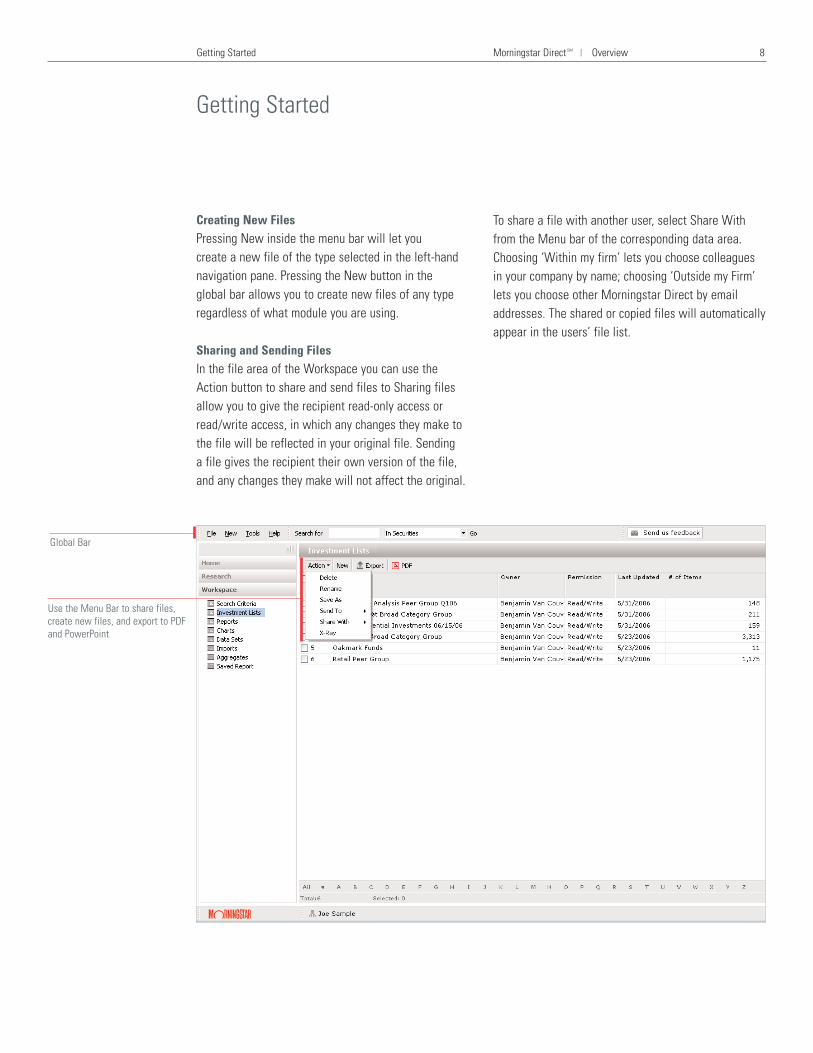
Creating New FilesPressing New inside the menu bar will let you create a new file of the type selected in the left-hand navigation pane. Pressing the New button in the global bar allows you to create new files of any type regardless of what module you are using.
Sharing and Sending FilesIn the file area of the Workspace you can use theAction button to share and send files to Sharing filesallow you to give the recipient read-only access orread/write access, in which any changes they make tothe file will be reflected in your original file. Sending a file gives the recipient their own version of the file,and any changes they make will not affect the original.
To share a file with another user, select Share Withfrom the Menu bar of the corresponding data area.Choosing ‘Within my firm’ lets you choose colleaguesin your company by name; choosing ‘Outside my Firm’lets you choose other Morningstar Direct by emailaddresses. The shared or copied files will automaticallyappear in the users’ file list.
Use the Menu Bar to share files,create new files, and export to PDFand PowerPoint
Global Bar
Getting Started

Changing Password and Account InformationTo change your password or update your profile, clickon your name at the bottom of the screen.
Hedge Fund AgreementTo receive access to hedge fund data, click on theHedge Fund Agreement in the Product Support sectionof the Home module.
User PreferencesBy pressing File/Set User Preferences you can changethe default data universe, page size, benchmarks, risk-free proxy, currency, and decimal points. Page sizecontrols the number of rows you can see at one time
in lists of items in windows and dialogs. Increasing the number of rows in a page may impact yourbrowsing speed. You can also change the orientation of user-created PDFs (this doesn’t apply to pre-defined PDF reports and chart PDFs). Choosing todisplay extended performance will set Direct to includeextended performance in investment returns. Extended performance simulates performance prior to inception by using the gross returns of the oldest share class and modifying them with the expense ratio of the subject share class.
Getting Started Morningstar Direct SM | Overview 9
The Support Section containscontact information and theHedge Fund Agreement
Client feedback supports future product developmentand training program.
Click on Your Name to Change Password
Use the Global Menu to createnew files
Searches andLists
Dynamic Search Criteria 11
Static Investment Lists 14
Portfolio Holdings 19
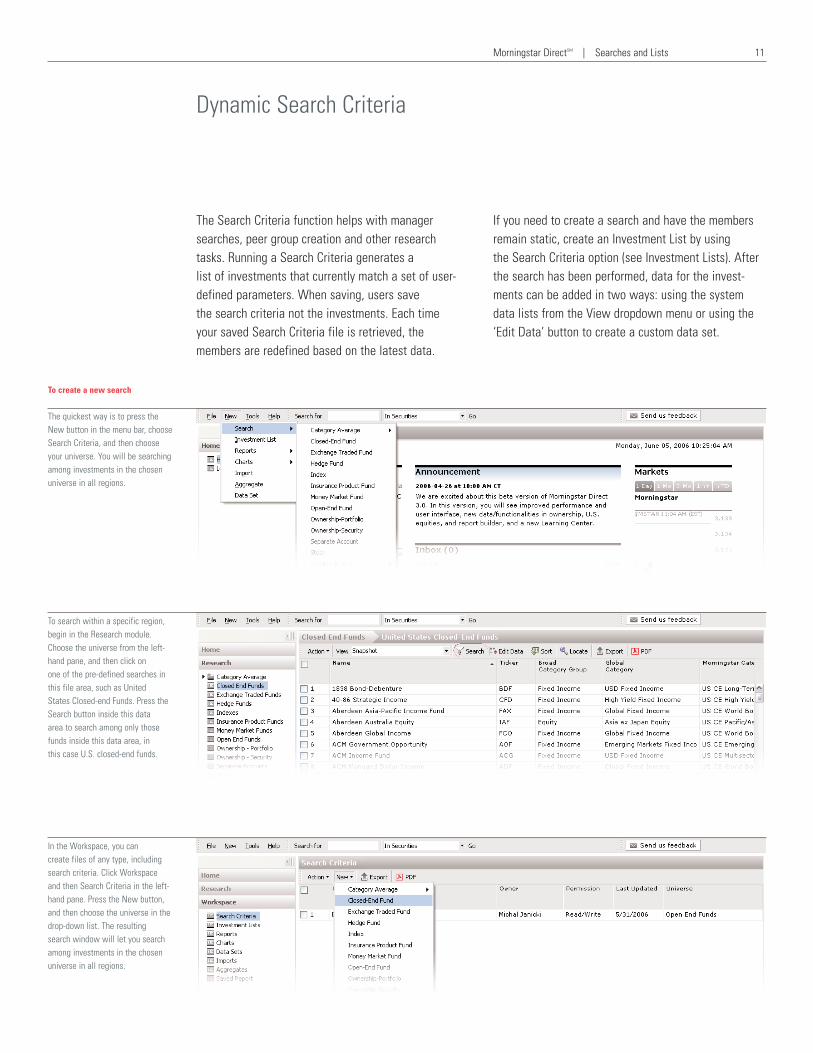
The Search Criteria function helps with managersearches, peer group creation and other research tasks. Running a Search Criteria generates a list of investments that currently match a set of user-defined parameters. When saving, users save the search criteria not the investments. Each time your saved Search Criteria file is retrieved, themembers are redefined based on the latest data.
If you need to create a search and have the membersremain static, create an Investment List by using the Search Criteria option (see Investment Lists). Afterthe search has been performed, data for the invest-ments can be added in two ways: using the systemdata lists from the View dropdown menu or using the‘Edit Data’ button to create a custom data set.
To create a new search
The quickest way is to press theNew button in the menu bar, chooseSearch Criteria, and then chooseyour universe. You will be searchingamong investments in the chosenuniverse in all regions.
To search within a specific region,begin in the Research module.Choose the universe from the left-hand pane, and then click on one of the pre-defined searches inthis file area, such as United States Closed-end Funds. Press theSearch button inside this data area to search among only thosefunds inside this data area, inthis case U.S. closed-end funds.
In the Workspace, you can create files of any type, includingsearch criteria. Click Workspaceand then Search Criteria in the left-hand pane. Press the New button,and then choose the universe in thedrop-down list. The resulting search window will let you searchamong investments in the chosenuniverse in all regions.
Dynamic Search Criteria
Morningstar DirectSM | Searches and Lists 11

Using Dynamic Search CriteriaLet’s create a list of open-end funds in the small growth Morningstar Category with trailing 3-year totalreturns in the top quartile of that category.
Begin by pressing New in the menu bar, move toSearch, and choose Open-end Fund.
In the new window, click the second row, Field column.Expand Snapshot, and click Morningstar Category.Verify that the Operator column shows “=”. Click in the second row, Value column, and expand theU.S. group, and choose Small Growth. (continued on next page)1
2
3
Dynamic Search Criteria Morningstar Direct SM | Searches and Lists 12
1
2 3
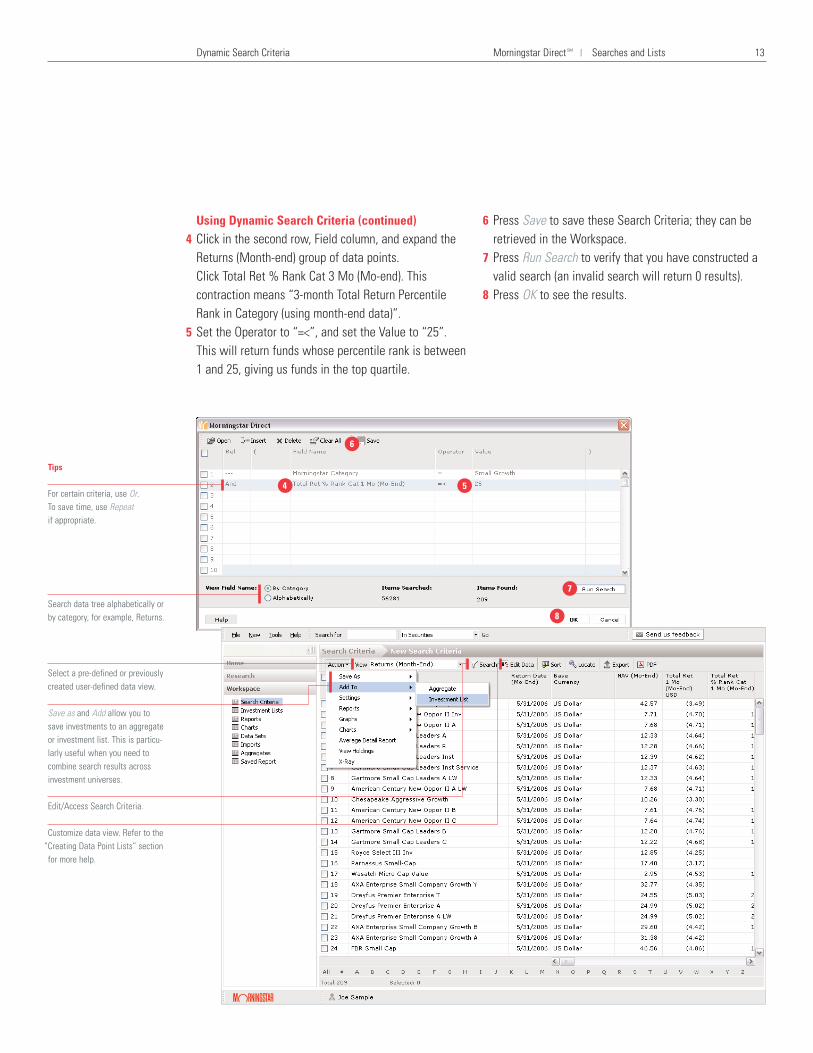
Using Dynamic Search Criteria (continued)Click in the second row, Field column, and expand theReturns (Month-end) group of data points. Click Total Ret % Rank Cat 3 Mo (Mo-end). Thiscontraction means “3-month Total Return PercentileRank in Category (using month-end data)”. Set the Operator to “=<”, and set the Value to “25”.This will return funds whose percentile rank is between 1 and 25, giving us funds in the top quartile.
Press Save to save these Search Criteria; they can beretrieved in the Workspace. Press Run Search to verify that you have constructed avalid search (an invalid search will return 0 results).Press OK to see the results.
Dynamic Search Criteria Morningstar Direct SM | Searches and Lists 13
4
5
6
7
8
54
6
7
8
Tips
For certain criteria, use Or. To save time, use Repeat if appropriate.
Search data tree alphabetically orby category, for example, Returns.
Select a pre-defined or previouslycreated user-defined data view.
Save as and Add allow you to save investments to an aggregate or investment list. This is particu-larly useful when you need tocombine search results acrossinvestment universes.
Edit/Access Search Criteria.
Customize data view. Refer to the “Creating Data Point Lists” sectionfor more help.

Morningstar Direct SM | Searches and Lists 14
Investment Lists serve performance reporting, peeranalysis, and other important tasks. The user definesthe membership of the investment list in one of four ways: individually, by search criteria, accessing a pre-created investment list, or by importing. The
data points associated with an investment list aredefined in one of two ways: using system data lists, or with a data point list pre-created by the user.
To create a new list
The quickest way is to press the New button in the global bar,and choose Investment List.
In the menu bar of theWorkspace/Investment List File area, press New.
Static Investment Lists

Creating a List by Name/TickerBegin by pressing New in a file area, and choosingInvestment List. In the dialog box that opens asking you how you want to add investments, click Name/Ticker, and thenclick OK. Click Universes to add from an investment universe or My Lists to add from an existing Investment List. In the Find by field, choose how you would like to search, either by name, ticker, SecID, CUSIP, or ISIN. In the search bar, enter your search term, and click Go (To view all investments in the universe or list, click Go without entering any text). Steps 3 and 4 can be repeated to combine investmentsacross investment universes.
The results of the search will appear in the AvailableRecords pane; select the subject investment(s), andthen click the Add button. To change the order of investments in the resulting list,select specific investments in the Selected Recordspane, and then use the arrow buttons. Click OK. A new window opens with your investments. To save the investment list, click Save.
Static Investment Lists Morningstar Direct SM | Searches and Lists 15
1
2
3
4
5
6
78
1
2
4
3
5
6
78

Creating Investment Lists Using Search CriteriaThe process to create an Investment List using searchcriteria is very similar to creating a Search Criteria by itself. The only difference is that once the list hasbeen created, the investments in the list are static,whereas opening a saved search criteria performs thesearch anew each time.
Begin by pressing the New button in the menu bar of any file area and choosing Investment List, or bypressing the New button in the action bar of the Workspace/Investment Lists data area.
In the window that asks you how you would like to create the search, select Search Criteria, select auniverse, and press OK.
The following search process is the same whether you are creating an Investment List or generating asaved Search Criteria; please refer to the ‘Using SearchCriteria’ section on page 15 for a step-by-step guide.
Static Investment Lists Morningstar Direct SM | Searches and Lists 16
1
2
1
2
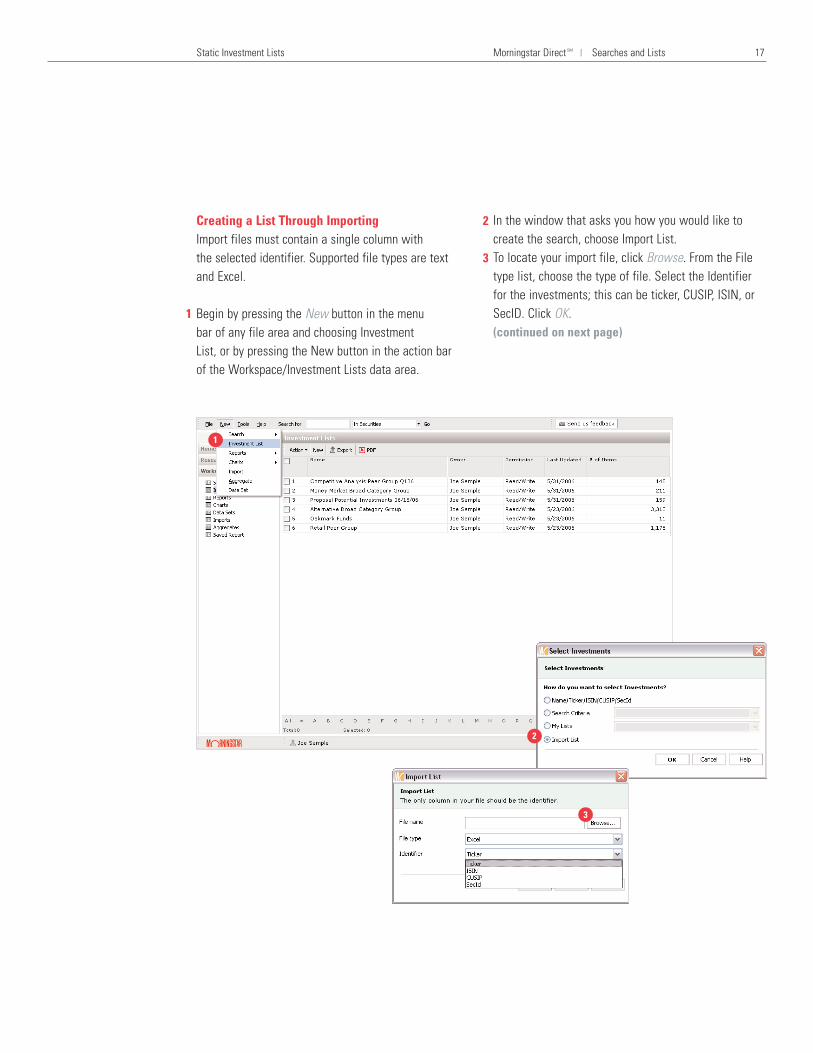
Creating a List Through Importing Import files must contain a single column with the selected identifier. Supported file types are textand Excel.
Begin by pressing the New button in the menu bar of any file area and choosing Investment List, or by pressing the New button in the action bar of the Workspace/Investment Lists data area.
In the window that asks you how you would like tocreate the search, choose Import List. To locate your import file, click Browse. From the Filetype list, choose the type of file. Select the Identifierfor the investments; this can be ticker, CUSIP, ISIN, orSecID. Click OK.(continued on next page)
Static Investment Lists Morningstar Direct SM | Searches and Lists 17
1
2
3
1
2
3

Static Investment Lists Morningstar Direct SM | Searches and Lists 18
If the import process encounters a problem with the provided data, an import summary report will open.Read the warning(s), then click OK to continue theimport process or Cancel to abort it.Clicking OK will open a dialog to identify unmatchedinvestments.
Select an identifier and click Find to match the investment. Repeat for all identifiers shown, and clickOK to complete the import process. Clicking OK without using Find to match all investments will importonly those tickers which are identified. The imported list will open in the data area. Tosave the investment list, click Save.
6
7
4
5
Tips
To move or delete investments, and generate reports/charts, check the box next to an investment and select an option from theAction bar. Save As allows you tocreate another investment list from an existing list or aggregate.Add To allows you to add invest-ment to another already existing listor existing aggregate.
Add to an investment list.
4
5
6
7
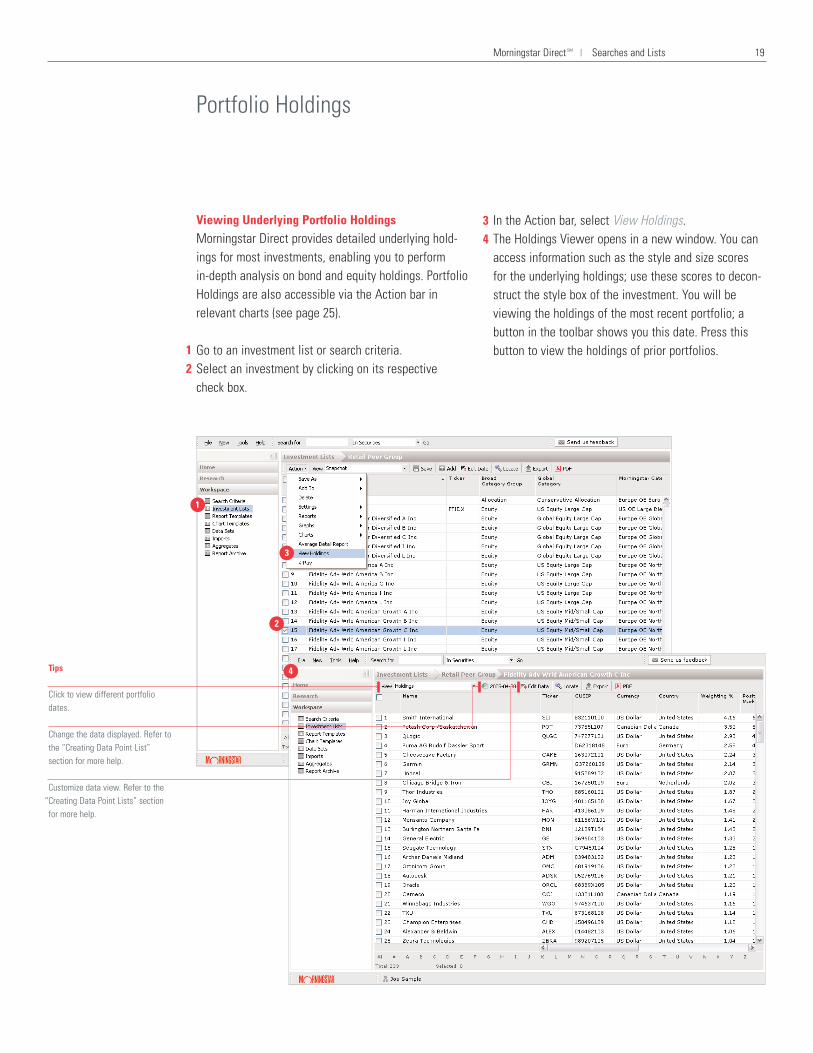
Viewing Underlying Portfolio HoldingsMorningstar Direct provides detailed underlying hold-ings for most investments, enabling you to perform in-depth analysis on bond and equity holdings. PortfolioHoldings are also accessible via the Action bar in relevant charts (see page 25).
Go to an investment list or search criteria.Select an investment by clicking on its respective check box.
In the Action bar, select View Holdings. The Holdings Viewer opens in a new window. You canaccess information such as the style and size scores for the underlying holdings; use these scores to decon-struct the style box of the investment. You will beviewing the holdings of the most recent portfolio; abutton in the toolbar shows you this date. Press thisbutton to view the holdings of prior portfolios.
Portfolio Holdings
Morningstar Direct SM | Searches and Lists 19
12
34
Tips
Click to view different portfoliodates.
Change the data displayed. Refer tothe “Creating Data Point List”section for more help.
Customize data view. Refer to the “Creating Data Point Lists” sectionfor more help.
1
2
3
4

Reports andCharts
Pre-defined Reports 21
Report Builder 22
Charts 24

Generating a Pre-defined ReportPre-defined reports add clarity and understanding to your research and communications.
Go to Workspace and select Reports. On the Action bar, click New, and then select a report. After selecting a report, you will be asked toselect an investment(s). Select the appropriate Universe. In the Find By search bar, choose the search method(name, ticker, CUSIP, ISIN, or SecID), enter the search term, and click Go. To view all investments inthe list, click Go without entering an investment name. If there are more than 100 funds use the dropdown to browse all the investments.
After selecting an investment in the results, click OK. Customize report settings as needed. Each report will have different options. Check “Include disclosurepages” if you wish to define terms in the report.To save the report settings, click Save. To generate the PDF, click OK.
Once the report has been generated, you can save the report to the Workspace, or you can email the report using Morningstar Direct’s internal email program.
Pre-defined Reports
Morningstar DirectSM | Reports and Charts 21
123
45
67
8
12
3
4
5
6
7
8

When the pre-formatted reports in Morningstar Directdo not suit your needs, the Report Builder lets you design custom reports. You create report templatesin the Report Builder, and then use your templates to generate custom reports for investments. You canuse operations, performance, ratings and risk, portfolio,and style analysis components in your custom reports.The report templates you design can have multiplepages, and the templates can be used to report on any investment.
Creating a Report TemplateTo create a report template, press Tools in the menubar of a file area, and click Report Builder. The Report Builder window displays report componentsin the Components tab on the left hand side of thewindow, and a mock-up of a report page on the right.Drag components from the left side and position them on the report mock-up. Navigate between pages by pressing the Pages tab on the upper left, and add a new page by pressingEdit/Add Page. Press the Save button to save your report template.
Morningstar DirectSM | Reports and Charts 22
Report Builder
Tips
Use Edit to insert and delete pagesof your report.
Click Report Settings to set thereport title, page size, benchmarks,and currency.
Click Preview to view your samplereport in single or multiple-pageformat.
1
2
3
4
1
2
34
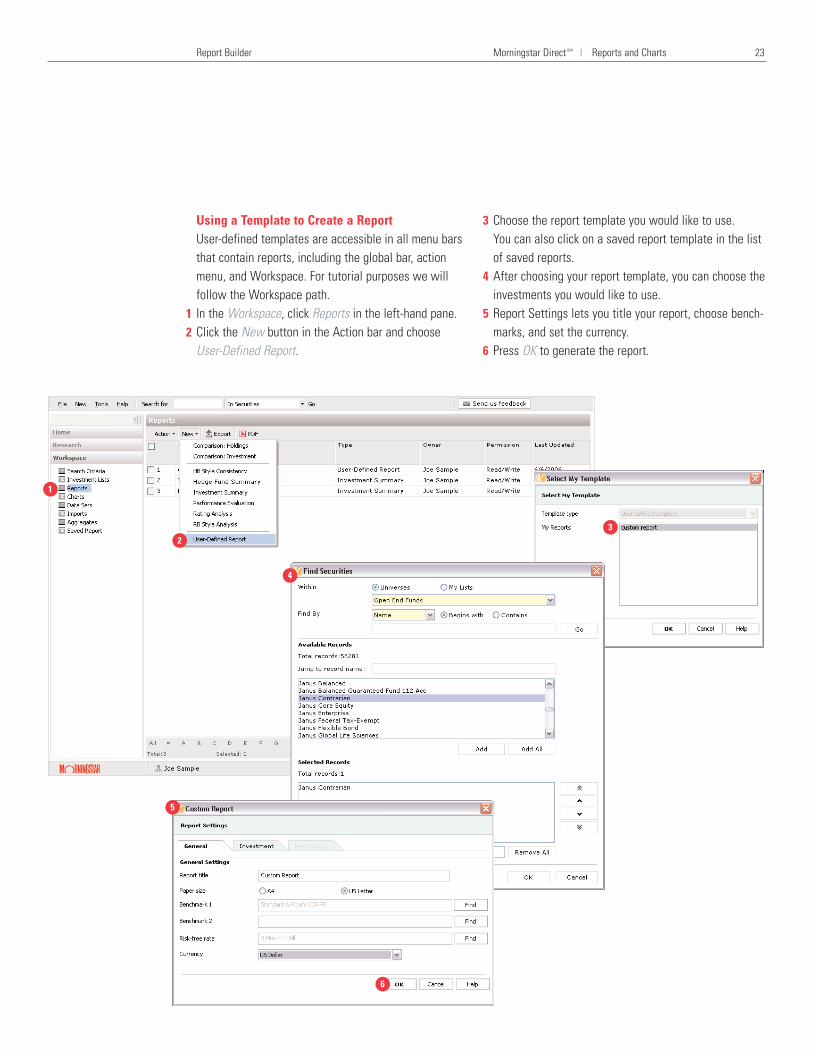
Using a Template to Create a ReportUser-defined templates are accessible in all menu barsthat contain reports, including the global bar, actionmenu, and Workspace. For tutorial purposes we willfollow the Workspace path. In the Workspace, click Reports in the left-hand pane. Click the New button in the Action bar and choose User-Defined Report.
Choose the report template you would like to use. You can also click on a saved report template in the listof saved reports. After choosing your report template, you can choose theinvestments you would like to use. Report Settings lets you title your report, choose bench-marks, and set the currency. Press OK to generate the report.
Report Builder Morningstar Direct SM | Reports and Charts 23
12
3
4
5
6
1
23
4
5
6

When information is better analyzed or conveyed visually, use Morningstar Direct’s charts to displaynumerical data. Charts can be exported intoPowerPoint, generated in PDF, or copied to theWindows clipboard, allowing you to paste the chart into many other applications.
Creating a ChartTo create a chart, press New in the global bar, clickCharts, and choose the chart.
After choosing the investment selection method, theappropriate dialog will appear. After selecting the investments click OK to generatethe chart. Please note that only the first 15 investmentswill be charted.
To create a chart from investments in a search result or investment list, place a check mark next to the investments, press the Action button, click Charts, andthen choose the chart you would like to use. Or, simply right click on the investment name.(continued on next page)
Charts
Morningstar Direct SM | Reports and Charts 24
1
2
3
1
2
3
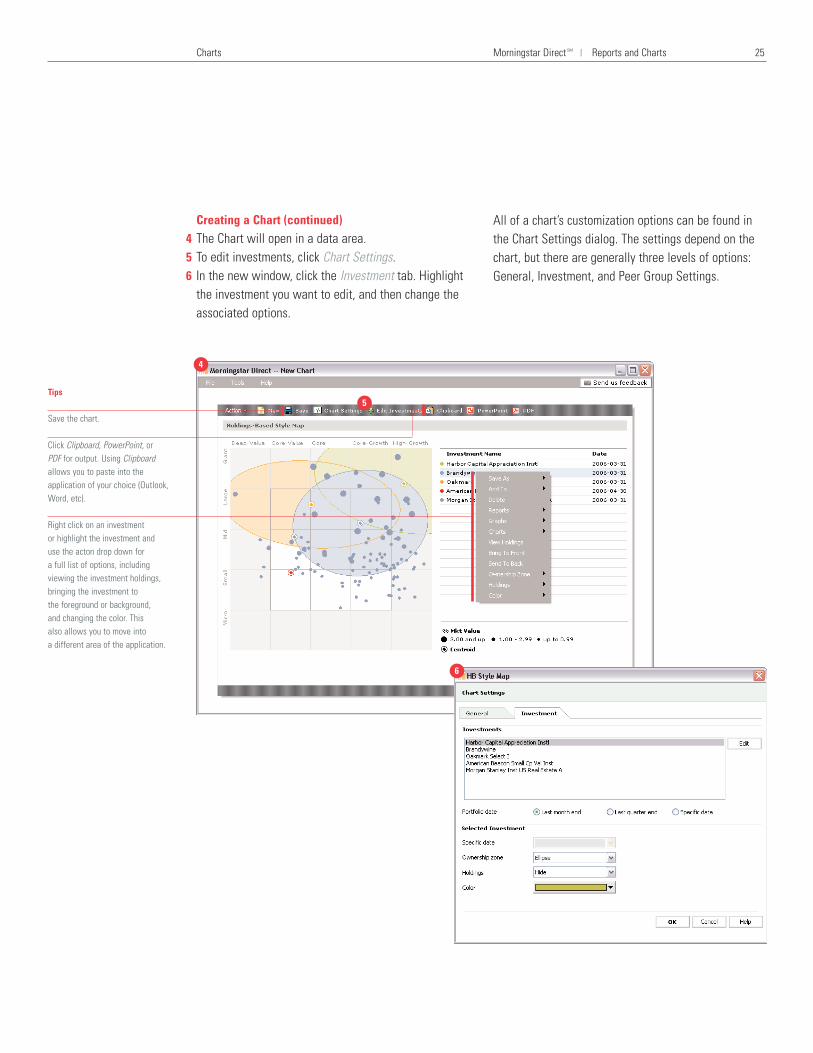
Creating a Chart (continued)The Chart will open in a data area. To edit investments, click Chart Settings. In the new window, click the Investment tab. Highlightthe investment you want to edit, and then change theassociated options.
All of a chart’s customization options can be found inthe Chart Settings dialog. The settings depend on thechart, but there are generally three levels of options:General, Investment, and Peer Group Settings.
Charts Morningstar Direct SM | Reports and Charts 25
Tips
Save the chart.
Click Clipboard, PowerPoint, or PDF for output. Using Clipboardallows you to paste into the application of your choice (Outlook,Word, etc).
Right click on an investment or highlight the investment and use the acton drop down for a full list of options, includingviewing the investment holdings,bringing the investment to the foreground or background, and changing the color. This also allows you to move into a different area of the application.
456
4
5
6

Data Sets andCustomization
Data Sets 27
Custom Data Points 28
Custom Investments 31

Creating a Data SetCreating a data set allows you to access the most rele-vant information to you in one efficient manner. User created data sets will be available in all areas ofthe application with data views under My Data Sets.
From an Investment List or Search Criteria click Edit Data. Select a data universe. The universe grouping allowsthe user to easily determine data points that apply to agiven universe. Universe options include Morningstarpre-defined universes, custom investments (user-created through the custom investment functionality),and my data sets (previously saved data sets).
Select a data point list using the drop-down list. Select data from the selected data point list, andclick Add. To change the order of your selected data, select thedata points and use the arrow buttons. To change general or calculation point listings, selectdata and click Settings.Click OK. A new window opens with the data.
Morningstar Direct SM | Data Sets and Customization 27
Data Sets
1
2
3
4
5
6
1
2
3
4
6
5

1
Customizing Data PointsCustom data enables you to perform in-depth evalua-tion and benchmarking, and add precision to your analysis. User-created data sets will be availablethroughout the application under My Data Sets.
As an example let’s create trailing 1-, 2-, 3-, 4-, and 5-year trailing Treynor Ratios as of 12-31-2005 anddisplay it as a percentile rank.
From an Investment List or Search Criteria click Edit Data.
Choose the Custom Calculations list in the new window. Choose Treynor Ratio (geometric), and then click Add.From the Selected Data pane, select Treynor Ratio(geometric), and then click Settings. The data Settingsdialog opens. In the General tab under Display options, choosePercentile (descending). This will assign the largestvalue to the lowest percentile. The options under the General tab are available for any numerical dataregardless of data list chosen in Step 2.(continued on next page)
Morningstar Direct SM | Data Sets and Customization 28
Custom Data Points
2
34
5
1
2
3
5
4
Tips
When you apply the data set to a list of investments, the percentilecalculation will be done on the fly based on the investments in yourwindow. This is useful for runningpercentile ranks on custom peergroups and non-return data.
Note that pre-defined percentileranks in Morningstar Category are available for limited return data points.

Custom Data Points Morningstar Direct SM | Data Sets and Customization 29
Customizing Data Points (continued)Click on the Calculation tab. Type in 01-01-2000 in the Start Date box and type 12-31-2005 in the End Date box. Use the calendarbutton to choose dates graphically. Click Find next to the Benchmark box. Type RussellMidcap Value, click Go, and then click OK.
Select Backward Extending Window. (See next page fora description of all four Calculation Window options.)Type in 12 in the Moving Step box. Click OK in the Settings dialog. Click OK in the Select Data Points dialog. A new window opens with your trailing time series defined. To save, click Save.
78
9
10
11121314
15
7
8
9
10
11
12
13
14 15

How Does the Calculation Window Work?For all examples the start date is 1 January 2000, andthe end date is 31 December 2004.
Single Data Point gives you one data point as output based on your start and end date. The following illustration is a single trailing 5 year calculation.
Rolling Window allows you to calculate rolling statis-tics, where the start date and end date both move forward together. Rolling windows are typically used to measure consistency of data. Use Moving Window Size to set the time period for each calculation and Moving Step to set how often each calculation is performed. The following illustra-tion has a moving window size of 4 years and a moving step of three months, so you would get fivedata points as output.
Forward Extending Window allows you to fix the startdate for each calculation. One application of this calculation would be to calculate cumulative perform-ance (data point is total return and annualized is not checked). The following illustration has a movingstep of 12 months, so you would get five data points as output.
Backward Extending Window calculation fixes the enddate for the calculation. It is typically used to calculatetrailing statistics. The following illustration has amoving step of 12 months, so you would get five data points as output.
Custom Data Points Morningstar Direct SM | Data Sets and Customization 30

Users can create custom investments by creatingaggregates or importing a portfolio. You can use aggre-gates throughout the application. Aggregates are listedunder the Custom Investments data universe.
Creating and Editing AggregatesAn aggregate is a portfolio of investments or benchmarks that users create by assigning weights to each investment.
To create an aggregate, go to Workspace, and thenclick Aggregates. On the Action bar, click New and select Aggregate.
Select investments by name, ticker, CUSIP, ISIN, or SecID. Click OK.
You can also create aggregates using investments in an investment list, chart, or the results of a search. To do this, place a check mark next to the invest-ments you would like to add to the aggregate. Press the Action button (or right click), and click Save As Aggregate.(continued on next page)
Custom Investments
Morningstar Direct SM | Data Sets and Customization 31
3
4
1
2
1
2
3
4

Creating and Editing Aggregates (continued)Select Currency and Rebalancing frequency.In the Snapshot Settings window, type in the snapshotdate in YYYY-MM format. Assign weights to the components of the aggregate. Click OK.
A new window opens with your portfolio. Assign aname by Saving the aggregate.Click OK. If complete, you can close the window.
Aggregates can be added to research just like anyother investment. They will appear under theAggregate universe in the Add Investment dialog.
Custom Investments Morningstar Direct SM | Data Sets and Customization 32
Create a snapshot. Useful if theholdings and weights in a portfoliohave changed over time.
Tips
The earliest snapshot date isconsidered the inception date of the aggregate. Aggregateperformance will only be generatedafter the earliest snapshot date.
56
78
9
10
5
6
7
8
9
10
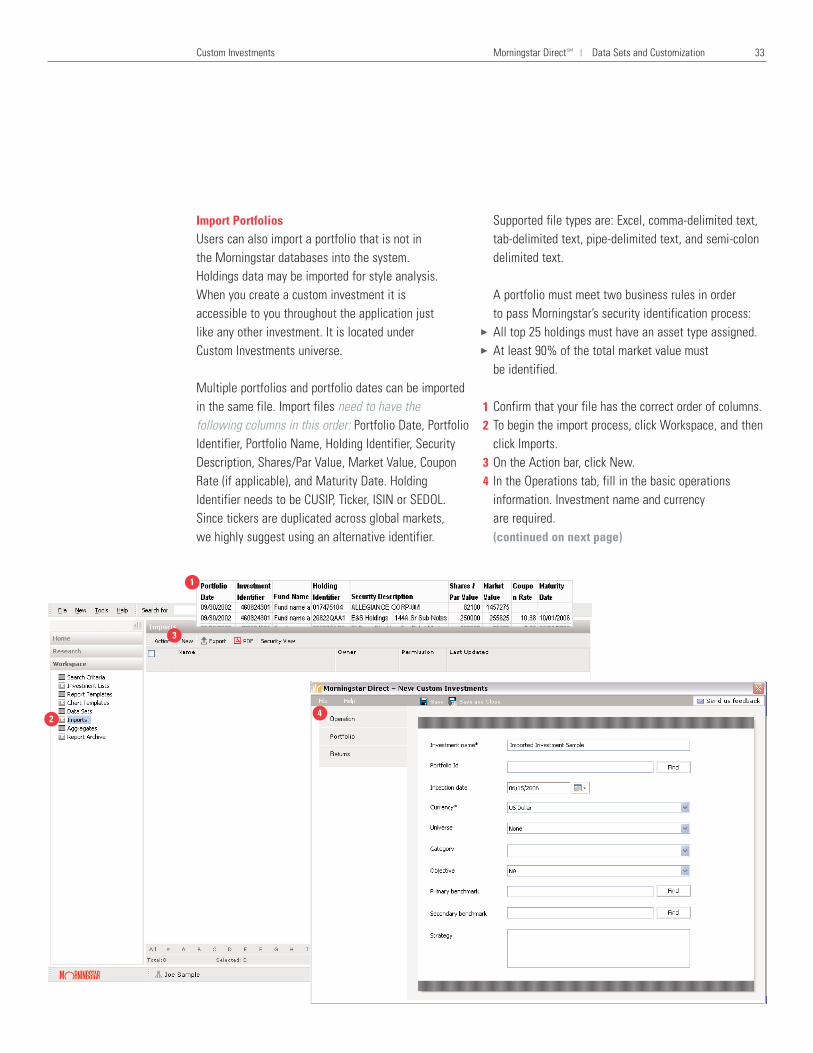
Import PortfoliosUsers can also import a portfolio that is not in the Morningstar databases into the system. Holdings data may be imported for style analysis.When you create a custom investment it is accessible to you throughout the application just like any other investment. It is located under Custom Investments universe.
Multiple portfolios and portfolio dates can be importedin the same file. Import files need to have the following columns in this order: Portfolio Date, PortfolioIdentifier, Portfolio Name, Holding Identifier, SecurityDescription, Shares/Par Value, Market Value, CouponRate (if applicable), and Maturity Date. HoldingIdentifier needs to be CUSIP, Ticker, ISIN or SEDOL.Since tickers are duplicated across global markets, we highly suggest using an alternative identifier.
Supported file types are: Excel, comma-delimited text,tab-delimited text, pipe-delimited text, and semi-colondelimited text.
A portfolio must meet two business rules in order to pass Morningstar’s security identification process: All top 25 holdings must have an asset type assigned.At least 90% of the total market value must be identified.
Confirm that your file has the correct order of columns.To begin the import process, click Workspace, and thenclick Imports. On the Action bar, click New. In the Operations tab, fill in the basic operations information. Investment name and currency are required.(continued on next page)
Custom Investments Morningstar Direct SM | Data Sets and Customization 33
3
3
12
34
2
3
4
1

Import Portfolios (continued)Click the Portfolio tab. Click Import to launch the portfolio import tool. Click Browse to locate your holdings file. Use the FileType menu to choose from one of the supported filetypes. Click Next.The import process will begin. You may see a screenreporting minor problems with your file format; clickClose to continue through the process. You will be ableto manually match securities later.
Click the Operation tab.Click Find. Select the portfolio identifier from your imported file and press OK. It may take a few minutes for theidentifier to appear.Click Save. If you want to import returns, see page 40.
Custom Investments Morningstar Direct SM | Data Sets and Customization 34
567
8
91011
12
5
6
7
8
9
10
11
12
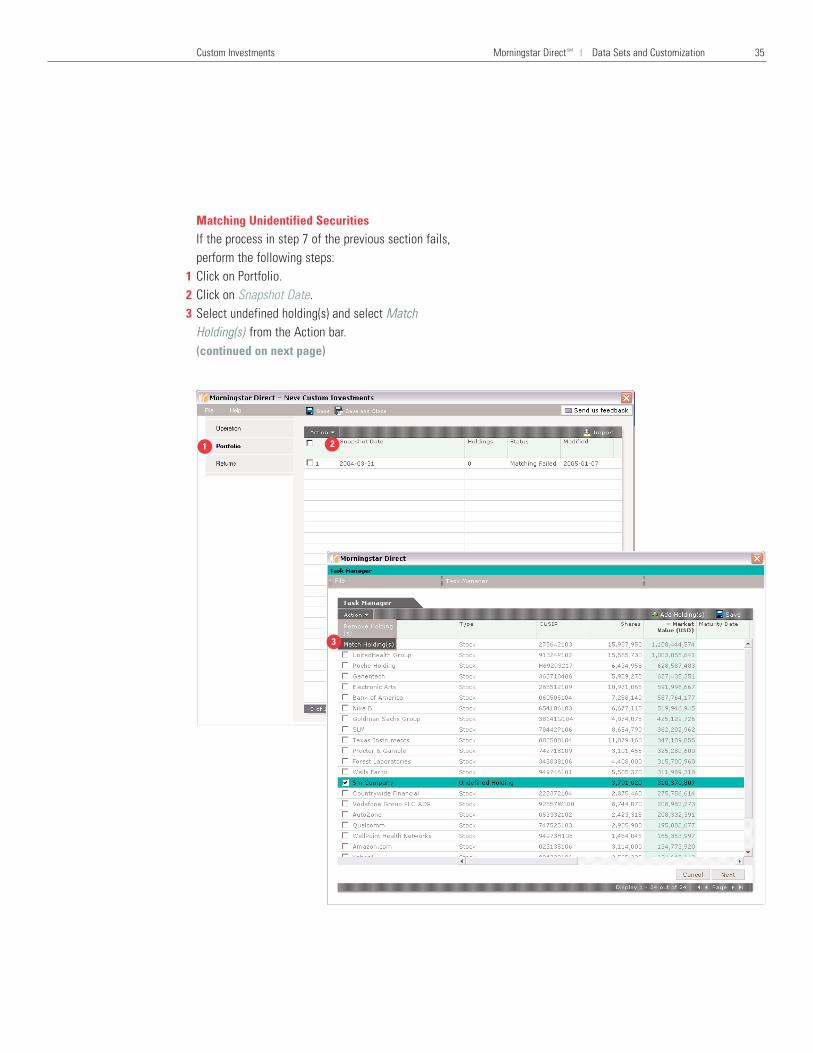
Matching Unidentified SecuritiesIf the process in step 7 of the previous section fails,perform the following steps:Click on Portfolio.Click on Snapshot Date.Select undefined holding(s) and select MatchHolding(s) from the Action bar.(continued on next page)
Custom Investments Morningstar Direct SM | Data Sets and Customization 35
123
1 2
3
Custom Investments Morningstar Direct SM | Data Sets and Customization 36
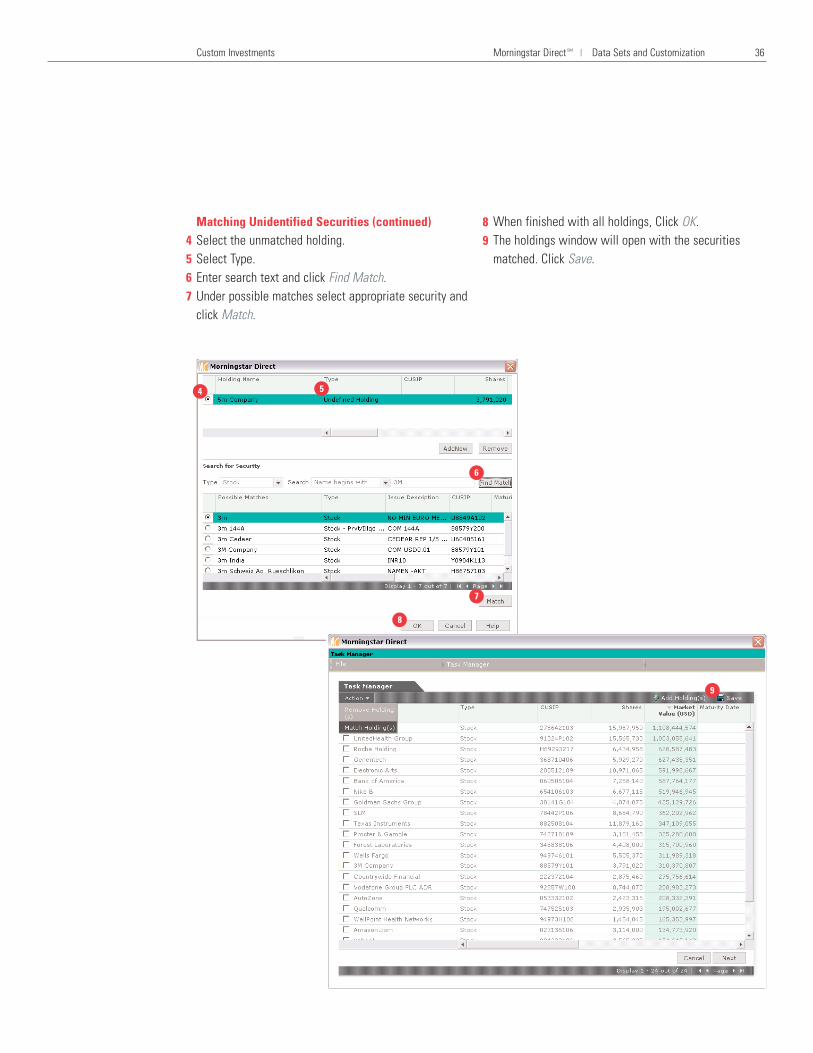
Matching Unidentified Securities (continued)Select the unmatched holding.Select Type.Enter search text and click Find Match.Under possible matches select appropriate security andclick Match.
When finished with all holdings, Click OK.The holdings window will open with the securitiesmatched. Click Save.
4567
89
4 5
6
7
8
9

Import ReturnsReturns associated with a custom investment may beadded to facilitate peer analysis and other research.
Open the Import file in the Workspace, and click on the Returns tab. Click Import.
To locate your import file, click Browse. Choose File type (your file must have return date in YYYY-MMformat and return value). Choose return format. The imported returns will be displayed in the Returns window. Click Save or Save and Close.
Custom Investments Morningstar Direct SM | Data Sets and Customization 37
Tips
Manually add a return periodwithout importing.
1
2
3
45
6
1
2
3
4
5
6