monitoring of antihypertensive therapy for reduction in left ventricular mass
TRANSCRIPT
BRIEF COMMUNICATION
Monitoring of Antihypertensive Therapy forReduction in Left Ventricular Mass
Junichiro Hashimoto, Yutaka Imai, and Michael F. O�Rourke
AJH 2007; 20:1229–1233
Background: Pressure pulse waveform features maypredict treatment-induced regression of left ventricular(LV) mass better than casual brachial blood pressure (BP).We compared predictive power for LV mass reductionbetween the putative optimal pulse waveform feature(pulse amplification) and the putative optimal brachial cuffmeasurement (self BP monitoring at home).
Methods: Forty-three patients with hypertension re-ceived standard medical treatment for 1 year. Self BPmonitoring was used to determine home morning andevening BPs. Radial pressure waveforms recorded withapplanation tonometry in the clinic were transformed toaortic waveforms, and pulse amplification (upper limbpulse pressure/central pulse pressure) was calculated.
Results: Antihypertensive therapy significantly (P � .05)reduced LV load, manifest by a decrease in both home BPsand by an increase in amplification. These changes wereaccompanied by significant reduction in echocardiographi-
cally determined LV mass index (LVMI). However, treat-Science and Medicine, Sendai, Japan; and St. Vincent’s Clinic/University
© 2007 by the American Journal of Hypertension, Ltd.Published by Elsevier Inc.
ment-induced LVMI change did not correlate with changein any component of home BPs, but closely correlatedwith change in amplification (r � �0.54, P � .001).Amplification was a strong determinant of LVMI reduc-tion, independent of age, gender, and home BP. Estimatedsubject numbers required for predicting a significantLVMI reduction were far less when the pulse waves wereused rather than home BP; for � � 0.05 and � � 0.20,numbers were 25 subjects for amplification but more than1000 for home BP.
Conclusions: Regression of LV mass is closely asso-ciated with reduction in wave reflection, and can be as-sessed more precisely and easily from radial tonometrythan use of the brachial cuff measurement, even in thehome setting. Am J Hypertens 2007;20:1229–1233© 2007 American Journal of Hypertension, Ltd.
Key Words: Pulse wave analysis, hypertrophy, wavereflection, blood pressure monitoring, antihypertensive treat-
ment.R ecent studies have shown that central aortic systolicpressure, augmentation index, and augmented pres-sure, can predict reduction in left ventricular (LV)
mass during antihypertensive treatment, and the predictivepower of these measures is greater than that of brachial bloodpressure (BP).1,2 This power difference may be explainedpartly on the basis that the LV load affected by wave reflec-tion can be better evaluated by central aortic BP waveformthan by peripheral brachial cuff BP.1–3 However, such expla-nation might be clouded because casual BP measurement inthe office does not always reflect individuals’ “true” BPchange. It has relatively poor reproducibility and the potentialinclusion of white coat and placebo effects.
Self BP monitoring at home (home BP measurement), atechnique that makes it possible to obtain multiple measure-ments under well-controlled conditions, has been increas-ingly used in assessing the response to antihypertensive
Received April 5, 2007. First decision June 2, 2007. Accepted July 21,2007.
From the Department of Planning for Drug Development and ClinicalEvaluation (JH) and Department of Clinical Pharmacology and Thera-peutics (YI), Tohoku University Graduate School of Pharmaceutical
treatment.4–6 Self BP monitoring has been shown to be morereliable than conventional casual BP measurement because itavoids observer and regression dilution biases, eliminates thewhite coat effect, and has minimal placebo effect.4,5 It is alsoreported that home BP might be better related to the regres-sion of LV mass than casual BP.7
Hence, the purpose of the present study was to comparethe predictive power for treatment-induced LV mass reduc-tion between pulse wave analysis and home BP measure-ment. We used pulse amplification ratio between the aortaand radial artery as a measure of wave reflection, because itcan be calculated independently of cuff BP value.3
MethodsConsecutive, untreated patients with hypertension seen atKojinkai Central Clinic (Sendai, Japan) were enrolled in
of New South Wales (MFO), Darlinghurst, Australia.Address correspondence and reprint requests to Dr. Junichiro Hashi-
moto, Department of Planning for Drug Development and Clinical Eval-uation, Tohoku University Graduate School of Pharmaceutical Scienceand Medicine, 6-3 Aoba, Aramaki, Aoba-ku, Sendai 980-8578, Japan;
e-mail: [email protected]0895-7061/07/$32.00doi:10.1016/j.amjhyper.2007.07.010
1230 AJH–November 2007–VOL. 20, NO. 11PULSE MONITORING FOR LV MASS REGRESSION
this study. For screening, brachial BP was measured in theoffice twice using an automated oscillometric device (BP-203i, Colin Medical, Komaki, Japan), with the patient in thesitting position. Patients were included if they had a meansystolic BP �140 mm Hg or diastolic BP �90 mm Hg. Noneof the patients had secondary hypertension, renal failure, ormajor cardiovascular complication, and none was takingvasoactive drugs. The study protocol was approved by theethical committee, and all patients gave informed consent.
This time-series clinical trial comprised 2-week observa-tion and subsequent 1-year treatment periods. The patientsdiagnosed as having hypertension were given standard med-ical treatment, according to European Society of Hyperten-sion–Cardiology guidelines.8 Specifically, treatment wasinitiated with one of the five major classes of antihyperten-sive agents, including angiotensin II receptor blockers(ARBs), angiotensin-converting enzyme inhibitors (ACEIs),calcium channel blockers (CCBs), diuretics, and �-blockers.The BP was measured every 2, 4, or 8 weeks in the clinic.The target BP was set at �140/90 mm Hg (for 38 patientswithout diabetes) or �130/80 mm Hg (for 5 patients withdiabetes). If monotherapy was insufficient for BP control,combination therapy with two or more drug classes wasgiven so as to achieve the target BP. Medication was titratedthroughout the treatment period.
All subjects were instructed to measure their BP athome twice daily throughout the study period, as describedpreviously.5,6 Briefly, home BP was measured once in themorning (within 1 h after waking, after micturition, sittingafter a 3-min rest, before drug ingestion, and before break-fast) and once in the evening (just before going to bed,sitting after a 3-min rest), using a fully automatic cuffoscillometric device (HEM 401C, 701C, 703C, or 747IC;Omron Health Care, Kyoto, Japan).9 Home systolic BP,diastolic BP, and pulse pressure were averaged in eachpatient separately for the last 7 days of the observationperiod and for the last 7 days of the treatment period. Wedefined sustained hypertension as showing both high ca-sual BP (systolic �140 mm Hg or diastolic �90 mm Hg)and high home morning BP (systolic �135 mm Hg ordiastolic �85 mm Hg) in the observation period, andwhite coat hypertension as showing high casual BP butnormal home morning BP (�135/85 mm Hg).8,9
All cardiovascular measurements in the clinic afterscreening were conducted in a room specialized for vas-cular examination. First, brachial BP was measured twiceby using an automated cuff oscillometric device (HEM-907; Omron Health Care), with the patient seated after 5min of rest. The average of the two BP readings was usedfor data analysis. Then, radial pulse waveforms were re-corded for 30 sec noninvasively with automated applana-tion tonometry (HEM-9010AI or 9000AI; Omron HealthCare).2,10 Central aortic pulse waveforms were generatedusing a validated generalized transfer function (Sphygmo-Cor version 7.1; AtCor Medical, Sydney, Australia).11
Pulse amplification was calculated as the percent ratio of
radial pulse pressure to aortic pulse pressure. This pulseamplification ratio differs from the absolute pulse ampli-fication (ie, brachial pulse pressure minus aortic pulsepressure, in mm Hg) as used in our previous study,2 in thatthe former, but not the latter, can be estimated without anycuff BP calibrations.
The M-mode echocardiography was performed to mea-sure LV dimensions and to calculate LV mass using thePenn convention method, with operators blinded to BP andamplification. The LV mass index (LVMI) was deter-mined as the LV mass divided by body surface area. TheLV hypertrophy was defined as LVMI �125 g/m2 for menand LVMI �110 g/m2 for women.8 Examinations wererepeated at baseline and at the end of the treatment period.Intraobserver and interobserver coefficients of variationfor LVMI determination were 4.8% and 8.1%, respec-tively.
Statistical analysis was performed using parametrictests, because BP, LVMI, and other parameters showed anormal distribution. Data are expressed as mean � SD.Treatment-induced changes in parameters were evaluatedby using paired t test. Pearson’s correlation coefficients (r)were calculated between the changes in LVMI and otherparameters. Statistical significance of r differences wasevaluated by repeated measures analysis of variance andsubsequent Bonferroni correction. Multivariate linear re-gression analysis was used to examine independent deter-minants of LVMI change. Potentially relevant variablesincluding age, gender, change in pulse amplification, andchange in home morning diastolic BP were forced into theregression model. Power calculation was made to estimatethe number of subjects that would be required for each LVload parameter change to predict a significant LVMIchange, with � � 0.05 (two-sided) and � � 0.20.2
ResultsForty-three subjects (29 men and 14 women, mean age of57 � 8 years) completed the study. At entry, the screeningcasual systolic BP and diastolic BP were 158 � 15 mm Hgand 97 � 10 mm Hg, respectively. The subjects includednine patients (21%) with isolated systolic hypertensionand three patients (7%) with isolated diastolic hyperten-sion. Home BP measurement showed that 41 patients (95%)had sustained hypertension and only 2 patients (5%) hadwhite coat hypertension. Mean baseline LVMI was 120 � 19g/m2, and LV hypertrophy was present in 18 subjects (42%).
All patients were treated with antihypertensive medi-cation throughout the treatment period of 1 year, withoutany discontinuation. At the end of the treatment period,most patients (37 patients, 86%) were receiving combina-tion therapy, and the mean number of prescribed drugswas 2.8 � 1.1 per patient. The antihypertensive drugs usedincluded ARBs in 27 patients (63 %), ACEIs in 6 (14%),CCBs in 16 (37%), diuretics in 36 (84%), �-blockers in 19(44%), �-blockers in 8 (19%), and central �-agonists in 8
(19%), alone or in combination. With therapy, all but five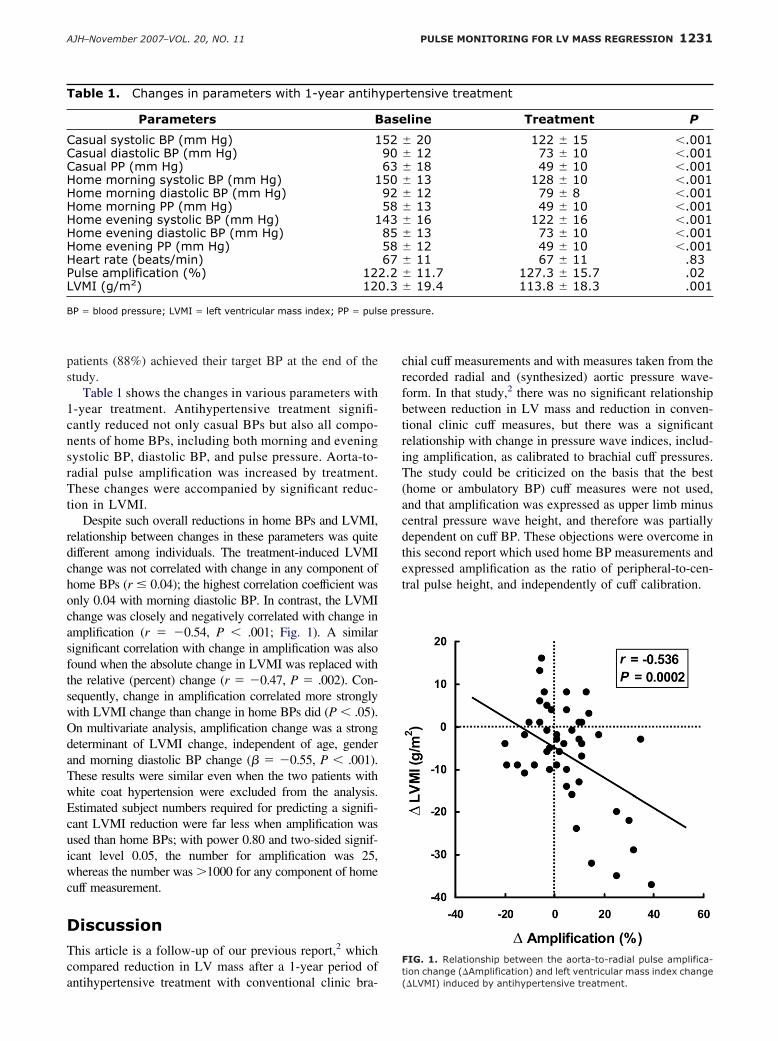
e pre
1231AJH–November 2007–VOL. 20, NO. 11 PULSE MONITORING FOR LV MASS REGRESSION
patients (88%) achieved their target BP at the end of thestudy.
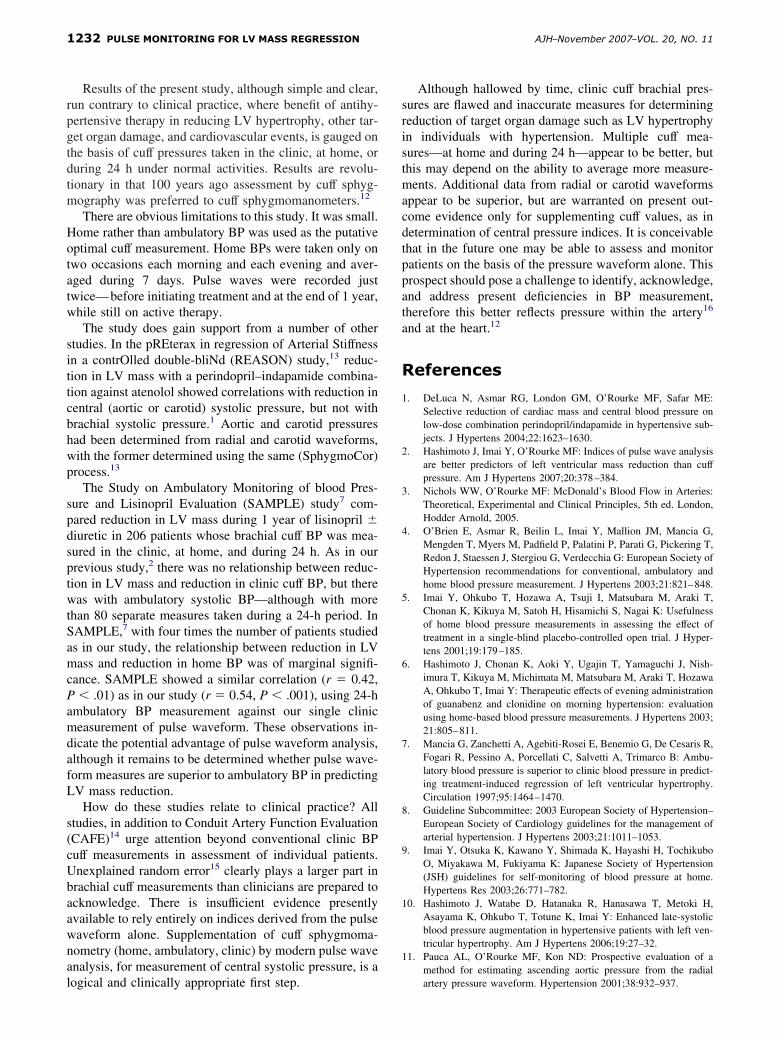
Table 1 shows the changes in various parameters with1-year treatment. Antihypertensive treatment signifi-cantly reduced not only casual BPs but also all compo-nents of home BPs, including both morning and eveningsystolic BP, diastolic BP, and pulse pressure. Aorta-to-radial pulse amplification was increased by treatment.These changes were accompanied by significant reduc-tion in LVMI.
Despite such overall reductions in home BPs and LVMI,relationship between changes in these parameters was quitedifferent among individuals. The treatment-induced LVMIchange was not correlated with change in any component ofhome BPs (r � 0.04); the highest correlation coefficient wasonly 0.04 with morning diastolic BP. In contrast, the LVMIchange was closely and negatively correlated with change inamplification (r � �0.54, P � .001; Fig. 1). A similarsignificant correlation with change in amplification was alsofound when the absolute change in LVMI was replaced withthe relative (percent) change (r � �0.47, P � .002). Con-sequently, change in amplification correlated more stronglywith LVMI change than change in home BPs did (P � .05).On multivariate analysis, amplification change was a strongdeterminant of LVMI change, independent of age, genderand morning diastolic BP change (� � �0.55, P � .001).These results were similar even when the two patients withwhite coat hypertension were excluded from the analysis.Estimated subject numbers required for predicting a signifi-cant LVMI reduction were far less when amplification wasused than home BPs; with power 0.80 and two-sided signif-icant level 0.05, the number for amplification was 25,whereas the number was �1000 for any component of homecuff measurement.
DiscussionThis article is a follow-up of our previous report,2 whichcompared reduction in LV mass after a 1-year period of
Table 1. Changes in parameters with 1-year antih
Parameters B
Casual systolic BP (mm Hg) 1Casual diastolic BP (mm Hg)Casual PP (mm Hg)Home morning systolic BP (mm Hg) 1Home morning diastolic BP (mm Hg)Home morning PP (mm Hg)Home evening systolic BP (mm Hg) 1Home evening diastolic BP (mm Hg)Home evening PP (mm Hg)Heart rate (beats/min)Pulse amplification (%) 12LVMI (g/m2) 12
BP � blood pressure; LVMI � left ventricular mass index; PP � puls
antihypertensive treatment with conventional clinic bra-
chial cuff measurements and with measures taken from therecorded radial and (synthesized) aortic pressure wave-form. In that study,2 there was no significant relationshipbetween reduction in LV mass and reduction in conven-tional clinic cuff measures, but there was a significantrelationship with change in pressure wave indices, includ-ing amplification, as calibrated to brachial cuff pressures.The study could be criticized on the basis that the best(home or ambulatory BP) cuff measures were not used,and that amplification was expressed as upper limb minuscentral pressure wave height, and therefore was partiallydependent on cuff BP. These objections were overcome inthis second report which used home BP measurements andexpressed amplification as the ratio of peripheral-to-cen-tral pulse height, and independently of cuff calibration.
tensive treatment
line Treatment P
� 20 122 � 15 �.001� 12 73 � 10 �.001� 18 49 � 10 �.001� 13 128 � 10 �.001� 12 79 � 8 �.001� 13 49 � 10 �.001� 16 122 � 16 �.001� 13 73 � 10 �.001� 12 49 � 10 �.001� 11 67 � 11 .83� 11.7 127.3 � 15.7 .02� 19.4 113.8 � 18.3 .001
ssure.
FIG. 1. Relationship between the aorta-to-radial pulse amplifica-
yper
ase
52906350925843855867
2.20.3
tion change (�Amplification) and left ventricular mass index change(�LVMI) induced by antihypertensive treatment.
1232 AJH–November 2007–VOL. 20, NO. 11PULSE MONITORING FOR LV MASS REGRESSION
Results of the present study, although simple and clear,run contrary to clinical practice, where benefit of antihy-pertensive therapy in reducing LV hypertrophy, other tar-get organ damage, and cardiovascular events, is gauged onthe basis of cuff pressures taken in the clinic, at home, orduring 24 h under normal activities. Results are revolu-tionary in that 100 years ago assessment by cuff sphyg-mography was preferred to cuff sphygmomanometers.12
There are obvious limitations to this study. It was small.Home rather than ambulatory BP was used as the putativeoptimal cuff measurement. Home BPs were taken only ontwo occasions each morning and each evening and aver-aged during 7 days. Pulse waves were recorded justtwice—before initiating treatment and at the end of 1 year,while still on active therapy.
The study does gain support from a number of otherstudies. In the pREterax in regression of Arterial Stiffnessin a contrOlled double-bliNd (REASON) study,13 reduc-tion in LV mass with a perindopril–indapamide combina-tion against atenolol showed correlations with reduction incentral (aortic or carotid) systolic pressure, but not withbrachial systolic pressure.1 Aortic and carotid pressureshad been determined from radial and carotid waveforms,with the former determined using the same (SphygmoCor)process.13
The Study on Ambulatory Monitoring of blood Pres-sure and Lisinopril Evaluation (SAMPLE) study7 com-pared reduction in LV mass during 1 year of lisinopril �diuretic in 206 patients whose brachial cuff BP was mea-sured in the clinic, at home, and during 24 h. As in ourprevious study,2 there was no relationship between reduc-tion in LV mass and reduction in clinic cuff BP, but therewas with ambulatory systolic BP—although with morethan 80 separate measures taken during a 24-h period. InSAMPLE,7 with four times the number of patients studiedas in our study, the relationship between reduction in LVmass and reduction in home BP was of marginal signifi-cance. SAMPLE showed a similar correlation (r � 0.42,P � .01) as in our study (r � 0.54, P � .001), using 24-hambulatory BP measurement against our single clinicmeasurement of pulse waveform. These observations in-dicate the potential advantage of pulse waveform analysis,although it remains to be determined whether pulse wave-form measures are superior to ambulatory BP in predictingLV mass reduction.
How do these studies relate to clinical practice? Allstudies, in addition to Conduit Artery Function Evaluation(CAFE)14 urge attention beyond conventional clinic BPcuff measurements in assessment of individual patients.Unexplained random error15 clearly plays a larger part inbrachial cuff measurements than clinicians are prepared toacknowledge. There is insufficient evidence presentlyavailable to rely entirely on indices derived from the pulsewaveform alone. Supplementation of cuff sphygmoma-nometry (home, ambulatory, clinic) by modern pulse waveanalysis, for measurement of central systolic pressure, is a
logical and clinically appropriate first step.Although hallowed by time, clinic cuff brachial pres-sures are flawed and inaccurate measures for determiningreduction of target organ damage such as LV hypertrophyin individuals with hypertension. Multiple cuff mea-sures—at home and during 24 h—appear to be better, butthis may depend on the ability to average more measure-ments. Additional data from radial or carotid waveformsappear to be superior, but are warranted on present out-come evidence only for supplementing cuff values, as indetermination of central pressure indices. It is conceivablethat in the future one may be able to assess and monitorpatients on the basis of the pressure waveform alone. Thisprospect should pose a challenge to identify, acknowledge,and address present deficiencies in BP measurement,therefore this better reflects pressure within the artery16
and at the heart.12
References
1. DeLuca N, Asmar RG, London GM, O’Rourke MF, Safar ME:Selective reduction of cardiac mass and central blood pressure onlow-dose combination perindopril/indapamide in hypertensive sub-jects. J Hypertens 2004;22:1623–1630.
2. Hashimoto J, Imai Y, O’Rourke MF: Indices of pulse wave analysisare better predictors of left ventricular mass reduction than cuffpressure. Am J Hypertens 2007;20:378–384.
3. Nichols WW, O’Rourke MF: McDonald’s Blood Flow in Arteries:Theoretical, Experimental and Clinical Principles, 5th ed. London,Hodder Arnold, 2005.
4. O’Brien E, Asmar R, Beilin L, Imai Y, Mallion JM, Mancia G,Mengden T, Myers M, Padfield P, Palatini P, Parati G, Pickering T,Redon J, Staessen J, Stergiou G, Verdecchia G: European Society ofHypertension recommendations for conventional, ambulatory andhome blood pressure measurement. J Hypertens 2003;21:821–848.
5. Imai Y, Ohkubo T, Hozawa A, Tsuji I, Matsubara M, Araki T,Chonan K, Kikuya M, Satoh H, Hisamichi S, Nagai K: Usefulnessof home blood pressure measurements in assessing the effect oftreatment in a single-blind placebo-controlled open trial. J Hyper-tens 2001;19:179–185.
6. Hashimoto J, Chonan K, Aoki Y, Ugajin T, Yamaguchi J, Nish-imura T, Kikuya M, Michimata M, Matsubara M, Araki T, HozawaA, Ohkubo T, Imai Y: Therapeutic effects of evening administrationof guanabenz and clonidine on morning hypertension: evaluationusing home-based blood pressure measurements. J Hypertens 2003;21:805–811.
7. Mancia G, Zanchetti A, Agebiti-Rosei E, Benemio G, De Cesaris R,Fogari R, Pessino A, Porcellati C, Salvetti A, Trimarco B: Ambu-latory blood pressure is superior to clinic blood pressure in predict-ing treatment-induced regression of left ventricular hypertrophy.Circulation 1997;95:1464–1470.
8. Guideline Subcommittee: 2003 European Society of Hypertension–European Society of Cardiology guidelines for the management ofarterial hypertension. J Hypertens 2003;21:1011–1053.
9. Imai Y, Otsuka K, Kawano Y, Shimada K, Hayashi H, TochikuboO, Miyakawa M, Fukiyama K: Japanese Society of Hypertension(JSH) guidelines for self-monitoring of blood pressure at home.Hypertens Res 2003;26:771–782.
10. Hashimoto J, Watabe D, Hatanaka R, Hanasawa T, Metoki H,Asayama K, Ohkubo T, Totune K, Imai Y: Enhanced late-systolicblood pressure augmentation in hypertensive patients with left ven-tricular hypertrophy. Am J Hypertens 2006;19:27–32.
11. Pauca AL, O’Rourke MF, Kon ND: Prospective evaluation of amethod for estimating ascending aortic pressure from the radial
artery pressure waveform. Hypertension 2001;38:932–937.
1233AJH–November 2007–VOL. 20, NO. 11 PULSE MONITORING FOR LV MASS REGRESSION
12. Mackenzie J: The Study of the Pulse: Arterial, Venous, and Hepatic,and the Movements of the Heart. Edinburgh, Young J. Pentland, 1902.
13. Asmar RG, London GM, O’Rourke MF, Safar ME: Improvement inblood pressure, arterial stiffness and wave reflections with a very-low-dose perindopril/indapamide combination in hypertensive pa-tient: a comparison with atenolol. Hypertension 2001;38:922–926.
14. William B, Lacy PS, Thom SM, Cruickshank K, Stanton A, Collier
D, Hughes AD, Thurston H, O’Rourke M: Differential impact ofblood pressure-lowering drugs on central aortic pressure and clinicaloutcomes: principal results of the Conduit Artery FunctionEvaluation (CAFE) study. Circulation 2006;113:1213–1225.
15. Lane D, Beevers M, Barnes N, Bourne J, John A, Malins S, BeeversDG: Inter-arm differences in blood pressure: when are they clini-cally significant? J Hypertens 2002;20:1089–1095.
16. Messerli F, Ventura HO, Amodeo C: Osler’s maneuver and pseudohy-
pertension. N Engl J Med 1985;312:1548–1551.