monitoring near-surface soil water storage in turfgrass using time domain reflectometry and weighing...
TRANSCRIPT

Monitoring Near-Surface Soil Water Storage in Turfgrass using Time DomainReflectometry and Weighing LysimetryM. H. Young,* P. J. Wierenga, and C. F. Mancino
ABSTRACTMonitoring near-surface soil water content with time domain re-
flectometry (TDK) could improve our understanding of water move-ment in a daily irrigated crop. But, TDK field validation is neededusing weighing lysimeters to assess actual changes in soil water storage.In this study, we test the hypothesis that vertically installed TDRprobes can be used to measure evapotranspiration (ET) in a full-cover turfgrass environment. This was done by directly comparingchanges in soil water storage measured with TDR against changes inmass measured with weighing lysimeters. The TDR probes (200, 400,600, and 800 mm long) were installed vertically in two weighing lysime-ters. The TDR water content and lysimeter mass determinations weremade every 30 min for a 28-d period during daily irrigation intervals,and during a 6-d irrigation interval. Average water contents increasedwith increasing probe length; e.g., 600- and 800-mm probes yieldedaverage water contents of 18.1 and 18.5%, vs. 14.8% for the 200-mmprobe. These differences reflect the lack of transpiration:!! uptakefrom deeper soil layers. AU TDR probes underestimated water addedand lost compared with the lysimeter during daily irrigation, withshorter probes exhibiting larger differences than longer probes. How-ever, when the irrigation interval was increased to 6 d, the longerTDR probes were more suited to measuring water loss; for example,the 200-, 400-, 600-, and 800-mm probes measured 40, 77, 78, and96% of the water loss recorded by the lysimeter, which only recordsET. This shows that increasing amounts of water were taken up fromdeeper layers as the soil dried.
NUMEROUS STUDIES have shown TDR to be a versatiletool for determining volumetric water content of
soil. Following the critical development of Topp et al.(1980), a period of intensive research has led to manyimprovements in the use of TDR for soil water contentmeasurements. Specifically, data automation programsand coaxial multiplexers allow the user to measure andrecord soil water content at many sites simultaneouslywith the same cable tester. Time domain reflectometryis now being used to monitor water content in manyagricultural settings.
Richardson et al. (1992) used 300-mm-long TDRprobes installed vertically into 600-mm-long soil col-umns to measure consumptive water use by tall fescue(Festuca amndinacea Schreb.) in a greenhouse environ-ment. The TDR-measured water contents were statisti-cally similar to gravimetrically determined water con-tents, but ponding of water at the base of the columncaused some errors. Herkelrath et al. (1991) used verti-cally installed 500-mm-long TDR probes to monitor thewater budget at a temperate eastern site under a closedforest canopy. They found excellent correlation in thetiming of rainfall events using measurements from a
M.H. Young and P. J. Wierenga, Dep. of Soil, Water and Environmen-tal Science, Univ. of Arizona, Tucson, AZ 85721; and C.F. Mancino,Dep. of Agronomy, The Pennsylvania State Univ., University Park,PA 16802. Received 25 June 1996. *Corresponding author ([email protected]).
Published in Soil Sci. Soc. Am. J. 61:1138-1146 (1997).
rain gauge and TDR. However, the TDR overpredictedrainfall amounts, which could have been caused by sur-face-water run-on or real differences in precipitationamounts between the test plot and the rain gauge, whichwere 100 m apart. Rudolph et al. (1991) and Celia etal. (1991) used vertically installed TDR probes, rangingfrom 250 to 2000 mm long, in a glacial outwash depositon Cape Cod, Massachusetts. Water was applied usinga sprinkler system and then tracked using TDR andtensiometers. Because they were unable to account forwater lost to ET or gained from precipitation, the watermass balance could not be completed. Baker and Spaans(1994) used microlysimeters (200 mm long and 100 mmin diameter) and vertically installed TDR probes withthe end of the waveguide flush with the soil surface (i.e.,handle positioned below the waveguides). The microly-simeters were left bare at the surface; water was appliedfrom natural precipitation. Evaporation measured usingTDR and determined from micrometeorological mea-surements (i.e., Bowen ratio and rain gauge) were com-pared. When water accumulation at the bottom of thelysimeter was accounted for, comparisons between TDRand micrometeorological readings were within 8.5%.
Topp and Davis (1985) used five vertically installedprobes, of various lengths, to measure the wetting frontdepth, with five horizontally installed probes placed atthe termination depth of each vertical probe. The verti-cal probes were useful in tracking the wetting frontmovement, but soil water contents were more accuratelydetermined using the horizontal probes.
Weighing lysimeters have become valuable tools foragronomic research, because they allow direct measure-ments of changes in mass that can be attributed directlyto plant-root uptake or soil evaporation, or both. Severalweighing lysimeter systems are in use today for studyingwater use (Pruitt and Angus, 1960; van Bavel and Mey-ers, 1962; Dugas et al, 1985; Marek et al., 1988) andsoil water balance (Kirkham et al., 1984; Young et al.,1996). However, to our knowledge, weighing lysimetershave not been used to validate the use of verticallyinstalled TDR probes for measuring ET of daily irri-gated plants.
In this study, we test the hypothesis that verticallyinstalled TDR probes can be used to measure ET ina full-cover turfgrass environment subjected to dailyirrigation. This will be done by comparing changes insoil water storage measured with TDR to changes inwater mass measured with weighing lysimeters.
MATERIALS AND METHODSExperimental Setup
This research took place at the Large Weighing LysimeterFacility at the University of Arizona Karsten Turfgrass Re-
Abbreviations: TDR, time domain reflectometry; ET, evapotranspira-tion; DOY, day of year.
1138

YOUNG ET AL.: TDR AND WEIGHING LYSIMETRY TO MONITOR SOIL WATER STORAGE IN TURFGRASS 1139
search Facility (hereafter referred to as the Karsten Labora-tory), in Tucson, AZ. Two lysimeters were constructed be-tween Fall 1992 and Summer 1993 that were designed toinvestigate both plant-root uptake in a turfgrass setting andwater and solute recharge into deeper soil profiles. The lysime-ters are 4.0 m deep and 2.5 m in diameter and were filled withVinton fine sand (sandy, mixed, thermic Typic Torrifluvent).The Vinton soil is 90% sand (35% fine sand, 35% mediumsand), 7% silt, and 3% clay. Saturated hydraulic conductivitywas determined to be 150 cm d-1 using the constant headmethod of Klute and Dirksen (1986). Unsaturated hydraulicparameters were obtained using the method of Hudson et al.(1996). Final bulk densities were calculated to be 1.503 and1.490 Mg m~3 for the two lysimeters.
The lysimeters rest on scales (Model FS-8, Cardinal Scale,Webb City, MO) equipped with electronic loadcells of 45-kgcapacity (Model Z-100, Cardinal Scale). The scale system hasa maximum load of 45 Mg with a precision of ±200 g. Loadcellsare connected to a data logger (Model CR-7, Campbell Scien-tific, Inc., Logan, UT). The weighing lysimeter facility is de-scribed in detail in Young et al. (1996).
Lysimeters were planted with 'Tifway' bermudagrass (Cy-nodon dactylon X tramvaalensis) in June 1994. Both lysime-ters were irrigated with potable water until April 1995, afterwhich time one of the lysimeters (hereafter referred to as theeffluent lysimeter) was switched to tertiary effluent from thecity of Tucson's wastewater treatment plant. The chemicalcomposition of the effluent water, monitored at the KarstenLaboratory, did not change appreciably during the study pe-riod. Chemical analysis showed the water had a total dissolvedsolids concentration of just under 700 mg kg"1, NO3-N concen-
tration of 6 mg kg"1, and an electrical conductivity equal to0.14 S m"1. The second lysimeter (hereafter referred to as thepotable lysimeter) continued to receive potable water.
Four vertical and three horizontal TDR probes (Dynamax,Inc., Houston, TX) consisting of three 3.0-mm o.d. waveguides,spaced 30 mm apart, were installed in the top 800 mm ofthe effluent lysimeter (Fig. 1). The potable lysimeter was notequipped with horizontal probes. The vertical probes were200, 400, 600, and 800 mm long, while all horizontal probeswere 200 mm long. The probes were connected through RG58/U, SOO coaxial cable, to a multiplexer (JFW Industries,Indianapolis, IN), similar to that described by Baker and All-maras (1990), and a TDR cable tester (Model 1502C, Tek-tronix Corp., Beaverton, OR). Sampling was controlled bya computer program (LabWindows, Version 2.3.1, NationalInstruments, Austin, TX) that collected the TDR traces, ana-lyzed them for electrical length and impedance, and calculatedthe volumetric water contents and bulk electrical conductivi-ties of the soil (Baker and Allmaras, 1990). Probe calibrationwas completed as described by Young et al. (1997). Data fromthree calibration experiments were fitted simultaneously to asingle calibration equation, of the form of Ledieu et al. (1986),using TableCurve (v.1.1.2, Jandel Scientific Software, Inc., SanRafael, CA).
Thermocouples, constructed of 24-gauge copper-constan-tan wire (Model TT-T-24, Omega Engineering, Inc., Stamford,CT) inserted into a 3.2-mm o.d. stainless steel tube, wereinstalled in the effluent lysimeter to measure soil temperature.Individual thermocouples were installed at depths of O, 10,50, 100, 250, 500, and 1000 mm.
An irrigation system (courtesy Rainbird Golf Division,
Soil SurfaceI200mm
400mm600mm
800mm
Load Cell x Counter WeightsFig. 1. Cross section of lysimeter facility, showing surface monitoring system (TDR = time domain reflectometry).

1140 SOIL SCI. SOC. AM. J., VOL. 61, JULY-AUGUST 1997
Glendora, CA) for the lysimeter facility was installed to ac-commodate both effluent and potable water supplies. Theamount of daily irrigation was 90% of reference ET as deter-mined by a weather tower 15 m south of the lysimeters, usinga modified Penman Equation (Rainbird Golf Division). Thisresulted in some drainage through the profile. Irrigation oc-curred at approximately 0300 hours for each day when mea-sured precipitation was less than reference ET. Total precipita-tion was accounted for in the water balance. The lysimetersand the surrounding area were irrigated daily, except for oneperiod in August 1995, when irrigation was interrupted for 6 d.
Data AnalysisTwo time periods were chosen for intensive analyses. Time
Period 1, between 16 June and 14 July 1995 (day of year[DOY] 167-195), permitted soil water content measurementsbelow daily irrigated turf. Time Period 2, between 21 and 29August 1995 (DOY 241-247), permitted measurements of soilwater content below unirrigated turf. The time interval fordata collection was 30 min during both periods.
Temperature effects on water content measurements werecorrected for using the following equation:
^corrected = 0TDR + 0.00175 0TDR(Tcaiib — TK) [1]
where 6corrected is the corrected volumetric water content, 6TDRis the TDK-measured volumetric water content, rcaiib is thetemperature (°C) measured during laboratory calibration, andTK is the depth-averaged temperature (°C) measured with fieldthermocouples (Pepin et al., 1995). Average temperatureswere calculated for each length TDK probe by finding thedepth at the mid-point between two thermocouple sensorsand then weighting the temperature according to the relativethickness of the soil layer on either side of the thermocouple.For example, the average temperature for the top 200 mm ofsoil, using thermocouples at 0-, 10-, 50-, 100-, and 250-mmdepth, was calculated using
[(srn) + (25r10) + (45r50) (25r250)]200
[2]where Ttc is defined above, and the numerical designationsfor T on the right side indicate the installation depth of thethermocouple. Average temperatures that include deeper soilare computed similarly. Each TDR measurement was usedfor calculating the corrected water content and the soil waterstorage for each probe length (i.e., soil water storage = probelength X 6V).
Water added to the lysimeter by either irrigation or precipi-tation or water lost from the lysimeter by ET (or downwarddrainage in the case of the TDR probes) was determined byfinding the difference in soil water storage for successive timeintervals. Thus, water added was found from the differencein water content multiplied by probe length from just beforean irrigation event to just after an irrigation event (typicallyat 0100 and 0400 hours, respectively). Water lost was foundfrom the difference in water content multiplied by probelength from just after an irrigation event to just before thenext irrigation event (typically at 0400 and 0100 hours, respec-tively). Water content data were smoothed (Baker andSpaans, 1994).
Given the low concentration of electrolytes in the effluentwater, we neglected any possible effects of bulk electricalconductivity on the apparent dielectric constant used for watercontent determinations.
The change in soil water storage measured with the lysime-ter and TDR were compared with each other by (i) regressinglysimeter-measured changes in soil water storage against thosemeasured using TDR, and (ii) testing whether the populationstatistics of the two measurement techniques were the same.In the first comparison, we performed linear regression onobserved (lysimeter) vs. predicted (TDR) changes in soil waterstorage. If the differences between the two methods resultedin random scatter, then deviation from the 1:1 line would beinsignificant. In the second comparison, we used the Mann-Whitney Rank Sum Test (SigmaStat, v. 1.0, Jandel ScientificSoftware, Inc.) to evaluate whether soil water storage changesobtained by the two methods were sampled from differentpopulations. The rank sum test does not require that the datasets be drawn from normally distributed populations. Thenull hypothesis is that the samples were taken from the samepopulations, thereby indicating that soil water storage changesmeasured by the TDR can be used as a reliable estimate oftrue changes. The alternative hypothesis, that samples weretaken from different populations, indicates that the TDR didnot provide a reliable estimate of true soil water storagechanges. The above-described tests would indicate how wellthe TDR performed under these field settings.
RESULTS AND DISCUSSIONTime Domain Reflectometry Used for Measuring
Diurnal Changes in Soil Water ContentFigures 2 and 3 show the diurnal fluctuations in water
content as measured by TDR, and as measured withthe lysimeter, for the effluent and potable lysimeters,respectively. The bar graph reflects water added to thelysimeter from irrigation (precipitation did not occurduring this time period). The data are unsmoothed buthave been adjusted for temperature. Water contents inthe effluent and potable lysimeters, measured by TDR,show a pattern of water gain with subsequent water loss,with no clear trend in soil water storage during the28-d period (Fig. 2 and 3, respectively). It is apparentthat the 200-mm probe recorded lower water contents(i.e., the deeper soil profiles were wetter). Daily reduc-tions in near-surface water content were caused mostlyby evapotranspiration and to a lesser extent by drainage.The amplitudes of the daily fluctuations in water contentrecorded with the longer probes are less than recordedfor the shorter probes but still significant. However,daily fluctuations in water content at 500 mm are mini-mal, as is evident from water contents measured withthe horizontal probes at 500 mm (Fig. 4). Therefore, thedepth-averaged water content values of vertical TDRprobes (Fig. 2 and 3) show significant variations becauseof the large variations near the surface.
Daily irrigation depths are represented on the top ofeach graph in Fig. 2 and 3. During Time Period 1, theeffluent lysimeter received =11% more water than thepotable lysimeter, due to differences in operation of thepotable water system vs. the effluent system. Lowerirrigation amounts applied to the potable lysimeter ledto smaller amplitudes in daily TDR fluctuations.
The response of the TDR system to individual irriga-tion events appears quite good, especially for the 200-mm probe. Note the TDR response to the reduced irri-

S op'
W O i sr a. O 1
Xn
i
Vol
umet
ric W
ater
Con
tent
O O
a. I K
Vol
umet
ric W
ater
Con
tent
a o
o ^o
a ^ a o
o O a JO > a w S 3 z O I W O i 73 CS O tn H S

1142 SOIL SCI. SOC. AM. J., VOL. 61, JULY-AUGUST 1997
14.0
168 169 170 171 172 173 174DOY-1995
Fig. 4. Water content measurements made with horizontally installedtime domain reflectometry probes located at 500-mm depth in theeffluent lysimeter. SE, NE, W indicate the southeast, northeast,and west locations in the lysimeter. Average is the average of thethree water contents at each time (DOY = day of year).
gation on DOY 178 on the effluent lysimeter (Fig. 2).Even small differences in irrigation depths were re-corded, as is clear from the drop in water contents forboth lysimeters after lower irrigation depths on DOY170 and 171.
Use of Time Domain Reflectometryfor Measuring Water Addition
The TDK undermeasured the water applied to thelysimeters for all probe lengths during Time Period 1(Fig. 5). This can be seen by the significant differencesin the total water added measured with each TDK probevs. the lysimeter (Table 1). Though the rank sum testsindicate that the TDK system did not perform well, thescatter about the regression line lessened (higher r2) asthe probe length increased. The reasons for the biastoward undermeasurement are not clear, but examina-tion of the probes after the experiment showed that abiomass (verdure and thatch) layer 25 mm thick wasfound above the top of the handle, and the top of theTDK handle itself was 22 mm above the soil, leaving a47-mm-thick biomass layer above the waveguides. Wa-ter absorption in the biomass layer has been shown tooccur up to =50% of the thatch depth (Hurto et al.,1980; Zimmerman, 1973). Therefore, it is reasonable toassume that a portion of water from each irrigationevent was absorbed in the biomass, which was recordedby the lysimeter, but which remained above the effectivesphere of influence of the TDR probe.
Use of Time Domain Reflectometryfor Measuring Water Loss
Results from the effluent lysimeter showed agree-ment between water losses measured with the 400- and800-mm probes and the lysimeter. The 600-mm probenearly passed the rank sum test (P = 0.0237), and the200-mm probe failed (Fig. 6, Table 2). The potable ly-simeter showed that water lost as measured by the TDRprobes was consistently less than water lost as measuredby the lysimeter, except for the 800-mm probe, whichshowed better agreement with the lysimeter. The TDRsystem of the potable lysimeter closely predicted waterloss during several days in which lower than average
A200-mm
effluent lysimeter12,——————
"O 2 4 6 8 10 12Lysimeter - mm
Q
B400-mm
2 4 6 8 10 12Lysimeter - mm
O 2 4 6 8 10 12Lysimeter - mm
D800-mm
2 4 6 8 10 12Lysimeter - mm
« 6
P 4
2
O
E200mm
potable lysimeter121——————10
O 2 4 6 8 10 12Lysimeter - mm
10
E
gt- 4
600mm
400mm
2 4 6 8 10 12Lysimeter - mm
H800mm
"O 2 4 6 8 10 12 O 2 4 6 8 10 12Lysimeter - mm Lysimeter - mm
Fig. 5. Water added as measured by time domain reflectometry(TDR) using different length probes vs. water added as measuredby lysimeter. Numbers under graph label are probe lengths. Solidline is best-fitted regression line, and dashed line is 1:1 line.
ET was recorded from the scale system and for the800-mm probe (Fig. 6H). The 200-mm probes recordedaverages of only 2.7 and 3.1 mm for the effluent andpotable lysimeters, respectively, about half the total ETrecorded by the lysimeter scales.
This trend of increasing water loss measured by thelonger probes (Fig. 6B, 6C, 6D, and 6H) can be ex-plained by considering that some plant-root uptake alsooccurs from deeper roots in soils that are monitoredwith longer probes. Though plant-root uptake in dailyirrigated turfgrass will occur mostly from near-surfaceroots, deeper roots will also contribute to water use inproportion to the root volume distribution. This findingis supported by other research conducted by the author(Mancino, 1995, unpublished data, Univ. of Arizona,Tucson) who found, for the hybrid variety of bermu-dagrass grown in the lysimeter, that 62% of the totalroot volume was in the upper 305 mm, 27% from 305
YOUNG ET AL.: TDK AND WEIGHING LYSIMETRY TO MONITOR SOIL WATER STORAGE IN TURFGRASS 1143
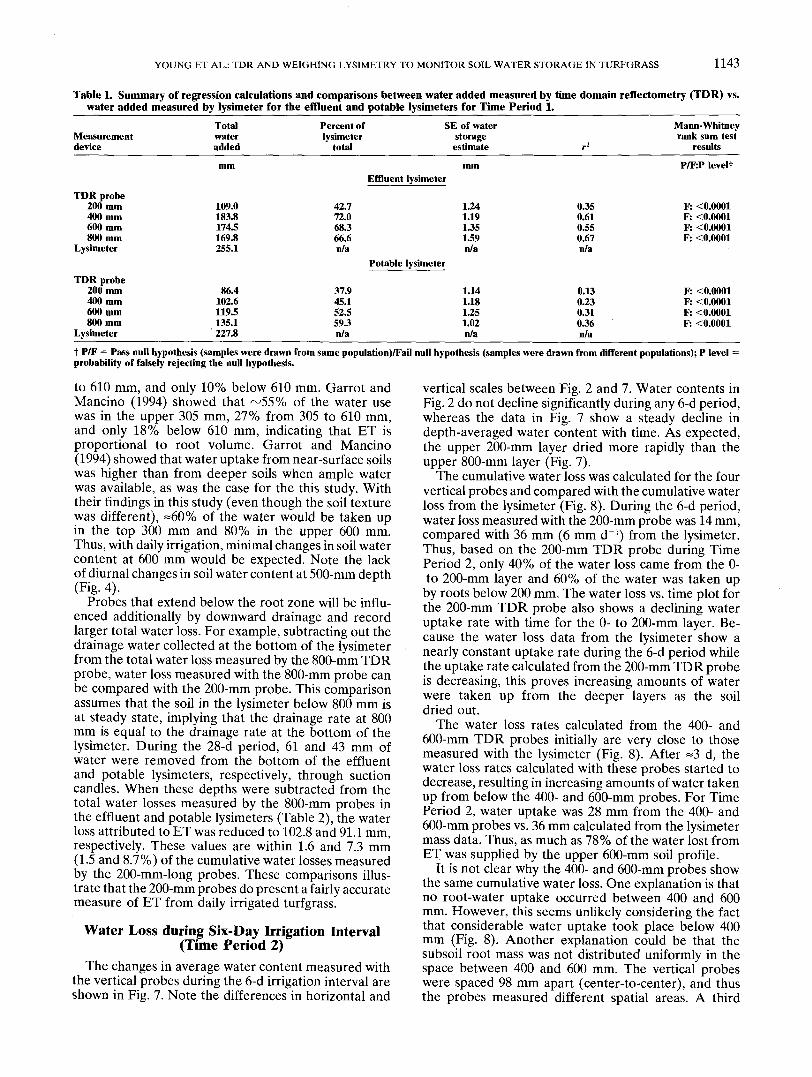
Table 1. Summary of regression calculations and comparisons between water added measured by time domain reflectometry (TDR) vs.water added measured by lysimeter for the effluent and potable lysimeters for Time Period 1. __ ___
Measurementdevice
Totalwateradded
Percent oflysimeter
total
SE of waterstorageestimate
Mann-Whitneyrank sum test
results
mm mm P/F-.P leveltEffluent lysimeter
TDR probe200mm400mm600mm800mm
Lysimeter
TDR probe200mm400mm600mm800mm
Lysimeter
109.0183.8174.5169.8255.1
86.4102.6119.5135.1
' 227.8
42.772.068.366.6n/a
37.945.152.559.3n/a
1.241.191.351.59n/a
Potable lysimeter
1.141.181.251.02n/a
0.350.610.550.67n/a
0.130.230.310.36n/a
F: <0.0001F: <0.0001F: <0.0001F: <0.0001
F: <0.0001F: <0.0001F: <0.0001F: <0.0001
t P/F = Pass null hypothesis (samples were drawn from same popnlation)/Fail null hypothesis (samples were drawn from different populations); P levelprobability of falsely rejecting the null hypothesis.
to 610 mm, and only 10% below 610 mm. Garrot andMancino (1994) showed that ^55% of the water usewas in the upper 305 mm, 27% from 305 to 610 mm,and only 18% below 610 mm, indicating that ET isproportional to root volume. Garrot and Mancino(1994) showed that water uptake from near-surface soilswas higher than from deeper soils when ample waterwas available, as was the case for the this study. Withtheir findings in this study (even though the soil texturewas different), =60% of the water would be taken upin the top 300 mm and 80% in the upper 600 mm.Thus, with daily irrigation, minimal changes in soil watercontent at 600 mm would be expected. Note the lackof diurnal changes in soil water content at 500-mm depth(Fig. 4).
Probes that extend below the root zone will be influ-enced additionally by downward drainage and recordlarger total water loss. For example, subtracting out thedrainage water collected at the bottom of the lysimeterfrom the total water loss measured by the 800-mm TDRprobe, water loss measured with the 800-mm probe canbe compared with the 200-mm probe. This comparisonassumes that the soil in the lysimeter below 800 mm isat steady state, implying that the drainage rate at 800mm is equal to the drainage rate at the bottom of thelysimeter. During the 28-d period, 61 and 43 mm ofwater were removed from the bottom of the effluentand potable lysimeters, respectively, through suctioncandles. When these depths were subtracted from thetotal water losses measured by the 800-mm probes inthe effluent and potable lysimeters (Table 2), the waterloss attributed to ET was reduced to 102.8 and 91.1 mm,respectively. These values are within 1.6 and 7.3 mm(1.5 and 8.7%) of the cumulative water losses measuredby the 200-mm-long probes. These comparisons illus-trate that the 200-mm probes do present a fairly accuratemeasure of ET from daily irrigated turfgrass.
Water Loss during Six-Day Irrigation Interval(Time Period 2)
The changes in average water content measured withthe vertical probes during the 6-d irrigation interval areshown in Fig. 7. Note the differences in horizontal and
vertical scales between Fig. 2 and 7. Water contents inFig. 2 do not decline significantly during any 6-d period,whereas the data in Fig. 7 show a steady decline indepth-averaged water content with time. As expected,the upper 200-mm layer dried more rapidly than theupper 800-mm layer (Fig. 7).
The cumulative water loss was calculated for the fourvertical probes and compared with the cumulative waterloss from the lysimeter (Fig. 8). During the 6-d period,water loss measured with the 200-mm probe was 14 mm,compared with 36 mm (6 mm d"1) from the lysimeter.Thus, based on the 200-mm TDR probe during TimePeriod 2, only 40% of the water loss came from the 0-to 200-mm layer and 60% of the water was taken up
by roots below 200 mm. The water loss vs. time plot forthe 200-mm TDR probe also shows a declining wateruptake rate with time for the O- to 200-mm layer. Be-cause the water loss data from the lysimeter show anearly constant uptake rate during the 6-d period whilethe uptake rate calculated from the 200-mm TDR probeis decreasing, this proves increasing amounts of waterwere taken up from the deeper layers as the soildried out.
The water loss rates calculated from the 400- and600-mm TDR probes initially are very close to thosemeasured with the lysimeter (Fig. 8). After =3 d, thewater loss rates calculated with these probes started todecrease, resulting in increasing amounts of water takenup from below the 400- and 600-mm probes. For TimePeriod 2, water uptake was 28 mm from the 400- and600-mm probes vs. 36 mm calculated from the lysimetermass data. Thus, as much as 78% of the water lost fromET was supplied by the upper 600-mm soil profile.
It is not clear why the 400- and 600-mm probes showthe same cumulative water loss. One explanation is thatno root-water uptake occurred between 400 and 600mm. However, this seems unlikely considering the factthat considerable water uptake took place below 400mm (Fig. 8). Another explanation could be that thesubsoil root mass was not distributed uniformly in thespace between 400 and 600 mm. The vertical probeswere spaced 98 mm apart (center-to-center), and thusthe probes measured different spatial areas. A third

1144 SOIL SCI. SOC. AM. J., VOL. 61, JULY-AUGUST 1997
effluent lysimeter12
2 4Lysimeter - mm
10 12
potable lysimeter12
O ' 2 4 6 8 10 12-Lysimeter - mm
O 2 4 6 8 10 12Lysimeter - mm
"O 2 4 6 8 10 12 O 2 4 6 8 10 12Lysimeter - mm Lysimeter - mm
Fig. 6. Water lost as measured by time domain reflectometry (TDK)using different length probes vs. water lost as measured by lysime-ter. Numbers under graph label are probe lengths. Solid line isbest-fitted regression line, and dashed line is 1:1 line.
explanation could be that a zone existed, somewherebetween 200 and 400 mm at the beginning of the 6-dexperiment, within which water movement was insignifi-cant. Within the zone monitored by the 400-mm probe(i.e., 0-400 mm), most of the water loss was caused byET, though some could have been caused by drainageduring the first several days without irrigation (say, forexample, 25 mm ET + 3 mm drainage = 28 mm waterloss). As the upper soil layers dried, this zone of zerowater movement migrated downward, to a level near600 mm, where no drainage occurred (then, 28 mmET + O mm drainage = 28 mm water loss). Becauseroots were absent at depths between 600 and 800 mm,drainage should occur deeper than 800 mm and be re-corded by that probe (so, 28 mm ET + 7 mm drainage =35 mm water loss). Therefore, the water loss recordedby the longer probes, attributable only to ET, is indepen-dent of probe length because the roots are shorter than
the waveguides. Total water loss will be different, how-ever, because drainage is recorded by the longer probes.We note that the drainage rate using this example isconsistent with rates of water removed from the bottomof the tank (=1 mm d"1). The above data show thatvertical TDR probes of different length can be usefulin determining changes in root water uptake with timeand depth.
Variability in MeasurementsPossible sources of variability considered here for the
TDR measurements include calibration error, measure-ment bias (systematic error), simple random error, andanalytical error. Calibration error can lead to significantuncertainty if the user is interested in true water contentand not in changes of water content, because of uncer-tainties in the regression constant; thus, using the samecalibration curve for measuring changes in water con-tent would cause minimal error. The change in watercontents were emphasized in this research, so that theregression constant could be factored out of the calcula-tion, reducing this source of error. The standard errorof water content estimates using the Vinton fine sandcalibration curve was 0.008 m3 m~3 (n = 735, r2 = 0.989).
Measurement bias is a measure of the departure ofthe statistical true value from the scientific true value(Greacen, 1981). Applying this idea to neutron modera-tion, Greacen (1981) noted that the measurement biascan be reduced if the same soil and conditions are usedfor calibration as the population soil. For this study,TDR probes calibrated to Vinton soil were inserted intosoil columns packed to the same bulk density as foundin the lysimeters. Thus, we believe that our measure-ment bias has been reduced to the extent possible.
The estimation of simple random error was quantifiedin the same manner as Baker and Spaans (1994). Wechose a 3.5-h time period between 2200 and 0130 hoursand determined the simple random error for each TDRprobe and both lysimeters for Time Period 1. Duringthese hours, ET was nearly insignificant, leading to aperiod of negligible change in measured soil water stor-age (we also neglected downward drainage for the sakeof simplicity). Standard errors of measurements due tosimple random error for the lysimeter were about fivetimes less than for any of the TDR probes (Table 3);thus, we will assume for this study that the lysimeterprovides unbiased data with no variability. Note thatstandard error in water content measurements fromTDR is very low, in most cases, an order of magnitudeless than the calibration error (0.008 m3 m~3), yet stillsignificant when considering the total possible error inwater stored in a given depth of soil.
Analytical error is affected by the instrument settings.The resolution of the *-axis (either distance or time)affects the precision of the cable tester, which can affectresultant water content values. During these experi-ments, the distance-division parameter on the cable tes-ter was set to values of 0.05, 0.05, 0.10, and 0.25 (mdivision'1) for the 200, 400, 600, and 800-mm probes,respectively. The amount of error that would occur ifthe reflection points on the TDR trace varied by onedata point on the cable tester were determined; the

YOUNG ET AL.: TDK AND WEIGHING LYSIMETRY TO MONITOR SOIL WATER STORAGE IN TURFGRASS 1145
Table 2. Summary of regression calculations and comparisons between water lost measured by time domain reflectometry (TDK) vs.water lost measured by lysimeter for the effluent and potable lysimeters for Time Period 1. __ __
Measurementdevice
Totalwaterlost
Percentof lysimeter
totalSE of water
storage estimate
Mann-Whitneyrank sum test
results
mmEffluent lysimeter
P/F-.P levelf
TDR probe200mm400mm600mm800mm
Lysimeter
TDR probe200 mm400mm600mm800mm
Lysimeter
104.4177.0168.9163.8184.9
83.8100.6116.1134.1160.7
56.595.891.488.6n/a
Potable lysimeter
52.162.672.383.4n/a
1.281.081.251.80n/a
1.091.051.071.06n/a
0.240.550.380.20n/a
0.440.610.640.53n/a
F: <0.0001P: 0.2381F: 0.0237P: 0.0715
F: <0.0001F: <0.0001F: <0.0001F: <0.0001
t P/F - Pass null hypothesis (samples were drawn from same population)/Fail null hypothesis (samples were drawn from different populations); P level :
probability of falsely rejecting the null hypothesis.
differences in water contents were found to be 0.0017,0.0017, 0.0028, and 0.0021 m3 m~3 for each data pointcollected from the cable tester, for the 200-, 400-,600-, and 800-mm probes, respectively. Though this un-certainty could be significant for individual water con-tent measurements, we were considering changes in wa-ter content, using identical algorithms for analyzing allfour TDR probes. Thus, any error (or bias) would affectall the probes in the same way, canceling the errorswhen calculating change in soil water storage.
By summing the sources of uncertainty, we found thatstandard errors sum to totals exceeding 0.01 m3 m~3
only in the case of the 200-mm probes. In all cases,between 66 and 93% of the total error was due to cali-bration.
CONCLUSIONSVertically installed TDR probes were tested by com-
paring changes in soil water storage measured by TDRprobes with changes in mass measured by large weighinglysimeters, converted to soil water storage. Automatic
0.20
§* 0.10
0.05
•~v_
.\%Hi
~~~K.
Probelength-(mm)
800
600
400
242 246 247243 244 245DOY-1995
Fig. 7. Change in volumetric water content recorded in the effluentlysimeter using the vertical time domain reflectometry probes dur-ing Time Period 2 (DOY = day of year).
data collection with the TDR system and the lysimetercontinued for more than 15 mo, at 30-min time intervals.We found that TDR-measured diurnal changes in watercontent can be attributed mostly to plant-root uptake.
During Time Period 1, the shorter TDR probes gener-ally underestimated irrigation water added becausesome of the irrigated water never infiltrated the soilprofile; a portion of the water was absorbed by an or-ganic mat located immediately above the TDR wave-guides. Longer probes more closely predicted wateradded because longer probes averaged thicker soil se-quences, removing some of the variability in water con-tent that is present in near-surface soils. Shorter TDRprobes also underestimated the water lost from the soil,for the same reasons as given above. However, thelonger probes measured higher water losses, due todownward drainage of water that was combined intothe estimate of ET. Monitoring near-surface soil in dailyirrigated turfgrass with 200-mm TDR probes gave anexcellent estimate of diurnal variation of water content,but using these variations to estimate changes in soilwater storage did not compare as well with the lysimeter.
20
10
242 246 247243 244 245
DOY-1995Fig. 8. Sum of water lost from the root zone of the effluent lysimeter
without irrigation (DOY = day of year).

1146 SOIL SCI. SOC. AM. J., VOL. 61, JULY-AUGUST 1997
Table 3. Standard errors of measurements (o-m) for time domainreflectometry (TDR) and lysimeter systems from day of year167 to day of year 195 in 1995.t
Measurementdevice
TDR probe200mm400mm600mm800mm
Lysimeter
Effluent
am of04
m3m-3
0.001500.000850.000740.00058
a/a
lysimeter
o-m of waterstorage
nun
0.3000.3420.4420.4630.071
Potable
o-m of e.m3m '
0.002050.000640.000400.00040
n/a
lysimeter
o-m of waterstorage
mm
0.4090.2560.2420.3400.075
t Standard error was calculated using o-n = -= where a, = standard devia-Vn
tion, and n = number of measurements.t 0, = volumetric water content.
During Time Period 2, cumulative water loss rates asmeasured with the effluent lysimeter were shown to belinear. These rates correlated very closely to measure-ments made by the 800-mm TDR probe. Shorter TDRprobes measured less water loss than the lysimeters,presumably because the available soil water was de-pleted in the shallow soils, requiring plant-root uptakefrom deeper soil. The TDR system showed that =80%of total soil water loss, as measured by the lysimeter,occurred in the top 600 mm of soil. The TDR systemgave better estimates of changes in soil water storagewhen the soil system was not irrigated daily.
The results show that generally, the longer TDRprobes gave more accurate estimates of soil water stor-age than did the shorter probes, especially for the longerirrigation interval. Longer probes tended to smooth outthe variability in near-surface water contents by averag-ing across thicker soil layers. This is fortunate given thatthe rooting depth of turfgrass, and of many other crops,is >200 to 400 mm, requiring longer waveguides to bet-ter monitor total water use. These results showed thatTDR would be useful for automating the measurementof soil water storage for crops that are irrigated at timeintervals longer than 1 d. Using vertical TDR probes ofdifferent lengths provides additional information aboutthe depths of plant-root uptake and their changeswith time.
ACKNOWLEDGMENTSFunding for this research was provided in whole or in part by
the Water Resources Research Center, College of Agriculture,Univ. of Arizona, Grant 104 Program, and grant numberES04940 from the National Institute of Environmental HealthSciences, NIH.