monitoring in motion: monitoring containers and amazon ecs
TRANSCRIPT
© 2016, Amazon Web Services, Inc. or its Affiliates. All rights reserved.
Ilan Rabinovitch
Monitoring in MotionMonitoring Containers and ECS
$ finger ilan@datadog[datadoghq.com]Name: Ilan RabinovitchRole: Director, Technical CommunityInterests: * Open Source * Large scale web operations * Monitoring and Metrics * Planning FL/OSS and DevOps Events (SCALE, TXLF, DevOpsDays, and more…)
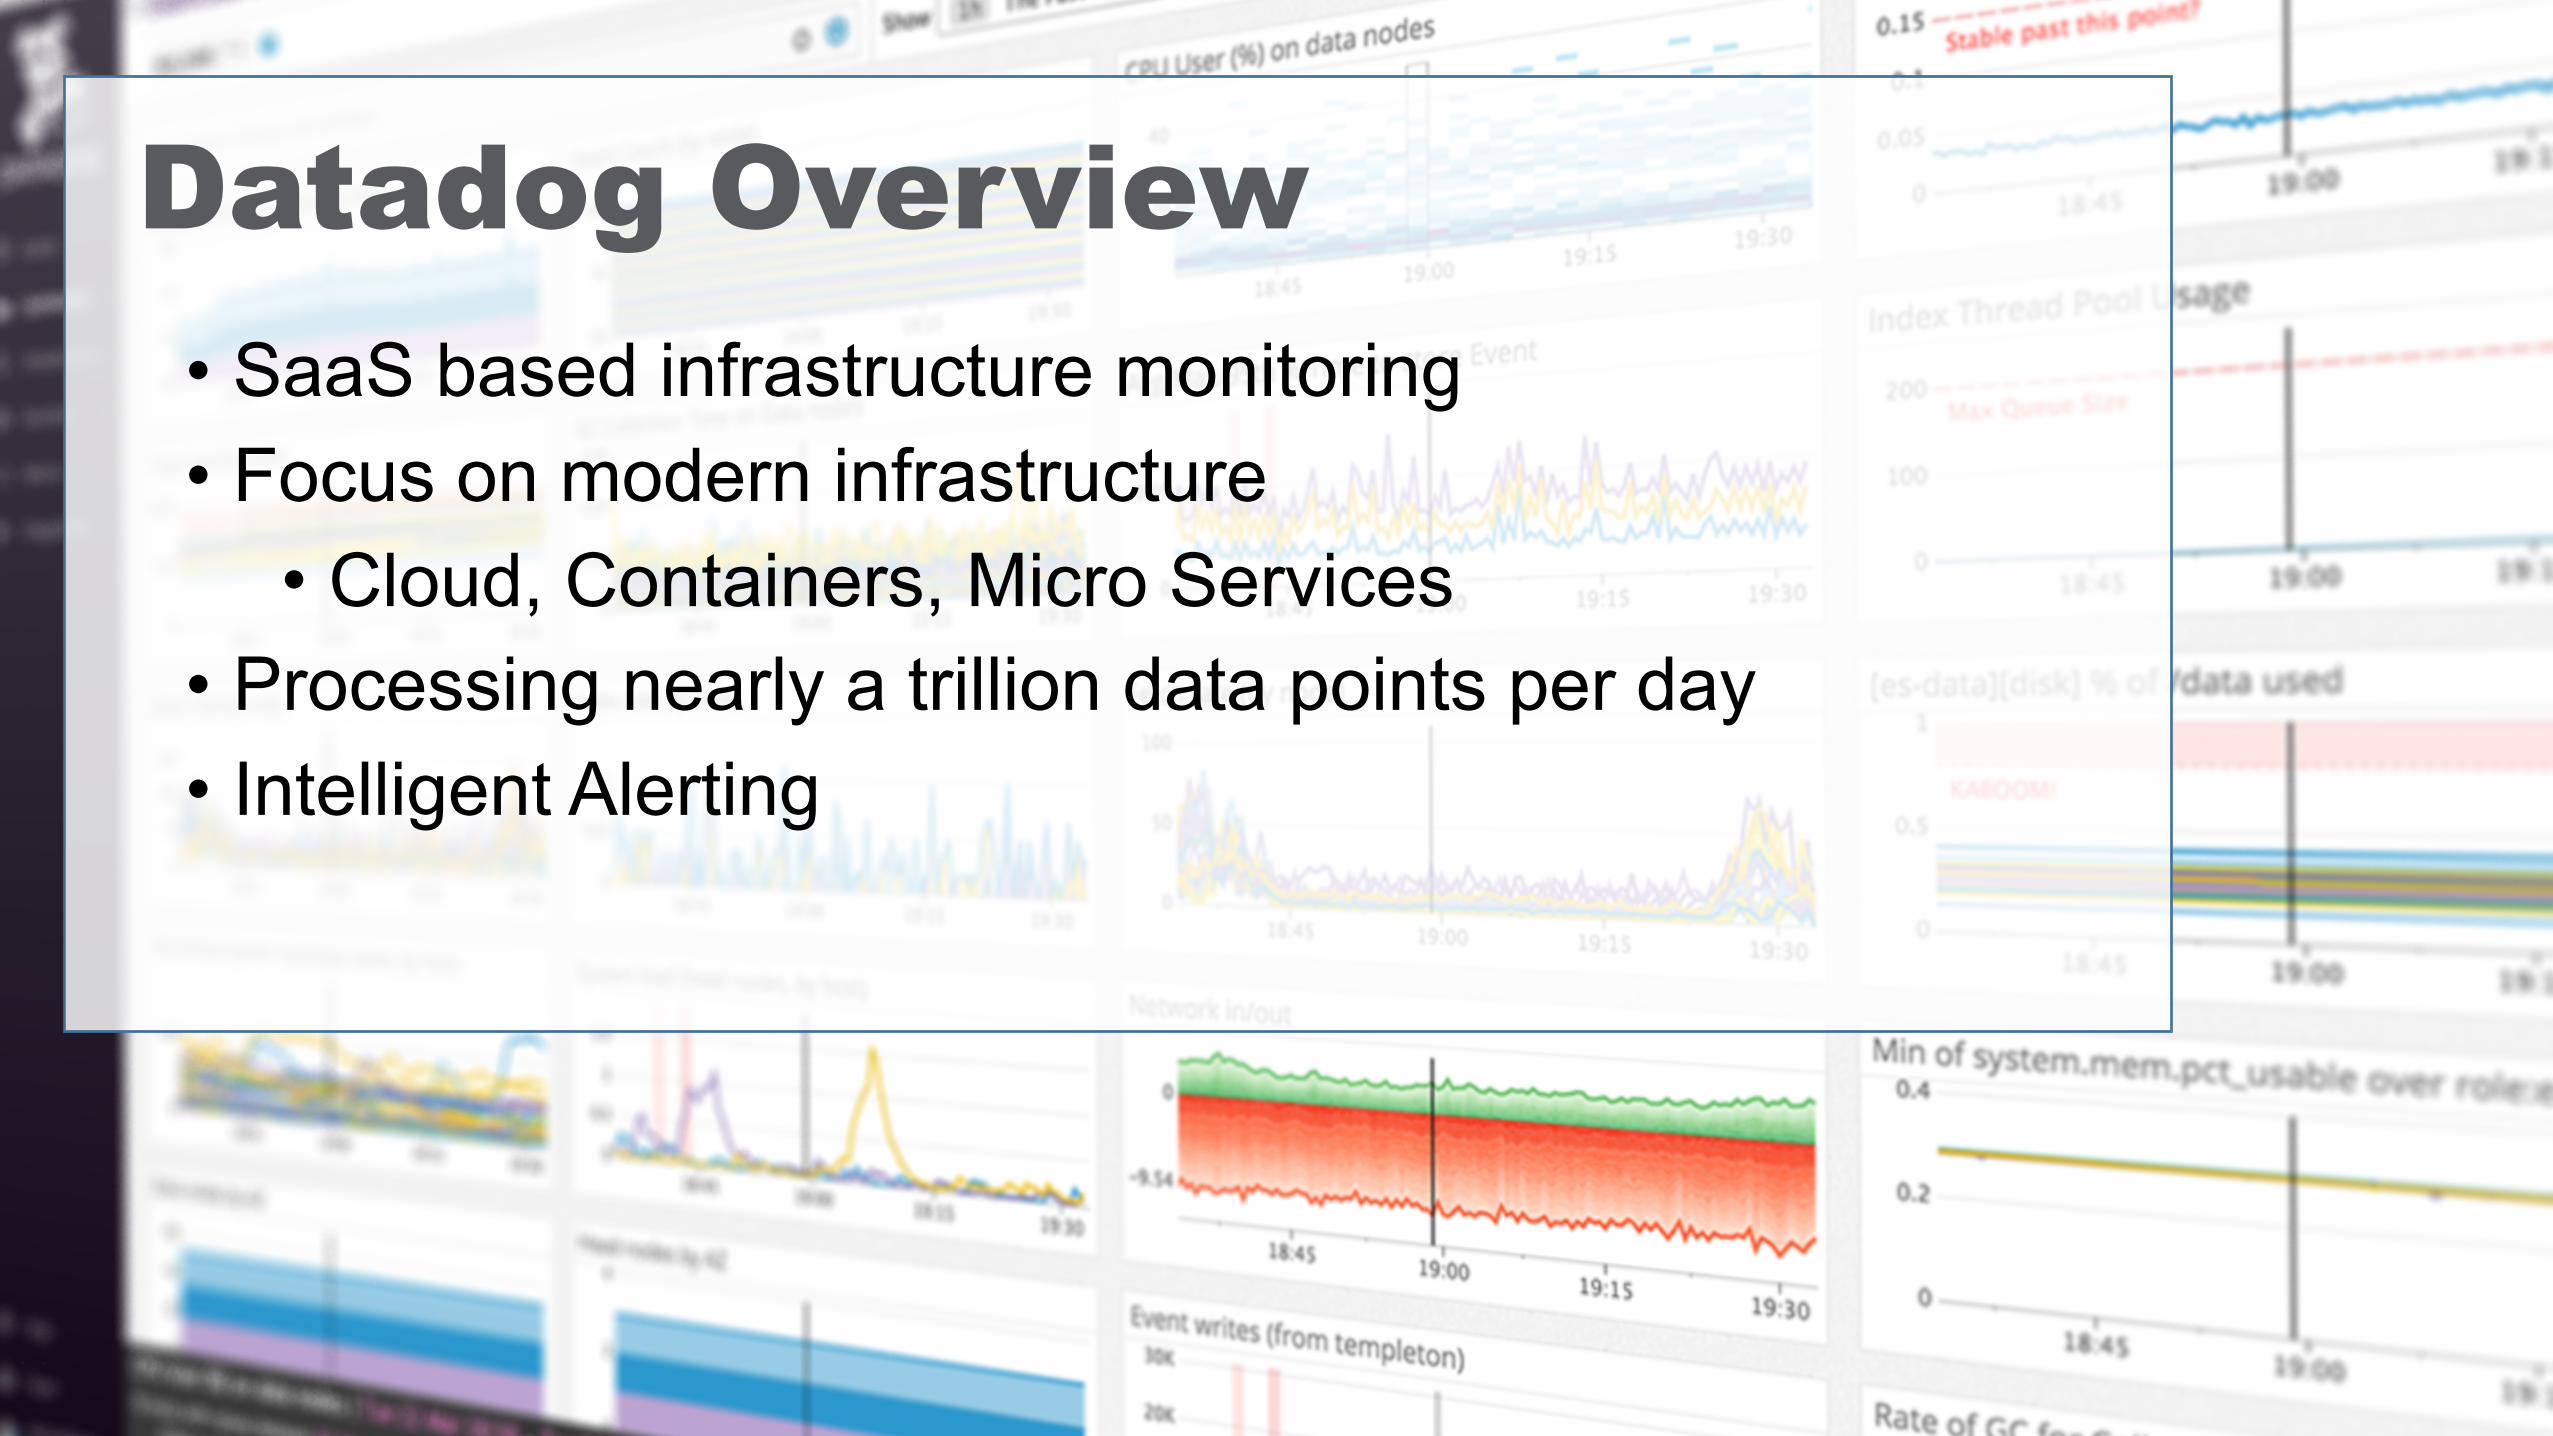
• SaaS based infrastructure monitoring • Focus on modern infrastructure
• Cloud, Containers, Micro Services • Processing nearly a trillion data points per day • Intelligent Alerting
Datadog Overview

Operating Systems, Cloud Providers (AWS), Containers, Web Servers, Datastores, Caches, Queues and more...
Monitor Everything

$ cat ~/.plan
1. Introduction: Why Containerize?
2. How: Collecting Docker and ECS Metrics
3. Finding the Signal: How do we know what to monitor?
4. Practice: Fitting it all together on ECS

Why Containerization?
More info at: www.datadoghq.com/docker-adoption/

Why Containers?• Avoid Dependency Hell

Why Containers?• Avoid Dependency Hell
• Single Artifact Deployments
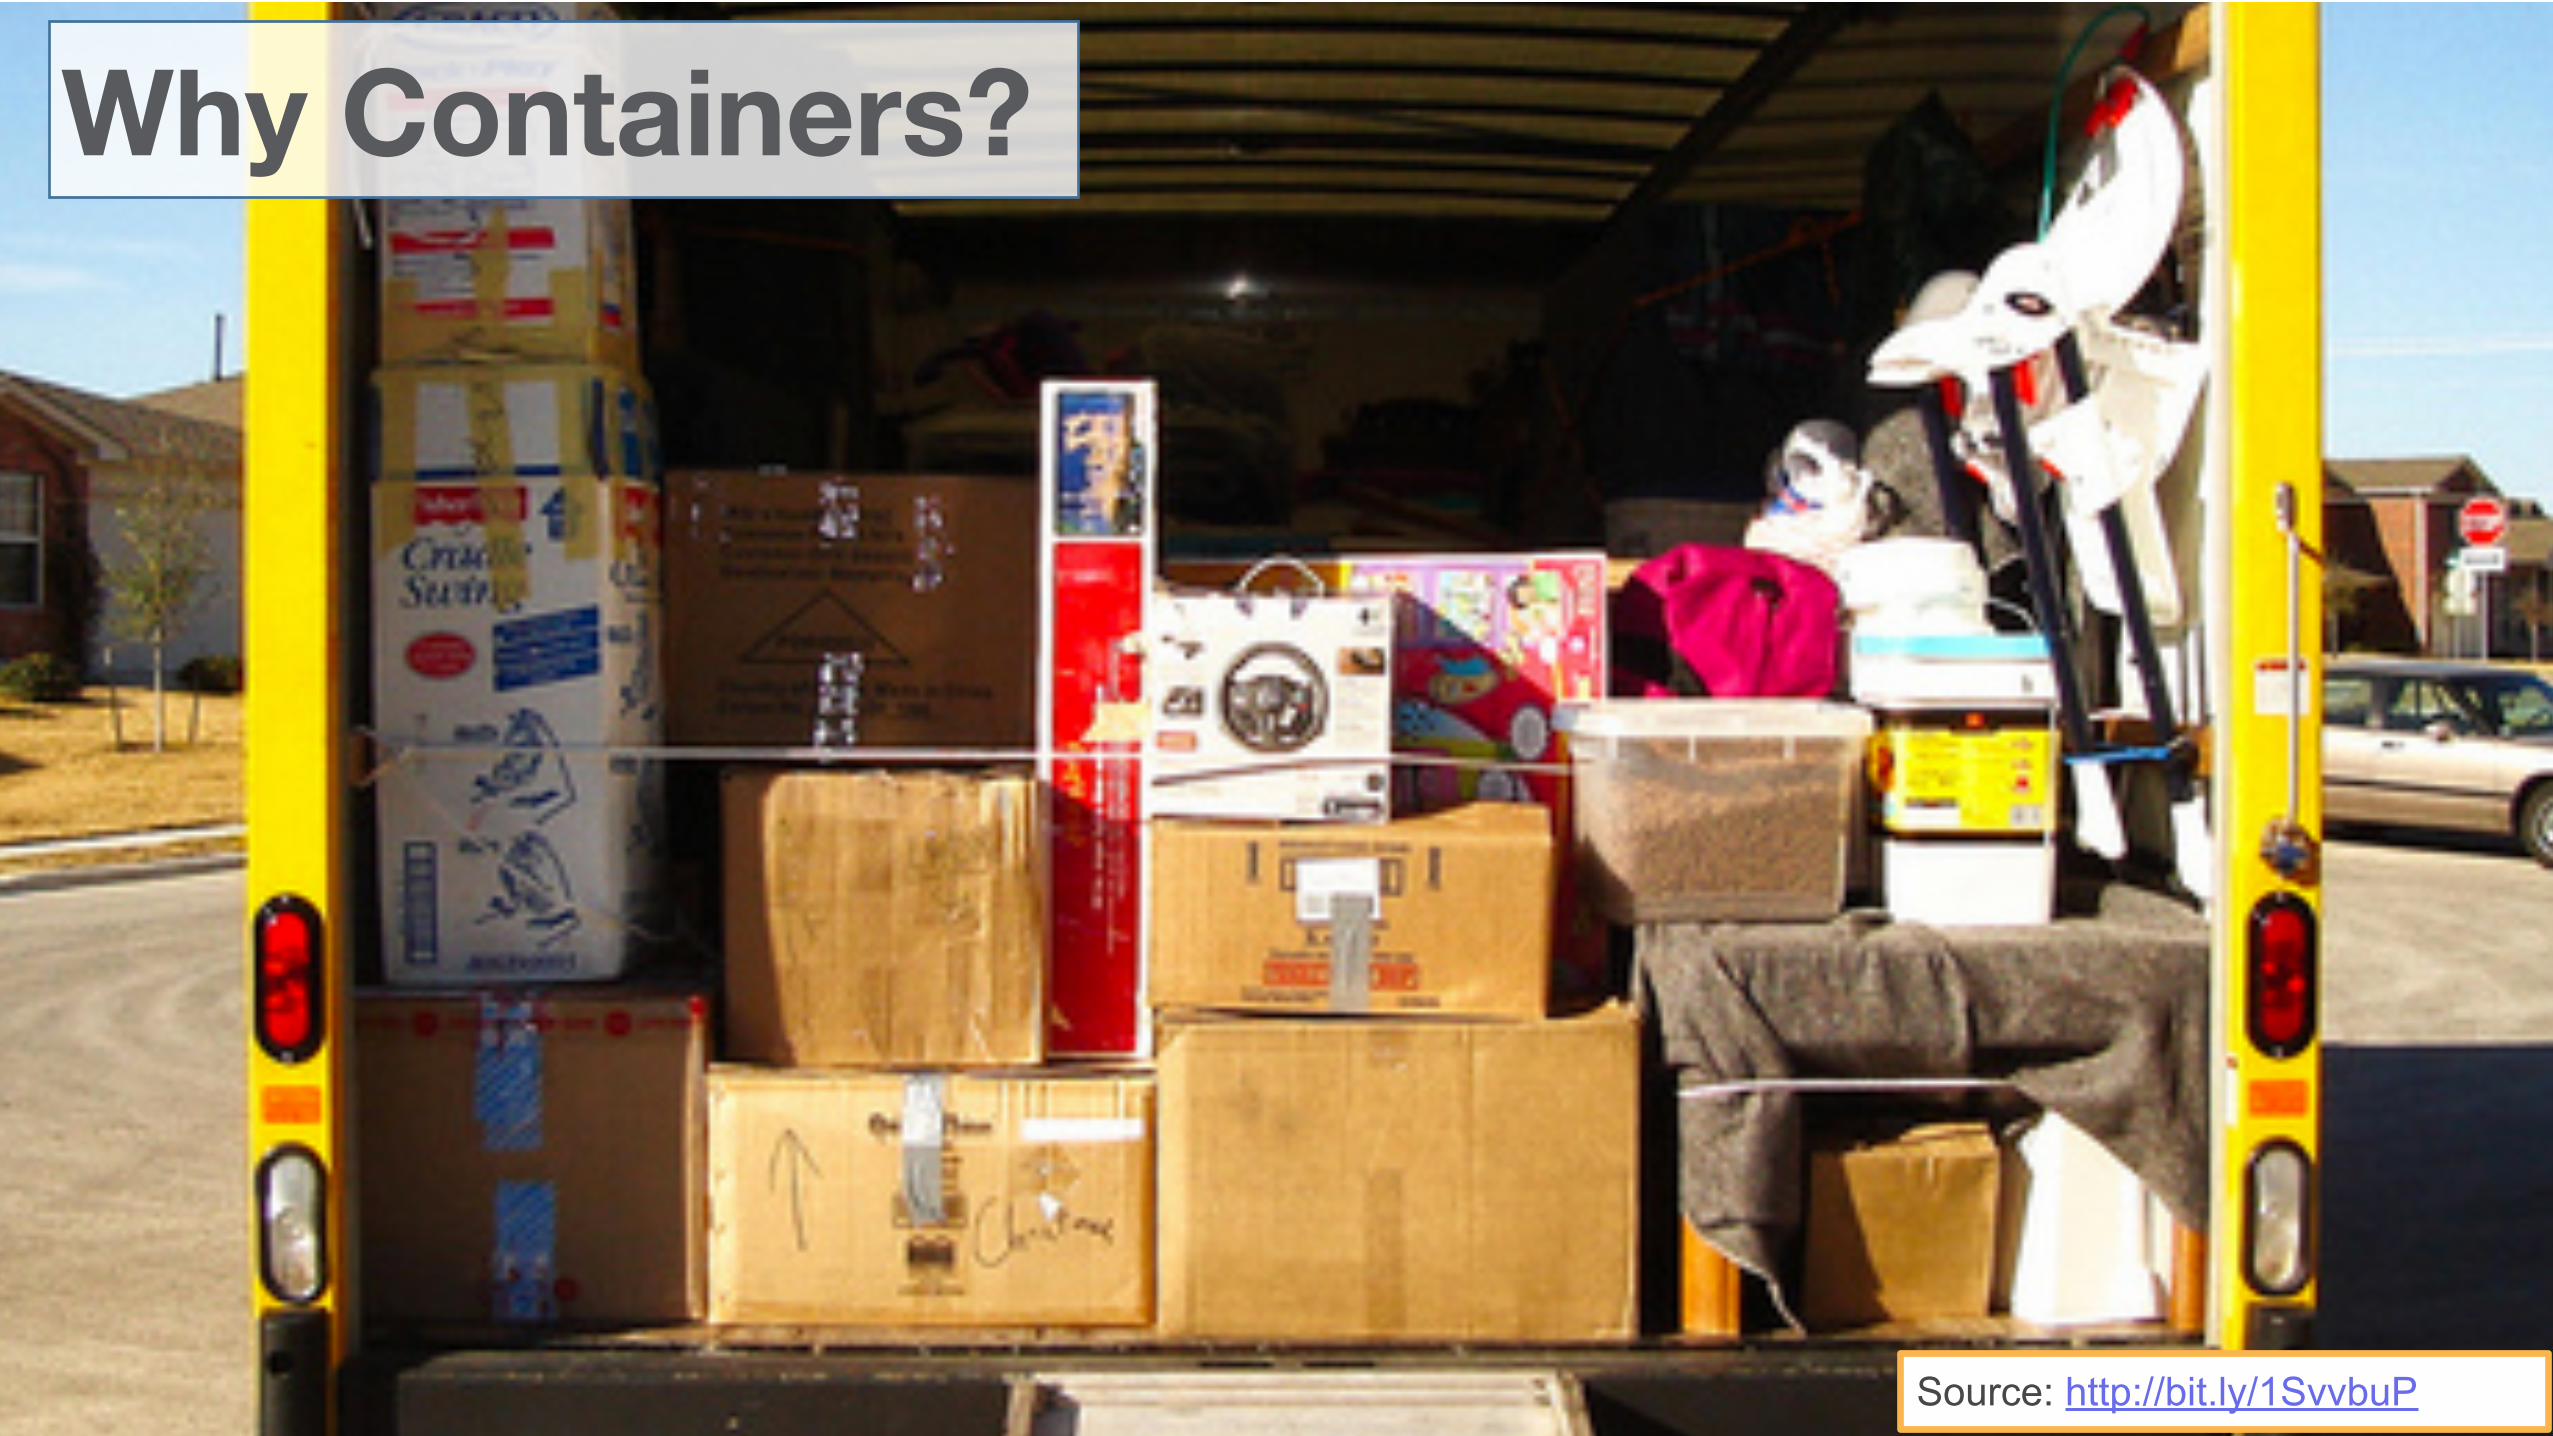

Source: http://bit.ly/1qFylWK
• Avoid Dependency Hell
• Single Artifact Deployments
• Quick, Low Cost Provisioning
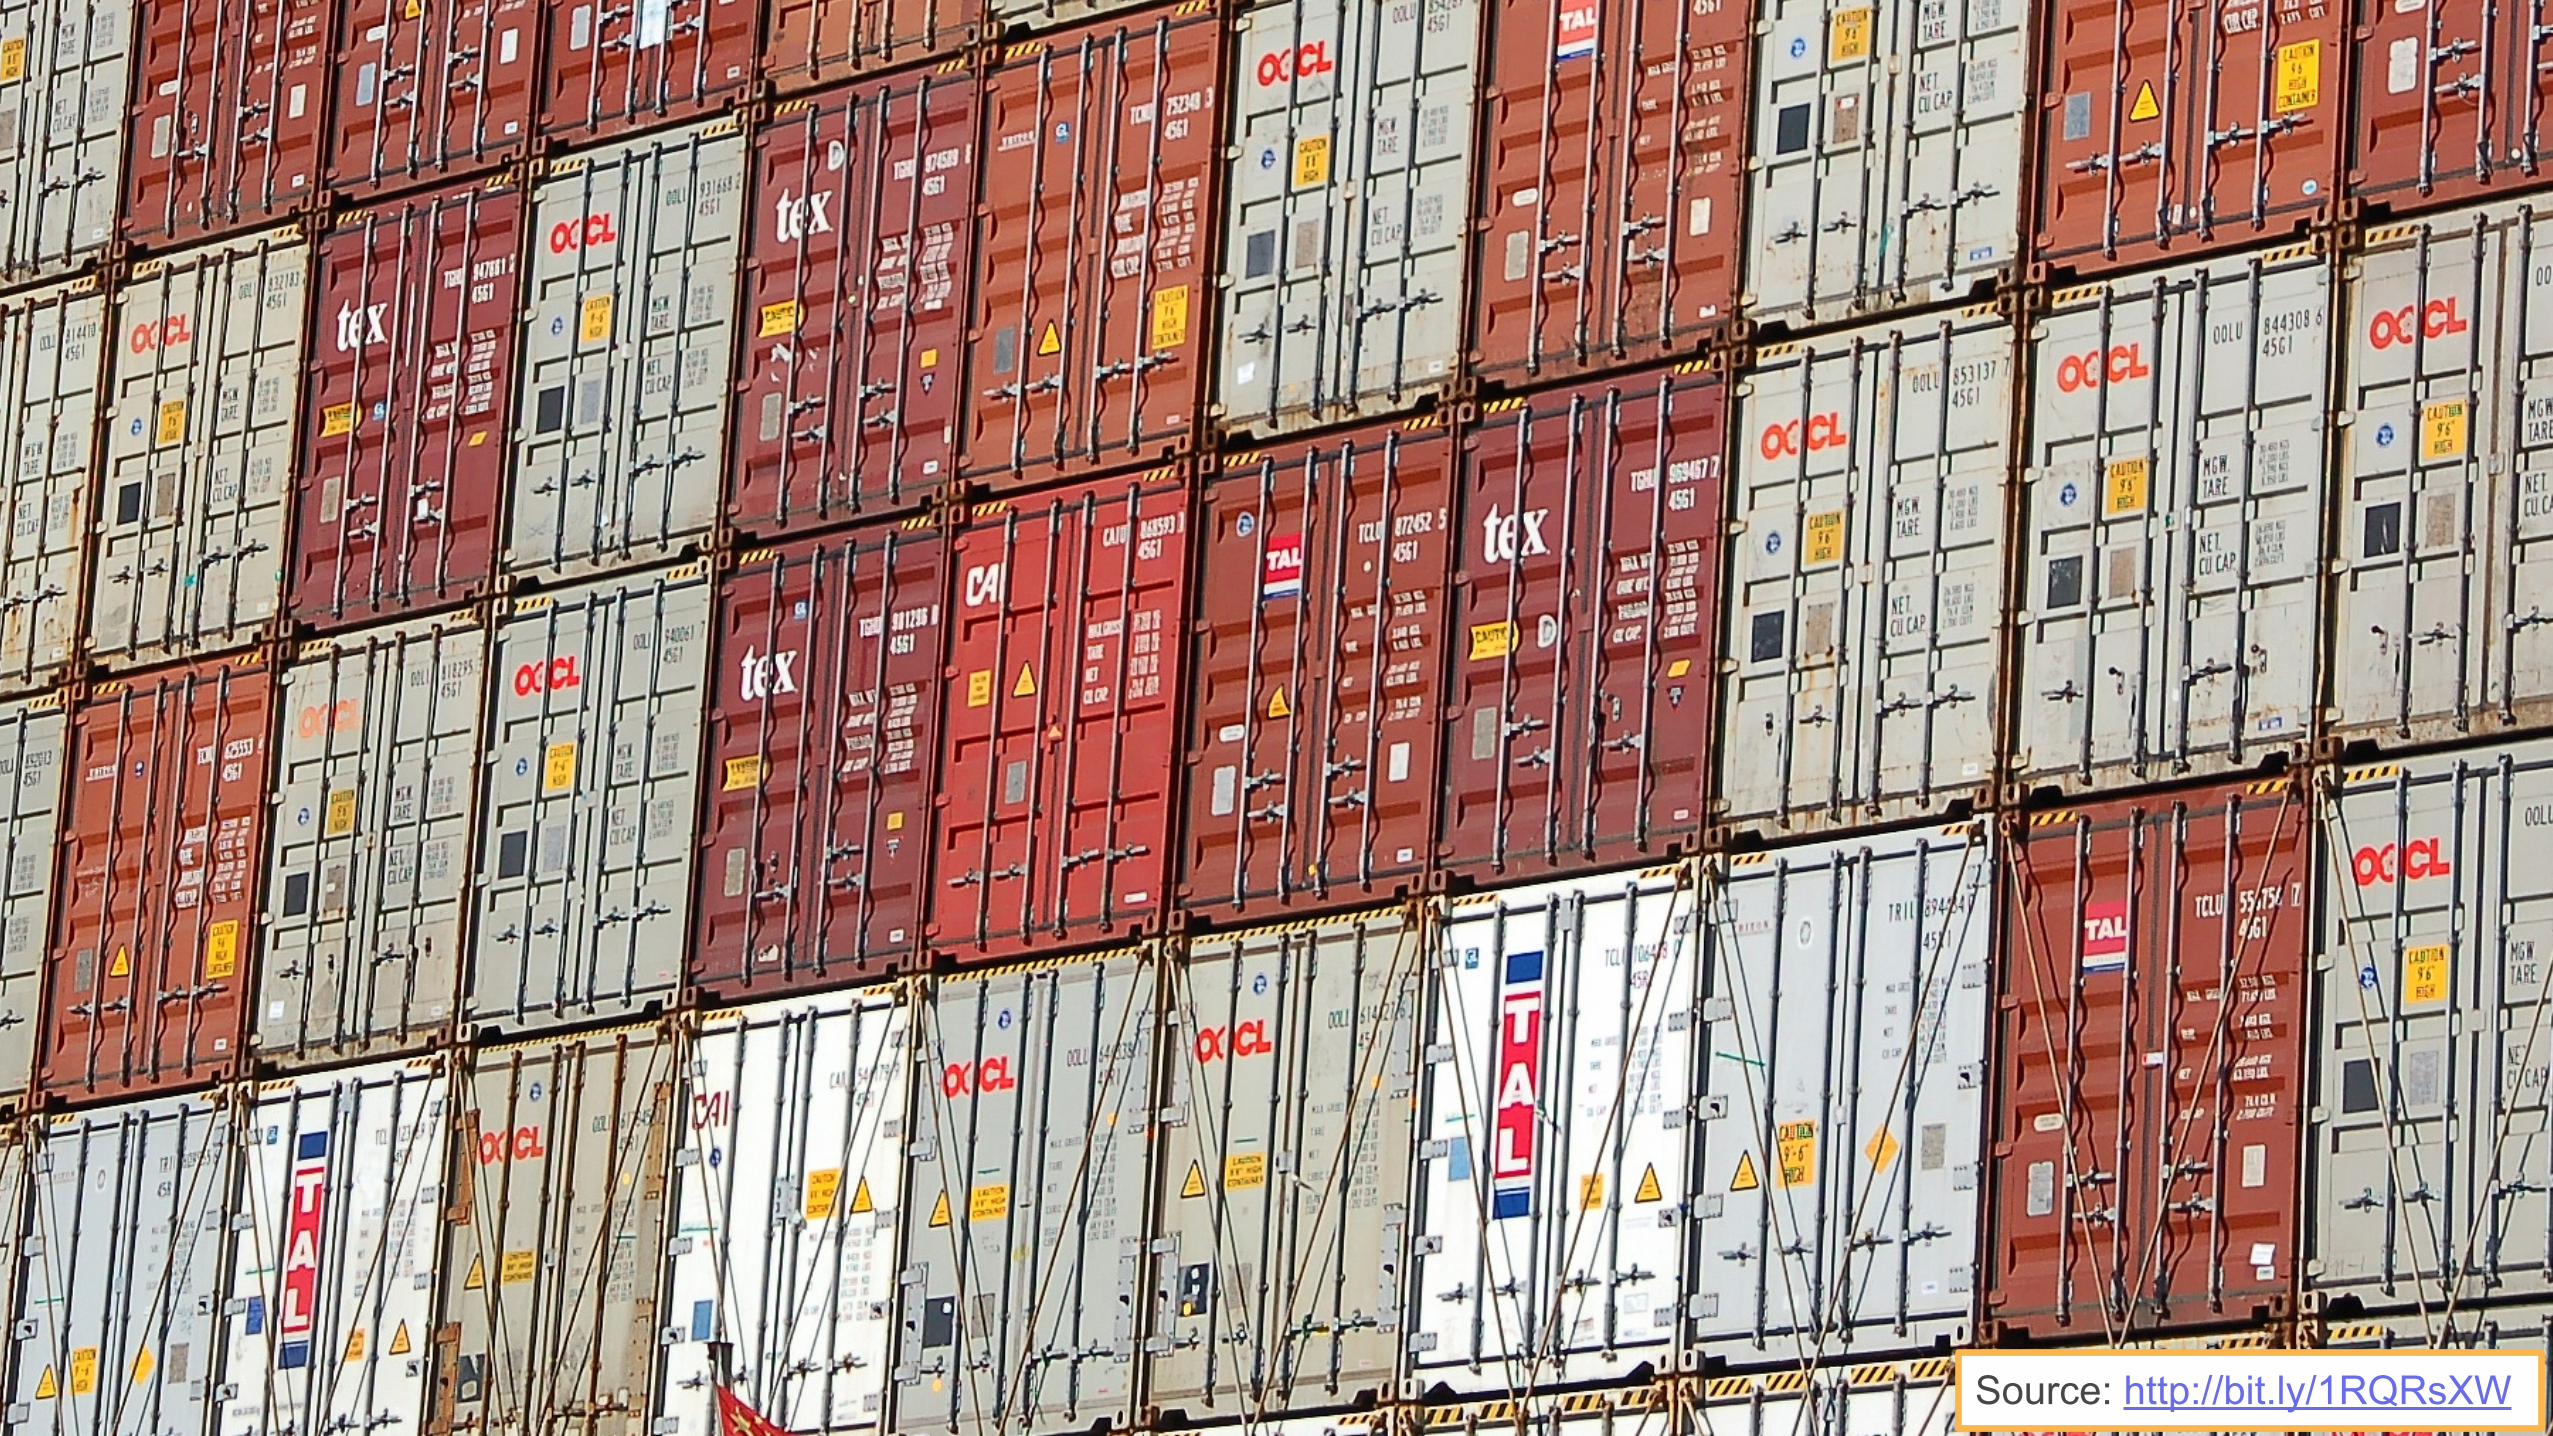
Why Containers?

Source: Datadog

ECS - Elastic Container Services
• Automatically manages and schedules your containers as ‘tasks’
• Ensures tasks are always running based on your parameters
• Integration with load balancing and routing via ELB.
Monitoring in Motion How do you define and monitor for normal when everything is changing around you?
Between ECS and Containers you now have:
• Containers moving between hosts. • Changing ports • and other changes underneath your feet.
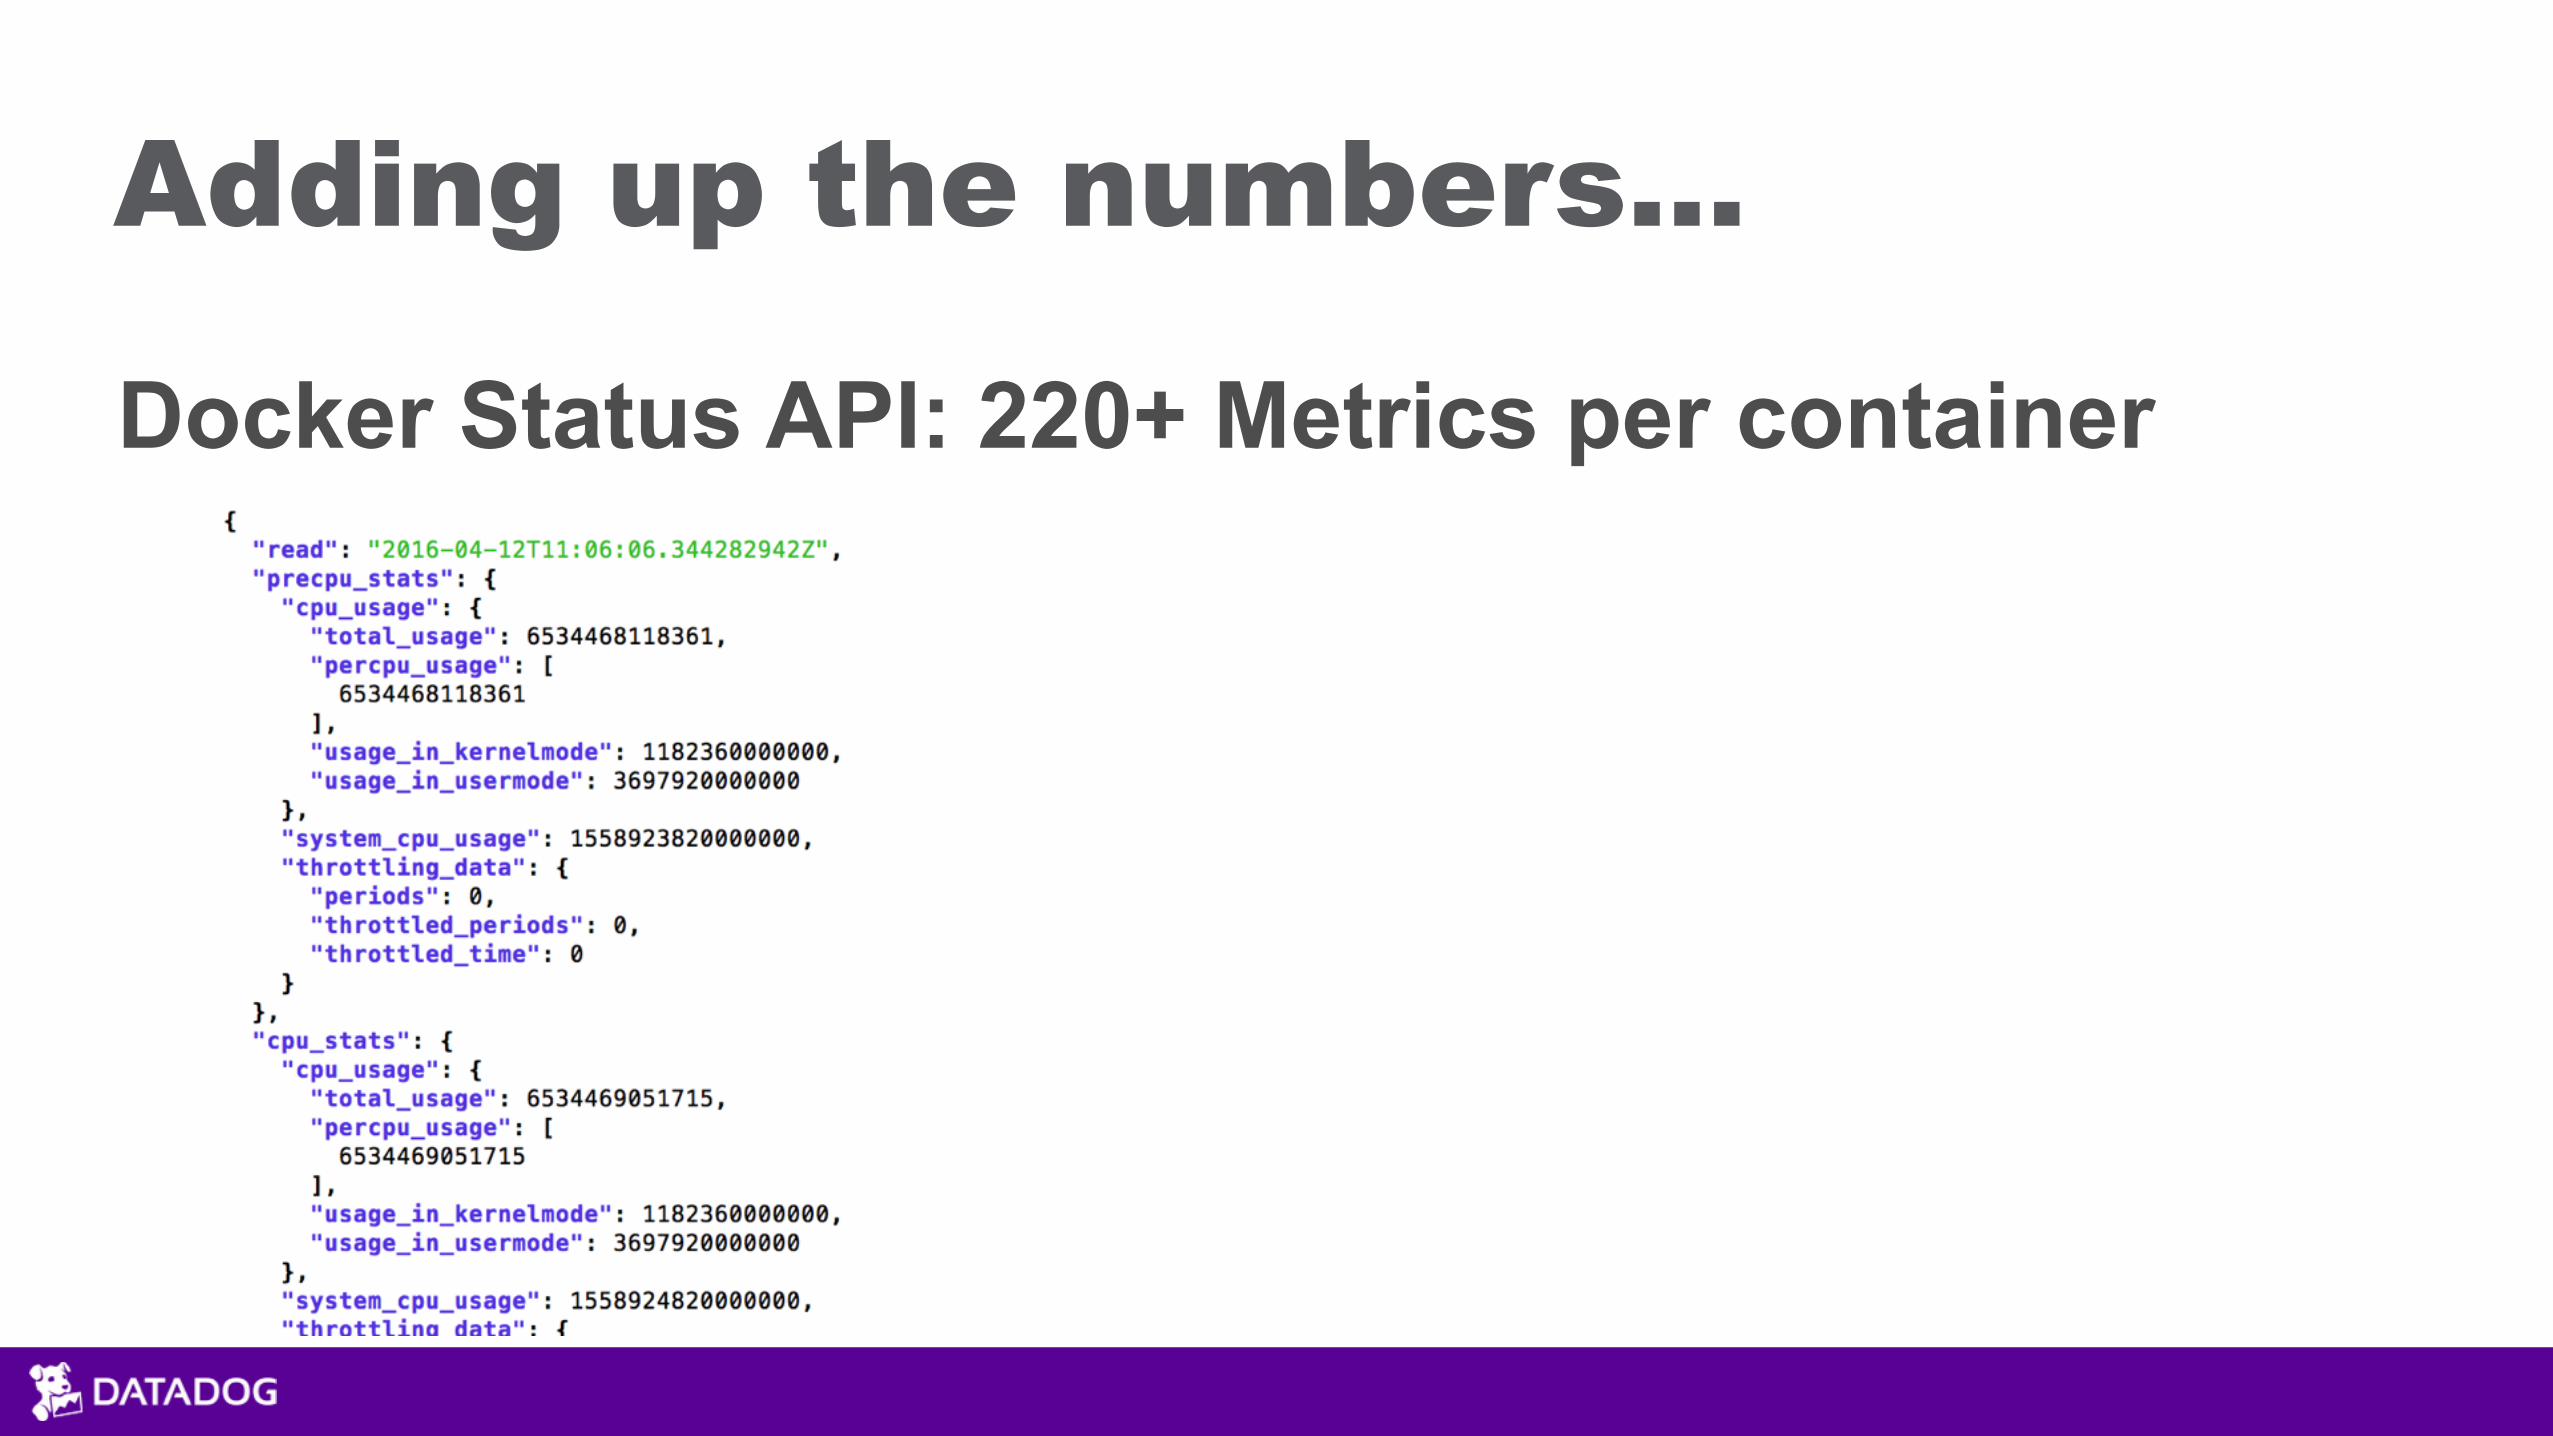
Adding up the numbers…
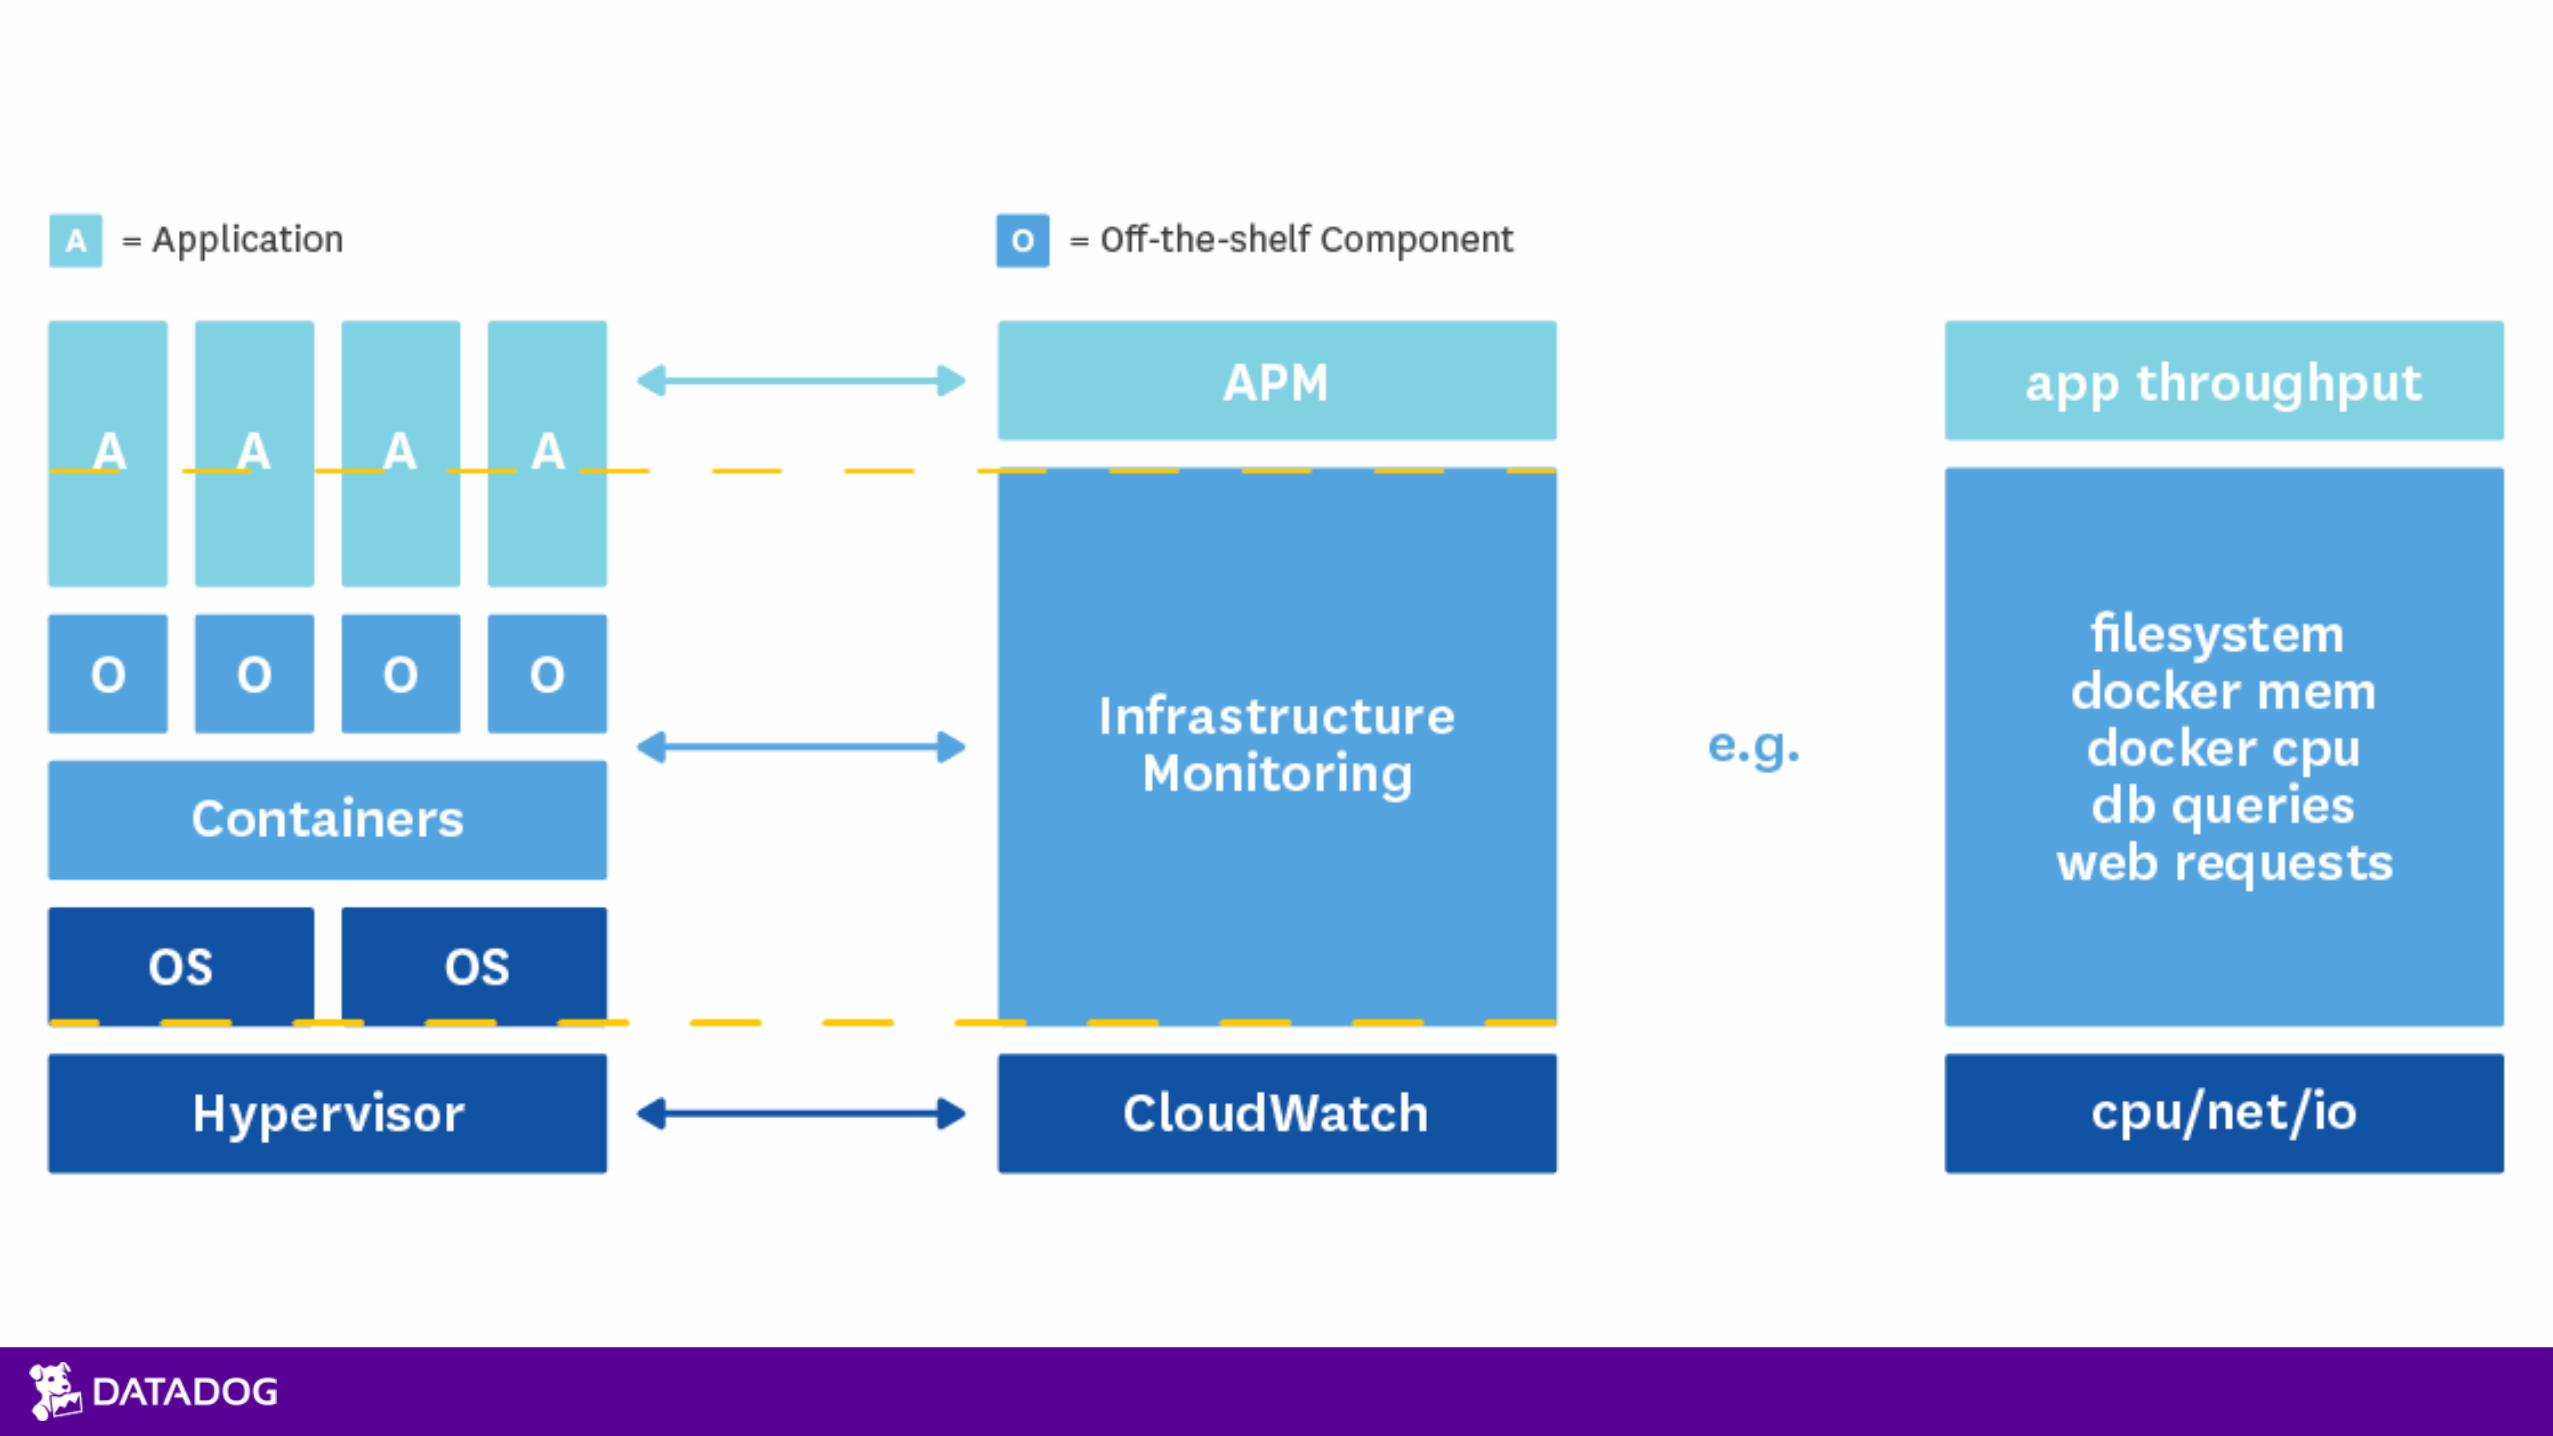
Docker Status API: 220+ Metrics per container
Adding up the numbers…
Docker Status API: 223+ Metrics per container ECS CloudWatch Metrics: 4 per cluster + 2 per service
Adding up the numbers…
Docker Status API: 223+ Metrics per container ECS CloudWatch Metrics: 4 per cluster + 2 per service OS Metrics: 100~ per instance

Docker Status API: 223+ Metrics per container ECS CloudWatch Metrics: 4 per cluster + 2 per service OS Metrics: 100~ per instance App Metrics: 50~
Adding up the numbers…


Adding up the numbers…
OS Metrics: 100~ per instance Docker Status API: 223+ Metrics per container ECS CloudWatch Metrics: 4 per cluster + 2 per service App Metrics: 50~
Metrics Overload!


Host Centric
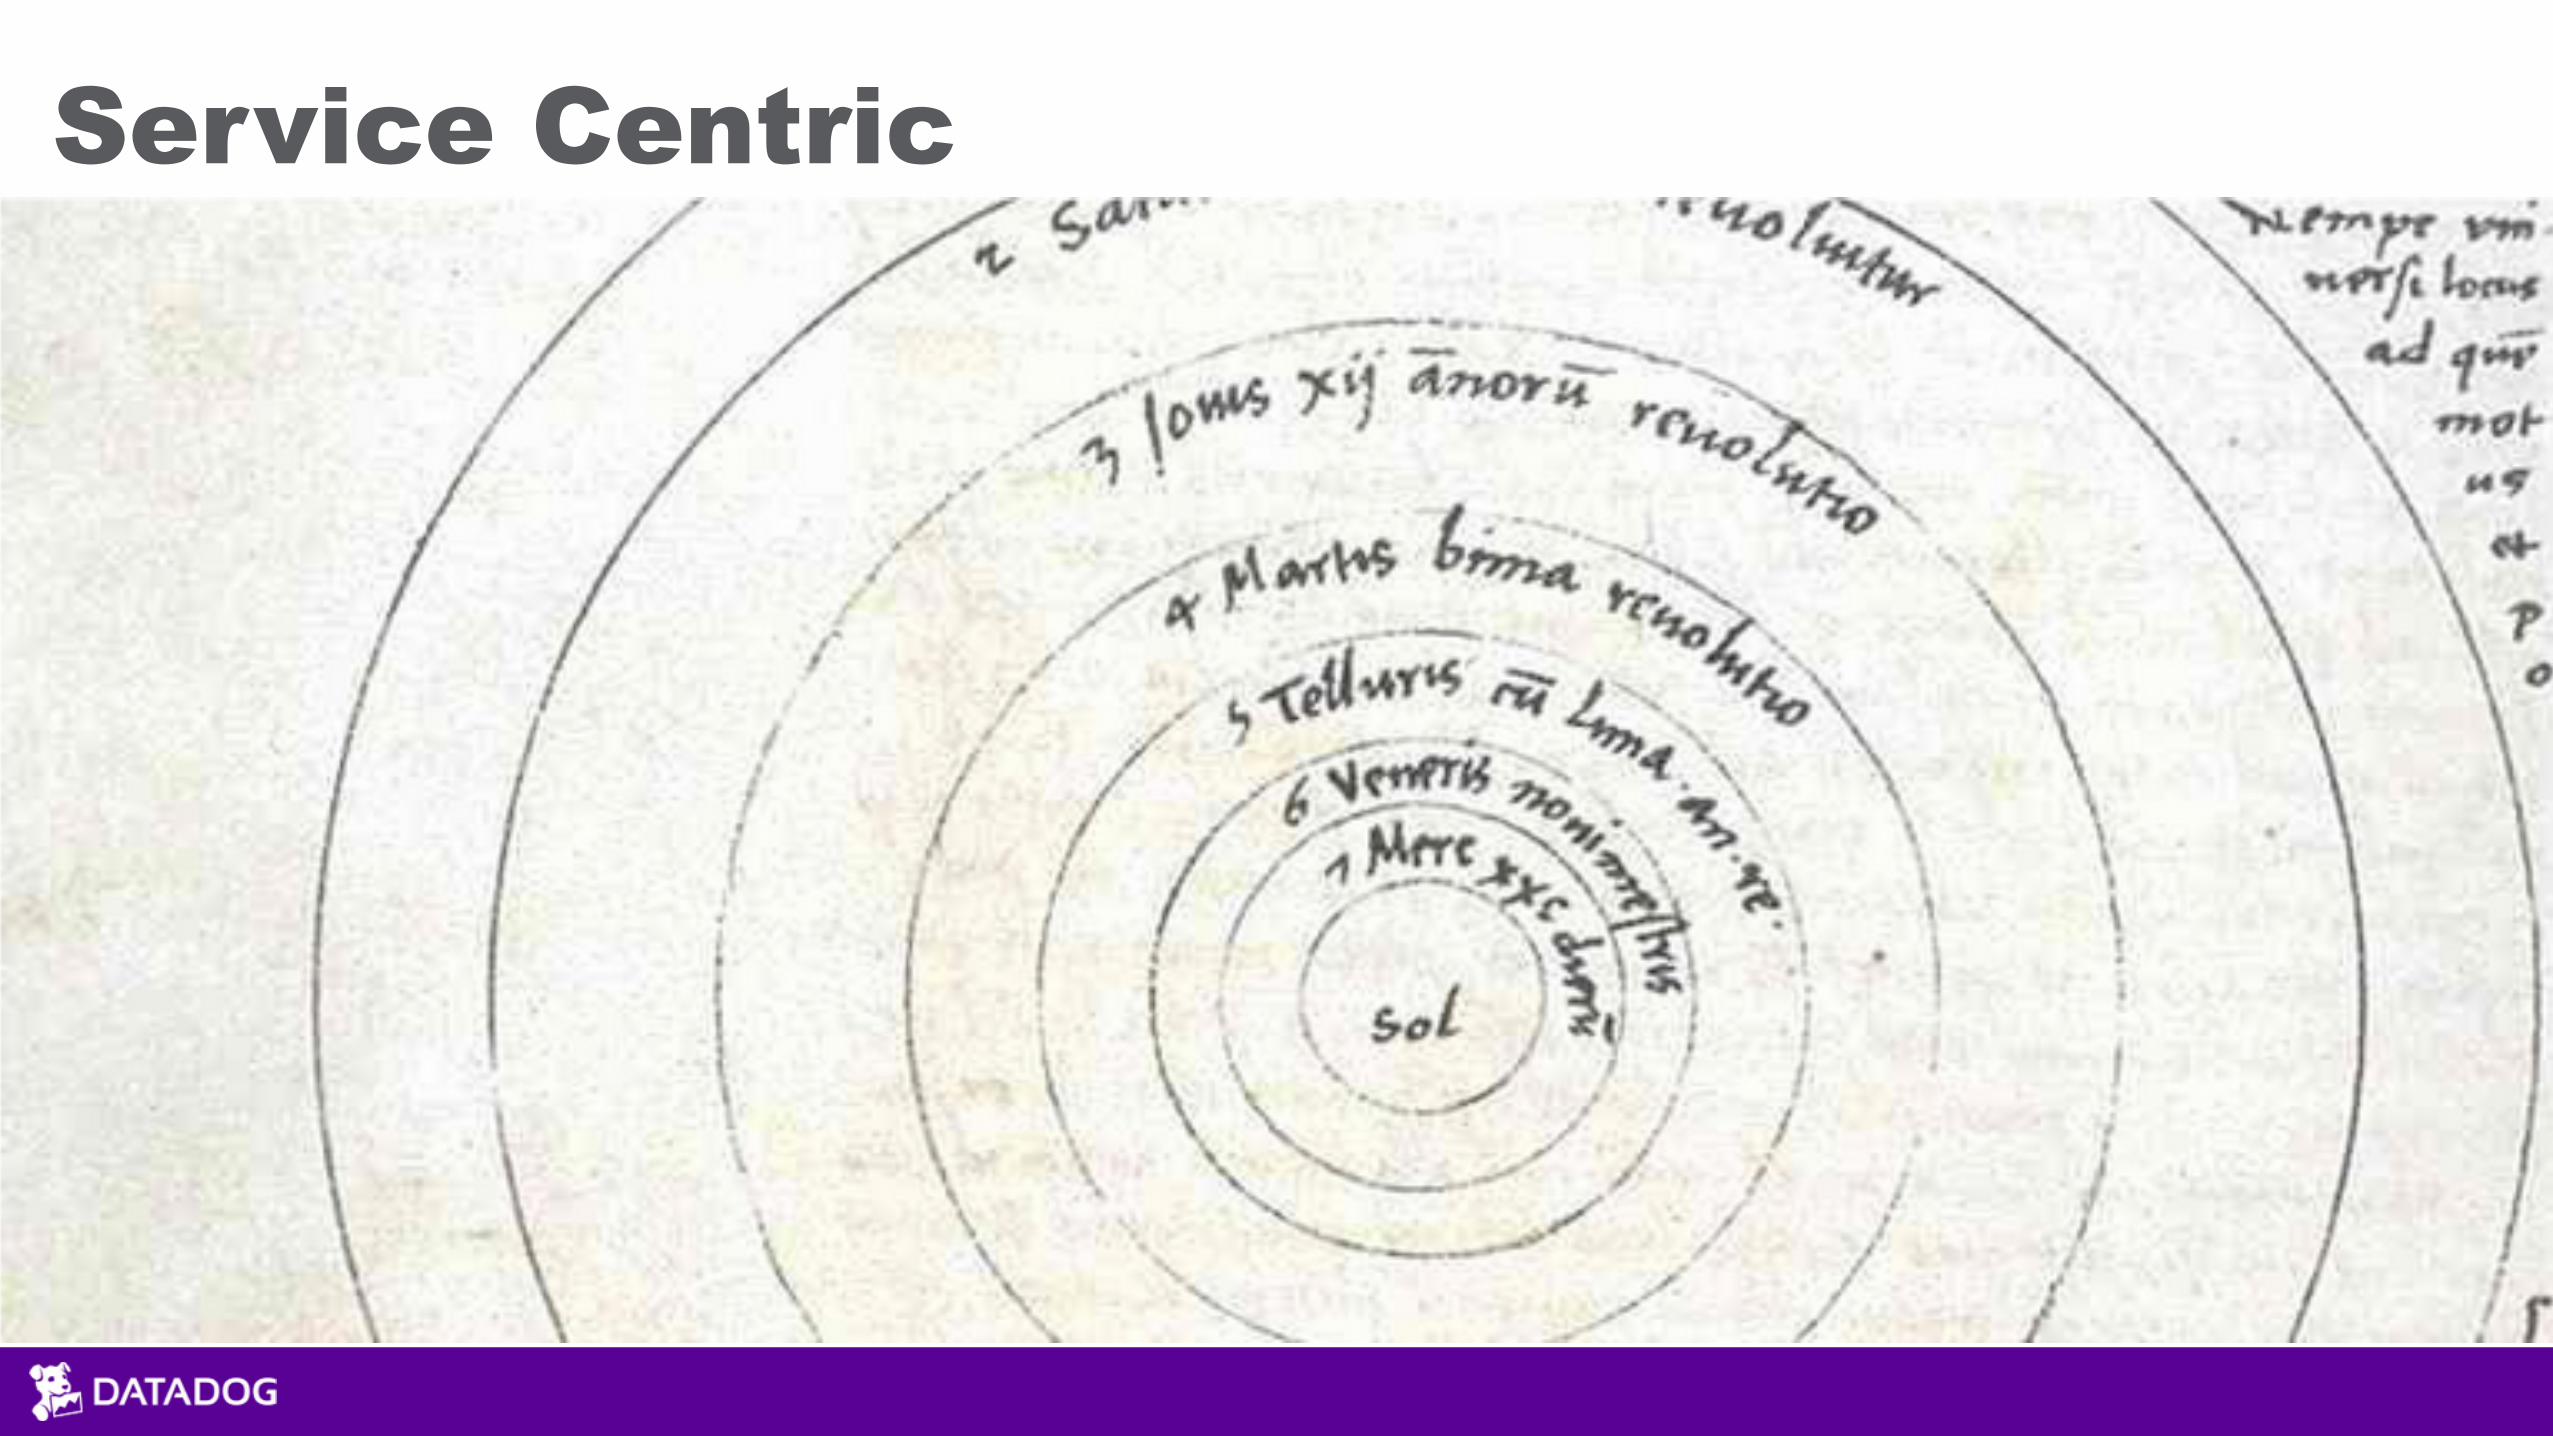
Service Centric

Avoiding Gaps

Tags All the Way Down

Moving from statements to tag based queries
“Monitor all containers running image web in region us-west-2 across all availability zones that use more than 1.5x the average memory on c3.xlarge”

Monitoring 101


Collecting data is cheap; not having it when you need it can be expensive

Instrument all the things!


Monitoring 101: tl;dr Edition
More Details at: http://www.datadoghq.com/blog/monitoring-101-alerting/
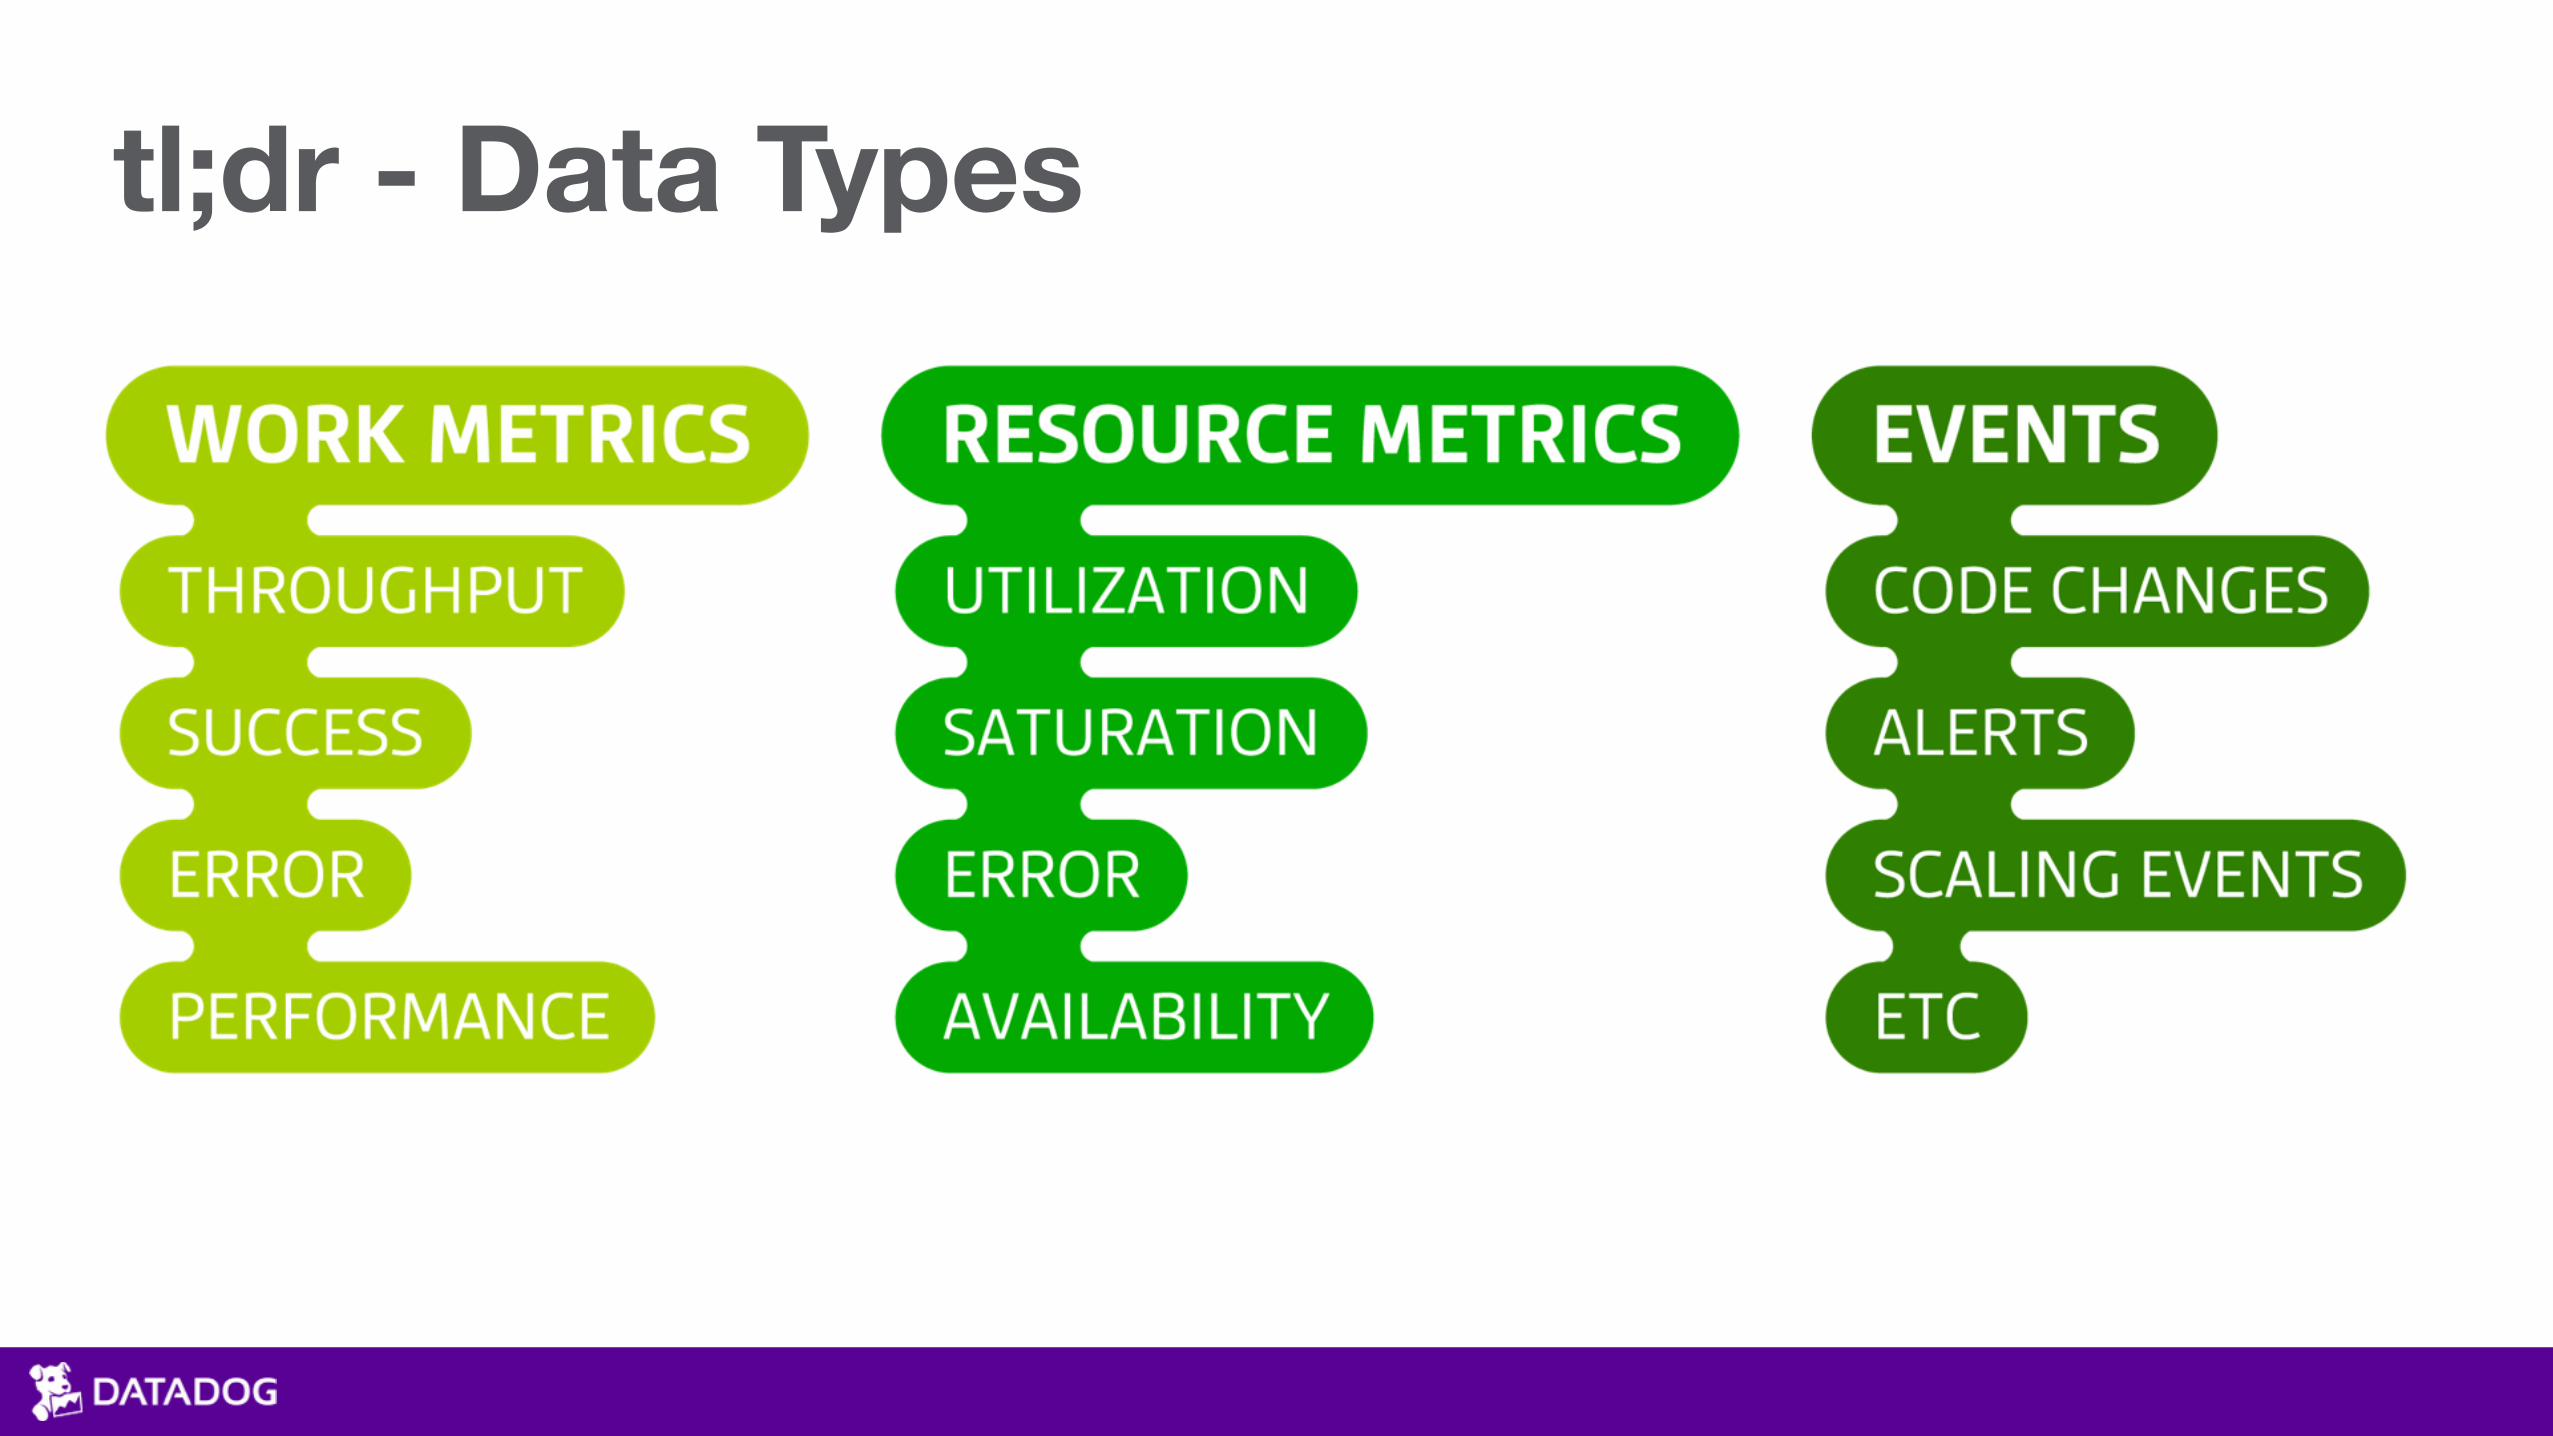
tl;dr - Data Types

Examples: NGINX - Metrics
Work Metrics:Requests Per Second • Dropped
Connections • Request Time • Error Rates
Resource Metrics: • Disk I/O • Memory • CPU • Queue Length
Examples: NGINX - Events
• Configuration Change • Code Deployment • Service Started / Stopped • etc

When to let a sleeping engineer lie?

When to alert?

Recurse until you find root cause

Getting at the Metrics• ECS vs Docker
• Work Metrics vs Resource Metrics

Resource MetricsUtilization: • CPU (user + system) • memory • i/o • network traffic
Saturation • throttling • swap
Error • Network Errors
(receive vs transmit)

Docker and ECS Events
• Starting / Stopping Containers • Auto-scaled Underlying Instances

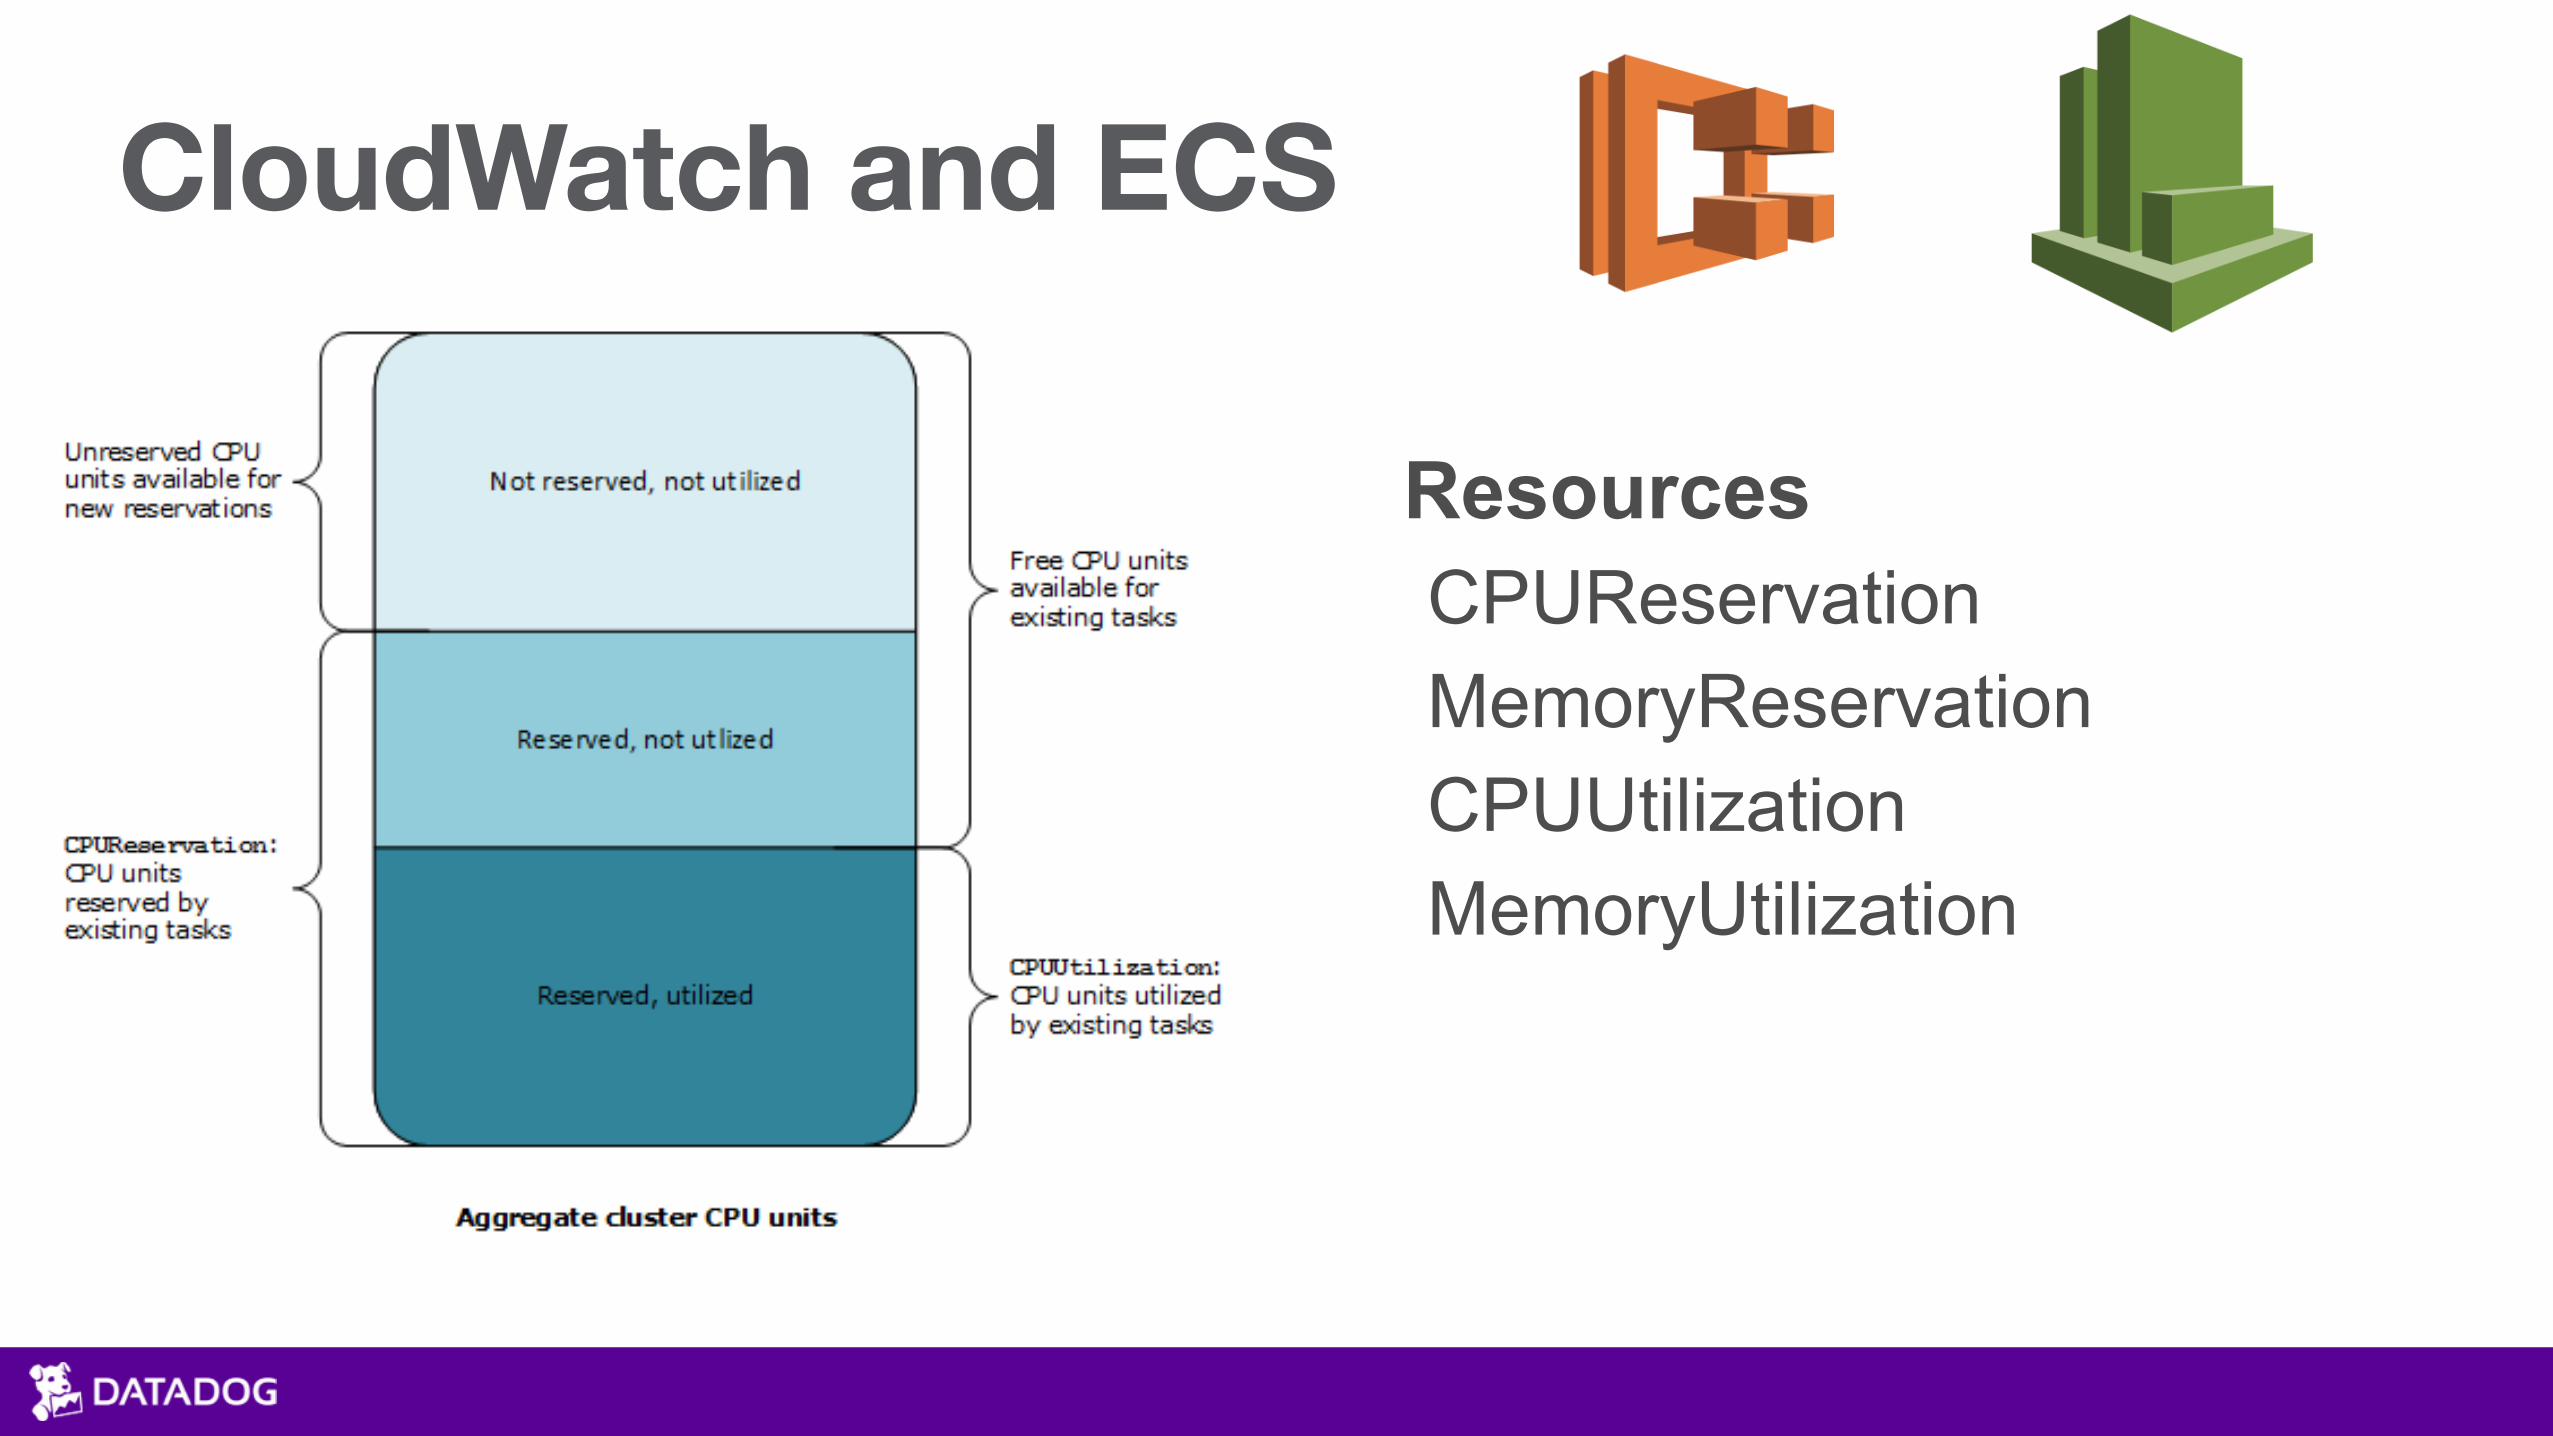
CloudWatch and ECS
Resources CPUReservation MemoryReservation CPUUtilization MemoryUtilization
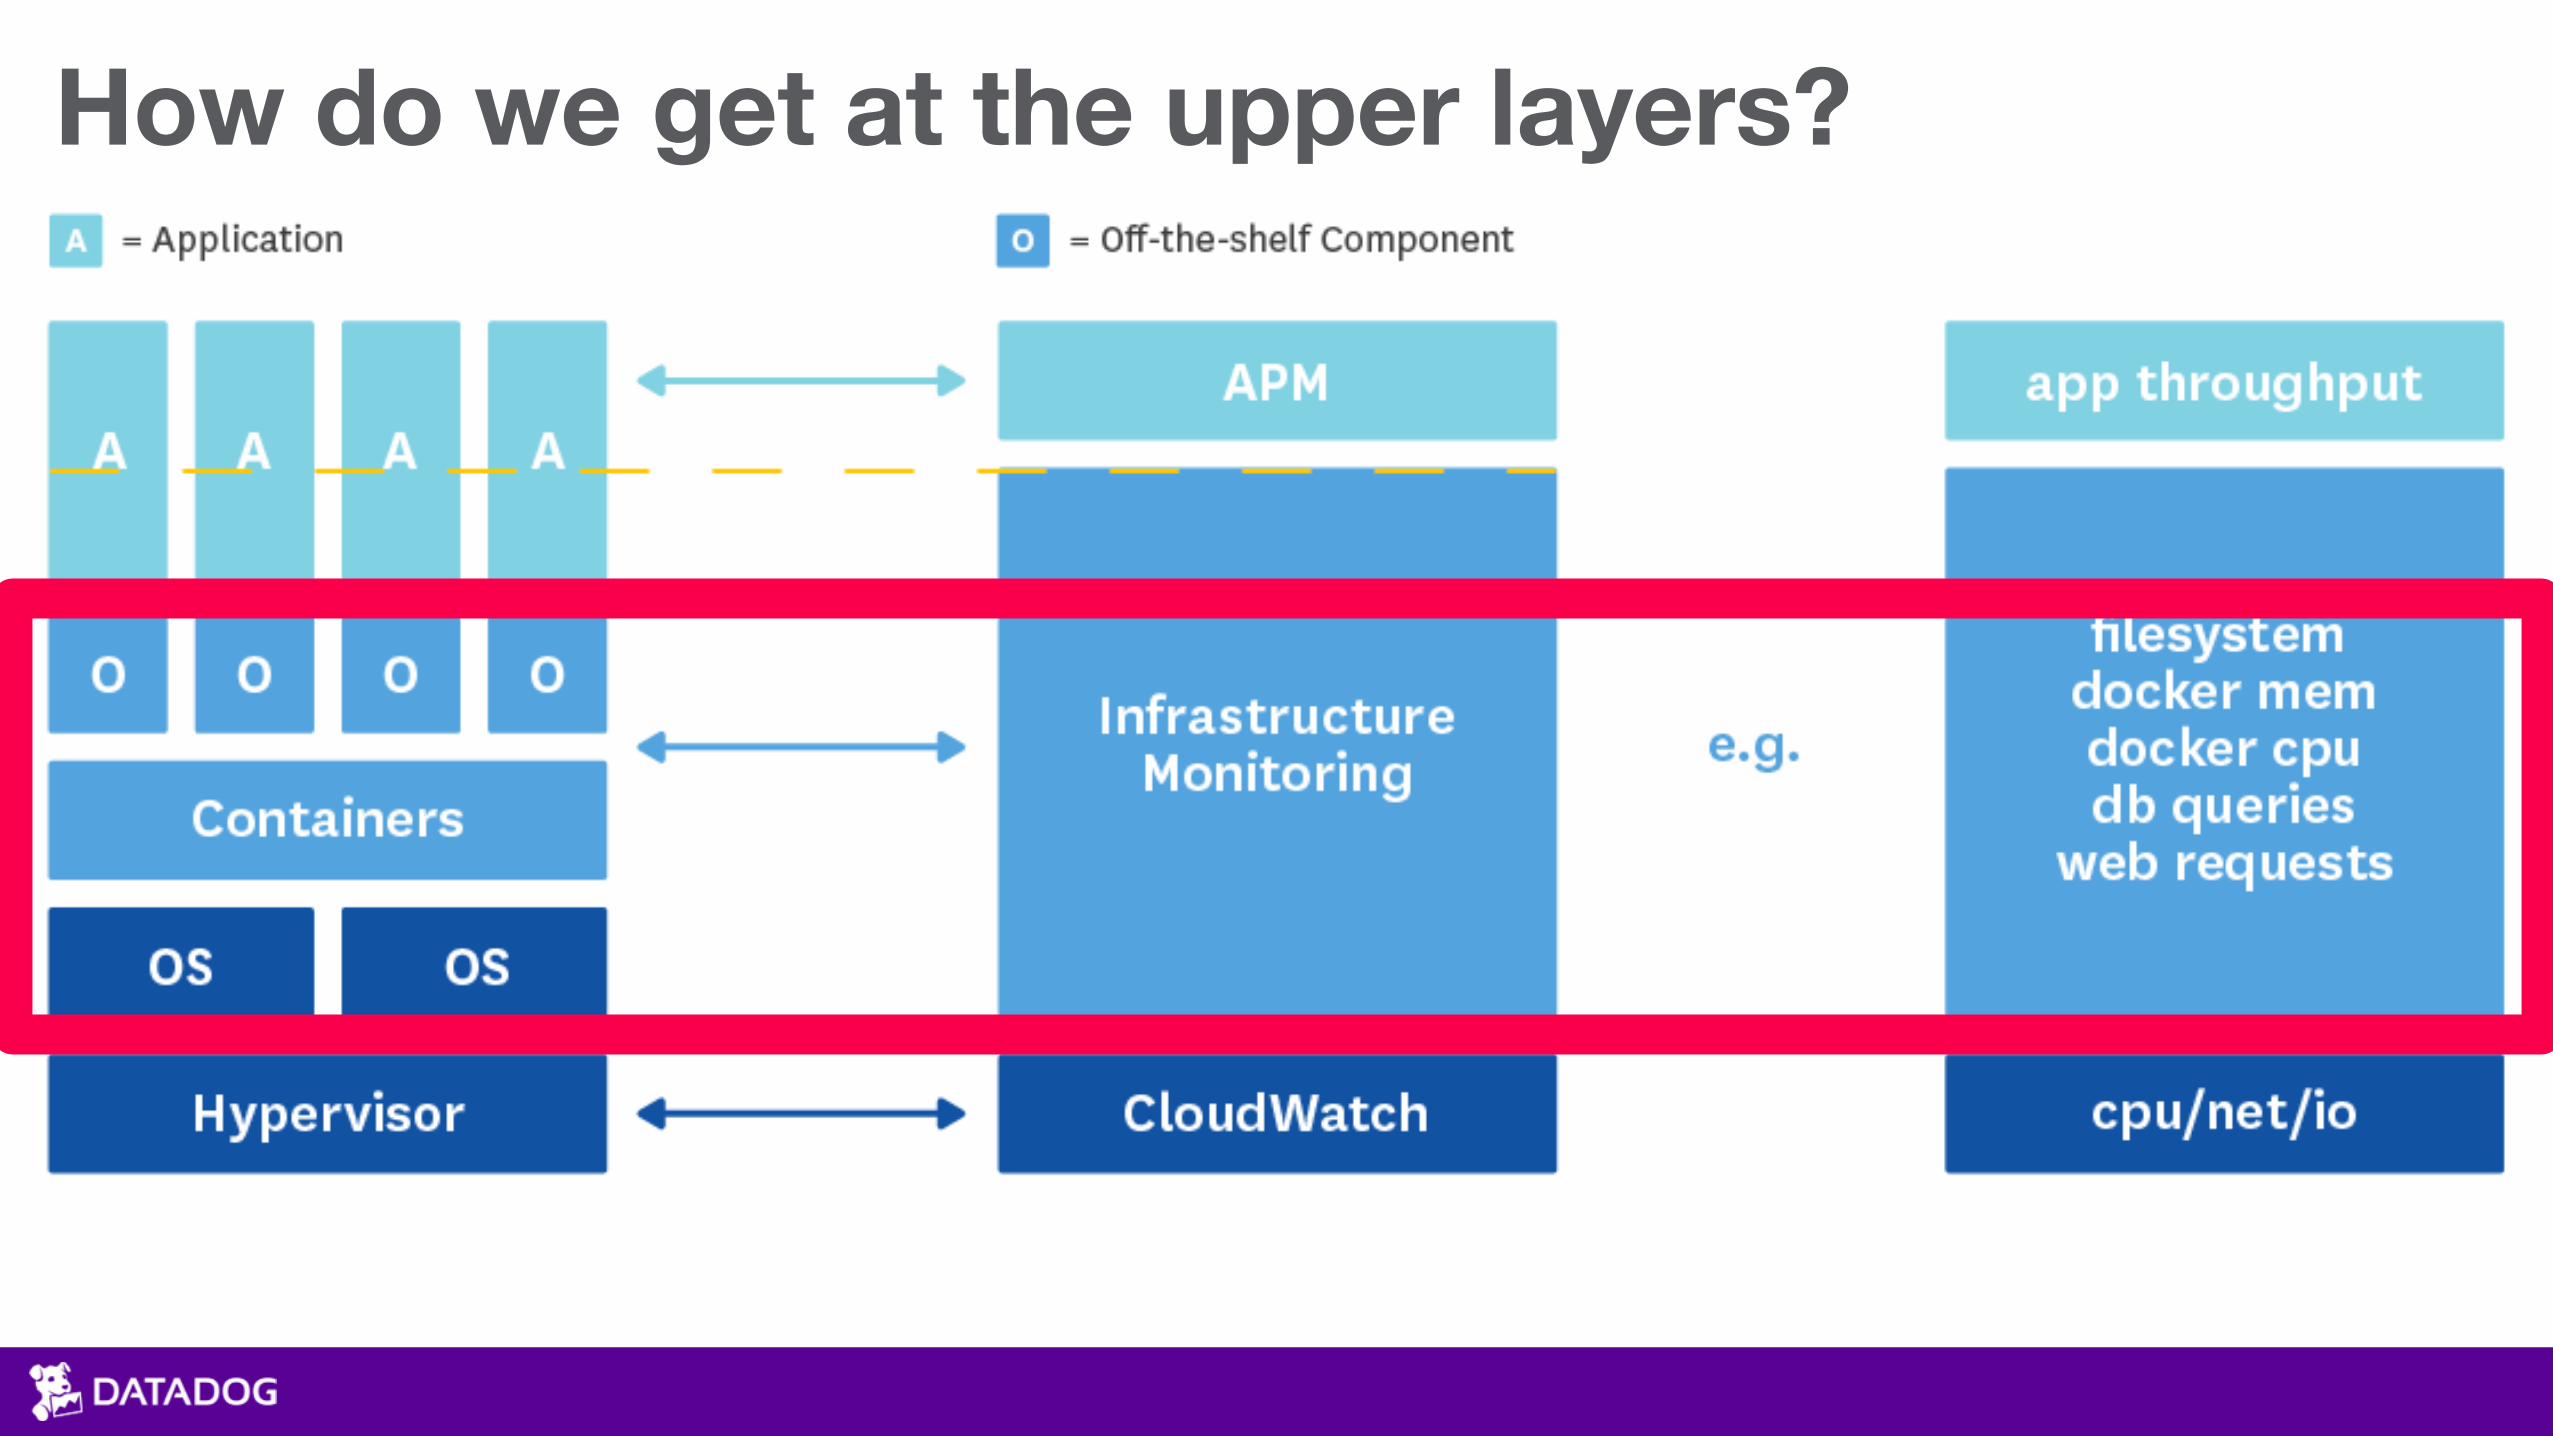
How do we get at the upper layers?

Getting at the Metrics
CPU METRICS MEMORY METRICS I/O METRICS NETWORK METRICS
pseudo-files Yes Yes Some Yes, in 1.6.1+
stats command Basic Basic No Basic
API Yes Yes Some Yes

Pseudo-files
• Provide visibility into container metrics via the file system. • Generally under: /cgroup/<resource>/docker/$CONTAINER_ID/ or /sys/fs/cgroup/<resource>/docker/$CONTAINER_ID/

Pseudo-files: CPU Metrics$ cat /sys/fs/cgroup/cpuacct/docker/$CONTAINER_ID/cpuacct.stat > user 2451 # time spent running processes since boot > system 966 # time spent executing system calls since boot
$ cat /sys/fs/cgroup/cpu/docker/$CONTAINER_ID/cpu.stat > nr_periods 565 # Number of enforcement intervals that have elapsed > nr_throttled 559 # Number of times the group has been throttled > throttled_time 12119585961 # Total time that members of the group were throttled (12.12 seconds)
Pseudo-files: CPU Throttling

Docker API• Detailed streaming metrics as JSON HTTP socket
$ curl -v --unix-socket /var/run/docker.sock http://localhost/containers/28d7a95f468e/stats

STATS Command
# Usage: docker stats CONTAINER [CONTAINER...] $ docker stats $CONTAINER_ID CONTAINER CPU % MEM USAGE/LIMIT MEM % NET I/O BLOCK I/O ecb37227ac84 0.12% 71.53 MiB/490 MiB 14.60% 900.2 MB/275.5 MB 266.8 MB/872.7 MB
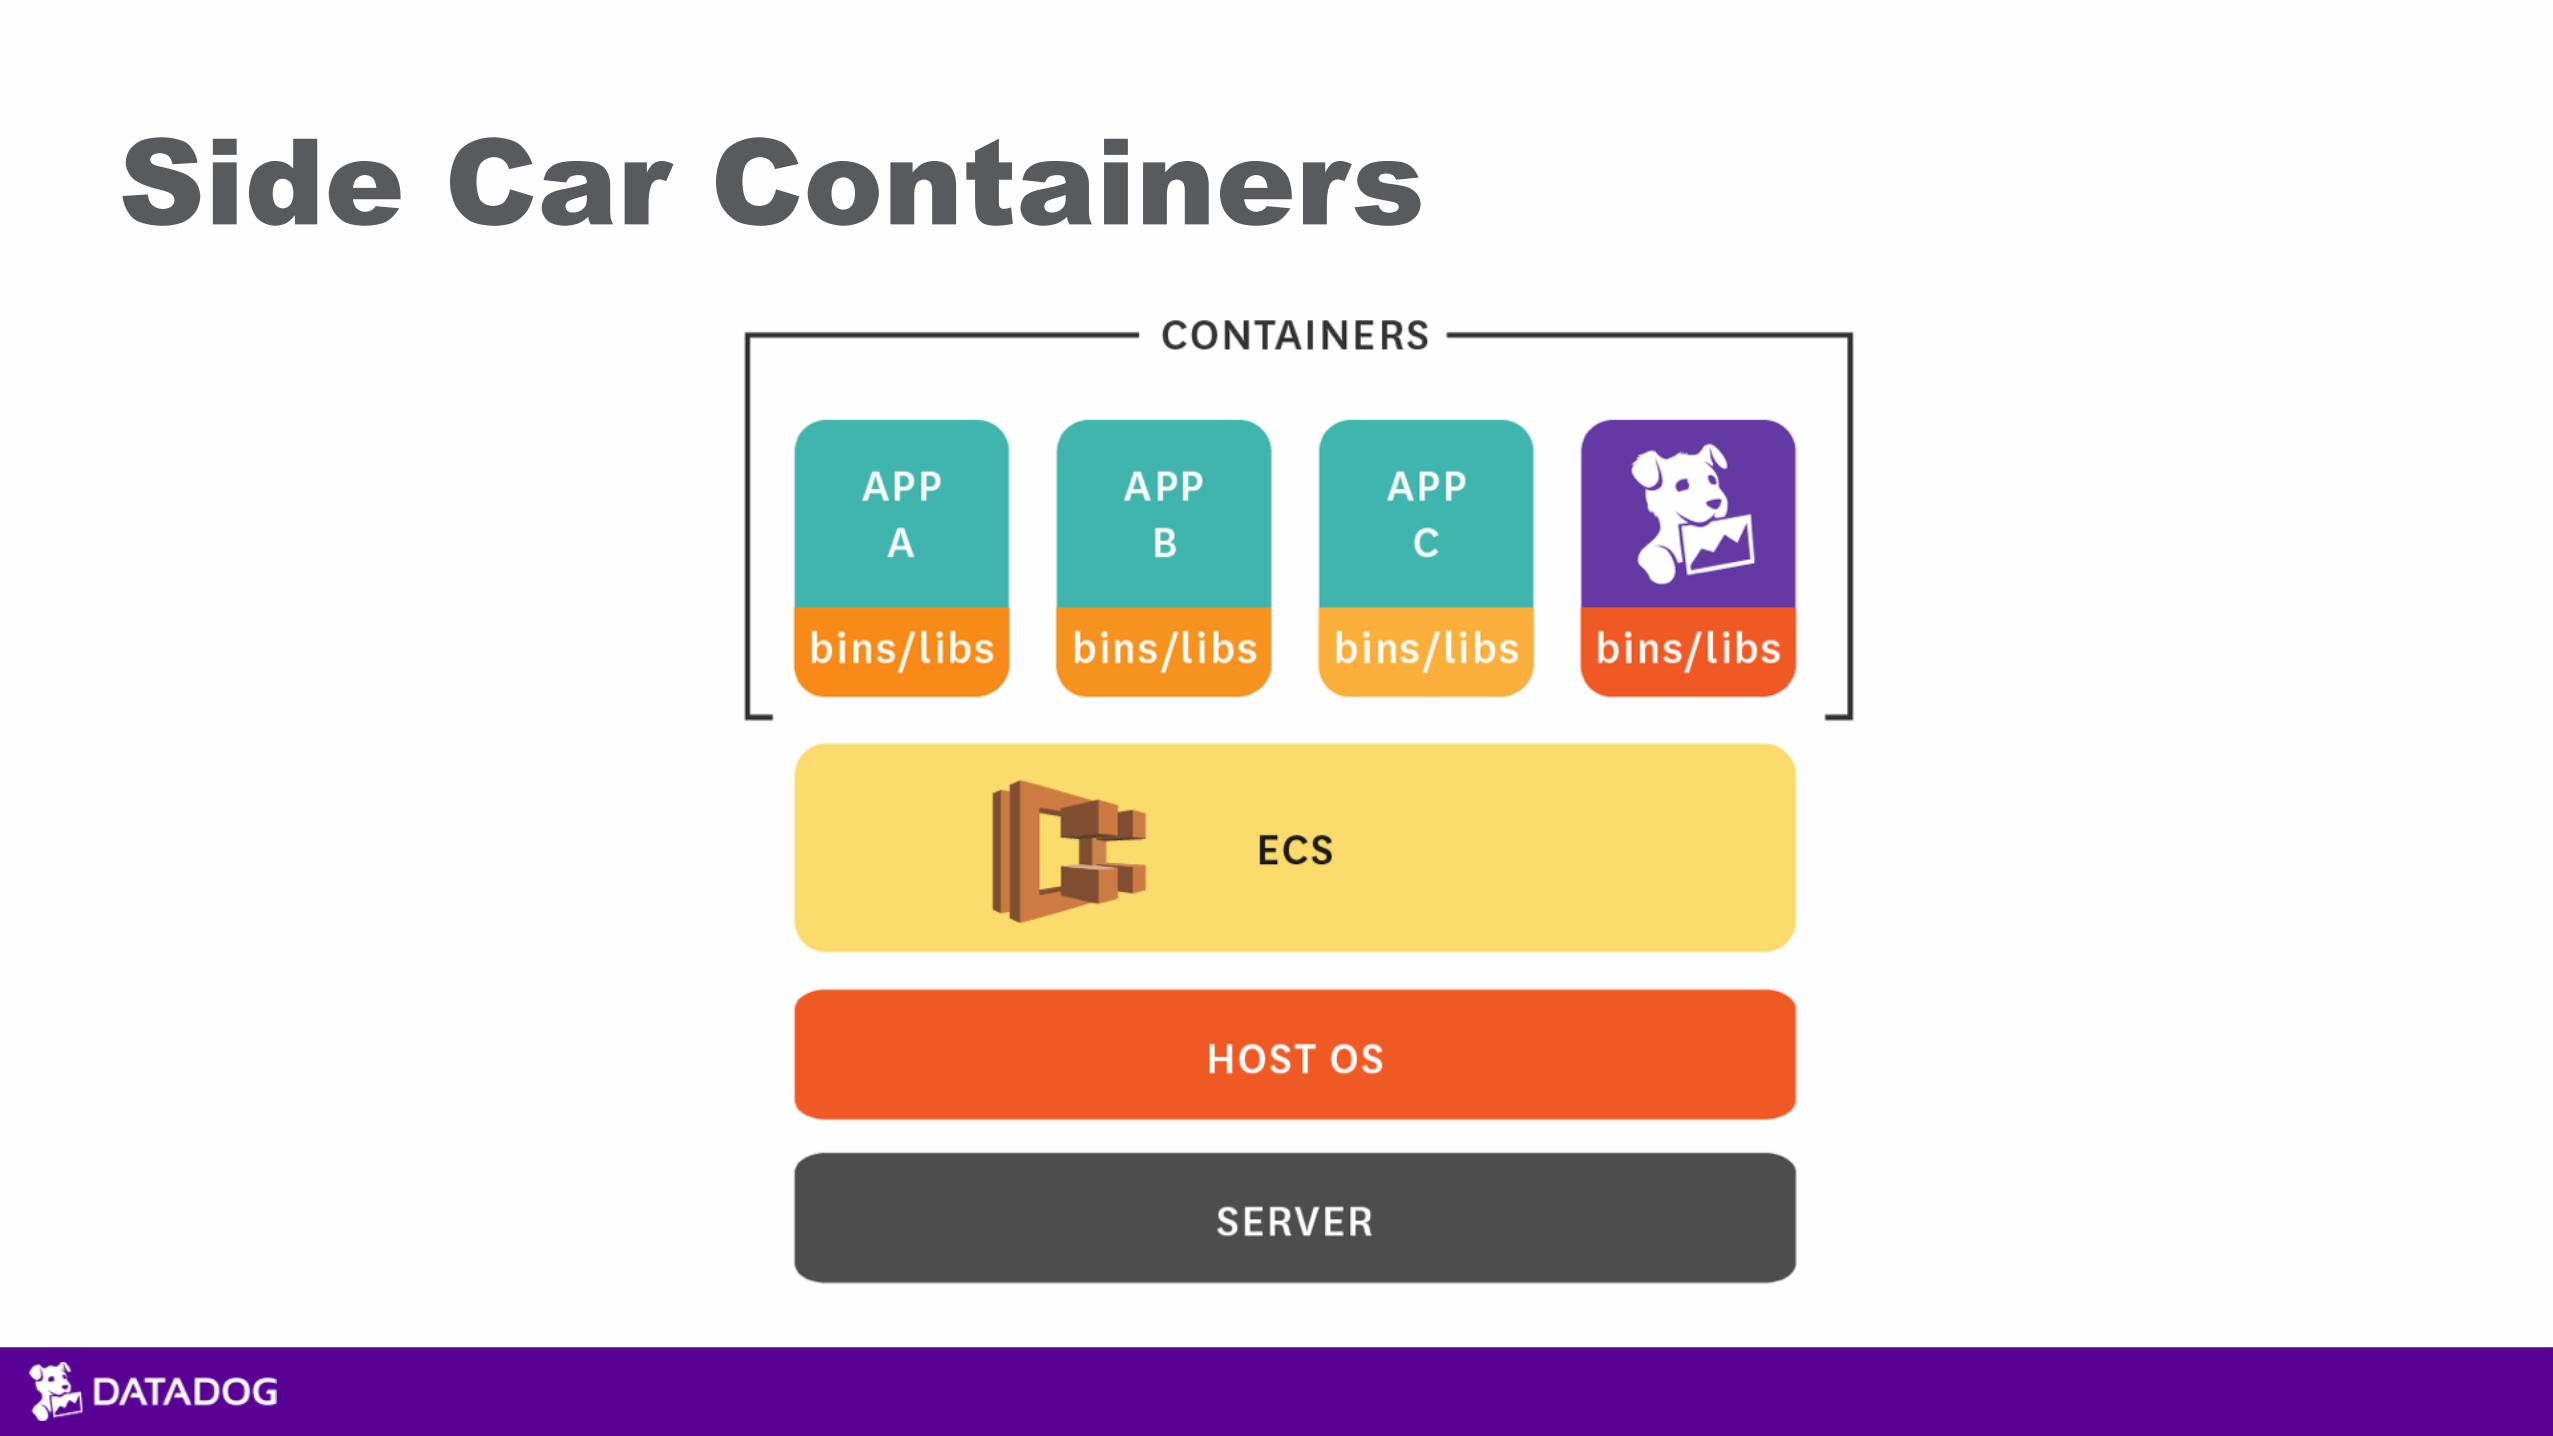
Side Car Containers

Agents and Daemons
• Ideally we’d want to schedule an agent or daemon on each node via ECS Tasks.
• Current Work Arounds: 1. Bake it into your image. 2. Install on each host at provision time. 3. Automate with User Scripts and Launch Configs

Grant Privileges via IAM$ aws iam create-role \ --role-name ecs-monitoring \ --assume-role-policy-document file://trust.policy
$ aws iam put-role-policy --role-name ecs-monitoring --policy-name ecs-monitoring-policy --policy-document file://ecs.policy
$ aws iam create-instance-profile --instance-profile-name ECSNode
$ aws iam add-role-to-instance-profile \ --instance-profile-name ECSNode \ --role-name ecs-monitoring

Create A User Script
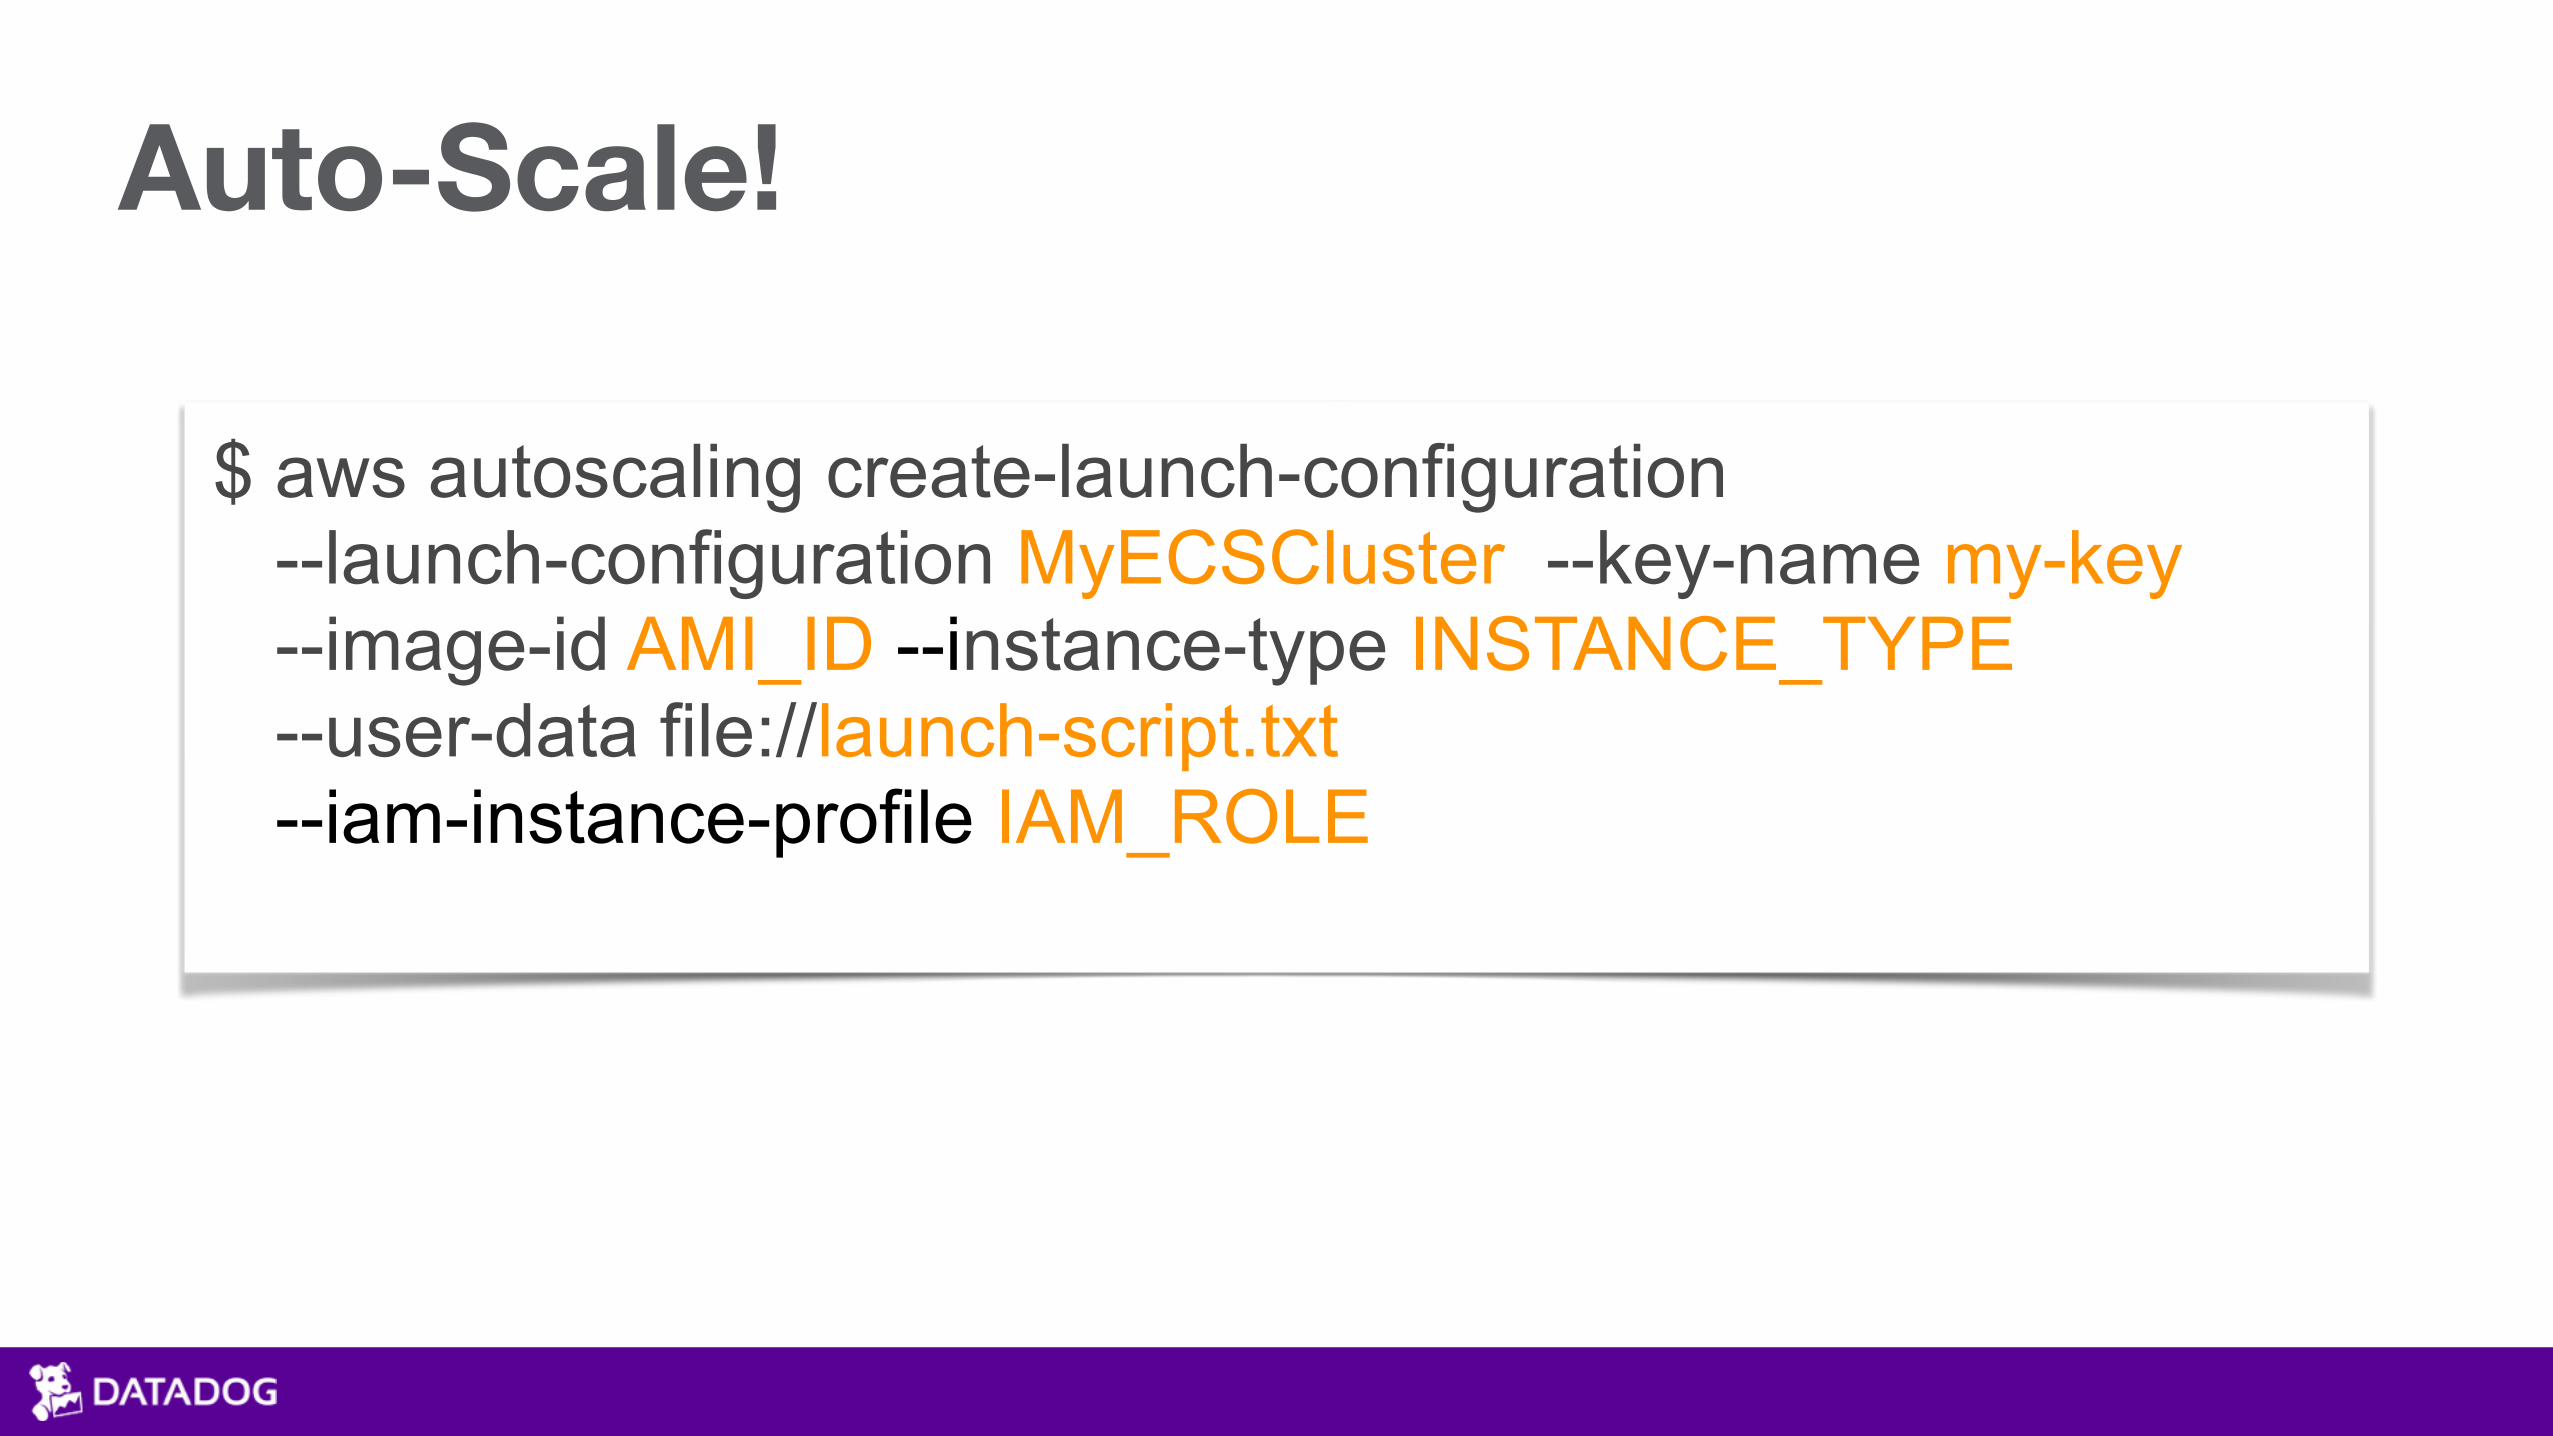
Auto-Scale!
$ aws autoscaling create-launch-configuration --launch-configuration MyECSCluster --key-name my-key --image-id AMI_ID --instance-type INSTANCE_TYPE --user-data file://launch-script.txt --iam-instance-profile IAM_ROLE
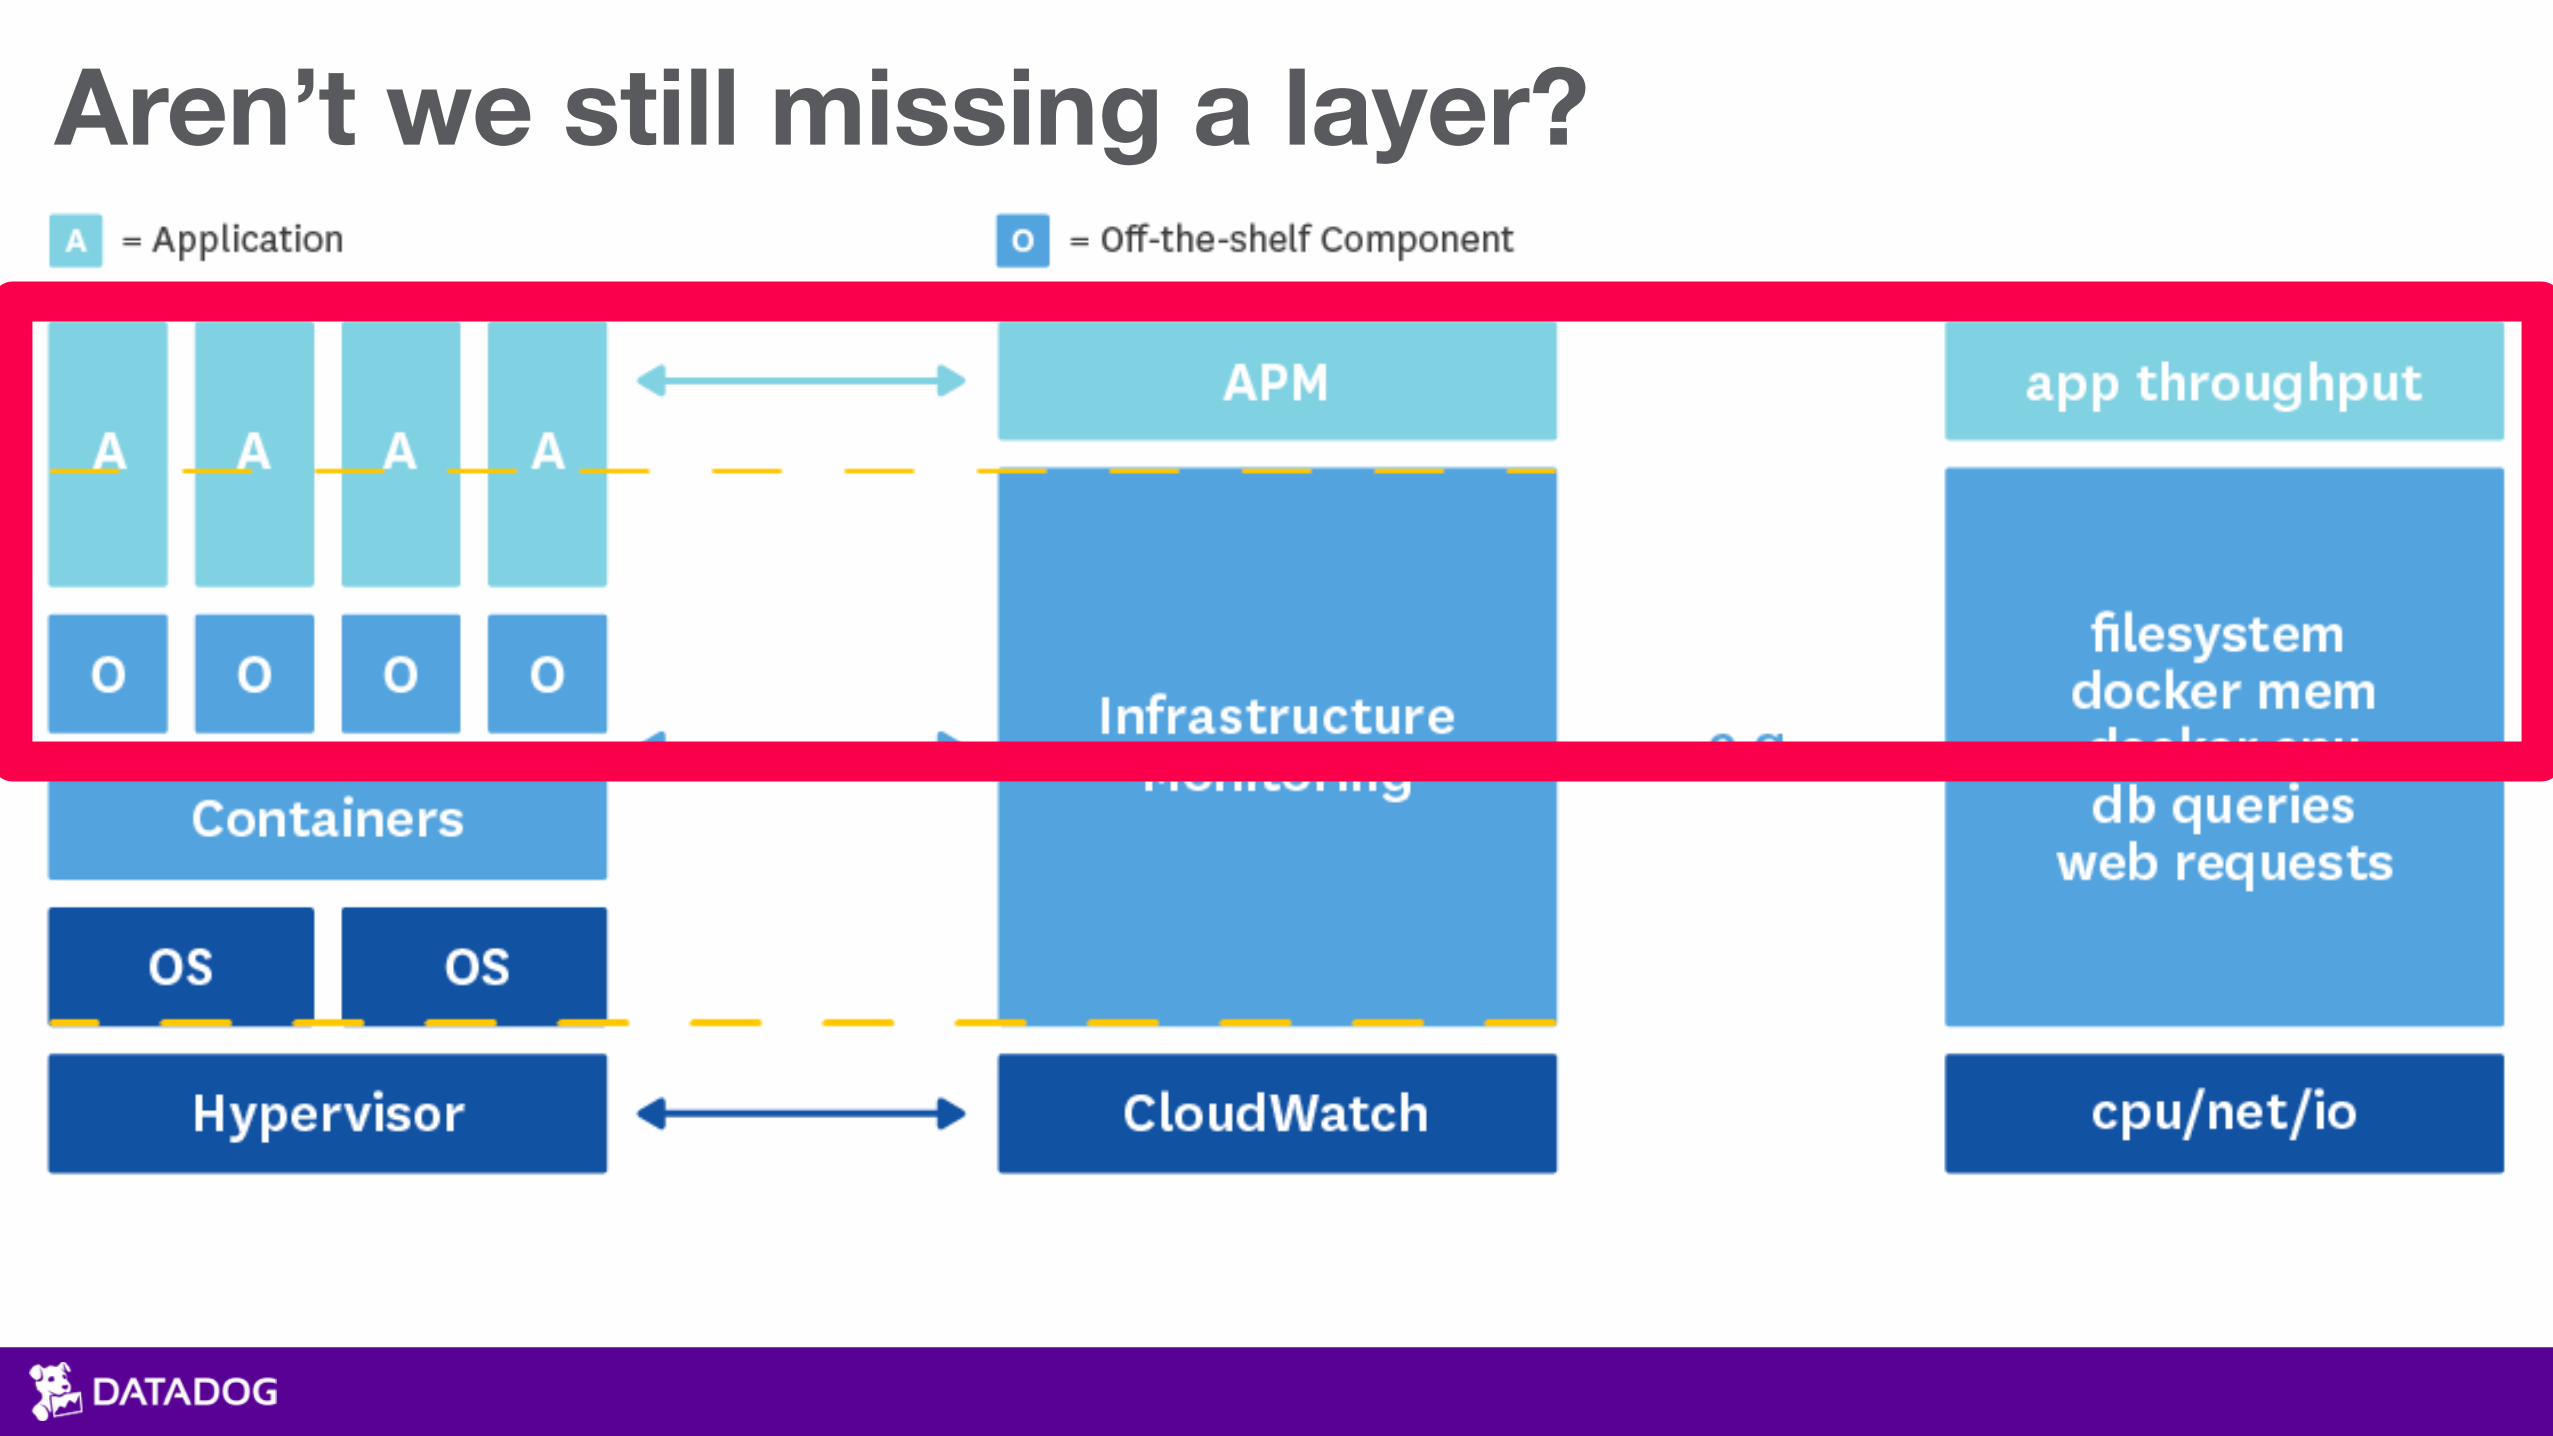
Aren’t we still missing a layer?
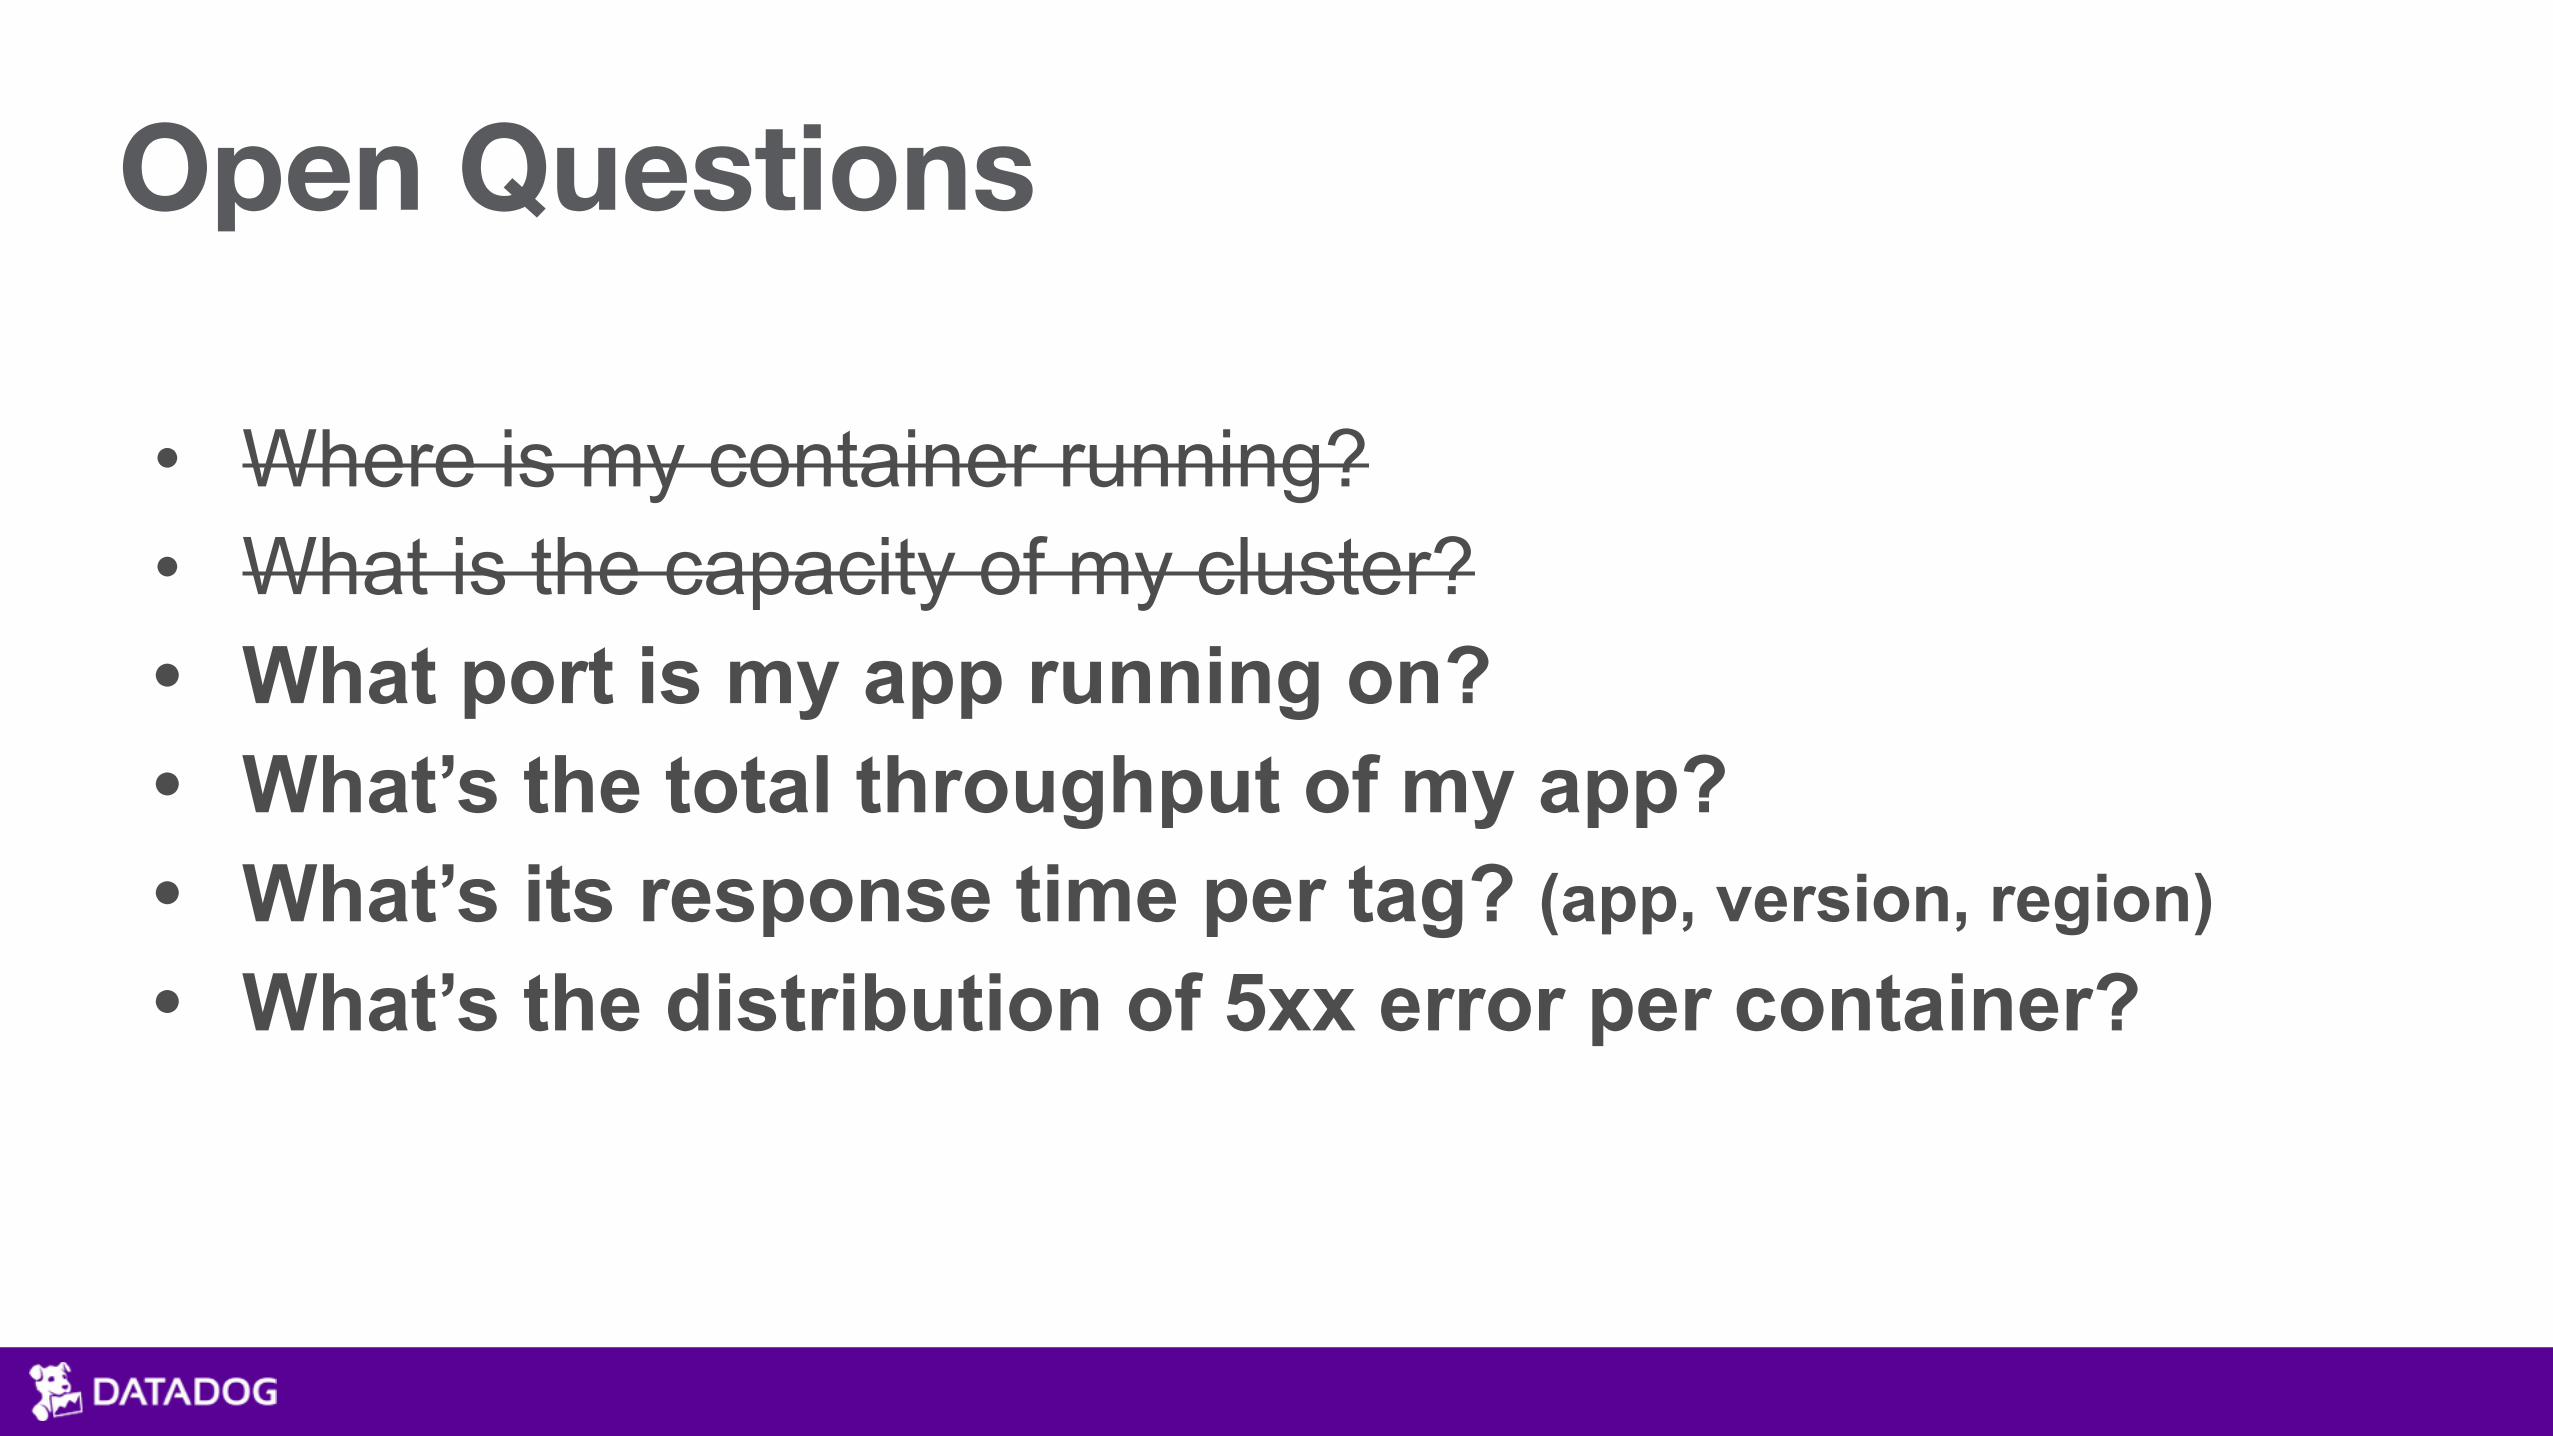
Open Questions
• Where is my container running? • What is the capacity of my cluster? • What port is my app running on? • What’s the total throughput of my app? • What’s its response time per tag? (app, version, region) • What’s the distribution of 5xx error per container?

Service Discovery
Docker API ECS & CloudWatch
Monitoring Agent Container
A O A O
Containers List & Metadata
Additional Metadata (Tags, etc)
Config Backend Integration Configurations
Host Level Metrics
Custom Metrics
• Instrument custom applications
• You know your key transactions best.
• Use async protocols like Etys’ STATSD

Thank You