monitoring dissolved organic carbon in surface and drinking waters
TRANSCRIPT
Monitoring dissolved organic carbon in surface and drinking waters
Christian Volk,*a Larry Wood,a Bruce Johnson,a Jeff Robinson,b Hai Wei Zhuc and
Louis Kapland
aIndiana-American Water Company Inc., PO Box 1152, Muncie, IN 47308-1152, USA.E-mail: [email protected]; Fax: 765-741-1258; Tel: 765-741-1274
bIndiana-American Water Company Inc., PO Box 570, Greenwood, IN 46142, USAcSievers Instruments Inc., 6060 Spine Rd., Boulder, CO 80301, USAdStroud Water Research Center, 970 Spencer Rd., Avondale, PA 19311, USA
Received 28th August 2001, Accepted 12th December 2001First published as an Advance Article on the web 14th January 2002
The presence of natural organic matter (NOM) strongly impacts drinking water treatment, water quality, and
water behavior during distribution. Dissolved organic carbon (DOC) concentrations were determined daily over
a 22 month period in river water before and after conventional drinking water treatment using an on-line total
organic carbon (TOC) analyzer. Quantitative and qualitative variations in organic matter were related to
precipitation and runoff, seasons and operating conditions. Following a rainfall event, DOC levels could
increase by 3.5 fold over baseflow concentrations, while color, UV absorbance values and turbidity increased
by a factor of 8, 12 and 300, respectively. Treated water DOC levels were closely related to the source water
quality, with an average organic matter removal of 42% after treatment.
Introduction
Natural organic matter (NOM) in surface waters can be at theorigin of various problems in drinking water. Organic materialcan be responsible for water taste, odor and color. Organiccompounds also lead to the formation of disinfection by-products (DBPs) after reacting with disinfectants during watertreatment. NOM can be related to bacterial proliferationwithin distribution systems. Therefore, the control of organicmatter has been recognized as an important part of theoperation of drinking water plants and distribution systems.Organic material can originate from various sources. The
fraction of organic matter that derives from the biota growingin the water bodies is classified as internal or autochthonousNOM. This source of organic matter is due to the excretion anddecay of organisms including bacteria, algae and vascularplants. The external organic matter (allochthonous) enters thewater stream from the watershed, and originates fromdegradation of terrestrial vegetation and soil leaching duringrunoff.1,2 Chemical characterization of organic matter is alsocomplex. To date, it has not been possible to identify allorganic molecules in water. The difficulty of this approachresults from the great complexity of the organic matrix,constituted by a mixture of hundreds of simple molecules orhetero-polymers, and the very low concentration of thesecompounds. Consequently, organic matter characterization isonly possible through various fractionation and measurementtechniques that give partial information on organic matterlevels, and chemical functions or molecules, depending on themethodology used.3,4
Surrogate parameters such as total organic carbon (TOC) ordissolved organic carbon (DOC) provide an indication of thetotal organic matter concentration. TOC analyzers measure thelevel of organic carbon amenable to oxidation to CO2 using acombination of oxidizing agents (persulfate), and UV light orhigh temperature. The amount of carbon dioxide (CO2)produced can be measured using non-dispersive infraredabsorption or conductivity. Since most waters contain carbon-ates and bicarbonates, the concentrations of those inorganiccompounds are either measured or the samples are acidified
and purged with an inert gas to remove the inorganiccarbon (IC), prior to determination of TOC. Organic matterlevels in fresh waters typically range from 0.1 mg L21 to10–20 mg L21.5,6
Moreover, the composition and structure of the organicmatter, the presence of specific polymers or chemical functions,and the apparent molecular weight of organic compounds canbe determined using sophisticated testing including elementalanalysis, spectrophotometric measurement, HPLC, pyrolysisGC-MS, NMR, ultra-filtration, or resin fractionation.4 TheNOM generally includes humic substances (humic and fulvicacids), and non-humic materials including hydrophilic acids,amino-acids, proteins, carbohydrates, carboxylic acids andother trace compounds.2,4,7–9
A variety of treatment processes can be used to controlorganic matter in drinking water. Removal of organic mattervaries widely, and generally between 10 and 90%.10 The degreeof organic carbon removal depends on several parameters suchas the quality and quantity of organic materials in the sourcewater, the treatment train design and operational conditions.In general, organic matter levels are reduced after settling,adsorption, granular activated carbon (GAC) filtration ormembrane processes. Oxidation processes with ozone orchlorine lead to the formation of biodegradable compounds.11
Water utilities have to comply with increasingly stringentregulations on disinfection by-products and water quality. TheUS Environmental Protection Agency (US EPA) promulgatednew rules aimed at reducing the levels of DBPs in drinkingwater.12 The rule also includes monitoring the levels of NOMduring treatment and in the finished water by measurement ofTOC.12,13 Reducing the level of organic matter duringtreatment may be an effective approach to improving wateraesthetic, and controlling bacterial water quality without theuse of excessive levels of disinfectants or the formation ofdisinfectant by-products. An effective NOM control programrelies upon a good understanding of the origin, occurrence andfluctuation of the organic matter in source water. Some studiesdescribed seasonal changes in organic matter level, using a wideincrement of time between sampling campaigns (weekly ormonthly monitoring).2,11,14,15 However, no studies have
DOI: 10.1039/b107768f J. Environ. Monit., 2002, 4, 43–47 43
This journal is # The Royal Society of Chemistry 2002
Publ
ishe
d on
14
Janu
ary
2002
. Dow
nloa
ded
on 2
7/10
/201
4 17
:50:
13.
View Article Online / Journal Homepage / Table of Contents for this issue
reported a daily monitoring of organic matter concentrationsin source and treated waters using an on-line TOC analyzer.This study was designed to monitor DOC concentrations of theriver, settled, filtered and plant effluent waters, and evaluateNOM removal during water treatment. Specific objectives ofthe study were the following: (i) to field test a low maintenanceTOC analyzer, (ii) to examine fluctuations of organic matterlevels over time and determine parameters affecting DOCconcentrations in water, and (iii) to assess organic matterremoval during water treatment.
Material and methods
Source water
The White River in Muncie (Indiana) has a drainage area of241 square miles (625 km2). The bulk of the land in thedrainage basin is in active agricultural use. A few communitiesare located along the White River upstream from the treat-ment facility. The average annual river flow is 130 MGD(5.7 m3 s21). Flow in the river can be augmented by releasingwater from a 7.1 billion gallon reservoir located six milesupstream from the treatment plant. Average annual precipita-tion is approximately 35 inches (890 mm).
Study site
Plant IN610 (Indiana-American Water Company) is aconventional treatment facility that involves pretreatment,coagulation, flocculation, sedimentation, filtration and posttreatment. Pretreatment chemicals included powdered acti-vated carbon (for micro pollutant removal during spring andsummer) and chlorine. Ferric chloride and a cationic polymerwere used for coagulation. The dual media filtration processconsisted of 24 inches of GAC (61 cm) and 6–8 inches(15–20 cm) of sand. The GAC was implemented in March of1997. Then, since spring of 1999, 50% of the GAC has beenreplaced with reactivated/virgin GAC on a yearly basis. Thefiltered water was treated with chlorine and ammonia to formchloramines, fluoride and orthophosphate prior to entering thedistribution system. Plant production averaged 11 MGD(42,000 m3 per day).
TOC Measurement
Organic matter concentrations in the river, settled, filtered andplant effluent waters were measured on a daily basis using aportable TOC analyzer (Sievers Model 800, Ionics-SieversInstruments, Inc., Boulder, CO). The device uses a combina-tion of UV/persulfate oxidation of organics to form CO2, and apermeation/conductivity detection method. Inorganic carbon(IC) was converted to CO2 after addition of phosphoric acid.IC was then removed by separating the CO2 from the samplethrough a gas permeable membrane using vacuum. The TOCanalyzer included a 60 micron prefilter. Monitoring wasconducted from August 28, 1998 to June 13, 2000. The TOCanalyzer was used in the grab sample mode at the beginning ofthe study (August 1998–February 1999). Then, a prototypemulti-stream sampler (Sievers, Model 800/810/820 MS, 4sample streams: river, settled, filtered and finished waters)controlled by the TOC analyzer was used to collect daily valuesof organic matter levels. The software in the TOC analyzer setthe analysis conditions for each stream including samplingorder, flushing time, number of analyses per stream, andreagent flow rates. To avoid plugging the instrument lines,water was filtered upstream of the analyzer through a 3 micronstainless steel membrane with an on-line filtering system(Collins Products Co., Model 9700 filtering system, Living-stone, TX). When using the multi-stream sampler, the TOCanalyzer operated for approximately 5 hours a day to gather
one data set per sample stream. Results were expressed as mg ofDOC per liter.
Other parameters
Absorbance UV at 254 nm (UV254, in cm21), true color(Platinum-Cobalt color units) (Hach spectrophotometer,model DR 4000, Hach Company, Loveland CO), turbidity(NTU),16 river level (feet), precipitation (inches) and otheroperational data were recorded on a daily basis. Specific UVabsorbance (SUVA, in L (mg cm)21) values corresponded tothe ratio between UV absorbance at 254 nm and DOC level(SUVA ~ UV Abs.(cm21) 6 100/DOC(mg L21)).
Data analysis
Data were analyzed using a spreadsheet program (Lotus 123,Lotus Development Corp., Cambridge MA) a graphingprogram (Harvard Graphics, Software Publishing Corp.,Santa Clara, CA), and a statistical analysis program (Stat-graphics, STSC, Rockville, MD).
Results and discussion
This section presents the equipment performance, anddescribes variations in river water quality and impacts ontreated water. A total of 546 samples were obtained from theWhite River. Table 1 shows averages and ranges for thedifferent water quality parameters. DOC concentrations inthe White River ranged from 2.15 to 11.90 mg L21, with anaverage of 4.00 mg L21. Specific UV absorbance valuesaveraged 2.81 L (mg cm)21 (range 1.40–10.5). SUVA valueswere generally low (v3 L (mg cm)21), indicating a low contentof humic substances in the raw water.
Analyzer performance
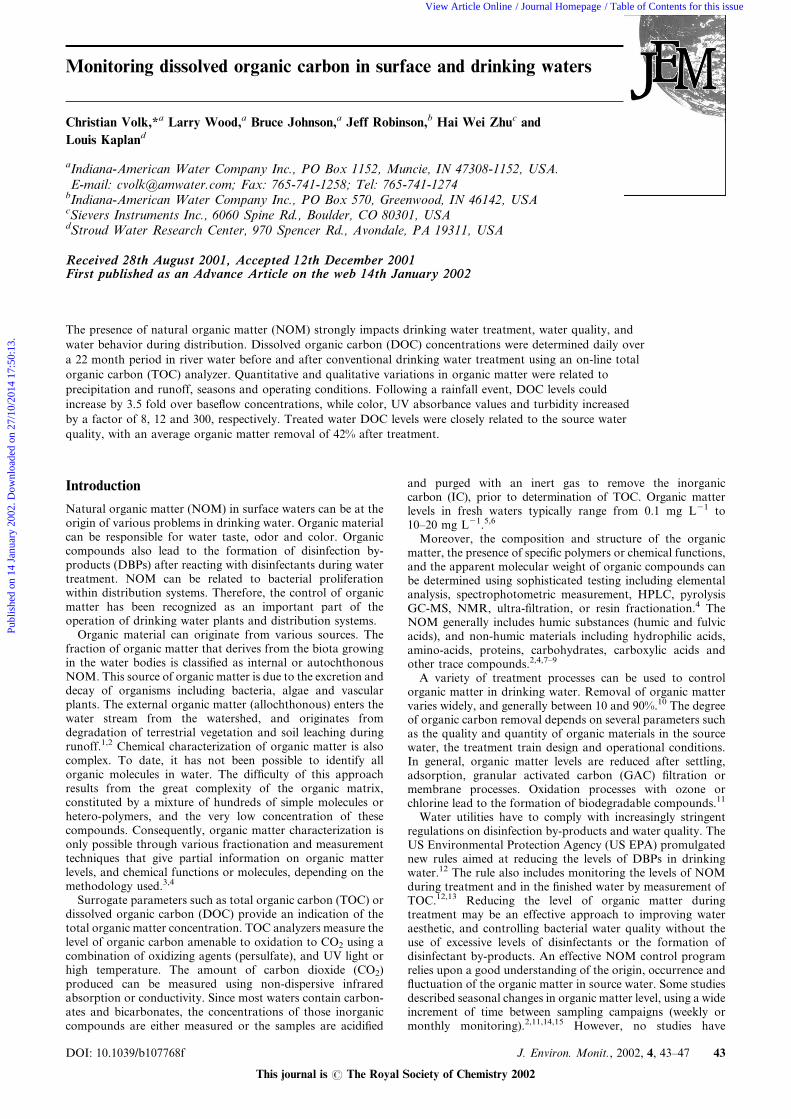
Because of limited laboratory space and personnel, it is criticalthat the water utilities avail themselves of reliable, compact,easy to use and low maintenance equipment. The operation ofanalytical equipment such as TOC analyzers can becometedious and time consuming, when frequent maintenance isrequired. A total of 2,200 DOC values were collected over a22 month period, representing over 10,100 TOC analyses. Noproblems occurred during the sampling period, and the Sieversinstrument was very reliable. Routine maintenance includedchanging reagent cartridges (acid and persulfate every 3months), UV lamp (every 6 months), and prefilter (every 6weeks). Analyzer calibration was periodically checked through-out the study using a potassium hydrogen phthalate (KHP)solution at 2.5 mg C L21. Fig. 1 indicates no shift in theinstrument calibration over time. Overall, DOC concentrationsof 2.5 mg L21 KHP standard solutions averaged 2.51 mg L21
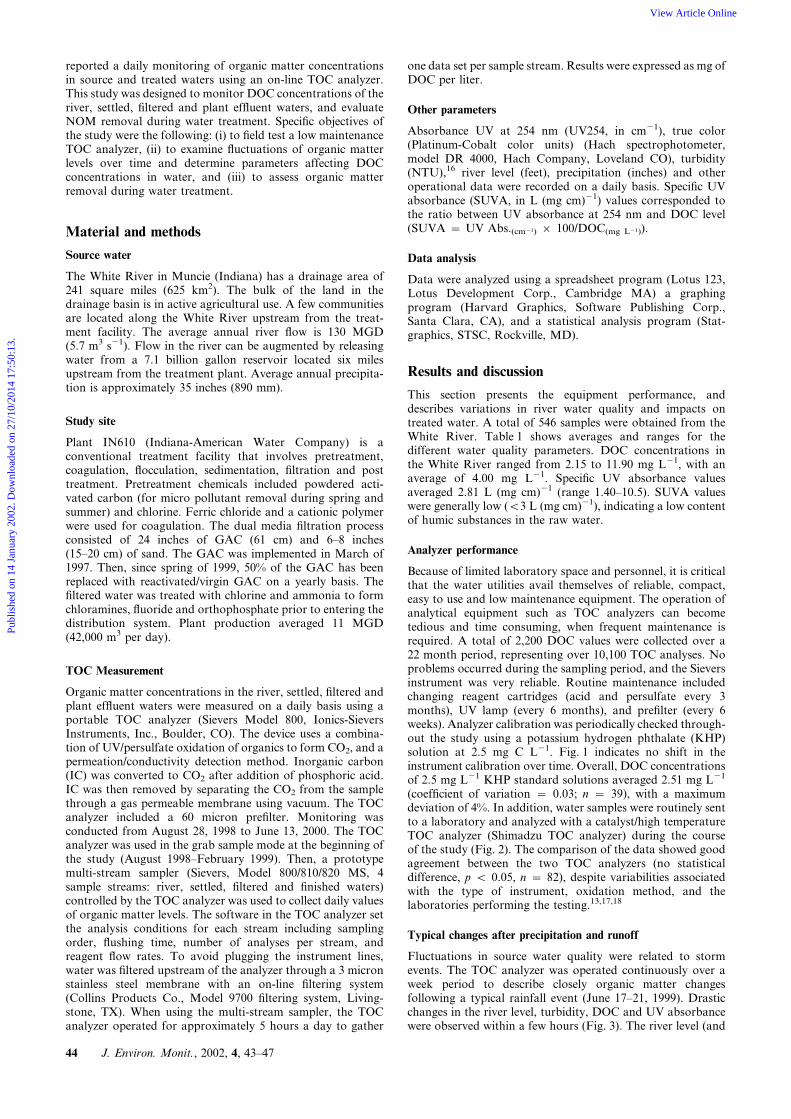
(coefficient of variation ~ 0.03; n ~ 39), with a maximumdeviation of 4%. In addition, water samples were routinely sentto a laboratory and analyzed with a catalyst/high temperatureTOC analyzer (Shimadzu TOC analyzer) during the courseof the study (Fig. 2). The comparison of the data showed goodagreement between the two TOC analyzers (no statisticaldifference, p v 0.05, n ~ 82), despite variabilities associatedwith the type of instrument, oxidation method, and thelaboratories performing the testing.13,17,18
Typical changes after precipitation and runoff
Fluctuations in source water quality were related to stormevents. The TOC analyzer was operated continuously over aweek period to describe closely organic matter changesfollowing a typical rainfall event (June 17–21, 1999). Drasticchanges in the river level, turbidity, DOC and UV absorbancewere observed within a few hours (Fig. 3). The river level (and
44 J. Environ. Monit., 2002, 4, 43–47
Publ
ishe
d on
14
Janu
ary
2002
. Dow
nloa
ded
on 2
7/10
/201
4 17
:50:
13.
View Article Online
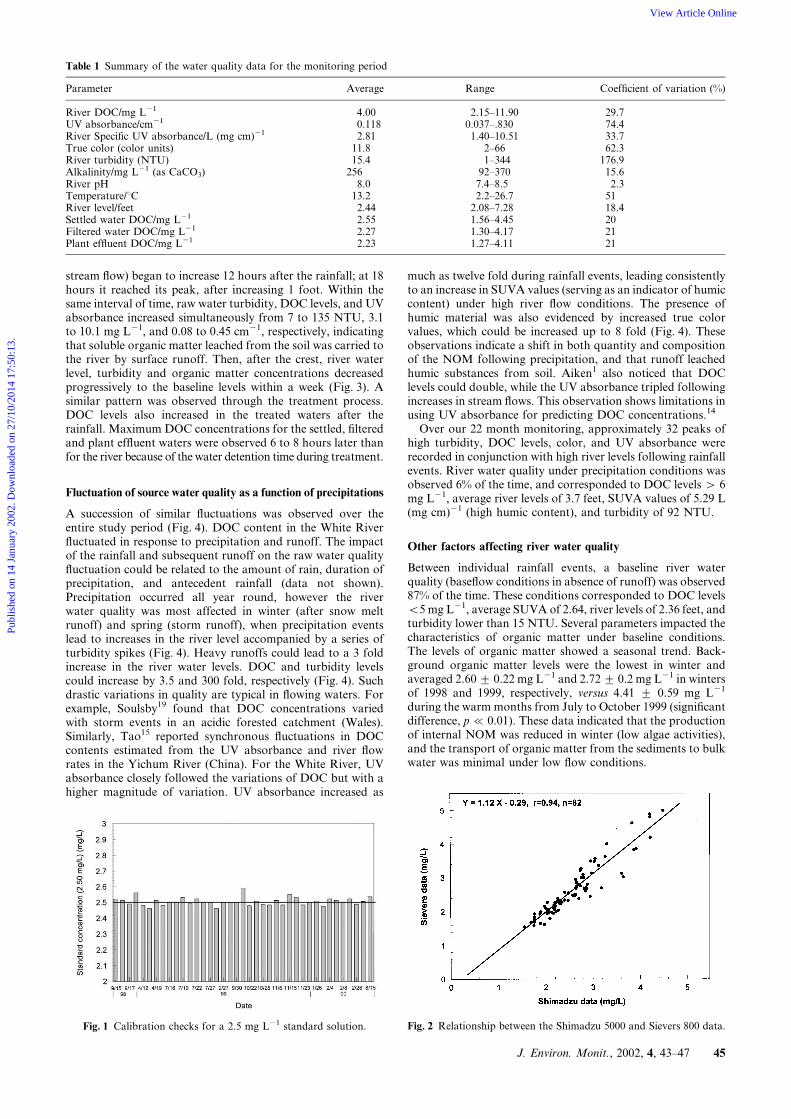
stream flow) began to increase 12 hours after the rainfall; at 18hours it reached its peak, after increasing 1 foot. Within thesame interval of time, raw water turbidity, DOC levels, and UVabsorbance increased simultaneously from 7 to 135 NTU, 3.1to 10.1 mg L21, and 0.08 to 0.45 cm21, respectively, indicatingthat soluble organic matter leached from the soil was carried tothe river by surface runoff. Then, after the crest, river waterlevel, turbidity and organic matter concentrations decreasedprogressively to the baseline levels within a week (Fig. 3). Asimilar pattern was observed through the treatment process.DOC levels also increased in the treated waters after therainfall. Maximum DOC concentrations for the settled, filteredand plant effluent waters were observed 6 to 8 hours later thanfor the river because of the water detention time during treatment.
Fluctuation of source water quality as a function of precipitations
A succession of similar fluctuations was observed over theentire study period (Fig. 4). DOC content in the White Riverfluctuated in response to precipitation and runoff. The impactof the rainfall and subsequent runoff on the raw water qualityfluctuation could be related to the amount of rain, duration ofprecipitation, and antecedent rainfall (data not shown).Precipitation occurred all year round, however the riverwater quality was most affected in winter (after snow meltrunoff) and spring (storm runoff), when precipitation eventslead to increases in the river level accompanied by a series ofturbidity spikes (Fig. 4). Heavy runoffs could lead to a 3 foldincrease in the river water levels. DOC and turbidity levelscould increase by 3.5 and 300 fold, respectively (Fig. 4). Suchdrastic variations in quality are typical in flowing waters. Forexample, Soulsby19 found that DOC concentrations variedwith storm events in an acidic forested catchment (Wales).Similarly, Tao15 reported synchronous fluctuations in DOCcontents estimated from the UV absorbance and river flowrates in the Yichum River (China). For the White River, UVabsorbance closely followed the variations of DOC but with ahigher magnitude of variation. UV absorbance increased as
much as twelve fold during rainfall events, leading consistentlyto an increase in SUVA values (serving as an indicator of humiccontent) under high river flow conditions. The presence ofhumic material was also evidenced by increased true colorvalues, which could be increased up to 8 fold (Fig. 4). Theseobservations indicate a shift in both quantity and compositionof the NOM following precipitation, and that runoff leachedhumic substances from soil. Aiken1 also noticed that DOClevels could double, while the UV absorbance tripled followingincreases in stream flows. This observation shows limitations inusing UV absorbance for predicting DOC concentrations.14
Over our 22 month monitoring, approximately 32 peaks ofhigh turbidity, DOC levels, color, and UV absorbance wererecorded in conjunction with high river levels following rainfallevents. River water quality under precipitation conditions wasobserved 6% of the time, and corresponded to DOC levels w 6mg L21, average river levels of 3.7 feet, SUVA values of 5.29 L(mg cm)21 (high humic content), and turbidity of 92 NTU.
Other factors affecting river water quality
Between individual rainfall events, a baseline river waterquality (baseflow conditions in absence of runoff) was observed87% of the time. These conditions corresponded to DOC levelsv5 mg L21, average SUVA of 2.64, river levels of 2.36 feet, andturbidity lower than 15 NTU. Several parameters impacted thecharacteristics of organic matter under baseline conditions.The levels of organic matter showed a seasonal trend. Back-ground organic matter levels were the lowest in winter andaveraged 2.60¡ 0.22 mg L21 and 2.72¡ 0.2 mg L21 in wintersof 1998 and 1999, respectively, versus 4.41 ¡ 0.59 mg L21
during the warm months from July to October 1999 (significantdifference, p % 0.01). These data indicated that the productionof internal NOM was reduced in winter (low algae activities),and the transport of organic matter from the sediments to bulkwater was minimal under low flow conditions.
Table 1 Summary of the water quality data for the monitoring period
Parameter Average Range Coefficient of variation (%)
River DOC/mg L21 4.00 2.15–11.90 29.7UV absorbance/cm21 0.118 0.037–.830 74.4River Specific UV absorbance/L (mg cm)21 2.81 1.40–10.51 33.7True color (color units) 11.8 2–66 62.3River turbidity (NTU) 15.4 1–344 176.9Alkalinity/mg L21 (as CaCO3) 256 92–370 15.6River pH 8.0 7.4–8.5 2.3Temperature/uC 13.2 2.2–26.7 51River level/feet 2.44 2.08–7.28 18.4Settled water DOC/mg L21 2.55 1.56–4.45 20Filtered water DOC/mg L21 2.27 1.30–4.17 21Plant effluent DOC/mg L21 2.23 1.27–4.11 21
Fig. 1 Calibration checks for a 2.5 mg L21 standard solution. Fig. 2 Relationship between the Shimadzu 5000 and Sievers 800 data.
J. Environ. Monit., 2002, 4, 43–47 45
Publ
ishe
d on
14
Janu
ary
2002
. Dow
nloa
ded
on 2
7/10
/201
4 17
:50:
13.
View Article Online
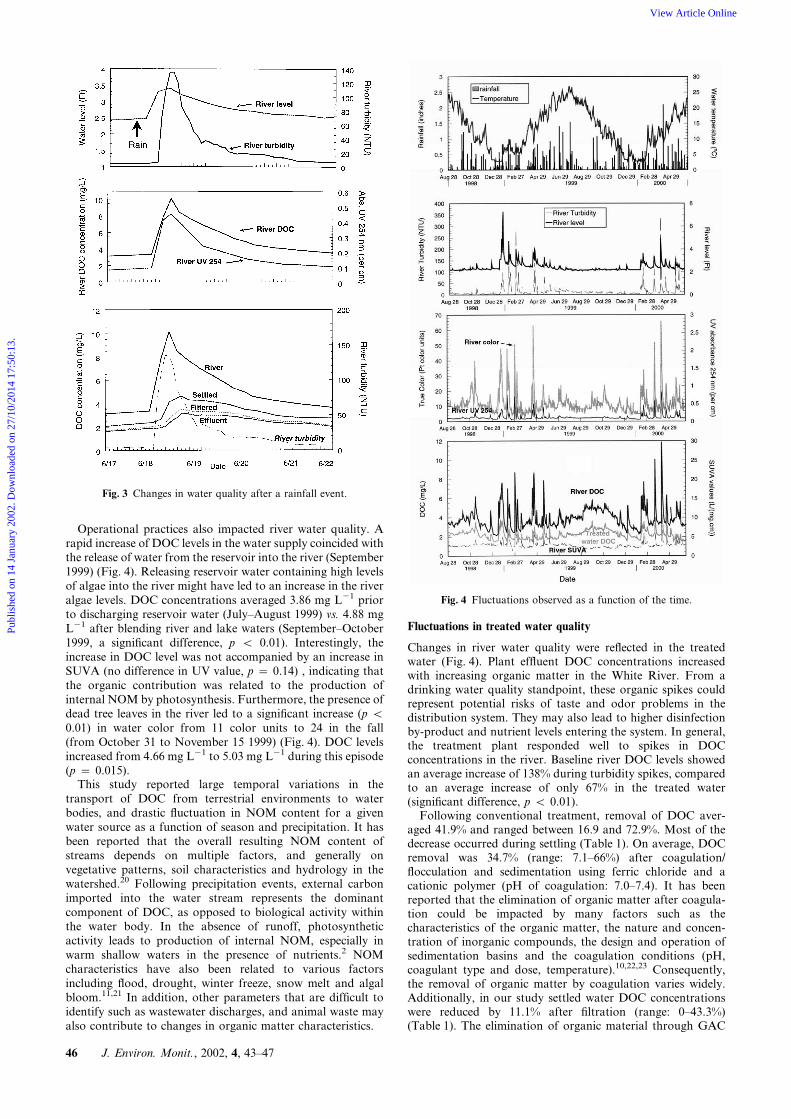
Operational practices also impacted river water quality. Arapid increase of DOC levels in the water supply coincided withthe release of water from the reservoir into the river (September1999) (Fig. 4). Releasing reservoir water containing high levelsof algae into the river might have led to an increase in the riveralgae levels. DOC concentrations averaged 3.86 mg L21 priorto discharging reservoir water (July–August 1999) vs. 4.88 mgL21 after blending river and lake waters (September–October1999, a significant difference, p v 0.01). Interestingly, theincrease in DOC level was not accompanied by an increase inSUVA (no difference in UV value, p ~ 0.14) , indicating thatthe organic contribution was related to the production ofinternal NOM by photosynthesis. Furthermore, the presence ofdead tree leaves in the river led to a significant increase (p v
0.01) in water color from 11 color units to 24 in the fall(from October 31 to November 15 1999) (Fig. 4). DOC levelsincreased from 4.66 mg L21 to 5.03 mg L21 during this episode(p ~ 0.015).This study reported large temporal variations in the
transport of DOC from terrestrial environments to waterbodies, and drastic fluctuation in NOM content for a givenwater source as a function of season and precipitation. It hasbeen reported that the overall resulting NOM content ofstreams depends on multiple factors, and generally onvegetative patterns, soil characteristics and hydrology in thewatershed.20 Following precipitation events, external carbonimported into the water stream represents the dominantcomponent of DOC, as opposed to biological activity withinthe water body. In the absence of runoff, photosyntheticactivity leads to production of internal NOM, especially inwarm shallow waters in the presence of nutrients.2 NOMcharacteristics have also been related to various factorsincluding flood, drought, winter freeze, snow melt and algalbloom.11,21 In addition, other parameters that are difficult toidentify such as wastewater discharges, and animal waste mayalso contribute to changes in organic matter characteristics.
Fluctuations in treated water quality
Changes in river water quality were reflected in the treatedwater (Fig. 4). Plant effluent DOC concentrations increasedwith increasing organic matter in the White River. From adrinking water quality standpoint, these organic spikes couldrepresent potential risks of taste and odor problems in thedistribution system. They may also lead to higher disinfectionby-product and nutrient levels entering the system. In general,the treatment plant responded well to spikes in DOCconcentrations in the river. Baseline river DOC levels showedan average increase of 138% during turbidity spikes, comparedto an average increase of only 67% in the treated water(significant difference, p v 0.01).Following conventional treatment, removal of DOC aver-
aged 41.9% and ranged between 16.9 and 72.9%. Most of thedecrease occurred during settling (Table 1). On average, DOCremoval was 34.7% (range: 7.1–66%) after coagulation/flocculation and sedimentation using ferric chloride and acationic polymer (pH of coagulation: 7.0–7.4). It has beenreported that the elimination of organic matter after coagula-tion could be impacted by many factors such as thecharacteristics of the organic matter, the nature and concen-tration of inorganic compounds, the design and operation ofsedimentation basins and the coagulation conditions (pH,coagulant type and dose, temperature).10,22,23 Consequently,the removal of organic matter by coagulation varies widely.Additionally, in our study settled water DOC concentrationswere reduced by 11.1% after filtration (range: 0–43.3%)(Table 1). The elimination of organic material through GAC
Fig. 3 Changes in water quality after a rainfall event.
Fig. 4 Fluctuations observed as a function of the time.
46 J. Environ. Monit., 2002, 4, 43–47
Publ
ishe
d on
14
Janu
ary
2002
. Dow
nloa
ded
on 2
7/10
/201
4 17
:50:
13.
View Article Online
filtration was related to operational practices, and could beattributed to the combination of adsorption and biodegrada-tion (data not shown). Adsorption occurred mainly afterannual replacement of 50% of the GAC in the Spring (April,1999 and 2000). Since chlorination levels on top of the filterswere v0.2 mg L21, biomass could accumulate on filter mediain the form of a biofilm, leading to the assimilation of bio-degradable materials contained in the water. From the point ofdecreasing the amount of organic matter, these two processesof adsorption and biological filtration differ. Biologicalfiltration eliminates specifically biodegradable compounds,while adsorption retains biodegradable and non biodegradablemolecules.11
Conclusions
This study demonstrated that the Sievers TOC analyzer was areliable and low maintenance instrument. TOC instruments areuseful tools that can be used at water utilities to evaluate sourcewater TOC levels and plant performance. Organic matter levelsin the river and after treatment were closely related to rainfall/runoff events, seasons and operational practices. Water utilitiesshould direct their efforts at reducing the levels of organicsduring drinking water treatment. Reduction in organic carbonlevels will result in long term improvements of water quality(lower DBP levels, better stability of disinfectants, no taste andodor customer complaints, and no bacterial regrowth in thedistribution systems).
Acknowledgement
The authors wish to thank the production and maintenancedepartment personnel and Mark LeChevallier for theirassistance. This project was funded by the Indiana-AmericanWater Company, Inc. (Greenwood, IN) and Ionics–SieversInstruments, Inc. (Boulder, CO).
References
1 G. Aiken, in Proceedings of the Workshop on NOM in DrinkingWater, Chamonix, France, Sep. 19–22, 1993, 37.
2 B. H. Kornegay, K. J. Kornegay and E. Torres, Natural OrganicMatter in Drinking Water: Recommendations to Water Utilities,AWWA Research Foundation, Denver, CO, 2000.
3 J. C. Block and L. Mathieu, Analusis Magazine, 1991, 19(7), 54.4 G. L. Amy, in Proceedings of the Workshop on NOM in Drinking
Water, Chamonix, France, Sep. 19–22, 1993, 19.5 J. Mallevialle, in Proceedings of the Workshop on Natural Organic
Matter, Poitiers, France, Sep. 18–19, 1996, I-1.6 C. J. Volk, in Methods in Enzymology, Microbial growth in
biofilms. ed. R. J. Doyle, Academic Press, New York, NY. 2001,337, 144.
7 E. M. Thurman and R. L. Malcolm, Environ. Sci. Technol., 1981,45, 463.
8 C. J. Volk, C. B. Volk and L. A. Kaplan, Limnol. Oceanogr., 1997,42, 39.
9 J. F. Croue, G. V. Korshin and M. Benjamin, Characterization ofNatural Organic Matter in Drinking Water. AWWA ResearchFoundation, Denver, CO, 2000.
10 J. K Edzwald, in Proc. Am.WaterWorks Assoc. Water Quality andTechnology Conference, San Francisco, CA, Nov. 6–10, 1994,1775.
11 J. C. Joret and M. Prevost, Biodegradable Organic Matter inWaters, personal communication.
12 US EPA, Fed. Regist., 1998, 63(241), 69390.13 E. T. Urbansky, J. Environ. Monit., 2001, 3, 102.14 J. K Edzwald, W. C. Becker and K. L Wattier, J. Am. Water
Works Assoc., 1985, 77(4), 122.15 S. Tao, Water Res., 1998, 32, 2205.16 APHA, AWWA, WEF, Standard Methods for the Examination of
Water and Waste Water,. American Public Health Association,Washington DC, 20th edn., 1998.
17 I. Najm, in Proc. Am. Water Works Assoc. Water Quality andTechnology Conference, New Orleans, LA, Nov. 12–15, 1995, 71.
18 L. A. Kaplan, J. Am. Water Works Assoc., 2000, 92(4), 149.19 C. Soulsby, J. Hydrol., 1995, 170, 159.20 G. Aiken and E. Cotsaris, J. Am.Water Works Assoc., 1995, 87(1),
36.21 P. M. Huck, P. M Fedorack and W. B. Anderson, J. Am. Water
Works Assoc., 1991, 83, 69.22 S. J. Randtke, in Proceedings of theWorkshop on NOM in Drinking
Water, Chamonix, France, Sep. 19–22, 1993, 155.23 J. G. Jacangelo, J. DeMarco, D. M. Owen and S. J. Randtke,
J. Am. Water Works Assoc., 1995, 87, 64.
J. Environ. Monit., 2002, 4, 43–47 47
Publ
ishe
d on
14
Janu
ary
2002
. Dow
nloa
ded
on 2
7/10
/201
4 17
:50:
13.
View Article Online