monitoring data quality performance using data quality … · monitoring data quality performance...
TRANSCRIPT
W H I T E P A P E R
Monitoring Data Quality Performance Using Data Quality Metrics
with David Loshin
This document contains Confidential, Proprietary and Trade Secret Information (“Confidential Information”) of Informatica Corporation and may not be copied, distributed, duplicated, or otherwise reproduced in any manner without the prior written consent of Informatica.
While every attempt has been made to ensure that the information in this document is accurate and complete, some typographical errors or technical inaccuracies may exist. Informatica does not accept responsibility for any kind of loss resulting from the use of information contained in this document. The information contained in this document is subject to change without notice.
The incorporation of the product attributes discussed in these materials into any release or upgrade of any Informatica software product—as well as the timing of any such release or upgrade—is at the sole discretion of Informatica.
Protected by one or more of the following U.S. Patents: 6,032,158; 5,794,246; 6,014,670; 6,339,775; 6,044,374; 6,208,990; 6,208,990; 6,850,947; 6,895,471; or by the following pending U.S. Patents: 09/644,280; 10/966,046; 10/727,700.
This edition published March 2011
1Monitoring Data Quality Performance using Data Quality Metrics
White Paper
Table of ContentsAssessing the Value of Information Improvement . . . . . . . . . . . . . . . . . . . . 2
Performance Management, Data Governance, and Data Quality Metrics . . . . . . . . . . . . . . . . . . . . . . . . . . . . . . . . . . . . . . . . . . 4
Positive Impacts of Improved Data Quality . . . . . . . . . . . . . . . . . . . . . . . . . . . . . . . . . . . 4
Business Policy, Data Governance, and Rules . . . . . . . . . . . . . . . . . . . . . . . . . . . . . . . . . 4
Metrics for Quantifying Data Quality Performance . . . . . . . . . . . . . . . . . . . . . . . . . . . . . . 6
Dimensions of Data Quality . . . . . . . . . . . . . . . . . . . . . . . . . . . . . . . . . . . . 8
Uniqueness . . . . . . . . . . . . . . . . . . . . . . . . . . . . . . . . . . . . . . . . . . . . . . . . . . . . . . . . . 8
Accuracy. . . . . . . . . . . . . . . . . . . . . . . . . . . . . . . . . . . . . . . . . . . . . . . . . . . . . . . . . . . . 8
Consistency . . . . . . . . . . . . . . . . . . . . . . . . . . . . . . . . . . . . . . . . . . . . . . . . . . . . . . . . . 9
Completeness. . . . . . . . . . . . . . . . . . . . . . . . . . . . . . . . . . . . . . . . . . . . . . . . . . . . . . . . 9
Timeliness . . . . . . . . . . . . . . . . . . . . . . . . . . . . . . . . . . . . . . . . . . . . . . . . . . . . . . . . . 10
Currency. . . . . . . . . . . . . . . . . . . . . . . . . . . . . . . . . . . . . . . . . . . . . . . . . . . . . . . . . . . 10
Conformance . . . . . . . . . . . . . . . . . . . . . . . . . . . . . . . . . . . . . . . . . . . . . . . . . . . . . . . 10
Referential Integrity . . . . . . . . . . . . . . . . . . . . . . . . . . . . . . . . . . . . . . . . . . . . . . . . . . . 10
Technology Supports Your Metrics . . . . . . . . . . . . . . . . . . . . . . . . . . . . . . .11
Assessment . . . . . . . . . . . . . . . . . . . . . . . . . . . . . . . . . . . . . . . . . . . . . . . . . . . . . . . . 11
Definition . . . . . . . . . . . . . . . . . . . . . . . . . . . . . . . . . . . . . . . . . . . . . . . . . . . . . . . . . . 11
Validation and Cleansing. . . . . . . . . . . . . . . . . . . . . . . . . . . . . . . . . . . . . . . . . . . . . . . 12
Monitor and Manage Ongoing Quality of Data . . . . . . . . . . . . . . . . . . . . . . . . . . . . . . . 12
Putting it all Together: The Data Quality Scorecard . . . . . . . . . . . . . . . . . .13
Validating Data . . . . . . . . . . . . . . . . . . . . . . . . . . . . . . . . . . . . . . . . . . . . . . . . . . . . . . 13
Thresholds for Conformance . . . . . . . . . . . . . . . . . . . . . . . . . . . . . . . . . . . . . . . . . . . . 13
Ongoing Process Control . . . . . . . . . . . . . . . . . . . . . . . . . . . . . . . . . . . . . . . . . . . . . . . 14
Proactive Monitoring and Alerting. . . . . . . . . . . . . . . . . . . . . . . . . . . . . . . . . . . . . . . . . 15
The Data Quality Scorecard . . . . . . . . . . . . . . . . . . . . . . . . . . . . . . . . . . . . . . . . . . . . . 16
Case Study – Marks & Spencer Money . . . . . . . . . . . . . . . . . . . . . . . . . . .17
Summary . . . . . . . . . . . . . . . . . . . . . . . . . . . . . . . . . . . . . . . . . . . . . . . . .18
2
Assessing the Value of Information ImprovementOrganizational data quality management is often introduced in reaction to acute problems traceable to how some data failure adversely affected the business. This reactive approach may be typified by a rush to identify, evaluate, and purchase technical solutions that may (or may not) address the manifestation of problems, as opposed to isolating the root causes and eliminating the source of the introduction of flawed data.
In more thoughtful organizations, the business case for data quality improvement may have been developed as a result of assessing how poor data quality impacted the achievement of business objectives, and reviewing how holistic, enterprise-wide approaches to data quality management can benefit the organization as a whole. As is discussed in our previous white paper, “The Data Quality Business Case: Projecting Return on Investment,” following a process to justify the costs of investing in data quality improvement (at the governance, process, as well as technology levels) will lead to identifying key business areas that are impacted by poor data quality and whose performance improvements are tied to high quality information.
Clearly, data quality is not a one-time effort. The events and changes that allows flawed data to be introduced into an environment are not unique; rather, there are always new and insidious ways that can negatively impact the quality of data. It is necessary for the data management teams to not just address acute data failures, but also baseline the current state of data quality so that one can identify the critical failure points and determine improvement targets. This implies a few critical ideas:
•Organizations need a way to formalize data quality expectations as a means for measuring conformance of data to those expectations;
•Organizations must be able to baseline the levels of data quality and provide a mechanism to identify leakages as well as analyze root causes of data failures; and lastly,
•Organizations must be able to effectively establish and communicate to the business client community the level of confidence they should have in their data, which necessitates a means for measuring, monitoring, and tracking data quality.
The ability to motivate data quality improvement as a driver of increasing business productivity demonstrates a level of organizational maturity that views information as an asset, and rewards proactive involvement in change management. The next logical step after realizing how information gaps correspond to lowered business performance is realizing the productivity benefits that result from general data governance, stewardship, and management.
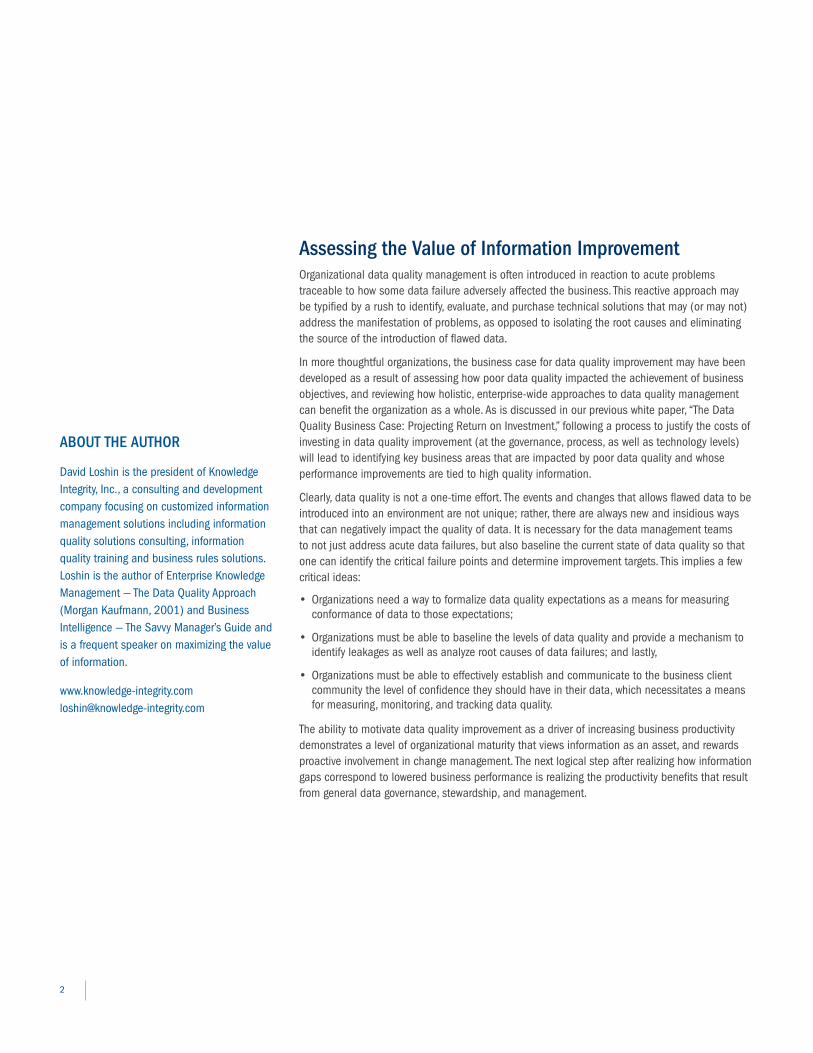
AbouT The AuThor
David Loshin is the president of Knowledge Integrity, Inc., a consulting and development company focusing on customized information management solutions including information quality solutions consulting, information quality training and business rules solutions. Loshin is the author of Enterprise Knowledge Management — The Data Quality Approach (Morgan Kaufmann, 2001) and Business Intelligence — The Savvy Manager’s Guide and is a frequent speaker on maximizing the value of information.
www.knowledge-integrity.com [email protected]
White Paper
3
Most interestingly, these two activities are really different sides of the same coin — they both basically depend on a process of determining the value added by improved data quality as a function of conformance to business expectations, and how those expectations are measured in relation to component data quality rules. If business success is quantifiable, and the dependence of the business on high quality data is measurable, then any improvements to the information asset should reflect measurable business performance improvements as well.
This suggests that by metrics used for monitoring the quality of data can actually roll up into higher level performance indicators for the business as a whole. This white paper reviews how poor data quality impacts both operational activities and strategic initiatives, and that the process used to assess business impact and justify data quality improvement can be used in turn to monitor ongoing data quality management. By relating those business impacts to data quality rules, an organization can employ those rules for both establishing a baseline measurement as well as ongoing monitoring of data quality performance.
But how can organizations achieve these data quality management objectives? Consider the approach of data quality policies and protocols that focus on automating the monitoring and reporting of data quality. Integrating control processes based on data quality rules communicates knowledge about the value of the data in use, and empowers the business users with the ability to determine how best the data can be used to meet their own business needs.
Monitoring Data Quality Performance using Data Quality Metrics
4
Performance Management, Data Governance, and Data Quality MetricsEstablishing a business case for data quality improvement hinges upon the ability to document the pains incurred by data flaws in running the business. The tasks of segmenting them across impact dimensions and categorizing each impact within lower levels of a hierarchical taxonomy facilitates researching negative financial impacts specifically attributable to “bad data.” Reviewing the scale of the data failures based on their corresponding negative financial impacts suggests ways to prioritize the remediation of data flaws, which in turn relies on data quality tools and technology.
However, the challenge in employing the concept of “return on investment” for justifying the funding of an improvement project is the ability to monitor, over time, whether the improvements implemented through the project are facilitating the promised positive impacts. So in contrast to the approach used to establish the business case, we can see that if business performance, customer satisfaction, compliance, and automated logistics are all directly tied to ensuring high quality data, then we should be able to use the same kinds of metrics to evaluate the ongoing effectiveness of the data quality program. Documenting this approach, standardizing its roles and responsibilities, and integrating the right tools and methods are the first key tasks in developing a data governance framework.
Positive Impacts of Improved Data QualityThe business case is developed based on assessing the negative impacts of poor data quality across a number of high-level categories: decreased revenues, increased costs, increased risk, and decreased confidence. Since a proactive approach to data governance and data quality enables the identification of the introduction of flawed data within the application framework, the flawed processes that are responsible for injecting unexpected data can be corrected, eliminating the source of the data problem. As we eliminate the sources of poor data quality, instead of looking at the negative impact of poor data quality, let’s consider the positive impacts of improved data quality namely: increased revenues, decreased costs, decreased risks, and increased confidence.
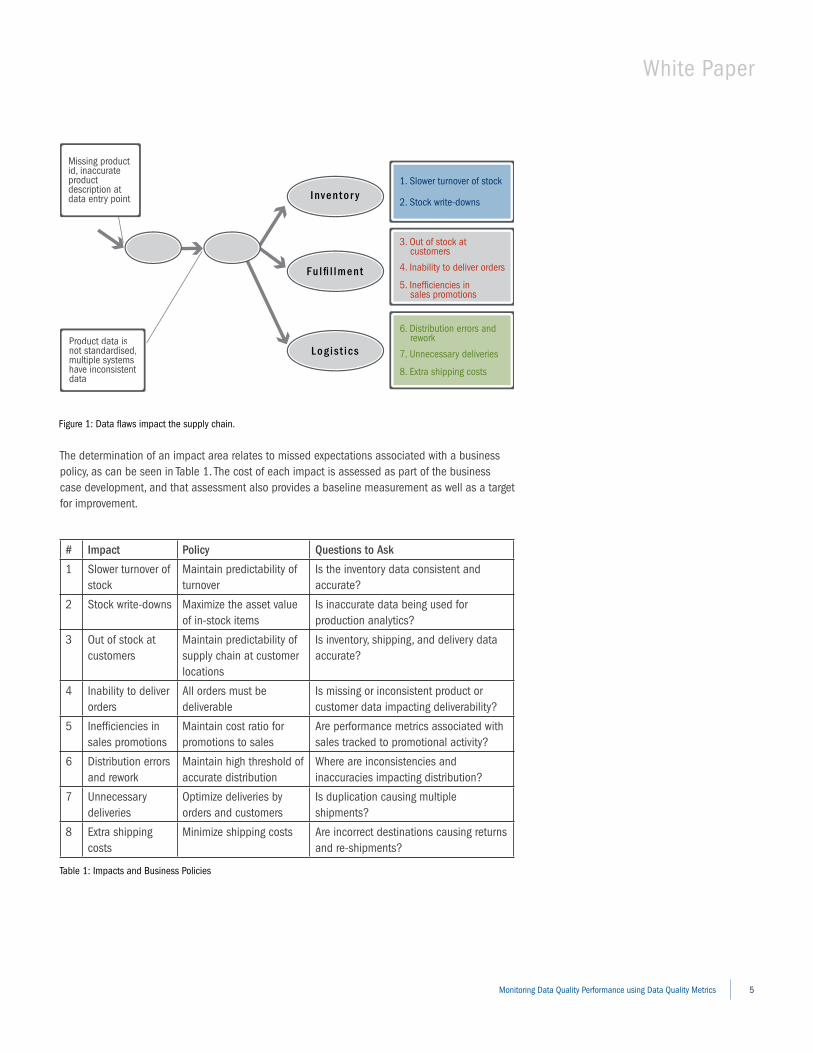
business Policy, Data Governance, and rulesNot only did the impact analysis phase of the business case process identify impact areas, it also provided some level of measurement and corresponding metrics. For example, Figure 1 shows an example of how data errors introduced at an early stage of processing contribute to various business impacts. The missing product identifiers, inaccurate product descriptions, and inconsistency across different systems contributed to the list of business impacts shown at the right.
White Paper
5
The determination of an impact area relates to missed expectations associated with a business policy, as can be seen in Table 1. The cost of each impact is assessed as part of the business case development, and that assessment also provides a baseline measurement as well as a target for improvement.
# Impact Policy Questions to Ask
1 Slower turnover of stock
Maintain predictability of turnover
Is the inventory data consistent and accurate?
2 Stock write-downs Maximize the asset value of in-stock items
Is inaccurate data being used for production analytics?
3 Out of stock at customers
Maintain predictability of supply chain at customer locations
Is inventory, shipping, and delivery data accurate?
4 Inability to deliver orders
All orders must be deliverable
Is missing or inconsistent product or customer data impacting deliverability?
5 Inefficiencies in sales promotions
Maintain cost ratio for promotions to sales
Are performance metrics associated with sales tracked to promotional activity?
6 Distribution errors and rework
Maintain high threshold of accurate distribution
Where are inconsistencies and inaccuracies impacting distribution?
7 Unnecessary deliveries
Optimize deliveries by orders and customers
Is duplication causing multiple shipments?
8 Extra shipping costs
Minimize shipping costs Are incorrect destinations causing returns and re-shipments?
Monitoring Data Quality Performance using Data Quality Metrics
1. Slower turnover of stock
2. Stock write-downs
3. Out of stock at customers
4. Inability to deliver orders
5. Inef�ciencies in sales promotions
6. Distribution errors and rework
7. Unnecessary deliveries
8. Extra shipping costs
Inventor y
Fu l� l lment
Log is t ics
Missing product id, inaccurate product description at data entry point
Product data isnot standardised,multiple systemshave inconsistentdata
Figure 1: Data flaws impact the supply chain.
Table 1: Impacts and Business Policies
6
Consider the business policy associated with impact #4: “All orders must be deliverable.” The impact is incurred because of missing product identifiers, inaccurate product descriptions, and inconsistency across different subsystems, each of which contributes to reducing the deliverability of an order. In turn, assuring that product identifiers are present, product descriptions are accurate, and maintaining data consistency across applications will improve the deliverability of orders.
This assurance is brought about as a result of instituting data governance principles across the organization in a way that provides the ability to implement, audit and monitor data quality at multiple points across the enterprise and measure consistency and conformity against associated business expectations and key performance indicators. These tasks integrate with the management structure, processes, policies, standards, and technologies required to manage and ensure the quality of data within the organization based on conforming to requirements of business policies. This framework then supports ownership, responsibility, and accountability for the institution of capable data processes for measurable data quality performance improvement.
Metrics for Quantifying Data Quality PerformanceThe way that governance can be manifested is a challenge, since, as is demonstrated by the high level of our example business policies, the statement of these policies is typically done using a “natural language” format that impedes the ability to measure conformance. The objective is to apply a process of semantic refinement that quantifies data quality performance to develop meaningful metrics associated with well-defined data quality dimensions. The refinement steps include:
1. Identifying the key data assertions associated with business policies,
2. Determining how those data assertions relate to quantifiable business impact,
3. Evaluating how the identified data flaws are categorized within a set of data quality dimensions and specifying the data rules that measure their occurrence,
4. Quantifying the contribution of each flaw to conformance with each business policy, and
5. Articulating and implementing the data rules within a drillable reporting framework.
White Paper
7
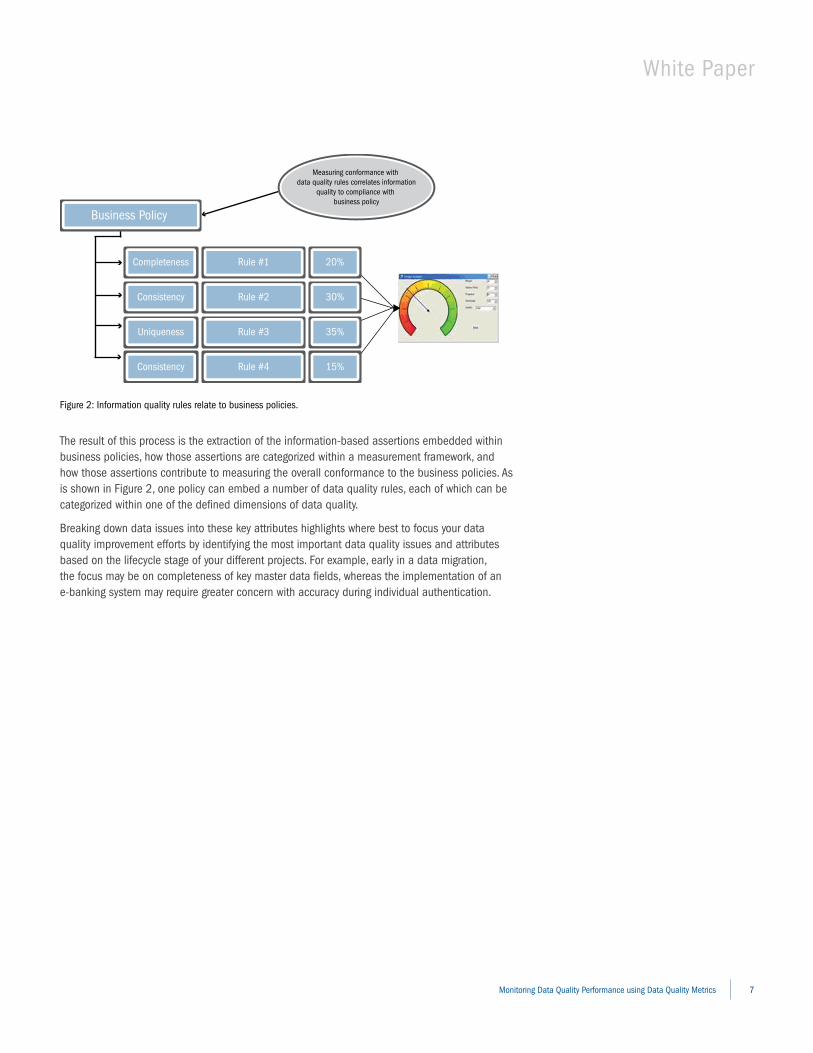
The result of this process is the extraction of the information-based assertions embedded within business policies, how those assertions are categorized within a measurement framework, and how those assertions contribute to measuring the overall conformance to the business policies. As is shown in Figure 2, one policy can embed a number of data quality rules, each of which can be categorized within one of the defined dimensions of data quality.
Breaking down data issues into these key attributes highlights where best to focus your data quality improvement efforts by identifying the most important data quality issues and attributes based on the lifecycle stage of your different projects. For example, early in a data migration, the focus may be on completeness of key master data fields, whereas the implementation of an e-banking system may require greater concern with accuracy during individual authentication.
Monitoring Data Quality Performance using Data Quality Metrics
DATA
Consistency Rule #4 15%
Uniqueness Rule #3 35%
Consistency Rule #2 30%
Completeness Rule #1 20%
Business Policy
Measuring conformance with data quality rules correlates information
quality to compliance with business policy
Figure 2: Information quality rules relate to business policies.
8
Dimensions of Data QualityOrganizing data quality rules within defined data quality dimensions not only simplifies the specification and measurement of the levels of data quality, it also provides the underlying structure that supports how the expression of data quality expectations can be transformed into a set of actionable assertions that can be measured and reported. Defining data quality rules segregated within the dimensions enables the governance of data quality management. Data stewards can use data quality tools for determining minimum thresholds for meeting business expectations, monitoring whether measured levels of quality meet or exceed those business expectations, which then provides insight into examining the root causes that are preventing the levels of quality from meeting those expectations.
Dimensions of data quality are often categorized according to the contexts in which metrics associated with the business processes are to be measured, such as measuring the quality of data associated with data values, data models, data presentation, and conformance with governance policies. The dimensions associated with data models and data governance require continuous management review and oversight. However, the dimensions associated with data values and data presentation in many cases lend themselves handily to system automation, and are the best ones suited for defining rules used for continuous data quality monitoring.
uniquenessUniqueness refers to requirements that entities modeled within the enterprise are captured and represented uniquely within the relevant application architectures. Asserting uniqueness of the entities within a data set implies that no entity exists more than once within the data set and that there is a key that can be used to uniquely access each entity (and only that specific entity) within the data set. For example, in a master product table, each product must appear once and be assigned a unique identifier that represents that product across the client applications.
The dimension of uniqueness is characterized by stating that no entity exists more than once within the data set. When there is an expectation of uniqueness, data instances should not be created if there is an existing record for that entity. This dimension can be monitored two ways. As a static assessment, it implies applying duplicate analysis to the data set to determine if duplicate records exist, and as an ongoing monitoring process, it implies providing an identity matching and resolution service at the time of record creation to locate exact or potential matching records.
AccuracyData accuracy refers to the degree with which data correctly represents the “real-life” objects they are intended to model. In many cases, accuracy is measured by how the values agree with an identified source of correct information (such as reference data). There are different sources of correct information: a database of record, a similar corroborative set of data values from another table, dynamically computed values, or perhaps the result of a manual process.
An example of an accuracy rule might specify that for healthcare providers, the Registration Status attribute must have a value that is accurate according to the regional accreditation board. If that data is available as a reference data set, and automated process can be put in place to verify the accuracy, but if not, a manual process may be instituted to contact that regional board to verify the accuracy of that attribute.
White Paper
9
ConsistencyIn its most basic form, consistency refers to data values in one data set being consistent with values in another data set. A strict definition of consistency specifies that two data values drawn from separate data sets must not conflict with each other, although consistency does not necessarily imply correctness. Even more complicated is the notion of consistency with a set of predefined constraints. More formal consistency constraints can be encapsulated as a set of rules that specify consistency relationships between values of attributes, either across a record or message, or along all values of a single attribute. However, be careful not to confuse consistency with accuracy or correctness.
Consistency may be defined within different contexts:
•Between one set of attribute values and another attribute set within the same record (record-level consistency)
•Between one set of attribute values and another attribute set in different records (cross-record consistency)
•Between one set of attribute values and the same attribute set within the same record at different points in time (temporal consistency)
•Consistency may also take into account the concept of “reasonableness,” in which some range of acceptability is imposed on the values of a set of attributes.
An example of a consistency rule verifies that, within a corporate hierarchy structure, the sum of the number of employees at each site should not exceed the number of employees for the entire corporation.
CompletenessAn expectation of completeness indicates that certain attributes should be assigned values in a data set. Completeness rules can be assigned to a data set in three levels of constraints:
1. Mandatory attributes that require a value,
2. Optional attributes, which may have a value based on some set of conditions, and
3. Inapplicable attributes, (such as maiden name for a single male), which may not have a value
Completeness may also be seen as encompassing usability and appropriateness of data values. An example of a completeness rule is seen in our example in section ‘Business Policy, Data Governance and Rules’ (pp. 4-5), in which business impacts were caused by the absence of product identifiers. To ensure that all orders are deliverable, each line item must refer to a product, and each line item must have a product identifier. Therefore, the line item is not valid unless the Product identifier field is complete.
Monitoring Data Quality Performance using Data Quality Metrics
10
TimelinessTimeliness refers to the time expectation for accessibility and availability of information. Timeliness can be measured as the time between when information is expected and when it is readily available for use. For example, in the financial industry, investment product pricing data is often provided by third-party vendors. As the success of the business depends on accessibility to that pricing data, service levels specifying how quickly the data must be provided can be defined and compliance with those timeliness constraints can be measured.
CurrencyCurrency refers to the degree to which information is current with the world that it models. Currency can measure how “up-to-date” information is, and whether it is correct despite possible time-related changes. Data currency may be measured as a function of the expected frequency rate at which different data elements are expected to be refreshed, as well as verifying that the data is up to date. This may require some automated and manual processes. Currency rules may be defined to assert the “lifetime” of a data value before it needs to be checked and possibly refreshed. For example, one might assert that the contact information for each customer must be current, indicating a requirement to maintain the most recent values associated with the individual’s contact data.
ConformanceThis dimension refers to whether instances of data are either store, exchanged, or presented in a format that is consistent with the domain of values, as well as consistent with other similar attribute values. Each column has numerous metadata attributes associated with it: its data type, precision, format patterns, use of a predefined enumeration of values, domain ranges, underlying storage formats, etc.
referential IntegrityAssigning unique identifiers to objects (customers, products, etc.) within your environment simplifies the management of your data, but introduces new expectations that any time an object identifier is used as foreign keys within a data set to refer to the core representation, that core representation actually exists. More formally, this is referred to referential integrity, and rules associated with referential integrity often are manifested as constraints against duplication (to ensure that each entity is represented once, and only once), and reference integrity rules, which assert that all values used all keys actually refer back to an existing master record.
White Paper
11
Technology Supports Your MetricsA framework to effectively monitor data quality performance must integrate technology to coordinate the assessment and discovery of data quality issues, the definition of data quality rules, the use of those rules for distinguishing between valid and invalid data and possibly cleansing invalid data, and the management, measurement, and reporting of conformance to those rules.
AssessmentPart of the process of refining data quality rules for proactive monitoring deals with establishing the relationship between recognized data flaws and business impacts, but in order to do this, one must first be able to distinguish between “good” and “bad” data. The attempt to qualify data quality is a process of analysis and discovery involving an objective review of the data values populating data sets through quantitative measures and analyst review. While a data analyst may not necessarily be able to pinpoint all instances of flawed data, the ability to document situations where data values look like they don’t belong provides a means to communicate these instances with subject matter experts whose business knowledge can confirm the existences of data problems.
Data profiling is a set of algorithms for statistical analysis and assessment of the quality of data values within a data set, as well as exploring relationships that exists between value collections within and across data sets. For each column in a table, a data profiling tool will provide a frequency distribution of the different values, providing insight into the type and use of each column. Cross-column analysis can expose embedded value dependencies, while inter-table analysis explores overlapping values sets that may represent foreign key relationships between entities, and it is in this way that profiling can be used for anomaly analysis and assessment, which feeds the process of defining data quality metrics.
DefinitionThe analysis performed by data profiling tools exposes anomalies that exist within the data sets, and at the same time identifies dependencies that represent business rules embedded within the data. The result is a collection of data rules, each of which can be categorized within the framework of the data quality dimensions. Even more appealing is the fact that the best-of-breed vendors provide data profiling, data transformation, and data cleaning tools with a capability to create data quality rules that can be implemented directly within the software.
Monitoring Data Quality Performance using Data Quality Metrics
12
Validation and CleansingOur data quality rules are going to fall into two categories. One set of rules, validations, simply asserts what must be true about the data, and is used as a means of validating that data conforms to our expectations. Both data transformation and data profiling products will allow the end client to define validation rules that can be tested against a large set of data instances. For example, having determined through profiling that the values within a specific column should fall within a range of 20-100, one can specify a rule asserting that “all values must be greater than or equal to 20, and less than or equal to 100.” The next time data is streamed through the data quality tool, the rule can be applied to verify that each of the values falls within the specified range, and tracks the number of times the value does not fall within that range.
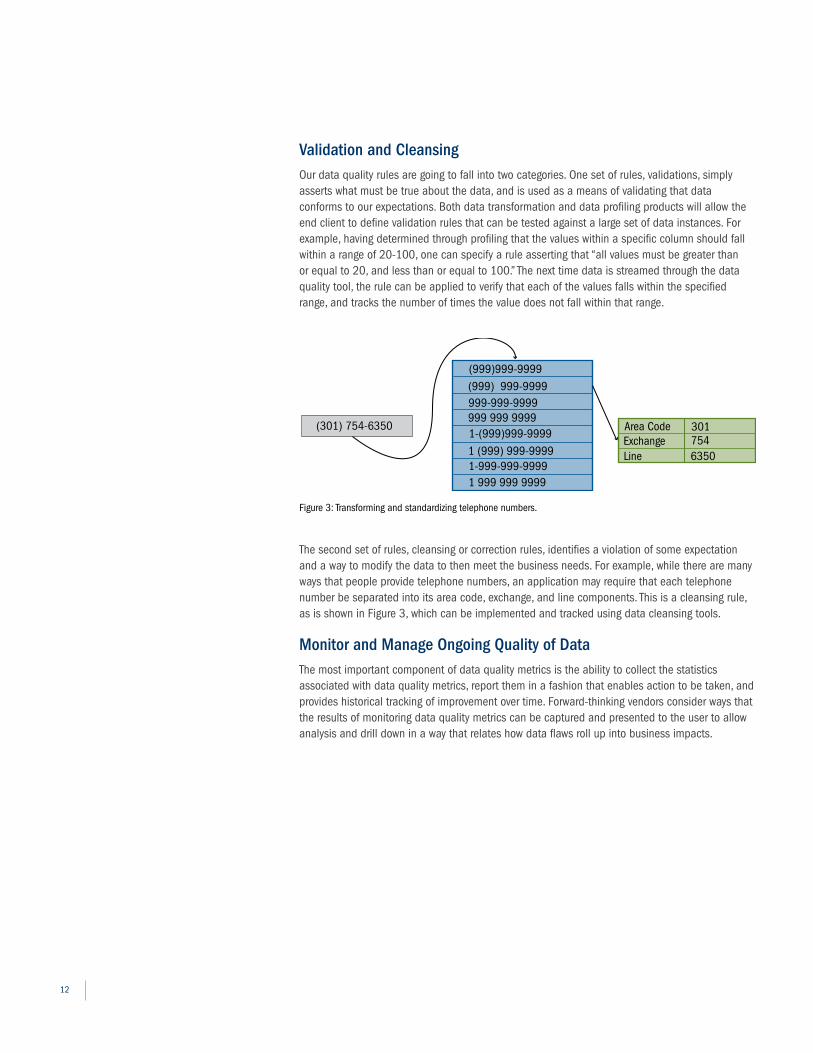
The second set of rules, cleansing or correction rules, identifies a violation of some expectation and a way to modify the data to then meet the business needs. For example, while there are many ways that people provide telephone numbers, an application may require that each telephone number be separated into its area code, exchange, and line components. This is a cleansing rule, as is shown in Figure 3, which can be implemented and tracked using data cleansing tools.
Monitor and Manage ongoing Quality of Data The most important component of data quality metrics is the ability to collect the statistics associated with data quality metrics, report them in a fashion that enables action to be taken, and provides historical tracking of improvement over time. Forward-thinking vendors consider ways that the results of monitoring data quality metrics can be captured and presented to the user to allow analysis and drill down in a way that relates how data flaws roll up into business impacts.
Figure 3: Transforming and standardizing telephone numbers.
(301) 754-6350
(999)999-9999(999) 999-9999999-999-9999999 999 99991-(999)999-99991 (999) 999-99991-999-999-99991 999 999 9999
Area CodeExchangeLine
3017546350
White Paper
13
Putting it all Together: The Data Quality ScorecardA data quality scorecard is a management tool that captures a virtual snapshot of the quality levels of your data, presents that information to the user, and provides insight as to where data flaws are impacting business operations and where the most egregious flaws exist within the system. Using data quality rules based on defined dimensions provides a framework for measuring conformance to business data quality expectations.
Validating DataTo be able to measure the level of data quality based on the dimensions of data quality, the data to be monitored will be subjected to validation using the defined rules. The levels of conformance to those rules are calculated and the results can be incorporated into a data quality scorecard.
Measuring conformance is dependent on the kinds of rules that are being validated. For rules that are applied at the record level, conformance can be measured as the percentage of records that are valid. Rules at the table or data set level (such as those associated with uniqueness), and those that apply across more than one data set (such as those associated with reference integrity) can measure the number of occurrences of invalidity.
Validation of data quality rules is typically done using data profiling, parsing, standardization, and cleansing tools. As is mentioned in section ‘Definition’ (p 11), best-of-breed vendors allow for integrating data quality rules within their products for auditing and monitoring of data validity. By tracking the number of discovered (and perhaps, corrected) flaws as a percentage of the size of the entire data set, these tools can provide a percentage level of conformance to defined rules. The next step is to assess whether the level of conformance meets the user expectations.
Thresholds for ConformanceFor any measured metric, user expectation levels are set based on the degree to which the data conforms to the defined sets of rules. But since different data flaws have different business impacts, the degrees to which different data quality rules are violated reflect different levels of business criticality. Consequently, there may be different levels of expected conformance, which is reflected in setting acceptability thresholds.
The simplest approach is to have a single threshold. If the conformance rate meets, or exceeds the threshold, the quality of the data is within acceptable bounds. If the conformance rate is below the threshold, the quality of the data is not acceptable.
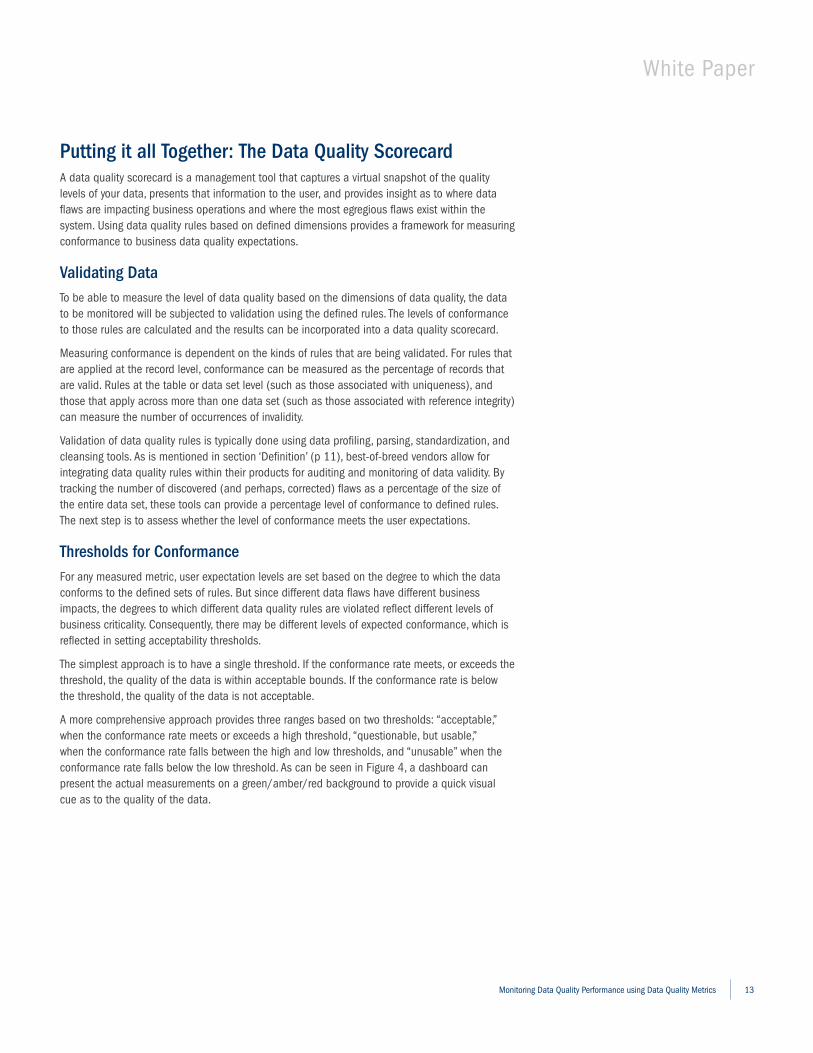
A more comprehensive approach provides three ranges based on two thresholds: “acceptable,” when the conformance rate meets or exceeds a high threshold, “questionable, but usable,” when the conformance rate falls between the high and low thresholds, and “unusable” when the conformance rate falls below the low threshold. As can be seen in Figure 4, a dashboard can present the actual measurements on a green/amber/red background to provide a quick visual cue as to the quality of the data.
Monitoring Data Quality Performance using Data Quality Metrics
14
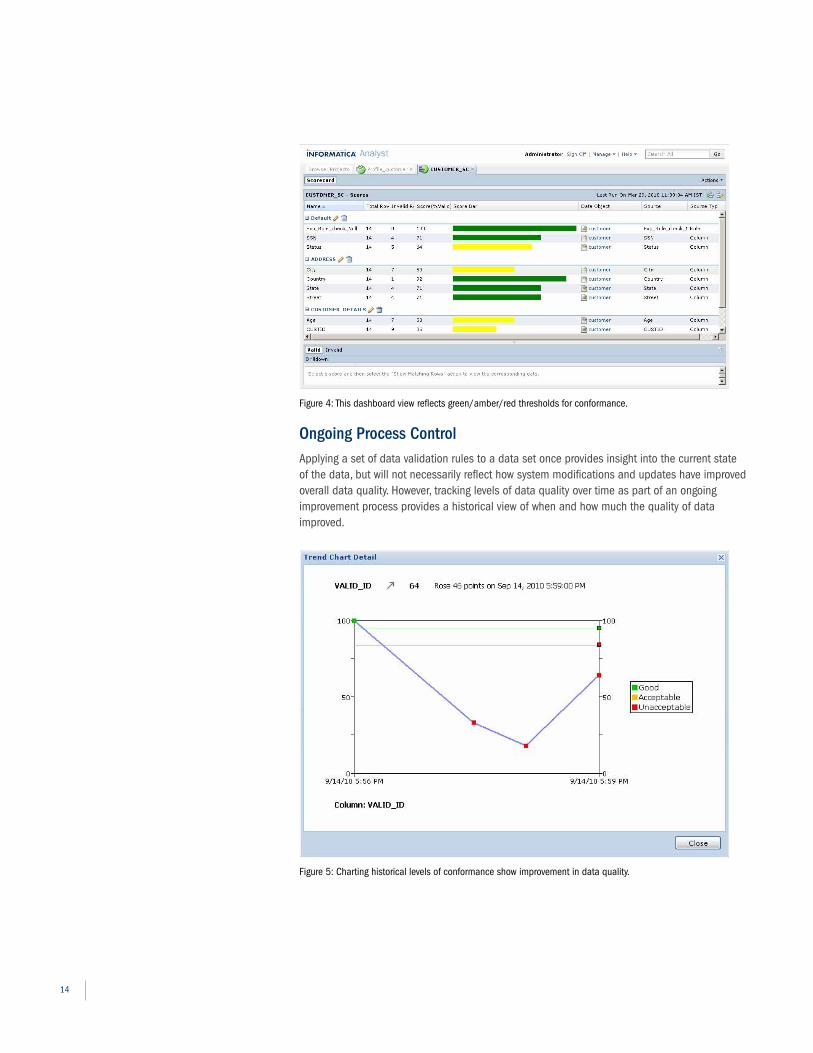
ongoing Process ControlApplying a set of data validation rules to a data set once provides insight into the current state of the data, but will not necessarily reflect how system modifications and updates have improved overall data quality. However, tracking levels of data quality over time as part of an ongoing improvement process provides a historical view of when and how much the quality of data improved.
Figure 4: This dashboard view reflects green/amber/red thresholds for conformance.
Figure 5: Charting historical levels of conformance show improvement in data quality.
White Paper
15Monitoring Data Quality Performance using Data Quality Metrics
As part of a statistical control process, data quality levels can be tracked on a periodic (e.g., daily) basis, and charted to show if the measured level of data quality is within an acceptable range when compared to historical control bounds, or whether some event has caused the measured level to be below what is acceptable. Statistical control charts can help in notifying the data stewards when an exception event is impacting data quality, and where to look to track down the offending information process. Historical charting becomes another critical component of the data quality scorecard.
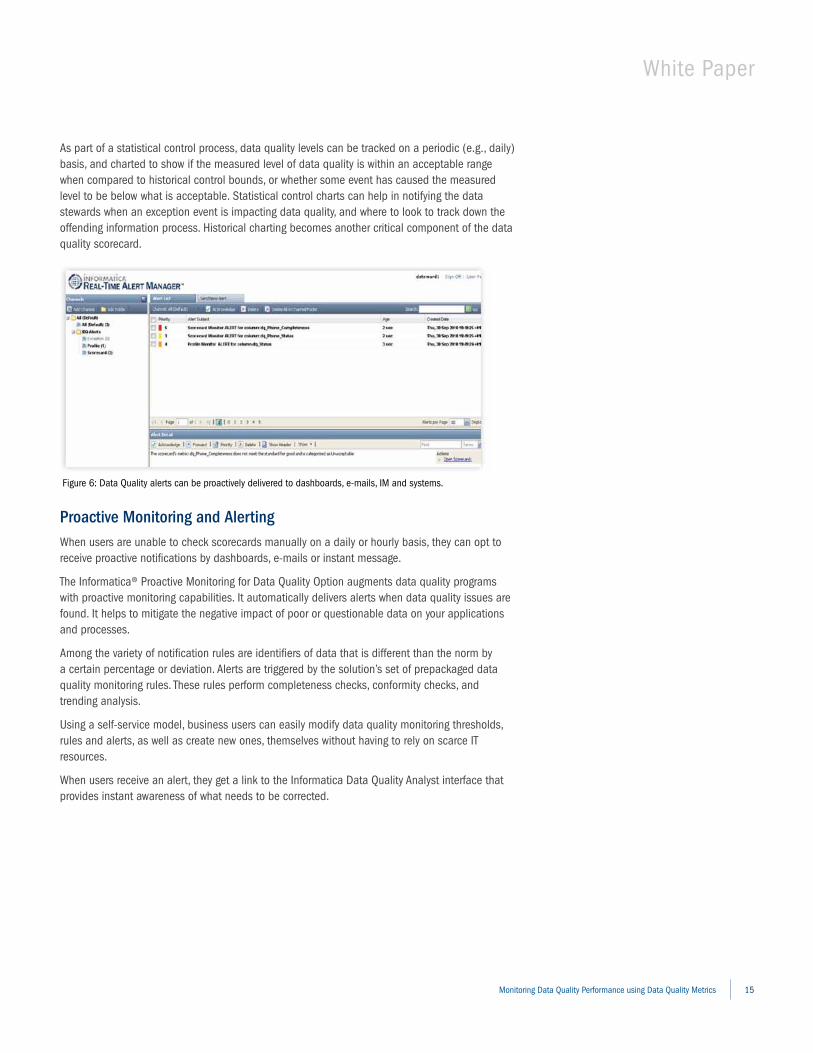
Proactive Monitoring and AlertingWhen users are unable to check scorecards manually on a daily or hourly basis, they can opt to receive proactive notifications by dashboards, e-mails or instant message.
The Informatica® Proactive Monitoring for Data Quality Option augments data quality programs with proactive monitoring capabilities. It automatically delivers alerts when data quality issues are found. It helps to mitigate the negative impact of poor or questionable data on your applications and processes.
Among the variety of notification rules are identifiers of data that is different than the norm by a certain percentage or deviation. Alerts are triggered by the solution’s set of prepackaged data quality monitoring rules. These rules perform completeness checks, conformity checks, and trending analysis.
Using a self-service model, business users can easily modify data quality monitoring thresholds, rules and alerts, as well as create new ones, themselves without having to rely on scarce IT resources.
When users receive an alert, they get a link to the Informatica Data Quality Analyst interface that provides instant awareness of what needs to be corrected.
Figure 6: Data Quality alerts can be proactively delivered to dashboards, e-mails, IM and systems.
16
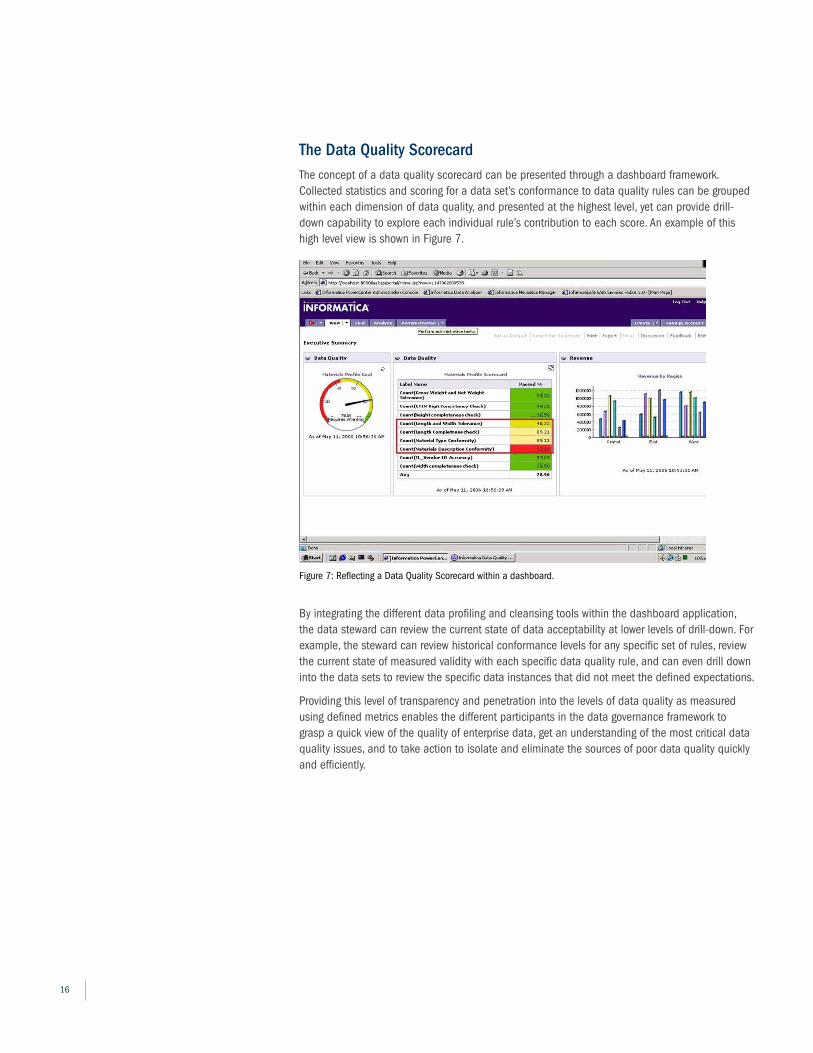
The Data Quality ScorecardThe concept of a data quality scorecard can be presented through a dashboard framework. Collected statistics and scoring for a data set’s conformance to data quality rules can be grouped within each dimension of data quality, and presented at the highest level, yet can provide drill-down capability to explore each individual rule’s contribution to each score. An example of this high level view is shown in Figure 7.
By integrating the different data profiling and cleansing tools within the dashboard application, the data steward can review the current state of data acceptability at lower levels of drill-down. For example, the steward can review historical conformance levels for any specific set of rules, review the current state of measured validity with each specific data quality rule, and can even drill down into the data sets to review the specific data instances that did not meet the defined expectations.
Providing this level of transparency and penetration into the levels of data quality as measured using defined metrics enables the different participants in the data governance framework to grasp a quick view of the quality of enterprise data, get an understanding of the most critical data quality issues, and to take action to isolate and eliminate the sources of poor data quality quickly and efficiently.
Figure 7: Reflecting a Data Quality Scorecard within a dashboard.
White Paper
17Monitoring Data Quality Performance using Data Quality Metrics
Case Study – Marks & Spencer MoneyMarks & Spencer Money is a leading UK financial services company, and retains a close working relationship with UK-based Marks & Spencer. M&S Money went above and beyond meeting the challenge of readying its information environment for compliance with Basel II compliance by seizing the opportunity to enhance data management across the organization by introducing a comprehensive data quality management program. The clear objective? To establish total faith in the accuracy of the information. Providing clear procedures for assuring the highest levels of data quality doesn’t just enable Basel II compliance, but also enables the business to confidently engage in business development with customers.
Broader data management benefits that M&S Money wished to achieve centered on the need to avoid potential customer frustration caused by inaccurate data, enabling the company to undertake business analysis and, therefore, sales activities with greater confidence. The company wanted to ensure that customers were given “no surprises” when approached about new products and services. Because of the company’s hesitation to use data of questionable quality when approaching customers, in these cases, the company would not approach customers at all, rather than risk any frustration. Enhancing data quality would therefore drive improved business analysis and sales practices. Therefore, when assessing its needs for Basel II compliance, M&S Money created a specification for a data quality initiative that would meet the regulatory requirements as well as delivering a platform for enhanced organizational data quality management.
Between their need to track and report ongoing exposure to credit, market, and operational risks, while needing to mitigate potential problems with questionable accuracy from data acquired from third-party providers, M&S Money deployed Informatica’s data profiling and data quality modules as a data quality management platform alongside their data warehouse. At the same time, they were able to institute new data quality management policies and protocols for managing the data quality review process, to make sure that any events that could negatively impact quality would be immediately addressed and nullified.
M&S Money’s methodology began with defining data quality rules for the relevant files and tables, coding those rules running those rules against the data, analyzing the data and creating an action plan for quality assurance. Once Informatica Data Quality and Data Profiler went live, it took business analysts just four days to develop 20 Basel II business rules on the fly, deliver a data accuracy scorecard, create profiles on account history tables and develop other business rules that were then added to the scorecard. And even though the main driver for the business was compliance with Basel II’s stipulations, which was completed successfully a year ahead of the deadline, the company has created an assured level of data quality that has enabled it to undertake business analysis and financial reporting with greater confidence. A further gain has been the reduction of the analysis cycle by up to 40 per cent, meaning faster comprehension and validation of information through less time needing to be spent assessing the accuracy of the data. Now, the data quality scorecard is used to formally evaluate data quality levels on a quarterly basis, with benefits surpassing the original Basel II requirements, providing greater confidence in customer data, which in turn provides greater insight into marketing and sales activities.
18
SummaryThe importance of high quality data requires constant vigilance. But by introducing data quality monitoring and reporting policies and protocols, the decisions to acquire and integrate data quality technology become much simpler. Since the events and changes that allow flawed data to be introduced into an environment are not unique, and data flaws are constantly being introduced, to ensure that data issues do not negatively impact application and operations:
• Formalize an approach for identifying data quality expectations and defining data quality rules against which the data may be validated
•Baseline the levels of data quality and provide a mechanism to identify leakages as well as analyze root causes of data failures; and lastly,
• Establish and communicate to the business client community the level of confidence they should have in their data, based on a technical approach for measuring, monitoring, and tracking data quality.

White Paper
19Monitoring Data Quality Performance using Data Quality Metrics
W H I T E P A P E R
Worldwide Headquarters, 100 Cardinal Way, Redwood City, CA 94063, USAphone: 650.385.5000 fax: 650.385.5500 toll-free in the US: 1.800.653.3871 www.informatica.com
Informatica Offices Around The Globe: Australia • Belgium • Canada • China • France • Germany • Japan • Korea • the Netherlands • Singapore • Switzerland • United Kingdom • USA
© 2011 Informatica Corporation. All rights reserved. Printed in the U.S.A. Informatica, the Informatica logo, and The Data Integration Company are trademarks or registered trademarks of Informatica Corporation in the United States and in jurisdictions throughout the world. All other company and product names may be trade names or trademarks of their respective owners.
6741 (03/07/2011)