monetarypolicy report july2018 · the ability of risk‐premium adjusted forward rates to forecast...
TRANSCRIPT
Monetary Policy ReportJuly 2018

Chapter 1
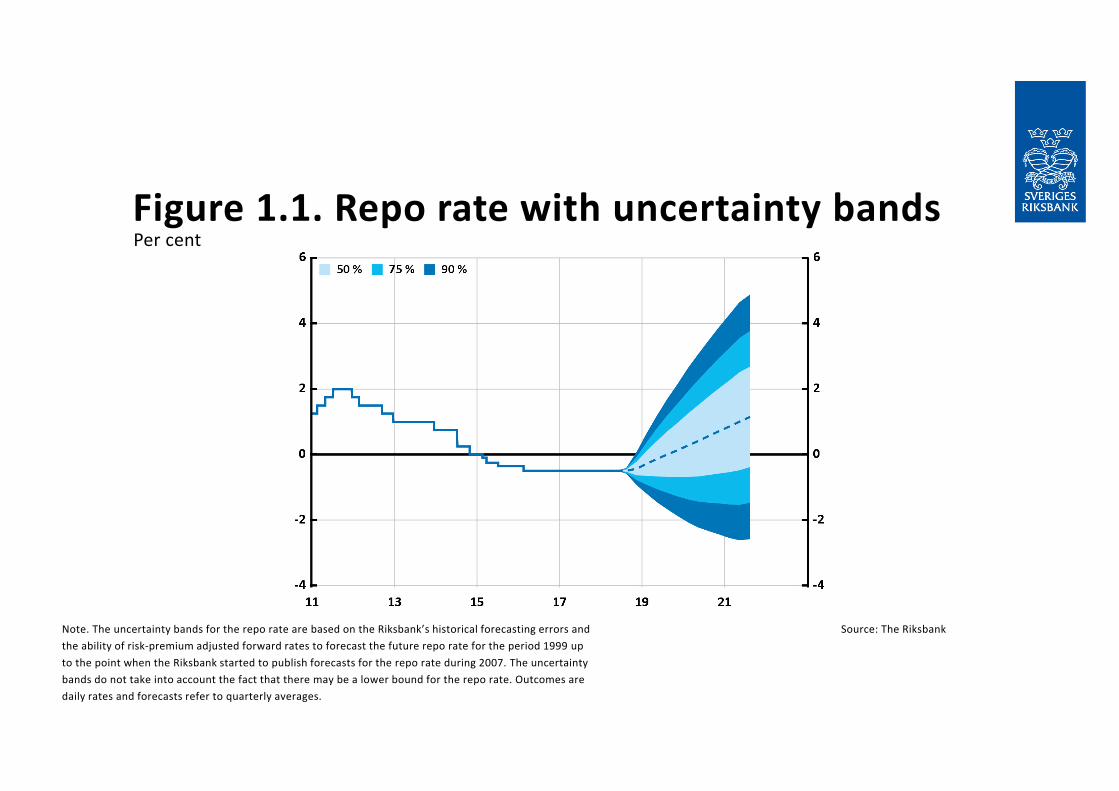
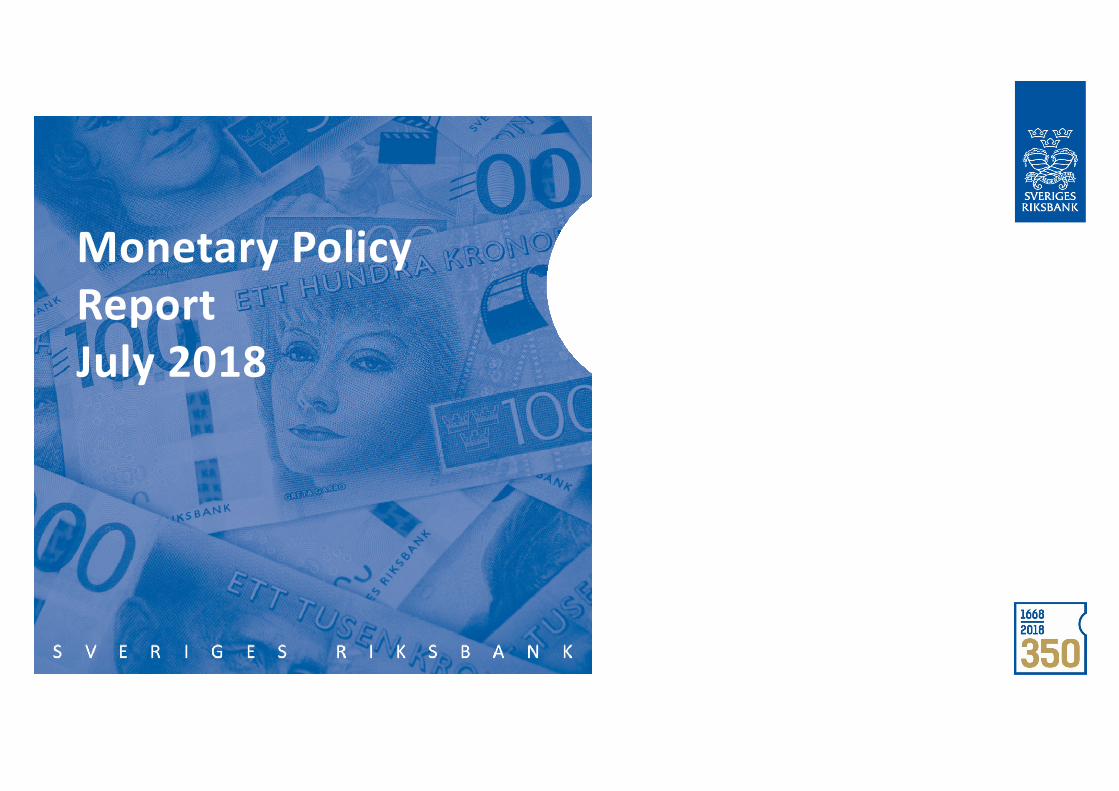
Figure 1.1. Repo rate with uncertainty bands
Note. The uncertainty bands for the repo rate are based on the Riksbank’s historical forecasting errors and the ability of risk‐premium adjusted forward rates to forecast the future repo rate for the period 1999 up to the point when the Riksbank started to publish forecasts for the repo rate during 2007. The uncertainty bands do not take into account the fact that there may be a lower bound for the repo rate. Outcomes are daily rates and forecasts refer to quarterly averages.
Source: The Riksbank
Per cent
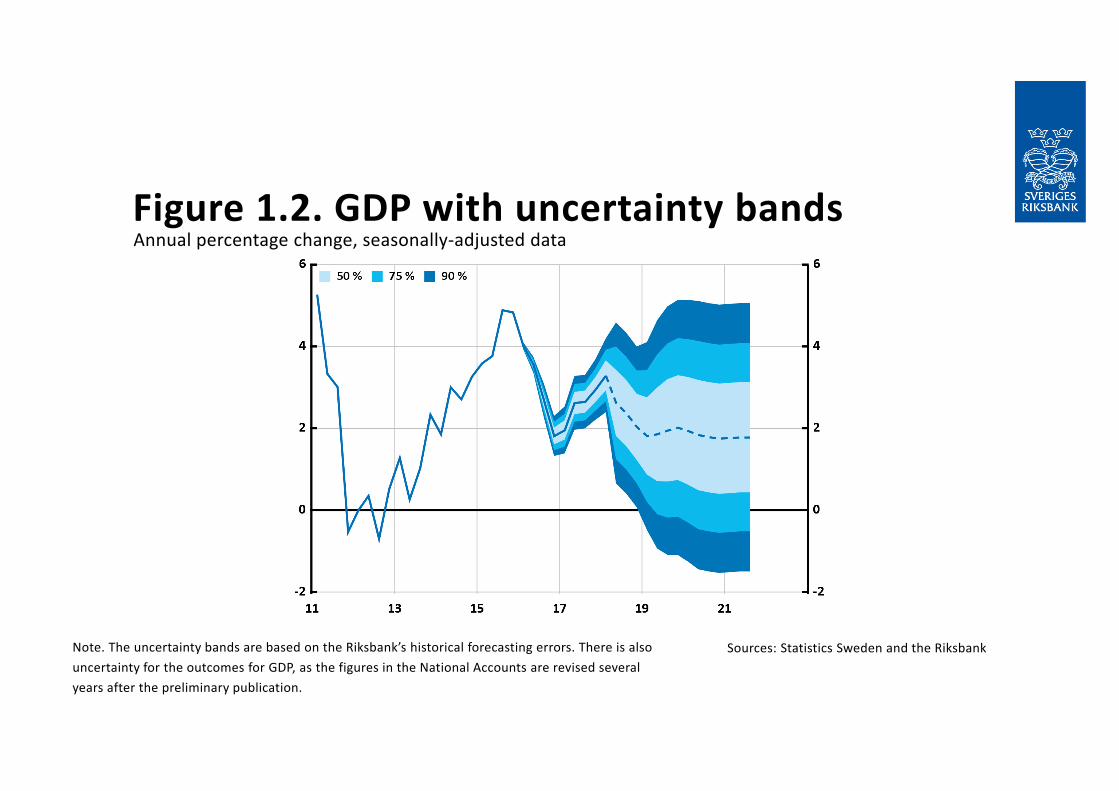
Figure 1.2. GDP with uncertainty bands
Sources: Statistics Sweden and the Riksbank
Annual percentage change, seasonally‐adjusted data
Note. The uncertainty bands are based on the Riksbank’s historical forecasting errors. There is also uncertainty for the outcomes for GDP, as the figures in the National Accounts are revised several years after the preliminary publication.
Figure 1.3. CPIF with uncertainty bands
Note. The uncertainty bands are based on the Riksbank’s historical forecasting errors.
Sources: Statistics Sweden and the Riksbank
Annual percentage change
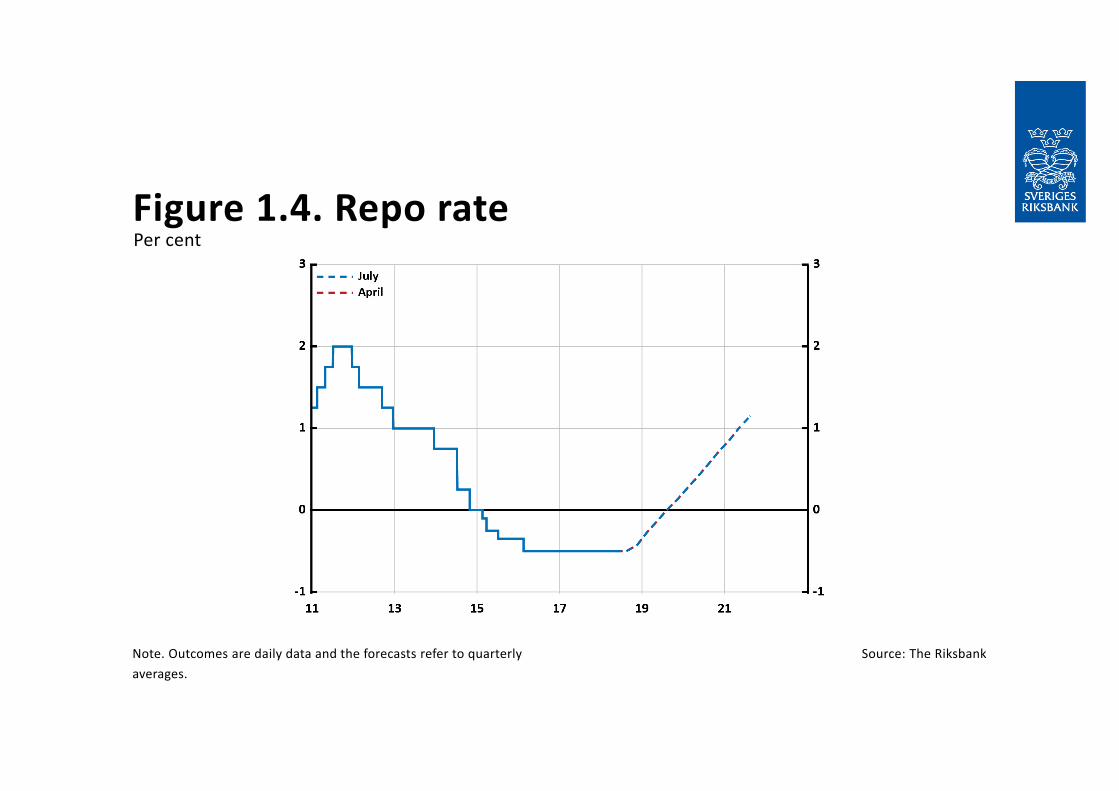
Figure 1.4. Repo rate
Note. Outcomes are daily data and the forecasts refer to quarterly averages.
Source: The Riksbank
Per cent
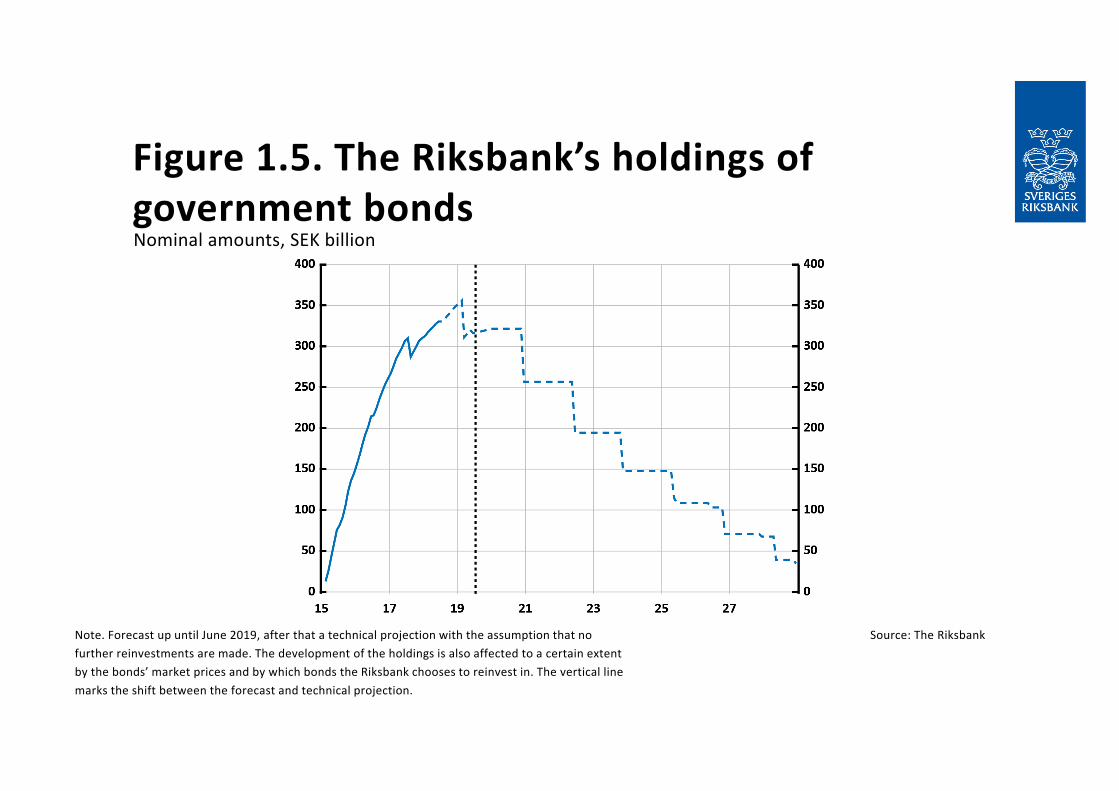
Figure 1.5. The Riksbank’s holdings of government bonds
Note. Forecast up until June 2019, after that a technical projection with the assumption that no further reinvestments are made. The development of the holdings is also affected to a certain extent by the bonds’ market prices and by which bonds the Riksbank chooses to reinvest in. The vertical line marks the shift between the forecast and technical projection.
Source: The Riksbank
Nominal amounts, SEK billion
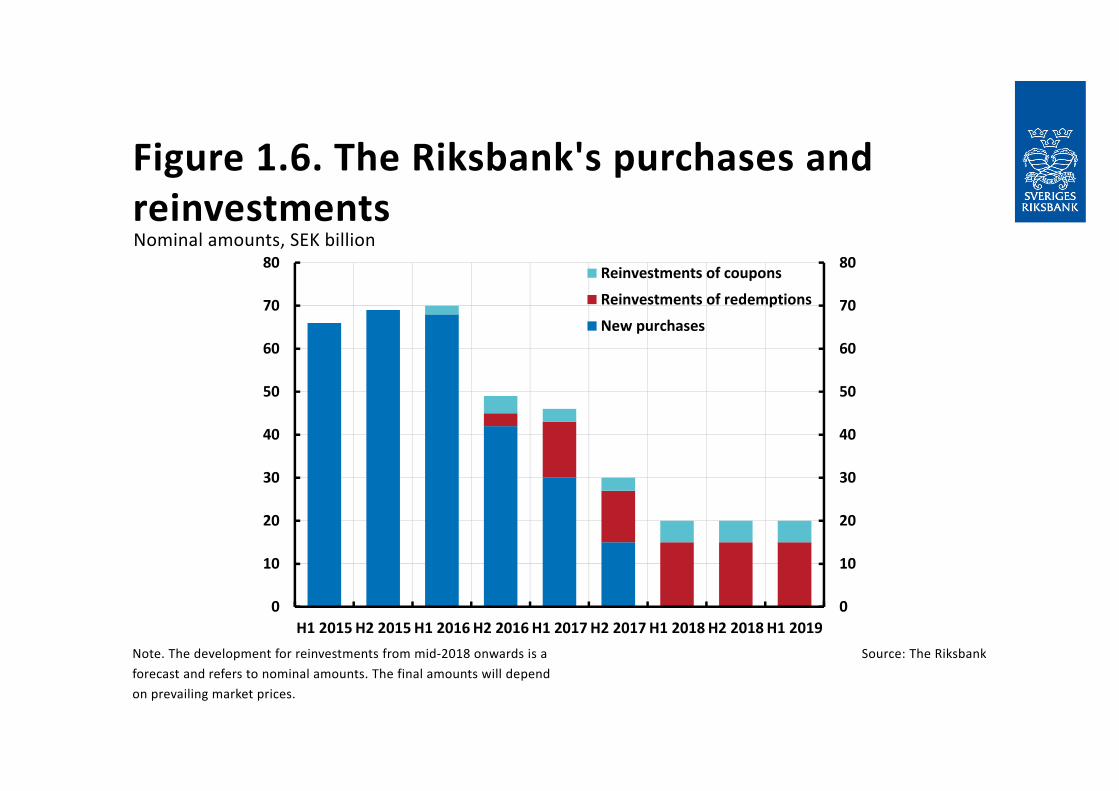
Figure 1.6. The Riksbank's purchases and reinvestments
0
10
20
30
40
50
60
70
80
0
10
20
30
40
50
60
70
80
H1 2015H2 2015H1 2016H2 2016H1 2017H2 2017H1 2018H2 2018H1 2019
Reinvestments of coupons
Reinvestments of redemptions
New purchases
Note. The development for reinvestments from mid‐2018 onwards is a forecast and refers to nominal amounts. The final amounts will dependon prevailing market prices.
Source: The Riksbank
Nominal amounts, SEK billion
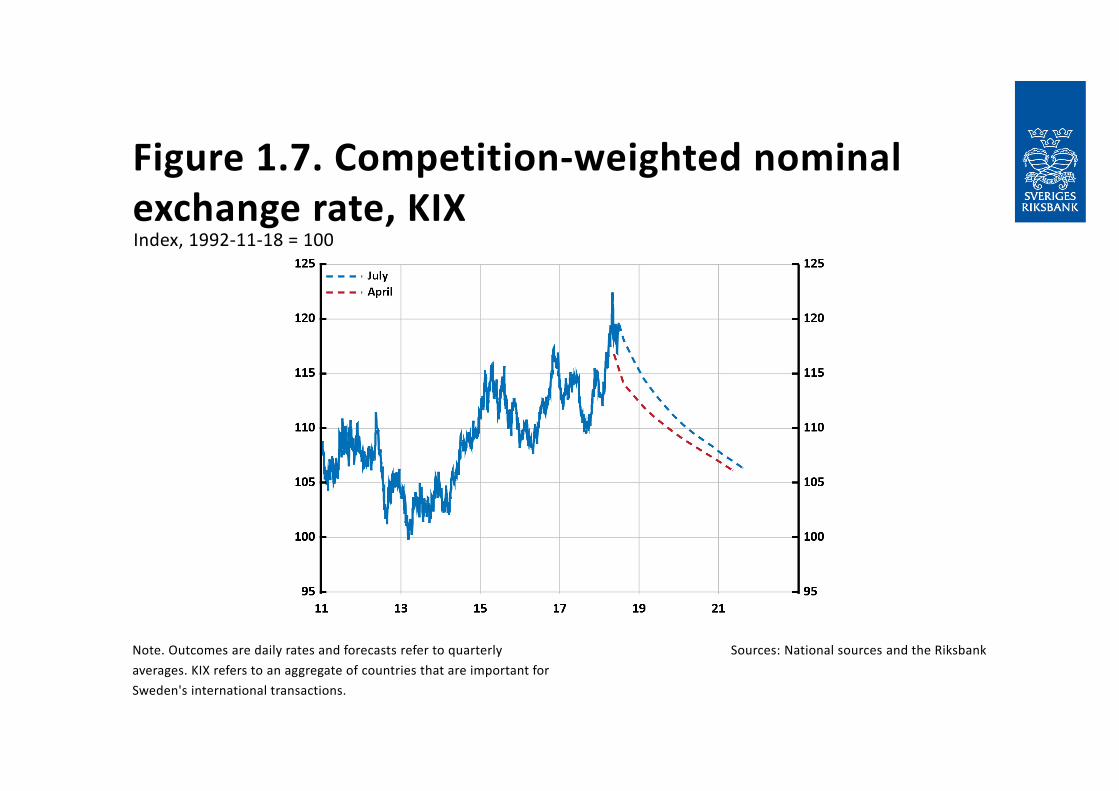
Figure 1.7. Competition‐weighted nominal exchange rate, KIX
Note. Outcomes are daily rates and forecasts refer to quarterly averages. KIX refers to an aggregate of countries that are important for Sweden's international transactions.
Sources: National sources and the Riksbank
Index, 1992‐11‐18 = 100
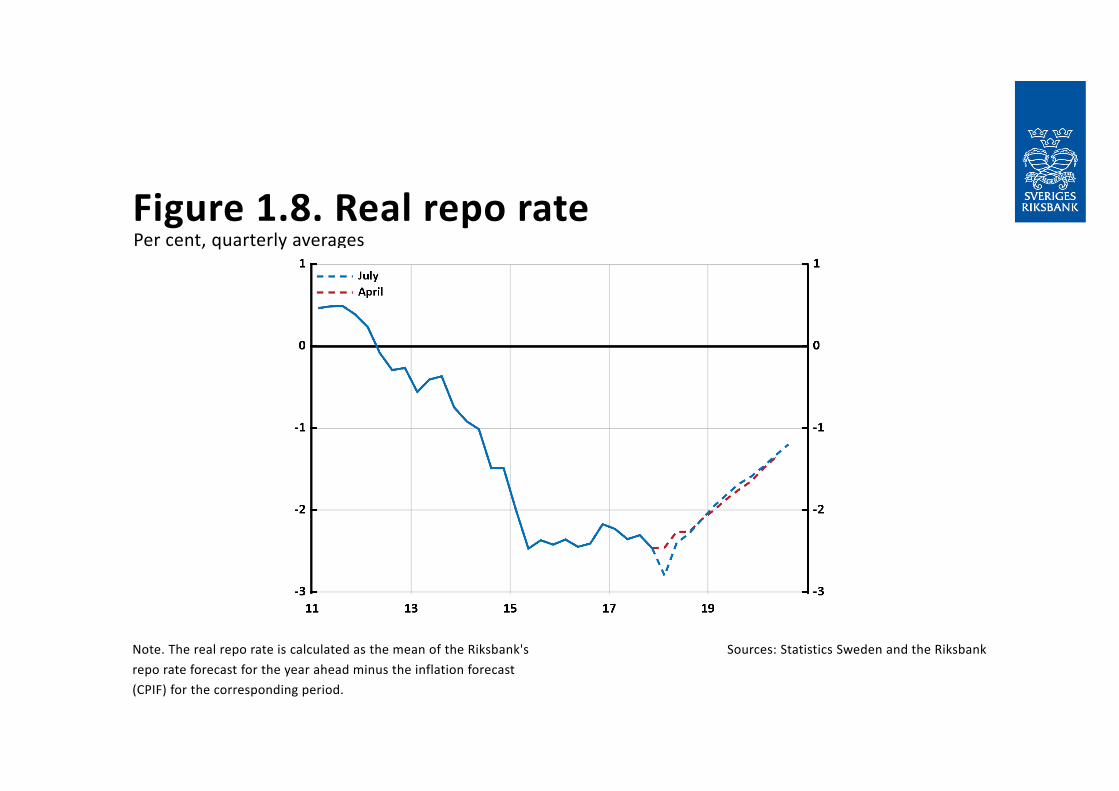
Figure 1.8. Real repo rate
Note. The real repo rate is calculated as the mean of the Riksbank'srepo rate forecast for the year ahead minus the inflation forecast (CPIF) for the corresponding period.
Sources: Statistics Sweden and the Riksbank
Per cent, quarterly averages
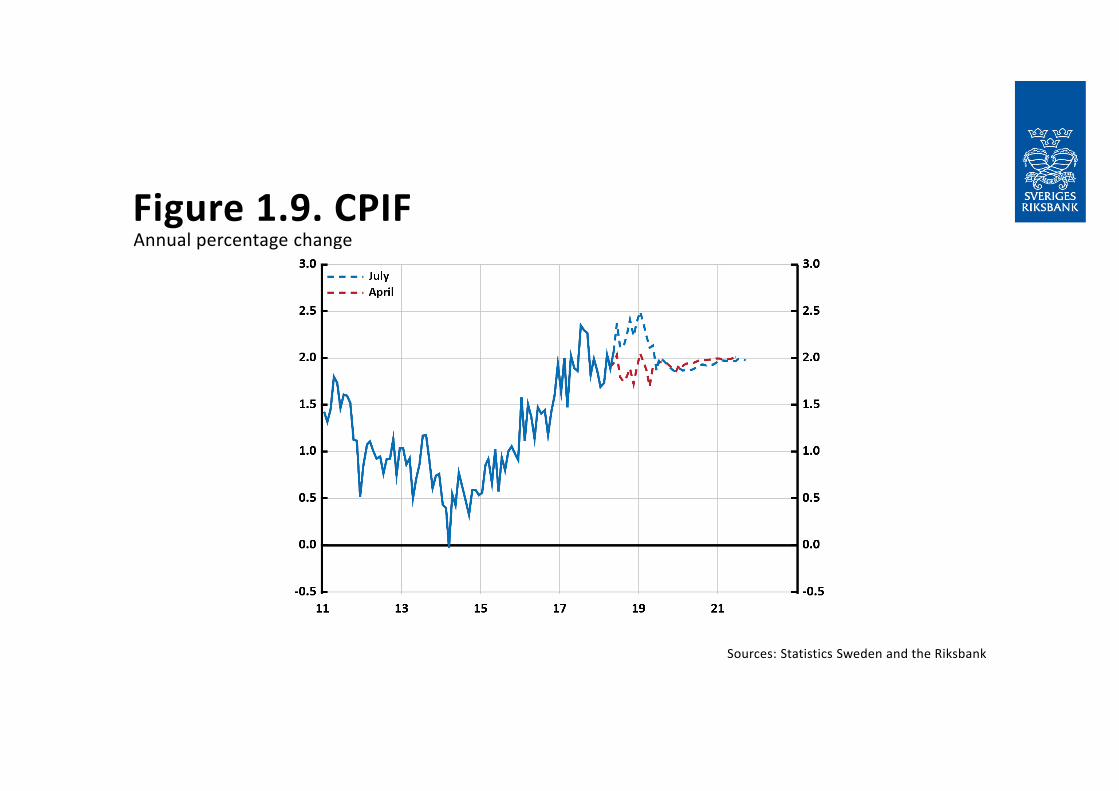
Figure 1.9. CPIF
Sources: Statistics Sweden and the Riksbank
Annual percentage change
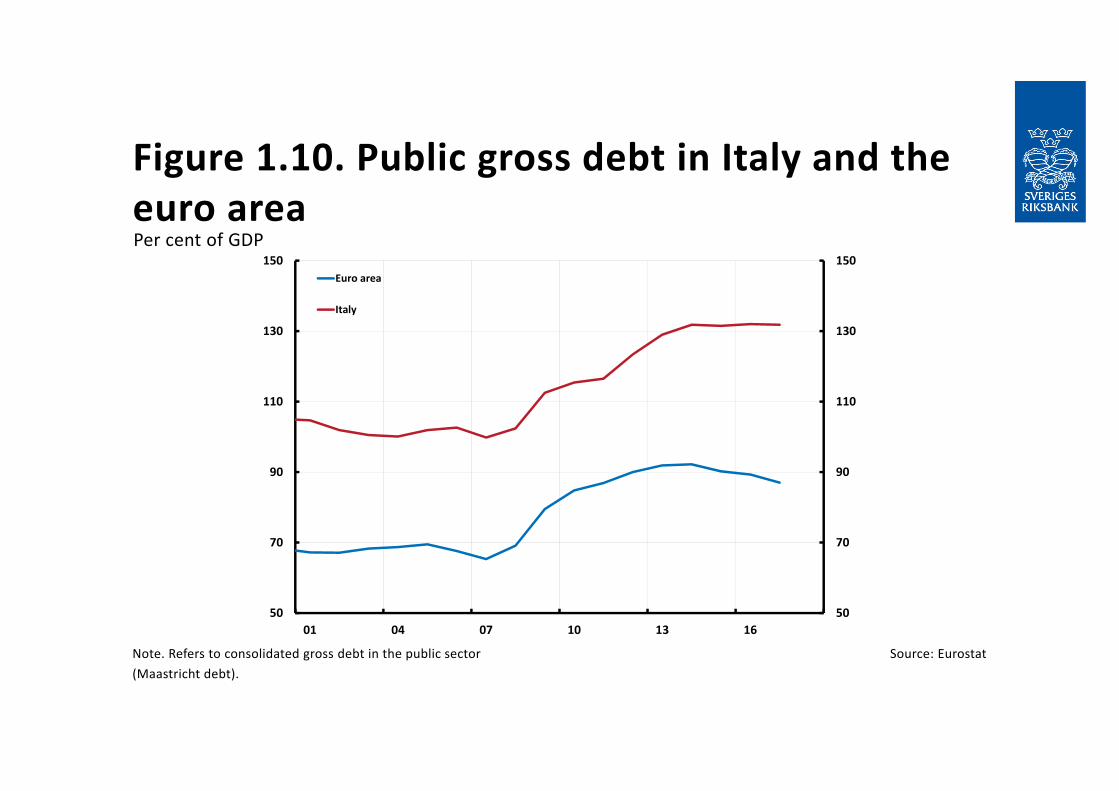
Figure 1.10. Public gross debt in Italy and the euro area
Note. Refers to consolidated gross debt in the public sector (Maastricht debt).
Source: Eurostat
Per cent of GDP
50
70
90
110
130
150
50
70
90
110
130
150
01 04 07 10 13 16
Euro area
Italy
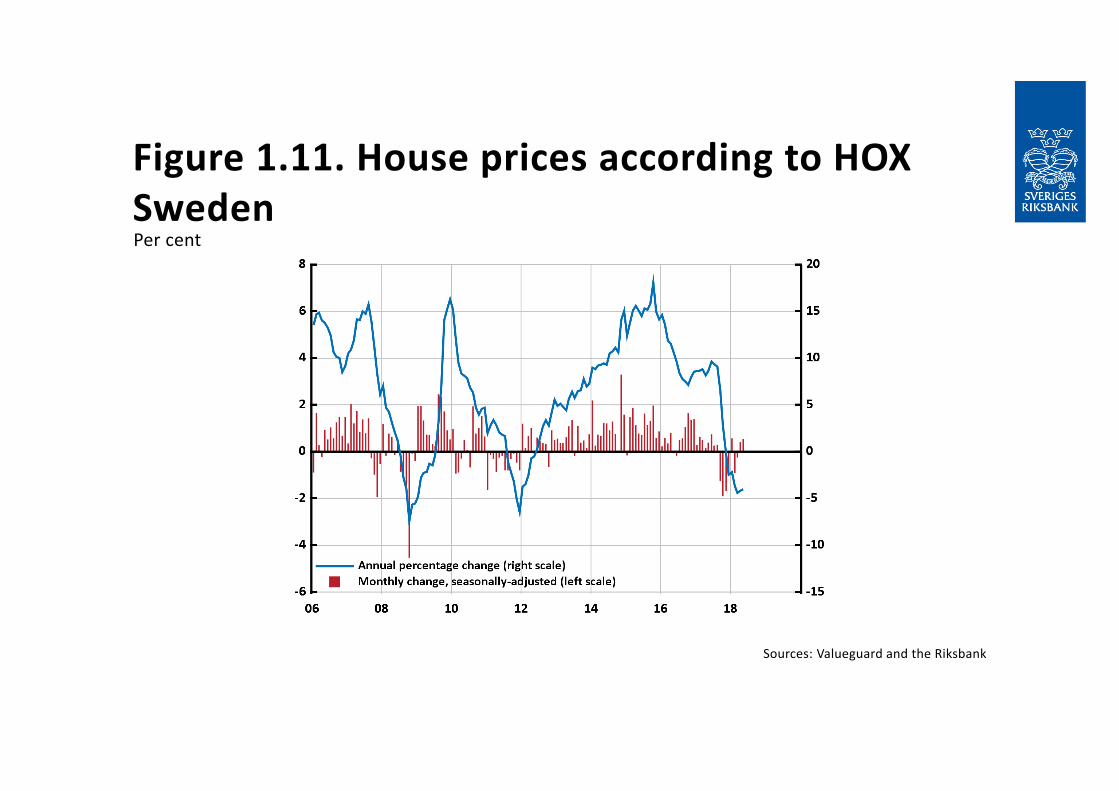
Figure 1.11. House prices according to HOX Sweden
Sources: Valueguard and the Riksbank
Per cent
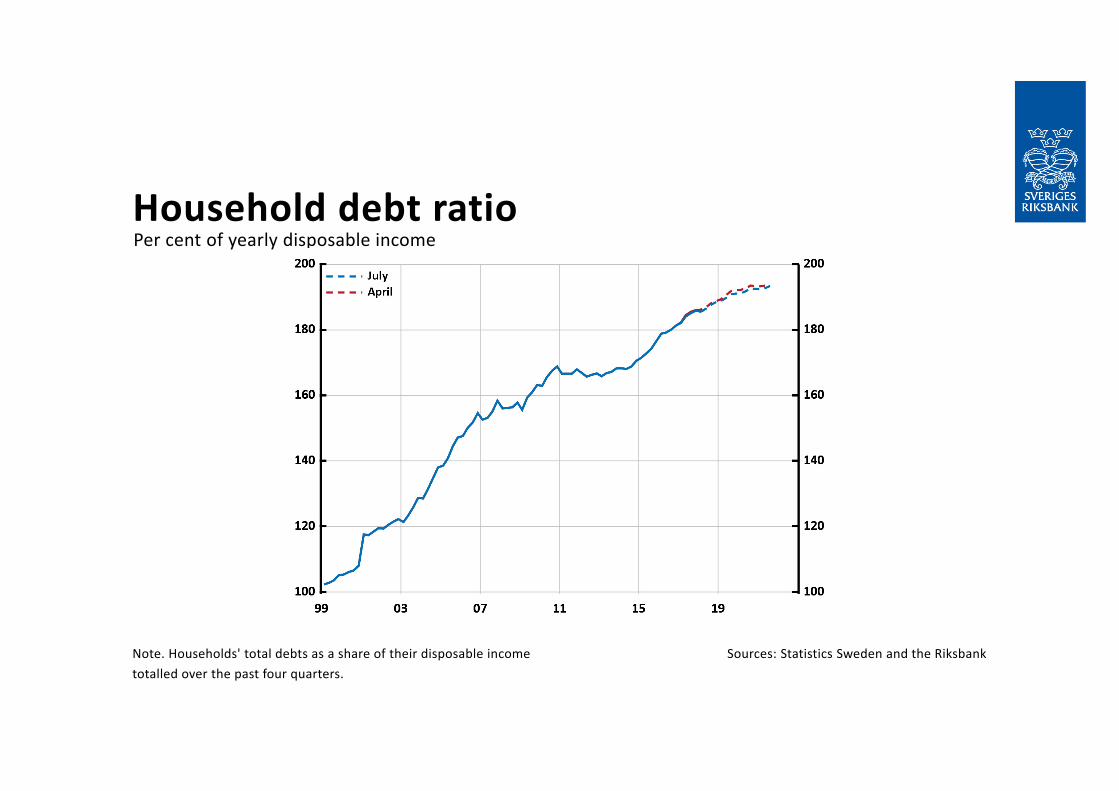
Household debt ratio
Note. Households' total debts as a share of their disposable income totalled over the past four quarters.
Sources: Statistics Sweden and the Riksbank
Per cent of yearly disposable income
Article – The Phillips curve and monetary policy
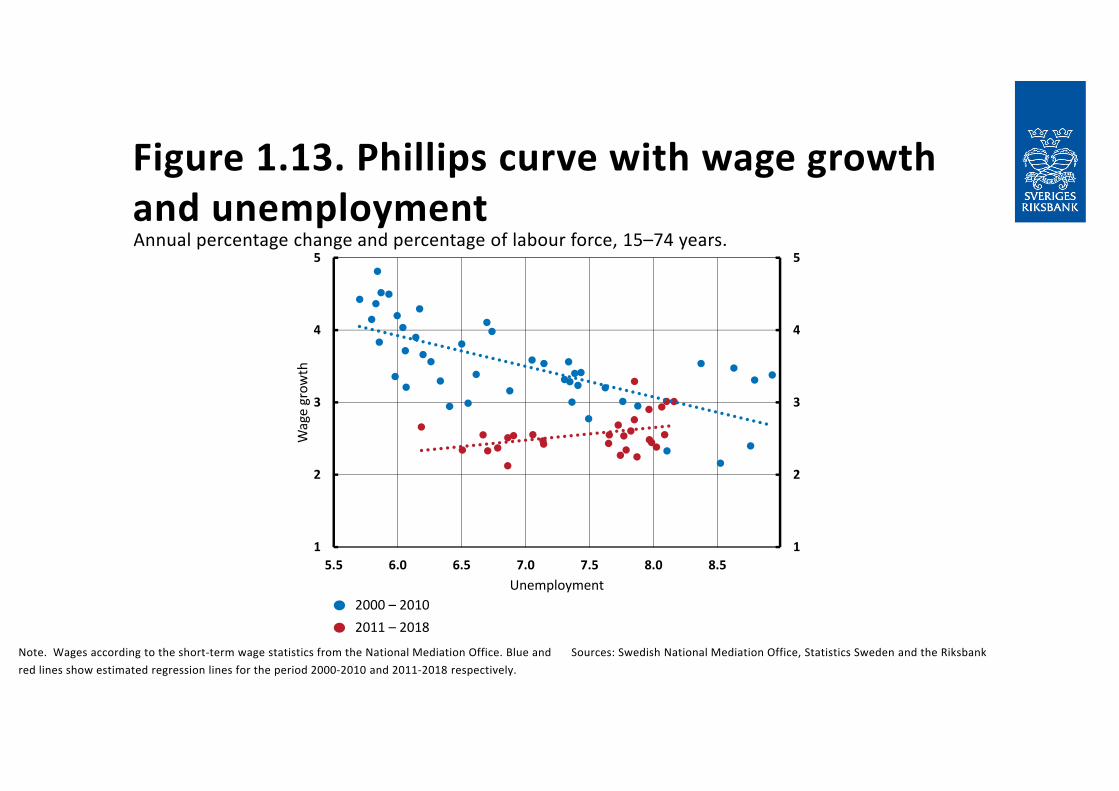
Figure 1.13. Phillips curve with wage growth and unemployment
Note. Wages according to the short‐term wage statistics from the National Mediation Office. Blue and red lines show estimated regression lines for the period 2000‐2010 and 2011‐2018 respectively.
Sources: Swedish National Mediation Office, Statistics Sweden and the Riksbank
Annual percentage change and percentage of labour force, 15–74 years.
1
2
3
4
5
1
2
3
4
5
5.5 6.0 6.5 7.0 7.5 8.0 8.5
Wage grow
th
Unemployment2000 – 20102011 – 2018
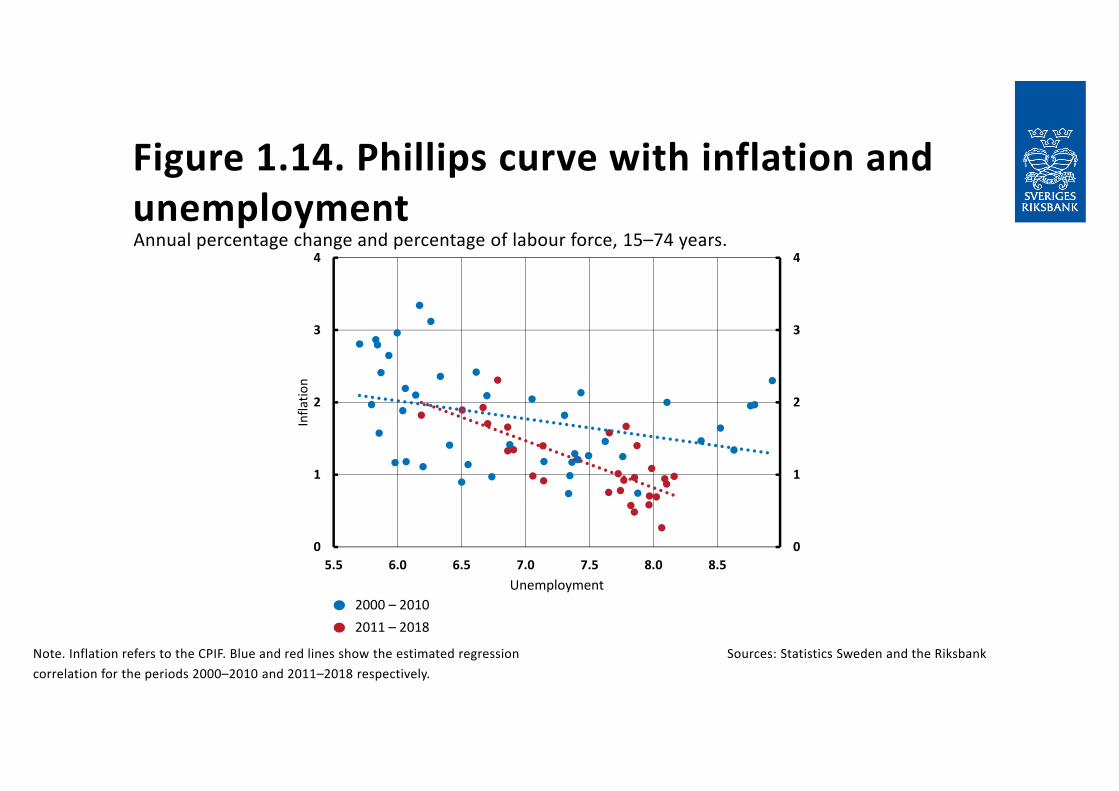
Figure 1.14. Phillips curve with inflation and unemployment
Note. Inflation refers to the CPIF. Blue and red lines show the estimated regression correlation for the periods 2000–2010 and 2011–2018 respectively.
Sources: Statistics Sweden and the Riksbank
Annual percentage change and percentage of labour force, 15–74 years.
0
1
2
3
4
0
1
2
3
4
5.5 6.0 6.5 7.0 7.5 8.0 8.5
Infla
tion
Unemployment2000 – 20102011 – 2018
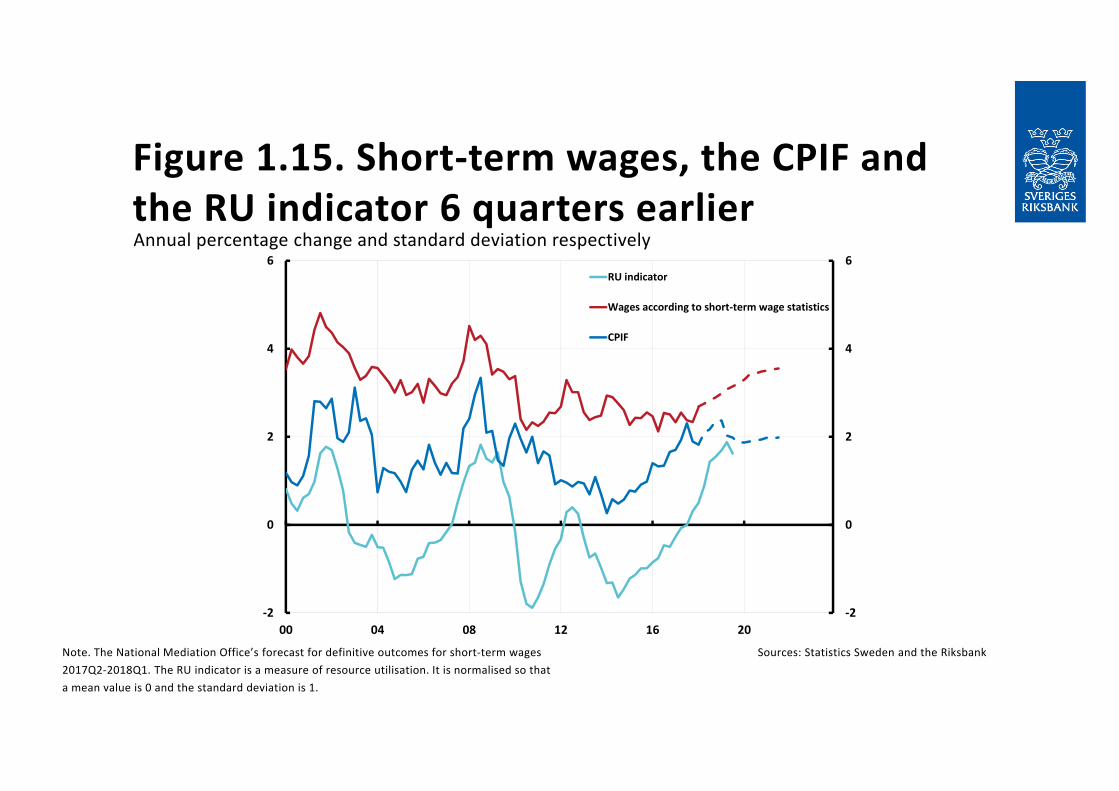
Figure 1.15. Short‐term wages, the CPIF and the RU indicator 6 quarters earlier
Note. The National Mediation Office’s forecast for definitive outcomes for short‐term wages 2017Q2‐2018Q1. The RU indicator is a measure of resource utilisation. It is normalised so that a mean value is 0 and the standard deviation is 1.
Sources: Statistics Sweden and the Riksbank
Annual percentage change and standard deviation respectively
‐2
0
2
4
6
‐2
0
2
4
6
00 04 08 12 16 20
RU indicator
Wages according to short‐term wage statistics
CPIF
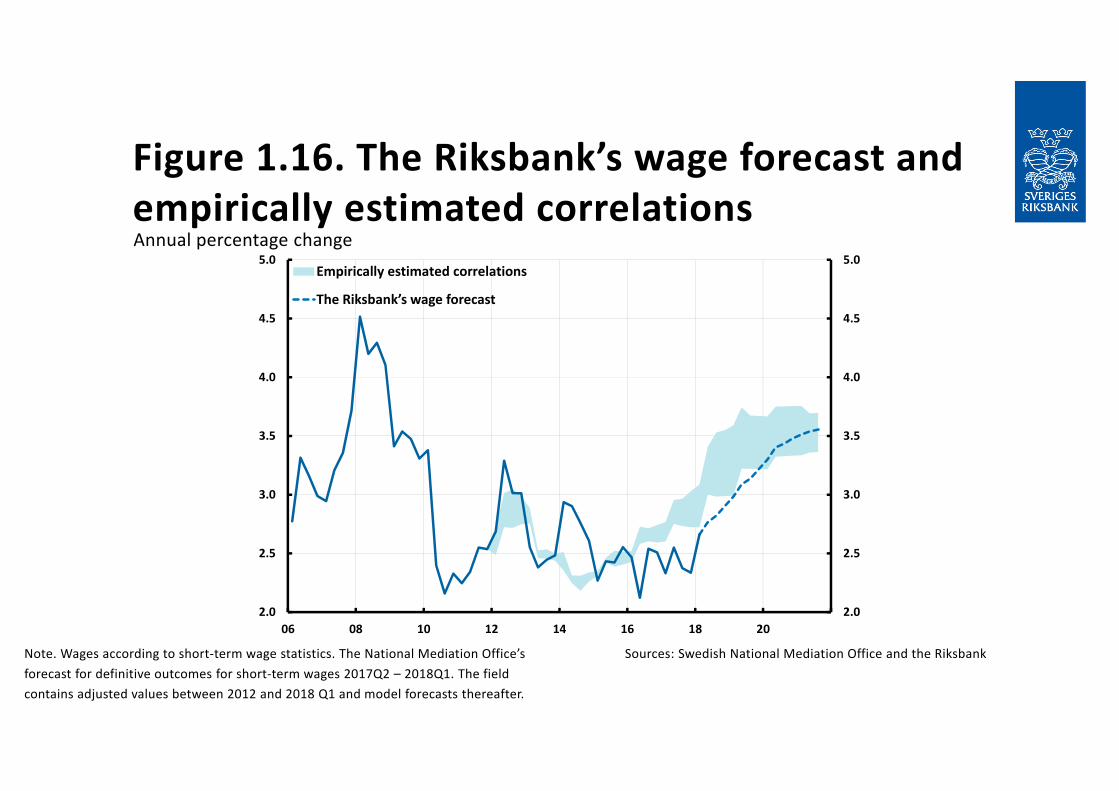
Figure 1.16. The Riksbank’s wage forecast and empirically estimated correlations
Note. Wages according to short‐term wage statistics. The National Mediation Office’s forecast for definitive outcomes for short‐term wages 2017Q2 – 2018Q1. The field contains adjusted values between 2012 and 2018 Q1 and model forecasts thereafter.
Sources: Swedish National Mediation Office and the Riksbank
Annual percentage change
2.0
2.5
3.0
3.5
4.0
4.5
5.0
2.0
2.5
3.0
3.5
4.0
4.5
5.0
06 08 10 12 14 16 18 20
Empirically estimated correlations
The Riksbank’s wage forecast
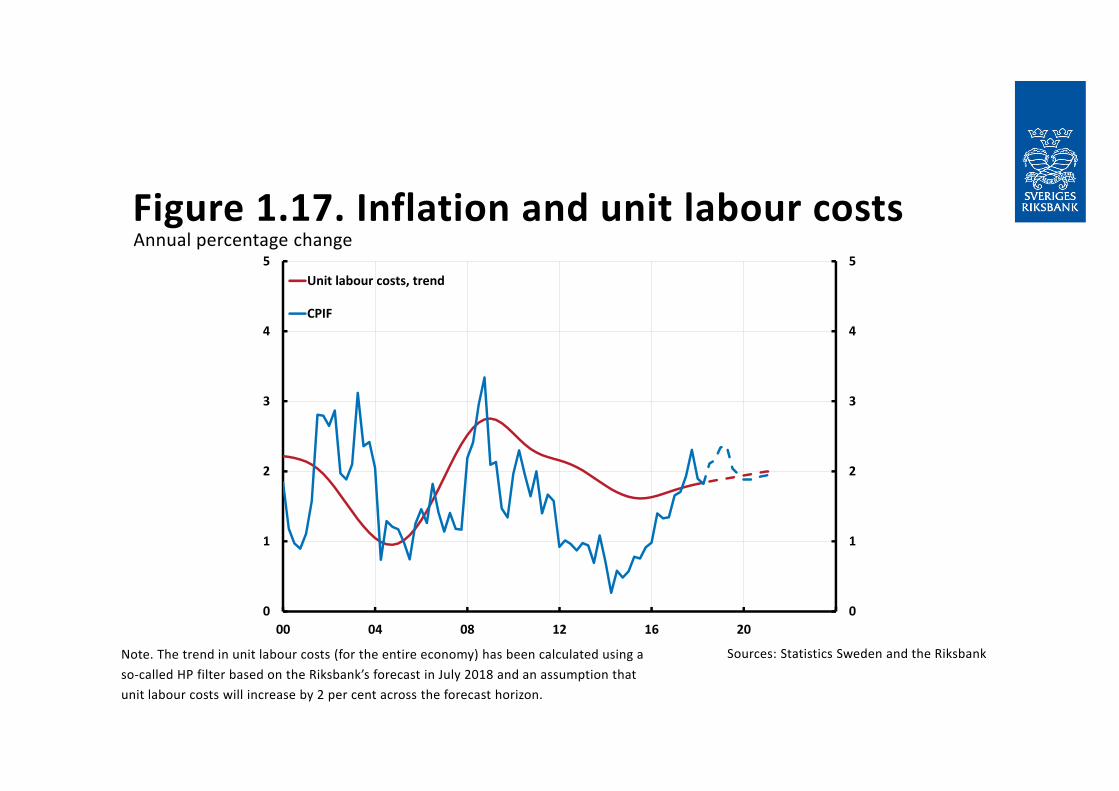
Figure 1.17. Inflation and unit labour costs
Note. The trend in unit labour costs (for the entire economy) has been calculated using a so‐called HP filter based on the Riksbank’s forecast in July 2018 and an assumption that unit labour costs will increase by 2 per cent across the forecast horizon.
Sources: Statistics Sweden and the Riksbank
Annual percentage change
0
1
2
3
4
5
0
1
2
3
4
5
00 04 08 12 16 20
Unit labour costs, trend
CPIF

Chapter 2
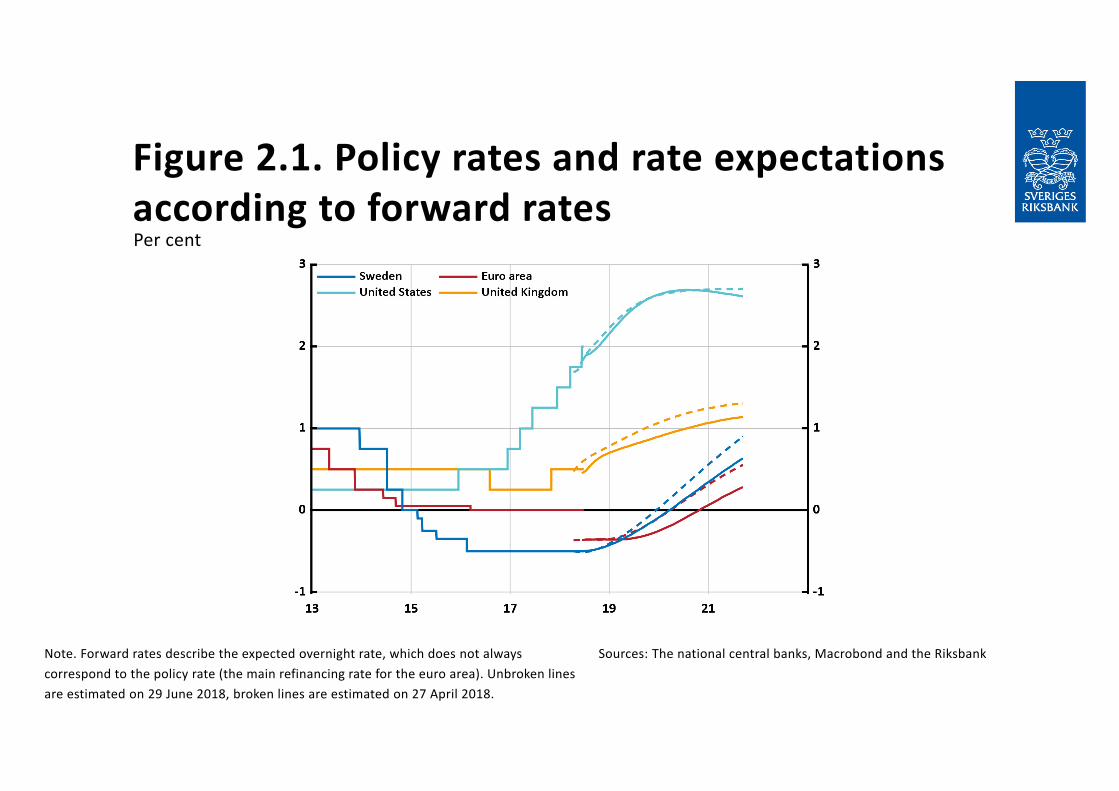
Figure 2.1. Policy rates and rate expectations according to forward rates
Note. Forward rates describe the expected overnight rate, which does not always correspond to the policy rate (the main refinancing rate for the euro area). Unbroken lines are estimated on 29 June 2018, broken lines are estimated on 27 April 2018.
Sources: The national central banks, Macrobond and the Riksbank
Per cent
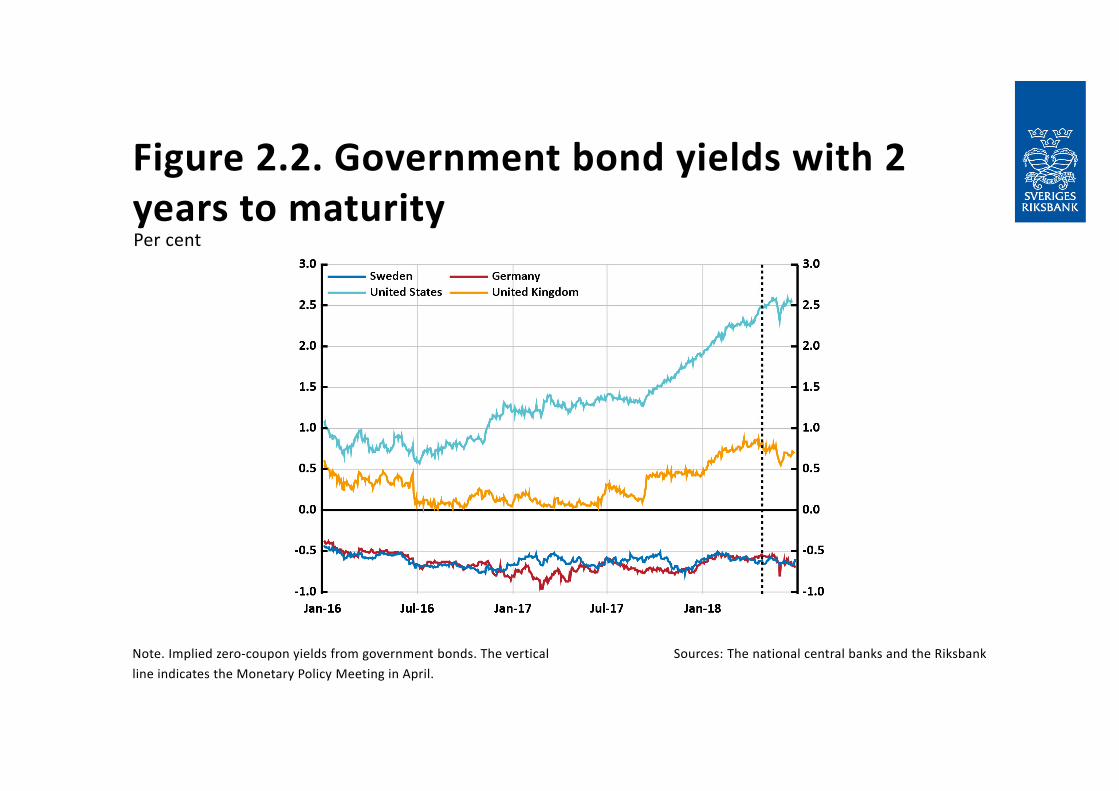
Figure 2.2. Government bond yields with 2 years to maturity
Note. Implied zero‐coupon yields from government bonds. The vertical line indicates the Monetary Policy Meeting in April.
Sources: The national central banks and the Riksbank
Per cent
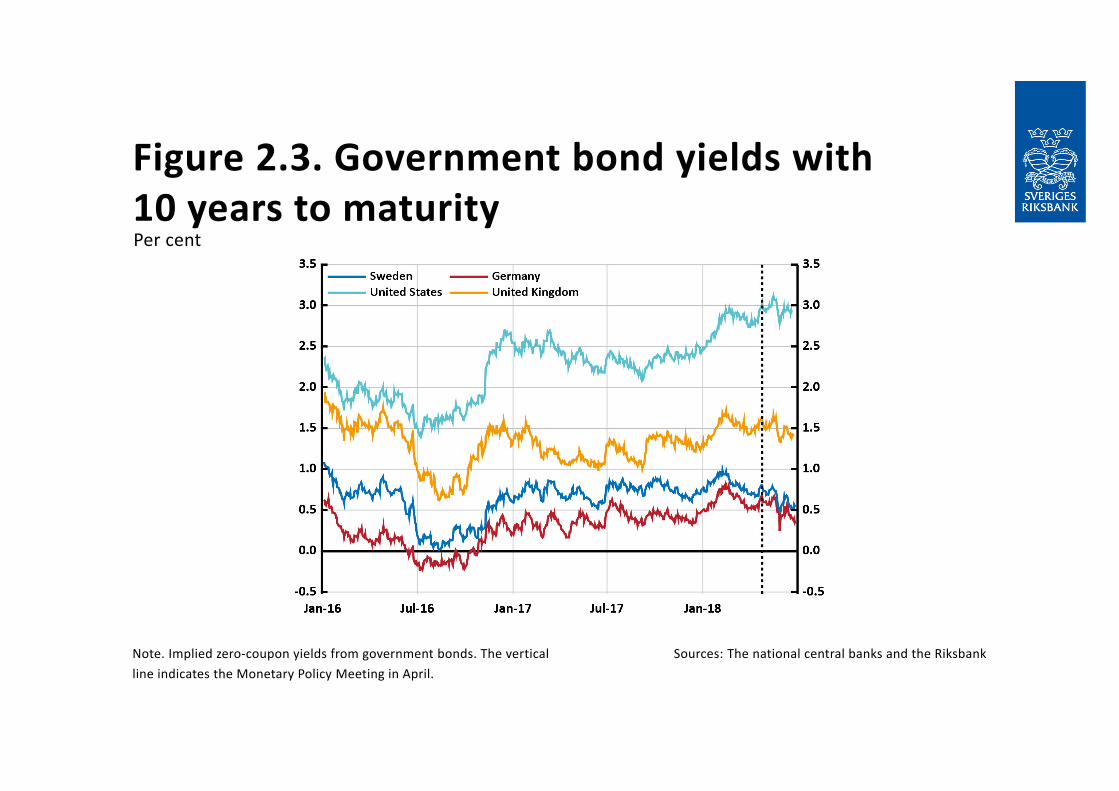
Figure 2.3. Government bond yields with 10 years to maturity
Note. Implied zero‐coupon yields from government bonds. The vertical line indicates the Monetary Policy Meeting in April.
Sources: The national central banks and the Riksbank
Per cent
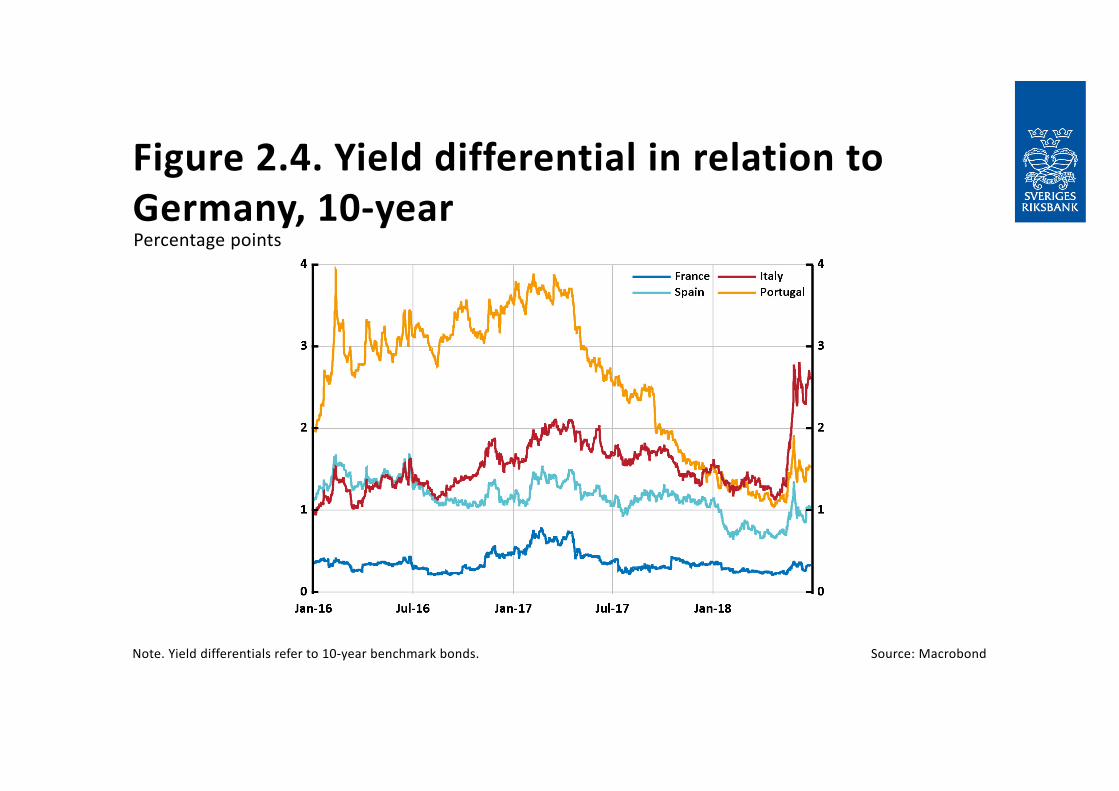
Figure 2.4. Yield differential in relation to Germany, 10‐year
Note. Yield differentials refer to 10‐year benchmark bonds. Source: Macrobond
Percentage points
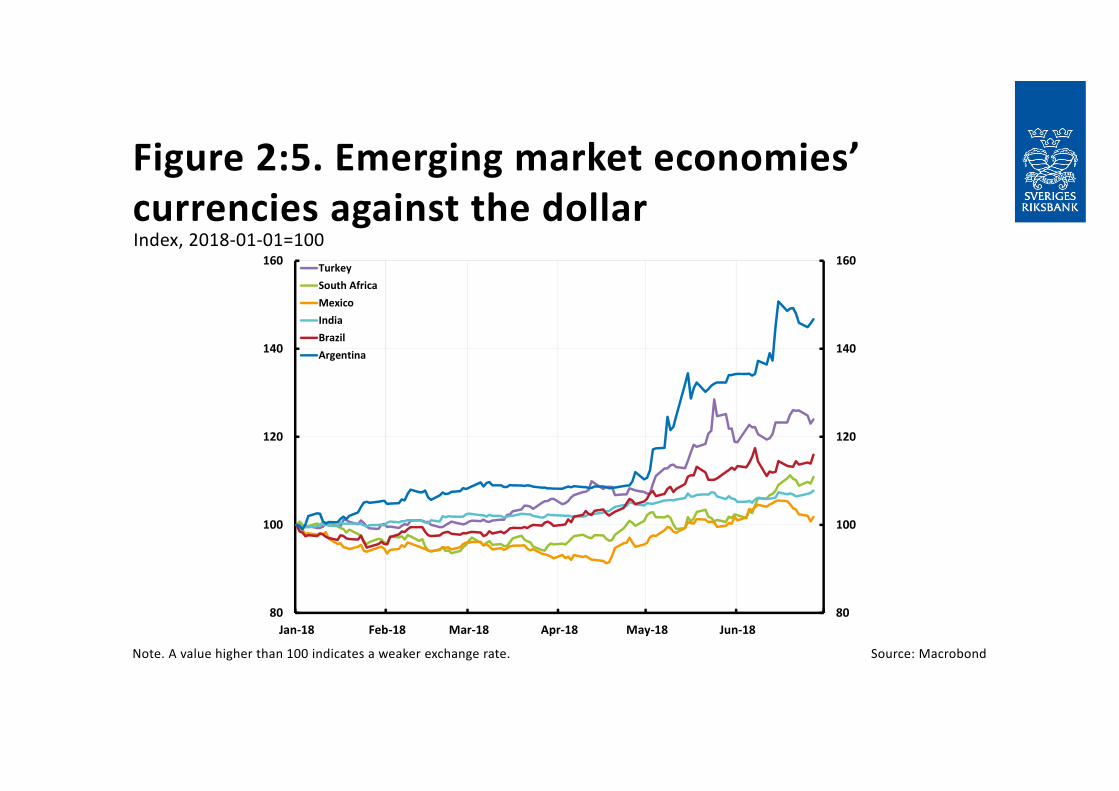
Figure 2:5. Emerging market economies’ currencies against the dollar
Note. A value higher than 100 indicates a weaker exchange rate. Source: Macrobond
Index, 2018‐01‐01=100
80
100
120
140
160
80
100
120
140
160
Jan‐18 Feb‐18 Mar‐18 Apr‐18 May‐18 Jun‐18
TurkeySouth AfricaMexicoIndiaBrazilArgentina
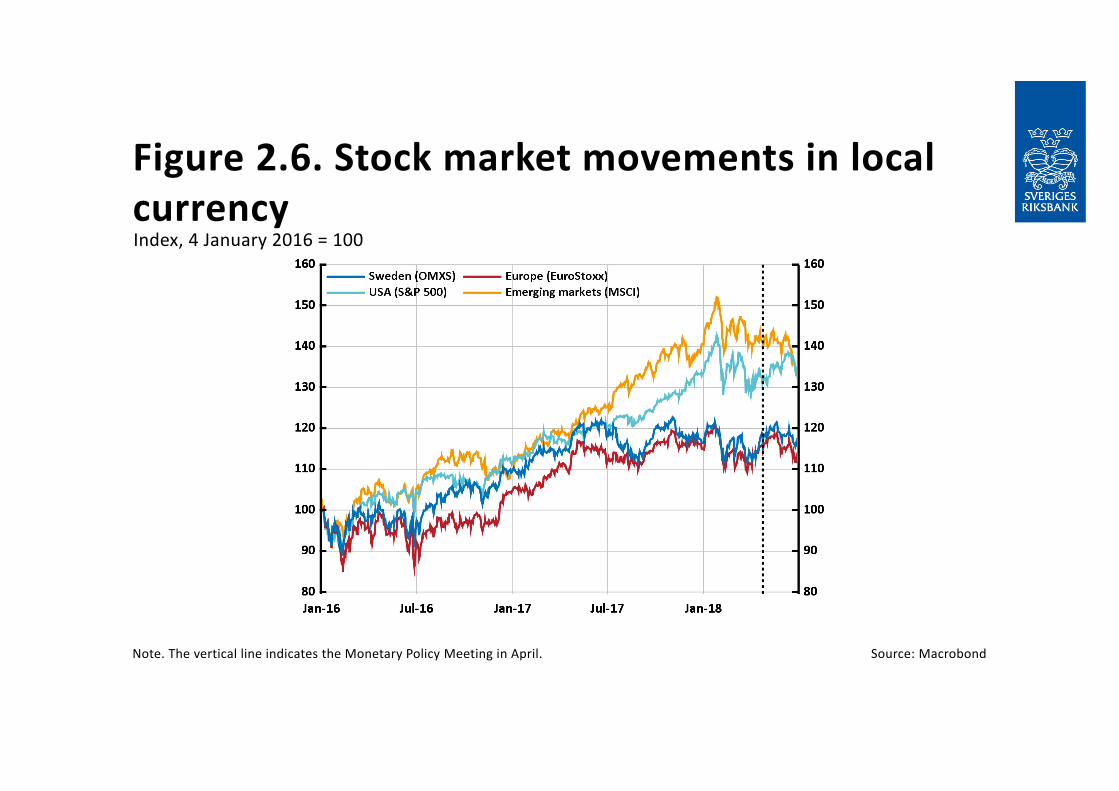
Figure 2.6. Stock market movements in local currency
Note. The vertical line indicates the Monetary Policy Meeting in April. Source: Macrobond
Index, 4 January 2016 = 100
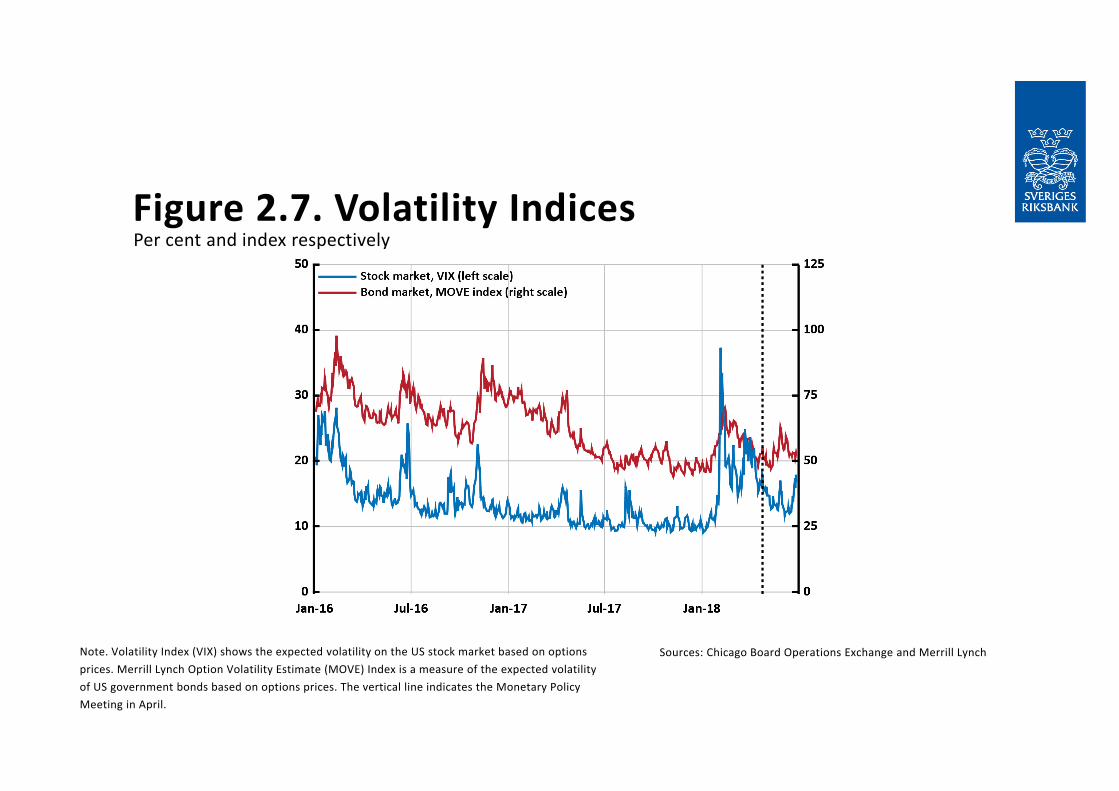
Figure 2.7. Volatility Indices
Note. Volatility Index (VIX) shows the expected volatility on the US stock market based on options prices. Merrill Lynch Option Volatility Estimate (MOVE) Index is a measure of the expected volatility of US government bonds based on options prices. The vertical line indicates the Monetary Policy Meeting in April.
Sources: Chicago Board Operations Exchange and Merrill Lynch
Per cent and index respectively
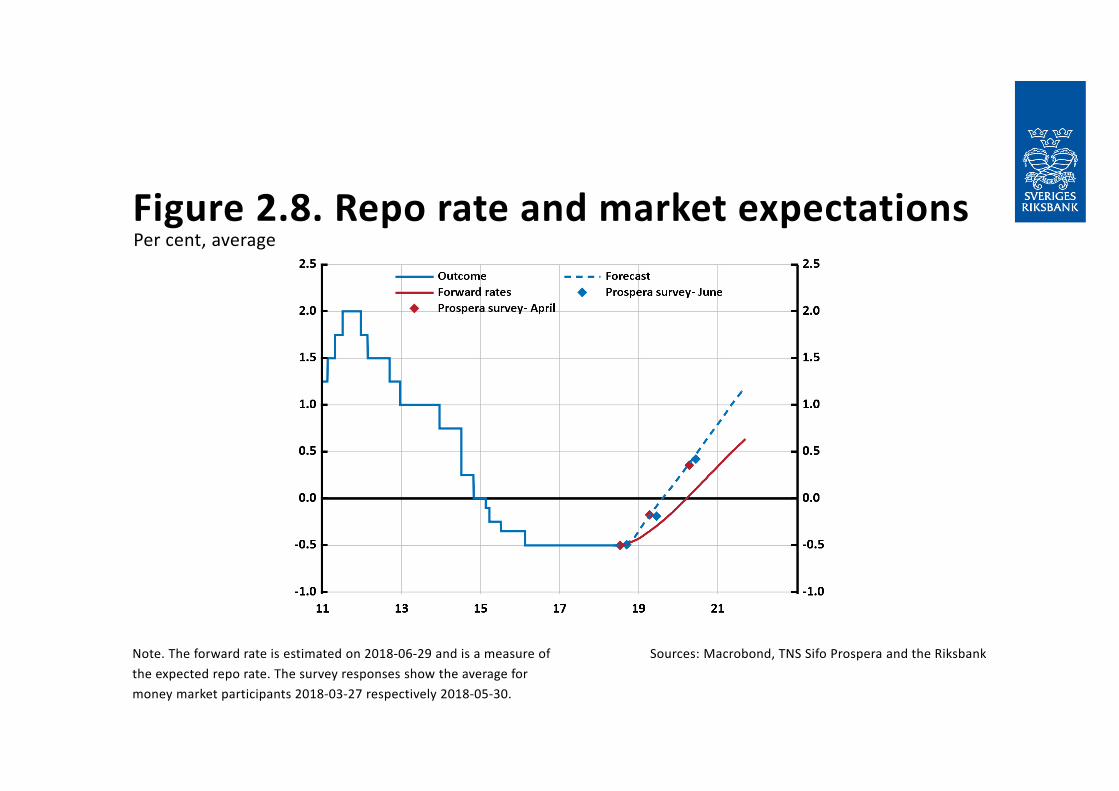
Figure 2.8. Repo rate and market expectations
Note. The forward rate is estimated on 2018‐06‐29 and is a measure of the expected repo rate. The survey responses show the average for money market participants 2018‐03‐27 respectively 2018‐05‐30.
Sources: Macrobond, TNS Sifo Prospera and the Riksbank
Per cent, average

Figure 2.9. Yield spread between mortgage bonds and government bonds
Note. Yields on mortgage bonds and government bonds are zero coupon yields calculated using the Nelson‐Siegel method. The vertical line indicates the Monetary Policy Meeting in April.
Sources: Macrobond and the Riksbank
Percentage points
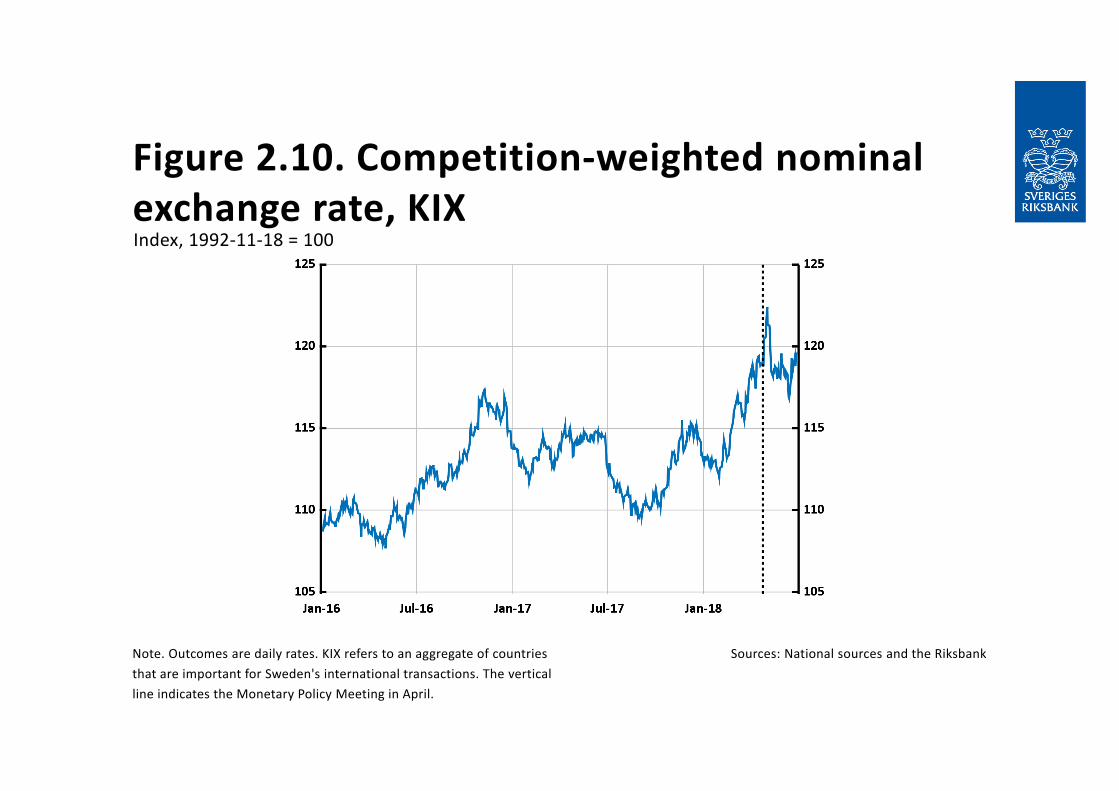
Figure 2.10. Competition‐weighted nominal exchange rate, KIX
Note. Outcomes are daily rates. KIX refers to an aggregate of countries that are important for Sweden's international transactions. The vertical line indicates the Monetary Policy Meeting in April.
Sources: National sources and the Riksbank
Index, 1992‐11‐18 = 100
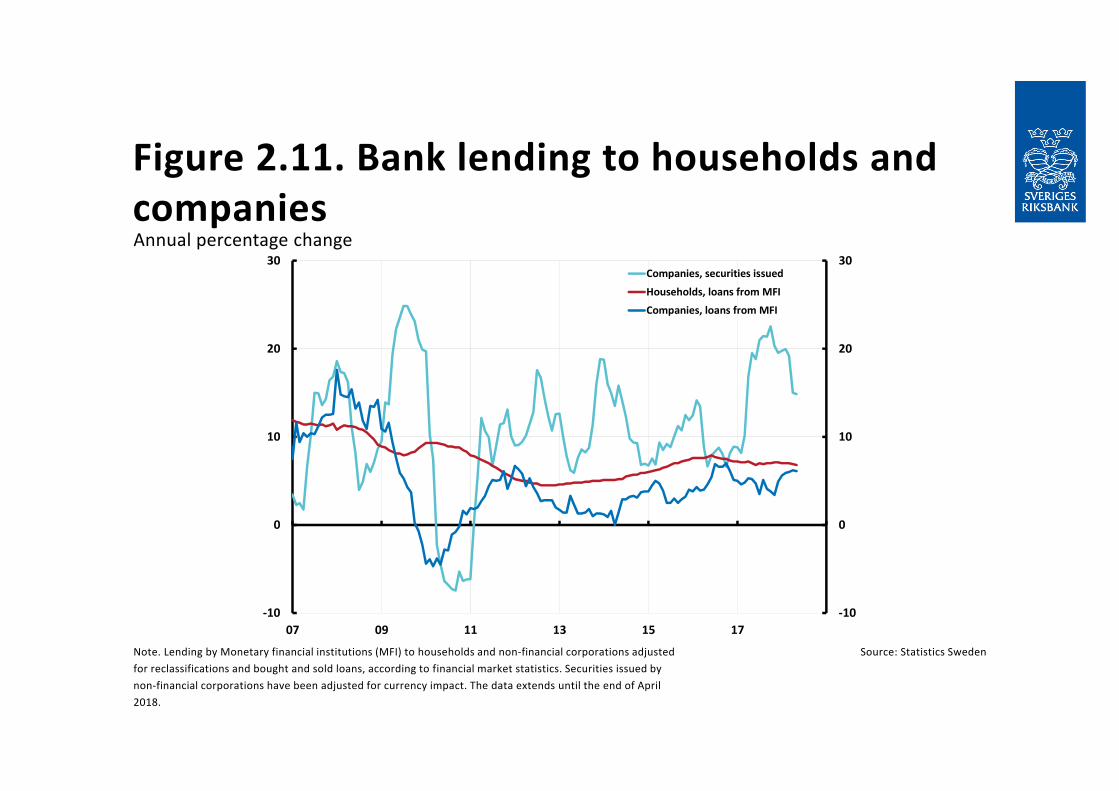
Figure 2.11. Bank lending to households and companies
Note. Lending by Monetary financial institutions (MFI) to households and non‐financial corporations adjusted for reclassifications and bought and sold loans, according to financial market statistics. Securities issued by non‐financial corporations have been adjusted for currency impact. The data extends until the end of April 2018.
Source: Statistics Sweden
Annual percentage change
‐10
0
10
20
30
‐10
0
10
20
30
07 09 11 13 15 17
Companies, securities issued
Households, loans from MFI
Companies, loans from MFI
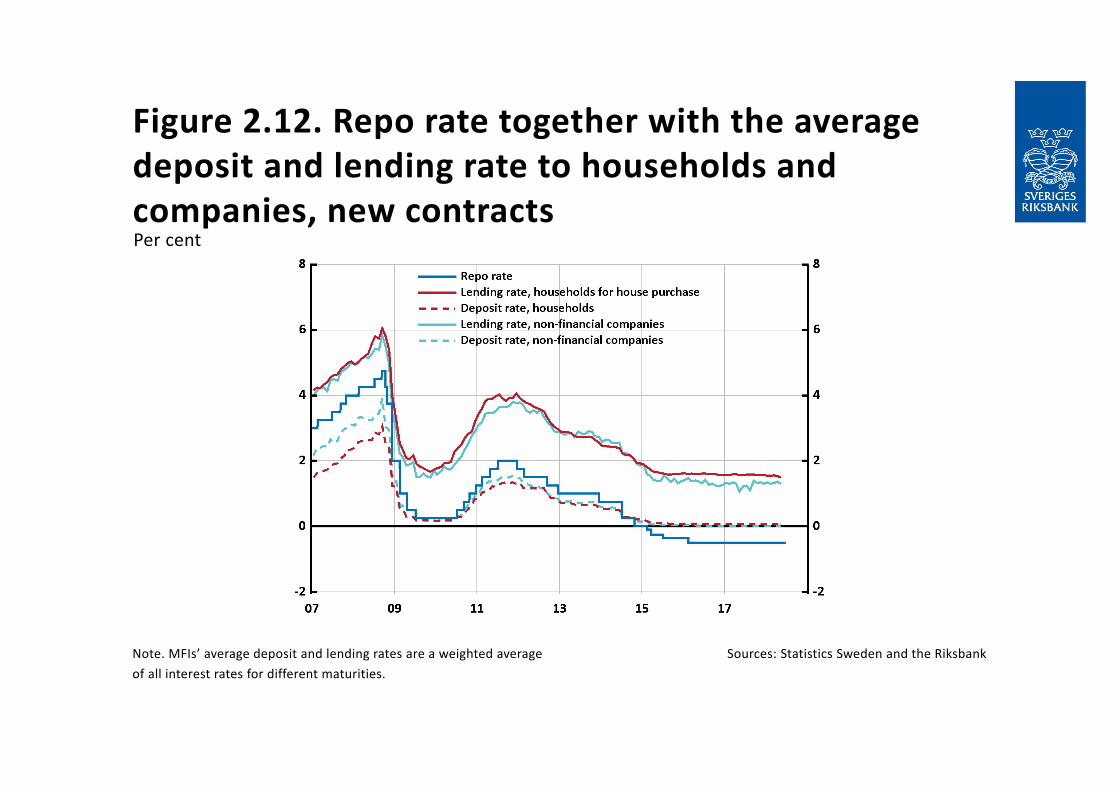
Figure 2.12. Repo rate together with the average deposit and lending rate to households and companies, new contracts
Note. MFIs’ average deposit and lending rates are a weighted average of all interest rates for different maturities.
Sources: Statistics Sweden and the Riksbank
Per cent
Chapter 3

Figure 3.1. CPIF and variation band
‐1
0
1
2
3
4
‐1
0
1
2
3
4
11 13 15 17Note. The pink area shows the Riksbank’s variation band and covers about three‐quarters of the outcomes since January 1995. The variation band is a means of showing whether the deviation from the inflation target is unusually large. The dotted line refers to the Riksbank's forecast.
Sources: Statistics Sweden and the Riksbank
Annual percentage change
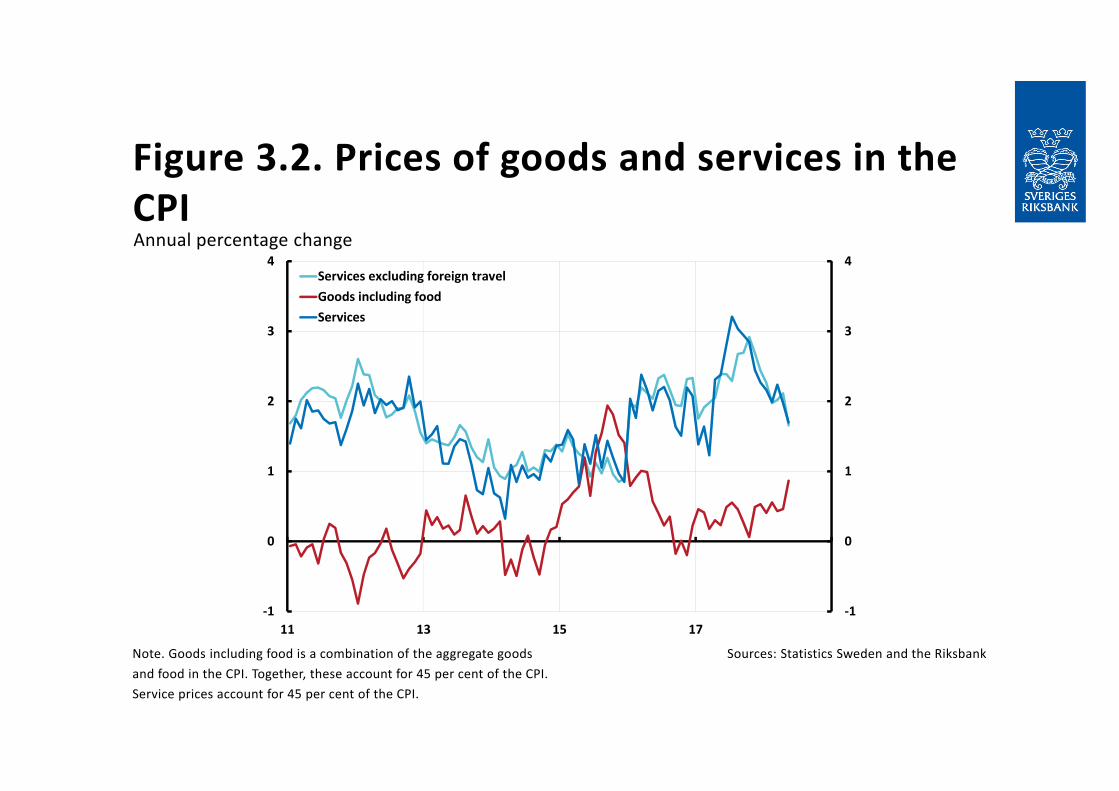
Figure 3.2. Prices of goods and services in the CPI
‐1
0
1
2
3
4
‐1
0
1
2
3
4
11 13 15 17
Services excluding foreign travelGoods including foodServices
Note. Goods including food is a combination of the aggregate goods and food in the CPI. Together, these account for 45 per cent of the CPI. Service prices account for 45 per cent of the CPI.
Sources: Statistics Sweden and the Riksbank
Annual percentage change
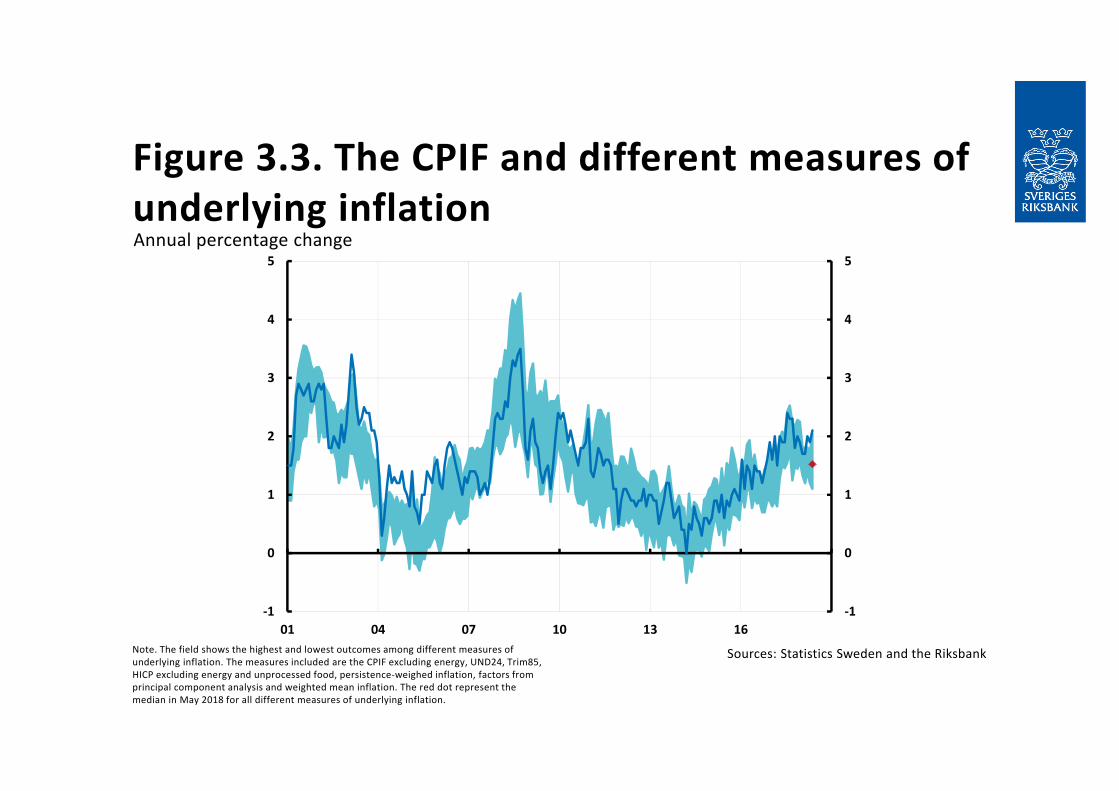
Figure 3.3. The CPIF and different measures of underlying inflation
‐1
0
1
2
3
4
5
‐1
0
1
2
3
4
5
01 04 07 10 13 16Note. The field shows the highest and lowest outcomes among different measures of underlying inflation. The measures included are the CPIF excluding energy, UND24, Trim85, HICP excluding energy and unprocessed food, persistence‐weighed inflation, factors from principal component analysis and weighted mean inflation. The red dot represent the median in May 2018 for all different measures of underlying inflation.
Sources: Statistics Sweden and the Riksbank
Annual percentage change
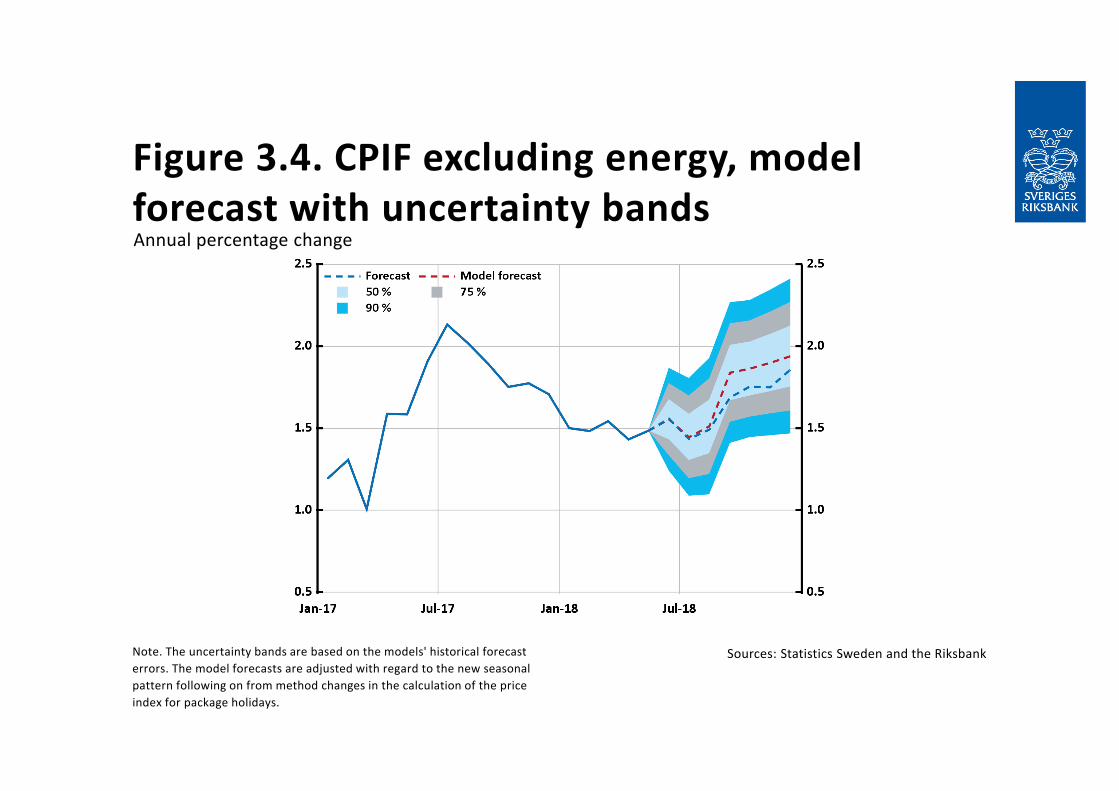
Figure 3.4. CPIF excluding energy, model forecast with uncertainty bands
Note. The uncertainty bands are based on the models' historical forecast errors. The model forecasts are adjusted with regard to the new seasonal pattern following on from method changes in the calculation of the price index for package holidays.
Sources: Statistics Sweden and the Riksbank
Annual percentage change
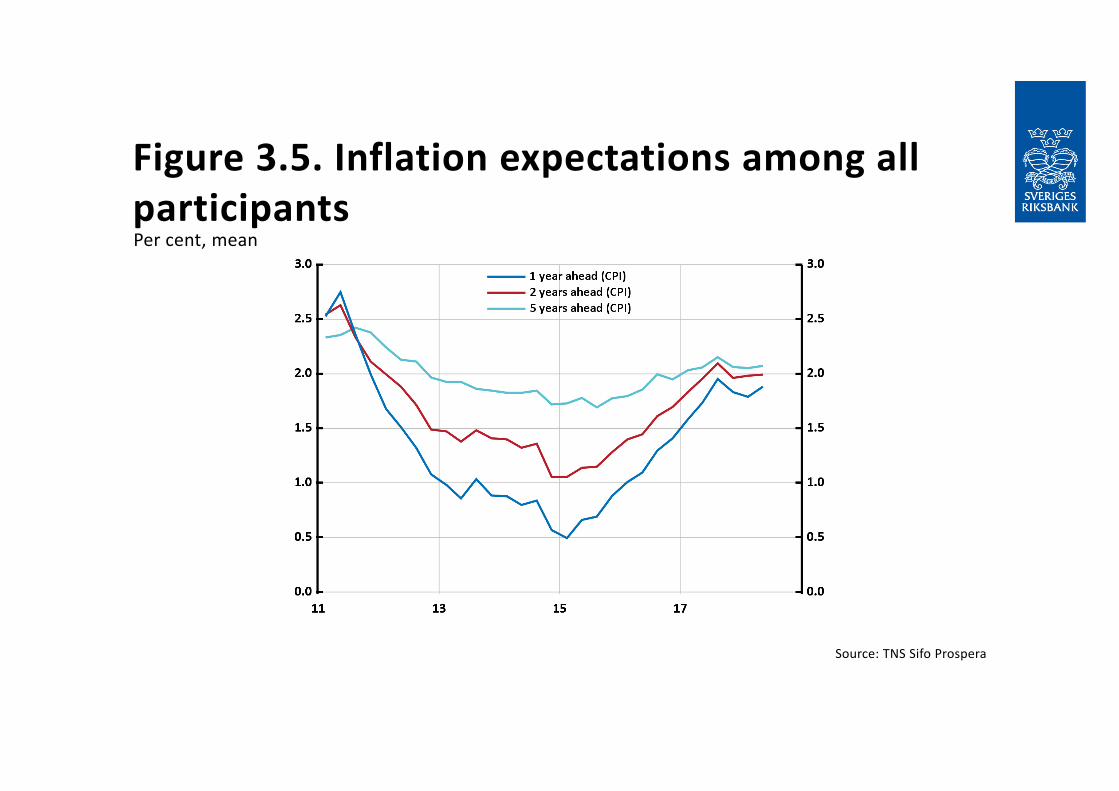
Figure 3.5. Inflation expectations among all participants
Source: TNS Sifo Prospera
Per cent, mean
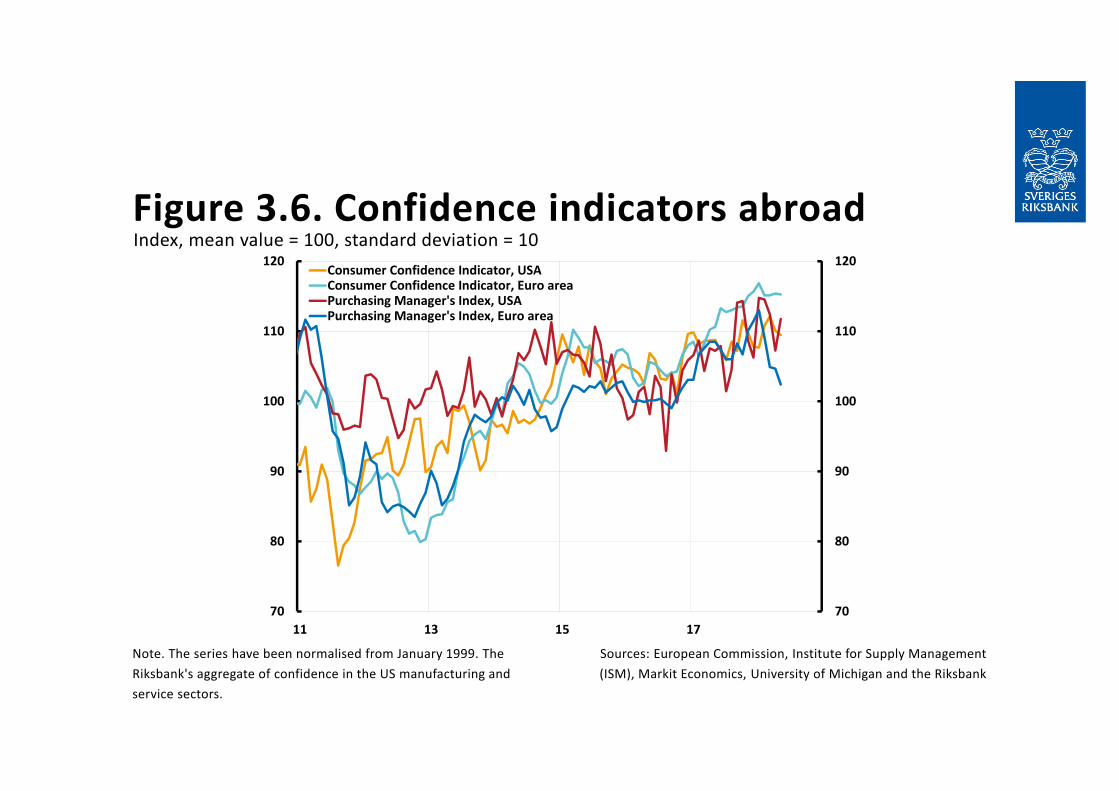
Figure 3.6. Confidence indicators abroad
Note. The series have been normalised from January 1999. The Riksbank's aggregate of confidence in the US manufacturing and service sectors.
Sources: European Commission, Institute for Supply Management (ISM), Markit Economics, University of Michigan and the Riksbank
Index, mean value = 100, standard deviation = 10
70
80
90
100
110
120
70
80
90
100
110
120
11 13 15 17
Consumer Confidence Indicator, USAConsumer Confidence Indicator, Euro areaPurchasing Manager's Index, USAPurchasing Manager's Index, Euro area
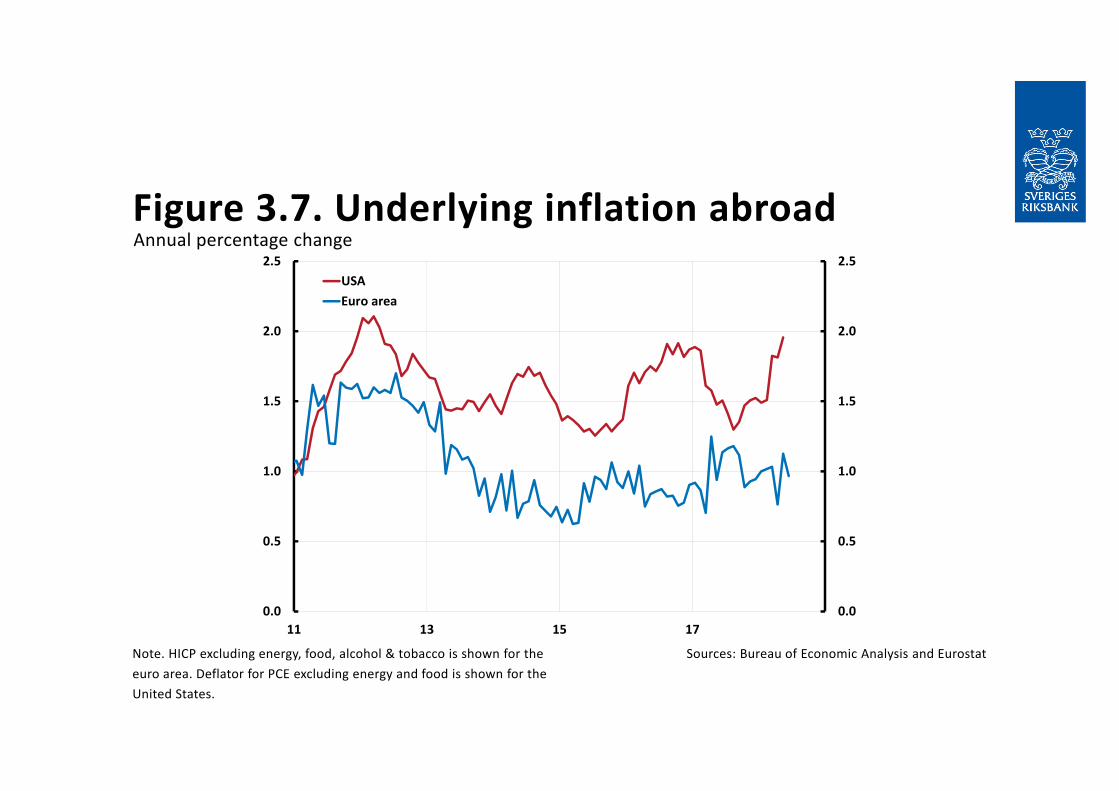
Figure 3.7. Underlying inflation abroad
Note. HICP excluding energy, food, alcohol & tobacco is shown for the euro area. Deflator for PCE excluding energy and food is shown for the United States.
Sources: Bureau of Economic Analysis and Eurostat
Annual percentage change
0.0
0.5
1.0
1.5
2.0
2.5
0.0
0.5
1.0
1.5
2.0
2.5
11 13 15 17
USAEuro area
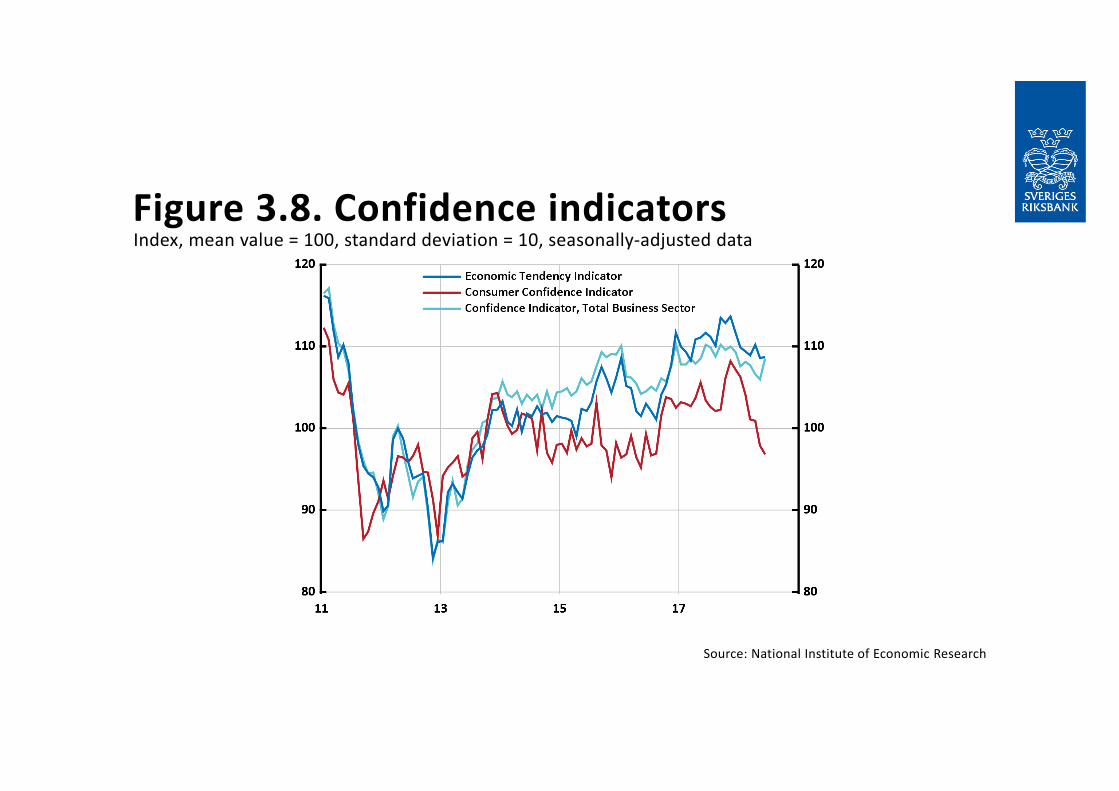
Figure 3.8. Confidence indicators
Source: National Institute of Economic Research
Index, mean value = 100, standard deviation = 10, seasonally‐adjusted data
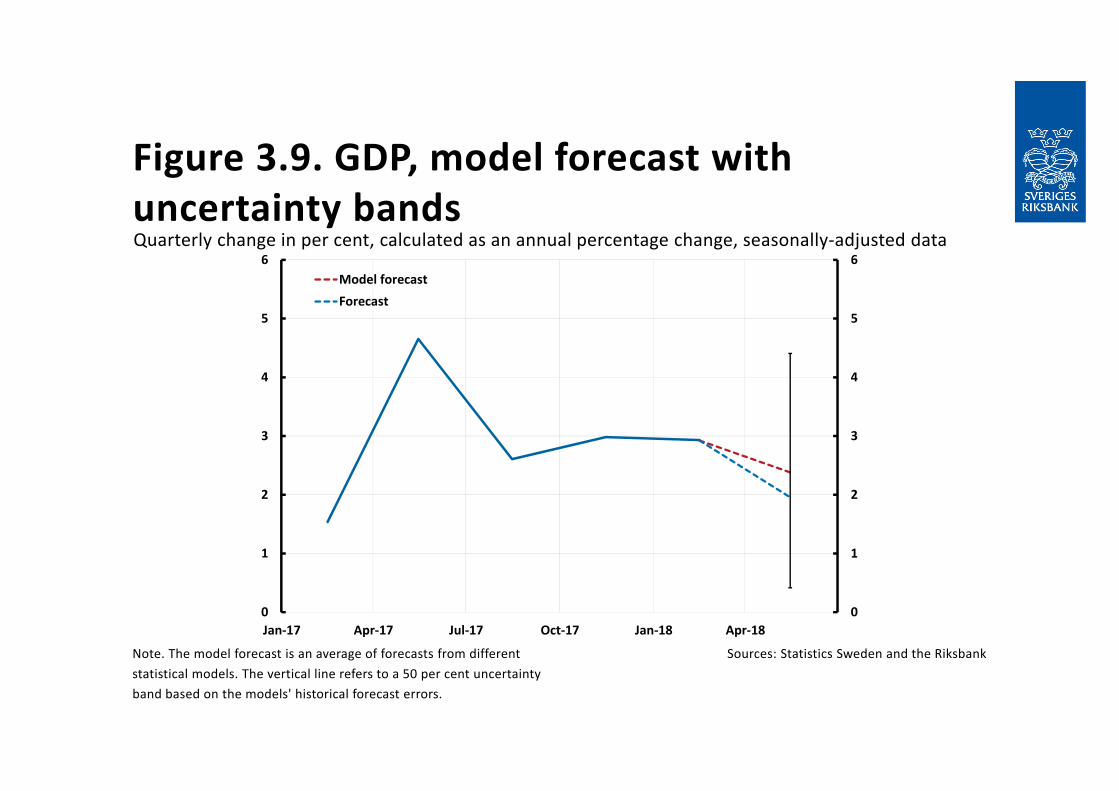
Figure 3.9. GDP, model forecast with uncertainty bands
Note. The model forecast is an average of forecasts from different statistical models. The vertical line refers to a 50 per cent uncertainty band based on the models' historical forecast errors.
Sources: Statistics Sweden and the Riksbank
Quarterly change in per cent, calculated as an annual percentage change, seasonally‐adjusted data
0
1
2
3
4
5
6
0
1
2
3
4
5
6
Jan‐17 Apr‐17 Jul‐17 Oct‐17 Jan‐18 Apr‐18
Model forecastForecast
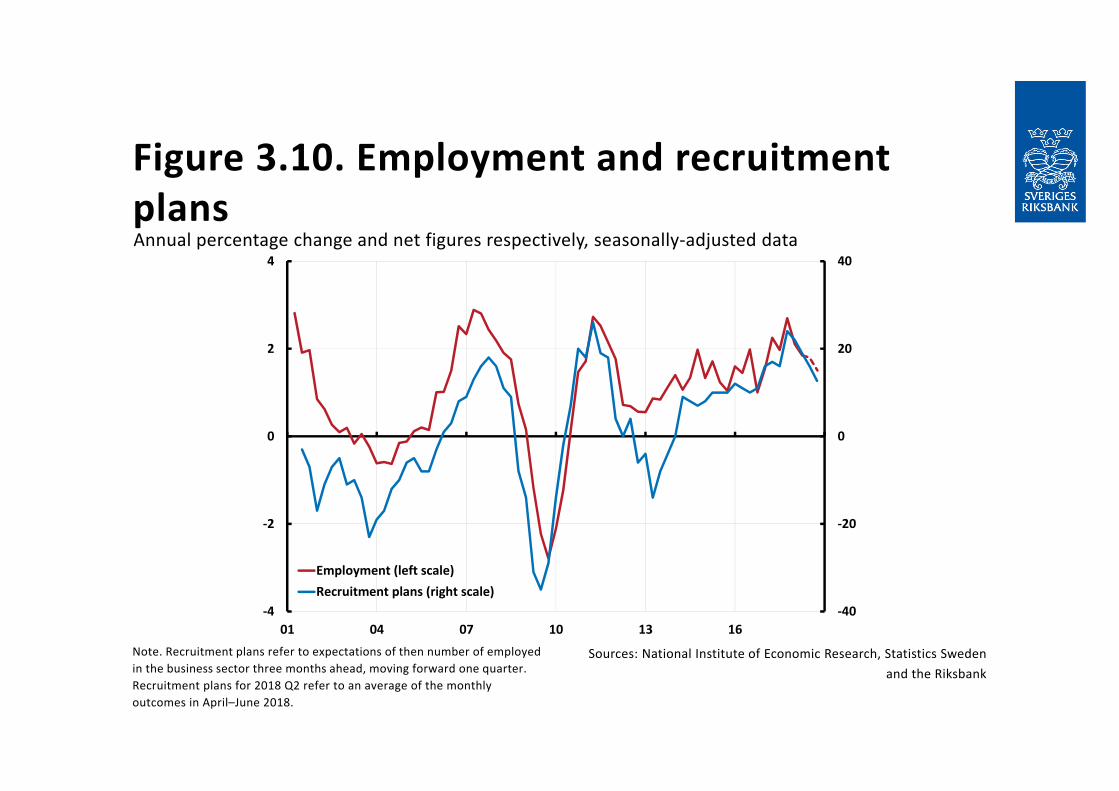
Figure 3.10. Employment and recruitment plans
‐40
‐20
0
20
40
‐4
‐2
0
2
4
01 04 07 10 13 16
Employment (left scale)Recruitment plans (right scale)
Note. Recruitment plans refer to expectations of then number of employed in the business sector three months ahead, moving forward one quarter. Recruitment plans for 2018 Q2 refer to an average of the monthly outcomes in April–June 2018.
Sources: National Institute of Economic Research, Statistics Sweden and the Riksbank
Annual percentage change and net figures respectively, seasonally‐adjusted data
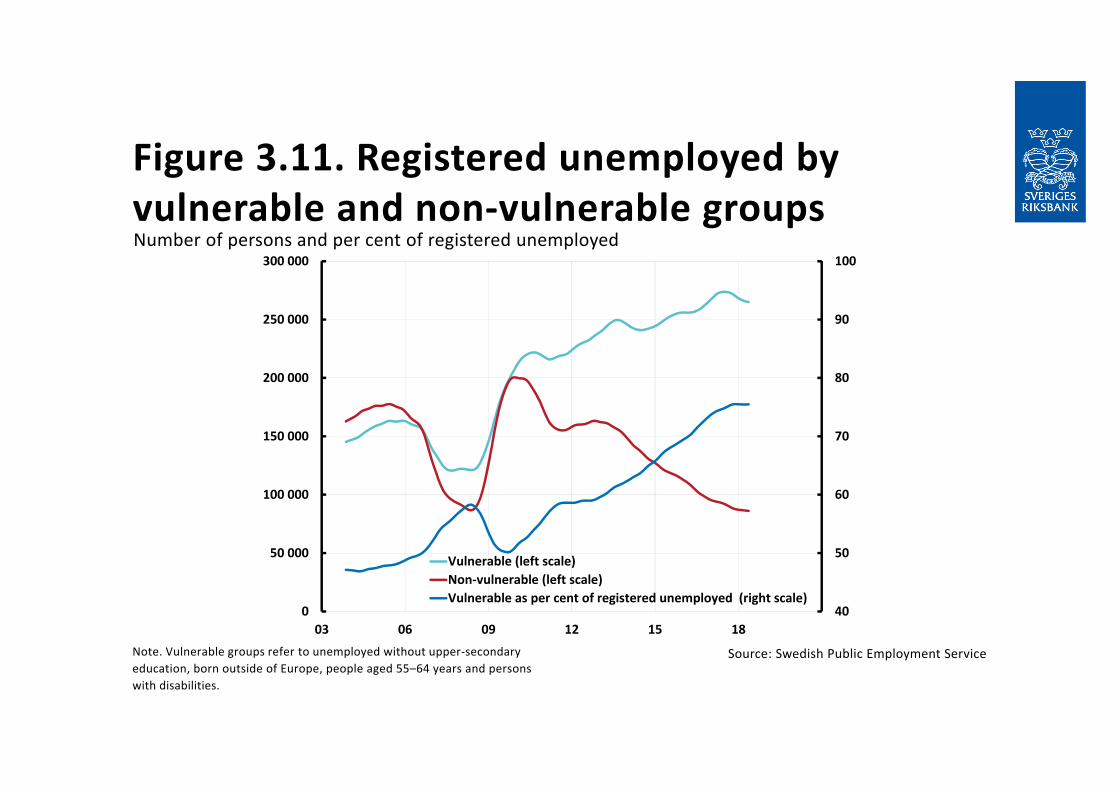
Figure 3.11. Registered unemployed by vulnerable and non‐vulnerable groups
Note. Vulnerable groups refer to unemployed without upper‐secondary education, born outside of Europe, people aged 55–64 years and persons with disabilities.
Source: Swedish Public Employment Service
Number of persons and per cent of registered unemployed
40
50
60
70
80
90
100
0
50 000
100 000
150 000
200 000
250 000
300 000
03 06 09 12 15 18
Vulnerable (left scale)Non‐vulnerable (left scale)Vulnerable as per cent of registered unemployed (right scale)
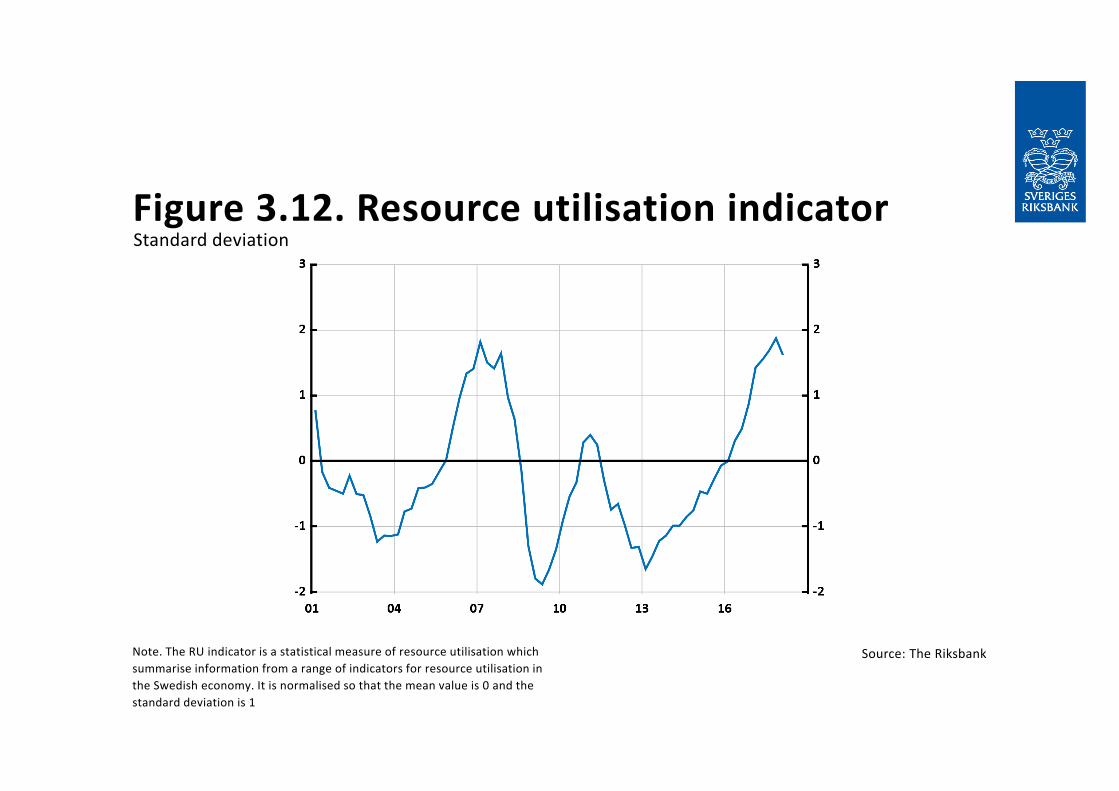
Figure 3.12. Resource utilisation indicator
Note. The RU indicator is a statistical measure of resource utilisation which summarise information from a range of indicators for resource utilisation in the Swedish economy. It is normalised so that the mean value is 0 and the standard deviation is 1
Source: The Riksbank
Standard deviation
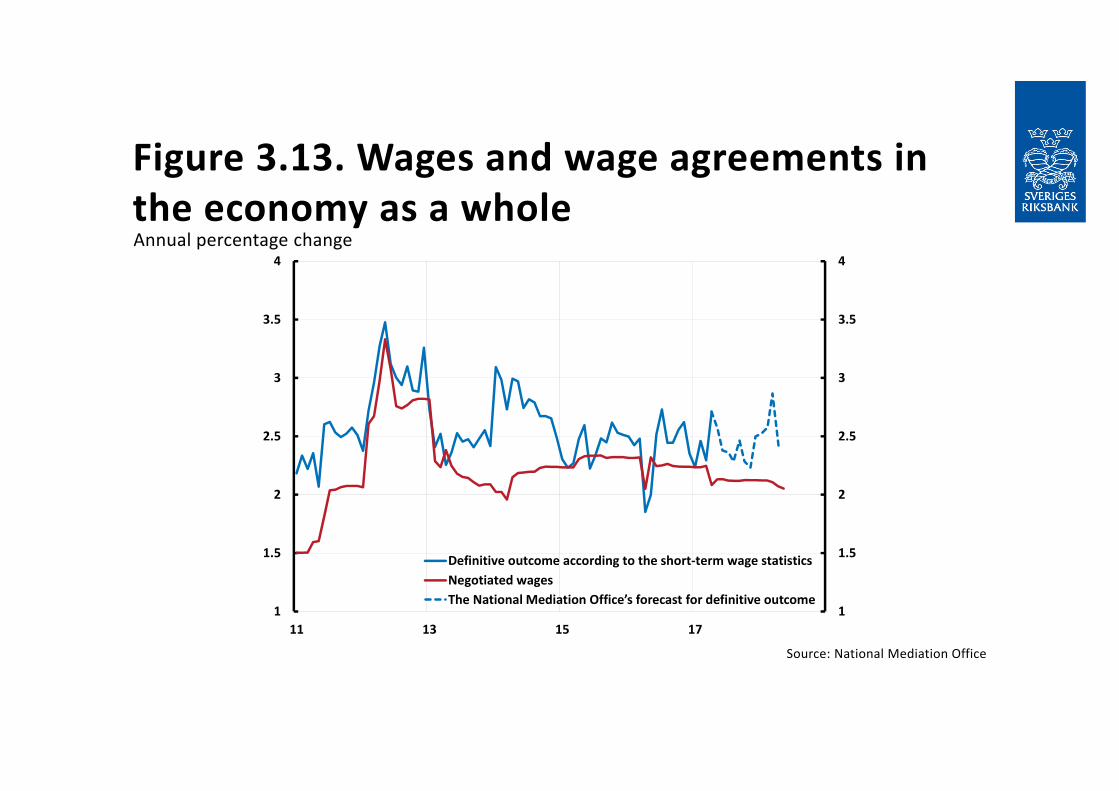
Figure 3.13. Wages and wage agreements in the economy as a whole
Source: National Mediation Office
Annual percentage change
1
1.5
2
2.5
3
3.5
4
1
1.5
2
2.5
3
3.5
4
11 13 15 17
Definitive outcome according to the short‐term wage statisticsNegotiated wagesThe National Mediation Office’s forecast for definitive outcome

Chapter 4
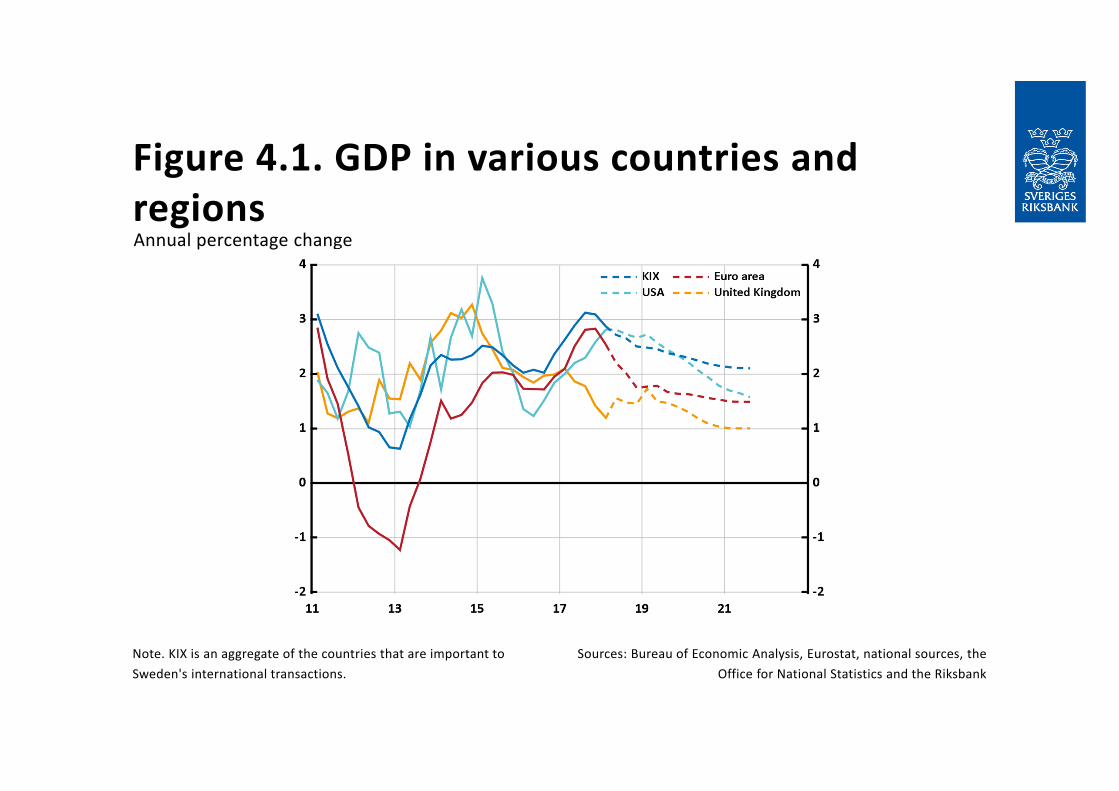
Figure 4.1. GDP in various countries and regions
Note. KIX is an aggregate of the countries that are important to Sweden's international transactions.
Sources: Bureau of Economic Analysis, Eurostat, national sources, the Office for National Statistics and the Riksbank
Annual percentage change
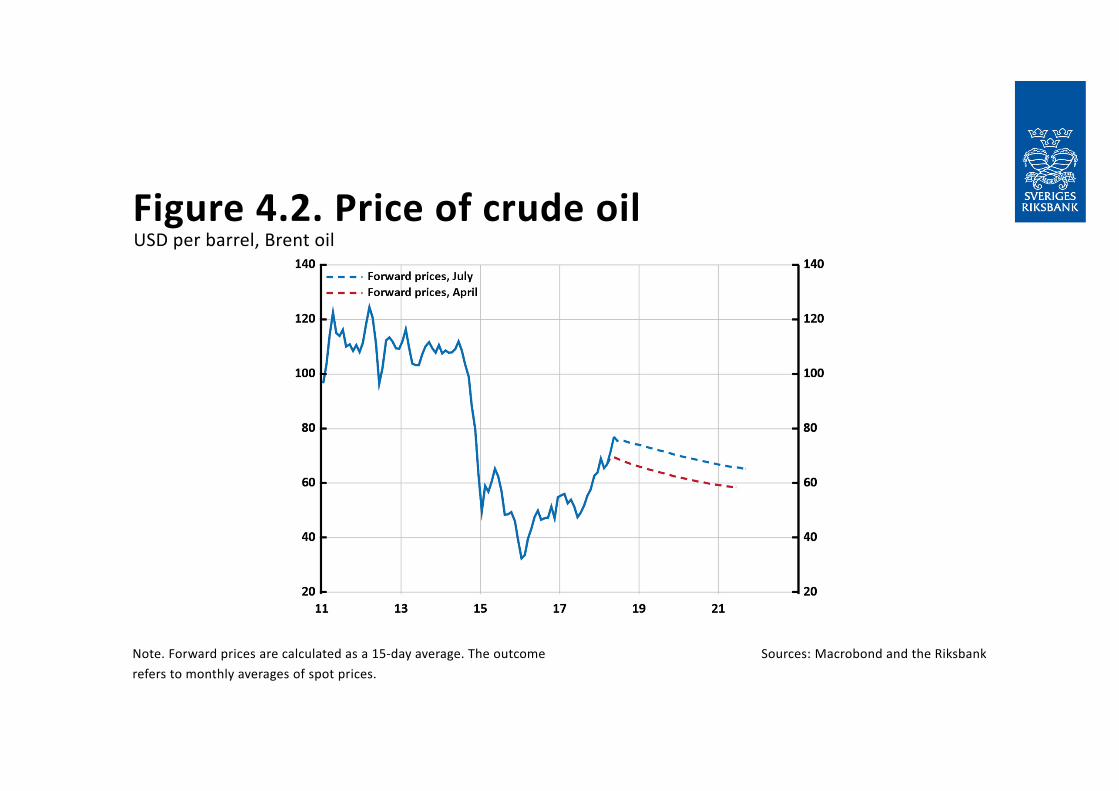
Figure 4.2. Price of crude oil
Note. Forward prices are calculated as a 15‐day average. The outcome refers to monthly averages of spot prices.
Sources: Macrobond and the Riksbank
USD per barrel, Brent oil
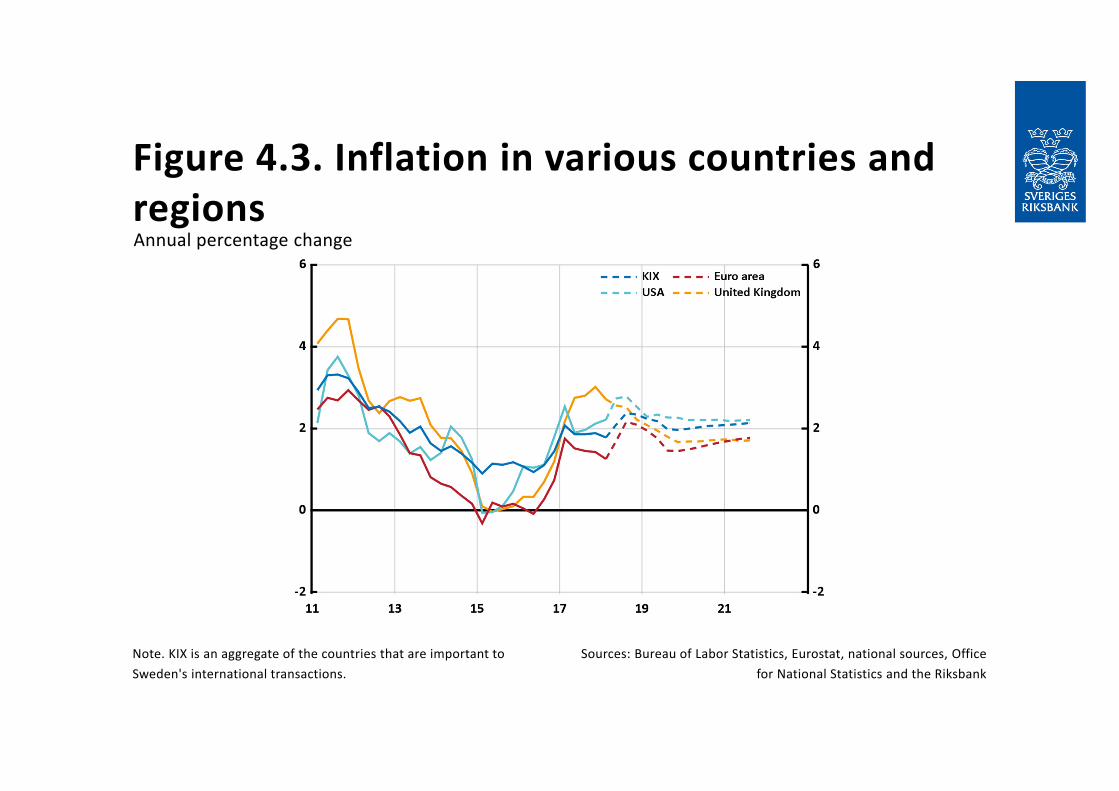
Figure 4.3. Inflation in various countries and regions
Note. KIX is an aggregate of the countries that are important to Sweden's international transactions.
Sources: Bureau of Labor Statistics, Eurostat, national sources, Office for National Statistics and the Riksbank
Annual percentage change
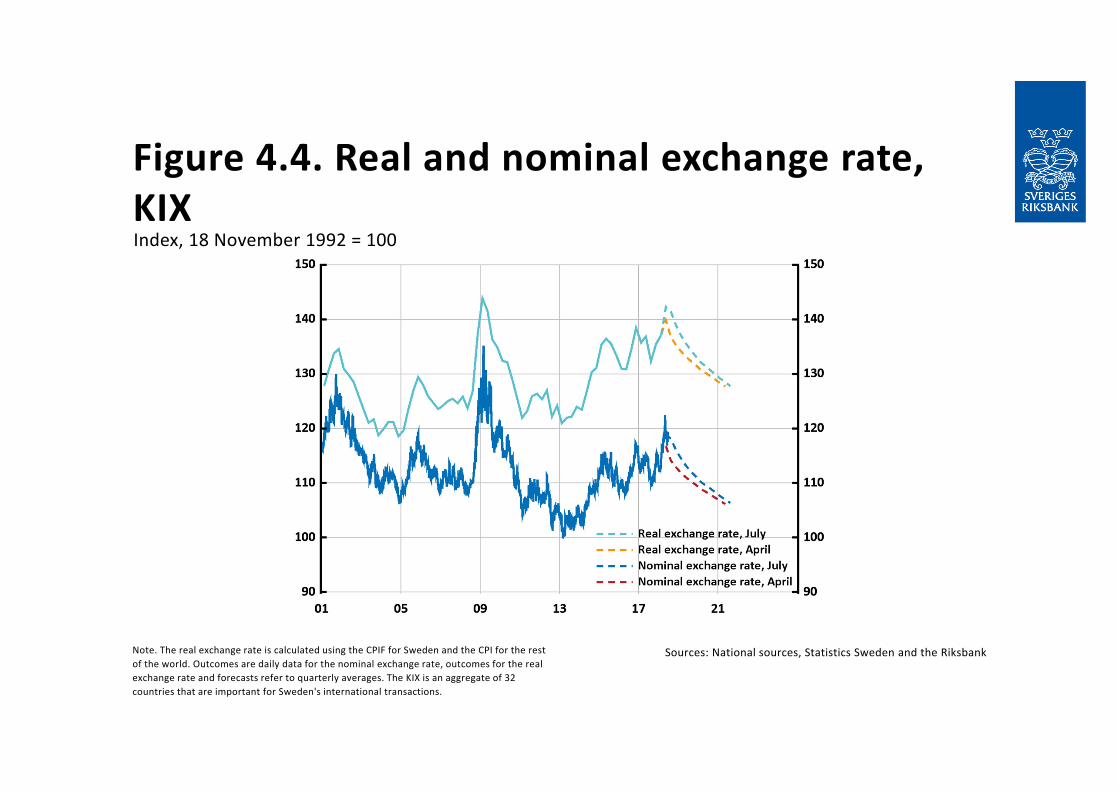
Figure 4.4. Real and nominal exchange rate, KIX
Note. The real exchange rate is calculated using the CPIF for Sweden and the CPI for the rest of the world. Outcomes are daily data for the nominal exchange rate, outcomes for the real exchange rate and forecasts refer to quarterly averages. The KIX is an aggregate of 32 countries that are important for Sweden's international transactions.
Sources: National sources, Statistics Sweden and the Riksbank
Index, 18 November 1992 = 100
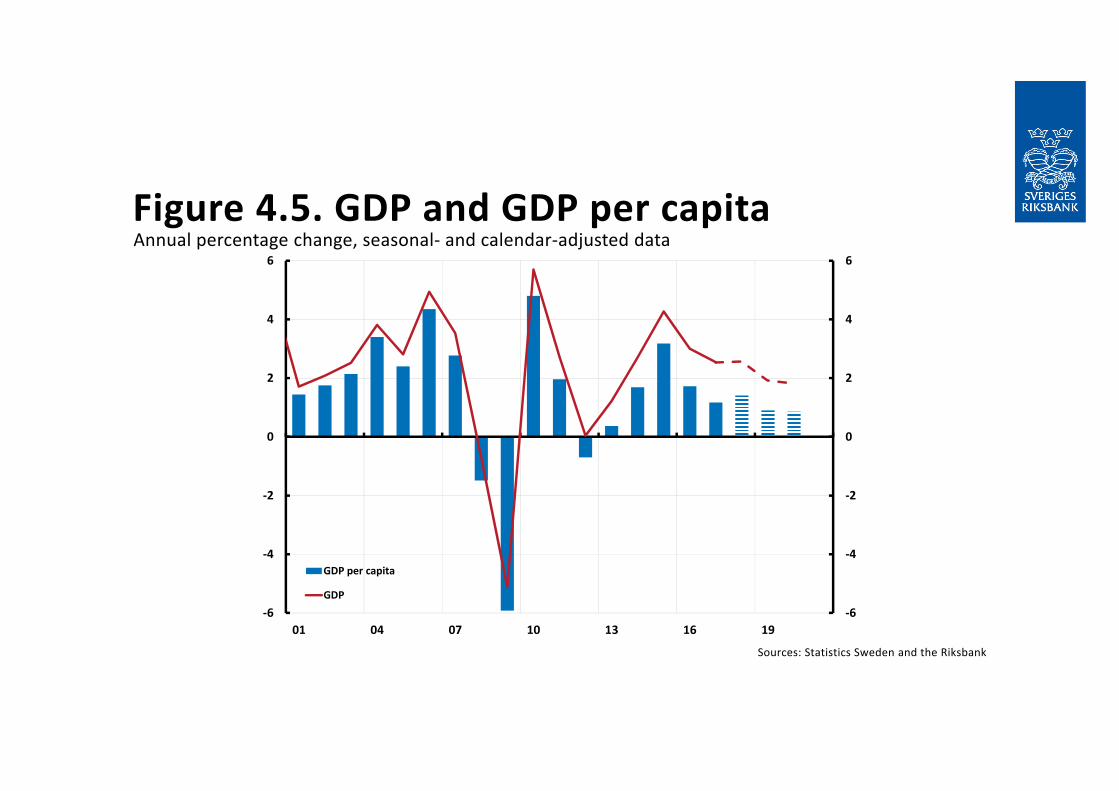
Figure 4.5. GDP and GDP per capita
Sources: Statistics Sweden and the Riksbank
Annual percentage change, seasonal‐ and calendar‐adjusted data
‐6
‐4
‐2
0
2
4
6
‐6
‐4
‐2
0
2
4
6
01 04 07 10 13 16 19
GDP per capita
GDP
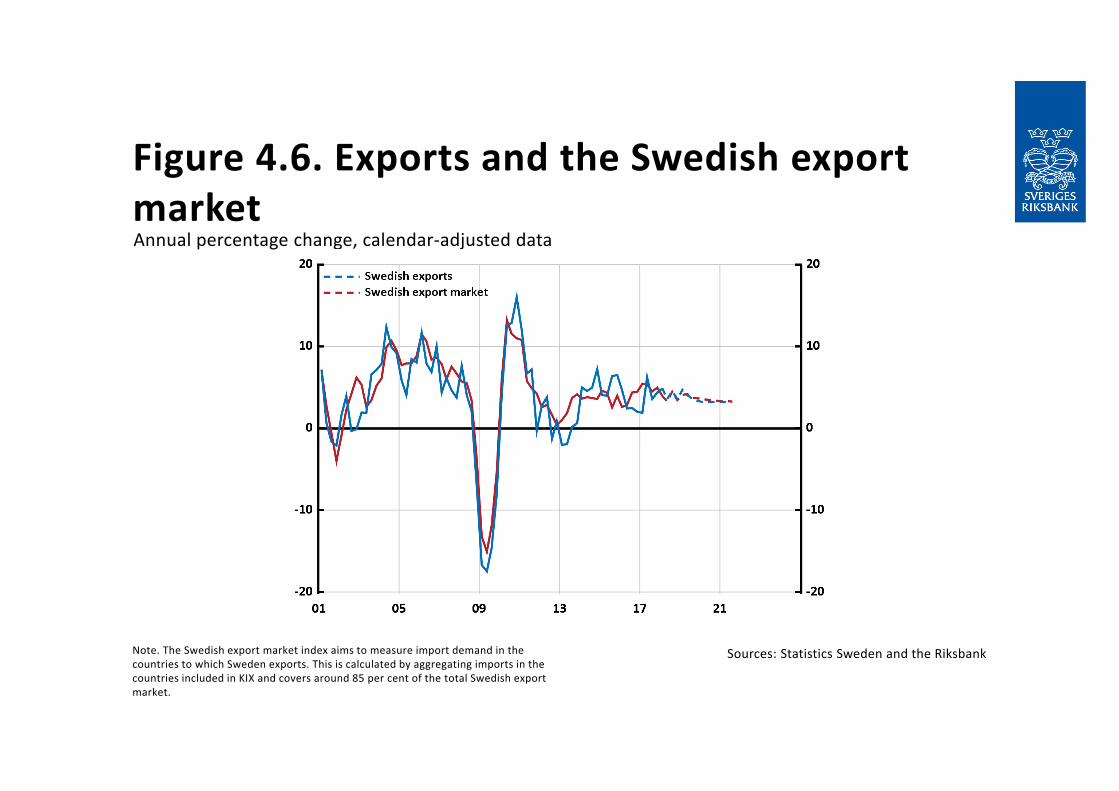
Figure 4.6. Exports and the Swedish export market
Note. The Swedish export market index aims to measure import demand in the countries to which Sweden exports. This is calculated by aggregating imports in the countries included in KIX and covers around 85 per cent of the total Swedish export market.
Sources: Statistics Sweden and the Riksbank
Annual percentage change, calendar‐adjusted data
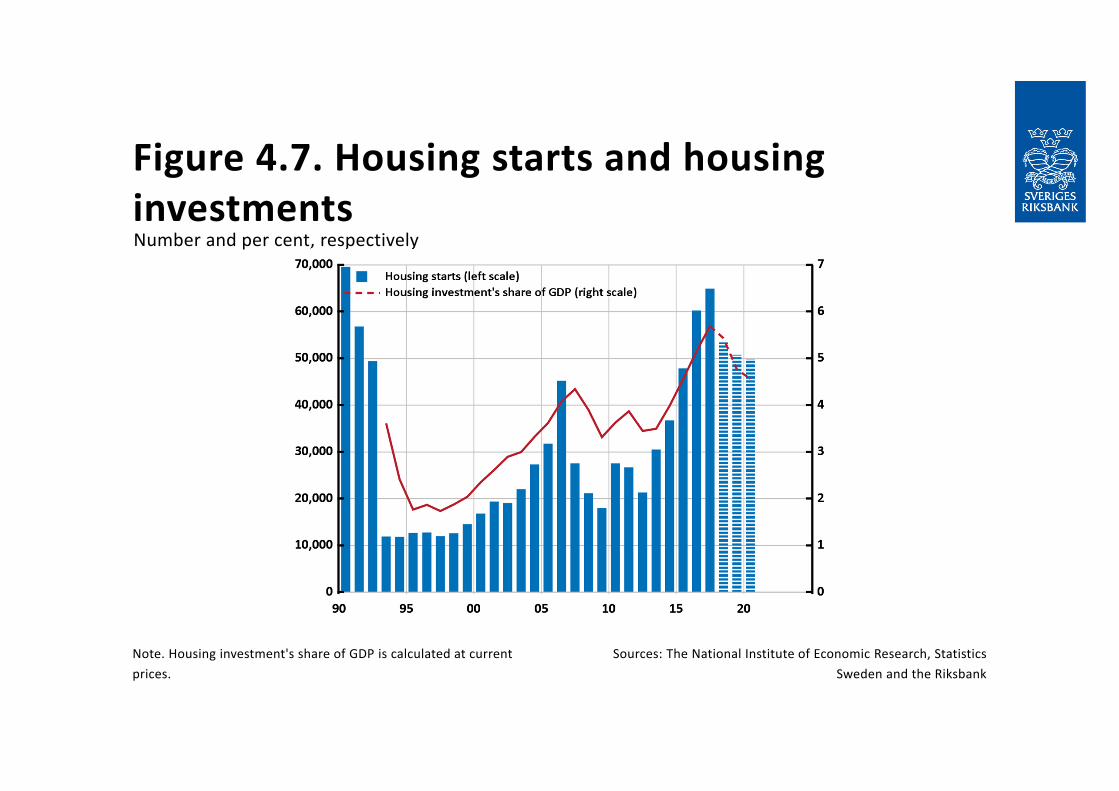
Figure 4.7. Housing starts and housinginvestments
Note. Housing investment's share of GDP is calculated at current prices.
Sources: The National Institute of Economic Research, Statistics Sweden and the Riksbank
Number and per cent, respectively
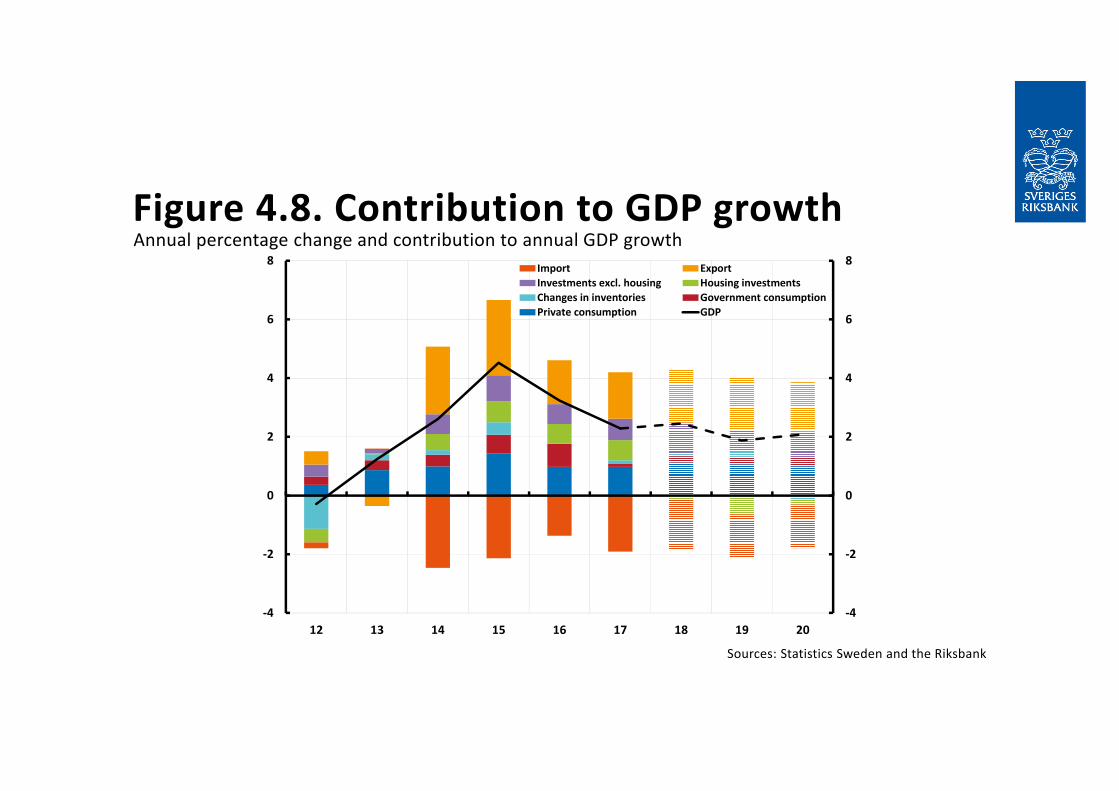
Figure 4.8. Contribution to GDP growth
Sources: Statistics Sweden and the Riksbank
Annual percentage change and contribution to annual GDP growth
‐4
‐2
0
2
4
6
8
‐4
‐2
0
2
4
6
8
12 13 14 15 16 17 18 19 20
Import ExportInvestments excl. housing Housing investmentsChanges in inventories Government consumptionPrivate consumption GDP
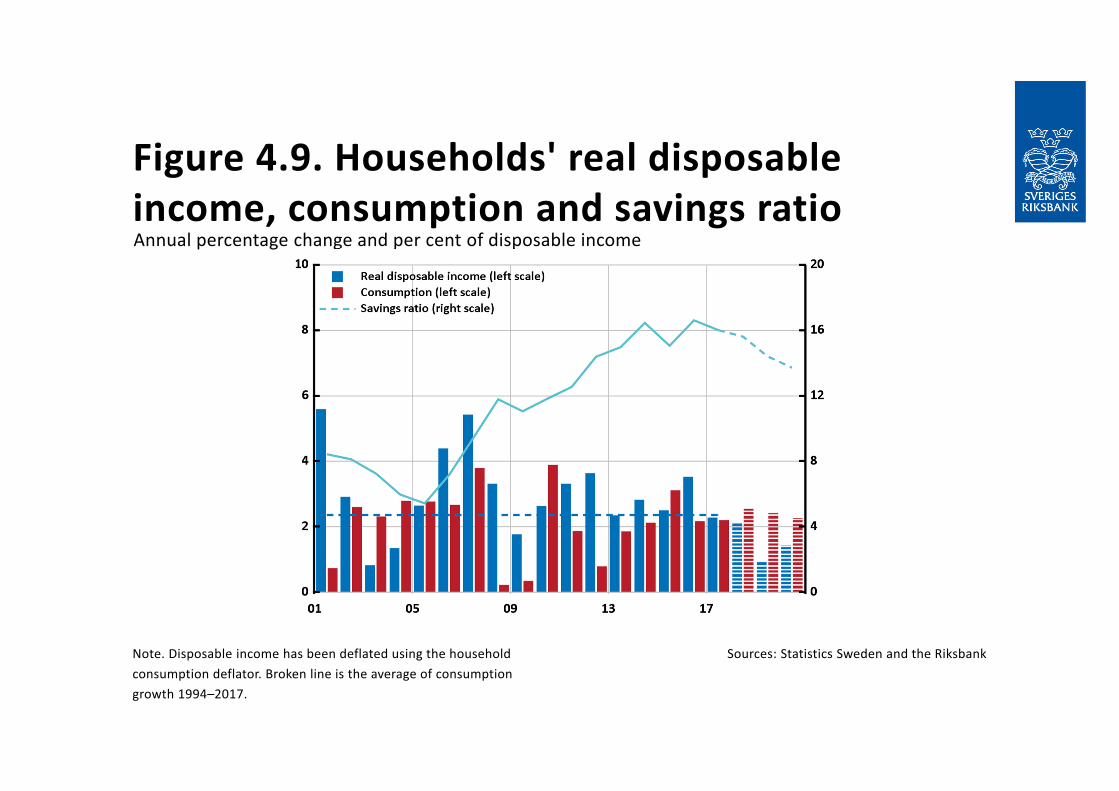
Figure 4.9. Households' real disposable income, consumption and savings ratio
Note. Disposable income has been deflated using the household consumption deflator. Broken line is the average of consumption growth 1994–2017.
Sources: Statistics Sweden and the Riksbank
Annual percentage change and per cent of disposable income
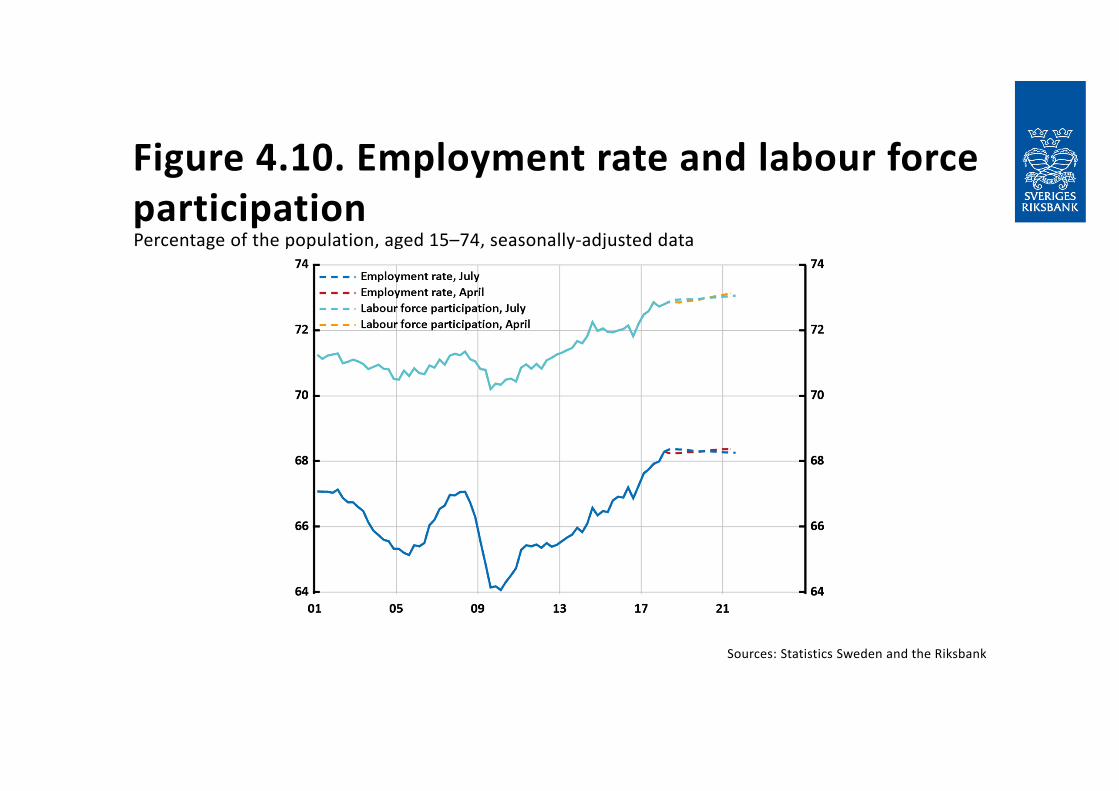
Figure 4.10. Employment rate and labour force participation
Sources: Statistics Sweden and the Riksbank
Percentage of the population, aged 15–74, seasonally‐adjusted data
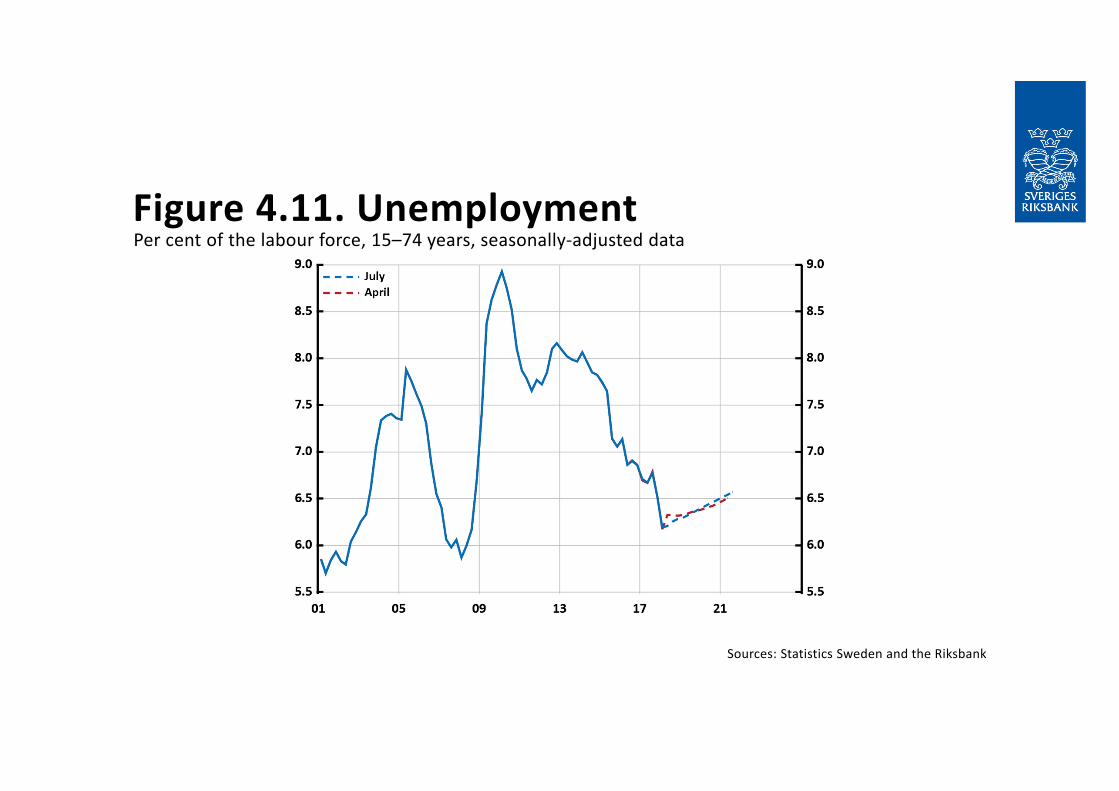
Figure 4.11. Unemployment
Sources: Statistics Sweden and the Riksbank
Per cent of the labour force, 15–74 years, seasonally‐adjusted data
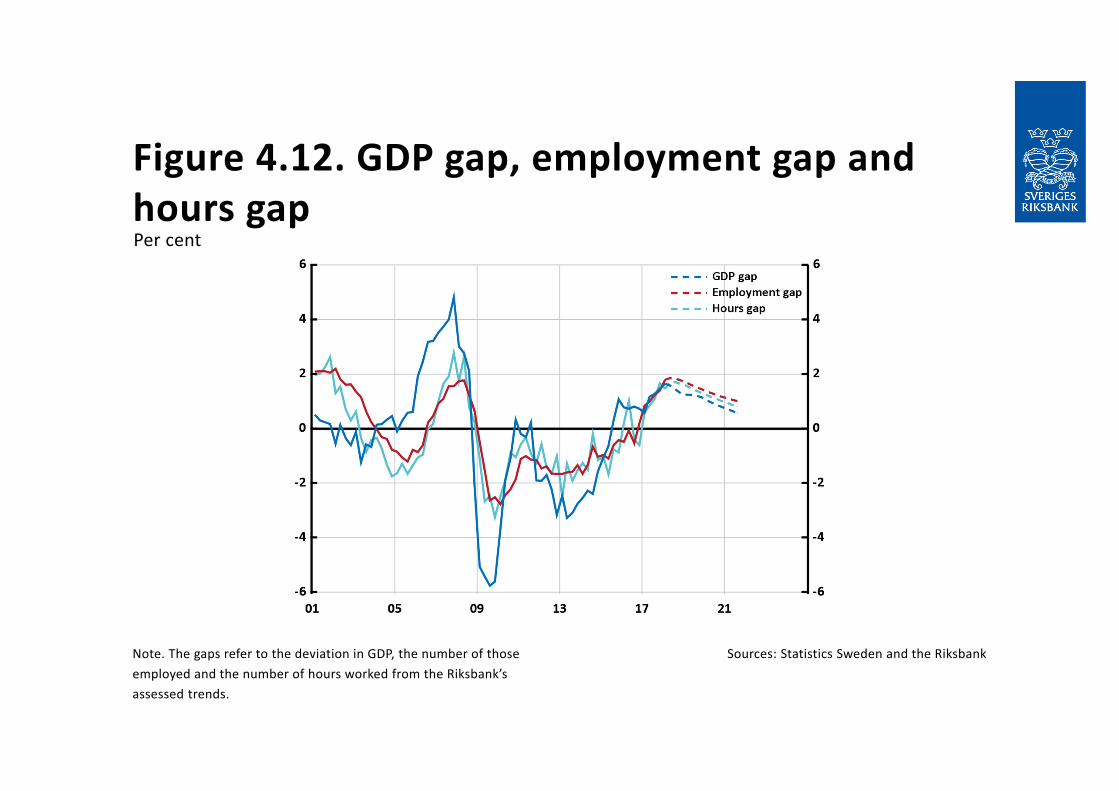
Figure 4.12. GDP gap, employment gap and hours gap
Note. The gaps refer to the deviation in GDP, the number of those employed and the number of hours worked from the Riksbank’sassessed trends.
Sources: Statistics Sweden and the Riksbank
Per cent
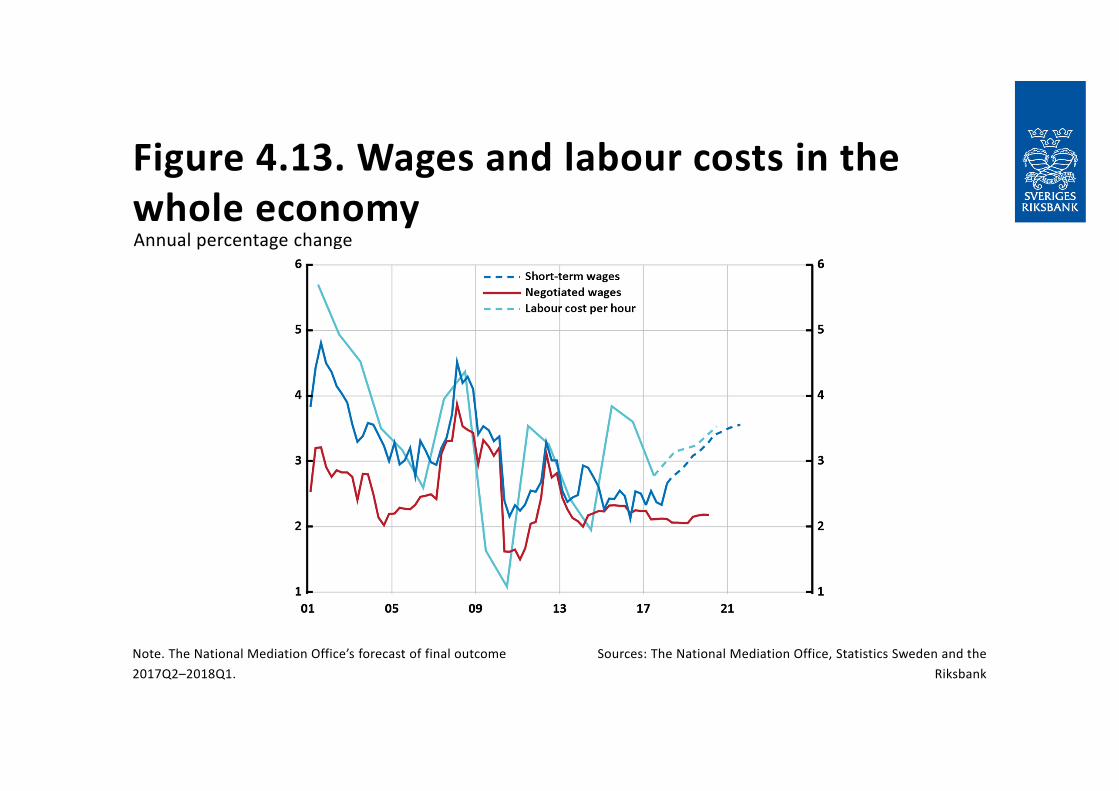
Figure 4.13. Wages and labour costs in the whole economy
Note. The National Mediation Office’s forecast of final outcome 2017Q2–2018Q1.
Sources: The National Mediation Office, Statistics Sweden and the Riksbank
Annual percentage change
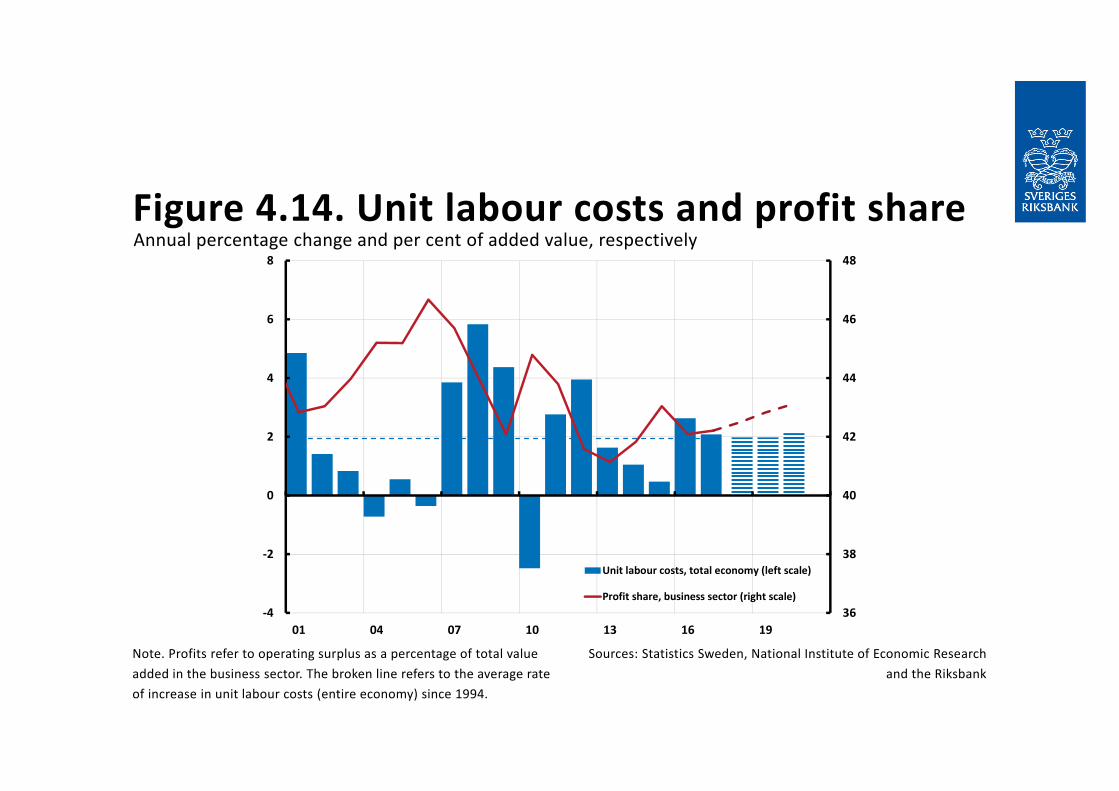
Figure 4.14. Unit labour costs and profit share
Note. Profits refer to operating surplus as a percentage of total value added in the business sector. The broken line refers to the average rate of increase in unit labour costs (entire economy) since 1994.
Sources: Statistics Sweden, National Institute of Economic Research and the Riksbank
Annual percentage change and per cent of added value, respectively
36
38
40
42
44
46
48
‐4
‐2
0
2
4
6
8
01 04 07 10 13 16 19
Unit labour costs, total economy (left scale)
Profit share, business sector (right scale)
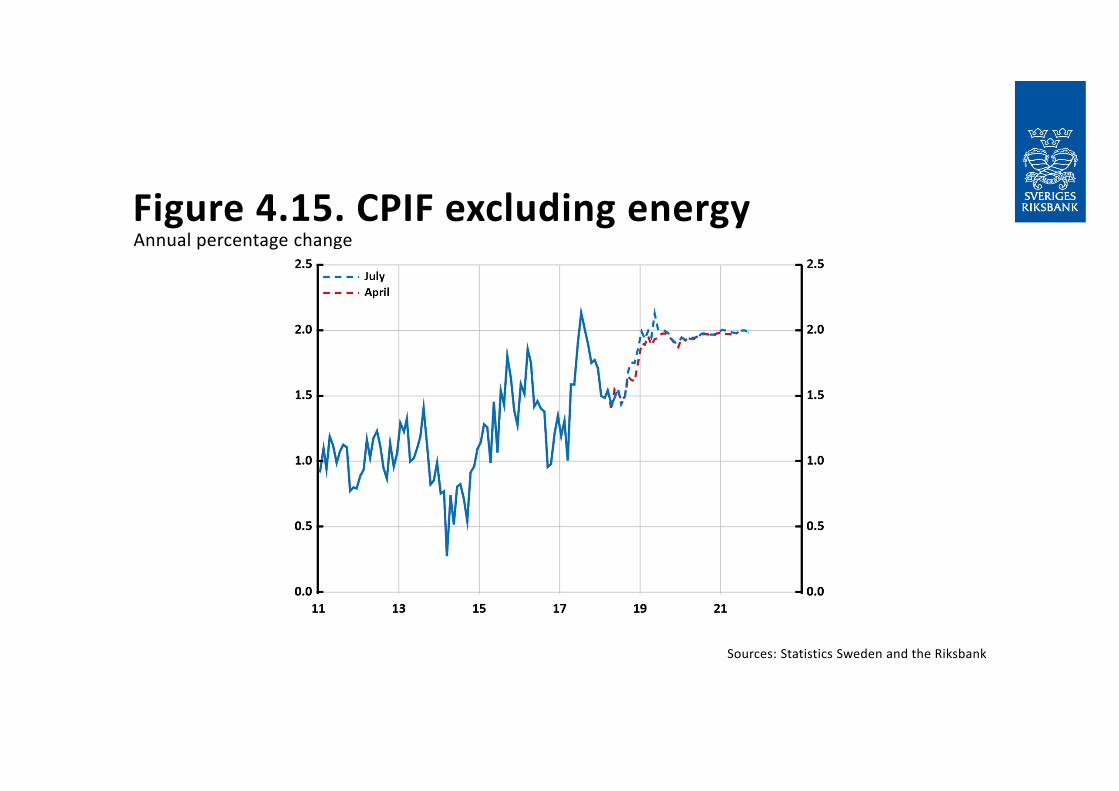
Figure 4.15. CPIF excluding energy
Sources: Statistics Sweden and the Riksbank
Annual percentage change
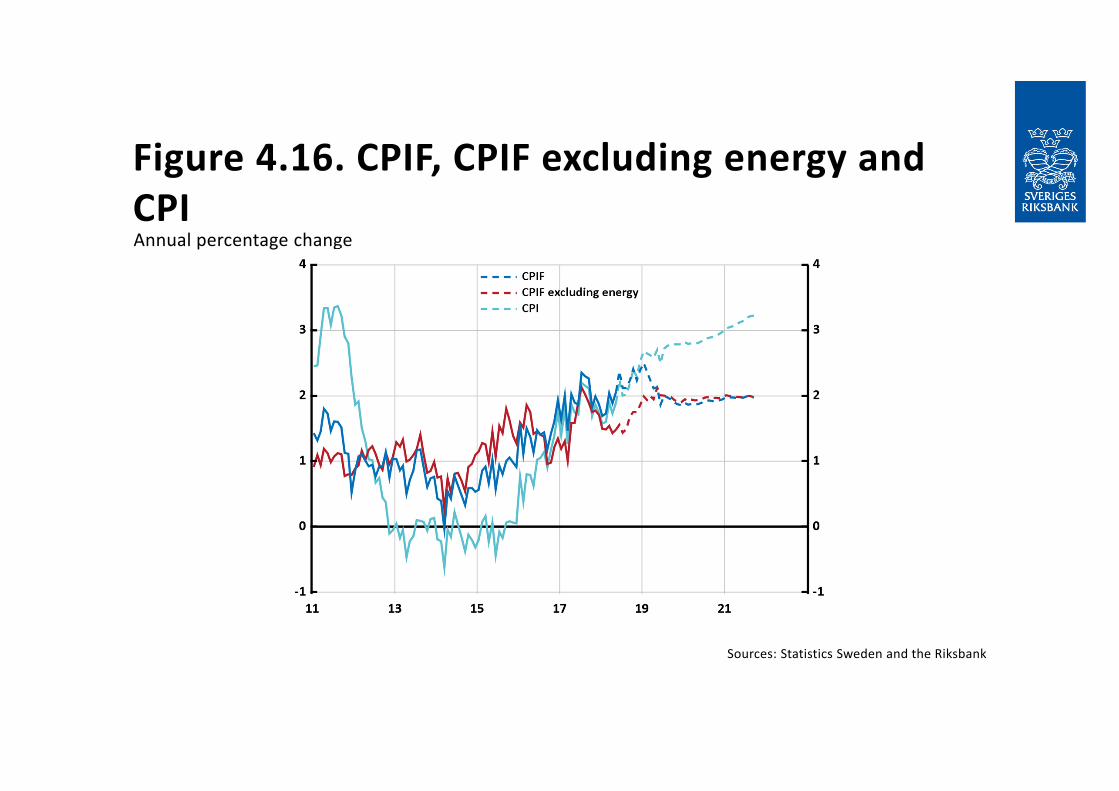
Figure 4.16. CPIF, CPIF excluding energy and CPI
Sources: Statistics Sweden and the Riksbank
Annual percentage change