momentum investing - wordpress.com · winning is a pure mathematical game: only about half of our...
TRANSCRIPT


WeekendInvesting* provides a scientific and risk managed alternative methodology for Investing in the Indian capital market. The growth prospects for Indian markets over the next decade are globally recognized to be one of the best. Growth enables formation of strong trends in any market. Identifying the stock specific strong trends and riding them for optimal periods enhances the efficient use of capital The advisory runs several algorithmic momentum investing models which provide unambigous and well-timed investment entries and exits along with appropriate risk management through stock diversification and money management. We invest our own money heavily into our own models. The advisory helps you run these strategies in your own account. All our models are Tactical Allocation models viz: the allocation between equity and debt is dynamically switched based on market trends which provides an additional cushion during periods of extreme stress. *Alok Jain is a SEBI Registered Investment Advisor (INA100007532). The advisory runs as WeekendInvesting.com
What do we do?

Bhav Bhagwan Che’ (Price is God): The core philosophy consists of an emotionless pursuit of price trends. We believe that the price discounts all factors fundamental & technical and that price is supreme. Survival of the fittest: We apply the theory of natural selection to stocks. We retain only the fittest stocks and ruthlessly exit those that stop performing. Winners are kept running and losers are exited. Zero Predictions: Our decisions are not swayed by external noise. Noise is usually in form of Results/News/Rumours/Expectations/ Forecasts etc. We do not try to time or predict the market. Defined Exits: Exiting a trade can only be done efficiently if it is either defined at the time of entry or is a dynamically calculated parameter. We maintain an unambiguously defined exit at all times. Money Management/Risk diversification: Our strategies ensure we take on equal risk per investment diversified over 25 to 50 stocks in the portfolios. Extreme moves against us in a few stocks is acceptable.
Weekendinvesting Philosophy

15 minute Investing: The process of investing can be a worry-free and enjoyable process. With our strategies, investing can be left to a 10-15 minute job per week /month. Tactical Asset Allocation: The strategies will automatically allocate exposure to Debt if equity opportunities are not available during preiods of market stress. Debt investments are done in market-listed liquid funds. Master of your own money: Our method of operation lets you manage your portfolio through your own account. At all times you will have full control over your money and stocks. We provide a complete advisory and checks and balances on your handling of your portfolio. Power of Compounding : Most investors lose the powerful benefits of consistent compounding. We target a CAGR of 20%+ in all our strategies with a goal to take capital up min 500% in 10 years. In the last 10 years, starting at Jan 2008, compounding has helped capital go up several folds, even as high as 1200%.
Weekendinvesting Philosophy

Winning is a pure mathematical game: Only about half of our investments result in winning trades. However our average winners are several times larger the size of our average losers by design and the end result is a positive portfolio outcome. Psychology driven trends: We believe prices are driven by mass psychology and momentum strategy is to buy high and sell higher vs. the conventional buy low and sell high value strategy. The efficient rotation of capital results in shallow drawdown and better returns. Automated Algorithmic approach: Eliminating scope of emotion based errors in decision making is a result of automation achieved by our self designed proprietary algorithms Genuine Capacity of the models: The capacity of these models has been tested to hold several hundred crores of investment. We may cap the investment accounts at INR 100 crores.
Weekendinvesting Philosophy
Boring is good: We believe wealth creation happens when the process is most slow and boring. These strategies will not suit you if you may be looking for action and an adrenaline rush. The average churn per week could be 1 or 2 transactions in a portfolio of upto50 stocks. Vs. Index performance: Regulations prevent us from providing return based assurances but our studies over last two decades show that our strategies have beaten the market benchmarks by a wide margin over the medium and long term periods. Tax and Broker fee efficiency : Our investments usually range from a minimum of a few weeks and months to sometimes a few years. The LTCG (0) and STCG (15%) tax regime in India is very conducive for such investing. We also work with Zerodha.com a leading online brokerage house where NO delivery based broker fee is applicable. Simplicity: We embrace simplicity in all our procedures. Viz :Simple to execute strategies, once a week/month churn, support 24x7X365, paperless quarterly billing and e-signed advisory agreements.
Weekendinvesting Philosophy

Overall Asset Allocation: Overall asset allocation to stocks could be 20-80 pct depending on your age and financial goals. Due to the Tactical Allocation nature of the strategies, one can go for a higher allocation in momentum vs. value investing strategies. Diversification benefits: The returns from momentum investing will be less volatile than conventional buy and hold and hence can provide a better/ stable growth in returns. We do however recommend that you continue your other passive or active investments and reallocate larger amounts over time. Strategy Allocation: Within momentum investing, you can diversify capital further among our various strategies to smoothen overall returns. We recommend a overall portfolio size of minimum INR 1cr. Dry Powder : Since we can never say if your Day 1 of investing here could be the market high/top for some period to come, always keep some dry powder as reserve to add during sharp drawdowns.
How much should you allocate ?
Setup: We will help you set up your portfolio in your own account as per our model portfolio allocation. Then henceforth you will only need to spend 5-15 mins every week/month to make the changes (if any) as per the update email. Entry and Exit: Our algorithms scan the NSE market data for suitable entries into or exits from invested stocks at the end of each week/month ( as per the specific strategy). An e-mail advisory alert with the desired stock entry/exit is sent at 3.15 PM on each Friday/or last day of the month. Allocation: Individual allocation to stocks will range from 2 to 4% exposure per stock depending on the strategy. Cash in Hand: The strategy will recommend you to hold spare cash in LiquidBees if no suitable allocation is available. Billing: We shall bill you at the end of each quarter based on a High Watermark value (explained later in detail). We do not charge any fees prior to our performance.
How does it work?

Fee structure: Our fee structure is very simple. We will raise a High Watermark (HW) based advisory bill every quarter. Fee payable is 20% of net profits before capital gains tax. GST may be applicable. High Value Watermark Example: The bill is raised only in the quarter if the end capital exceeds the previous High Watermark.
Fee & High Watermark
End of
Qtr
Start Capital Gross Gain End Capital Carry fwd loss
to next Qtr
Fees Payable @20%
of Net Gain
High Water Mark
(HW) for next Qtr
1 1,00,00,000 5,00,000 1,05,00,000 0 1,00,000 1,05,00,000
2 1,05,00,000 -10,00,000 95,00,000 -10,00,000 0 1,05,00,000
3 95,00,000 0 95,00,000 0 0 1,05,00,000
4 95,00,000 25,00,000 1,20,00,000 0 3,00,000 1,20,00,000
*Fee is paid from non portfolio funds. Else if needed profits may be liquidated proportionately.

Strategy Performance History
Parameter Mi25 Mi50 Mi40
Periodicity Weekly Weekly Monthly
Risk per stock 4% 2% 2.5%
Returns volatility High Low Medium
Average stock Churn 2 per week 2 per week 2 per month
CAGR 10 yrs* 38% 29% 21%
Max Drawdown 10yrs* 33% 29% 39%
Stock Filters All NSE stocks All NSE stocks All NSE stocks
*10 yrs 1/1/2007 to 31/12/2016 simulated model. All costs and transaction taxes are accounted for. **Past performance is no guarantee for future performance

Power of Compounding and Outperformance vs. Benchmarks
*1/1/2003 to 31/07/2017 simulated model. All costs and transaction taxes are accounted for. **Past performance is no guarantee for future performance

Past Performance Mi25
Strategy Performance
*Survivorship Bias error may exist **Past performance is no guarantee for future performance
Year Jan Feb Mar Apr May Jun Jul Aug Sep Oct Nov Dec Yr%
2003 0.1% 0.9% -0.8% 0.2% 15.2% 8.6% 7.3% 17.5% 3.9% 18.9% 1.3% 17.0% 131.7%
2004 -3.3% 3.5% -0.6% 3.3% -12.9% -1.7% 1.3% 0.7% 6.2% 11.6% 11.8% 20.3% 43.2%
2005 3.2% 5.7% -3.2% 0.6% 3.2% 2.0% 7.9% 9.5% 6.4% -11.6% 4.5% 6.8% 38.7%
2006 11.0% 1.2% 13.0% 2.3% -13.5% -7.4% -0.7% 1.8% 1.6% 6.0% 0.3% 4.1% 18.2%
2007 4.0% -8.9% -3.0% 2.4% 9.4% 10.1% 5.4% 3.9% 20.0% 20.0% 8.2% 13.3% 119.3%
2008 -16.4% -2.0% -3.9% 0.2% 1.6% -7.2% -2.1% -0.3% -1.4% -4.2% 0.2% 0.5% -31.0%
2009 0.4% 0.6% -0.1% 2.8% 12.3% 5.8% 18.5% 3.2% 5.6% 1.1% 7.9% 6.6% 85.1%
2010 -2.9% -0.1% 3.8% 2.7% -6.4% 8.0% 3.0% 5.0% 6.3% 1.3% -6.9% 1.5% 15.1%
2011 -8.5% -1.6% 1.6% 1.6% -0.6% 1.8% 8.7% -1.8% 1.2% 2.4% -4.6% -2.1% -2.7%
2012 2.1% 4.5% 5.4% 3.2% -2.9% 2.4% 1.9% 6.8% 7.8% 1.1% 7.9% -0.7% 46.6%
2013 -4.0% -4.5% -1.1% 0.2% 6.1% -5.9% 3.3% -4.7% 3.4% 6.4% 9.6% 5.8% 13.8%
2014 -0.9% 2.7% 3.3% 3.7% 15.4% 11.6% 0.5% 4.5% 0.5% 7.1% 7.4% 0.3% 70.9%
2015 5.7% 2.6% -0.2% 0.9% 3.7% 1.4% 20.1% -6.6% -4.2% -1.7% 2.5% 6.9% 33.0%
2016 -10.4% -7.7% 1.4% 3.2% 1.3% 3.6% 11.7% -0.6% 2.5% 11.8% -16.4% 5.5% 2.1%
2017 9.5% 1.0% 2.4% 11.7% 2.1% 5.8% 10.3% N/A N/A N/A N/A N/A 50.9%

Past Performance Mi50
Strategy Performance
Live performance of Mi50 since Apr 1 2016 at weekendinvesting.com *Survivorship Bias error may exist **Past performance is no guarantee for future performance
Year Jan Feb Mar Apr May Jun Jul Aug Sep Oct Nov Dec Yr%
2003 0.3% 0.5% -0.2% 0.6% 5.7% 4.7% 3.3% 19.7% 1.2% 13.4% 5.5% 20.5% 102.2%
2004 -6.6% 1.1% 0.0% 4.4% -10.3% -0.8% 2.3% 0.0% 3.5% 5.4% 12.6% 15.7% 27.7%
2005 -0.3% 5.5% -1.4% 1.2% 5.1% 3.5% 8.7% 9.1% 3.7% -9.4% 4.6% 4.7% 39.2%
2006 14.8% -1.8% 15.3% 10.6% -11.4% -12.9% -0.6% 1.5% 0.1% 2.4% 4.3% 4.9% 25.5%
2007 6.1% -7.6% -7.2% 0.7% 4.8% 8.3% 3.2% -0.6% 13.0% 18.4% 7.1% 12.8% 72.2%
2008 -17.7% -3.3% -1.4% 0.5% 0.3% -2.9% 0.0% 0.1% -0.3% -1.2% 0.5% 0.5% -23.6%
2009 0.4% 0.5% 0.5% 0.4% 0.5% 0.6% 2.2% 1.5% 2.8% -1.1% 4.5% 6.8% 21.3%
2010 -0.2% -1.4% 6.0% 6.9% -2.5% 8.5% 6.6% 5.2% 7.8% 5.3% -7.4% -0.7% 38.1%
2011 -3.3% -0.9% 0.3% 0.7% 0.0% 1.2% 3.8% -5.9% 0.9% 0.9% -2.5% -1.1% -6.0%
2012 0.7% 1.5% 3.1% 3.7% -2.1% 2.1% 1.2% 3.8% 5.7% 2.3% 8.3% 0.6% 35.2%
2013 0.8% -0.7% 0.8% -0.8% 2.9% -3.4% 1.8% -6.3% 2.7% 3.5% 4.9% 4.9% 11.0%
2014 -2.0% 6.9% 4.2% 4.3% 11.3% 12.9% 6.5% 2.0% 7.5% 2.8% 4.0% -1.5% 75.9%
2015 6.7% 2.3% -2.0% -0.5% 1.6% -1.6% 15.9% -7.9% -1.1% 1.4% 3.8% 5.2% 24.2%
2016 -6.8% -8.6% 0.5% N/A N/A N/A N/A N/A N/A N/A N/A N/A -14.5%

Past Performance Mi40
Strategy Performance
*Survivorship Bias error **Past performance is no guarantee for future performance
Year Jan Feb Mar Apr May Jun Jul Aug Sep Oct Nov Dec Yr%
2003 0.3% 0.6% -0.6% 0.9% 2.6% 5.0% 6.4% 12.4% 3.1% 10.9% 8.4% 22.3% 97.8%
2004 -6.3% -1.3% 1.5% 6.2% -17.7% 2.1% 3.6% 4.1% 6.9% 3.4% 12.9% 12.2% 26.4%
2005 1.8% 5.2% -1.9% -1.2% 5.1% 2.6% 9.9% 8.4% 2.7% -9.1% 11.0% 6.7% 47.5%
2006 9.2% -1.8% 10.3% 3.8% -12.9% -9.8% -1.8% 5.8% 0.2% 6.7% 1.9% 3.2% 12.5%
2007 2.5% -8.4% -2.8% 3.6% 4.0% 4.0% 4.7% -0.3% 13.5% 21.0% 1.3% 13.6% 68.6%
2008 -18.8% -2.8% -13.0% 5.0% -0.2% -1.7% 0.5% 0.2% -2.9% 0.3% -0.2% 0.5% -30.3%
2009 0.5% 0.4% 0.5% 0.4% 0.1% 1.4% 4.3% 1.0% 4.2% -0.2% 6.2% 4.6% 25.8%
2010 1.5% 0.3% 6.7% 6.5% -0.5% 7.4% 1.6% 3.5% 9.2% 3.9% -6.1% 1.6% 40.6%
2011 -8.0% -3.1% 5.5% 3.0% -1.8% 1.6% 4.1% -5.6% -1.5% 2.7% -5.3% -5.7% -14.3%
2012 3.4% 2.9% 5.1% 3.7% -1.5% 0.7% -1.3% 4.4% 6.9% 1.5% 4.3% 2.8% 37.8%
2013 3.7% -3.8% -2.3% 4.5% 9.6% -6.5% -3.9% -8.2% 9.6% 7.9% 8.1% 7.2% 26.2%
2014 -0.3% 6.5% 3.3% 2.0% 11.0% 20.5% 2.2% 7.3% 9.1% 5.3% 10.1% 0.9% 109.5%
2015 4.2% 4.0% 5.2% -2.5% 9.5% -2.3% 6.6% -3.9% 3.1% 7.5% -3.0% 2.3% 34.2%
2016 -5.8% -10.3% 5.5% -0.8% -0.8% 9.2% 0.5% 2.8% 4.7% 7.8% -10.7% -1.7% -1.9%
2017 8.7% 5.4% 9.0% 6.4% -3.0% 5.4% 11.2% N/A N/A N/A N/A N/A 51.0%

Performance – last updated 31/12/2017
Strategy Performance
*Actual results in live performance **Past performance is no guarantee for future performance
Parameter Mi25 Mi50 Mi40
Period 1Apr2016 to 31Dec 2017
1Apr2016 to 31Dec 2017
1Apr2016 to 31Dec 2017
Returns absolute 242.12% 114.54% 72.79%
Max Drawdown 19.50% 14.51% 10.80%
Nifty Same Period 14.79% 14.79% 14.79%
CNX500 same period 18.71% 18.71% 18.71%

Case Study-Mi50
Mi50 closed its first year of live performance on Mar 31 2017. Its first year report can be seen here. It closed the year with a +54.02% gain. In 12 months, there were 120 investments. #Winners were 65% and #losers 35% . The average gainer was nearly up +35% and the average loser was down -7%. So regardless of the “stock names” if one keeps doing this mechanically, the math automatically keeps the portfolio positive. In short the strategy is to Buy high, keep shedding losers and let winners run. And if there is no momentum, buy Debt.

Case Study-Top winners & losers of Mi50
Stock Entry Exit Gain Stock Entry Exit Loss
HAVELLS 4.3 24.8 478% SHILPI CABLES 220 96 55%
CEAT 162 795 391% WELSPUN 97 49 49%
HOTEL
LEELA
12.9 62.6 384% HOCL 62 33 47%
AJANTA
PHARMA
304 1429 369% SHREERAMA
NEWS
49 27 44%
CG POWER 5.2 24.4 365% GOLDIAM 171 101 41%
KRBL 37 168 351% KWALITY 153 90 41%
JSPL 86 379 340% MICROSEC 40 24 40%
*Study from 1/1/2003 to 31/7/2017 945 TRADES/ 53% WINS/ AVG WIN +55%/ AVG LOSS -13% **Past performance is no guarantee for future performance

Stock Entry Exit Gain Stock Entry Exit Loss
IB VENTURE 35 195 451% SHILPI CABLES 220 96 55%
AJANTA 304 1429 369% CEAT 104 68 35%
CROMPTON 5.2 24.5 359% SELAN 241 164 33%
BHUSHAN 50 212 327% GEECEE VEN 117 80 33%
INDSWIFT 53 214 299% BUTTERFLY 271 188 32%
FIN CABLES 65 260 298% NUCLEUS 174 121 32%
JAI CORP 218 850 290% ATLANTA 117 82 32%
BHARTI 17 66 284% FEDDERS 88 62 31%
*Study from 1/1/2003 to 31/7/2017 544 TRADES/ 52% WINS/ AVG WIN +65%/ AVG LOSS -14% **Past performance is no guarantee for future performance
Case Study-Top winners & losers of Mi25
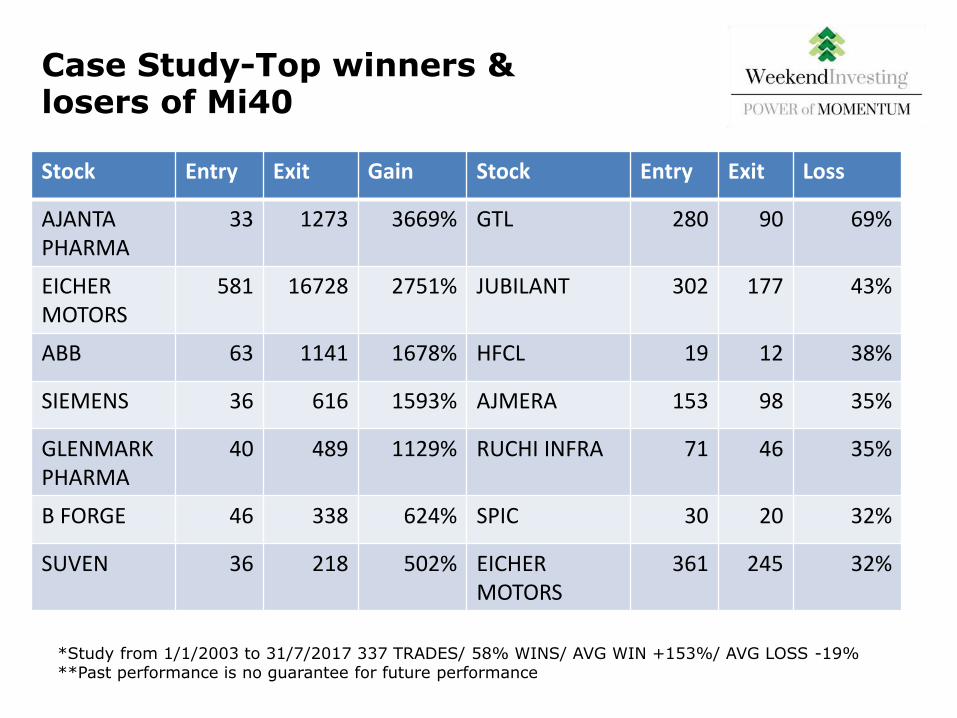
Stock Entry Exit Gain Stock Entry Exit Loss
AJANTA
PHARMA
33 1273 3669% GTL 280 90 69%
EICHER
MOTORS
581 16728 2751% JUBILANT 302 177 43%
ABB 63 1141 1678% HFCL 19 12 38%
SIEMENS 36 616 1593% AJMERA 153 98 35%
GLENMARK
PHARMA
40 489 1129% RUCHI INFRA 71 46 35%
B FORGE 46 338 624% SPIC 30 20 32%
SUVEN 36 218 502% EICHER
MOTORS
361 245 32%
*Study from 1/1/2003 to 31/7/2017 337 TRADES/ 58% WINS/ AVG WIN +153%/ AVG LOSS -19% **Past performance is no guarantee for future performance
Case Study-Top winners & losers of Mi40

Role of Luck
Luck/ chance still plays a role in this strategy despite the strategy automation. The point of your entry may be the high point for next few years or the strategy may not be able to pick the next 10 bagger due to paucity of cash on that day, is all a play of luck. However, study of last 14 years data provide us enough evidence that good returns are surely possible regardless. The best place to add to the portfolios is when they are in double digit drawdown and that may happen every year or so. So, be brave and invest or add during those periods and maybe luck will be on your side. Momentum investing based premium returns have lasted for the last 100 years and there is no reason to believe why it wont be that way going forward! All the best!

About the founder
An alumnus of IIT Delhi and University of Maryland, Alok Jain has been involved in the markets since 1996. He set up and managed a National Stock Exchange brokerage house for two decades servicing institutional, corporate and retail HNI clients before turning a SEBI registered Investment Advisor. His interests lie in mathematical modeling of investing systems and behavioral finance. These algorithmic strategies were initially created to run his own portfolio. Buoyed by the continuing success of the strategies, they are now a part of the advisory. Alok is best contactable on Email or Twitter : [email protected] / @Weekendinvestng