molecular signatures of plastic phenotypes in two eusocial ...sro.sussex.ac.uk/60183/1/patalano et...
TRANSCRIPT
Molecular signatures of plastic phenotypes in two eusocial insect species with simple societies
Article (Published Version)
http://sro.sussex.ac.uk
Patalano, Solenn, Vlasova, Anna, Wyatt, Chris, Ewels, Philip, Camara, Francisco, Ferreira, Pedro G, Asher, Claire L, Jurkowski, Tomasz P, Segonds-Pichon, Anne, Bachman, Martin, González-Navarrete, Irene, Minoche, André E, Krueger, Felix, Lowy, Ernesto, Marcet-Houben, Marina et al. (2015) Molecular signatures of plastic phenotypes in two eusocial insect species with simple societies. Proceedings of the National Academy of Sciences, 112 (45). pp. 13970-13975. ISSN 0027-8424
This version is available from Sussex Research Online: http://sro.sussex.ac.uk/60183/
This document is made available in accordance with publisher policies and may differ from the published version or from the version of record. If you wish to cite this item you are advised to consult the publisher’s version. Please see the URL above for details on accessing the published version.
Copyright and reuse: Sussex Research Online is a digital repository of the research output of the University.
Copyright and all moral rights to the version of the paper presented here belong to the individual author(s) and/or other copyright owners. To the extent reasonable and practicable, the material made available in SRO has been checked for eligibility before being made available.
Copies of full text items generally can be reproduced, displayed or performed and given to third parties in any format or medium for personal research or study, educational, or not-for-profit purposes without prior permission or charge, provided that the authors, title and full bibliographic details are credited, a hyperlink and/or URL is given for the original metadata page and the content is not changed in any way.
Molecular signatures of plastic phenotypes in twoeusocial insect species with simple societiesSolenn Patalanoa,1, Anna Vlasovab,c, Chris Wyattb,c,d, Philip Ewelsa,e, Francisco Camarab,c, Pedro G. Ferreirab,f,g,Claire L. Asherh,i, Tomasz P. Jurkowskij, Anne Segonds-Pichona, Martin Bachmank,l, Irene González-Navarreteb,c,André E. Minocheb,c,m, Felix Kruegera, Ernesto Lowyb,c, Marina Marcet-Houbenb,c, Jose Luis Rodriguez-Alesb,c,Fabio S. Nascimenton, Shankar Balasubramaniank,l,o, Toni Gabaldonb,c,p, James E. Tarverq, Simon Andrewsa,Heinz Himmelbauerb,c,r, William O. H. Hughesi,s, Roderic Guigób,c, Wolf Reika,t,u,1, and Seirian Sumnerd,h,1
aThe Babraham Institute, Cambridge CB22 3AT, United Kingdom; bCentre for Genomic Regulation (CRG), Barcelona Institute of Science and Technology,Dr. Aiguader 88, 08003 Barcelona, Spain; cUniversitat Pompeu Fabra (UPF), 08003 Barcelona, Spain; dSchool of Biological Sciences, University of Bristol, BristolBS8 1TQ, United Kingdom; eDepartment of Biochemistry and Biophysics, Science for Life Laboratory, Stockholm University, Stockholm 106 91, Sweden; fInstitutode Investigação e Inovação em Saúde, Universidade do Porto, 4200-135 Porto, Portugal; gInstitute of Molecular Pathology and Immunology of the University ofPorto (IPATIMUP), Institute of Molecular Pathology and Immunology, University of Porto, 4200-135 Porto, Portugal; hInstitute of Zoology, Zoological Society ofLondon, London NW1 4RY, United Kingdom; iInstitute of Integrative and Comparative Biology, School of Biology, University of Leeds, Leeds LS2 9JT,United Kingdom; jInstitute of Biochemistry, University of Stuttgart, 70569 Stuttgart, Germany; kDepartment of Chemistry, University of Cambridge, CambridgeCB2 1EW, United Kingdom; lCancer Research UK Cambridge Institute, University of Cambridge, Cambridge CB2 ORE, United Kingdom; mMax Planck Institute forMolecular Genetics, 14195 Berlin, Germany; nDepartamento de Biologia, Faculdade de Filosofia, Ciências e Letras de Ribeirão Preto (FFCLRP)-Universidade deSão Paulo, 14040-901, Ribeirão Preto-SP, Brazil; oSchool of Clinical Medicine, University of Cambridge, CB2 0SP, Cambridge, United Kingdom; pInstitucióCatalana de Recerca i Estudis Avançats, 08010 Barcelona, Spain; qSchool of Earth Sciences, University of Bristol, BS8 1TQ, United Kingdom; rDepartment ofBiotechnology, Universität für Bodenkultur, 1190 Vienna, Austria; sSchool of Life Sciences, University of Sussex, Brighton BN1 9QG, United Kingdom; tCentre forTrophoblast Research, University of Cambridge, Cambridge CB2 3EG, United Kingdom; and uWellcome Trust Sanger Institute, Hinxton CB10 1SA, United Kingdom
Edited by Joan E. Strassmann, Washington University in St. Louis, St. Louis, MO, and approved September 16, 2015 (received for review August 11, 2015)
Phenotypic plasticity is important in adaptation and shapes the
evolution of organisms. However, we understand little about
what aspects of the genome are important in facilitating plasticity.
Eusocial insect societies produce plastic phenotypes from the same
genome, as reproductives (queens) and nonreproductives (work-
ers). The greatest plasticity is found in the simple eusocial insect
societies in which individuals retain the ability to switch between
reproductive and nonreproductive phenotypes as adults. We lack
comprehensive data on the molecular basis of plastic phenotypes.
Here, we sequenced genomes, microRNAs (miRNAs), and multiple
transcriptomes and methylomes from individual brains in a wasp
(Polistes canadensis) and an ant (Dinoponera quadriceps) that live
in simple eusocial societies. In both species, we found few differ-
ences between phenotypes at the transcriptional level, with little
functional specialization, and no evidence that phenotype-specific
gene expression is driven by DNA methylation or miRNAs. Instead,
phenotypic differentiation was defined more subtly by nonran-
dom transcriptional network organization, with roles in these net-
works for both conserved and taxon-restricted genes. The general
lack of highly methylated regions or methylome patterning in both
species may be an important mechanism for achieving plasticity
among phenotypes during adulthood. These findings define previ-
ously unidentified hypotheses on the genomic processes that facili-
tate plasticity and suggest that the molecular hallmarks of social
behavior are likely to differ with the level of social complexity.
social evolution | phenotypic plasticity | genome sequencing |transcriptomes | DNA methylation
Phenotypic plasticity allows organisms to maintain fitness in achanging environment. Plasticity influences organismal eco-
logical resilience, adaptability, evolutionary innovations, and spe-ciation (1, 2). However, we understand little about the molecularsignatures (the genes involved and differential regulation thereof)of such plasticity. Determining the molecular basis of phenotypicplasticity is fundamental to our understanding of the buildingblocks of life and has the potential to uncover insights into se-lection for adaptive function and phenotypic innovation (3–5).The profound action of evolution in the generation of biological
diversity can be discerned from the genome (6). However, genomesequence alone is not sufficient to explain diverse phenotypicvariation because such analyses infer associations based ongene evolution and gene sharing rather than directly identifying
differentially expressed genes (DEGs) in the phenotypes of interest(7). Here, in addition to genome and microRNA (miRNA) se-quencing, we use deep transcriptome and methylome sequencing ofsingle brains from alternative phenotypes to determine the differ-ential molecular processes associated with highly plastic phenotypesin two species of eusocial insects (8).
Significance
In eusocial insect societies, such as ants and some bees and wasps,
phenotypes are highly plastic, generating alternative phenotypes
(queens and workers) from the same genome. The greatest plas-
ticity is found in simple insect societies, in which individuals can
switch between phenotypes as adults. The genomic, transcrip-
tional, and epigenetic underpinnings of such plasticity are largely
unknown. In contrast to the complex societies of the honeybee, we
find that simple insect societies lack distinct transcriptional differ-
entiation between phenotypes and coherently patterned DNA
methylomes. Instead, alternative phenotypes are largely defined
by subtle transcriptional network organization. These traits may
facilitate genomic plasticity. These insights and resources will
stimulate new approaches and hypotheses that will help to un-
ravel the genomic processes that create phenotypic plasticity.
Author contributions: S.P., C.L.A., J.E.T., S.A., W.O.H.H., R.G., W.R., and S.S. designed re-
search; S.P., A.V., C.W., P.E., C.L.A., T.P.J., M.B., F.K., F.S.N., T.G., J.E.T., W.O.H.H., R.G., and
S.S. performed research; S.P., H.H., W.O.H.H., R.G., W.R., and S.S. contributed new reagents/
analytic tools; S.P., A.V., C.W., P.E., F.C., P.G.F., T.P.J., A.S.-P., M.B., I.G.-N., A.E.M., F.K., E.L.,
M.M.-H., J.L.R.-A., S.B., T.G., J.E.T., S.A., H.H., W.R., and S.S. analyzed data; and S.P., W.O.H.H.,
W.R., and S.S. wrote the paper.
Conflict of interest statement: S.B. is a founder and shareholder of Cambridge Epigenetix
Limited, and W.R. is a consultant and shareholder of Cambridge Epigenetix Limited.
This article is a PNAS Direct Submission.
Freely available online through the PNAS open access option.
Data deposition: Genomic analyses were performed on the whole-genome assemblies of
Polistes canadensis and Dinoponera quadriceps, deposited at the DNA Data Bank of
Japan/European Molecular Biology Laboratory/GenBank under the accession nos.
PRJNA253269 and PRJNA253275, respectively. Raw data from all bisulfite-sequencing
and RNA-sequencing libraries were deposited in the Gene Expression Omnibus (GEO)
database (accession no. GSE59525).
See Commentary on page 13755.
1To whom correspondence may be addressed. Email: [email protected],
[email protected], or [email protected].
This article contains supporting information online at www.pnas.org/lookup/suppl/doi:10.
1073/pnas.1515937112/-/DCSupplemental.
13970–13975 | PNAS | November 10, 2015 | vol. 112 | no. 45 www.pnas.org/cgi/doi/10.1073/pnas.1515937112
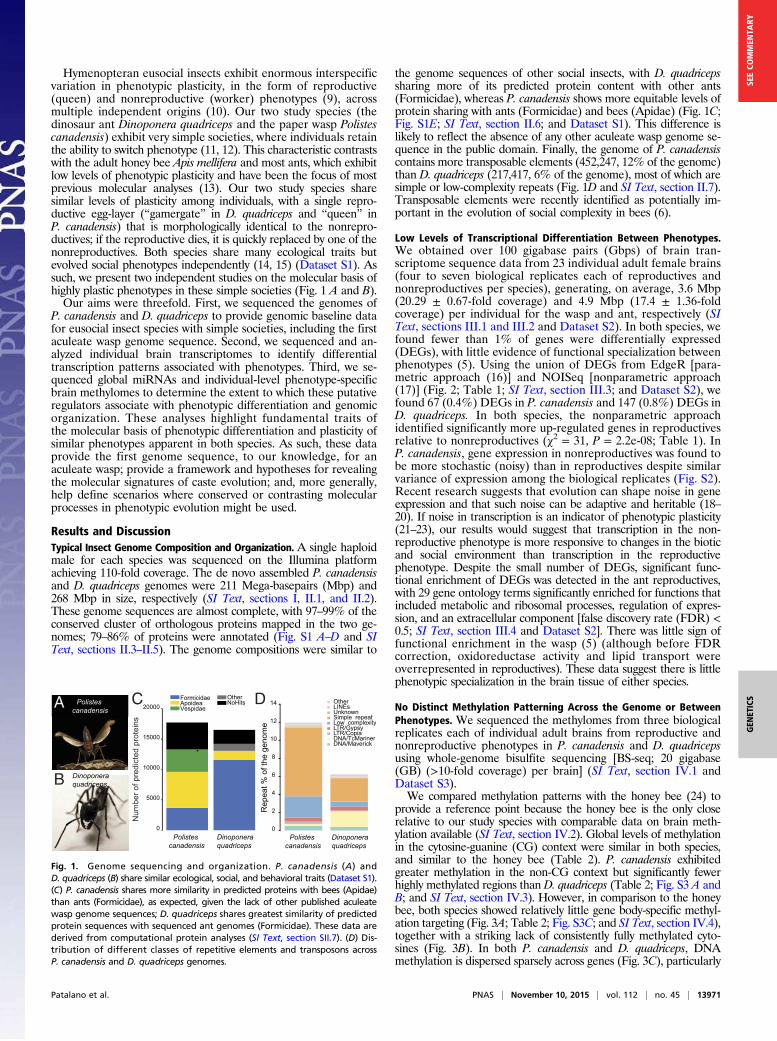
Hymenopteran eusocial insects exhibit enormous interspecificvariation in phenotypic plasticity, in the form of reproductive(queen) and nonreproductive (worker) phenotypes (9), acrossmultiple independent origins (10). Our two study species (thedinosaur ant Dinoponera quadriceps and the paper wasp Polistescanadensis) exhibit very simple societies, where individuals retainthe ability to switch phenotype (11, 12). This characteristic contrastswith the adult honey bee Apis mellifera and most ants, which exhibitlow levels of phenotypic plasticity and have been the focus of mostprevious molecular analyses (13). Our two study species sharesimilar levels of plasticity among individuals, with a single repro-ductive egg-layer (“gamergate” in D. quadriceps and “queen” inP. canadensis) that is morphologically identical to the nonrepro-ductives; if the reproductive dies, it is quickly replaced by one of thenonreproductives. Both species share many ecological traits butevolved social phenotypes independently (14, 15) (Dataset S1). Assuch, we present two independent studies on the molecular basis ofhighly plastic phenotypes in these simple societies (Fig. 1 A and B).Our aims were threefold. First, we sequenced the genomes of
P. canadensis and D. quadriceps to provide genomic baseline datafor eusocial insect species with simple societies, including the firstaculeate wasp genome sequence. Second, we sequenced and an-alyzed individual brain transcriptomes to identify differentialtranscription patterns associated with phenotypes. Third, we se-quenced global miRNAs and individual-level phenotype-specificbrain methylomes to determine the extent to which these putativeregulators associate with phenotypic differentiation and genomicorganization. These analyses highlight fundamental traits ofthe molecular basis of phenotypic differentiation and plasticity ofsimilar phenotypes apparent in both species. As such, these dataprovide the first genome sequence, to our knowledge, for anaculeate wasp; provide a framework and hypotheses for revealingthe molecular signatures of caste evolution; and, more generally,help define scenarios where conserved or contrasting molecularprocesses in phenotypic evolution might be used.
Results and Discussion
Typical Insect Genome Composition and Organization. A single haploidmale for each species was sequenced on the Illumina platformachieving 110-fold coverage. The de novo assembled P. canadensisand D. quadriceps genomes were 211 Mega-basepairs (Mbp) and268 Mbp in size, respectively (SI Text, sections I, II.1, and II.2).These genome sequences are almost complete, with 97–99% of theconserved cluster of orthologous proteins mapped in the two ge-nomes; 79–86% of proteins were annotated (Fig. S1 A–D and SIText, sections II.3–II.5). The genome compositions were similar to
the genome sequences of other social insects, with D. quadricepssharing more of its predicted protein content with other ants(Formicidae), whereas P. canadensis shows more equitable levels ofprotein sharing with ants (Formicidae) and bees (Apidae) (Fig. 1C;Fig. S1E; SI Text, section II.6; and Dataset S1). This difference islikely to reflect the absence of any other aculeate wasp genome se-quence in the public domain. Finally, the genome of P. canadensiscontains more transposable elements (452,247, 12% of the genome)than D. quadriceps (217,417, 6% of the genome), most of which aresimple or low-complexity repeats (Fig. 1D and SI Text, section II.7).Transposable elements were recently identified as potentially im-portant in the evolution of social complexity in bees (6).
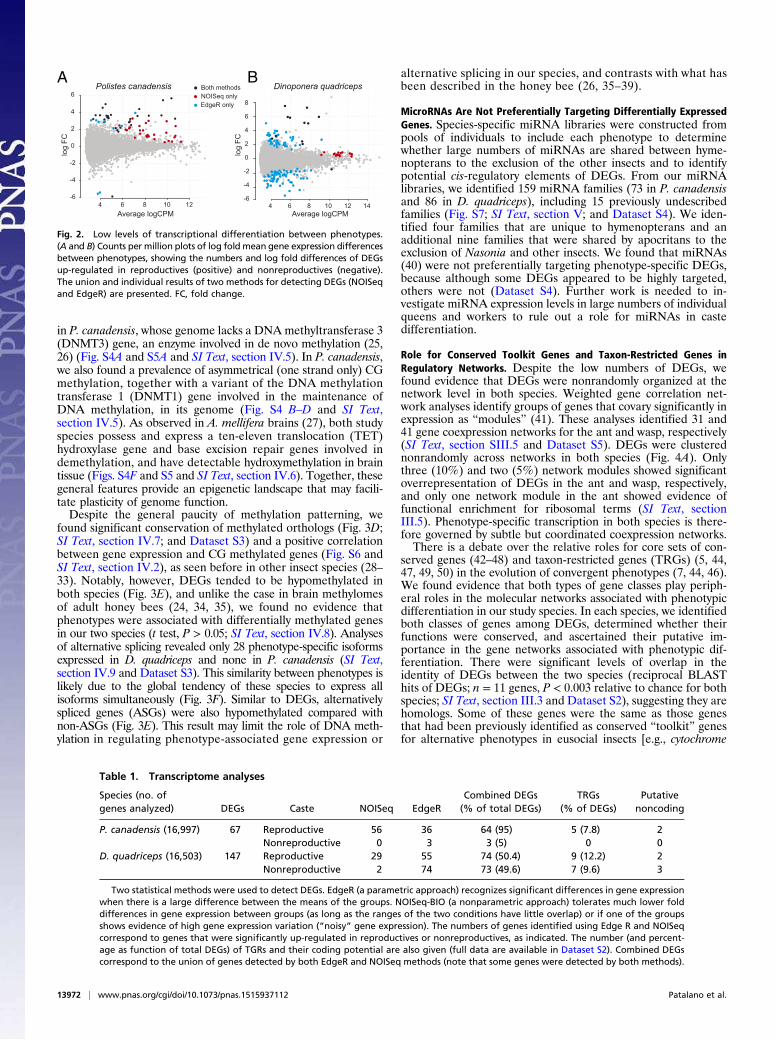
Low Levels of Transcriptional Differentiation Between Phenotypes.We obtained over 100 gigabase pairs (Gbps) of brain tran-scriptome sequence data from 23 individual adult female brains(four to seven biological replicates each of reproductives andnonreproductives per species), generating, on average, 3.6 Mbp(20.29 ± 0.67-fold coverage) and 4.9 Mbp (17.4 ± 1.36-foldcoverage) per individual for the wasp and ant, respectively (SIText, sections III.1 and III.2 and Dataset S2). In both species, wefound fewer than 1% of genes were differentially expressed(DEGs), with little evidence of functional specialization betweenphenotypes (5). Using the union of DEGs from EdgeR [para-metric approach (16)] and NOISeq [nonparametric approach(17)] (Fig. 2; Table 1; SI Text, section III.3; and Dataset S2), wefound 67 (0.4%) DEGs in P. canadensis and 147 (0.8%) DEGs inD. quadriceps. In both species, the nonparametric approachidentified significantly more up-regulated genes in reproductivesrelative to nonreproductives (χ2 = 31, P = 2.2e-08; Table 1). InP. canadensis, gene expression in nonreproductives was found tobe more stochastic (noisy) than in reproductives despite similarvariance of expression among the biological replicates (Fig. S2).Recent research suggests that evolution can shape noise in geneexpression and that such noise can be adaptive and heritable (18–20). If noise in transcription is an indicator of phenotypic plasticity(21–23), our results would suggest that transcription in the non-reproductive phenotype is more responsive to changes in the bioticand social environment than transcription in the reproductivephenotype. Despite the small number of DEGs, significant func-tional enrichment of DEGs was detected in the ant reproductives,with 29 gene ontology terms significantly enriched for functions thatincluded metabolic and ribosomal processes, regulation of expres-sion, and an extracellular component [false discovery rate (FDR) <0.5; SI Text, section III.4 and Dataset S2]. There was little sign offunctional enrichment in the wasp (5) (although before FDRcorrection, oxidoreductase activity and lipid transport wereoverrepresented in reproductives). These data suggest there is littlephenotypic specialization in the brain tissue of either species.
No Distinct Methylation Patterning Across the Genome or Between
Phenotypes. We sequenced the methylomes from three biologicalreplicates each of individual adult brains from reproductive andnonreproductive phenotypes in P. canadensis and D. quadricepsusing whole-genome bisulfite sequencing [BS-seq; 20 gigabase(GB) (>10-fold coverage) per brain] (SI Text, section IV.1 andDataset S3).We compared methylation patterns with the honey bee (24) to
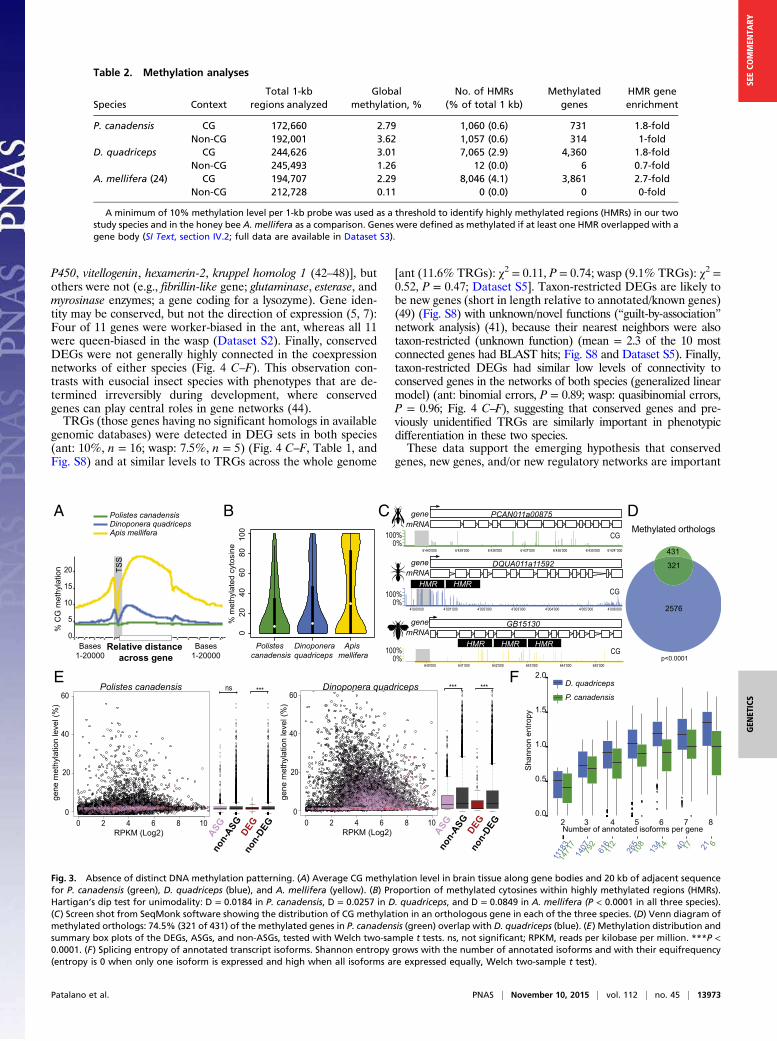
provide a reference point because the honey bee is the only closerelative to our study species with comparable data on brain meth-ylation available (SI Text, section IV.2). Global levels of methylationin the cytosine-guanine (CG) context were similar in both species,and similar to the honey bee (Table 2). P. canadensis exhibitedgreater methylation in the non-CG context but significantly fewerhighly methylated regions than D. quadriceps (Table 2; Fig. S3 A andB; and SI Text, section IV.3). However, in comparison to the honeybee, both species showed relatively little gene body-specific methyl-ation targeting (Fig. 3A; Table 2; Fig. S3C; and SI Text, section IV.4),together with a striking lack of consistently fully methylated cyto-sines (Fig. 3B). In both P. canadensis and D. quadriceps, DNAmethylation is dispersed sparsely across genes (Fig. 3C), particularly
Dinoponera
quadriceps
0
15000
FormicidaeApoideaVespidae
OtherNoHits
Polistes
canadensis
Nu
mb
er
of p
red
icte
d p
rote
ins
10000
5000
20000
Dinoponera
quadriceps
Polistes
canadensis
OtherLINEsUnknownSimple repeatLow complexityLTR/GypsyLTR/CopiaDNA/TcMarinerDNA/Maverick
Re
pe
at %
of th
e g
en
om
e
0
2
4
6
8
10
12
14
Dinoponera
quadriceps
Polistes
canadensis
B
C DA
Fig. 1. Genome sequencing and organization. P. canadensis (A) and
D. quadriceps (B) share similar ecological, social, and behavioral traits (Dataset S1).
(C) P. canadensis shares more similarity in predicted proteins with bees (Apidae)
than ants (Formicidae), as expected, given the lack of other published aculeate
wasp genome sequences; D. quadriceps shares greatest similarity of predicted
protein sequences with sequenced ant genomes (Formicidae). These data are
derived from computational protein analyses (SI Text, section SII.7). (D) Dis-
tribution of different classes of repetitive elements and transposons across
P. canadensis and D. quadriceps genomes.
Patalano et al. PNAS | November 10, 2015 | vol. 112 | no. 45 | 13971
GENETICS
SEECOMMENTARY
in P. canadensis, whose genome lacks a DNA methyltransferase 3(DNMT3) gene, an enzyme involved in de novo methylation (25,26) (Fig. S4A and S5A and SI Text, section IV.5). In P. canadensis,we also found a prevalence of asymmetrical (one strand only) CGmethylation, together with a variant of the DNA methylationtransferase 1 (DNMT1) gene involved in the maintenance ofDNA methylation, in its genome (Fig. S4 B–D and SI Text,section IV.5). As observed in A. mellifera brains (27), both studyspecies possess and express a ten-eleven translocation (TET)hydroxylase gene and base excision repair genes involved indemethylation, and have detectable hydroxymethylation in braintissue (Figs. S4F and S5 and SI Text, section IV.6). Together, thesegeneral features provide an epigenetic landscape that may facili-tate plasticity of genome function.Despite the general paucity of methylation patterning, we
found significant conservation of methylated orthologs (Fig. 3D;SI Text, section IV.7; and Dataset S3) and a positive correlationbetween gene expression and CG methylated genes (Fig. S6 andSI Text, section IV.2), as seen before in other insect species (28–33). Notably, however, DEGs tended to be hypomethylated inboth species (Fig. 3E), and unlike the case in brain methylomesof adult honey bees (24, 34, 35), we found no evidence thatphenotypes were associated with differentially methylated genesin our two species (t test, P > 0.05; SI Text, section IV.8). Analysesof alternative splicing revealed only 28 phenotype-specific isoformsexpressed in D. quadriceps and none in P. canadensis (SI Text,section IV.9 and Dataset S3). This similarity between phenotypes islikely due to the global tendency of these species to express allisoforms simultaneously (Fig. 3F). Similar to DEGs, alternativelyspliced genes (ASGs) were also hypomethylated compared withnon-ASGs (Fig. 3E). This result may limit the role of DNA meth-ylation in regulating phenotype-associated gene expression or
alternative splicing in our species, and contrasts with what hasbeen described in the honey bee (26, 35–39).
MicroRNAs Are Not Preferentially Targeting Differentially Expressed
Genes. Species-specific miRNA libraries were constructed frompools of individuals to include each phenotype to determinewhether large numbers of miRNAs are shared between hyme-nopterans to the exclusion of the other insects and to identifypotential cis-regulatory elements of DEGs. From our miRNAlibraries, we identified 159 miRNA families (73 in P. canadensisand 86 in D. quadriceps), including 15 previously undescribedfamilies (Fig. S7; SI Text, section V; and Dataset S4). We iden-tified four families that are unique to hymenopterans and anadditional nine families that were shared by apocritans to theexclusion of Nasonia and other insects. We found that miRNAs(40) were not preferentially targeting phenotype-specific DEGs,because although some DEGs appeared to be highly targeted,others were not (Dataset S4). Further work is needed to in-vestigate miRNA expression levels in large numbers of individualqueens and workers to rule out a role for miRNAs in castedifferentiation.
Role for Conserved Toolkit Genes and Taxon-Restricted Genes in
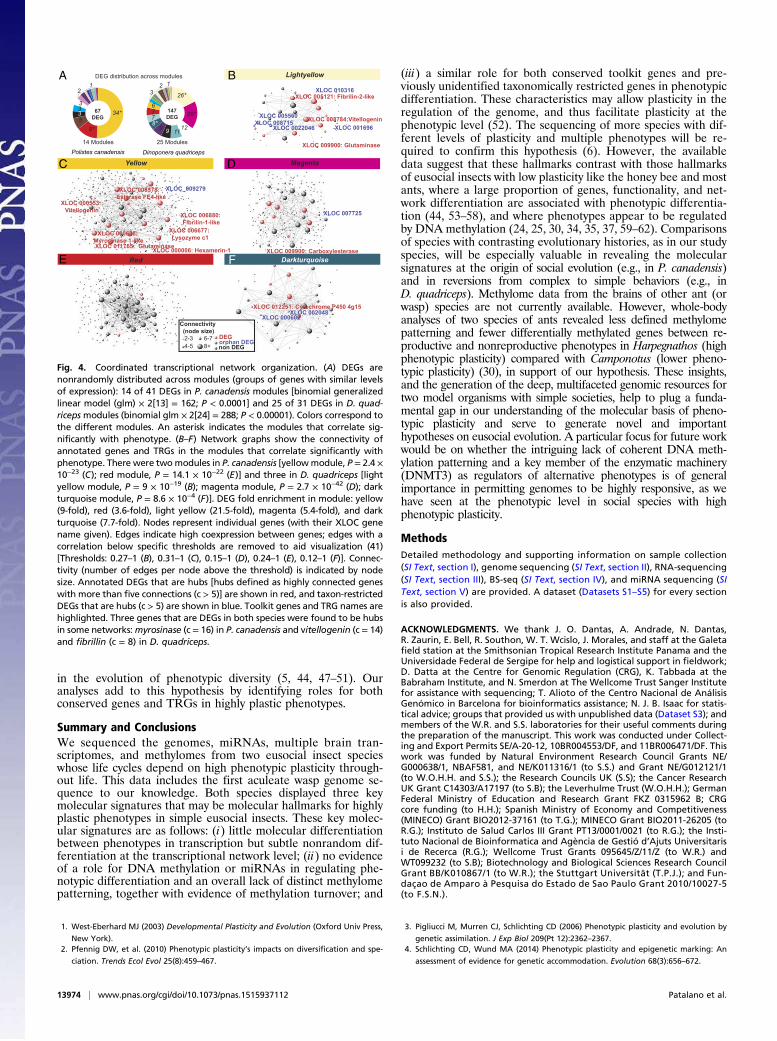
Regulatory Networks. Despite the low numbers of DEGs, wefound evidence that DEGs were nonrandomly organized at thenetwork level in both species. Weighted gene correlation net-work analyses identify groups of genes that covary significantly inexpression as “modules” (41). These analyses identified 31 and41 gene coexpression networks for the ant and wasp, respectively(SI Text, section SIII.5 and Dataset S5). DEGs were clusterednonrandomly across networks in both species (Fig. 4A). Onlythree (10%) and two (5%) network modules showed significantoverrepresentation of DEGs in the ant and wasp, respectively,and only one network module in the ant showed evidence offunctional enrichment for ribosomal terms (SI Text, sectionIII.5). Phenotype-specific transcription in both species is there-fore governed by subtle but coordinated coexpression networks.There is a debate over the relative roles for core sets of con-
served genes (42–48) and taxon-restricted genes (TRGs) (5, 44,47, 49, 50) in the evolution of convergent phenotypes (7, 44, 46).We found evidence that both types of gene classes play periph-eral roles in the molecular networks associated with phenotypicdifferentiation in our study species. In each species, we identifiedboth classes of genes among DEGs, determined whether theirfunctions were conserved, and ascertained their putative im-portance in the gene networks associated with phenotypic dif-ferentiation. There were significant levels of overlap in theidentity of DEGs between the two species (reciprocal BLASThits of DEGs; n = 11 genes, P < 0.003 relative to chance for bothspecies; SI Text, section III.3 and Dataset S2), suggesting they arehomologs. Some of these genes were the same as those genesthat had been previously identified as conserved “toolkit” genesfor alternative phenotypes in eusocial insects [e.g., cytochrome
log
FC
Average logCPM
6
4
2
0
-2
-4
-6
64 8 10 12
Average logCPM
log
FC
64 8 10 12 14
6
4
2
0
-2
-4
-6
8
Dinoponera quadricepsPolistes canadensis Both methods
NOISeq only
EdgeR only
A B
Fig. 2. Low levels of transcriptional differentiation between phenotypes.
(A and B) Counts per million plots of log fold mean gene expression differences
between phenotypes, showing the numbers and log fold differences of DEGs
up-regulated in reproductives (positive) and nonreproductives (negative).
The union and individual results of two methods for detecting DEGs (NOISeq
and EdgeR) are presented. FC, fold change.
Table 1. Transcriptome analyses
Species (no. of
genes analyzed) DEGs Caste NOISeq EdgeR
Combined DEGs
(% of total DEGs)
TRGs
(% of DEGs)
Putative
noncoding
P. canadensis (16,997) 67 Reproductive 56 36 64 (95) 5 (7.8) 2
Nonreproductive 0 3 3 (5) 0 0
D. quadriceps (16,503) 147 Reproductive 29 55 74 (50.4) 9 (12.2) 2
Nonreproductive 2 74 73 (49.6) 7 (9.6) 3
Two statistical methods were used to detect DEGs. EdgeR (a parametric approach) recognizes significant differences in gene expression
when there is a large difference between the means of the groups. NOISeq-BIO (a nonparametric approach) tolerates much lower fold
differences in gene expression between groups (as long as the ranges of the two conditions have little overlap) or if one of the groups
shows evidence of high gene expression variation (“noisy” gene expression). The numbers of genes identified using Edge R and NOISeq
correspond to genes that were significantly up-regulated in reproductives or nonreproductives, as indicated. The number (and percent-
age as function of total DEGs) of TGRs and their coding potential are also given (full data are available in Dataset S2). Combined DEGs
correspond to the union of genes detected by both EdgeR and NOISeq methods (note that some genes were detected by both methods).
13972 | www.pnas.org/cgi/doi/10.1073/pnas.1515937112 Patalano et al.
P450, vitellogenin, hexamerin-2, kruppel homolog 1 (42–48)], butothers were not (e.g., fibrillin-like gene; glutaminase, esterase, andmyrosinase enzymes; a gene coding for a lysozyme). Gene iden-tity may be conserved, but not the direction of expression (5, 7):Four of 11 genes were worker-biased in the ant, whereas all 11were queen-biased in the wasp (Dataset S2). Finally, conservedDEGs were not generally highly connected in the coexpressionnetworks of either species (Fig. 4 C–F). This observation con-trasts with eusocial insect species with phenotypes that are de-termined irreversibly during development, where conservedgenes can play central roles in gene networks (44).TRGs (those genes having no significant homologs in available
genomic databases) were detected in DEG sets in both species(ant: 10%, n = 16; wasp: 7.5%, n = 5) (Fig. 4 C–F, Table 1, andFig. S8) and at similar levels to TRGs across the whole genome
[ant (11.6% TRGs): χ2 = 0.11, P = 0.74; wasp (9.1% TRGs): χ2 =0.52, P = 0.47; Dataset S5]. Taxon-restricted DEGs are likely tobe new genes (short in length relative to annotated/known genes)(49) (Fig. S8) with unknown/novel functions (“guilt-by-association”network analysis) (41), because their nearest neighbors were alsotaxon-restricted (unknown function) (mean = 2.3 of the 10 mostconnected genes had BLAST hits; Fig. S8 and Dataset S5). Finally,taxon-restricted DEGs had similar low levels of connectivity toconserved genes in the networks of both species (generalized linearmodel) (ant: binomial errors, P = 0.89; wasp: quasibinomial errors,P = 0.96; Fig. 4 C–F), suggesting that conserved genes and pre-viously unidentified TRGs are similarly important in phenotypicdifferentiation in these two species.These data support the emerging hypothesis that conserved
genes, new genes, and/or new regulatory networks are important
ASG
DEG
Number of annotated isoforms per gene
Sh
an
no
n e
ntr
op
y
2.0
1.5
1.0
0.5
0.02 43 5 6 7 8
1118
314
717
1407792
616
112
265
108
134 14 40 17 21 6
P. canadensis
D. quadricepsDinoponera quadriceps
5
10
15
20
0
% C
G m
eth
yla
tion
Relative distance
across gene
Bases
1-20000
Bases
1-20000
TS
S
GB15130gene
mRNA
PCAN011a00875gene
mRNA
DQUA011a11592gene
mRNA
0%
100%
6’424’’0006’435’0006’436’0006’437’0006’438’0006’439’0006’440’000
HMR
4’001’0004’000’000
0%
100%
4’002’000 4’003’000 4’004’000 4’005’000 4’006’000
0%
100%HMR
641’000640’000 642’000 643’000 644’000 645’000
CG
CG
CG
02
04
06
08
01
00
Dinoponera
quadriceps
Polistes
canadensis
Apis
mellifera
% m
eth
yla
ted
cyto
sin
e
Methylated orthologs
321
2576
p<0.0001
431
E
A B C D
F
Dinoponera quadricepsPolistes canadensis
Apis mellifera
0
20
40
60
RPKM (Log2)
0 2 4 6 8 10
ge
ne
me
thyla
tio
n le
ve
l (%
)
Polistes canadensis
0
20
40
60
RPKM (Log2)
0 2 4 6 8 10
ge
ne
me
thyla
tio
n le
ve
l (%
)
non-A
SG
non-D
EG
ASG
DEG
non-A
SG
non-D
EG
***ns *** ***
HMR
HMR HMR
Fig. 3. Absence of distinct DNA methylation patterning. (A) Average CG methylation level in brain tissue along gene bodies and 20 kb of adjacent sequence
for P. canadensis (green), D. quadriceps (blue), and A. mellifera (yellow). (B) Proportion of methylated cytosines within highly methylated regions (HMRs).
Hartigan’s dip test for unimodality: D = 0.0184 in P. canadensis, D = 0.0257 in D. quadriceps, and D = 0.0849 in A. mellifera (P < 0.0001 in all three species).
(C) Screen shot from SeqMonk software showing the distribution of CG methylation in an orthologous gene in each of the three species. (D) Venn diagram of
methylated orthologs: 74.5% (321 of 431) of the methylated genes in P. canadensis (green) overlap with D. quadriceps (blue). (E) Methylation distribution and
summary box plots of the DEGs, ASGs, and non-ASGs, tested with Welch two-sample t tests. ns, not significant; RPKM, reads per kilobase per million. ***P <
0.0001. (F) Splicing entropy of annotated transcript isoforms. Shannon entropy grows with the number of annotated isoforms and with their equifrequency
(entropy is 0 when only one isoform is expressed and high when all isoforms are expressed equally, Welch two-sample t test).
Table 2. Methylation analyses
Species Context
Total 1-kb
regions analyzed
Global
methylation, %
No. of HMRs
(% of total 1 kb)
Methylated
genes
HMR gene
enrichment
P. canadensis CG 172,660 2.79 1,060 (0.6) 731 1.8-fold
Non-CG 192,001 3.62 1,057 (0.6) 314 1-fold
D. quadriceps CG 244,626 3.01 7,065 (2.9) 4,360 1.8-fold
Non-CG 245,493 1.26 12 (0.0) 6 0.7-fold
A. mellifera (24) CG 194,707 2.29 8,046 (4.1) 3,861 2.7-fold
Non-CG 212,728 0.11 0 (0.0) 0 0-fold
A minimum of 10% methylation level per 1-kb probe was used as a threshold to identify highly methylated regions (HMRs) in our two
study species and in the honey bee A. mellifera as a comparison. Genes were defined as methylated if at least one HMR overlapped with a
gene body (SI Text, section IV.2; full data are available in Dataset S3).
Patalano et al. PNAS | November 10, 2015 | vol. 112 | no. 45 | 13973
GENETICS
SEECOMMENTARY
in the evolution of phenotypic diversity (5, 44, 47–51). Ouranalyses add to this hypothesis by identifying roles for bothconserved genes and TRGs in highly plastic phenotypes.
Summary and Conclusions
We sequenced the genomes, miRNAs, multiple brain tran-scriptomes, and methylomes from two eusocial insect specieswhose life cycles depend on high phenotypic plasticity through-out life. This data includes the first aculeate wasp genome se-quence to our knowledge. Both species displayed three keymolecular signatures that may be molecular hallmarks for highlyplastic phenotypes in simple eusocial insects. These key molec-ular signatures are as follows: (i) little molecular differentiationbetween phenotypes in transcription but subtle nonrandom dif-ferentiation at the transcriptional network level; (ii) no evidenceof a role for DNA methylation or miRNAs in regulating phe-notypic differentiation and an overall lack of distinct methylomepatterning, together with evidence of methylation turnover; and
(iii) a similar role for both conserved toolkit genes and pre-viously unidentified taxonomically restricted genes in phenotypicdifferentiation. These characteristics may allow plasticity in theregulation of the genome, and thus facilitate plasticity at thephenotypic level (52). The sequencing of more species with dif-ferent levels of plasticity and multiple phenotypes will be re-quired to confirm this hypothesis (6). However, the availabledata suggest that these hallmarks contrast with those hallmarksof eusocial insects with low plasticity like the honey bee and mostants, where a large proportion of genes, functionality, and net-work differentiation are associated with phenotypic differentia-tion (44, 53–58), and where phenotypes appear to be regulatedby DNA methylation (24, 25, 30, 34, 35, 37, 59–62). Comparisonsof species with contrasting evolutionary histories, as in our studyspecies, will be especially valuable in revealing the molecularsignatures at the origin of social evolution (e.g., in P. canadensis)and in reversions from complex to simple behaviors (e.g., inD. quadriceps). Methylome data from the brains of other ant (orwasp) species are not currently available. However, whole-bodyanalyses of two species of ants revealed less defined methylomepatterning and fewer differentially methylated genes between re-productive and nonreproductive phenotypes in Harpegnathos (highphenotypic plasticity) compared with Camponotus (lower pheno-typic plasticity) (30), in support of our hypothesis. These insights,and the generation of the deep, multifaceted genomic resources fortwo model organisms with simple societies, help to plug a funda-mental gap in our understanding of the molecular basis of pheno-typic plasticity and serve to generate novel and importanthypotheses on eusocial evolution. A particular focus for future workwould be on whether the intriguing lack of coherent DNA meth-ylation patterning and a key member of the enzymatic machinery(DNMT3) as regulators of alternative phenotypes is of generalimportance in permitting genomes to be highly responsive, as wehave seen at the phenotypic level in social species with highphenotypic plasticity.
Methods
Detailed methodology and supporting information on sample collection
(SI Text, section I), genome sequencing (SI Text, section II), RNA-sequencing
(SI Text, section III), BS-seq (SI Text, section IV), and miRNA sequencing (SI
Text, section V) are provided. A dataset (Datasets S1–S5) for every section
is also provided.
ACKNOWLEDGMENTS. We thank J. O. Dantas, A. Andrade, N. Dantas,R. Zaurin, E. Bell, R. Southon, W. T. Wcislo, J. Morales, and staff at the Galetafield station at the Smithsonian Tropical Research Institute Panama and theUniversidade Federal de Sergipe for help and logistical support in fieldwork;D. Datta at the Centre for Genomic Regulation (CRG), K. Tabbada at theBabraham Institute, and N. Smerdon at The Wellcome Trust Sanger Institutefor assistance with sequencing; T. Alioto of the Centro Nacional de AnálisisGenómico in Barcelona for bioinformatics assistance; N. J. B. Isaac for statis-tical advice; groups that provided us with unpublished data (Dataset S3); andmembers of the W.R. and S.S. laboratories for their useful comments duringthe preparation of the manuscript. This work was conducted under Collect-ing and Export Permits SE/A-20-12, 10BR004553/DF, and 11BR006471/DF. Thiswork was funded by Natural Environment Research Council Grants NE/G000638/1, NBAF581, and NE/K011316/1 (to S.S.) and Grant NE/G012121/1(to W.O.H.H. and S.S.); the Research Councils UK (S.S); the Cancer ResearchUK Grant C14303/A17197 (to S.B); the Leverhulme Trust (W.O.H.H.); GermanFederal Ministry of Education and Research Grant FKZ 0315962 B; CRGcore funding (to H.H.); Spanish Ministry of Economy and Competitiveness(MINECO) Grant BIO2012-37161 (to T.G.); MINECO Grant BIO2011-26205 (toR.G.); Instituto de Salud Carlos III Grant PT13/0001/0021 (to R.G.); the Insti-tuto Nacional de Bioinformatica and Agència de Gestió d’Ajuts Universitarisi de Recerca (R.G.); Wellcome Trust Grants 095645/Z/11/Z (to W.R.) andWT099232 (to S.B); Biotechnology and Biological Sciences Research CouncilGrant BB/K010867/1 (to W.R.); the Stuttgart Universität (T.P.J.); and Fun-daçao de Amparo à Pesquisa do Estado de Sao Paulo Grant 2010/10027-5(to F.S.N.).
1. West-Eberhard MJ (2003) Developmental Plasticity and Evolution (Oxford Univ Press,
New York).
2. Pfennig DW, et al. (2010) Phenotypic plasticity’s impacts on diversification and spe-
ciation. Trends Ecol Evol 25(8):459–467.
3. Pigliucci M, Murren CJ, Schlichting CD (2006) Phenotypic plasticity and evolution by
genetic assimilation. J Exp Biol 209(Pt 12):2362–2367.
4. Schlichting CD, Wund MA (2014) Phenotypic plasticity and epigenetic marking: An
assessment of evidence for genetic accommodation. Evolution 68(3):656–672.
DEG distribution across modules
14 Modules
67
DEG
147
DEG
25 Modules
Yellow
Red
Lightyellow
Magenta
Darkturquoise
34*
9*
5333
21
26*
1211
26*
9
8*776
9
32 1
8+
Connectivity
(node size)
6-7
4-5
2-3 DEGorphan DEGnon DEG
Dinoponera quadricepsPolistes canadensis
XLOC 001696
XLOC 010316
XLOC 0022046XLOC 008715
XLOC 005560
XLOC 005121: Fibrilin-2-like
XLOC 008784:Vitellogenin
XLOC 007725
XLOC 002048XLOC 000602
XLOC 012251: Cytochrome P450 4g15
XLOC 000006: Hexamerin-1
XLOC 000608:
Myrosinase 1-like
XLOC 000553:
VitellogeninXLOC 006880:
Fibrilin-1-like
XLOC_009279XLOC 008578:
Esterase FE4-like
XLOC 011755: Glutaminase
XLOC 006677:
Lysozyme c1
XLOC 009900: Glutaminase
XLOC 009900: Carboxylesterase
A B
C D
E F
Fig. 4. Coordinated transcriptional network organization. (A) DEGs are
nonrandomly distributed across modules (groups of genes with similar levels
of expression): 14 of 41 DEGs in P. canadensis modules [binomial generalized
linear model (glm) × 2[13] = 162; P < 0.0001] and 25 of 31 DEGs in D. quad-
ricepsmodules (binomial glm × 2[24] = 288; P < 0.00001). Colors correspond to
the different modules. An asterisk indicates the modules that correlate sig-
nificantly with phenotype. (B–F) Network graphs show the connectivity of
annotated genes and TRGs in the modules that correlate significantly with
phenotype. There were twomodules in P. canadensis [yellowmodule, P = 2.4 ×
10−23 (C); red module, P = 14.1 × 10⁻²² (E)] and three in D. quadriceps [light
yellow module, P = 9 × 10⁻¹⁹ (B); magenta module, P = 2.7 × 10−42 (D); dark
turquoise module, P = 8.6 × 10⁻⁴ (F)]. DEG fold enrichment in module: yellow
(9-fold), red (3.6-fold), light yellow (21.5-fold), magenta (5.4-fold), and dark
turquoise (7.7-fold). Nodes represent individual genes (with their XLOC gene
name given). Edges indicate high coexpression between genes; edges with a
correlation below specific thresholds are removed to aid visualization (41)
[Thresholds: 0.27–1 (B), 0.31–1 (C), 0.15–1 (D), 0.24–1 (E), 0.12–1 (F)]. Connec-
tivity (number of edges per node above the threshold) is indicated by node
size. Annotated DEGs that are hubs [hubs defined as highly connected genes
with more than five connections (c > 5)] are shown in red, and taxon-restricted
DEGs that are hubs (c > 5) are shown in blue. Toolkit genes and TRG names are
highlighted. Three genes that are DEGs in both species were found to be hubs
in some networks:myrosinase (c = 16) in P. canadensis and vitellogenin (c = 14)
and fibrillin (c = 8) in D. quadriceps.
13974 | www.pnas.org/cgi/doi/10.1073/pnas.1515937112 Patalano et al.
5. Ferreira PG, et al. (2013) Transcriptome analyses of primitively eusocial wasps reveal
novel insights into the evolution of sociality and the origin of alternative phenotypes.
Genome Biol 14(2):R20.
6. Kapheim KM, et al. (2015) Social evolution. Genomic signatures of evolutionary
transitions from solitary to group living. Science 348(6239):1139–1143.
7. Rehan SM, Toth AL (2015) Climbing the social ladder: The molecular evolution of
sociality. Trends Ecol Evol 30(7):426–433.
8. Patalano S, Hore TA, Reik W, Sumner S (2012) Shifting behaviour: Epigenetic re-
programming in eusocial insects. Curr Opin Cell Biol 24(3):367–373.
9. Oster G, Wilson EO (1978) Caste and Ecology in the Social Insects (Princeton Univ Press,
Princeton).
10. Hughes WOH, Oldroyd BP, Beekman M, Ratnieks FLW (2008) Ancestral monogamy
shows kin selection is key to the evolution of eusociality. Science 320(5880):
1213–1216.
11. Sumner S, Kelstrup H, Fanelli D (2010) Reproductive constraints, direct fitness and
indirect fitness benefits explain helping behaviour in the primitively eusocial wasp,
Polistes canadensis. Proc Biol Sci 277(1688):1721–1728.
12. Monnin T (1999) Dominance hierarchy and reproductive conflicts among sub-
ordinates in a monogynous queenless ant. Behav Ecol 10(3):323–332.
13. Yan H, et al. (2014) Eusocial insects as emerging models for behavioural epigenetics.
Nat Rev Genet 15(10):677–688.
14. Peeters C (1993) Monogamy and polygyny in ponerine ants with or without queens.
Queen Number and Sociality in Insects, ed Keller L (Oxford Univ Press, Oxford).
15. Jandt JM, Tibbetts EA, Toth AL (2014) Polistes paper wasps: A model genus for the
study of social dominance hierarchies. Insectes Soc 61(1):11–27.
16. Robinson MD, McCarthy DJ, Smyth GK (2010) edgeR: A Bioconductor package for
differential expression analysis of digital gene expression data. Bioinformatics 26(1):
139–140.
17. Tarazona S, García-Alcalde F, Dopazo J, Ferrer A, Conesa A (2011) Differential ex-
pression in RNA-seq: A matter of depth. Genome Res 21(12):2213–2223.
18. Ansel J, et al. (2008) Cell-to-cell stochastic variation in gene expression is a complex
genetic trait. PLoS Genet 4(4):e1000049.
19. Newman JR, et al. (2006) Single-cell proteomic analysis of S. cerevisiae reveals the
architecture of biological noise. Nature 441(7095):840–846.
20. Viney M, Reece SE (2013) Adaptive noise. Proc Biol Sci 280(1767):20131104–20131104.
21. Lehner B (2010) Conflict between noise and plasticity in yeast. PLoS Genet 6(11):
e1001185.
22. Losick R, Desplan C (2008) Stochasticity and cell fate. Science 320(5872):65–68.
23. Raser JM, O’Shea EK (2005) Noise in gene expression: Origins, consequences, and
control. Science 309(5743):2010–2013.
24. Lyko F, et al. (2010) The honey bee epigenomes: Differential methylation of brain
DNA in queens and workers. PLoS Biol 8(11):e1000506.
25. Kucharski R, Maleszka J, Foret S, Maleszka R (2008) Nutritional control of re-
productive status in honeybees via DNA methylation. Science 319(5871):1827–1830.
26. Li-Byarlay H, et al. (2013) RNA interference knockdown of DNA methyl-transferase 3
affects gene alternative splicing in the honey bee. Proc Natl Acad Sci USA 110(31):
12750–12755.
27. Wojciechowski M, et al. (2014) Insights into DNA hydroxymethylation in the honey-
bee from in-depth analyses of TET dioxygenase. Open Biol 4(8):140110.
28. Hunt BG, Glastad KM, Yi SV, Goodisman MAD (2013) Patterning and regulatory as-
sociations of DNA methylation are mirrored by histone modifications in insects.
Genome Biol Evol 5(3):591–598.
29. Wang X, et al. (2013) Function and evolution of DNA methylation in Nasonia vitri-
pennis. PLoS Genet 9(10):e1003872.
30. Bonasio R, et al. (2012) Genome-wide and caste-specific DNA methylomes of the ants
Camponotus floridanus and Harpegnathos saltator. Curr Biol 22(19):1755–1764.
31. Sarda S, Zeng J, Hunt BG, Yi SV (2012) The evolution of invertebrate gene body
methylation. Mol Biol Evol 29(8):1907–1916.
32. Hunt BG, Brisson JA, Yi SV, Goodisman MAD (2010) Functional conservation of DNA
methylation in the pea aphid and the honeybee. Genome Biol Evol 2:719–728.
33. Zemach A, McDaniel IE, Silva P, Zilberman D (2010) Genome-wide evolutionary
analysis of eukaryotic DNA methylation. Science 328(5980):916–919.
34. Herb BR, et al. (2012) Reversible switching between epigenetic states in honeybee
behavioral subcastes. Nat Neurosci 15(10):1371–1373.
35. Lockett GA, Kucharski R, Maleszka R (2012) DNA methylation changes elicited by
social stimuli in the brains of worker honey bees. Genes Brain Behav 11(2):235–242.
36. Cingolani P, et al. (2013) Intronic non-CG DNA hydroxymethylation and alternative
mRNA splicing in honey bees. BMC Genomics 14:666.
37. Foret S, et al. (2012) DNA methylation dynamics, metabolic fluxes, gene splicing, and
alternative phenotypes in honey bees. Proc Natl Acad Sci USA 109(13):4968–4973.
38. Flores K, et al. (2012) Genome-wide association between DNA methylation and al-
ternative splicing in an invertebrate. BMC Genomics 13(1):480.
39. Jarosch A, Stolle E, Crewe RM, Moritz RF (2011) Alternative splicing of a single
transcription factor drives selfish reproductive behavior in honeybee workers (Apis
mellifera). Proc Natl Acad Sci USA 108(37):15282–15287.
40. Greenberg JK, et al. (2012) Behavioral plasticity in honey bees is associated with
differences in brain microRNA transcriptome. Genes Brain Behav 11(6):660–670.
41. Langfelder P, Horvath S (2008) WGCNA: An R package for weighted correlation
network analysis. BMC Bioinformatics 9:559.
42. Arendt J, Reznick D (2008) Convergence and parallelism reconsidered: What have we
learned about the genetics of adaptation? Trends Ecol Evol 23(1):26–32.
43. Toth AL, Robinson GE (2007) Evo-devo and the evolution of social behavior. Trends
Genet 23(7):334–341.
44. Mikheyev AS, Linksvayer TA (2015) Genes associated with ant social behavior show
distinct transcriptional and evolutionary patterns. eLife 4:e04775.
45. Parker J, et al. (2013) Genome-wide signatures of convergent evolution in echolo-
cating mammals. Nature 502(7470):228–231.
46. Stern DL (2013) The genetic causes of convergent evolution. Nat Rev Genet 14(11):
751–764.
47. Sumner S (2014) The importance of genomic novelty in social evolution. Mol Ecol
23(1):26–28.
48. Berens AJ, Hunt JH, Toth AL (2015) Comparative transcriptomics of convergent evo-
lution: Different genes but conserved pathways underlie caste phenotypes across
lineages of eusocial insects. Mol Biol Evol 32(3):690–703.
49. Chen S, Krinsky BH, Long M (2013) New genes as drivers of phenotypic evolution. Nat
Rev Genet 14(9):645–660.
50. Simola DF, et al. (2013) Social insect genomes exhibit dramatic evolution in gene
composition and regulation while preserving regulatory features linked to sociality.
Genome Res 23(8):1235–1247.
51. Wissler L, Gadau J, Simola DF, Helmkampf M, Bornberg-Bauer E (2013) Mechanisms
and dynamics of orphan gene emergence in insect genomes. Genome Biol Evol 5(2):
439–455.
52. Roberts SB, Gavery MR (2012) Is there a relationship between DNA methylation and
phenotypic plasticity in invertebrates? Front Physiol 2:116.
53. Chandrasekaran S, et al. (2011) Behavior-specific changes in transcriptional modules
lead to distinct and predictable neurogenomic states. Proc Natl Acad Sci USA 108(44):
18020–18025.
54. Ometto L, Shoemaker D, Ross KG, Keller L (2011) Evolution of gene expression in fire
ants: The effects of developmental stage, caste, and species. Mol Biol Evol 28(4):
1381–1392.
55. Grozinger CM, Fan Y, Hoover SER, Winston ML (2007) Genome-wide analysis reveals
differences in brain gene expression patterns associated with caste and reproductive
status in honey bees (Apis mellifera). Mol Ecol 16(22):4837–4848.
56. Barchuk AR, et al. (2007) Molecular determinants of caste differentiation in the highly
eusocial honeybee Apis mellifera. BMC Dev Biol 7:70.
57. Ament SA, et al. (2012) New meta-analysis tools reveal common transcriptional reg-
ulatory basis for multiple determinants of behavior. Proc Natl Acad Sci USA 109(26):
E1801–E1810.
58. Smith CR, et al. (2015) How do genomes create novel phenotypes? Insights from the
loss of the worker caste in ant social parasites.Mol Biol Evol, 10.1093/molbev/msv165.
59. Amarasinghe HE, Clayton CI, Mallon EB (2014) Methylation and worker reproduction
in the bumble-bee (Bombus terrestris). Proc Biol Sci 281(1780):20132502.
60. Smith CR, et al. (2012) Patterns of DNA methylation in development, division of labor
and hybridization in an ant with genetic caste determination. PLoS One 7(8):e42433.
61. Shi YY, et al. (2011) Diet and cell size both affect queen-worker differentiation
through DNA methylation in honey bees (Apis mellifera, Apidae). PLoS One 6(4):e18808.
62. Elango N, Hunt BG, Goodisman MA, Yi SV (2009) DNA methylation is widespread and
associated with differential gene expression in castes of the honeybee, Apis mellifera.
Proc Natl Acad Sci USA 106(27):11206–11211.
63. Sumner S, Lucas E, Barker J, Isaac N (2007) Radio-tagging technology reveals extreme
nest-drifting behavior in a eusocial insect. Curr Biol 17(2):140–145.
64. Asher C, Nascimento F, Sumner S, Hughes WOH (2013) Division of Labour and risk
taking in the dinosaur ant, Dinoponera quadriceps (Hymenoptera: Formicidae).
Myrmecol News 18:121–129.
65. Dohm JC, et al. (2014) The genome of the recently domesticated crop plant sugar
beet (Beta vulgaris). Nature 505(7484):546–549.
66. Parra G, et al. (2003) Comparative gene prediction in human and mouse. Genome Res
13(1):108–117.
67. Johnson BR, et al. (2013) Phylogenomics resolves evolutionary relationships among
ants, bees, and wasps. Curr Biol 23(20):2058–2062.
68. Ziller MJ, Hansen KD, Meissner A, Aryee MJ (2015) Coverage recommendations for
methylation analysis by whole-genome bisulfite sequencing. Nat Methods 12(3):
230–232.
69. Hansen KD, Langmead B, Irizarry RA (2012) BSmooth: From whole genome bisulfite
sequencing reads to differentially methylated regions. Genome Biol 13(10):R83.
70. Deaton AM, Bird A (2011) CpG islands and the regulation of transcription. Genes Dev
25(10):1010–1022.
71. Takai D, Jones PA (2003) The CpG island searcher: A newWWW resource. In Silico Biol
3(3):235–240.
72. Long HK, et al. (2013) Epigenetic conservation at gene regulatory elements revealed
by non-methylated DNA profiling in seven vertebrates. eLife 2:e00348.
73. Song J, Rechkoblit O, Bestor TH, Patel DJ (2011) Structure of DNMT1-DNA complex
reveals a role for autoinhibition in maintenance DNA methylation. Science 331(6020):
1036–1040.
74. Bachman M, et al. (2014) 5-Hydroxymethylcytosine is a predominantly stable DNA
modification. Nat Chem 6(12):1049–1055.
75. Djebali S, et al. (2012) Landscape of transcription in human cells.Nature 489(7414):101–108.
76. Liu F, et al. (2012) Next-generation small RNA sequencing for microRNAs profiling in Apis
mellifera: Comparison between nurses and foragers. Insect Mol Biol 21(3):297–303.
77. Tarver JE, Donoghue PCJ, Peterson KJ (2012) Do miRNAs have a deep evolutionary
history? BioEssays 34(10):857–866.
78. Tarver JE, et al. (2013) miRNAs: Small genes with big potential in metazoan phylo-
genetics. Mol Biol Evol 30(11):2369–2382.
79. Taylor RS, Tarver JE, Hiscock SJ, Donoghue PCJ (2014) Evolutionary history of plant
microRNAs. Trends Plant Sci 19(3):175–182.
80. Kurt M, Pickett JMC (2010) Simultaneous analysis and the origin of eusociality in the
Vespidae (Insecta: Hymenoptera). Arthropod Syst Phylogeny 68(1):3–33.
81. Schmidt C (2013) Molecular phylogenetics of ponerine ants (Hymenoptera: Formicidae:
Ponerinae). Zootaxa 3647:201–250.
Patalano et al. PNAS | November 10, 2015 | vol. 112 | no. 45 | 13975
GENETICS
SEECOMMENTARY