modifications to the high-rate trickling filter process units/1970 modifications … ·...
TRANSCRIPT
OFOeUS[£jir\£;is(
Report to
The Commonwealth of Massachusetts
Water Resources Commission
Division of Water Pollution Control
Modifications to High-Rate Trickling Filter Process
October 1970
Research Project 68-1
REPRINTED WITH PERMISSION OF'
METCALF A BODY. INC. ENOINEER8
BOSTON • NEW YORK • PALO ALTO
PUBLICATION No. 6065 =APPROVED BY ALFRED a HOLLAND, PURCHASING AGENT

TABLE OF CONTENTS
Page
LIST OF TABLES iii
LIST OF FIGURES iv
SUMMARY OF CONCLUSIONS S-l
REPORT
CHAPTER 1 - INTRODUCTION 1-1
Trickling Filters 1-1Activated Sludge Process 1-1Second Phase of Study 1-2Laboratory Support 1-2Personnel 1-3Equipment 1-3Duration of Studies 1-3
CHAPTER 2 - TRICKLING FILTER STUDIES 2-1
Preliminary Considerations 2-1Marlborough Trickling Filters 2-1Lime Treatment of Marlborough Trickling Filter Effluent 2-2Pilot Plant Trickling Filters 2-4Lime Treatment of Pilot Plant Trickling Filters 2-6Conclusions 2-10
CHAPTER 3 - PHOSPHORUS REMOVAL 3-1
Lime Treatment of Trickling Filter Effluent 3-1Activated Sludge Process 3-7Sludge Disposal 3-14Conclusions 3-20
M ETC ALF f t E D D V
TABLE OF CONTENTS (Continued)
Page
CHAPTER 4 - NITROGEN REMOVAL 4-1
Removal as Ammonia by Air Stripping 4-1Removal by Nitrification and Denitrification 4-5Conclusions 4-29
ACKNOWLEDGMENTS
APPENDIX A - MARLBOROUGH WASTEWATER TREATMENT A-lPLANT
Wastewater Flows A-3Temperatures A-5Raw Wastewater Characteristics A-5Imhoff Tank A-6Final Sedimentation Tank Effluent A-6Final Lagoon Effluent A-10
u
METCA.LF
LIST OF TABLES
Table Page
1 Summary of Laboratory Filter Leaf Studies 3-19
2 Relative Ratio of Nitrification of Various Temperatures 4-21
A-l Marlborough Sewage Treatment Plant Basic Design Data A-l
A-2 Summary of Variations in Raw Wastcwater Characteristics A-7
ui
M ETC ALT a EDO V
LIST OF FIGURES
Figure
1 View of Laboratory Trailer 1-3
2 Flow Diagram of High-Rate Trickling Filter System 2-1at Marlborough
3 Modified Flow Diagram of Trickling Filter System for 2-2Upgrading Effluent Quality Employing Lime
4 Effluent Quality Versus pH Following Lime Treatment 2-3of Trickling Filter Effluent
5 View of Pilot Rock Trickling Filter 2-5
6 View of Pilot Plastic Trickling Filter 2-5
7 Performance of Pilot and Plant Trickling Filters in 2-7Terms of BOD
8 Performance of Pilot and Plant Trickling Filters in 2-8Terms of Suspended Solids
9 Effluent Quality Versus pH Following Lime Treatment 2-9of Pilot Rock Trickling Filter Effluent
10 Combination Precipitation-Upflow Solids Contact 3-3Clarifier Used for Phosphorus Removal
11 Pilot Plant for Phosphorus Removal With Lime 3-3
12 Lime Requirements Versus pH at Marlborough 3-4
13 Residual Phosphorus Versus pH with Lime Precipitation 3-5
14 Residual Phosphorus Versus Time and pH 3-6
15 View of Activated-Sludge System 3-8
IV
M E T C A L F & EDO V
LIST OF FIGURES (Continued)
Figure Page
16 Modifications of Aeration Tank to Multiple-Pass System 3-9
17 Phosphorus and BOD of Influent to Aeration Tank and 3-11Alum to Inorganic Phosphorus Ratio Employed
18 Activated-Sludge Plant Operational Parameters 3-12
19 Effluent Quality Versus Alum to Inorganic Phosphorus 3-13Ratios
20 Centrifuge Studies on Sludge from Lime Precipitation of 3-15Trickling Filter Effluent
21 Centrifuge Studies on Sludge from Lime Precipitation of 3-16
Trickling Filter Effluent
22 Centrifuge Studies on Sludge from Lime Precipitation of 3-17Trickling Filter Effluent
23 Centrifuge Studies on Waste-Activated Sludge 3-21
24 View of Ammonia Stripping Unit 4-2
25 Effect of Certain Operational Variables upon Ammonia 4-4Stripping Tower Performance
26 Biological Treatment Sequence for Nitrogen Removal 4-6by Nitrification-Denitrification
27 Characteristics of Settled Trickling Filter Effluent 4-7Used to Feed Nitrification System
28 Operational Variables of Importance in Control of 4-9Biological Systems
29 Operational Variables of Importance in Control of 4-10Biological Systems
METC ALF ft £ DO Y
LIST OF FIGURES (Continued)
Figure Page
30 Nitrogenous Compounds in Nitrification System Effluent 4-11
31 Effluent Quality of Nitrification System 4-13
32 Influence of Dissolved Oxygen and Temperature Upon 4-13
Nitrification
33 Laboratory Aeration Unit ' 4-14
34 Effect of Variation in Mixed Liquor Volatile Suspended 4-1 5
Solids
35 Effect of Variation in Ammonia Concentration 4-16
36 Effect of Variation in pH 4-17
37 Percent of Maximum Rate of Nitrification at Constant 4-18Temperature and pH
38 Effect of Variation in Temperature 4-19
39 Rate of Nitrification at all Temperatures Compared to the 4-19
Rate at 30 degrees Centigrade
40 Effect of Variation in BOD 4-20
41 Rate of Nitrification Versus pH at Constant Temperature 4-21
42 Effeet of Temperature on Nitrification as Reported by 4-23
Borchardt
43 Rate of Nitrification Versus Temperature at Various 4-24
pH Levels
44 Upflow Filters Used in the Denitrification Studies 4-24
45 Operational Variables During Denitrification Studies 4-26
VI
M F T C AUF fV t DDY
LIST OF FIGURES (Continued)
Figure Page
46 Quality of Effluent from Devitrification Unit 4-27
47 Quality of Effluent from Denitrification Unit 4-28
48 Performance of Rock Denitrification Unit Versus 4-;H)
Operational Variables
A-l Marlhorough Wastewatcr Treatment Plant A-1
A-2 Plant Flows and Rainfall A-4
A-3 Maximum and Minimum Air and Sewage Temperatures A-5
A-4 Raw Wastewater Characteristics A-6
A-5 Imhoff Tank Effluent Characteristics A-8
A-6 Final Sedimentation Tank Effluent Characteristics A-9
A-7 Final Plant Effluent Characteristics and Performance. A-11
Vll
M FTC ALF f t E D D Y
HAHU1SON P EDDY. JR.
HAHWY L KINSI:LJOHN W R A Y M O N D , JR
.JOHN 5 BETHEL. JH
ANDREW C PATON
ROLF ELIA55EN. Sc D.
DEAN F COBUKN
CHARLES V HITCHCOCK, JR.
ARIEL A THOMAS
i "A 'JCIS A OBV F'T
r :Av r '_> A DUNCAN
RUi.SL.LL C HOLT
MORTON SOLOMON
Cl.AIH N S A W Y E R . Pll P
JOHN POOLER
WOOOHnw V. WIlSflN
',; >' AUL I. "a A " tJ API'
• 1 A ; I. «•, li.i, (,; APP
••iS .Tf'l'.C M L! Si I MCJSTON. NAA
,.A-ji[-<, p; vjpi-.LOM. AIF*
fl'TN ALO r, p*l L
' AMi:s A rif K
WAI.! FH *M<J[JY
I "» TJ ».L '•: I. I'll FH.TN
j . i i i - j L O'Ai_A<;...i ;-•'-,:;•. " !• UL TON
r.':Q<Jf-,J K 1'C.iFB
,:•. '-•*!=. T O ^Cl'JWKi:. Pr- H
W i i I I « " B V A M R I P E H . J «
METCALF & EDDY STATLER BUILDING • BOSTON • MASSACHUSETTS 02116
E N G I N E E R S
CABLE Aonness- 'METEOD
7WX 'ID 3?
November 20,1970
- 0 COBB
i I B FflOl
Commonwealth of MassachusettsDivision of Water Pollution Control100 Cambridge StreetBoston, Massachusetts 02102
Attention: Mr. Thomas C. McMahonDirector, Division of Water Pollution Control
Subject: Research Project 68-1
Gentlemen:
In accordance with the contract agreement between the Common-wealth of Massachusetts, Division of Water Pollution Control and Metcalf &Eddy, Inc. dated June 27, 1968 and August 14, 1969, we have conductedstudies at the Marlborough, Massachusetts wastewater treatment plant upon"Modification to the High-Rate Trickling Filter Process." This reportcontains the results of our studies.
Very truly yours,
METCALF & EDDY, INC.
David A. DuncanVice President
I N V E S T I G A T I O N S • R E P O R T S • D E S I G N S ' A D V I C E D U R I N G C O N S T R U C T I O N * A D V I C E ON O P E R A T I O N
P L A N N I N G • V A L U A T I O N S • L A B O R A T O R I E S * R E S E A R C H

SUMMARY OF CONCLUSION
SUMMARY OF CONCLUSIONS
A summary of the findings and conclusions of the accompanyingtechnical report are summarized herewith for convenience.
1. Rock trickling filters will produce an effluent of about 45 mg/L*BOD** and 55 mg/L suspended solids at loadings of 45 lb BOD/1,000cu ft (cubic feet).
2. Plastic trickling filters will produce an effluent of about 35 mg/L BODand 20 mg/L suspended solids at loadings of 45 lb BOD/1,000 cu ft and45 mg/L BOD at loadings of 70 lb BOD/1,000 cu ft.
3. Lime treatment of rock trickling filter effluent will produce an effluentquality of about 40 mg/L BOD and 20 mg/L suspended solids at a pllof 10.8.
4. Lime treatment will not upgrade trickling filter effluent to produce aneffluent of quality comparable to a well-operated activated-sludge unit.
5. Trickling filters may be considered as an alternate to theactivated-sludge process if the filters are to be used as roughing filters orif the filters are to be followed by certain nutrient removal processes.
6. When trickling filter effluents were treated with lime, the lowestphosphorus concentrations were obtained at pH levels between 9.9 and
11.0.
7. The total phosphorus in the lime-treated effluent at pH 10.8 was lessthan 1.0 mg/L and the inorganic phosphorus concentration was reducedto less than 0.5 mg/L as P.
8. "Luxury uptake" of phosphorus in the activated-sludge process wasnonexistent, and phosphorus removals were about 20 percent when nochemical was used. '
9. Alum was added to the last pass of the aeration tank for optimumphosphorus removal.
*Milligrams per liter.**Biochemical oxygen demand.
S-l
M E T C A U F f t E DO
10. The addition of alum improved the settleability of the mixed liquor andimproved the SVI (sludge volume index).
11. Alum to inorganic phosphorus ratios of 18 to 1 attained an averageeffluent quality of about 10 mg/L BOD, 20 mg/L suspended solids, 1.5mg/L total phosphorus and 1 mg/L inorganic phosphorus.
12. Lime sludge may be dewatcrcd for ultimate disposal or reclamation bythe use of centrifuges.
13. Mixtures of waste-activated sludge containing alum and primary sludgemay be dewatered by vacuum filtration.
14. The, ammonia stripping process is not practical in the colder climatesbecause of temperature limitations. Severe scaling and air pollutionproblems make this process unattractive at any location.
15. Nitrogen removal through the pathway of nitrification-denitrificationseems to offer the most hope at this time.
16. Settled trickling filter effluent, with BOD in the range of 20 to 70mg/L, proved to be a satisfactory feed for the nitrification unit.
17. The nitrification unit produced an effluent with an average of 10 mg/LBOD, and 30 mg/L suspended solids. Ammonia nitrogen was normallyless than 0.3 mg/L.
18. Factors which affect the time to attain complete nitrification are feedammonia concentration, pH, temperature, and MLVSS (mixed liquorvolatile suspended solids) concentration.
19. The ammonia concentration did not inhibit nitrification inconcentrations of less than 60 mg/L.
20. pH did affect the rate of nitrification. Optimum pH was found to be8.4.
21. Temperature did affect the rate of nitrification. The rate increasedthrough the range of 5 deg C to 30 deg C, in reasonable agreement withthe van't Hoff-Arrhenius law.
S-2
22. The time required for nitrification is directly proportional to ihcamount of nitrifiers present in the system.
23. Instantaneous increases in BOD concentration from 5 to 1 10 mg/L didnot affect the rate of nitrification. However, it would be expected thata change in the average BOD concentration of the feed would affectthat percentage of MLVSS which is composed of nitrifiers, and as aresult would affect the time to achieve complete ni t r i f icat ion.
24. Complete nitrification can be obtained in 1.8 hours contact with uMLVSS of 1,450 mg/L, average BOD feed of 50 mg/L, pll of H.4, 20dcg C temperature, and an ammonia feed concentration of 20 mg/L. If
the temperature were reduced to 10 deg C and the pll reduced lo 7.0,the required time would increase to 9.45 hours.
25. Upflow contact units, both rock and plastic, were found lo beunreliable dcnitrificatum systems.
i26. In general, more work needs to be performed on the factors of
denitrification and the control of the methanol feed.
S-3
M FT C A L F f l . F D D V

REPORT
CHAPTER 1
INTRODUCTION
Trickling Filters
One of the common methods of wastcwater treatment employed over
the course of the years, particularly in the smaller cities and towns, has been
to employ trickling filter systems using native rock as the contact material.
As a result, a considerable capital investment has been made on the part of
the communities involved. In Massachusetts alone, there are over 30 tricklingfilter installations, and prospects are that more will be built if sufficient
evidence can be accumulated to demonstrate that they arc compatible withprojected requirements for additional higher degrees of treatment for a
reasonable number of years in the future.
Although trickling filters have been known as the "work horses" of the
treatment field, they fiave been shown to suffer from low temperatures innorthern climates. As a result, although performance may be acceptableduring the summer and fall, they may fail to meet the desired standards
during the winter and spring when wastewater temperatures are lowest. Inaddition, trickling filters may not offer an opportunity for simple cationic
removal of phosphorus such as the activated-sludge process does.
Because of the great investment in trickling filter systems in
Massachusetts and in the nation, the growing need for higher qualityeffluents, and a need for algae nutrient (nitrogen and phosphorus) removal in
many locations, it was conceived that the quality of trickling filter effluentsmight be upgraded to a satisfactory level by treatment of filter effluent withlime prior to final settling. Hopefully, such treatment would yield effluentswith acceptable levels of BOD, suspended solids, and phosphorus withnominal additional capital costs. Furthermore, it was argued that limetreatment would raise the pli of the wastewater to a level where ammonianitrogen could be removed by air stripping, if desired. The primary purposeof the investigations was to study these possibilities. Marlborough,Massachusetts was selected as the site because of location, facilities, andneed.
Activated Sludge Process
Because of the many contingencies involved in the trickling filter
studies relative to their outcome and a considered need for information
1-1
M ETC ALF R- E D D Y
about nutrient removal, both nitrogen and phosphorus, it was deemedadvisable to conduct investigations, in parallel, on an alternative method ofwastewater treatment. The activated-sludge process offered the greatestpotential, so it was chosen as the competetive process. During the first year,phosphorus removal was incorporated as an integral part of the process sothat direct comparison could be made with the trickling filter—limeprecipitation system.
Second Phase of Study
At the close of the first year of investigations, it became quiteapparent that a rather drastic realignment of the studies should be made toobtain specific answers to problems at Marlborough which would havestatewide application, as well as to further define the future role of tricklingfilters.
The results of the first year clearly demonstrated that trickling filterperformance at Marlborough was abnormal. Since it was not clear whetherthis condition was due to a deficiency of the filters or to some otherabnormality, a decision was made to construct a new pilot rock filter toprovide trickling filter effluent for all nutrient removal studies. Since thequestion of whether to use rock or plastic media in the filter presented itself,a decision was made to construct both types and operate them in parallel.
Because of problems encountered in stripping ammonia fromlime-treated wastes, a decision was made to explore nitrogen removal via thenitrification—denitrification route. Since such a system was being studied inat least two other locations in the United States following activated-sludgetreatment, we chose to conduct similar studies employing the effluent fromthe trickling filter system as feed to the nitrification unit.
Laboratory Support
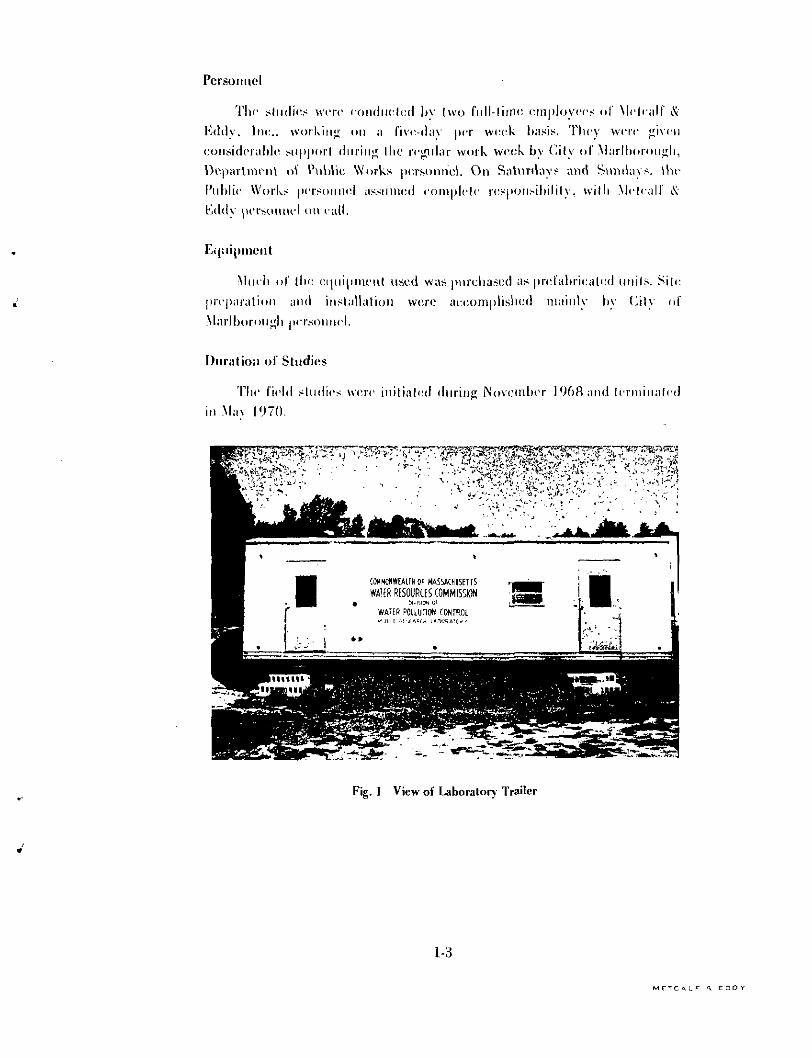
Essentially all analytical testing required for the investigations wasconducted in a mobile laboratory (Figure 1) stationed at Marlborough.
The analytical procedures used were in accordance with StandardMethods,* except in a few instances where changes were made to improvethe sensitivity of the tests or to reduce time requirements. All BOD testswere run employing a 7-day incubation period to equalize the daily workload and to eliminate the need for Saturday and Sunday attention.
^Standard Methods for the Examination of Water and Wastewater, 12thEdition, 1965.
1-2
Personnel
The studies were conducted by I wo full-lime employees of \ lelealf &
1'vddy. Inc., working on a five-day per week basis. Tlicy were ^iven
considerable support during Ihc rej^dar work week by City of \larlhorou<jh,
DiVjiarlrnrnl oi Pulilit; Works pr,rsonn'el. On S;it\)rd;iys and Sund;iys. |hr
Public Works personnel iissinned eomplcle responsibility, w i th Mclrjill' ^
tJddy pei'soiuu-l tin cull.
Mueli of ibe ei[ui(iiuen( used was purchased as pn^'aln'iiuiled units. Site
preparation and installation were accomplished mainly by Lily of
personnel.
Duration of Studies
The field studies were initialed durinp; November I 968 and terminated
in Mav 1970.
COMHOHWEAITH OF HAS5ACHDSETIS
WATER RESOURCES COMMISSION
Fig. ] View of Laboratory Trailer
1-3
M T T C * L F n , E D D Y
CHAPTER 2
TRICKLING FILTER STUDIES
Preliminary Considerations
The major purpose of the trickling filter studies was to determine
whether the quality of the effluent could be upgraded to a degree
comparable to that expected from activated-sludge treatment plants, under
both summer and winter conditions.
Preliminary studies conducted by Metealf & Eddy, Inc., for the City of
Marlborough during the summer of 1967 had demonstrated that finaleffluent quality could be markedly improved by coagulation of the TFE(trickling filter effluent) with alum or lime prior to final settling. Suchtreatment also removed a large part of the phosphorus, an important
consideration at Marlborough because of the ponds downstream throughwhich the effluent flows on its way to the Sudbury River. Since there was
reason to believe that nitrogen removal might also be needed atMarlborough, a decision was made to investigate the use of lime for
coagulation of the TFE because it could raise the pH sufficiently to allow
removal of ammonia nitrogen by air stripping, in addition to phosphorus
removal by precipitation.
Marlborough Trickling Filters
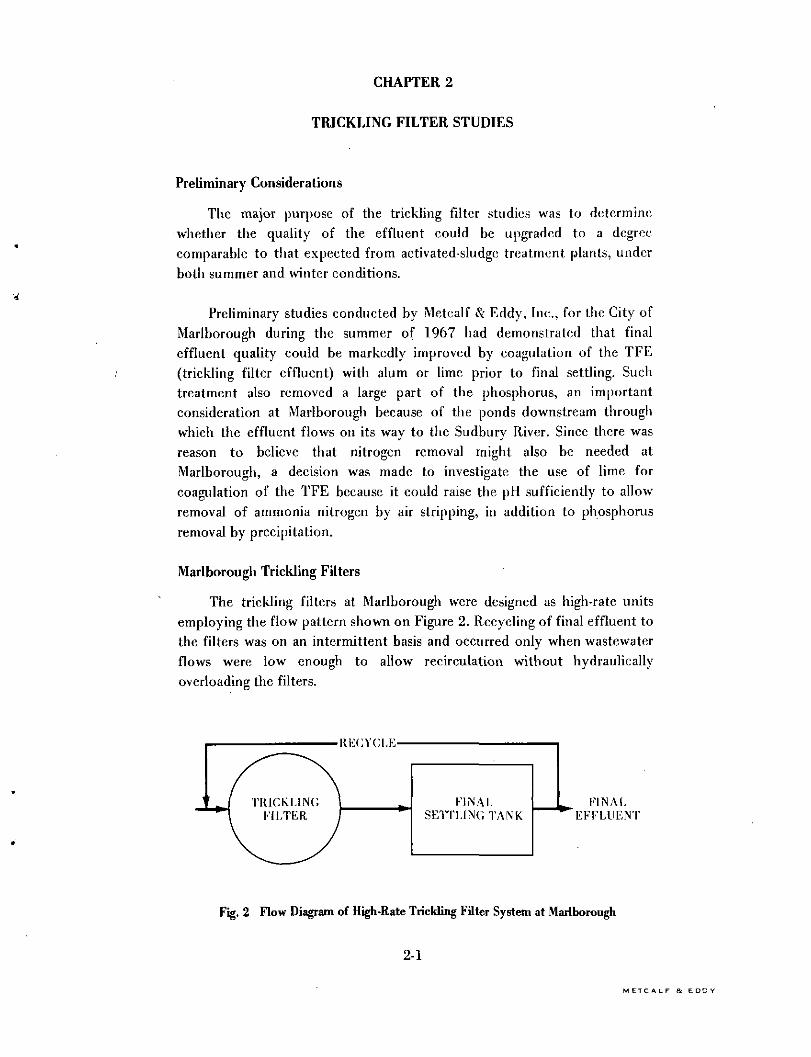
The trickling filters at Marlborough were designed as high-rate units
employing the flow pattern shown on Figure 2. Recycling of final effluent to
the filters was on an intermittent basis and occurred only when wastewaterflows were low enough to allow recirculation without hydraulically
overloading the filters.
' I TRICKLING \\ KILTER /
K 1 N A LSETTLING T A N K
^^*^m KIN At,'EFFLUENT
Fig. 2 Flow Diagram of High-Rate Trickling Filter System at Marlborough
2-1
M ETC A L F » E DD Y
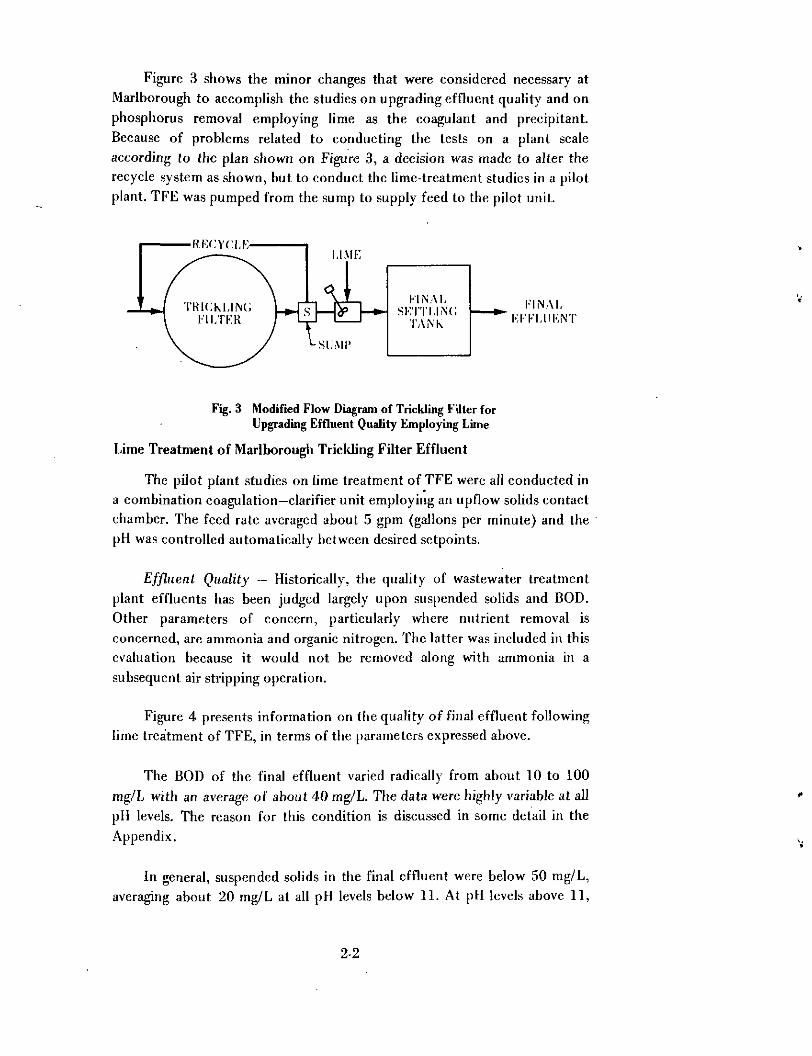
Figure 3 shows the minor changes that were considered necessary atMarlborough to accomplish the studies on upgrading effluent quality and on
phosphorus removal employing lime as the coagulant and precipitant.Because of problems related to conducting the tests on a plant scale
according to the plan shown on Figure 3, a decision was made to alter therecycle system as shown, but to conduct the lime-treatment studies in a pilot
plant. TFE was pumped from the sump to supply feed to the pilot unit.
• R E C Y C L E
l - I N A l ,T L U K N '
Fig. 3 Modified Flow Diagram of Trickling Filter forUpgrading Effluent Quality Employing Lime
Lime Treatment of Marlborough Trickling Filter Effluent
The pilot plant studies on lime treatment of TFE were all conducted ina combination coagulation—clarifier unit employing an upflow solids contact
chamber. The feed rate averaged about 5 gpm (gallons per minute) and thepH was controlled automatically between desired sctpoints.
Effluent Quality — Historically, the quality of wastewater treatment
plant effluents lias been judged largely upon suspended solids and BOD.Other parameters of concern, particularly where nutrient removal isconcerned, are ammonia and organic nitrogen. The latter was included in thisevaluation because it would not be removed along with ammonia in a
subsequent air stripping operation.
Figure 4 presents information on the quality of final effluent followinglime treatment of TFE, in terms of the parameters expressed above.
The BOD of the final effluent varied radically from about 10 to 100
mg/L with an average of about 40 mg/L. The data were highly variable at allpH levels. The reason for this condition is discussed in some detail in the
Appendix.
In general, suspended solids in the final effluent were below 50 mg/L,averaging about 20 mg/L at all pH levels below 11. At pll levels above 11,
2-2

PR1C1PITAT10H EFF. - PH PR1C1PITAT1QN EFF. - PH
! i
..u.I I
PR1CIP1TATION EFF. - PH
Fig. 4 Effluent Quality Versus pll
Following Lime Treatment of Trickling Filler Effluent
2-3
M ETC A L F ft E DD Y
results were highly erratic with values ranging up to 200+ mg/L. The highsuspended solids at pH 11 and above were primarily due to loss of flocculantmagnesium hydroxide and some magnesium ammonium phosphate.
The organic nitrogen content of the final effluent following limetreatment was found to vary radically at all pH levels, with some indicationof improvement as pH increased. This parameter was, undoubtedly, closelyassociated with BOD and responds to the same conditions.
Summary — In general, the suspended solids content of the lime-treatedeffluent was at acceptable levels at all pH values below 11. However, bothBOD and organic nitrogen were about twice as great, on an average, as thoseexpected in a good quality activated sludge effluent.
Because of unusual circumstances at the Marlborough wastewatertreatment plant with respect to wastewater flows, low temperatures, andcondition of the trickling filters, it seemed unwise to condemn all tricklingfilter treatment plants as being unable to meet modern standards oftreatment. On the assumption that a major part of the problem was relatedto the condition of the existing filters following 22 years of service, adecision was made to conduct further studies employing pilot filters.
Pilot Plant Trickling Filters
When it became apparent that further investigations on trickling filtersat Marlborough should be conducted on a pilot plant scale, a decision wasmade to construct rock and plastic media filters which would be operated inparallel.
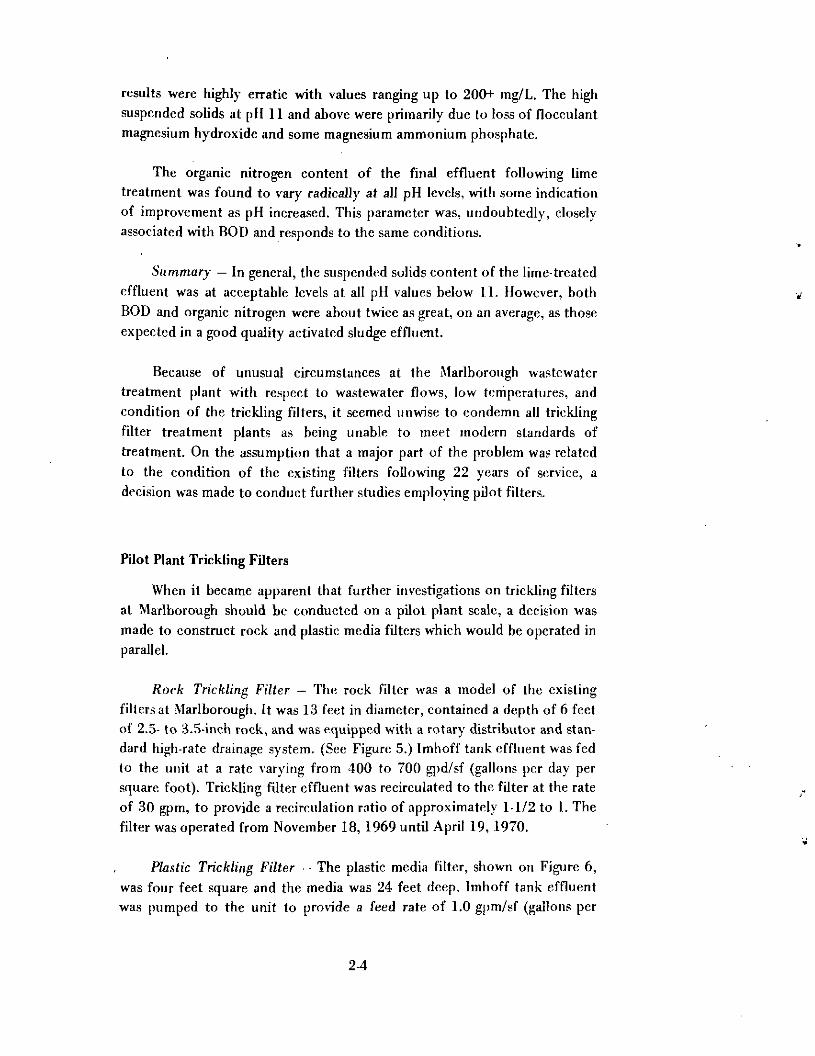
Rock Trickling Filter — The rock filter was a model of the existing
filters at Marlborough. It was 13 feet in diameter, contained a depth of 6 feetof 2.5- to 3.5-incK rock, and was equipped with a rotary distributor and stan-dard high-rate drainage system. (See Figure 5.) Imhoff tank effluent was fedto the unit at a rate varying from 400 to 700 gpd/sf (gallons per day persquare foot). Trickling filter effluent was recirculated to the filter at the rateof 30 gpm, to provide a recircnlation ratio of approximately 1-1/2 to 1. Thefilter was operated from November 18, 1969 until April 19, 1970.
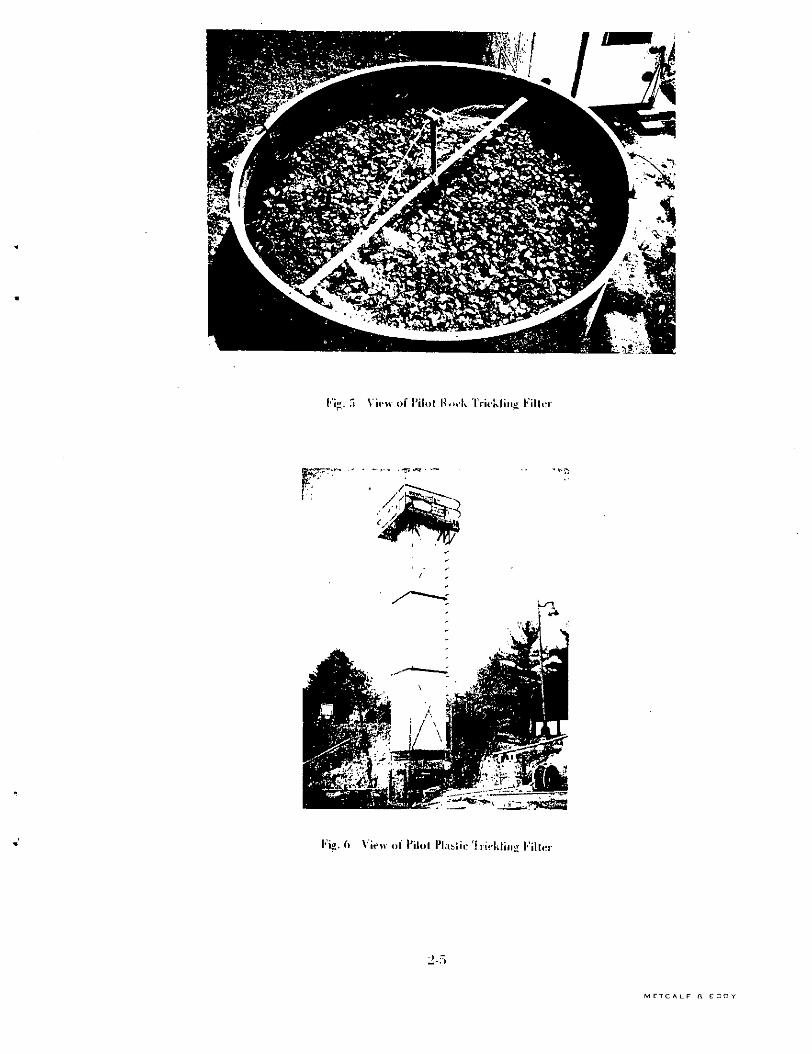
Plastic Trickling Filter — The plastic media filter, shown on Figure 6,
was four feet square and the media was 24 feet deep, Imhoff tank effluentwas pumped to the unit to provide a feed rate of 1.0 gpm/sf (gallons per
2-4
l''i» 5 View of I'ilol Ho»-k Trickling Filler
Kip. 6 View ol' I'ilol Plastic'! rirkling Killer
M CTC ALF n e r o n v
minute per square foot). No recirculation was used. The filter was operatedfrom October 13, 1969 until April 16, 1970.
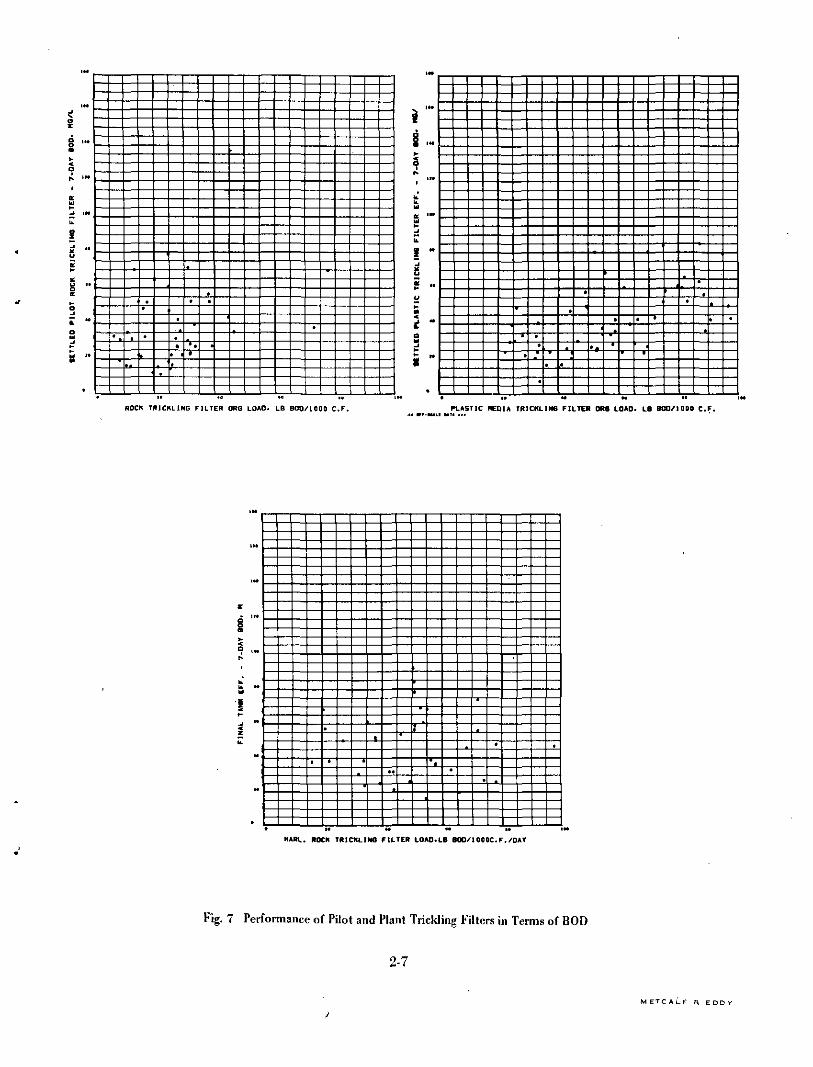
Effluent Quality — A comparison of the performance of the pilot rockand plastic filters and the main plant filter in terms of BOD remaining aftersettling is shown on Figure 7. These data show that the quality of theeffluent from the pilot rock filter was somewhat poorer than that from theplastic filter which operated at considerably greater BOD loadings. In therange of 20- to 40-pound loadings the plastic filter gave far superior results.The main plant filter, although operating under unsteady state hydraulicloadings, gave nearly as good results as the pilot filters operating understeady state conditions, indicating that the main plant filters were not in asbad a condition as originally assumed.
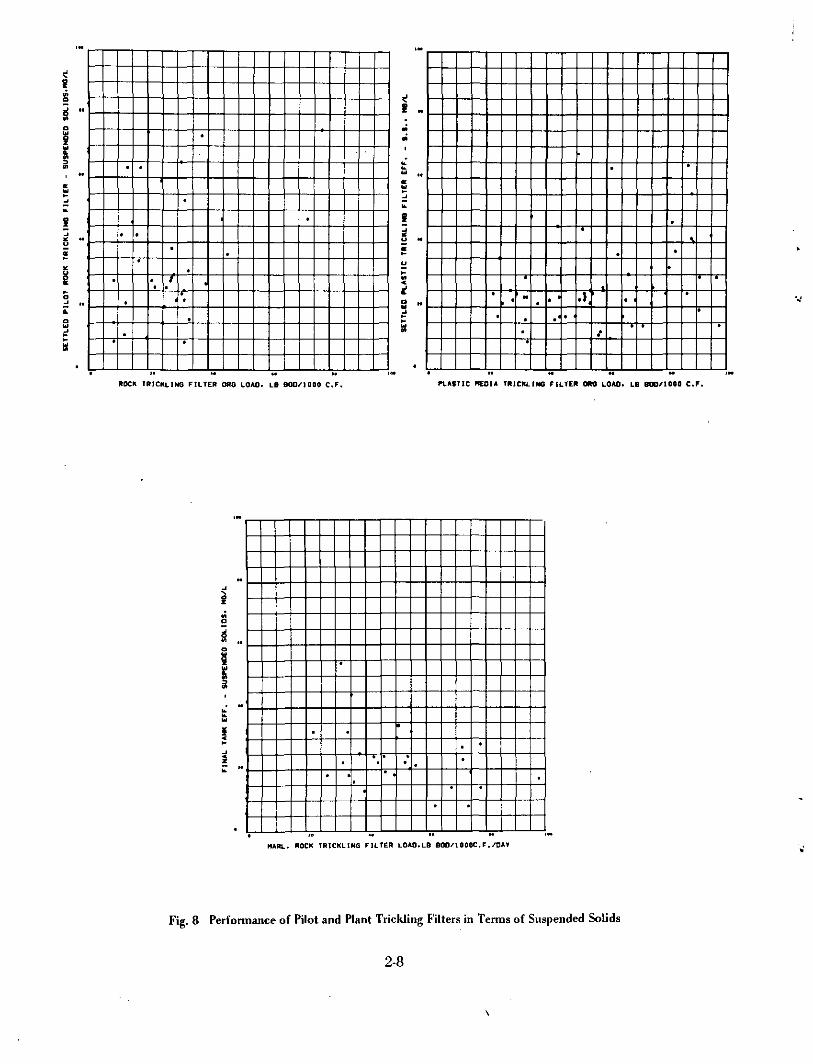
Figure 8 presents data on the suspended solids content of settledeffluents from the pilot and plant filters. The quality of all effluents, interms of this parameter, was extremely erratic, especially that from the pilotrock filter. In the case of the plant filter, there appeared to be improvedquality as the BOD loading increased; however, the deterioration of qualitywas due to the high flows which hydraulically overloaded the settling tanksat low BOD loadings. With the plastic pilot filter there was a definitedeterioration as BOD loadings exceeded 80 Ib BOD/1,000 cu ft.
Summary — All data shown on Figures 7 and 8 were obtained duringthe period of November 1969 through April 1970 and, therefore, are typicalof winter operation. From the data, it seems reasonable to conclude thatoperation of high-rate rock filters, under winter conditions, at BOD loadingsup to 40 lb/1,000 cu ft will result in effluents with BOD and suspendedsolids averaging about 40 mg/L and that operation of plastic filters undersimilar conditions, at BOD loadings up to 60 lb/1,000 cu ft will result ineffluents averaging 30 and 20 mg/L of BOD and suspended solids,respectively. Thus, it appears that plastic filters will produce higher qualityeffluents than rock filters at comparable loadings and comparable results at
somewhat higher loadings.
Lime Treatment of Pilot Trickling Filter Effluent
From November 16, 1969 through January 26, 1970, the pilot rockTFE was used as feed stock to the lime precipitation unit. The feed rateaveraged about 8 gpm and the pH was controlled automatically between
desired setpoints.
2-6
ROCK TRICKLING FILTER OR6 LOAD. LB BOO/1000 C.F. PLASTIC MEDIA TRICKLING FILTER ORS LOAD. LB BOO/1000 C.F.
HAJH.. ROCK TRICKLINO FILTER LOAD.LB BOD/1000C.F./DAT
Fig. 7 Performance of Pilot and Plant Trickling Filters in Terms of BOD
2-7
M E T C A L F a, E D D Y
.1.
ROCK TRICKLING FILTER WWJ LOAD. LB BOD/1000 C.F. fiA*Tic MEDIA TRICKLING FILTER ORO LOAD. LB BOO/IOOO C.F.
HARL. ROCK TRICKLING FILTER LOAO.LB BOD/lOOOC.F. /DAY
Fig. 8 Performance of Pilot and Plant Trickling Filters in Terms of Suspended Solids
2-8
i"o3
i ,-
PRICIP1TATION CFF. - PH PR|C1P1TATION EFF. - PV
PRICIPITATION EFF. - PH
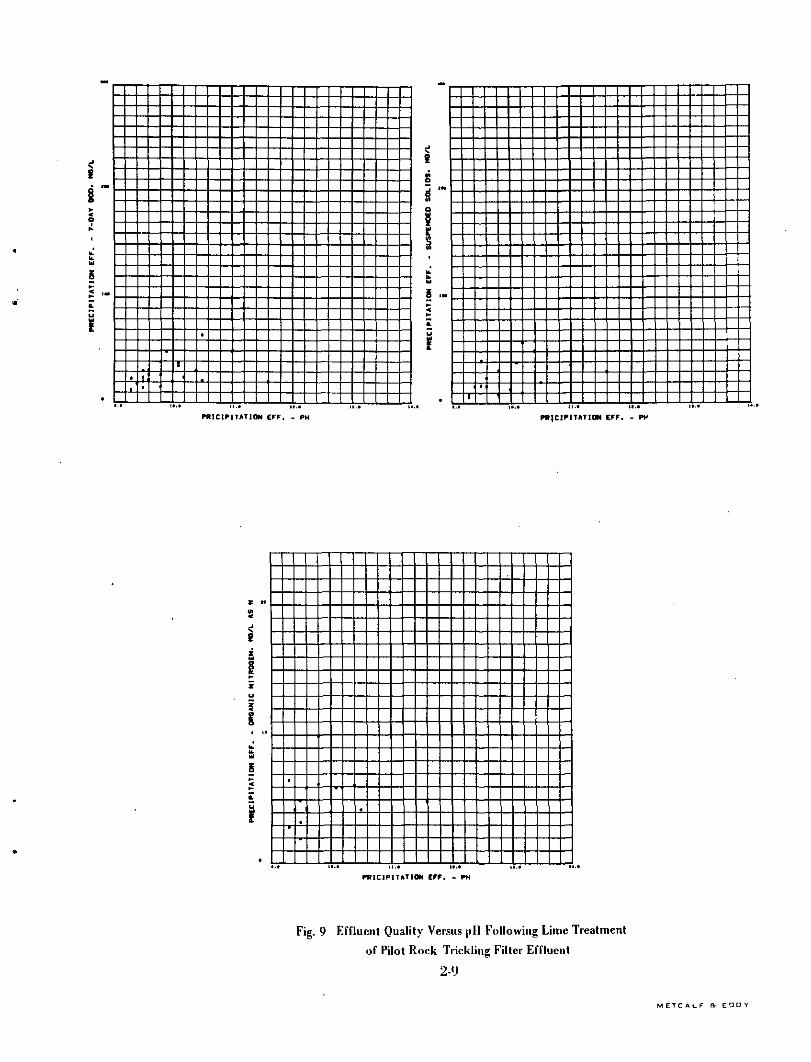
Fig. 9 Effluent Qual'1)' Versus (iH Following Lime Treatment
of Pilot Rock Trickling Filter Effluent
2-9
M ETC ftt-F (V E D D Y
Effluent Quality — The effluent quality in terms of BOD, suspendedsolids, and organic nitrogen, following lime treatment, is presented as Figure9. Unfortunately, a majority of the data were obtained at pH values less than10. The indications are that the rock filter effluent can be improved to theextent that its BOD and suspended solids would be reduced to the range of25-30 mg/L. Organic nitrogen residuals in the lime-treated effluent werehighly variable, averaging about 5 mg/L.
Summary — In general, the suspended solids content of the lime-treatedeffluent was at acceptable levels at all pH values below 11. However, bothBOD and organic nitrogen were about twice as great, on the average, aswould be expected in a good quality activated-sludge effluent.
Conclusions
A comparison of the data on Figure 9 with those on Figure 4 shows nooutstanding differences in quality between the lime-treated effluents of thepilot rock and plant filters. There was somewhat less variation in BOD whentreating the pilot TFE because the pilot unit was operated under steady-statehydraulic conditions while the plant filter was subject to normal diurnal andwet-weather flow variations.
It may be concluded on the basis of these investigations that limetreatment of TFE will improve the quality of the effluent, but it can beexpected that residual BOD and suspended solids will average about 40 and20 mg/L, respectively.
Because of the increasing stringency of standards imposed upon thedischarge from waste treatment facilities, the question of the adequacy oftrickling filters to meet these standards must be answered. It must beconcluded from these studies, that the effluent from trickling filters is oflesser quality than that from the activated-sludge process and that theeffluent quality deteriorates as the temperature decreases. While these twofactors do not necessarily eliminate trickling filters from furtherconsideration as treatment processes, they do place serious limitations upontheir use. The trickling filter should continue to be considered as an alternateto the activated-sludge process in situations where the filter will be used as aroughing filter, or where the filter will be followed by certain nutrientremoval processes capable of improving effluent quality to levels expectedwhen treating activated-sludge effluents.
2-10
CHAPTER 3
PHOSPHORUS REMOVAL
Removal of phosphorus (inorganic and organic phosphates) from
domestic and some industrial wastewaters is considered mandatory in all
situations where drainage is to lakes and reservoirs, because of its allegedeffect on stimulating eutrophication of such bodies of water. Theimportance of this subject is attested to by the pressure currently being
exerted upon the manufacturers of synthetic detergents to eliminatephosphates from their products and edicts advanced to accomplish at least80 percent removal of phosphorus from all wastewaters discharged to the
Great Lakes.
Because of the particular location of the Marlborough Easterlywastewater treatment plant, phosphorus removal was considered a necessityand, because of the considerable existing investment in trickling filters,special attention was given to treatment of their effluent for the reasonsexpressed in Chapter 1.
The activated-sludge process is a competitive biological treatmentprocess that is easily adapted to phosphorus removal through cationicprecipitation of phosphates. Since it seemed a likely substitute orsupplementary process for the trickling filter system, studies employing it
were also conducted in a pilot plant.
Lime Treatment of Trickling Filter Effluents
The investigations on phosphorus removal from TFE were initiatedduring January 1969 and continued through January 1970. All studies wereconducted upon unsettled TFE for reasons previously expressed. The TFEfrom the existing plant was used from January 1969 until October 1969.From the latter date to February 1970, TFE from the pilot rock filter,wasused as feed to the phosphorus removal unit.
Operation of the plant trickling filter was as described in the Appendix
and the pilot units were run as described in Chapter 2.
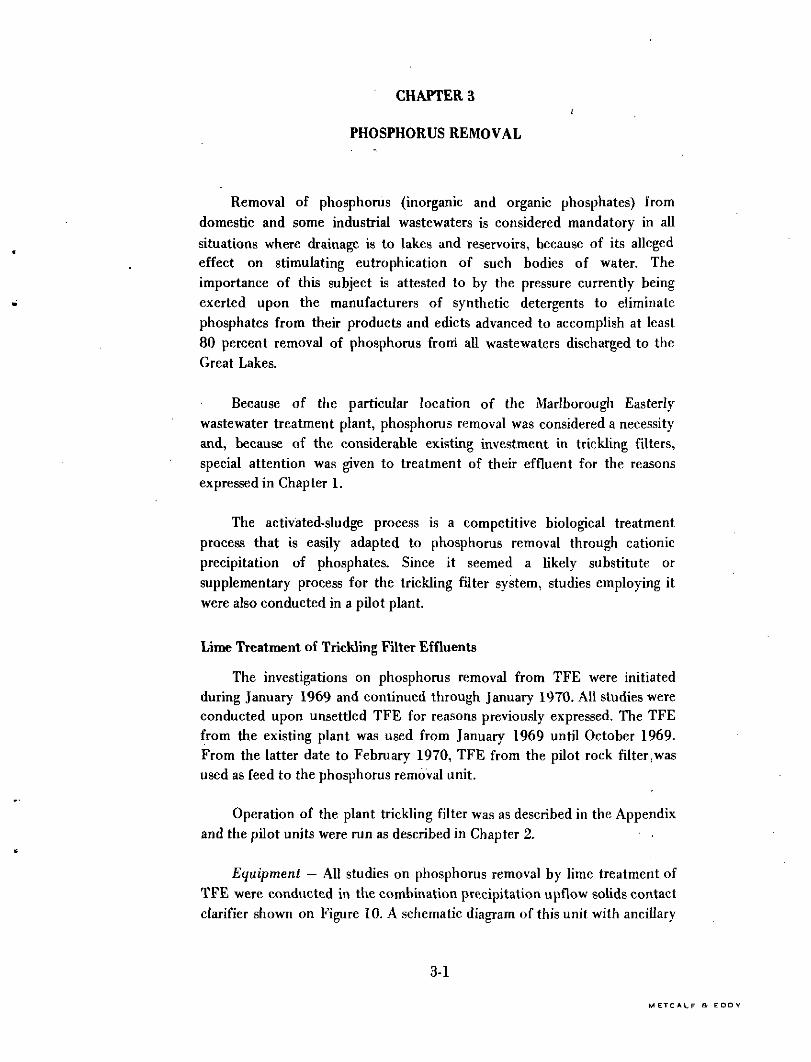
Equipment — All studies on phosphorus removal by lime treatment ofTFE were conducted in the combination precipitation upflow solids contactclarifier shown on Figure 10. A schematic diagram of this unit with ancillary
3-1
M E T C A L F

pH and lime feeding equipment necessary for continuous operation atdesired pH levels is presented as Figure 11.
TFE was fed to the phosphorus removal unit at a normal rate of 6 gpm.Lime additions were paced by an automatic pH controller to maintain thedesired pH in the mixing and coagulation zone. Since there was normally asignificant change in pH through the system, a second pH recorder wasinstalled on the effluent line to maintain a record of effluent quality forsubsequent studies on nitrogen removal.
Phosphorus Removal — Although a considerable fund of informationexisted in the literature concerning lime requirements in terms of wastewateralkalinity versus pH and phosphorus residuals 'versus pH, the studies atMarlborough were designed to explore the efficacy of lime treatment over arelatively wide range of pH values. This was done by attempting to hold thepH in the coagulation-mixing zone within a relatively narrow pH range forseveral consecutive days before making changes. A major reason for studyingpH effects over a rather wide range was related to the fact that the effluentfrom the phosphorus removal unit served as feed for the ammonia strippingunit, on which it was desirable to vary the pH over a relatively wide range.
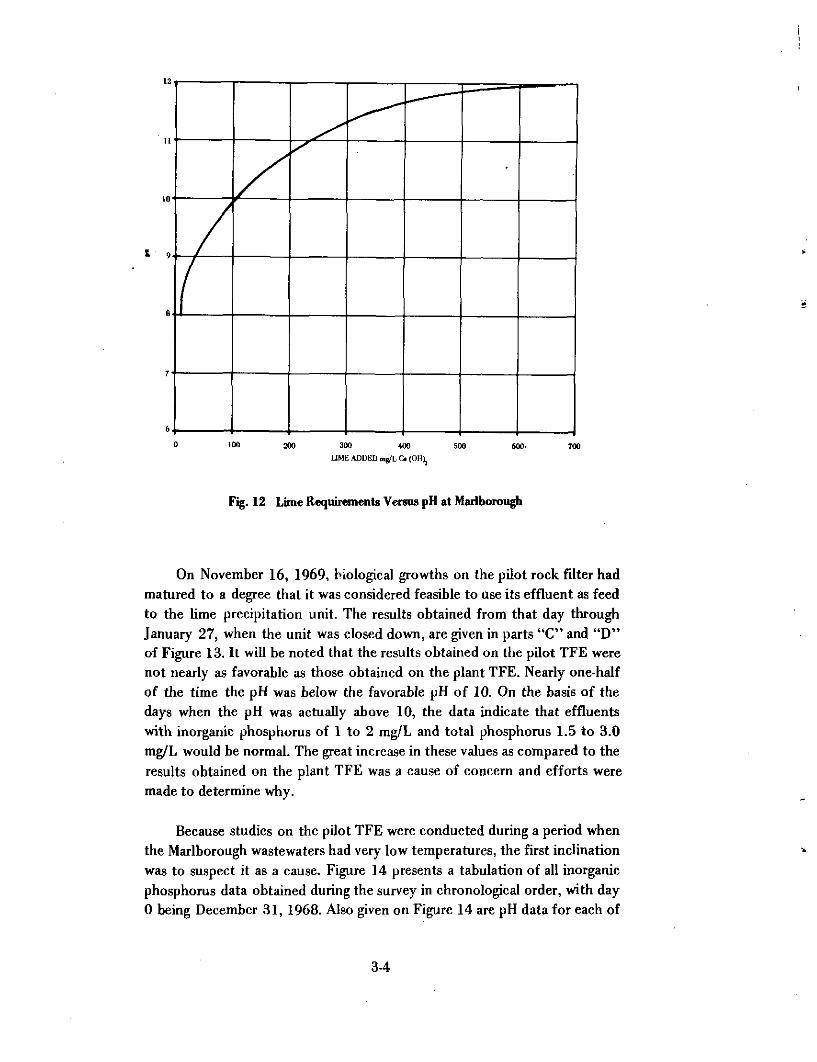
The amount of lime required to reach any desired pH level was foundto be related to the alkalinity of the wastewater as has been reported byother investigators. Figure 12 shows the amount of lime required to obtainvarious pH levels in Marlborough wastewater under dry-weather conditions.
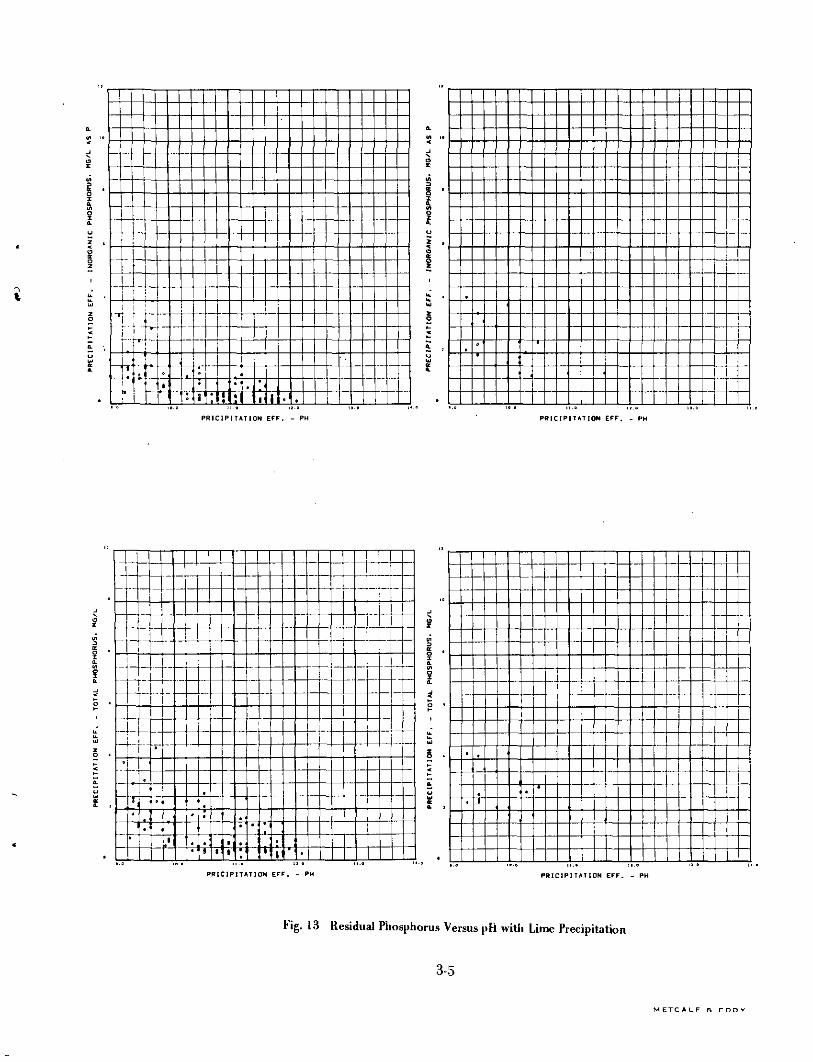
Data showing residual phosphorus levels obtained during the course ofthe Marlborough studies are presented on Figure 13. Parts "A" and "B" ofthis figure show results obtained during the first 300 days, while TFE fromthe main plant was used to feed the lime precipitation unit. The dataindicate that the best phosphorus removals, both inorganic and total, wereobtained at pH levels between 9.9 and 11.0. The somewhat poorer qualityeffluent produced at pH levels between 11 and 12 was believed to be due tothe higher suspended solids in the effluent caused by the formation offlocculant magnesium hydroxide and possibly magnesium ammoniumphosphate, as noted in Chapter 2.
From the data obtained on the main plant TFE it seemed reasonable toconclude that lime treatment at pH levels between 10 and 11 wouldnormally ensure the production of effluents with less than 0.5 mg/L ofinorganic phosphorus and less than 1.0 mg/L of total phosphorus withoutfiltration.
3-2
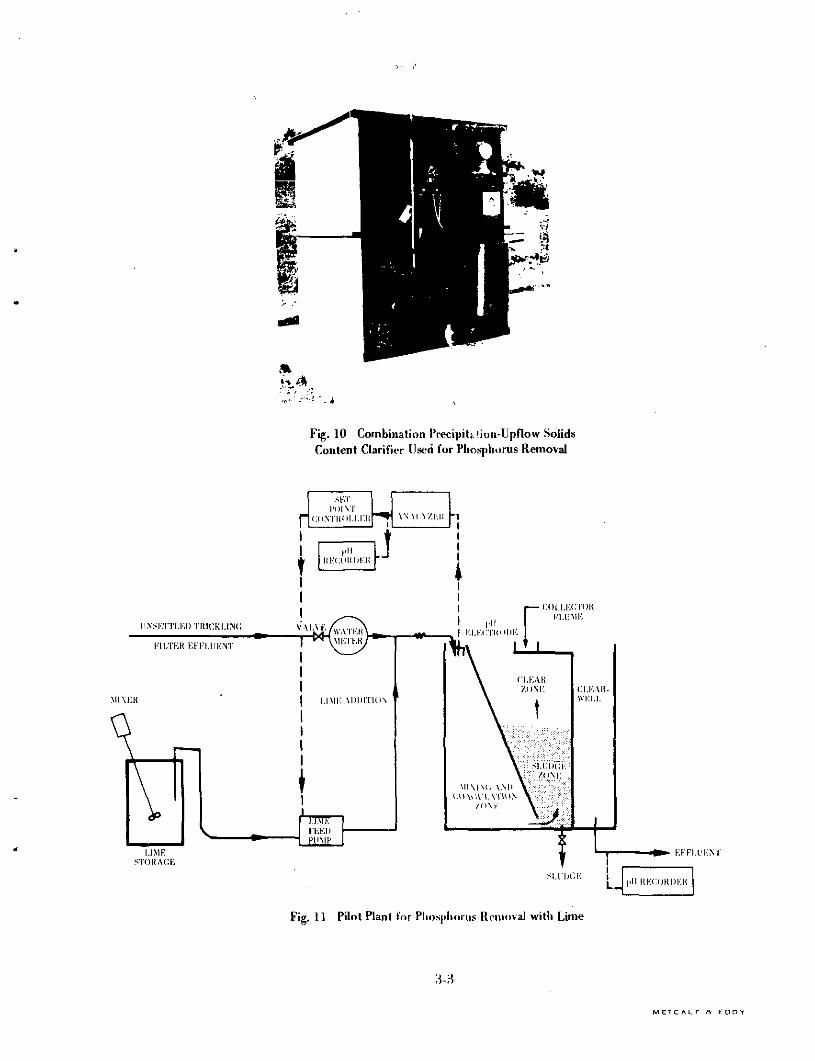
Fig. 10 Combination Precipilj.!ion-Upflow SolidsContent Clarifier Used for Phosphorus Removal
1,1 MKSTORACE
EKFU'KNT
Fig. 11 Pilot Plant for Phosphorus Removal with Lime
3-3
M E T C A L F f l . E D D Y
300 400 500
LIME ADDED mg/L C. (OH^
600. 700
Fig. 12 Lime Requirements Versus pH at Marlborough
On November 16, 1969, biological growths on the pilot rock filter hadmatured to a degree that it was considered feasible to use its effluent as feedto the lime precipitation unit. The results obtained from that day throughJanuary 27, when the unit was closed down, are given in parts "C" and "D"of Figure 13. It will be noted that the results obtained on the pilot TFE werenot nearly as favorable as those obtained on the plant TFE. Nearly one-halfof the time the pH was below the favorable pH of 10. On the basis of thedays when the pH was actually above 10, the data indicate that effluentswith inorganic phosphorus of 1 to 2 mg/L and total phosphorus 1.5 to 3.0mg/L would be normal. The great increase in these values as compared to theresults obtained on the plant TFE was a cause of concern and efforts weremade to determine why.
Because studies on the pilot TFE were conducted during a period whenthe Marlborough wastewaters had very low temperatures, the first inclinationwas to suspect it as a cause. Figure 14 presents a tabulation of all inorganicphosphorus data obtained during the survey in chronological order, with day0 being December 31, 1968. Also given on Figure 14 are pH data for each of
3-4
PRIC1PITHTION EFF. - PH PRICIP1TATION EFF. - PH
-J-U
PR1C1P1TAT1ON EFF. - PH PHICIPITAI10M EFF. - PH
Fig. 13 Residual Phosphorus Versus pH with Lime Precipitation
3-5
M ETC ALF f t E D D V

the days on which residual phosphorus was measured. Inspection of the datawill show that several days of operation at pH levels of 10 or above occurredduring both the winter of 1969 and of 1970. In 1969, many values ofinorganic phosphorus below 0.5 mg/L were observed-, in 1970, none.Obviously, the reason for the discrepancy was not low winter temperatures.
PR
EC
IPIT
AT
ION
UN
IT E
FF.
P =
rll
I =
IN
OR
G.
PH
OS
PH
OR
US
, M
G/L
AS
P
O
K3
*.
O
CO
O
to
4i
^
— rig— WIH
J
1
1
11
•
*
iC
1
1
TER
P
>
(
;,
p
1
*'
JC
i'V
•SP
*
JV
('•
1
R1N
p»
P
H
i
» '?!
G-
i• V 1
M
»
LAN
iM
J
*P
1
',,'
*'
'
'I
M
rs
p*.ri
'i'V
JHH
Mw
1
i 'V
;R-
•>
p
p
1
v'1
iK
•
ir'.i
p»
,
1
j
•AL
i
»
'
,<.!> 1
,
~-L^
r
,
*iii
ILO
I
,'
970NTt
»
»pp i.»\
>
i
'
i
R-
*P
t
i.
) |00 200 HOO 400 500
TIME, DAY OF YEAR (DAY 1 = 1/1/69 DAY 500- 3/15/70)
Fig. 14 Residual Phosphorus versus Time and
Further investigation has disclosed that when the change was madefrom using plant TFE to pilot TFE, a change in hydraulic regime occurred.Under the new conditions, a greater flow of TFE was fed to the precipitationunit. The poorer results obtained during the winter of 1970, therefore, arebelieved to have been caused by this hydraulic overload. It must beconcluded, therefore, that production of effluents with low phosphoruslevels of less than 1 mg/L will require that close attention be given to
hydraulic loadings on clarifiers.
3-6

Summary — In general, the best quality effluent in terms of phosphorus
occurs at pH levels between 9.9 and 11.0. This would ensure the productionof effluents with less than 0.5 mg/L of inorganic phosphorus and less than1.0 mg/L total phosphorus. In order to further insure this quality effluent,close attention must be given to the hydraulics of the clarifiers.
Activated-Sludge Process
Although several reports have been made indicating that the
activated-sludge process is capable of high removals of phosphorus through
"luxury uptake," if proper dissolved oxygen conditions are maintained,
subsequent studies have shown that "luxury uptake" does not occur at all
locations, and that where it does occur it is due primarily to cationicprecipitation of phosphates. During the course of the studies at Marlborough
several opportunities developed for determination of "luxury uptake" when
freezing conditions prevented the addition of chemicals. Under suchconditions and, in the presence of high dissolved oxygon levels, phosphorusremovals averaged about 20 percent.
Because of the many reports in the literature indicating that high
removals of phosphorus could be reliably obtained in the activated-sludgesystem of wastewater treatment by the judicious addition of aluminum orferric salts, a decision was made to investigate this method of treatment as a
comparison to the trickling filter system.
Equipment — The package-type activated-sludge plant shown on Figure15 was installed at Marlborough in a location selected to facilitate use of
Imhoff tank effluent as feed. The unit was selected from a considerablenumber of manufacturers' products because it included a circular clarifier
with mechanical sludge scrapers to deliver sludge to an air-lift sludge return
line. As received, the unit had a single aeration tank designed to operate onthe completely mixed principle. Since most large municipal plants have beendesigned to operate as multiple-pass systems, the aeration tank was modifiedin a manner, as shown on Figure 16, to allow operation as a multiple-passaeration tank and to allow operation of any of the modifications of theactivated-sludge process.
Operation — The activated sludge plant was placed in operation as a
stepped aeration system during the fall of 1968. Based upon studiesconducted at other locations by Metcalf & Eddy, Inc., it was determinedthat the optimum application point for alum (the coagulant chosen for
precipitation of phosphorus) was the last pass of a multiple-pass aerationtank.
3-7
M E T C A L F
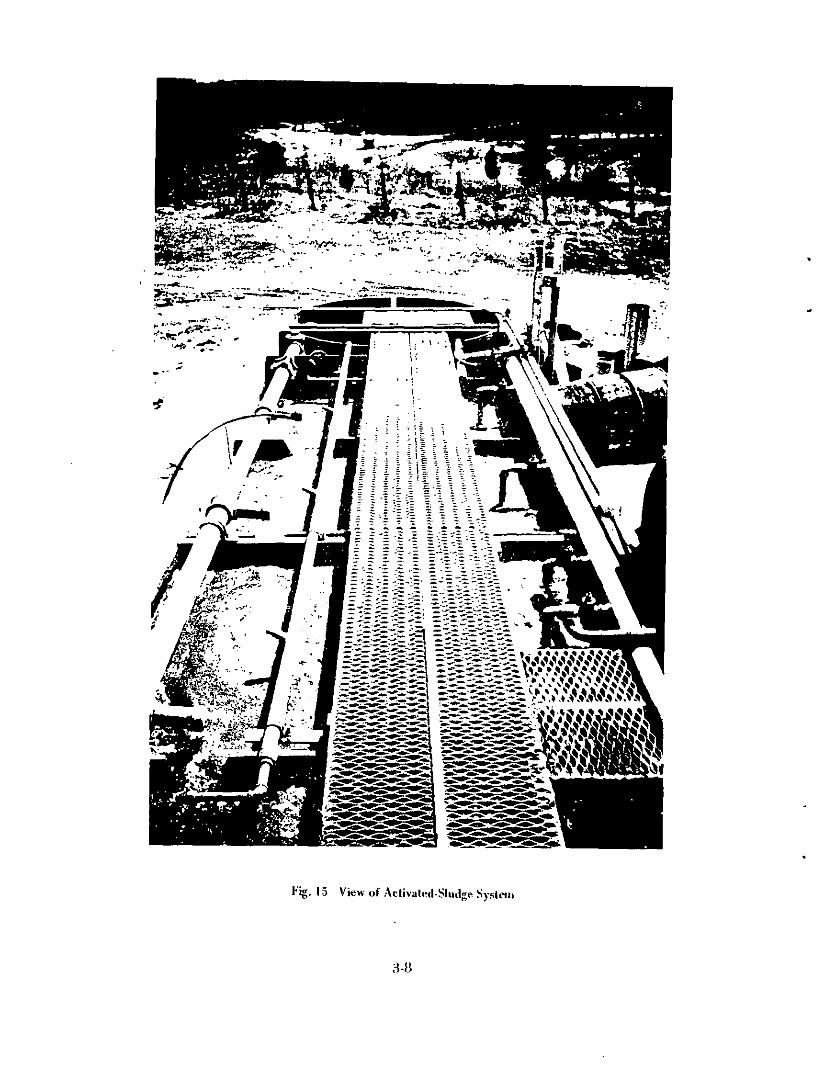
Fig. 15 View of Activated-Sludge System
H-8
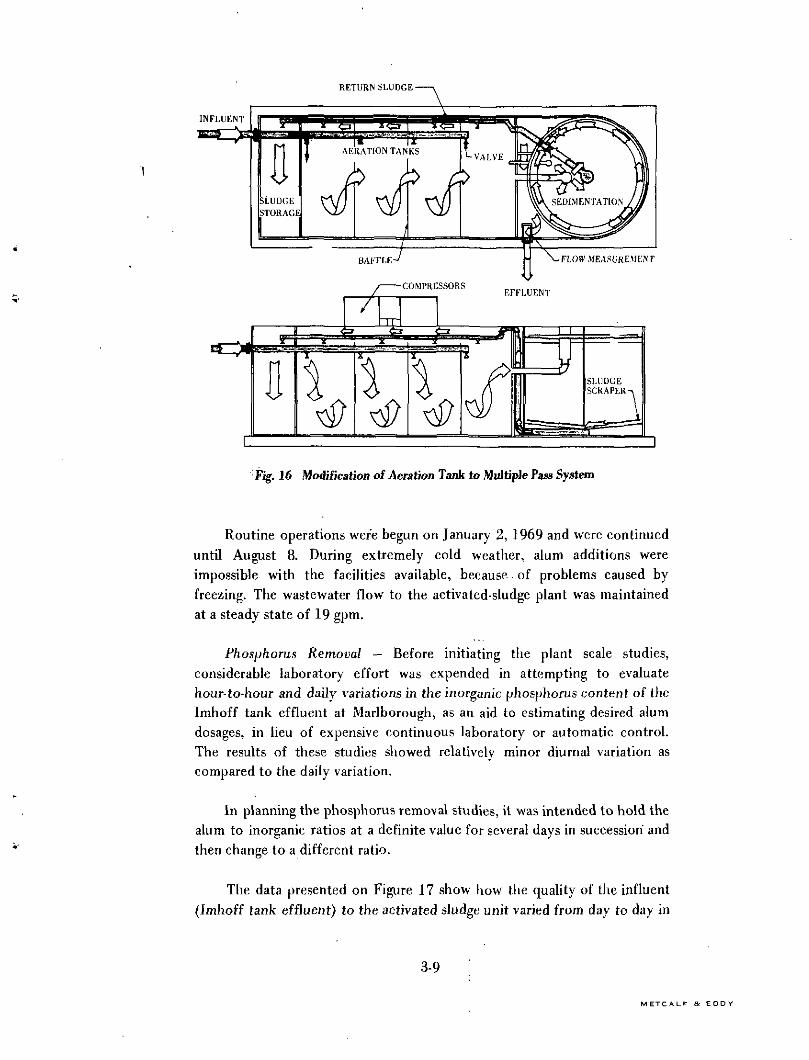
Fig. 16 Modification of Aeration Tank to Multiple Pass System
Routine operations were begun on January 2, 1969 and were continueduntil August 8. During extremely cold weather, alum additions wereimpossible with the facilities available, because of problems caused byfreezing. The wastewater flow to the activated-sludge plant was maintainedat a steady state of 19 gpm.
Phosphorus Removal — Before initiating the plant scale studies,considerable laboratory effort was expended in attempting to evaluatehour-to-hour and daily variations in the inorganic phosphorus content of theImhoff tank effluent at Maryborough, as an aid to estimating desired alumdosages, in lieu of expensive continuous laboratory or automatic control.The results of these studies showed relatively minor diurnal variation ascompared to the daily variation.
In planning the phosphorus removal studies, it was intended to hold thealum to inorganic ratios at a definite value for several days in succession andthen change to a different ratio.
The data presented on Figure 17 show how the quality of the influent
(Imhoff tank effluent) to the activated sludge unit varied from day to day in
3-9
M ETC ALP a E D D Y

terms of inorganic phosphorus and BOD. Because of the great dailyvariations in phosphorus, the ratio of alum to inorganic phosphorus changedconsiderably from day to day as shown, in spite of the intention of holdingfairly uniform ratios for extended periods of time.
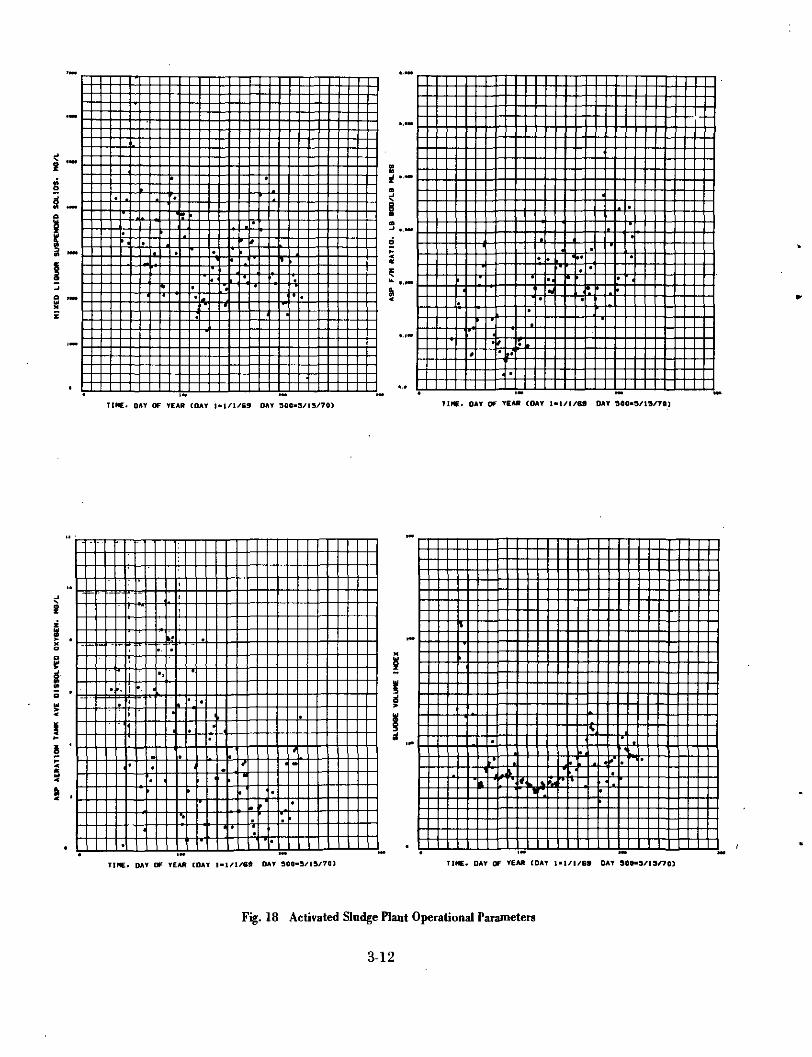
Figure 18 is a summary which shows how the common operational
parameters of MLSS, F/M (food to microorganism) ratio and DO (dissolvedoxygen) varied during the course of the studies. It also shows the settlingcharacter of the MLSS in terms of SVI. It will be noted that a considerableday-to-day variation occurred in spite of the steady state hydraulic loadimposed. Reference to the BOD information on Figure 17 will show that thegreat variations in F/M ratios and DO were related to the BOD. The abilityto maintain SVI values of 100 or less during such wide variations inoperational parameters is definite evidence of a special benefit from theaddition of alum for phosphorus removal.
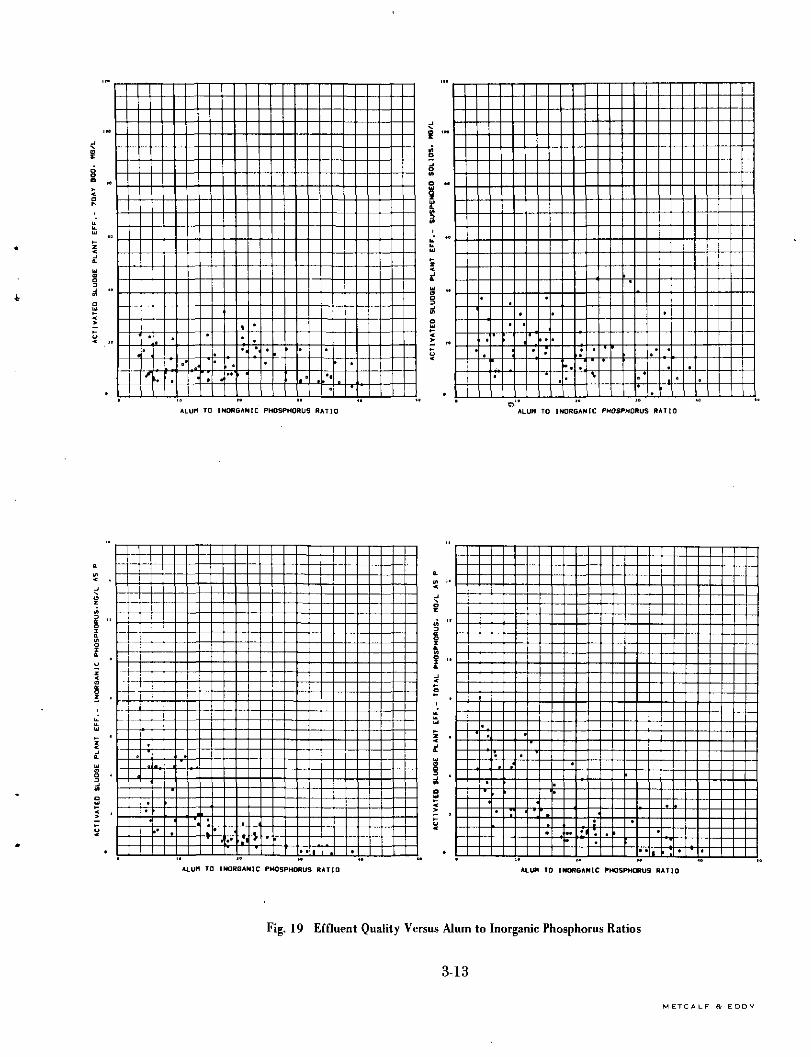
Because of the considerable daily variation in alum to phosphorusratios, the data concerned with effluent quality have been analyzed in termsof the ratios as shown on Figure 19. From these data it may be seen that
alum dosages of at least 18 to 1* of phosphorus were needed to reduceinorganic phosphorus to average levels of less than 1 mg/L, 25 to 1 to ensureless than 1 mg/L, and at least 28 to 1 to produce effluents with 0.5 mg/L or
less of inorganic phosphorus.
Alum to phosphorus dosages of 20 to 1 were required to produce anaverage effluent of 1.5 mg/L of total phosphorus and at least 30 to 1 for anyappreciable possibility of effluents with less than 1 mg/L. These data were allobtained on unfiltered samples. The fact that there were 12 occasions whentotal phosphorus values of 0.5 mg/L or less were measured when alum tophosphorus ratios were 30 or above indicates that phosphorus levels can bereduced to very low levels employing alum in the activated-sludge process.
Further study of Figure 19 shows that the BOD of the effluent wasnormally less than 25 mg/L, averaging about 15 mg/L. There appeared to belittle relationship of residual BOD to the alum to inorganic phosphorus ratio,except that the poorest quality effluent seemed to occur when the ratio was
between 20 and 24.
With respect to suspended solids in the activated sludge effluent, thereappeared to be a definite improvement as the alum to phosphorus ratio
*Alum: P ratio x 0.09 = Al:P.
3-10

T1NE. DAY OF TEAR (DAY Ht/I/69 DAY 300-3/13/70) TIME. DAY OF YEAR (DAY I*l/)/G9 DAY 900-3/13/70)
TINE< DAY OF YEAR (DAY 1-1/1/69 DAY 300-3/13/70)
Fig. 17 Phosphorus and BOD of Influent to Aeration Tank and
Alum to Inorganic Phosphorus Ratio Employed
3-11
M ETC ALF a EDDY
TIHE. OAT OF YEAR (OAT 1-1/1/69 OAT 300-3/13/70) TINE. OAT or TEAR (DAY 1-1/1/6* OAT 300-3/19/70)
TIHE. DAT OF TEAR [DAT 1-1/1/89 DAT 500-3/15/70J TIHE. DAY OF TEAR (DAT 1-1/I/6* OAT 300-3/13/703
Fig. 18 Activated Sludge Plant Operational Parameters
3-12
ALUM TO INORGANIC PHOSPHORUS RATIO
f ™
ALUH TO INORGANIC PHOSPHORUS RATIO
-1-1
--*--
ALUM TO INORGANIC PHOSPHORUS RATIO ALUM TO INORGANIC PHOSPHORUS RATIO
Fig. 19 Effluent Quality Versus Alum to Inorganic Phosphorus Ratios
3-13
M ETC ALF R E D D Y
increased. At ratios above 18 to 1, which were necessary to accomplish goodphosphorus removal, suspended solids were normally less than 20 mg/L.
Summary — From the data on Figures 17, 18, and 19 we conclude thatgood quality effluents can be produced at Marlborough, in terms of residualphosphorus, BOD, and suspended solids when alum to phosphorus ratios aremaintained at 18 to 1 or above.
Sludge Disposal
Sludge disposal is a major problem and cost factor in any method ofwastewater treatment that generates floating or settleable solids. Both of themethods of phosphorus removal investigated .at Marlborough generatesettleable solids that increase the total amount of solids requiring disposal.
Lime Treatment of Trickling Filter Effluent — Lime treatment ofdomestic wastewaters results in the precipitation of a large part of thebicarbonate alkalinity as calcium carbonate
Ca(HC03)2 + Ca(OH)2 •» 2 CaC03 + 2 H20 (3-1)and much of the inorganic phosphates as apatite
5 Ca (OH)2 + 3 H2POJ *.Cas(OH)(FO4)3 + 6 H20 + 3 OR- (3-2)
If the pH is carried to levels of 11 or above, magnesium ion will beprecipitated as magnesium hydroxide
Mg" + Ca(OH)2 * Mg(OH)2 + Ca*- (3-3)
Elevation of the pH to values above 10 requires the use of excessive lime.The excess is normally removed by the addition of carbon dioxide(recarbonation) which results in the formation of additional calciumcarbonate.
Ca(OH)2 + CO2 + CaCO3 + H20 (3-4)
In the case of lime treatment of TFE, the organic solids sloughing fromthe filter would be separated in the final clarifier in combination withcalcium carbonate and apatite from reactions 3-1 and 3-2. If sufficient limewere added to raise the pH above 11, then the final clarifier sludge would alsocontain magnesium hydroxide. Recarbonation is normally accomplished inseparate facilities, so handling of sludge from it is a separate problem and notunlike that experienced in water works practice.
Lime precipitation of TFE results in the production of a sludge with ahigh percentage of inorganic matter. The amount of calcium carbonate willbe in direct relationship to the alkalinity of the wastewater when the pH israised to 10 or above. At Marlborough the volume of sludge wasted varied
3-14

considerably from day to day in order to maintain a desirable depth ofsludge in the upflow unit. The average volume wasted was 400 gpd with anaverage dry-solids content of 1.3 percent, containing about 20 percentvolatile matter.
Because of the low volatile content of the sludges and potentialrecovery of lime through recalcination, we chose to investigate separatehandling of the sludges removed from the lime precipitation unit.Laboratory studies on vacuum filtration showed the sludge to be verydifficult to dewater; consequently, attention was directed to dewatering bycentrifuging.
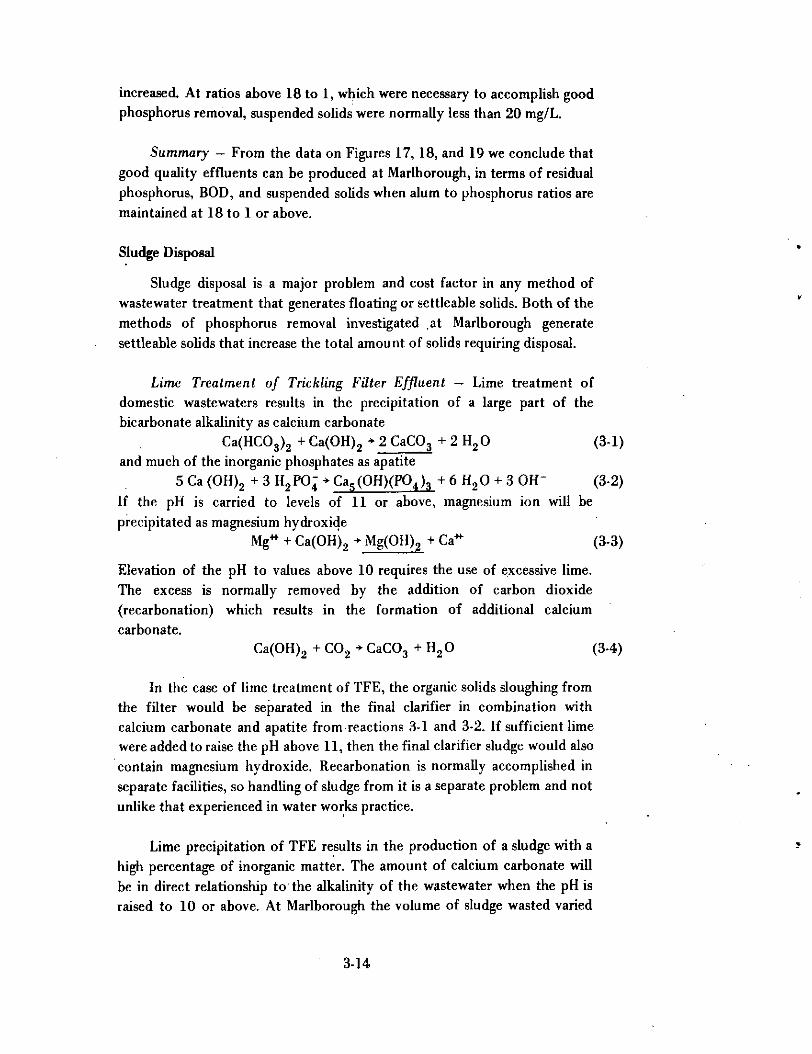
Arrangements were made with the Bird Machine Company, Walpole,Massachusetts, to conduct dewatering tests using their equipment uponsludges transported to their plant by tank truck. Four batches of sludge weresubjected to testing with and without the use of coagulants. The first-batchof sludge was not typical so results obtained are not shown. Data obtainedupon the other three batches are presented on Figures 20, 21, and 22.
80
NOTE: FEED SOLIDS 2.2%% CAKE SOLIDS SHOWN BY SPECIFIC POINTS1440 x GDEEP POOL 18 x 42 INCH CENTRIFUGE
50 100 150
FEED RATE (LBS./HR. SOLIDS)
200 250
100
wGAas
• • 17.790
80
'X*' 12.2
21.2
NOTE: FEED SOLIDS 2%% CAKE SOLIDS BY POINTS1440 x GDEEP POOL"X"FEED RATE 202 LBS./HR."0" FEED RATE 138 LBS./HR
0 1 2 3
POLYELECTROLYTE DOSAGE (LBS./TON)
Fig. 20 Centrifuge Studies on Sludge from Lime Precipitation of TFE
3-15
M ETC ALF & E D D Y
100
90
W>o
80-f
70'
23.1
NOTE: FEEDS% CAKI
6x 121
\^
OLIDS 2.5%: SOLIDS SHOWFG
NCH CENTR1FU
tv 31.1
J BY SPECIAL PC
^E
k)INTS \
O 30.6
\
10 20 30
FEED RATE (LBS./HR. SOLIDS)
40 50
u:ce:
NOTE: KEED SOLIDS 2.5%% CAKE SOLIDS BY-POINTS
330 x G"VKEEDRATE 39 LBS./HR"0" FEED RATE 21 LBS.
70
0 2 4 6
POLVKLKCTROLYTE DOSAGE (LBS./TON)
Fig. 21 Centrifuge Studies on Sludge from Lime Precipitation of TFE
3-16
too
NOTK: F K K I'/> ( :At:i:nt
—to -c3.r».5
) SOLIDS 2.3%
41.8
^KK SOLIDS SHOWN HY S P K C I K K
J I M C I I C K N T U I I ' l U i K
vo :ifu
I'OINTS ^..
I o 20 ;(oK I - K D H A T K ( L B S . / H K . SOLIDS)
40
100
* 90
^?'
)' NOTK: KKKD SOLIDS 2.3%:i)i-4 % CAKK SOLIDS BY POINTS
moxcFKKD ItATK = 34 LfiS./MK.
0 2 4 6
I'OLYRLKCrKOLYTK DOSAC.K (LBS./TON)
Fig. 22 Centrifuge Studies on Sludge from Lime Precipitation of TFE
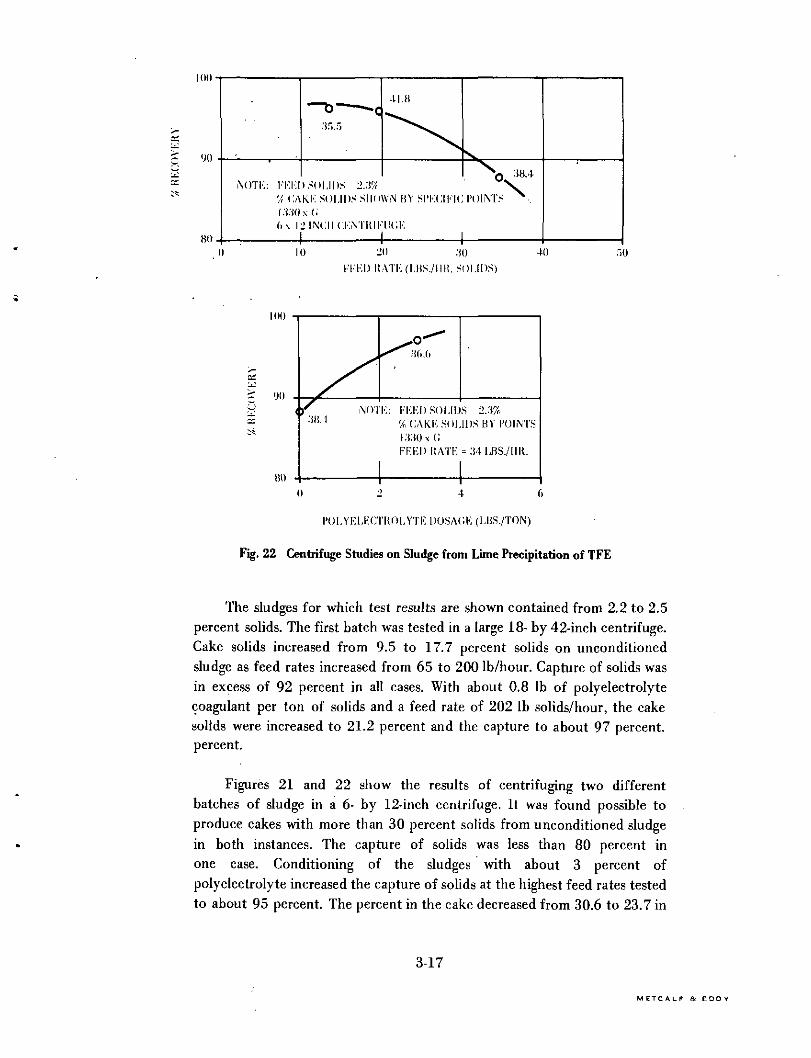
The sludges for which test results are shown contained from 2.2 to 2.5percent solids. The first batch was tested in a large 18- by 42-inch centrifuge.Cake solids increased from 9.5 to 17.7 percent solids on unconditionedsludge as feed rates increased from 65 to 200 Ib/hour. Capture of solids wasin excess of 92 percent in all cases. With about 0.8 Ib of polyelectrolytecoagulant per ton of solids and a feed rate of 202 Ib solids/hour, the cakesolids were increased to 21.2 percent and the capture to about 97 percent,percent.
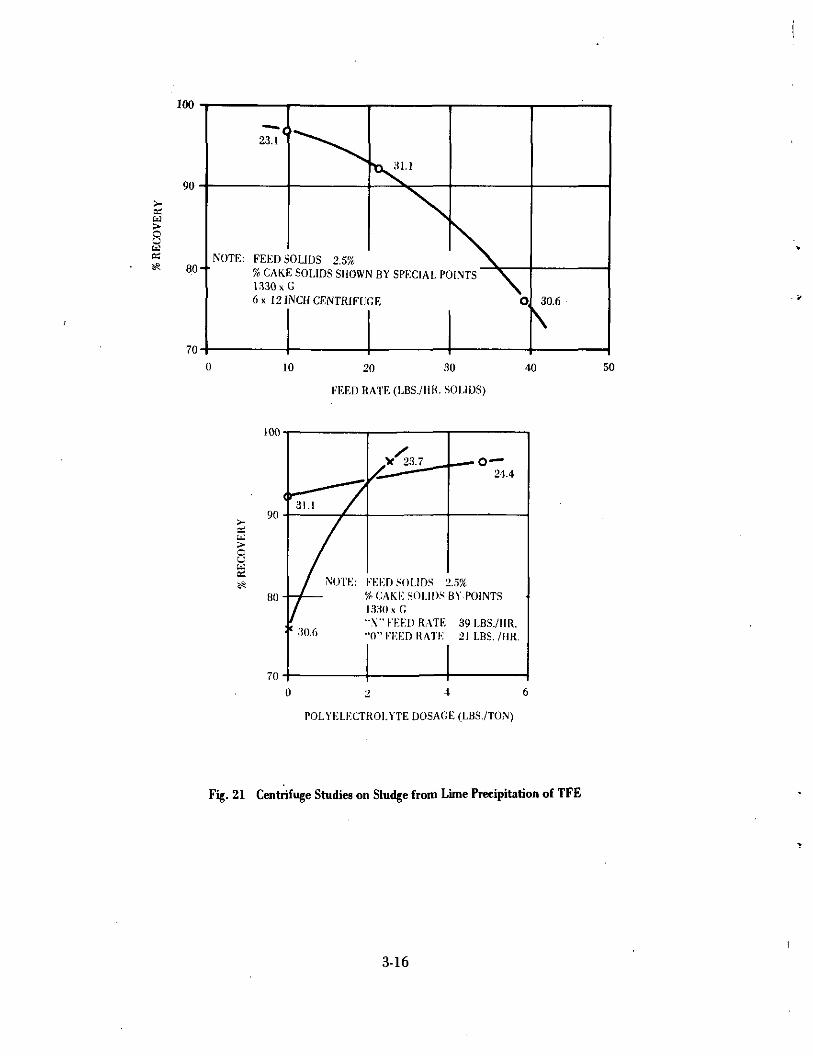
Figures 21 and 22 show the results of centrifuging two differentbatches of sludge in a 6- by 12-inch centrifuge. It was found possible toproduce cakes with more than 30 percent solids from unconditioned sludgein both instances. The capture of solids was less than 80 percent inone case. Conditioning of the sludges with about 3 percent ofpolyelectrolyte increased the capture of solids at the highest feed rates testedto about 95 percent. The percent in the cake decreased from 30.6 to 23.7 in
3-17
M E T C A L F R E D O Y

the case where the solids capture on unconditioned sludge, Figure 21, hadbeen so poor. This condition was not unexpected, since retention of thelighter solids in the cake would tend to decrease the degree of compaction.With the third sludge, Figure 22, addition of polyelectrolyte did not decreasethe solids content of the cake significantly. This was to be expected in viewof the excellent capture of solids with the unconditioned sludge.
Summary — Sludges from lime precipitation of TFE can be dewateredsatisfactorily for recovery of lime by centrifuging. Solids capture can becontrolled by addition of a relatively small amount of polyelectrolyte,approximately 3 pounds per ton of solids. The solids not captured whichescape in the centrate have been shown by other investigations to contain alarge part of the apatite. Thus, centrifuging constitutes a means of purifyingthe sludge by accomplishing a high degree of phosphate separation beforethe solids are recalcined to recover lime. The centrate containing a majorityof the phosphate is normally mixed with primary and secondary sludges fordewatering and ultimate disposal.
. Activated-Sludge System Employing Alum Removal of Phosphates —
Addition of either aluminum or ferric salts to activated-sludge systemsresults in the removal of phosphates through precipitation reactions that arenot well understood. The reactions are generally indicated to occur as
follows:*M+3 + HPQj-2 •» MP04 + H+ (3-5)
and excess M+3 ion reacts with alkalinity of the wastewater to produceflocculant aluminum or ferric hydroxide.
2M+3 + 6 HCO- * 2 M(QH)3 + 3 H20 + 6 C02 (3-6)
Because the hydroxides formed are highly flocculant, the use of excessaluminum or ferric salts is to be avoided because of detrimental effects onthe settling characteristics of the activated sludge.
As was noted in an earlier section, the sludge produced was more inweight but less in volume than normally expected. In fact, because of thefavorable effect of coagulant addition on the sludge volume index, resultantwaste sludge volumes were found to be slightly less than in the conventionalactivated sludge system.
Thickening of the alum waste activated sludge was attempted in boththe laboratory and the field. When a flotation unit was run at 0.35 gpm/sfand a 5 to 1 recycle to sludge ratio, the sludge thickened to 6.2 percentsolids and resulted in a 99 percent recovery of the solids.
*Where M+3 is either AT3 or Fe+3.
3-18
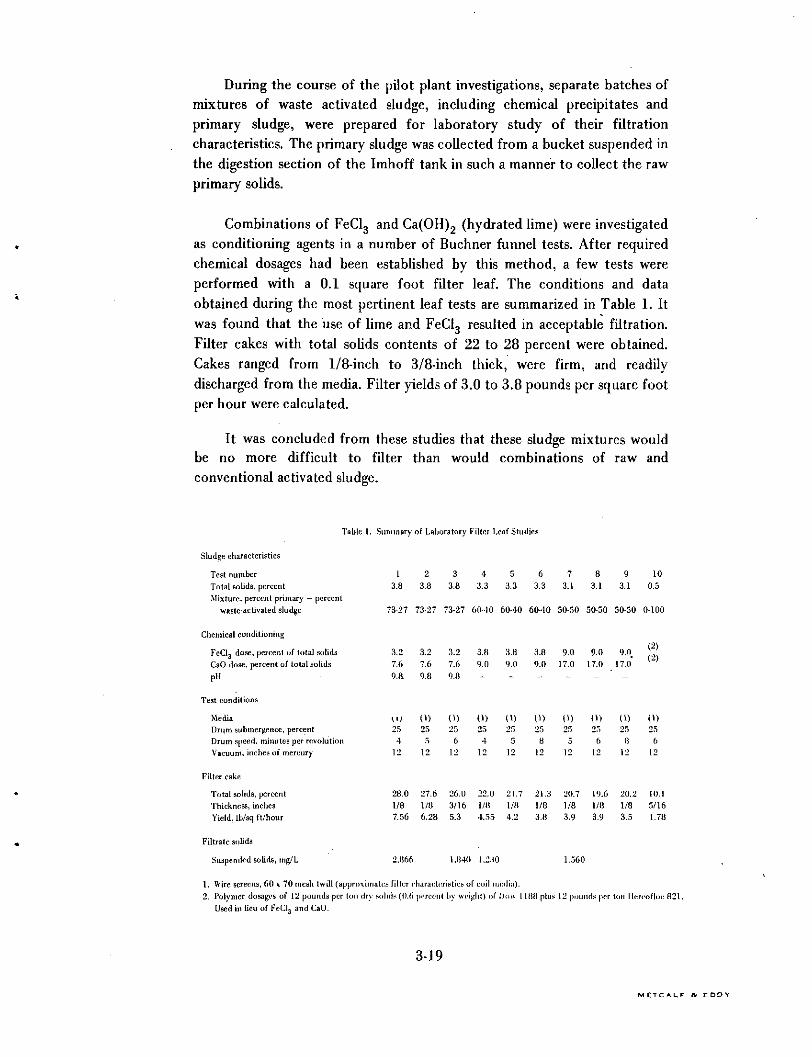
During the course of the pilot plant investigations, separate batches ofmixtures of waste activated sludge, including chemical precipitates andprimary sludge, were prepared for laboratory study of their filtrationcharacteristics. The primary sludge was collected from a bucket suspended inthe digestion section of the Imhoff tank in such a manner to collect the rawprimary solids.
Combinations of FeCl3 and Ca(OH)2 (hydrated lime) were investigatedas conditioning agents in a number of Buchner funnel tests. After requiredchemical dosages had been established by this method, a few tests wereperformed with a 0.1 square foot filter leaf. The conditions and dataobtained during the most pertinent leaf tests are summarized in Table 1. Itwas found that the use of lime and FeCI3 resulted in acceptable filtration.Filter cakes with total solids contents of 22 to 28 percent were obtained.Cakes ranged from 1/8-inch to 3/8-inch thick, were firm, and readilydischarged from the media. Filter yields of 3.0 to 3.8 pounds per square footper hour were calculated.
It was concluded from these studies that these sludge mixtures wouldbe no more difficult to filter than would combinations of raw andconventional activated sludge.
Table I. Summary of Laboratory Filler l.caf Studies
S lu d ge chara c ler isti c s
Test number 1 2 3 4 5 6 7 8 9 1 0Total solids, percent 3.8 3.8 3.8 3.3 3.3 3.3 3.1 3.1 3.1 0.5
Mixture, pereent primary — percentwaste-activated sludge 73-27 73-27 73-27 60-40 60-40 60-40 50-50 50-50 50-50 0-100
Chemical conditioning(2)
FeClj dose, percent of total solids 3.2 3.2 3.2 3.8 3.8 3.8 9.0 9.0 9.0. 'CaO dose, percent of total solids 7.6 7.6 7.6 9.0 9.0 9.0 17.0 17.0 17.0pH 9.a 9.8 9.8 - - - - ' -
Test conditions
Media W (1) (1) (1) (1) (1) (1) (1) (1) (1)Drum submergence, percent 25 25 25 25 25 25 25 2." 25 25Drum speed, minutes p e r revolution 4 5 6 4 5 8 5 6 ( 1 6Vacuum, inches of mercury 12 12 12 12 12 12 12 12 12 12
Filter cake
Total solids, percent 28.0 27.6 26.1) 22.0 21.7 21.3 20.7 19.6 20.2 I O.IThickness, inches 1/8 1/8 3/16 I /H 1 /H 1/8 1/8 1/8 1/8 5/16Yield, Ib/sq ft/hour 7.56 6.28 5.3 4.55 4.2 3.8 3.9 3.9 3.5 1.78
Filtralc solids
Suspended solids, mg/L 2,866 1.840 1,230 1,560
1. Wire screens, 60 x 70 mesh Iwill (approximates filter characteristics of coil media).
2. Polymer dosages of 12 pounds per ton dry solids (0,6 jicrccnt by wi'ijrhl) nf Don 1188 plus 12 pounds per ton Hereof lot: 821.Used in lieu of Fed, and CaO.
3-19
M E T C A L F & EDO V
Separate samples of the primary sludge and the alum sludge werecollected and taken to Bird Machine Company, to be run on a centrifuge.The samples were delivered by a tank truck on the day prior to testing thespecific sludge. The primary and waste activated sludges were run on an18-inch by 42-inch ccf (countercurrent feed) unit at 1,440 x G (2,400 rpm).
The two sludges were run independently. By using basic solidsbalancing principles developed by the Bird Machine Company, a predictioncan be made as to the ability of the centrifuge to dewater variouscombinations of the sludges when mixed. As an example, if we were to mixthe following: two parts of primary sludge by weight, dewatered alone to 30percent cake solids, and one part of waste activated, dewatered alone to 6percent cake solids, we could expect the mixture to dewater to about 22percent cake solids.
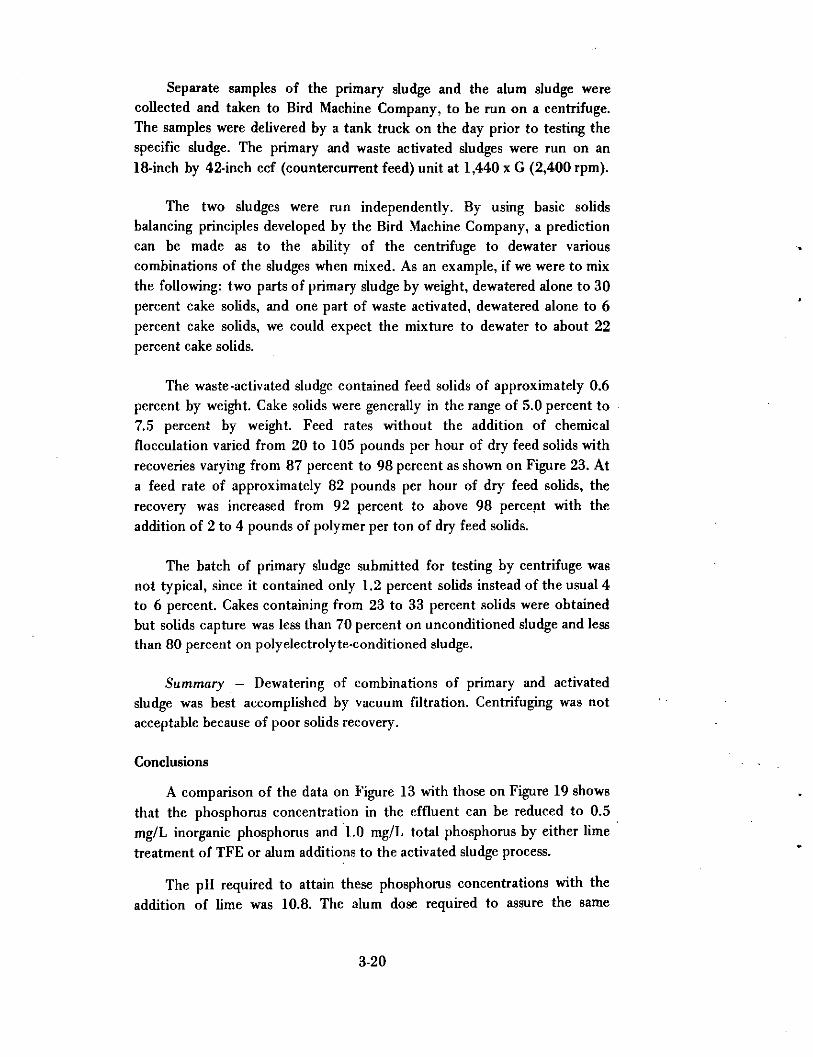
The waste-activated sludge contained feed solids of approximately 0,6percent by weight. Cake solids were generally in the range of 5.0 percent to7.5 percent by weight. Feed rates without the addition of chemicalflocculation varied from 20 to 105 pounds per hour of dry feed solids withrecoveries varying from 87 percent to 98 percent as shown on Figure 23. Ata feed rate of approximately 82 pounds per hour of dry feed solids, therecovery was increased from 92 percent to above 98 percent with the
addition of 2 to 4 pounds of polymer per ton of dry feed solids.
The batch of primary sludge submitted for testing by centrifuge wasnot typical, since it contained only 1.2 percent solids instead of the usual 4to 6 percent. Cakes containing from 23 to 33 percent solids were obtainedbut solids capture was less than 70 percent on unconditioned sludge and lessthan 80 percent on poly electrolyte-conditioned sludge.
Summary — Dewatering of combinations of primary and activatedsludge was best accomplished by vacuum filtration. Centrifuging was notacceptable because of poor solids recovery.
Conclusions
A comparison of the data on Figure 13 with those on Figure 19 showsthat the phosphorus concentration in the effluent can be reduced to 0.5
mg/L inorganic phosphorus and 1.0 mg/L total phosphorus by either limetreatment of TFE or alum additions to the activated sludge process.
The pH required to attain these phosphorus concentrations with theaddition of lime was 10.8. The alum dose required to assure the same
3-20
ioo •
% R
EC
OV
ER
Y
33
•a=>
0
NOTE: FEE
14418"DEE
•0 _
r^°~-D SOLIDS 0.6%\KE SOLIDS SHOWN BY SPECIFI) x Gx 42" CCFPPOOL
12.0'O.^^
^^V
05.4
*Q 5.05
40 60 80
FEED RATE <LBS./HR. SOLIDS)100 120
100'
90
80
7.5
6.95
NOTE: FEED SOLIDS 0.6%% CAKE SOLIDS BY POINTS1440 «<;18" x42"CCFDEEP POOLFEED RATE 82 I,BS,/HR-
1 1
0 2 4 6
POLYELECTROLYTE DOSAGE (LBS./TON)
Fig. 23 Centrifuge Studies on Waste-Activated Sludge
concentration of phosphorus in the activated sludge process effluent is a 28to 1 ratio of alum to inorganic phosphorus concentration, or 2.5 parts ofaluminum for each part of phosphorus.
The lime sludges can be classified for lime recovery or be dewatered forultimate disposal by the use of a centrifuge. The sludges produced throughthe use of alum for removal of phosphorus were dewatered better by the useof a vacuum filter than a centrifuge.
3-21
M ETC ALF

CHAPTER 4
NITROGEN REMOVAL
Because nitrogen is the major inorganic nutrient (fertilizer) required inthe growth of algae and the relatively high concentration of it that occurs indomestic wastewaters, it is reasonable to assume that removal will berequired in many locations.
Removal of fixed forms of nitrogen from wastewaters is somewhat
more complicated than that of phosphorus because of the several forms inwhich it occurs, i.e., as ammonium, nitrite or nitrate ions, or as organicallybound ammonia in the form of protein matter. Fortunately, nitrogen occursin domestic wastewaters largely as ammonium ion or its derivatives — ureaand protein. Effective nitrogen removal is dependent upon converting asmuch of the nitrogen as possible either to ammonium ion or to nitrate ion.
Removal as Ammonia by Air Stripping
During biological treatment, ammonium ions are released from ureathrough hydrolysis and from proteins by biological oxidation of the organicmatter according to the following equations.
CO(NH2)2 + 2 H20 ^^ 2 NH+ + C0= (4-1)
Org-N + 02 -B*** NH; + HCOg (4-2)With the high-rate trickling filter or high-rate activated-sludge methods
of treatment, all of the fixed forms of nitrogen except for small residualamounts of organic nitrogen, are converted to ammonium ion, consequentlythe effluents from both processes are especially amenable to reduction oftheir nitrogen content by removal of ammonia.
At the time the studies were initiated at Marlbo rough, air stripping ofammonia appeared to be a practical method in light of reports on studies atLake Tahoe. Lime treatment to remove phosphates at elevated pH levels andsubsequent stripping of ammonia as shown in equation 4-3 appeared to be aneconomical solution to the nutrient removal problem.
NH+ +OH-—NH 3 t +H20 (4-3)
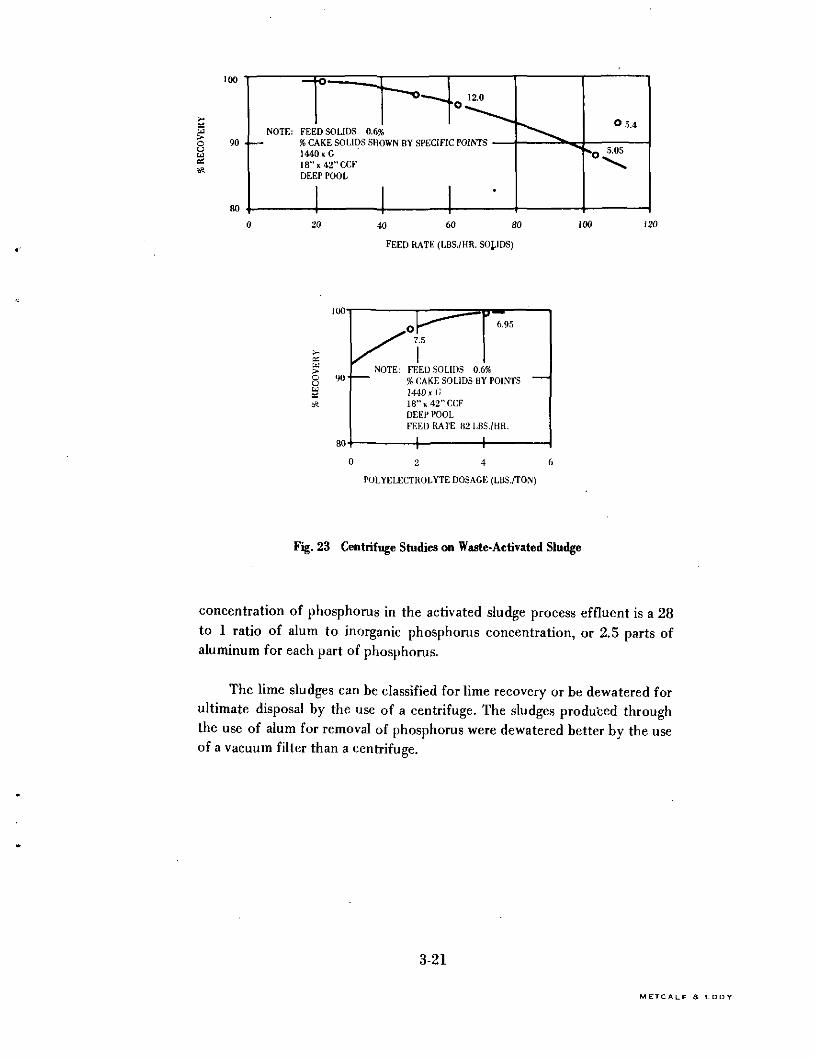
Accordingly, the ammonia stripping device shown as Figure 24 waspurchased and installed at Marlborough to accept and treat the high pHeffluent from the lime precipitation unit shown as Figure 10. The ammoniastripper was operated in a horizontal position rather than vertical because ofits small size and ease of sampling. A prototype would be from 25 to 30 feethigh. The suppliers of the equipment made assurances that results obtained
4-1
M E T C A L F a E D O Y
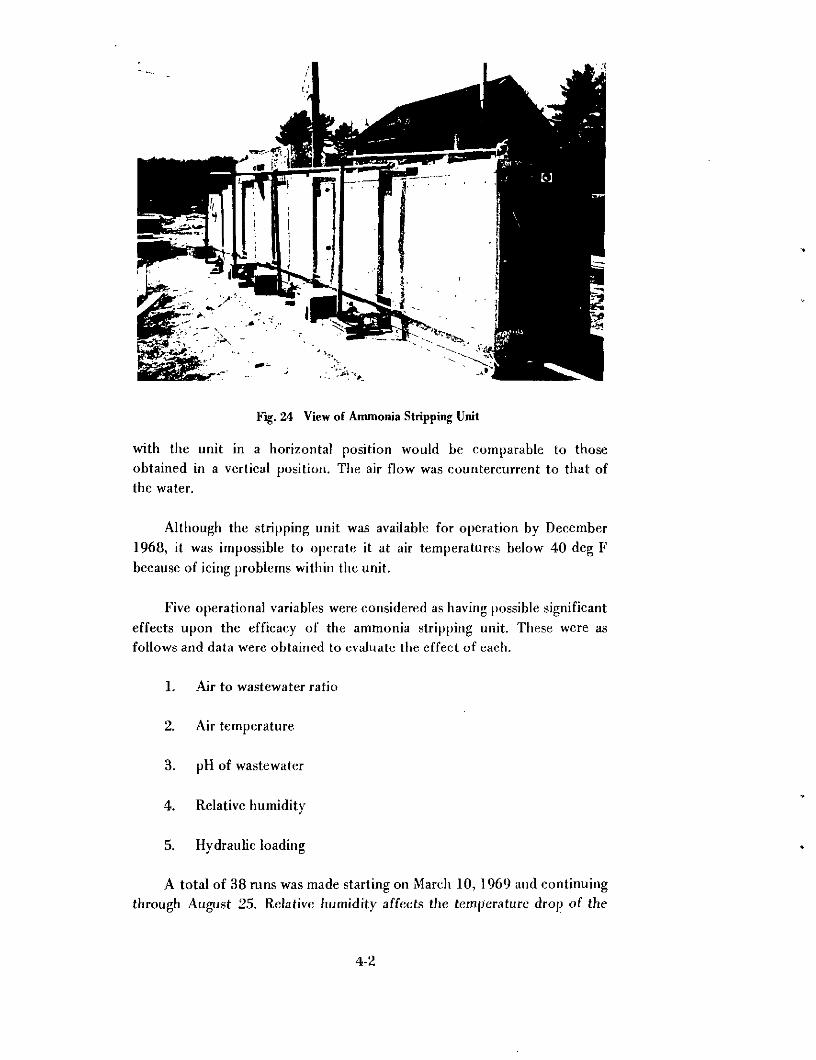
Fig. 24 View of Ammonia Stripping Unit
with the unit in a horizontal position would be comparable to thoseobtained in a vertical position. The air flow was countercurrent to that ofthe water.
Although the stripping unit was available for operation by December1968, it was impossible to operate it at air temperatures below 40 deg Fbecause of icing problems within the unit.
Five operational variables were considered as having possible significanteffects upon the efficacy of the ammonia stripping unit. These were asfollows and data were obtained to evaluate the effect of each.
1. Air to wastewater ratio
2. Air temperature.
3. pH of wastewater
4. Relative humidity
5. Hydraulic loading
A total of 38 runs was made starting on March 10, 1969 and continuingthrough August 25. Relative humidity affects the temperature drop of the
4-2
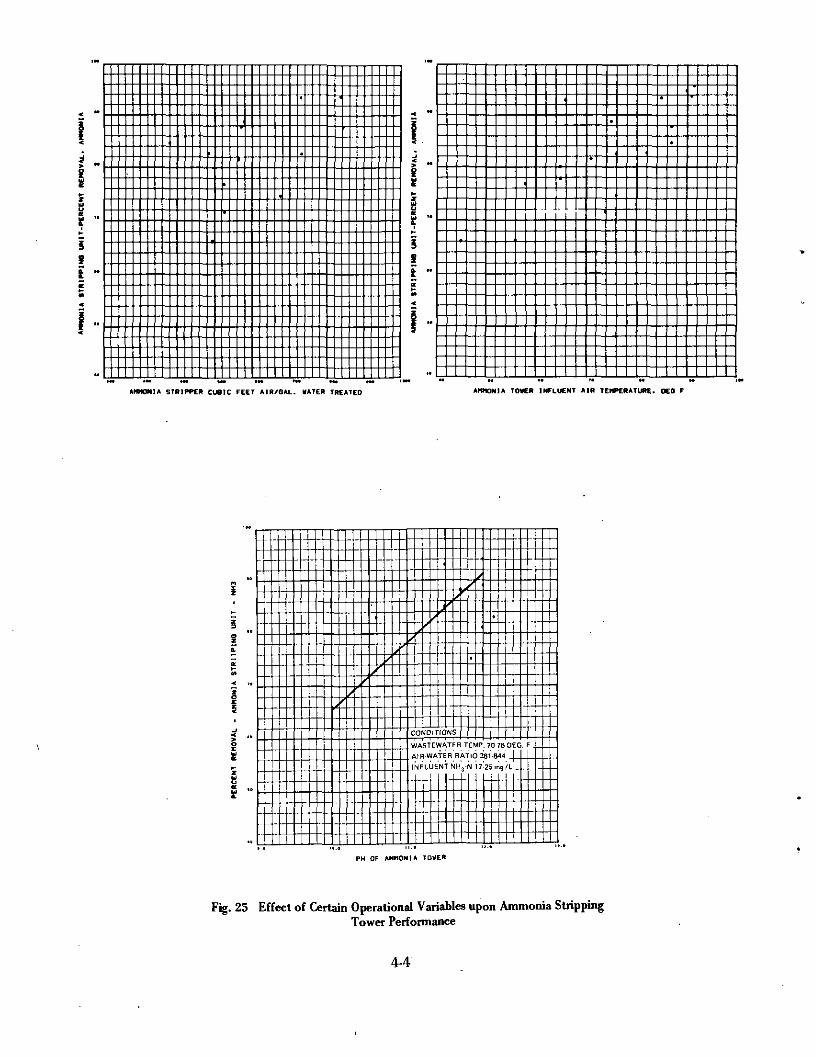
wastewater through the unit, and this drop affects stripping efficiency;however, other variables seemed to have more effect upon performance.Hydraulic loadings below 2 gpm/sf have no effect upon performance. Theinfluence of the first three items shown above is presented on Figure 25.Airflows of at least 550 cu ft/gal were necessary to insure removals of 85percent of the ammonia, and about 800 cu ft/gal was needed to accomplishremovals in excess of 93 percent, under summer conditions.
Air temperatures have a most important effect on ammonia removals.S i nee air and wastewater temperatures rise and fall somewhatsimulatneously, the measured effect must be considered to be a combinedone. The data on Figure 25 indicate that removals above 85 percent wouldbe dependent upon having air temperatures above 70 deg F. At temperaturesbelow 70 deg F, removals decrease to about 60 percent at 40 deg F. Below40 deg the process ceases to be dependable because of icing problems, if
wastewater temperatures are low.
The effect of pH upon ammonia removal also is shown on Figure 25.The most astonishing revelation of the data is that [iH levels of 11.5-12 didnot insure high removals of ammonia. The reason for this paradox is notknown because air-water ratios in excess of 500 and temperatures in excessof 70 deg F were used in all cases when pH was above 11.5. In general,however, the effect of pH is believed to be represented by the line shown onthe figure.
During the course of the ammonia removal studies, severe scaling of themedia in the stripping tower occurred. This problem has also beenencountered at Lake Tahoe and Washington, D.C. It represents a mostserious limitation of the process.
Summary — Removal of ammonia nitrogen by air stripping is notpractical except when air and wastewater temperatures are above 60 degF.Severe scaling of media can be expected at all pH levels above 10.5, andbelow pH 10.5 efficiency of removal is less than 75 percent. Under the mostideal conditions and with pH levels of 11.5 to 12, approximately 2 mg/L ofammonia nitrogen will remain in the effluent. Total nitrogen in effluentsfrom ammonia strippers can be expected .to range from 4 to 6 mg/L,
depending upon the amount of organic nitrogen in the influent.
A serious limitation of air stripping of ammonia is related to thepotential air pollution problem it creates. Serious question can be raised asto how long such a practice would be tolerated.
4-3
M ETC A L F a E D D V
iSft "
I -
AMMONIA STRIPPER CUBIC FEET AIR/GAL. HATER TREATED AMMONIA TOMER INFLUENT AIM TEMPERATURE. DEB *
1
(̂7
//
-
yf /
/,
/
CONDITIONS
,.
-
^
'
/
«
WASTEWATEH TEMP. 70-76 OEG
AIR-WATER RATIO 381-844
I•JF L JEN ^ ^ H3' N 7 2 rr 9/UI
PH OF AMMONIA TOWER
Fig. 25 Effect of Certain Operational Variables upon Ammonia StrippingTower Performance
4-4
Removal by Nitrification and Denitrification
Nitrification followed by denitrification is a major pathway throughwhich fixed forms of nitrogen are restored to elemental or gaseous nitrogen.It is nature's way and because the end product is nitrogen, no threat of airpollution is created.
Nitrification — During biological treatment of wastewaters, organicforms of nitrogen and urea are converted to ammonia, actually ammoniumion, by the action of saprophytic bacteria as shown in Equations 4-1 and 4-2.In many biological treatment systems, particularly during the warm summermonths, part or even all of the ammonia may be oxidized to nitrites andnitrates, in accordance with the following equations.
2 NH3 + 3 02 Bact > 2 NO" + 2 H+ + 2 H20 (4-4)
2 NO- + 02-§E£L^ 2 N03- (4-5)
or2 NH3 + 4 02
Bact > 2 NOJ + 2 H+ + 2 H20 (4-6)
Experience has demonstrated that complete oxidation of all of theammonia in wastewaters cannot be guaranteed in normal activated sludge ortrickling filter plants under winter conditions such as occur in Massachusetts.In order to ensure complete oxidation at all times, it has been proposed thatnitrification should be accomplished in a completely separate biologicalsystem following conventional biological treatment. In this manner thenitrifying bacteria responsible for nitrification are isolated and not subject tocompetition with the saprophytic bacteria.
The biological treatment sequence proposed for systems designed toaccomplish nitrogen removal .by the nitrification-denitrification route isshown as Figure 26. It will be noted that three separate stages of treatmentare considered essential. This is because specialized bacterial cultures arerequired in each stage. In the pilot study the first stage of treatment(carbonaceous oxidation or BOD removal) is accomplished by tricklingfilters.
The proposed second stage of treatment involves use of a systemexactly like that used in the conventional activated-sludge process, with theadditional provision that plug flow characteristics should be maintained inthe aeration tank. For our purposes, the activated sludge system used in thephosphate removal studies, shown on Figures 15 and 16, was ideally suitedto accomplish nitrification, since the aeration tank had been modified toprovide four aeration compartments to be operated in series.
4-5
M ETC ALF f t E D D Y

BOD REMOVAL NITRIFICATION DENITRIFICATION
Fig. 26 Biological Treatment Sequence for Nitrogen Removal by
Nitrification-Denitrification
The activated-sludge system was converted from its original use to anitrification unit, employing settled TFE as feed, on October 7, 1969 andcontinued on that basis until April 30, 1970. The settled TFE used to feedthe unit had characteristics shown on Figure 27. Ammonia, organic nitrogen,suspended solids and BOD all varied considerably during the 200-day periodof the study. These great variations were related to variations in dry and wetweather wastewater flows and Imhoff tank performance, as discussed inithe Appendix. '
During the operation of any biological system, a considerable numberof variables must be reckoned with, besides the quality of the feed. Most ofthem can be controlled except for temperature. For systems involvingfluidized suspensions of microorganisms, the following variables are ofconcern:
1. Temperature
2. pH
3. Dissolved oxygen
4. Detention time or hydraulic loading
5. Mixed liquor suspended solids or bacterial numbers
6. Sludge volume index
7. Rate of sludge return
4-6

TIME. DAY OF TEAR (OAT 1-1/1/69 DAY 300-3/13/70) TIME. DAT OF TEAR COAT 1-1/1/69 DAT 300-5/13/70)
-1-
TIME. OAT OF TEAR CDAT 1-1/1/69 DAY 300-3/13/70) TIME. DAY OF YEAH CDAY 1*1/1/69 DAY 500-3/13/70)
Fig. 27 Characteristics of Settled Trickling Filter Effluent Used to
Feed Nitrification System
4-7
M ETC A U F ft E D D Y
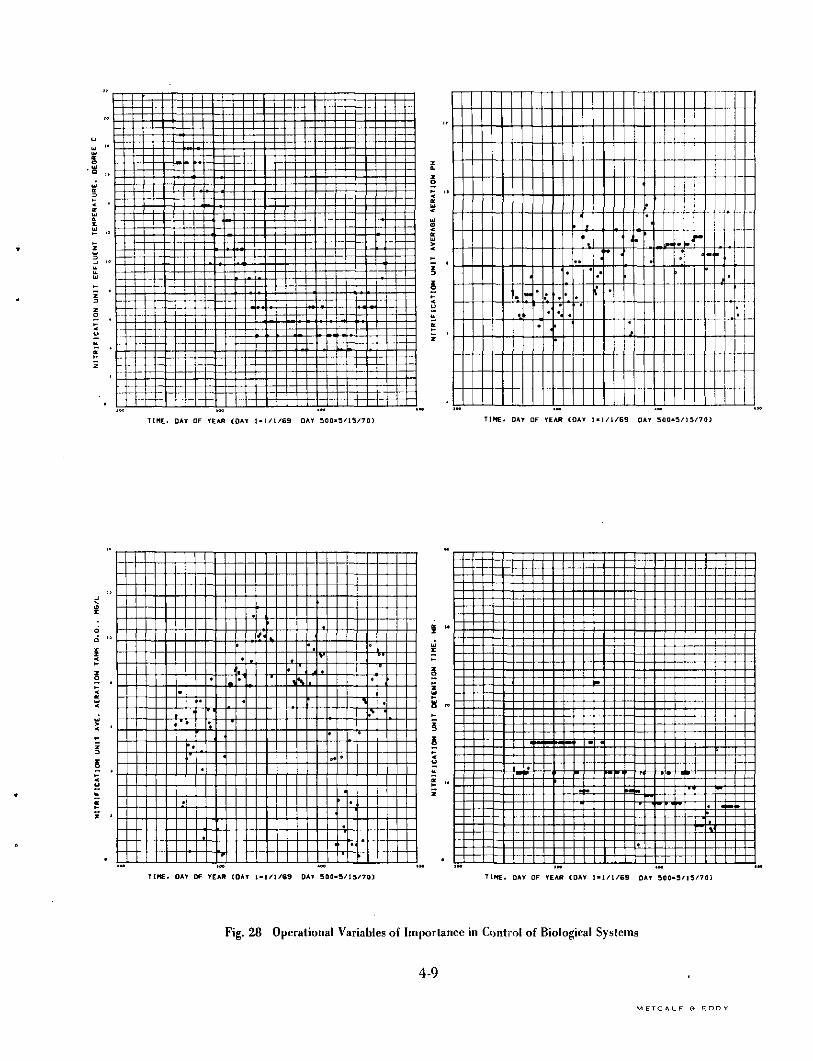
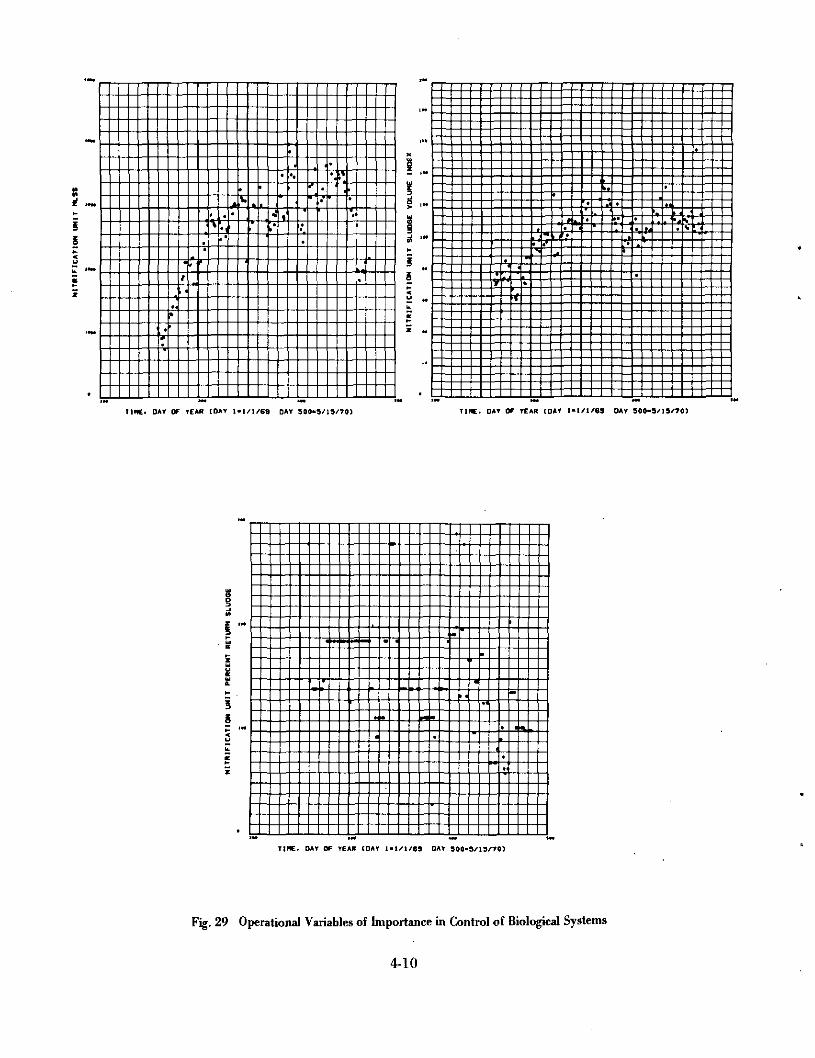
A summary of the above variables as they occurred chronologicallyduring the course of the studies on nitrification is given on Figures 28 and29.
Temperatures in the nitrification unit varied from a high of 18 deg C(64 F) at the start of the studies on October 7 to lows of 4 deg C (39 F) onseveral days between January 15 and March 28, 1970. By late Apriltemperatures of 10 deg C (50 F) or more were common. The greatday-to-day variations were a function of weather conditions, particularlyrainfall, and its effect on wastewater temperatures.
During the early days of the nitrification study, some trouble was
encountered in keeping the pH in a satisfactory range for nitrification. Thiswas corrected by adding sodium hydroxide on a drip-feed basis. Followingthe 330th day, November 25, the pH was kept in the range of 7 to 9, exceptfor a few days. A notable instance was from day 390 to 400, January 24 toFebruary 4, when too much hydroxide was added and pH levels above 9occurred.
Dissolved oxygen conditions were normally above 4 mg/L but onseveral occasions they were less. The values below 4 were a result of a limitedair supply due to one of the two air compressors being out of service andvarying demand for compressed air at other locations
At the start of the nitrification studies, the hydraulic load on thesystem was adjusted to provide a 15.5 hour detention time in the aerationtanks. This was done purposely to facilitate the development of a nitrifyingsludge. Early attempts to decrease the detention time resulted in erraticoperation but by December 15 a 12-hour period was proven successful, evenwith temperatures of 6 deg C and less in the aeration tank. Detention timesas low as 5 hours were used from March 15 to 25 with good results being
obtained.
From day 300 to 460, October 25 to April 5, mixed liquor settleablesolids were kept in the range of 2,500 to 4,000 mg/L. The decrease to 2,000mg/L on day 461 was due to a diversion of sludge to another project forseeding purposes.
The SVI of the sludge generally ranged between 90 and 140, during the
major part of the time, and is quite satisfactory.
The rate of sludge return normally ranged from 100 to 200 percent ofthe settled TFE entering the aeration tanks. These rates were abnormally
4-8
T1HE. OAT OF TEAR (DAT 1» 1/1/69 DAT 500-5/13/70) TINE. DAT OF TEAR COAT 1-1/1/69 OAT 300-S/l3/70)
TIME. OAT OF TEAR (DAT 1-1/1/63 DAT 500-5/13/70} TINE. DAT OF TEAR CDAT 1-1/1/69 DAT 500-5/15/701
Fig. 28 Operational Variables of Importance in Control of Biological Systems
4-9
M ETC ALF f t E D D Y
* ,«.i§
I1MC. DAT OF TEAR (DAV 1-1/1/68 DAT 300*3/19/70) TINE. DAT OF TEAR COAT 1-1/1/69 OAT 300-9/19/70)
TINE. DAT OF TEAR (DAT 1-1/1/69 OAT 900-S/13/70)
Fig. 29 Operational Variables of Importance in Control of Biological Systems
4-10
T1ME. DAY OF YEAR COAY 1*1/1/69 DAY 500-3/15/70) TtHE. DAY Of YEAR (DAY l-l/i/69 DAY 300-3/15/70)
TIHE. DAY OF YEAR (DAY 1-1/1/69 DAY 300-3/13/70) Tint. DAY OF YEAR CDAY 1-1/1/69 DAY 300-3/13/701
Fig. 30 Nitrogenous Compounds in Nitrification System Effluent
4-11
M ETC A L F a E D D Y
high but were necessary because of limitations of the air-lift system used.Attempts were made to use a pumped return but freezing problems made itsuse unreliable.
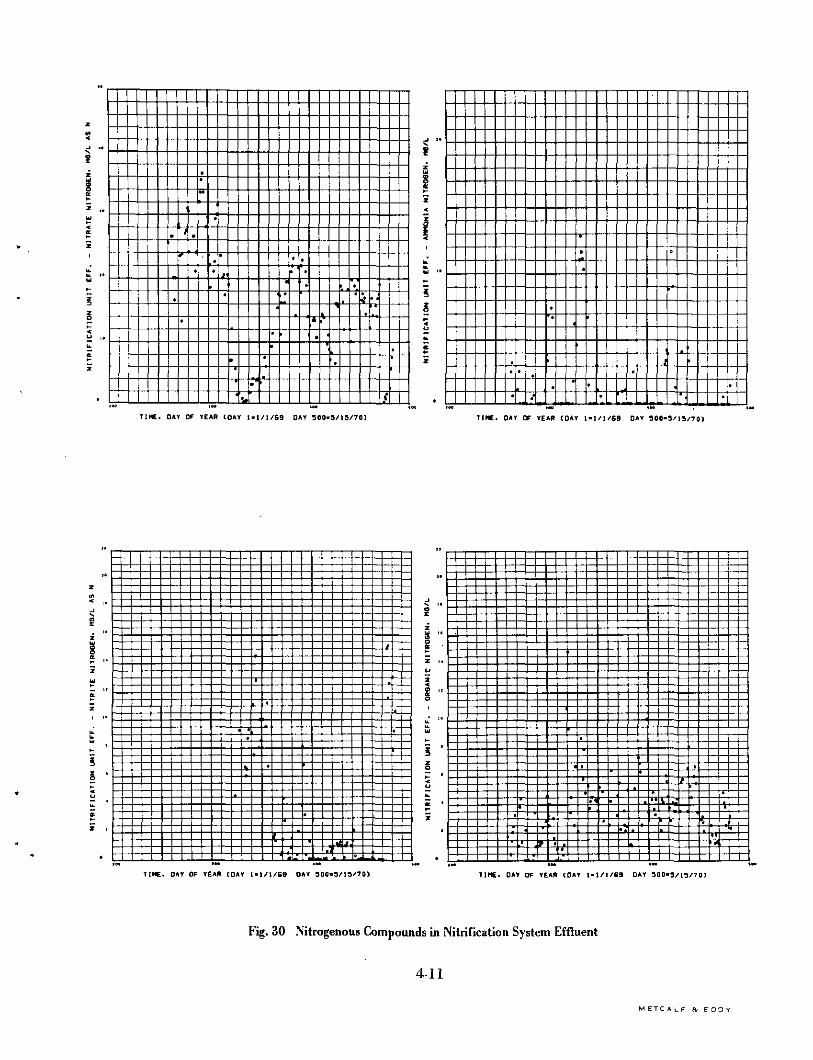
The effectiveness of the nitrification system in accomplishing itspurpose is shown by the data on Figure 30, with respect to nitrogenouscompounds in the effluent.
A high degree of nitrate formation occurred at all times during thestudy, except for the period from day 320 to 360 and after 471 and on dayswhen low DO conditions prevailed. The first lapse occurred as a result of adrop in detention time from 15.5 to 9.5 hours. The temperature also fellrapidly during this period. Although nitrate formation suffered greatly,formation of nitrites was still considerable and effluent ammonia nitrogenexceeded 5 mg/L on only 8 days of the 40. The failure to produce normallevels of nitrates after day 472 did not result in a breakdown of the process,as nitrites continued to be formed and very little ammonia escaped in theeffluent.
During the course of the nitrification studies, ammonia nitrogen wasreduced to less than 2 mg/L in the effluent on all but 25 days. On at least 8days the high ammonia levels were related to low dissolved oxygenconditions that limited oxidation of ammonia to nitrites and nitrates.
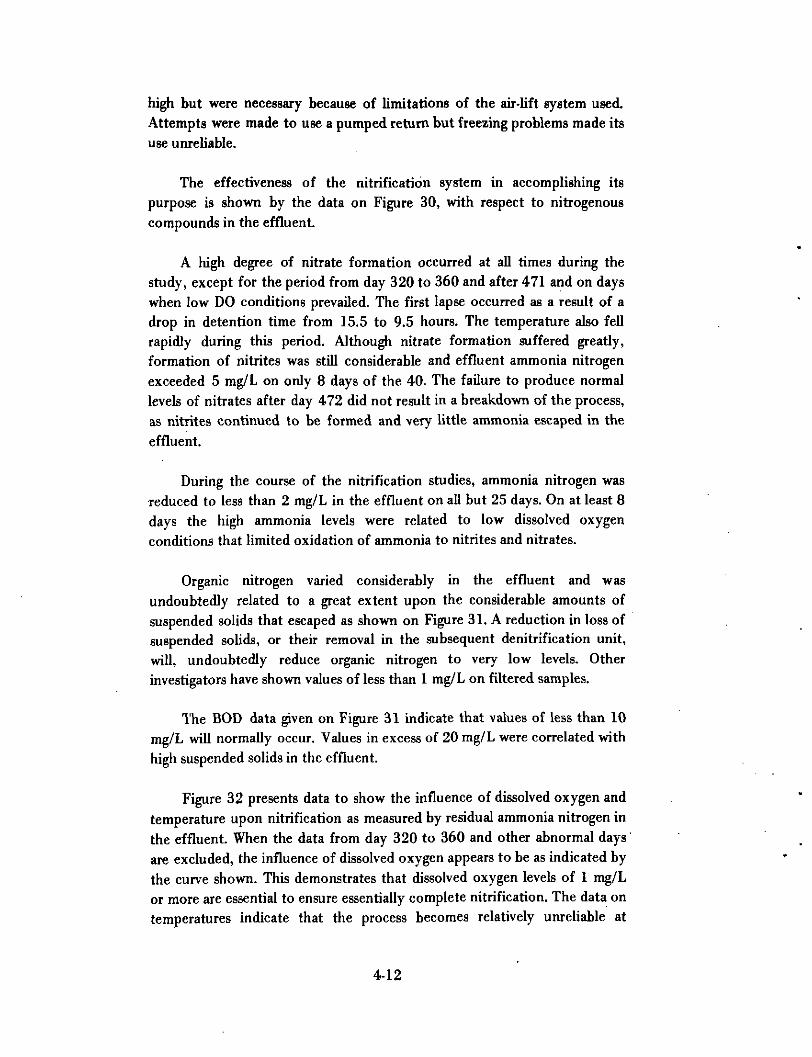
Organic nitrogen varied considerably in the effluent and wasundoubtedly related to a great extent upon the considerable amounts ofsuspended solids that escaped as shown on Figure 31. A reduction in loss ofsuspended solids, or their removal in the subsequent denitrification unit,will, undoubtedly reduce organic nitrogen to very low levels. Otherinvestigators have shown values of less than 1 mg/L on filtered samples.
The BOD data given on Figure 31 indicate that values of less than 10mg/L will normally occur. Values in excess of 20 mg/L were correlated withhigh suspended solids in the effluent.
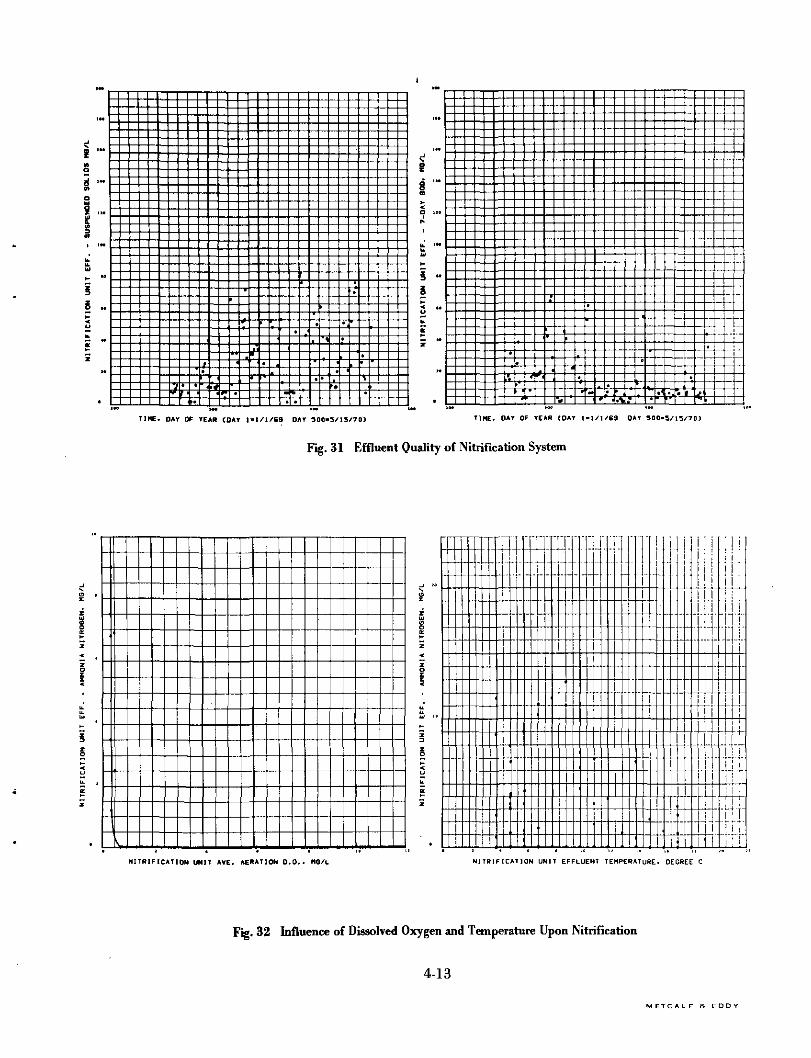
Figure 32 presents data to show the influence of dissolved oxygen andtemperature upon nitrification as measured by residual ammonia nitrogen inthe effluent. When the data from day 320 to 360 and other abnormal daysare excluded, the influence of dissolved oxygen appears to be as indicated bythe curve shown. This demonstrates that dissolved oxygen levels of 1 mg/Lor more are essential to ensure essentially complete nitrification. The data ontemperatures indicate that the process becomes relatively unreliable at
4-12
i "
J 1Ma '*•
4
T1BE. DA* Of YEAR COAT 1-1/1/69 OAT 500-3/15/70)
t;
TIME. DAT OF TEAR (OAT t-l/t/69 OAT 300-3/13/70)
Fig. 31 Effluent Quality of Nitrification System
NITRIFICATION UNIT AVE. AERATION O.O.. HG/L NITRIFICATION UNIT EFFLUENT TEMPERATURE. DEGREE C
Fig. 32 Influence of Dissolved Oxygen and Temperature Upon Nitrification
4-13
M ETC ALF 8r E D D Y
temperatures of 6 deg C (43 deg F) or less. Fortunately, very fewwastewaters approach such low temperatures.
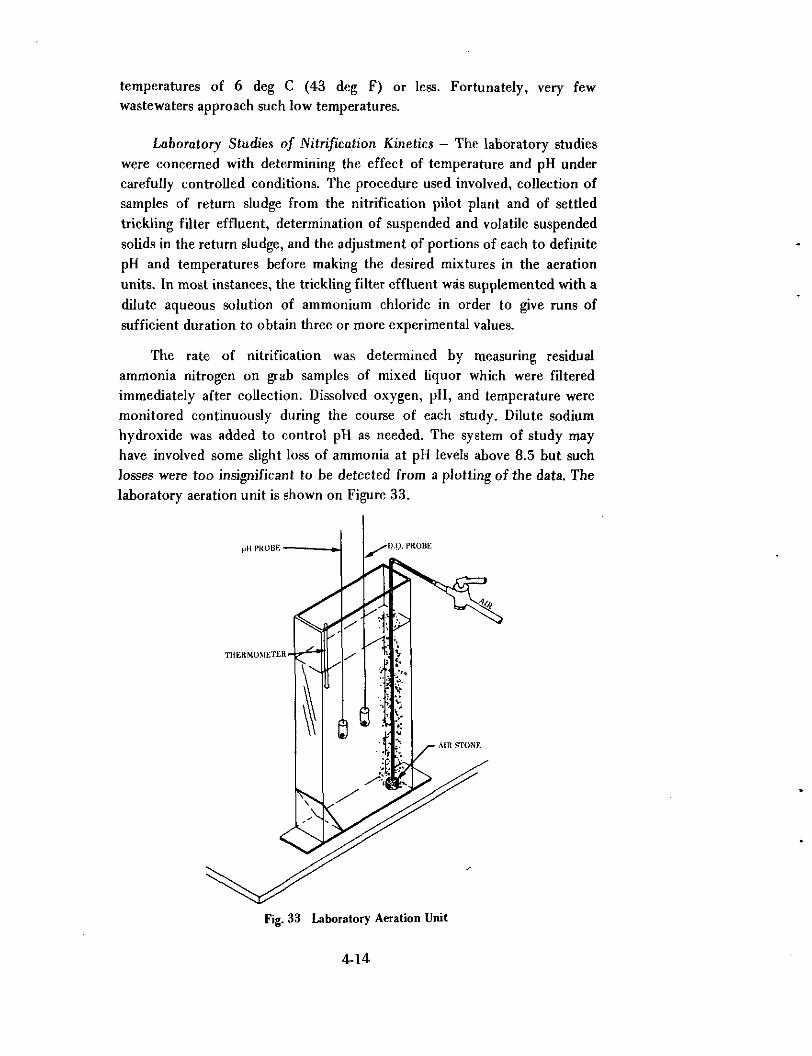
Laboratory Studies of Nitrification Kinetics — The laboratory studieswere concerned with determining the effect of temperature and pH undercarefully controlled conditions. The procedure used involved, collection ofsamples of return sludge from the nitrification pilot plant and of settledtrickling filter effluent, determination of suspended and volatile suspended
solids in the return sludge, and the adjustment of portions of each to definitepH and temperatures before making the desired mixtures in the aerationunits. In most instances, the trickling filter effluent was supplemented with a
dilute aqueous solution of ammonium chloride in order to give runs ofsufficient duration to obtain three or more experimental values.
The rate of nitrification was determined by measuring residualammonia nitrogen on grab samples of mixed liquor which were filteredimmediately after collection. Dissolved oxygen, pH, and temperature weremonitored continuously during the course of each study. Dilute sodiumhydroxide was added to control pH as needed. The system of study mayhave involved some slight loss of ammonia at pH levels above 8.5 but suchlosses were too insignificant to be detected from a plotting of the data. Thelaboratory aeration unit is shown on Figure 33.
Fig. 33 Laboratory Aeration Unit
4-14
It was assumed that the relative population of nitrifiers in the totalMLVSS concentration for the duration of the study remained constant. It is
felt that this assumption was justified because of the long duration of thepilot studies run under the same conditions, employing settled trickling filter
effluent as feed stock.
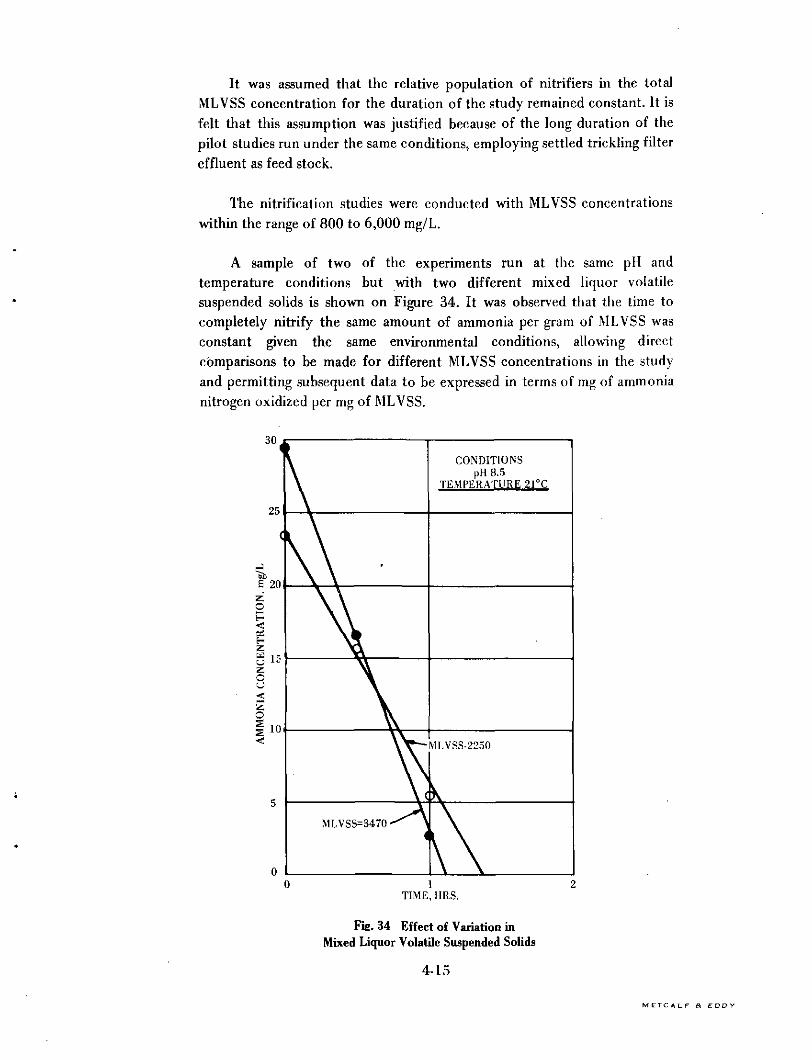
The nitrification studies were conducted with MLVSS concentrations
within the range of 800 to 6,000 mg/L.
A sample of two of the experiments run at the same pH andtemperature conditions but with two different mixed liquor volatilesuspended solids is shown on Figure 34. It was observed that the time tocompletely nitrify the same amount of ammonia per gram of MLVSS wasconstant given the same environmental conditions, allowing directcomparisons to be made for different MLVSS concentrations in the studyand permitting subsequent data to be expressed in terms of mg of ammonianitrogen oxidized per mg of MLVSS.
CONDITIONSpH 8.5
TEMPERATURE 21°C
TIME, HRS.
Fig. 34 Effect of Variation inMixed Liquor Volatile Suspended Solids
4-15
M ETC A L F fl EDO V

The augmented ammonia concentrations for the studies varied from 6to 60 mg/L. The ammonia concentration had to be augmented on manyoccasions because the time required for complete nitrification of low levelsof ammonia was so short that only one or two samples could be analyzed
prior to attaining the zero ammonia level. Two sample results are shown onFigure 35. Both of the experiments were conducted at the same pH andtemperature conditions. As can be seen from the figure, the slopes of thelines are parallel and constant for all residual concentrations of ammoniaregardless of the initial concentration, indicating that nitrification is notinhibited at ammonia concentrations normally found in a domesticwastewater system. Also, adjustment of other data for different ammoniaconcentrations may be made by constructing a line parallel to theexperimental line at the desired ammonia concentration.
.025
.020
.015
2 .oiouCdesi
.005
CONDITIONS
|)M8.5
T E M P E R A T U R E 20°C
I N I T I A L Ni l , = 46.rnn{i/L
INITIAL Nil., =26.4 mg/L
TIME. HOURS
Fig. 35 Effect of Variation in Ammonia Concentration
A special study was made to determine the effect of variable BOD uponthe rate of nitrification by nitrifying three different samples. Thetemperature and pH for all three units were the same. The wastewater in thefirst unit was primary effluent with a BOD of 110 mg/L, the second unitcontained settled trickling filter effluent with a BOD of 45 mg/L, and .the
4-16

third unit contained nitrification effluent from the pilot plant with a BOD of
5 mg/L. All samples were augmented with enough ammonium chloride to
give a reasonable duration for the test.
Figure 36 shows the results of this special study. Within the limits of
the study, there was no apparent inhibition of nitrification for the various
BOD concentrations. It should be realized that this study was undertaken to
determine the reaction of the nitrifiers to a shock loading of BOD and that
any sustained high BOD loading would eventually cause nitrification to
cease. Wasting of sludge would have a washing-out effect on the nitrifiers
because of the low growth rate exhibited by the nitrifiers as compared to
those organisms utilizing carbonaceous BOD and the established fact that an
increased BOD loading in a conventional system leads to greater sludge
production.
.020
.015
o
w ,.010
.005
CONDITIONSpll 8.5
TEMPERATURE 20°C
TIME, MRS.
Fig. 36 Effect of Variation in BOD
4-17
M ETC ALF f t E D D Y

The pH range investigated in these studies was from 6.0 to 10.5. Thesamples were adjusted to the desired pH level and maintained at that levelfor the duration of the experiment. The ammonia weight per MLVSS weightratio of the grab samples was plotted against time and all the other variableswere noted. The time plot allowed calculation of the exact time of completenitrification, i.e., complete oxidation of ammonia. A sample graph ispresented on Figure 37. This graph shows two sample results both of whichwere obtained at a temperature of 20 deg C. The pH of one sample was 8.5and the other 6.5. The figure also shows an adjusted line to compensate fordifferent initial concentrations of ammonia.
Three factors are immediately evident from the preceding figure.
1. There was no apparent initial uptake of ammonia by the nitrifiers.
2. There was no lag time involved in the rate of nitrification.
3. The rate was uniform and constant for the entire length of theexperiment. This indicates that the nitrifiers work at maximumefficiency at all times independent of the residual concentration ofammonia.
.015
;> .010
.005
CONDlTJONt
TEMPERATURE 20°C
3 4 5TIME, HOURS
Fig. 37 Effect of Variation in pH
4-18
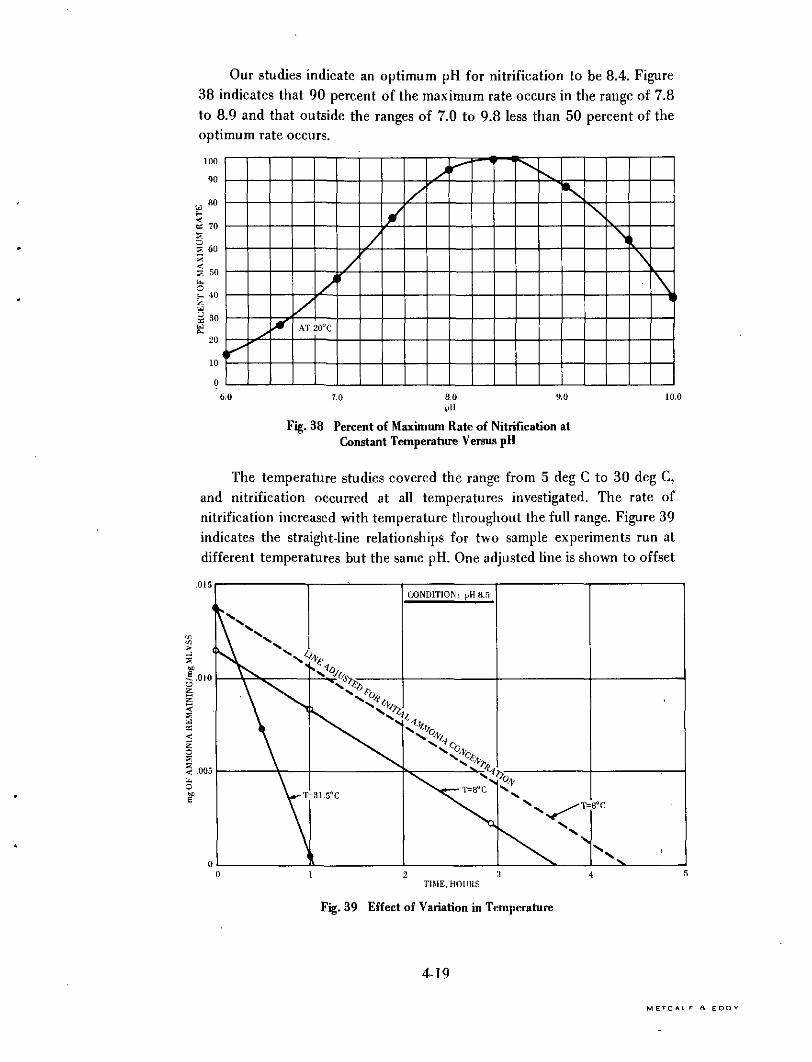
Our studies indicate an optimum pH for nitrification to be 8.4. Figure
38 indicates that 90 percent of the maximum rate occurs in the range of 7.8to 8.9 and that outside the ranges of 7.0 to 9.8 less than 50 percent of theoptimum rate occurs.
PER
CE
NT
OF
MA
XIM
UM
RA
TE
H-
IO
C
JJ
*-
Ol
O>
-4
33
OO
-o
o
oo
oo
oo o
oo
^ sr *
//
AT 20°C
/i
/f
//
/f
v^ *-*t—*^X
V\ s.s1,\
\1
0 7.0 8.0 9.0 10till
Fig. 38 Percent of Maximum Rate of Nitrification atConstant Temperature Versus pH
The temperature studies covered the range from 5 deg C to 30 deg C,and nitrification occurred at all temperatures investigated. The rate ofnitrification increased with temperature throughout the full range. Figure 39indicates the straight-line relationships for two sample experiments run atdifferent temperatures but the same pH. One adjusted line is shown to offset
.015
2 3TIME, HOURS
Fig. 39 Effect of Variation in Temperature
4-19
M ETC A l _ F & E D D V

the initial ammonia concentration difference. There was no lag periodobserved nor any decrease in the rate of nitrification as the residual ammonia
concentration decreased. ;
The relationship of the rate of nitrification at all temperatures studiedto the rate at 30 deg C is indicated on Figure 40. Since 30 deg C is a very
high sewage temperature for all but the most southerly states in the UnitedStates, a summary of relative rates in terms of other maximum temperaturesis as shown in Table 2, based upon the data of Figure 40.
100
90
80
70
O«60E-
50
0*40
30
20
10
pll 8.5
10 15 .20 25TEMPERATURE, °C
30 35
Fig. 40 Rate of Nitrification at All TemperaturesCompared to the Rate at 30 Degrees C
4-20
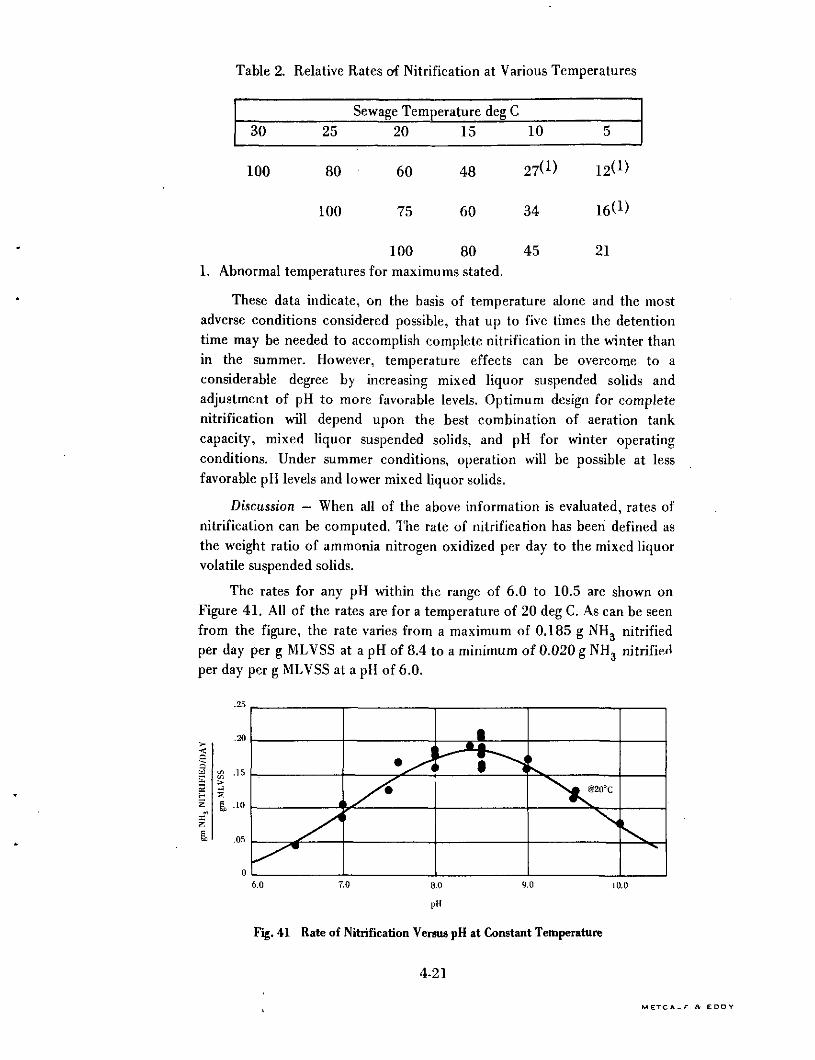
Table 2. Relative Rates erf Nitrification at Various Temperatures
Sewage Temperature deg C30 25 20 15 10 5
100 80
100
60 48 27<J) 12*1)
75 60 34 16(1>
100 80 451. Abnormal temperatures for maximums stated.
21
These data indicate, on the basis of temperature alone and the mostadverse conditions considered possible, that up to five times the detentiontime may be needed to accomplish complete nitrification in the winter thanin the summer. However, temperature effects can be overcome to aconsiderable degree by increasing mixed liquor suspended solids andadjustment of pH to more favorable levels. Optimum design for completenitrification will depend upon the best combination of aeration tankcapacity, mixed liquor suspended solids, and pH for winter operatingconditions. Under summer conditions, operation will be possible at lessfavorable pH levels and lower mixed liquor solids.
Discussion — When all of the above information is evaluated, rates ofnitrification can be computed. The rate of nitrification has been defined asthe weight ratio of ammonia nitrogen oxidized per day to the mixed liquorvolatile suspended solids.
The rates for any pH within the range of 6.0 to 10.5 are shown onFigure 41. All of the rates are for a temperature of 20 deg C. As can be seenfrom the figure, the rate varies from a maximum of 0.185 g NH3 nitrifiedper day per g MLVSS at a pH of 8.4 to a minimum of 0.020 g NH3 nitrifiedper day per g MLVSS at a pH of 6.0.
10.0
Fig. 41 Rate of Nitrification Versus pH at Constant Temperature
4-21
M ETC A ~.r ft E DD Y
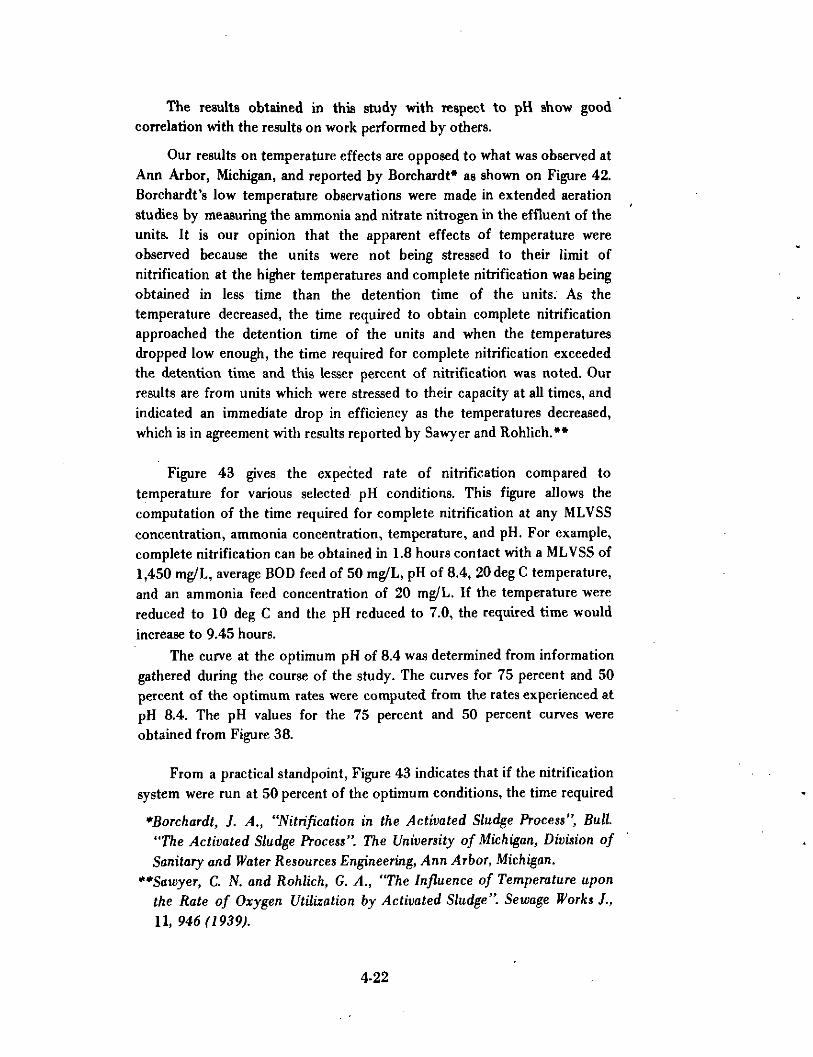
The results obtained in this study with respect to pH show goodcorrelation with the results on work performed by others.
Our results on temperature effects are opposed to what was observed atAnn Arbor, Michigan, and reported by Borchardt* as shown on Figure 42.Borchardt's low temperature observations were made in extended aerationstudies by measuring the ammonia and nitrate nitrogen in the effluent of theunits. It is our opinion that the apparent effects of temperature wereobserved because the units were not being stressed to their limit ofnitrification at the higher temperatures and complete nitrification was beingobtained in less time than the detention time of the units. As thetemperature decreased, the time required to obtain complete nitrificationapproached the detention time of the units and when the temperaturesdropped low enough, the time required for complete nitrification exceededthe detention time and this lesser percent of nitrification was noted. Ourresults are from units which were stressed to their capacity at all times, andindicated an immediate drop in efficiency as the temperatures decreased,which is in agreement with results reported by Sawyer and Rohlich.**
Figure 43 gives the expected rate of nitrification compared totemperature for various selected pH conditions. This figure allows thecomputation of the time required for complete nitrification at any MLVSSconcentration, ammonia concentration, temperature, and pH. For example,complete nitrification can be obtained in 1.8 hours contact with a MLVSS of1,450 mg/L, average BOD feed of 50 mg/L, pH of 8.4, 20deg C temperature,and an ammonia feed concentration of 20 mg/L. If the temperature werereduced to 10 deg C and the pH reduced to 7.0, the required time wouldincrease to 9.45 hours.
The curve at the optimum pH of 8.4 was determined from informationgathered during the course of the study. The curves for 75 percent and 50percent of the optimum rates were computed from the rates experienced atpH 8.4. The pH values for the 75 percent and 50 percent curves wereobtained from Figure 38.
From a practical standpoint, Figure 43 indicates that if the nitrificationsystem were run at 50 percent of the optimum conditions, the time required
•"Borchardt, J. A., "Nitrification in the Activated Sludge Process", Bull"The Activated Sludge Process". The University of Michigan, Division ofSanitary and Water Resources Engineering, Ann Arbor, Michigan.
**Sawyer, C. N. and Rohlich, G. A., "The Influence of Temperature uponthe Rate of Oxygen Utilization by Activated Sludge". Sewage Works J.,11, 946(1939).
4-22
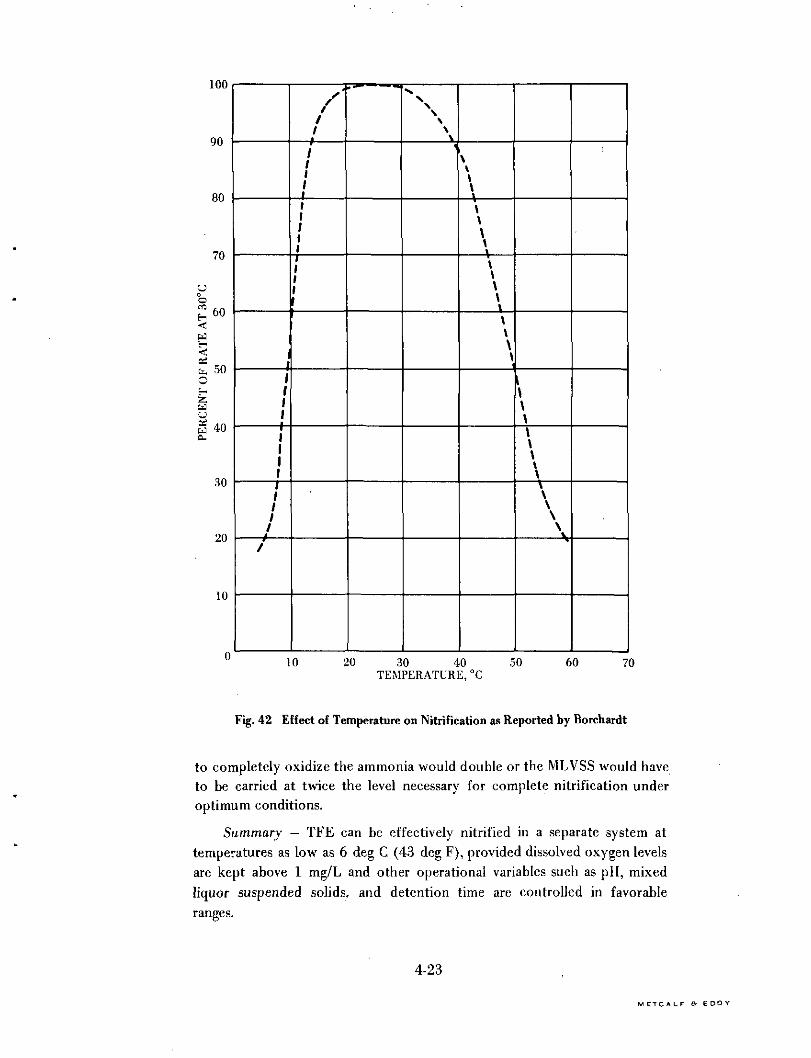
100
90
80
70
60
fc, 50OE-
£d
§40
30
20
10
f111I111t
f11/
/
1
///
/II1ft1/11I1111
• •* • •
V\\
\\1\\\\\\\\
\\\\\\\\\\
1\\\\\\\
\\\\\
10 20 30 40TEMPERATURE, °C
50 60 70
Fig. 42 Effect of Temperature on Nitrification as Reported by Borchardt
to completely oxidize the ammonia would double or the MLVSS would haveto be carried at twice the level necessary for complete nitrification underoptimum conditions.
Summary — TFE can be effectively nitrified in a separate system attemperatures as low as 6 deg C (43 deg F), provided dissolved oxygen levelsare kept above 1 mg/L and other operational variables sucli as pH, mixed
liquor suspended solids, and detention time are controlled in favorableranges.
4-23
M ETC A LF & E DOY
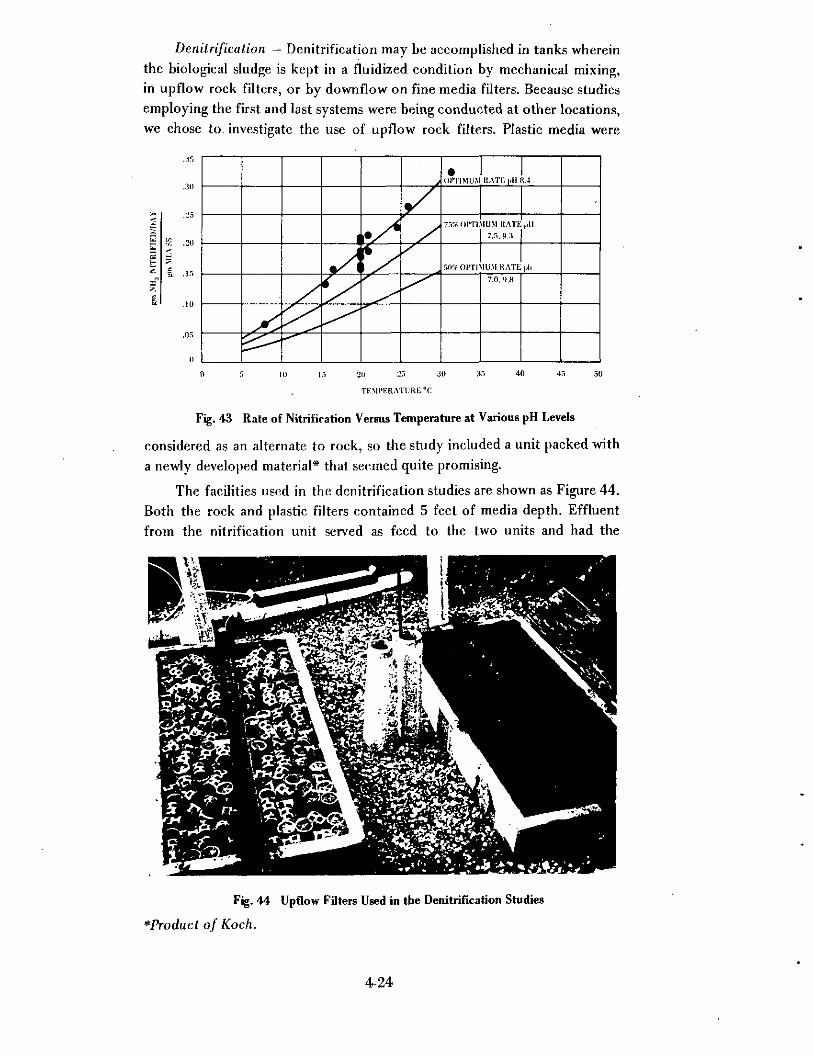
Denitrification — Denitrificatkm may be accomplished in tanks whereinthe biological sludge is kept in a fluidized condition by mechanical mixing,in upflow rock filters, or by downflow on fine media filters. Because studiesemploying the first and last systems were being conducted at other locations,we chose to investigate the use of upflow rock filters. Plastic media were
7.TOOITI IUM KATi
KATE |iH 8.4
I IliM RATEjJi
7.0, <).B
TEMPKRATURET
Fig. 43 Rate of Nitrification Versus Temperature at Various pH Levels
considered as an alternate to rock, so the study included a unit packed witha newly developed material* that seemed quite promising.
The facilities used in the dcnitrification studies are shown as Figure 44.Both the rock and plastic filters contained 5 feet of media depth. Effluentfrom the nitrification unit served as feed to the two units and had the
Fig. 44 Upflow Filters Used in the Denitrification Studies
*Product of Koch.
4-24
characteristics shown on Figures 30 and 31. Methyl alcohol was added to theinfluent to serve as a source of carbon (BOD) to reduce the nitrates andnitrites present to nitrogen gas according to equation 4-4.
2 CH3OH + 2 NOg -&&-+2 C02 + 4 H20 + Njt (4-4)Additional methyl alcohol was added to compensate for the dissolvedoxygen in the influent. An attempt was made to maintain a methanol to
nitrate nitrogen ratio of 5 to 1.
Figure 45 presents information on operational variables during the
course of the denitrification studies that were considered of importance.Temperature, of course, dropped radically from the high values of October
to occasional lows of 4 deg C (39 deg F) during January through March. pHalso varied from 6 to 10, depending principally upon the pH of the influent.
Detention time was held reasonably close to 2.6 hours for the first 120 days
and then fluctuated considerably during the rest of the study. There were
numerous days when the methanol to nitrate nitrogen ratio exceeded 5 to 1.
The quality of the effluent produced by the denitrification unit charged
with rock is shown on Figures 46 and 47. Corresponding data obtained withthe plastic media are not shown but, in general, were inferior. In fact, the
special plastic medium was replaced with a corrugated sheet type withoutimproving performances.
The effectiveness of the rock filter in removing nitrate and nitrite
nitrogen is shown on Figure 46. In general, removal of both was quiteerratic. The data from day 320 to 360 show very low nitrate nitrogen in theeffluent, from which it might be concluded that excellent results were
produced. Such a conclusion is not justified as the influent contained verylow nitrate levels, and the nitrite removals during this period were poor.Ammonia nitrogen in the effluents was generally zero which provides goodevidence to show that denitrification does not yield ammonia. On severaldays significant amounts of ammonia appeared in the effluent. This
condition was well correlated with days when the nitrification unit failed toproduce a completely nitrified effluent.
The organic nitrogen content of the effluent from the denitrification
unit normally ranged from 2 to 4 mg/L, with an average of about 3 mg/L.The suspended solids were less than 10 mg/L on most of the days up to day380. Following that the quality decreased in this regard, indicatingchanneling and need for backwash. The decreased quality indicates that a
clarifier would probably be necessary following the upflow unit.
4-25
METC A LF a E D D Y
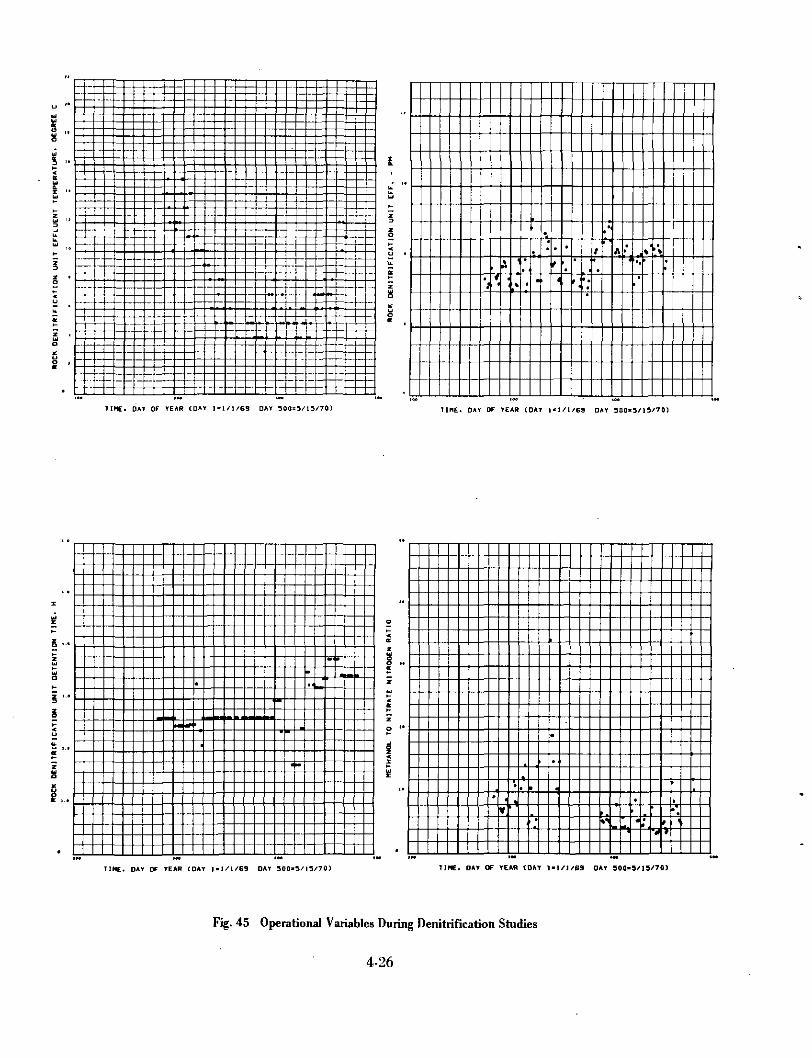
TIME. DAT OF TEAR (DA* 1-1/1/63 DAY 500-3/13/70) TIME. DAY OF TEAR (DAT 1*1/1/69 DAY 300-3/15/70)
TIME. DAT OF TEAR (DAT 1-1/1/69 DAT 300-3/13/70) TINE, DAT OF YEM* tDKI 1-1/1/69 OAT 900-3/15/70)
Fig. 45 Operational Variables During Denitrification Studies
4-26
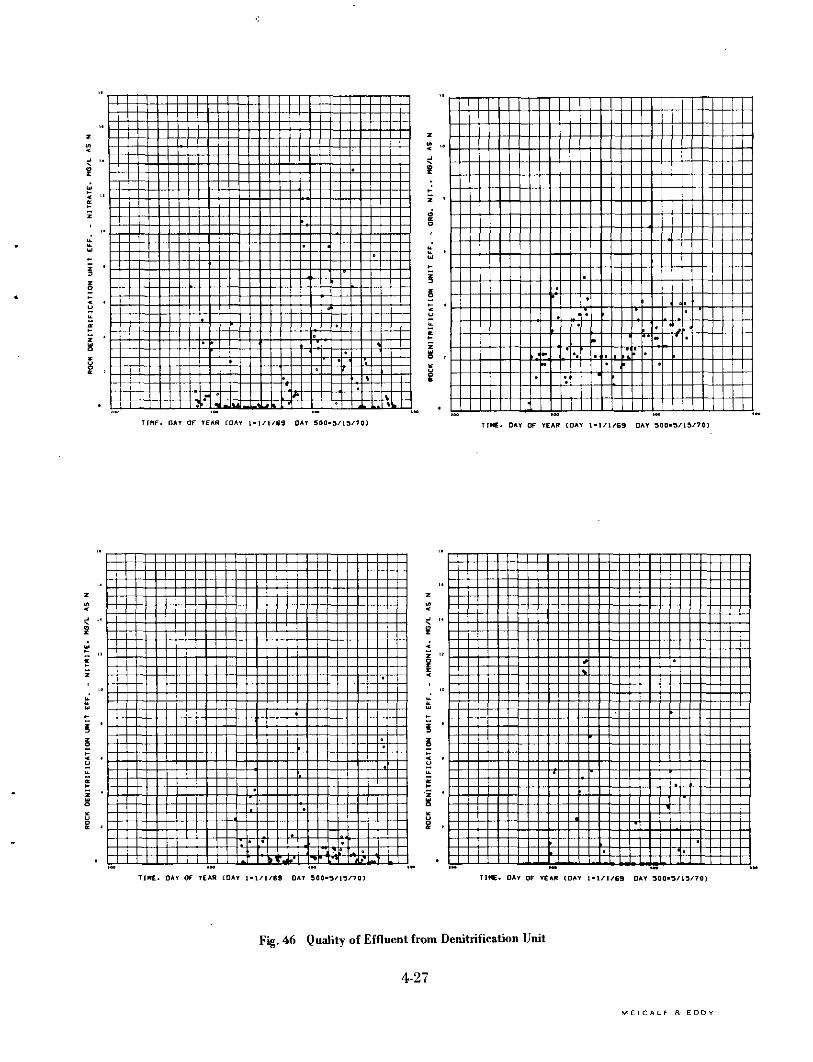
TIME. DAT OF YEAR [DAY 1-1/1/69 DAY 500-3/13/70) TIME. DAY OF YEAR CDAV 1-1/1/63 OAT 500-3/13/70)
TIME. DAY OF YEAH [DAY 1-1/1/69 DAY 500-5/15/70) TIME. DAY OF YEAR COAY 1-1/1/69 DAY 300-3/15/70)
Fig. 46 Quality of Effluent from Denitrification Unit
4-27
M ETC A LF R E D D Y
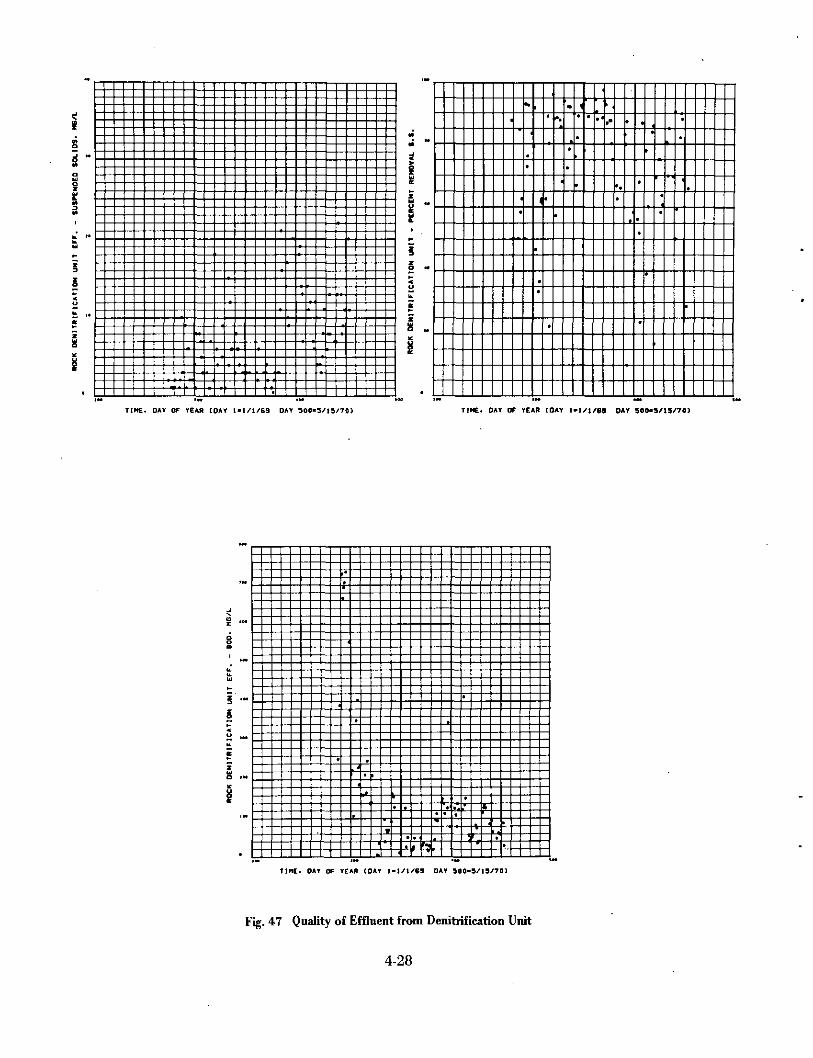
TIHE. OAT OF YEAR IOAY 1*1/1/69 OAT 300-3/13/70) TINE. OAT OF TEAR [DAY ft/1/69 OAT 300-3/13/70)
TIME. OAT OF YEAR (DAT 1-1/1/69 DAY 300-9/19/701
Fig. 47 Quality of Effluent from Denitrification Unit
4-28

The BOD of the denitrified effluent ranged over wide limits, oftenexceeding 100 mg/L and seldom less than 20. Many, but not all, of the highvalues were a result of excessive ratios of methanol to nitrate. For example,during the period of day 400 to 420, the methanol to nitrogen ratioexceeded 5 on only 3 occasions, yet BOD of the effluent exceeded 100 mg/Lon 9 days and never fell below 40 mg/L. These data indicate that either thecontrol of methanol to nitrate ratios was not precisely controlled or thatupflow rock filters are not acceptable units for denitrification.
In Figure 48, performance of the rock filter denitrification unit is
analyzed in terms of operational variables. These data indicate that ratios ofmethanol to nitrate nitrogen of 10 or more to 1 were needed to producedenitrified effluent. Such ratios, of course, are exhorbitant. Neitherdetention time in the range of 2 to 4 hours nor pH in the range of 7 to 8.6appeared to have a decided effect. Temperatures below 8 deg C (45 deg F)were definitely detrimental.
Summary — Denitrification in the upflow filters was not as successful aswould have been expected. Control of methanol must be perfected and morestudies need to be performed in the areas of rate kinetics and effects ofvariables such as pH, temperature, methanol dose, time, and sludgeconcentrations on the rate of denitrification.
On the basis of our studies it would have to be concluded that eitherthe units were channeling, which reduced the detention time and shouldhave been backwashed, or four hours detention at the temperatures and pH'sexperienced were not sufficient to accomplish complete denitrification.These experiences are probably illustrative of problems which would occurin any full scale unit.
Our data indicate a need for clarifiers following the upflow units and onthis basis, the upflow unit appears to be inferior to a completely mixeddenitrification system.
Conclusions
The removal of nitrogen as ammonia by means of air stripping is notpractical in the cold climates because of temperature problems." Severescaling and air pollution would probably make this process unacceptable atany location.
Nitrification has been shown to be a controllable process whenconducted in a separate system. Ammonia concentrations of 0.3 ± 0.3 mg/L
4-29
M E T C A L F ft EDO V
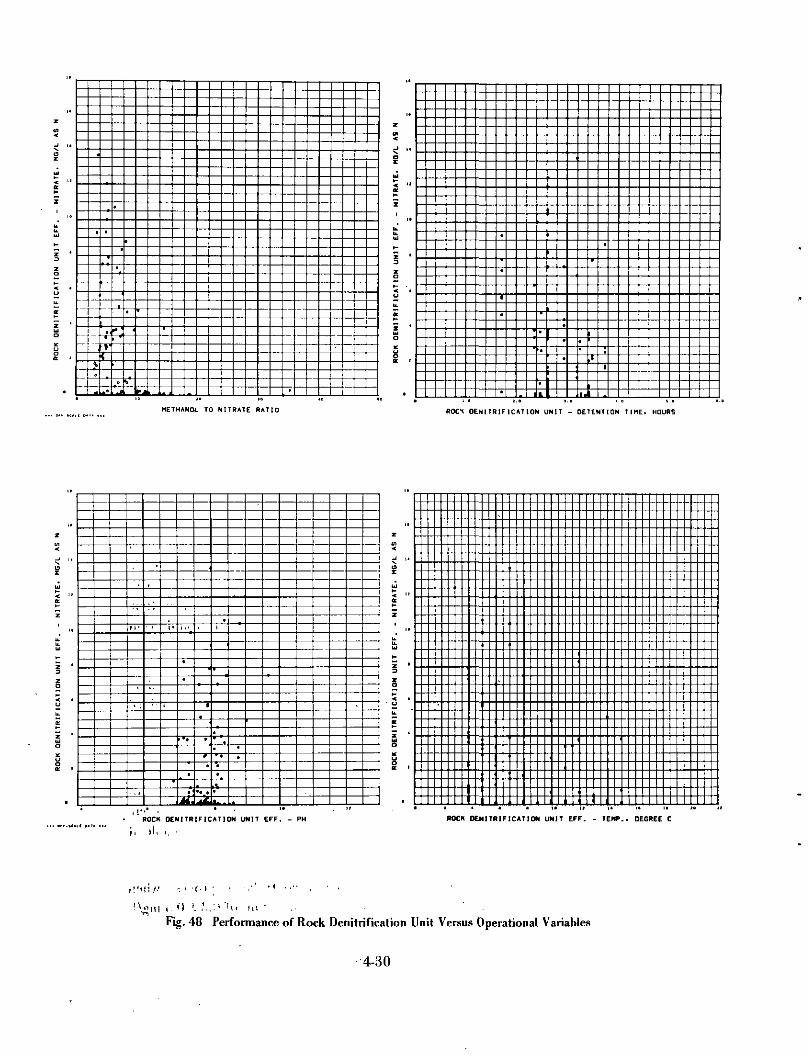
KETHANOL TO NITRATE RATIO ROCt OENITRIF1CATION UNIT - DETENTION TIME. HOURS
X
1 i'
• ;
- . i
,
1 •,i' 1 »•
•
•
>•*
•
.
4.
•
•
•
•• •j&
.i
•
.• .•"**«•
k.
••
—
11
i.
i,
i.
i
.
,
,
•
,•
•
<
- - -
(!.,' . . , . . , . . . 1 . .ROCK OENITR1FICATION UNIT EFF. - PH ROCK DEN1TRIFICAT10N UNIT EFF. - T£KP. . DEGREE C
SM! <• 0 '- - 1 . . : » ' ' ( • in 'Fig. 48 Performance of Rock Denitrification Unit Versus Operational Variables
4-30
in the effluent can be attained if the factors of pH, temperature, time, andMLVSS are considered in the design of the units and DO levels are kept inexcess of 1.0 mg/L. pH and temperature are especially important indetermining the kinetics of the nitrification reaction.
Denitrification in upflow filters was not found to be a controllableprocess under the conditions existing at Marlborough.
4-31
M E T C A L F a EDDY
ACKNOWLEDGMENTS
This research was supported by the Commonwealth of Massachusetts,Water Resources Commission, Division of Water Pollution Control, Grant68-1. Appreciation is acknowledged for the interest shown and thecooperation extended by Mr. Thomas McMahon, Director, and by Messrs.John Elwood and Alfred Ferullo of the Division of Water Pollution Control,and Mr. Harry P. Loftus, Commissioner of Maryborough Public WorksDepartment.
Special appreciation is extended to Mr. John Hartley, Superintendent,and the staff of the Marlborough Easterly Treatment Plant. Their work onthe installation and operation of the various units contributed immeasurablyto the success of this project.
The studies and investigations leading to this report were prepared byMr. Harry E. Wild, Jr., Engineering Asst., assisted in the field by Mr. RobertKimata, chemist, under the direction of the undersigned.
Respectfully submitted,
METCALF& EDDY, INC.
Clair N. SawyerVice PresidentDirector of Research
David A. DuncanVice President
Registered Professional EngineerMassachusetts license No. 6951
APPENDIX
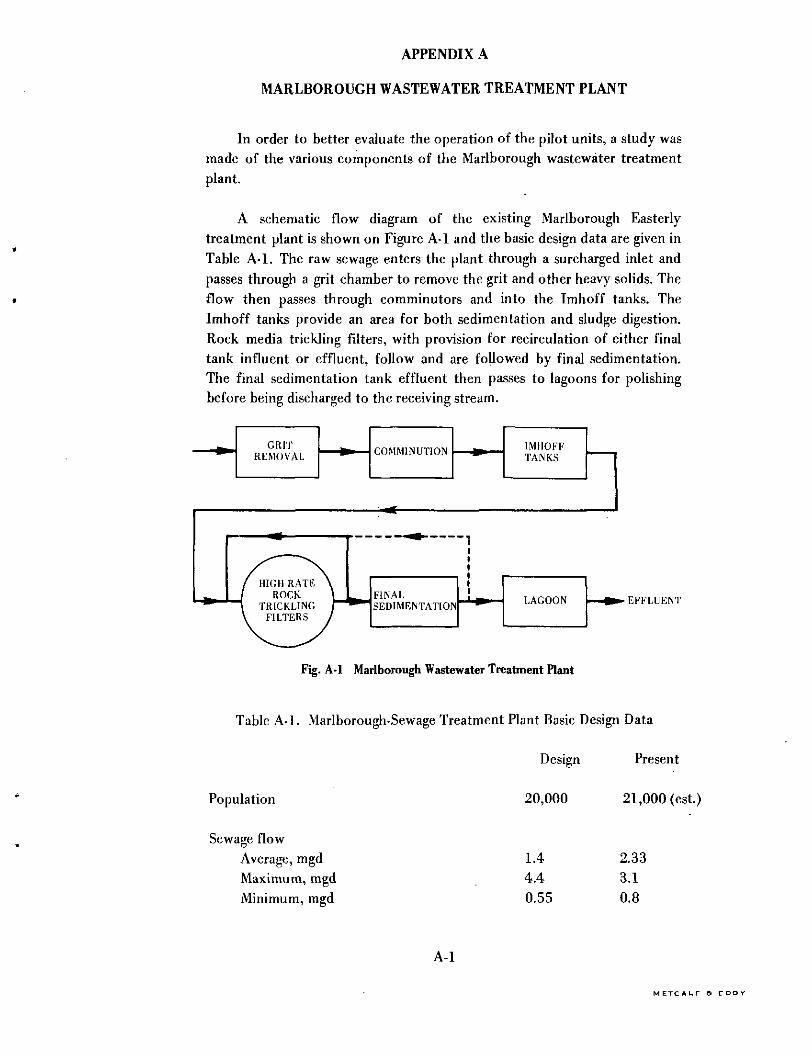
APPENDIX A
MARLBOROUGH WASTEWATER TREATMENT PLANT
In order to better evaluate the operation of the pilot units, a study wasmade of the various components of the Marlborough wastewater treatmentplant.
A schematic flow diagram of the existing Marlborough Easterlytreatment plant is shown on Figure A-l and the basic design data are given inTable A-l. The raw sewage enters the plant through a surcharged inlet andpasses through a grit chamber to remove the grit and other heavy solids. Theflow then passes through comminutors and into the Imhoff tanks. TheImhoff tanks provide an area for both sedimentation and sludge digestion.Rock media trickling filters, with provision for recirculation of either finaltank influent or effluent, follow and are followed by final sedimentation.The final sedimentation tank effluent then passes to lagoons for polishingbefore being discharged to the receiving stream.
HIGH RATEROCK
TRICKLINGFILTERS
FINALSEDIMENTATION
EFFLUENT
Fig. A-l Marlborough Wastewater Treatment Plant
Table A-l. Marlborough-Sewage Treatment Plant Basic Design Data
Design Present
Population
Sewage flowAverage, mgdMaximum, mgdMinimum, mgd
20,000
1.44.40.55
21,000 (est.)
2.333.10.8
A-l
M E T C A L F a EDO Y
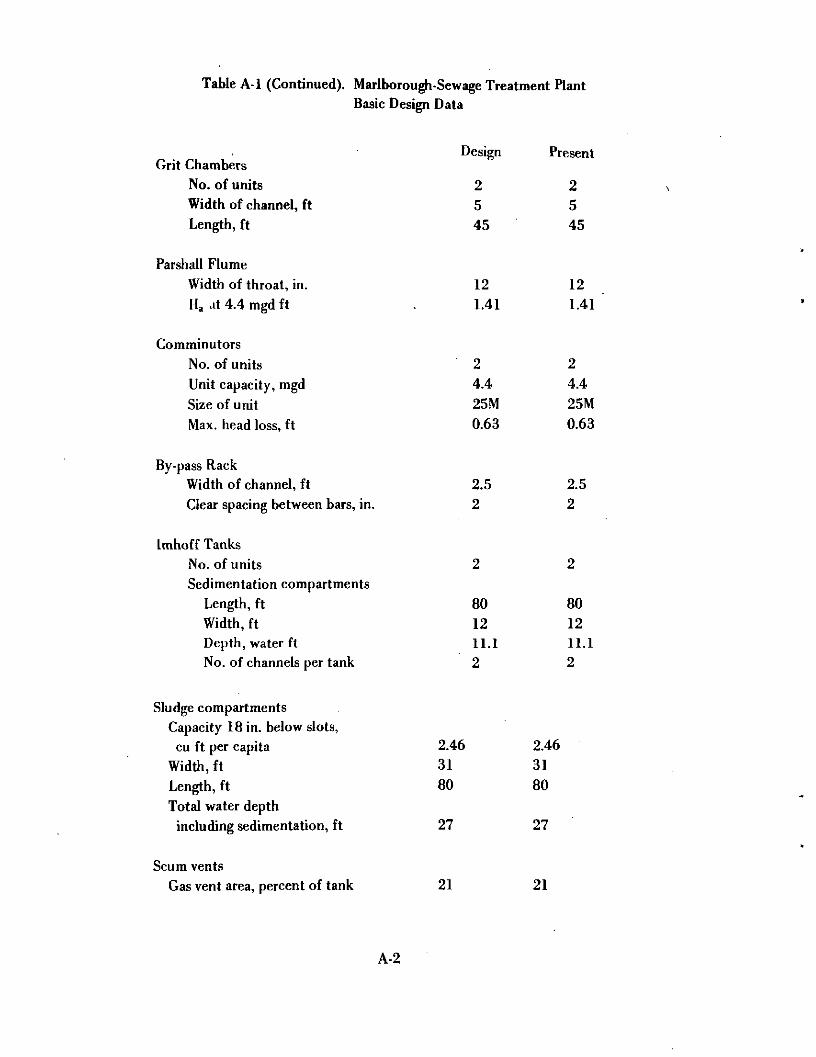
Table A-l (Continued). Marlborough-Sewage Treatment PlantBasic Design Data
Grit ChambersNo. of unitsWidth of channel, ftLength, ft
Par si i all FlumeWidth of throat, in.Ha .»t 4.4 mgd ft
ComminutorsNo. of unitsUnit capacity, mgdSize of unitMax. head loss, ft
By-pass RackWidth of channel, ftClear spacing between bars, in.
Imhoff TanksNo. of unitsSedimentation compartments
Length, ftWidth, ftDepth, water ftNo. of channels per tank
Design
2545
121.41
24.425M0.63
2.52
Present
2545
121.41
24.425M0.63
2.52
801211.12
801211.12
Sludge compartmentsCapacity 18 in. below slots,
cu ft per capitaWidth, ftLength, ftTotal water depth
including sedimentation, ft
Scum ventsGas vent area, percent of tank
2.463180
27
21
2.463180
27
21
A-2

Table A-l (Continued). Maryborough-Sewage Treatment PlantBasic Design Data
Sludge Drying Beds
High Rate Trickling FiltersNumber of unitsDiameter, ftArea provided, sq ftArea provided, acreDepth of stone, ft
Acre feet of stone
Design Present
Existing beds to be used
2646,4400.14860.88
2646,4400.14860.88
Final Settling TanksNo. of unitsArea, sq ftNo. of tanksWidth, ftLength, ftWater capacity, cu ftEffective water depth, ftSludge removalFreeboard, ft
Pumping StationRecirculation, mgd required
2
2,5402168020,3008
22,5402168020,3008
scraper conveyor1.0 1.0
3.0 3.0
Wastewater Flows
Maximum, minimum, and average daily flows for the period of January1, 1969 (day 1) to April 29, 1970 (day 484) are shown on Figure A-2.Although the data shown on Figure A-2 are informative and give outsidelimits, a study of daily data during high flow periods is more revealing. Forexample, for the period of March 23 to April 10, 1969 (day 82-100),maximum flows ranged from 2.85 to 3.10 mgd while minimum flows rangedfrom 2.6 to 2.8 mgd. Average flows did not drop below 2.8 mgd during this18-day period. These data show that there is presently very little variation indiurnal flows during wet periods at Marlborough.
A-3
M E T C A L F f t E D D Y

100 200 300 400 500
TIME, DAY OF YEAR (DAY 1 = 1/1/69 DAY 500 = 5/15/70)
Fig. A-2 Plant Flows and Rainfall
To better indicate the relationship between plant flow and rainfall, therainfall is plotted below the data on Figure A-2. During low groundwatertable periods, February 9-March 11, 1969 and April 30-October 27, 1969(day 40-70 and day 120-300) the rain had little effect upon the minimumplant flow. However, when the groundwater was high because of rains,March 20 - April 20, 1969, December 6 - December 26, 1969, and January25 - February 13, 1970 (day 79-110, day 340-360, and day 390-410), theadditional rainfall exerted a major effect upon the flow.
During periods of high groundwater, the infiltration into the collection
system causes the inadequate main trunk sewer to overflow at variouslocations. Contract documents for the replacement of the main trunk sewerhave been completed and are now under review by the Division of WaterPollution Controlof the Water Resources Commission.
A-4
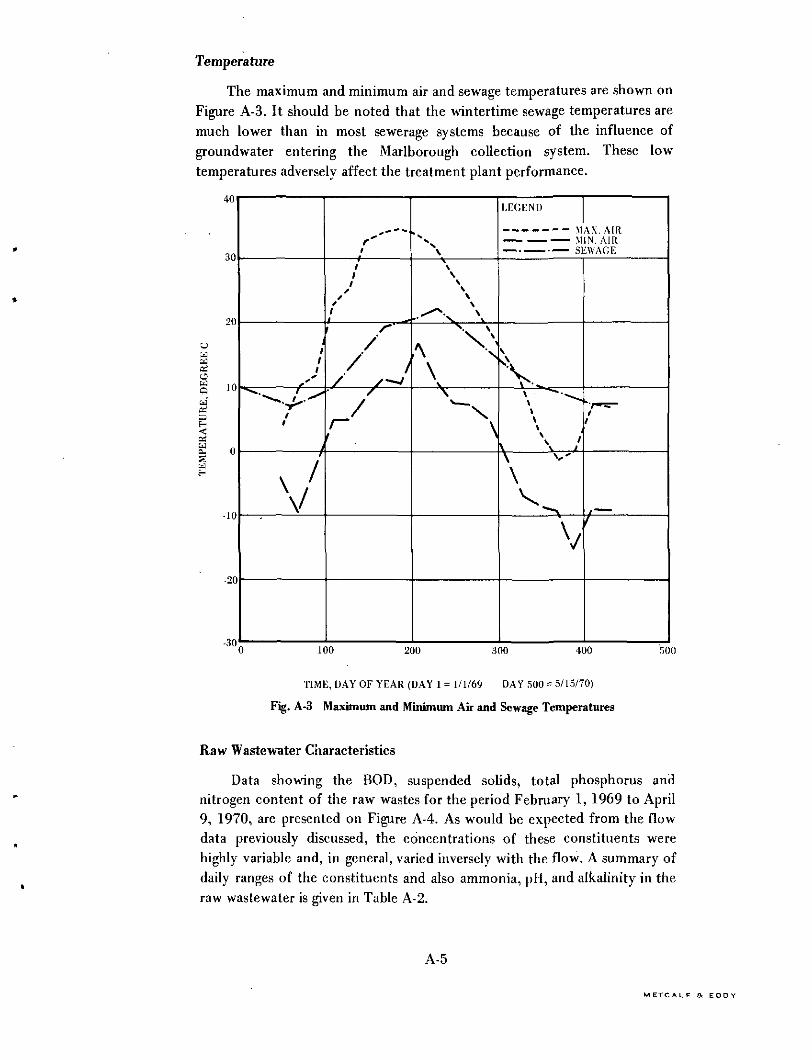
Temperature
The maximum and minimum air and sewage temperatures are shown onFigure A-3. It should be noted that the wintertime sewage temperatures aremuch lower than in most sewerage systems because of the influence ofgroundwater entering the Marlborough collection system. These lowtemperatures adversely affect the treatment plant performance.
Daaasowcia'etfa<oiuQ-EId
40
SO
i
1S
v7
0 1
f"1
111
1 —r /"'/
/ S'~~J
'
)0 2
XN\\
\\\\
*, ^\\\
\
)0 3
LEGEND
-,-,-_ . r-— „- , ̂ ^_ C'
V .V ^'^
\\\ ;\ V '\ *"'\
^\
V
DO 4
IV. AIR:WAGE
/~~~f
)0 50
TIME, DAY OF YEAR (DAY 1 = 1/1/69 DAY 500 = 5/15/70)
Fig. A-3 Maximum and Minimum Air and Sewage Temperatures
Raw Wastewater Characteristics
Data showing the BOD, suspended solids, total phosphorus andnitrogen content of the raw wastes for the period February 1, 1969 to April9, 1970, are presented on Figure A-4. As would be expected from the flowdata previously discussed, the concentrations of these constituents werehighly variable and, in general, varied inversely with the flow. A summary ofdaily ranges of the constituents and also ammonia, pH, and alkalinity in theraw wastewater is given in Table A-2.
A-5
M ETC ALF & E D D Y
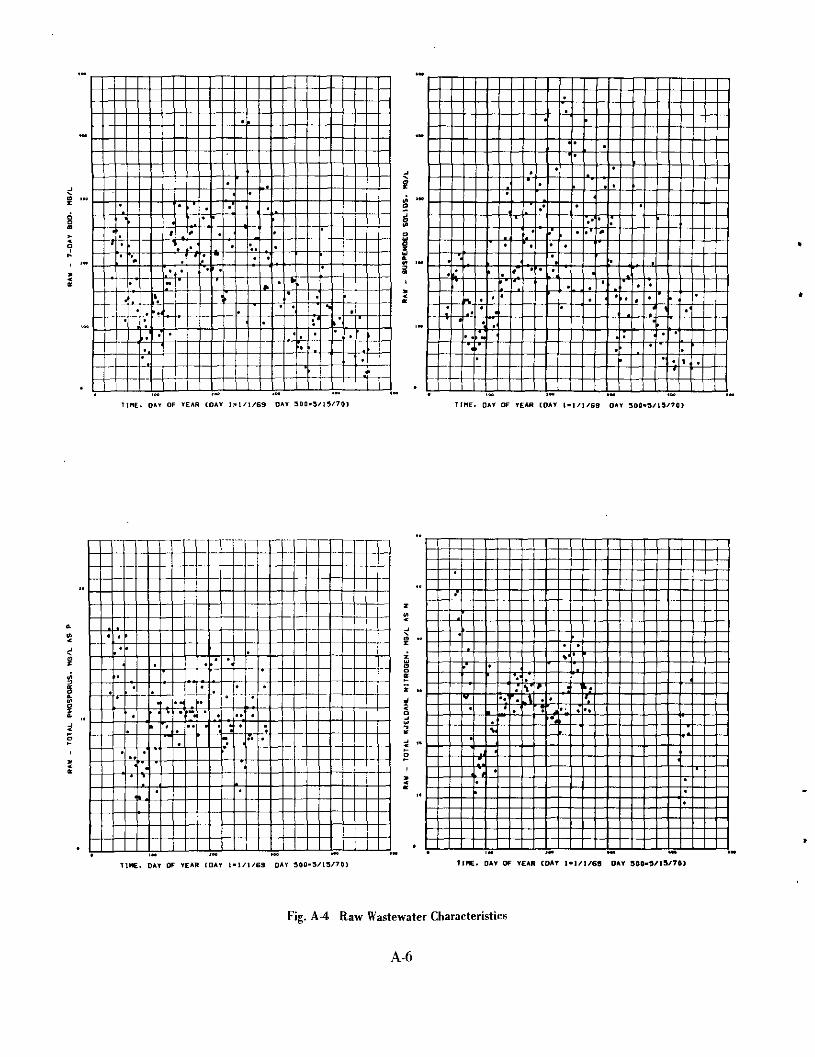
~^l"
Tint. DAY OF TEAR COAT 1-1/1/69 OAT 300-3/15/70) TIME. OAT OF TEAH (DAY 1-1/1/69 OAT 300*3/13/70)
TIME. DAT OF TEAR COAT 1-1/1/63 OAT 300-3/13/70) TIME. DAT OF TEAR COAT l*]/l/6fl OAT 300-3/13/70)
Fig. A-4 Raw Wastewaler Characteristics
A-6
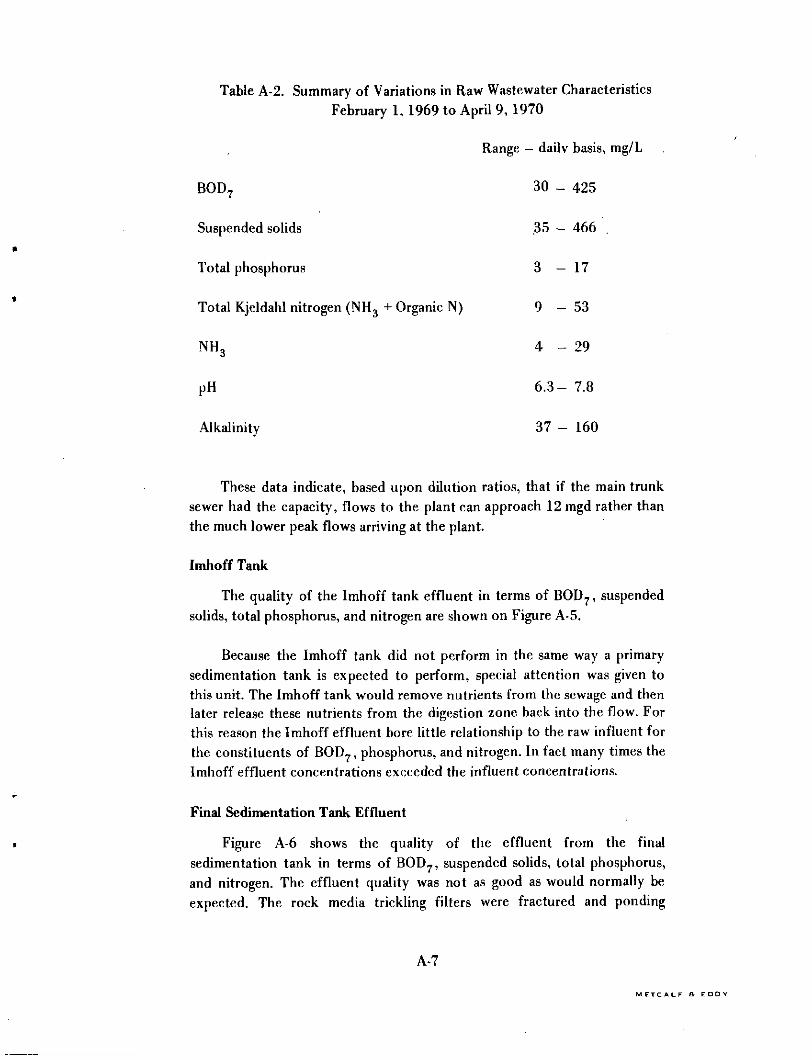
Table A-2. Summary of Variations in Raw Wastewater CharacteristicsFebruary 1, 1969 to April 9, 1970
Range — daily basis, mg/L
BOD? 30 - 425
Suspended solids 35 — 466 .
Total phosphorus 3 — 17
Total Kjeldahl nitrogen (NH3 + Organic N) 9 - 5 3
N H 3 4 - 2 9
pH 6.3- 7.8
Alkalinity 37 - 160
These data indicate, based upon dilution ratios, that if the main trunksewer had the capacity, flows to the plant can approach 12 mgd rather thanthe much lower peak flows arriving at the plant.
Imhoff Tank
The quality of the Imhoff tank effluent in terms of BOD7, suspendedsolids, total phosphorus, and nitrogen are shown on Figure A-5.
Because the Imhoff tank did not perform in the same way a primarysedimentation tank is expected to perform, special attention was given tothis unit. The Imhoff tank would remove nutrients from the sewage and thenlater release these nutrients from the digestion zone back into the flow. Forthis reason the Imhoff effluent bore little relationship to the raw influent forthe constituents of BOD?, phosphorus, and nitrogen. In fact many times theImhoff effluent concentrations exceeded the influent concentrations.
Final Sedimentation Tank Effluent
Figure A-6 shows the quality of the effluent from the finalsedimentation tank in terms of BOD-,, suspended solids, total phosphorus,and nitrogen. The effluent quality was not as good as would normally beexpected. The rock media trickling filters were fractured and ponding
A-7
M E T C a L F f t E D D Y
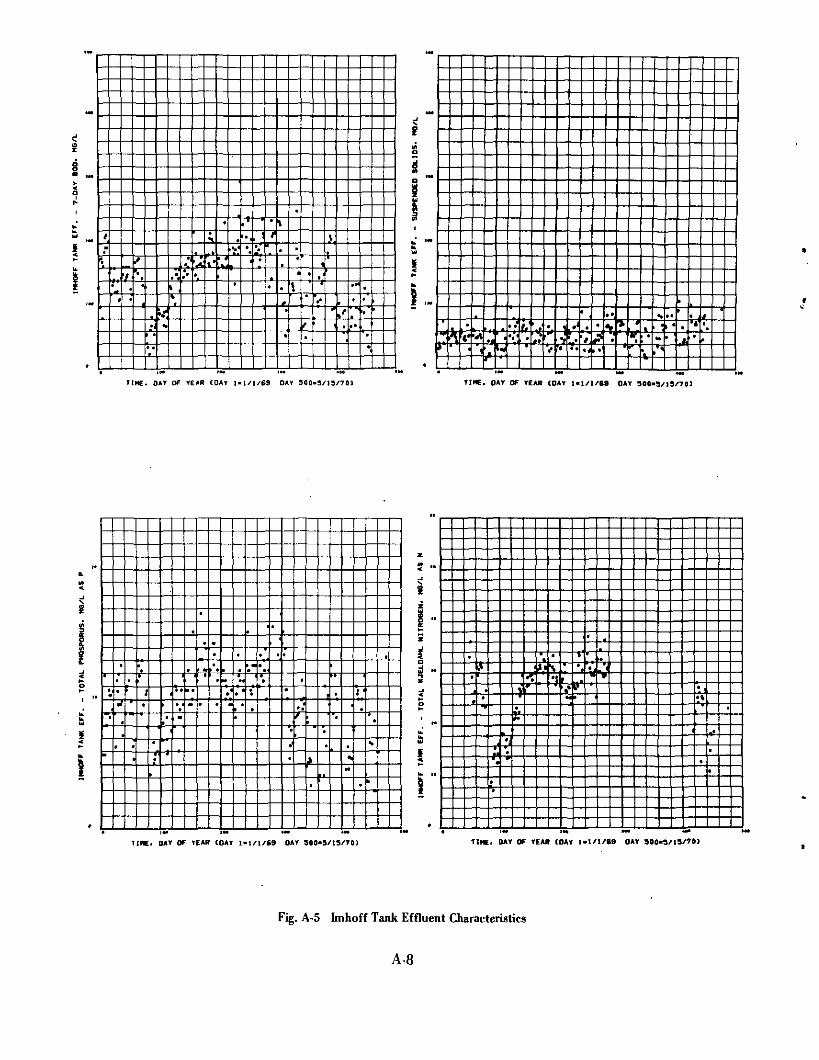
e."
*
'/
•
/
«i
i ••̂•.
i\
A
»̂tt >
•a
,V
*
*,
l
'1
*
'a.
•
1
•,
.
t•
*
•
•*
•
\
•
r-
i,̂1
<,/.,
•*•1 i,
••
^
4**
V
sJ
IH
S
1
uUl
ii-u.
,-
.
1
\•.*
1
§
^1
1
«(*«'
f,'1
*
*
t,J
••
,
,
**<
*
r*•'
..> »
1
*".
4̂
M
'»
,
•
'
.
1*
TINE. DAY OF YEAR COAT 1-1/1/69 DAV 900-9/13/701 TINE, OAT OF TEAR (OAT 1-1/1/69 OAT 900-3/13/70)
3
M^
TINE. OA1 OF TEAR (OAT 1-1/1/69 OAT 300-3/13/70) TINE. DAV OF TEAR (OAT 1-1/1/88 OAT 900-3/19/70)
Fig. A-5 Imhoff Tank Effluent Characteristics
A-8
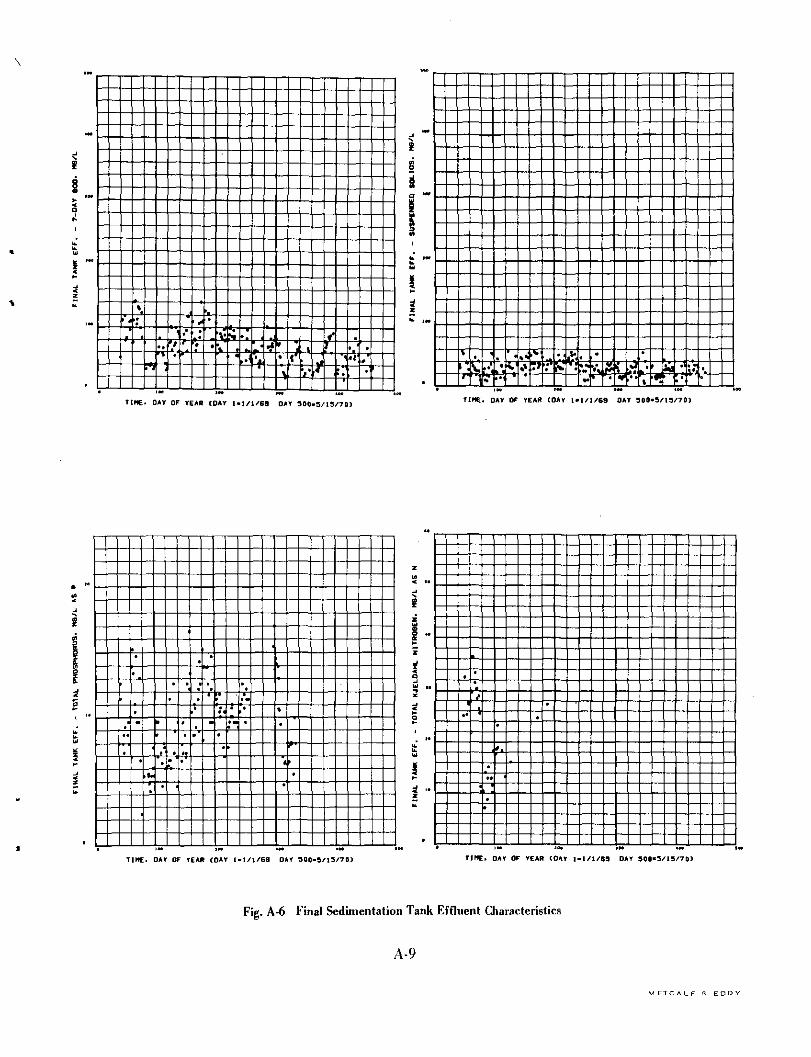
.-a* ~™ I***1W
TIHE. D*r OF TEAR fDAT l-t/1/69 OAT 300-3/13/70) TINE. OAT OF TEAR (OAT 1-1/1/69 OAT 300-3/13/70)
TIME. OAT OF TEAR (OAT 1-1/1/69 DAY 300-9/15/70) OAT OF YEAR (OAT 1-1/1/69 DAY 300-3/13/70)
Fig. A-6 Final Sedimentation Tank Effluent Characteristics
A-9
M ETC A l _ F n E D R V

occurred during periods of the year. Because of the high flow to the plant,recirculation was not practiced on a continuous basis.
The flow through the existing treatment plant sedimentation tanksapproached and sometimes suprassed the design flows and the removal ofsuspended solids suffered because of this.
Final Lagoon Effluent
In the final analysis, the quality of the final effluent as discharged tothe receiving stream is the most important consideration. Limited data wereobtained on the effluent discharged from the plant to the receiving stream.Figure A-7 shows the effluent quality in terms of suspended solids andBOD7.
In general, the best quality effluent was produced during the high flowperiods (low influent concentration periods) when the trickling filter wasproducing effluents with the lowest BOD?.
The percentage removals of both suspended solids and BOD? from theraw waste to the oxidation pond effluent are presented on Figure A-7.
The best overall percentage removals were during times of low ornormal flow conditions (high influent concentrations), and the removalsdeteriorated during periods of high flow and low influent concentrations.
A-10
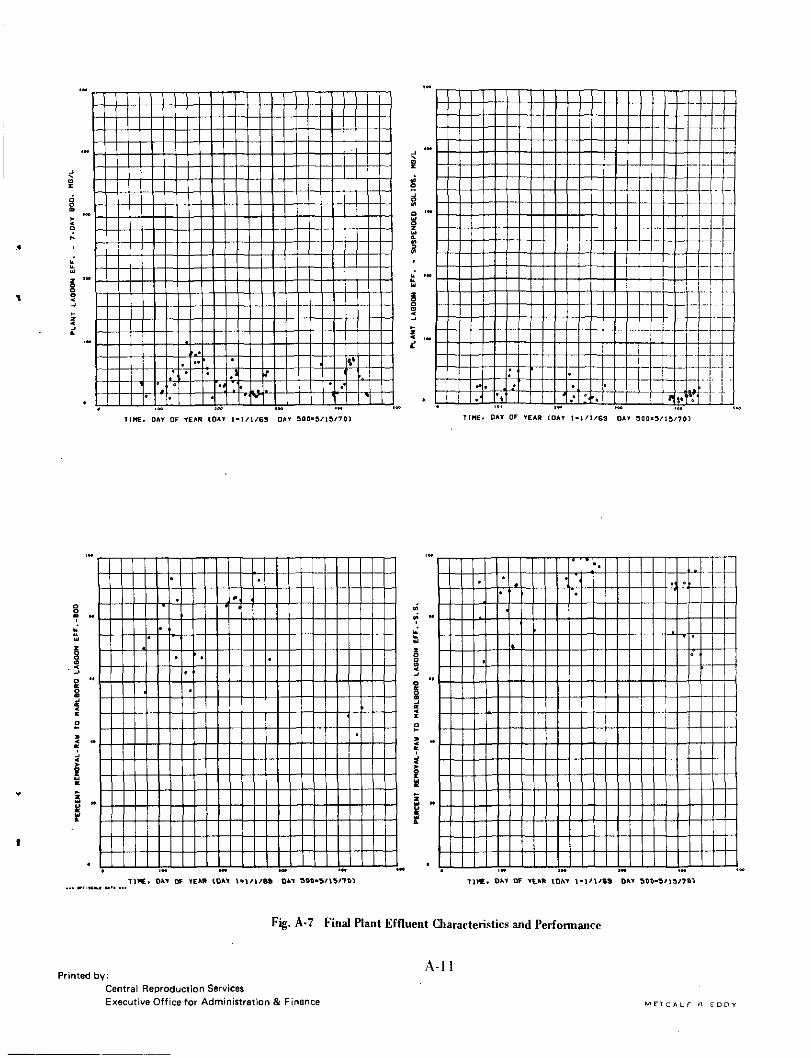
IIHE. DAT OF YEAR COAT 1-1/1/69 DAT SOO-3/13/70) TIME. OAT OF YEAR [DAY 1-1/1/63 OAT 300-3/13/701
OAf W TEAR UJfct . Olif Of YtAB IDAl 1-1/1/63 DAf 500-5/13/70)
Fig. A-7 Final Plant Effluent Characteristics and Performance
Printed by:A-l l
Central Reproduction ServicesExecutive Office for Administration & Finance M FT C A L F ' * F D D V