modernizing wisconsin’s dairy farms train the trainer workshop june 20 – 21, 2002 dairy...
TRANSCRIPT
Modernizing Wisconsin’sDairy Farms
Train the Trainer Workshop
June 20 – 21, 2002
Dairy Expansion Financial Case Studiesby
Scott Gunderson, Manitowoc County UW-Extension Dairy Agent
and
Tina Struyk, Sheboygan County UW-Extension Dairy & Livestock Agent
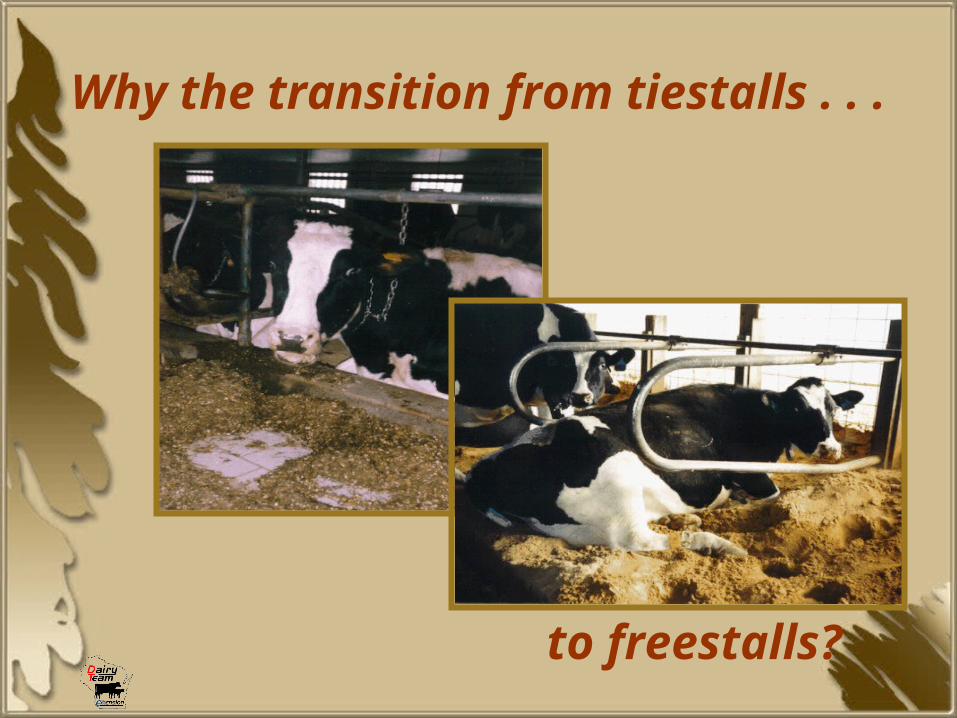
Why the transition from tiestalls . . .
to freestalls?
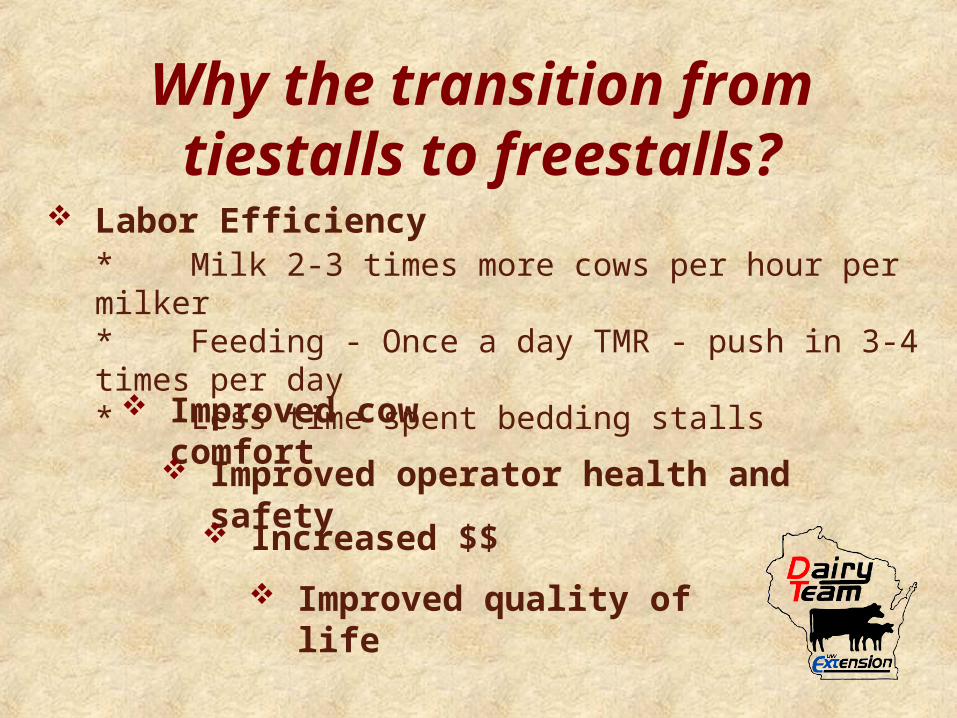
Why the transition fromtiestalls to freestalls?
Labor Efficiency* Milk 2-3 times more cows per hour per milker* Feeding - Once a day TMR - push in 3-4 times per day* Less time spent bedding stalls
Improved cow comfort Improved operator health and
safety Increased $$
Improved quality of life
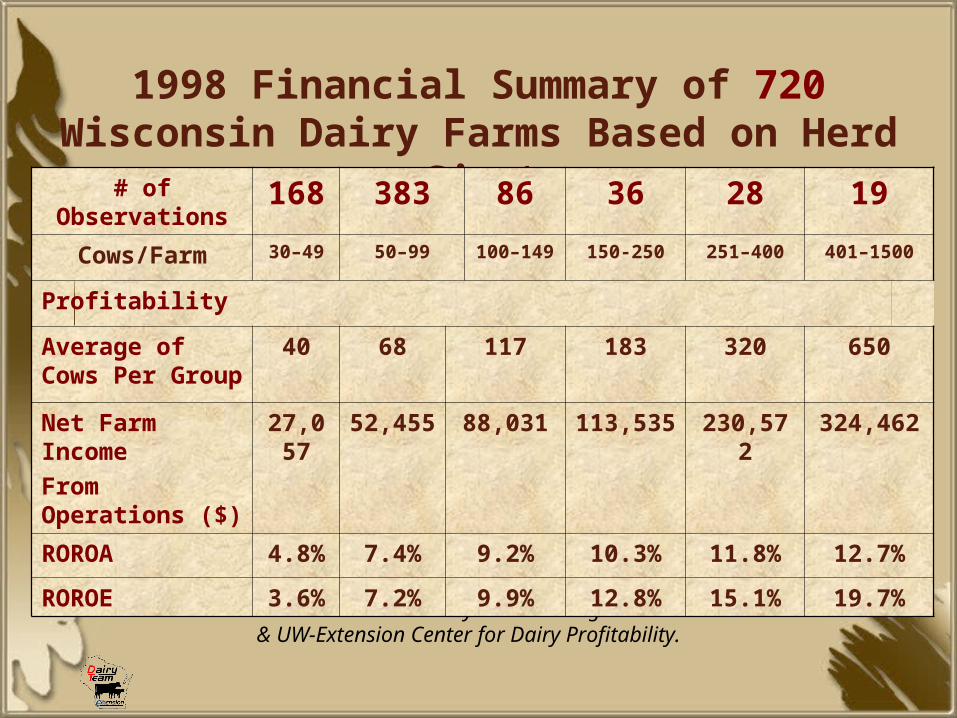
1Source: Lakeshore and Fox Valley Farm Management Associations & UW-Extension Center for Dairy Profitability.
1998 Financial Summary of 720Wisconsin Dairy Farms Based on Herd
Size1# of Observations
168 383 86 36 28 19
Cows/Farm 30–49 50–99 100–149
150-250 251–400 401–1500
Profitability
Average of Cows Per Group
40 68 117 183 320 650
Net Farm IncomeFrom Operations ($)
27,057
52,455
88,031 113,535
230,572
324,462
ROROA 4.8% 7.4% 9.2% 10.3% 11.8% 12.7%
ROROE 3.6% 7.2% 9.9% 12.8% 15.1% 19.7%
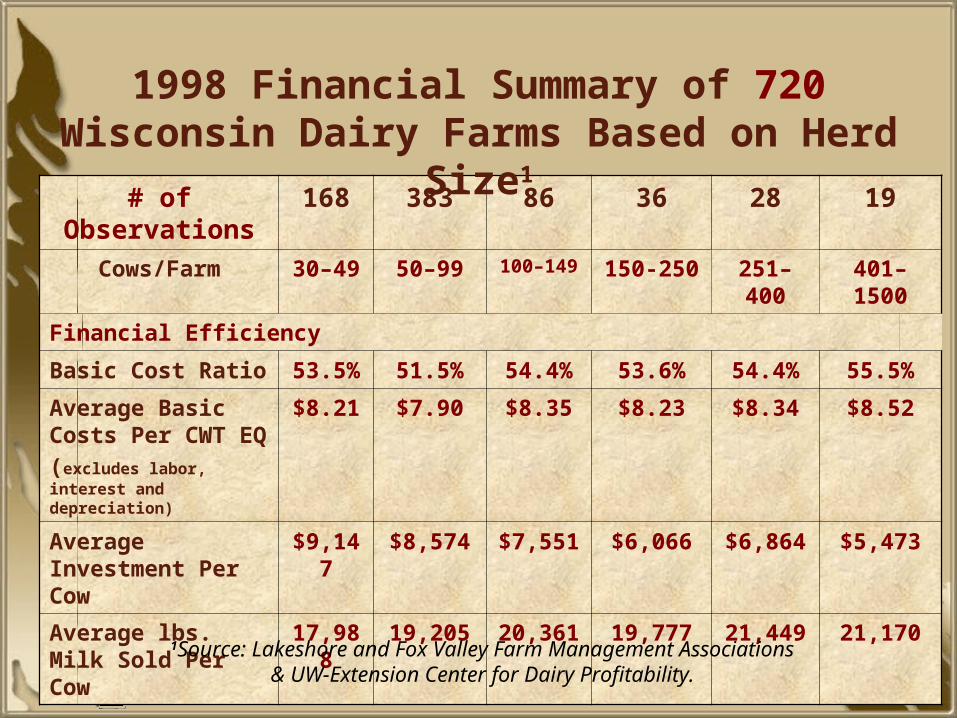
# of Observations
168 383 86 36 28 19
Cows/Farm 30–49 50–99 100–149
150-250
251–400
401–1500
Financial Efficiency
Basic Cost Ratio 53.5%
51.5% 54.4% 53.6% 54.4% 55.5%
Average Basic Costs Per CWT EQ (excludes labor, interest and depreciation)
$8.21 $7.90 $8.35 $8.23 $8.34 $8.52
Average Investment Per Cow
$9,147
$8,574 $7,551
$6,066 $6,864 $5,473
Average lbs. Milk Sold Per Cow
17,988
19,205 20,361
19,777 21,449 21,170
1Source: Lakeshore and Fox Valley Farm Management Associations & UW-Extension Center for Dairy Profitability.
1998 Financial Summary of 720Wisconsin Dairy Farms Based on Herd
Size1
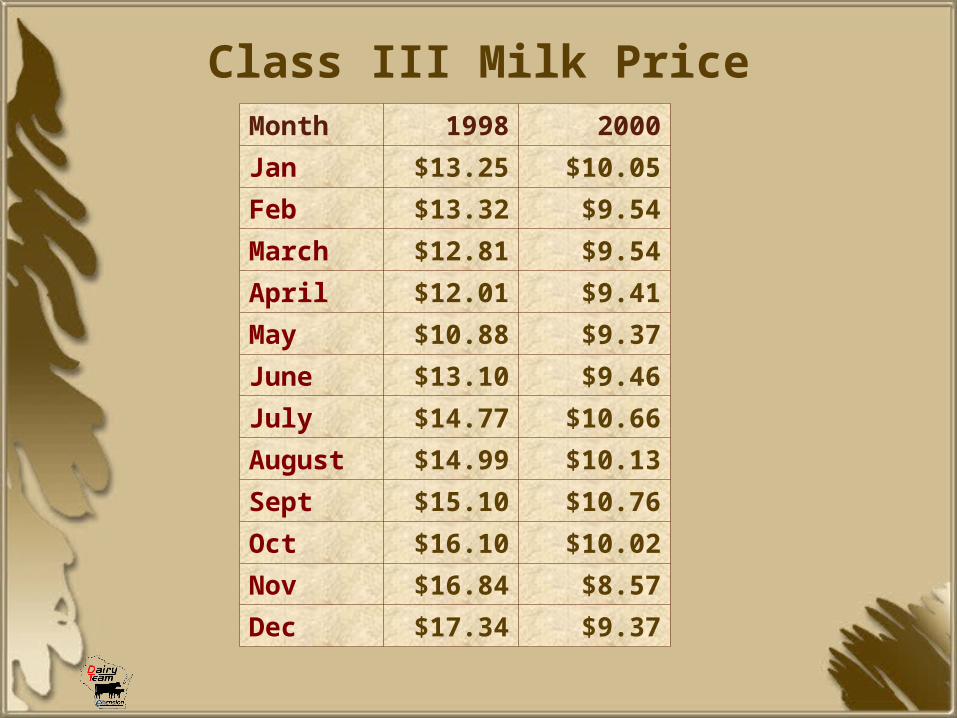
Class III Milk PriceMonth 1998 2000
Jan $13.25 $10.05
Feb $13.32 $9.54
March $12.81 $9.54
April $12.01 $9.41
May $10.88 $9.37
June $13.10 $9.46
July $14.77 $10.66
August $14.99 $10.13
Sept $15.10 $10.76
Oct $16.10 $10.02
Nov $16.84 $8.57
Dec $17.34 $9.37
1Source: Lakeshore and Fox Valley Farm Management Associations & UW-Extension Center for Dairy Profitability.
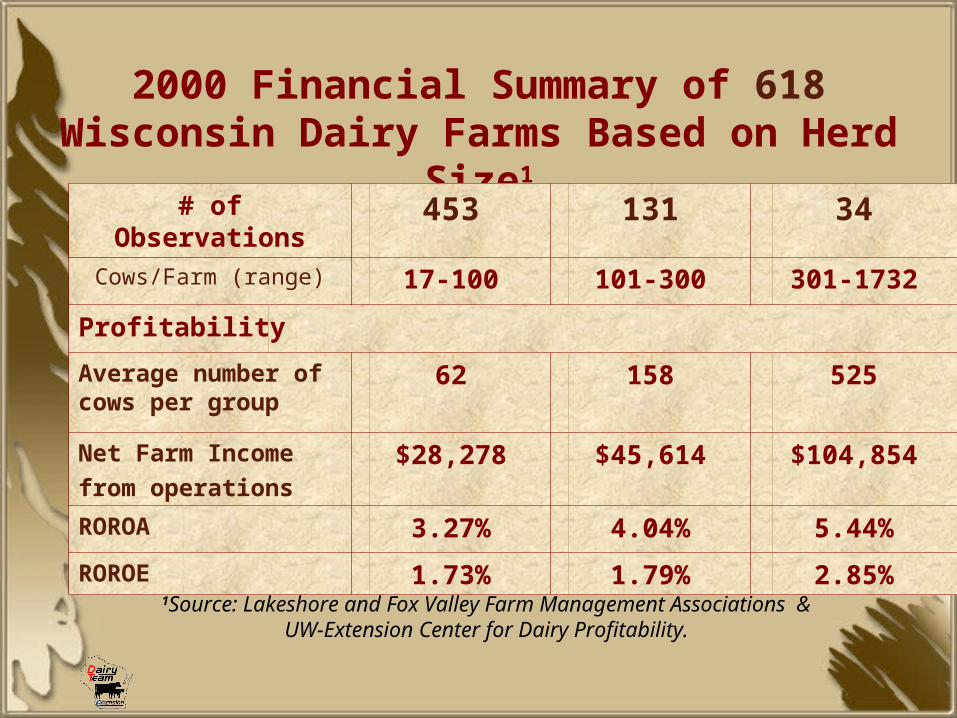
2000 Financial Summary of 618Wisconsin Dairy Farms Based on Herd
Size1# of
Observations453 131 34
Cows/Farm (range) 17-100 101-300 301-1732
Profitability
Average number of cows per group
62 158 525
Net Farm Incomefrom operations
$28,278 $45,614 $104,854
ROROA 3.27% 4.04% 5.44%
ROROE 1.73% 1.79% 2.85%
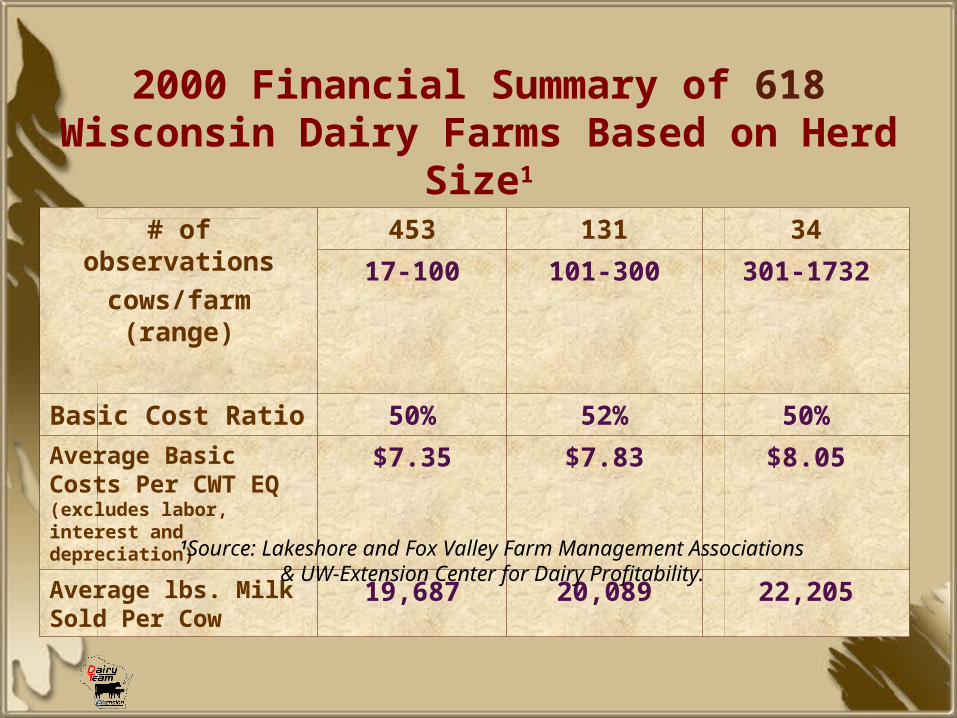
# of observations
cows/farm (range)
453 131 34
17-100 101-300 301-1732
Basic Cost Ratio 50% 52% 50%
Average Basic Costs Per CWT EQ (excludes labor, interest and depreciation)
$7.35 $7.83 $8.05
Average lbs. Milk Sold Per Cow
19,687 20,089 22,205
2000 Financial Summary of 618Wisconsin Dairy Farms Based on Herd
Size1
1Source: Lakeshore and Fox Valley Farm Management Associations & UW-Extension Center for Dairy Profitability.
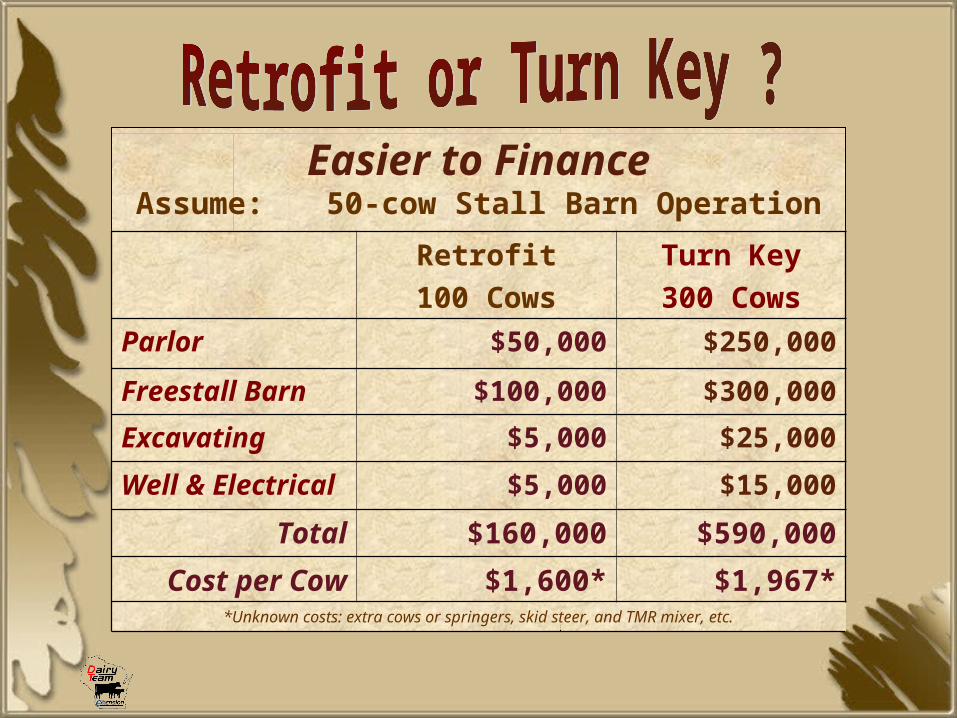
Easier to FinanceAssume: 50-cow Stall Barn Operation
Retrofit100 Cows
Turn Key300 Cows
Parlor $50,000 $250,000
Freestall Barn $100,000 $300,000
Excavating $5,000 $25,000
Well & Electrical
$5,000 $15,000
Total $160,000 $590,000
Cost per Cow $1,600* $1,967**Unknown costs: extra cows or springers, skid steer, and TMR mixer, etc.
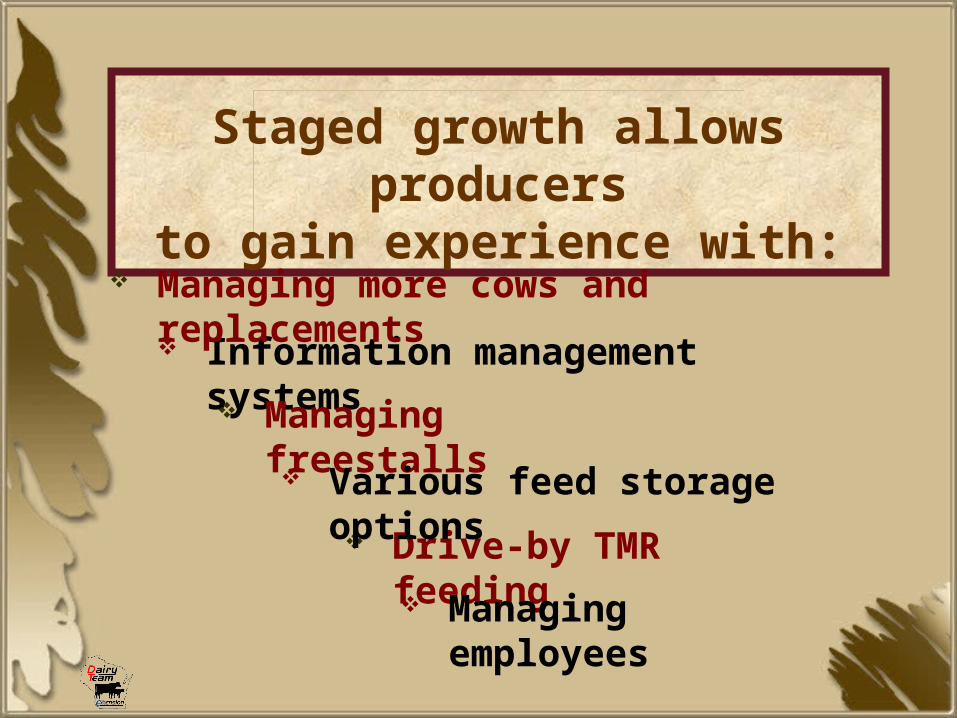
Staged growth allows producers
to gain experience with:
Information management systems Managing
freestalls
Managing more cows and replacements
Drive-by TMR feeding
Various feed storage options
Managing employees
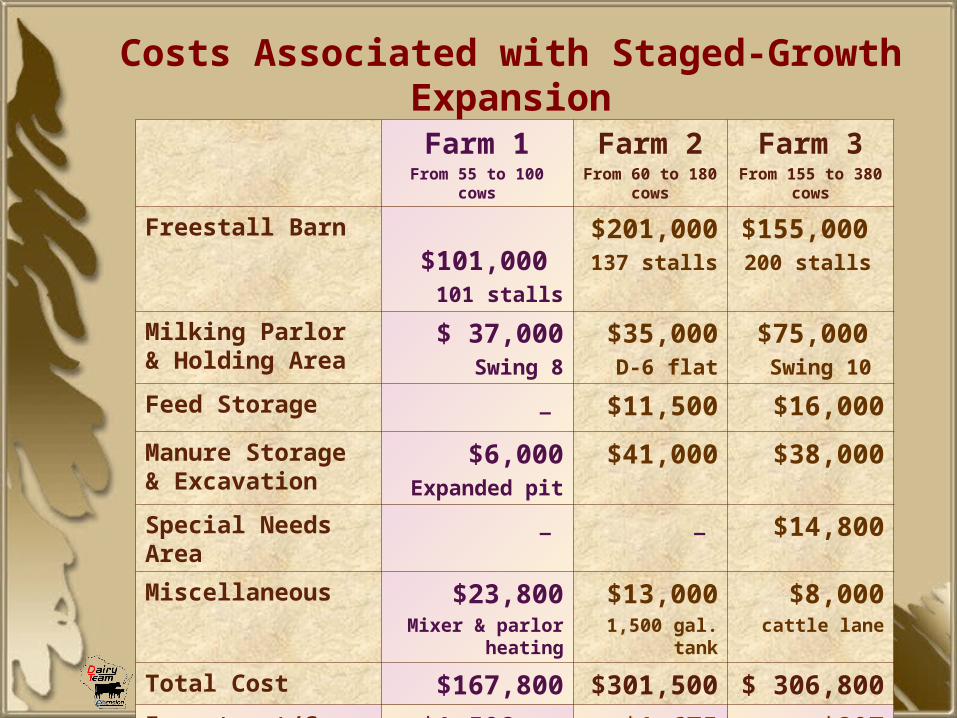
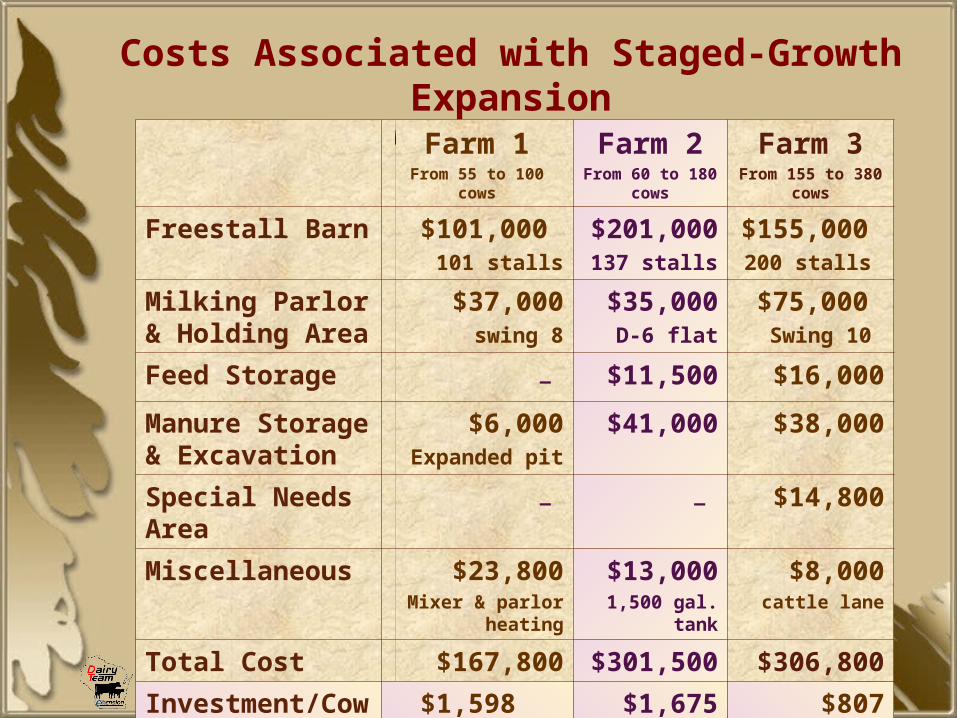
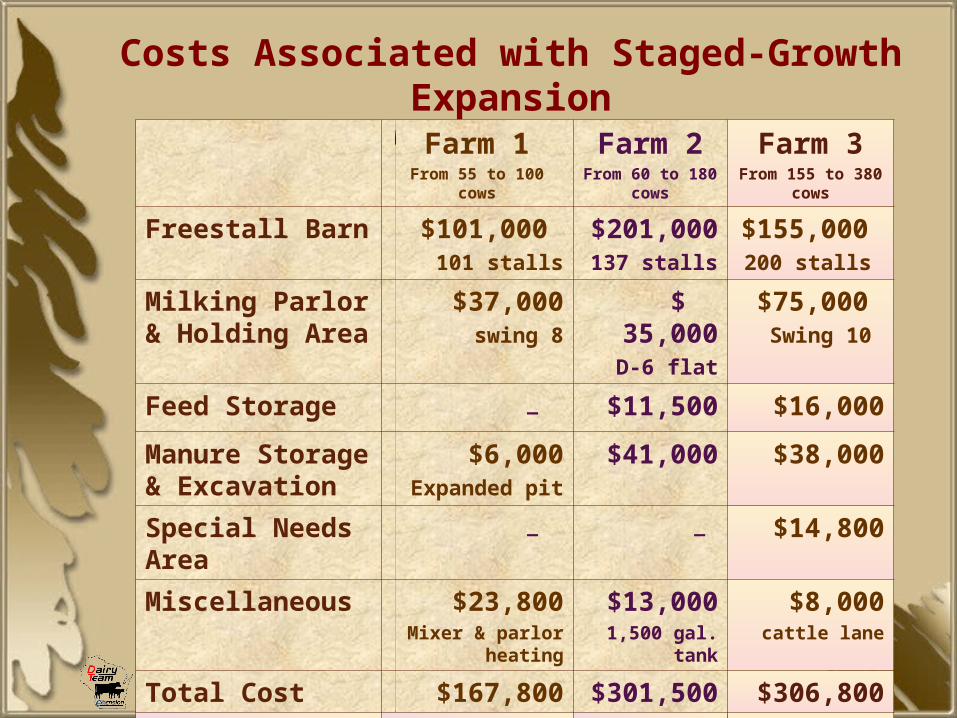
Costs Associated with Staged-Growth Expansion
(Manitowoc County Dairy Farms)Farm 1From 55 to 100
cows
Farm 2From 60 to 180 cows
Farm 3From 155 to
380 cows
Freestall Barn $101,000 101 stalls
$201,000
137 stalls
$155,000
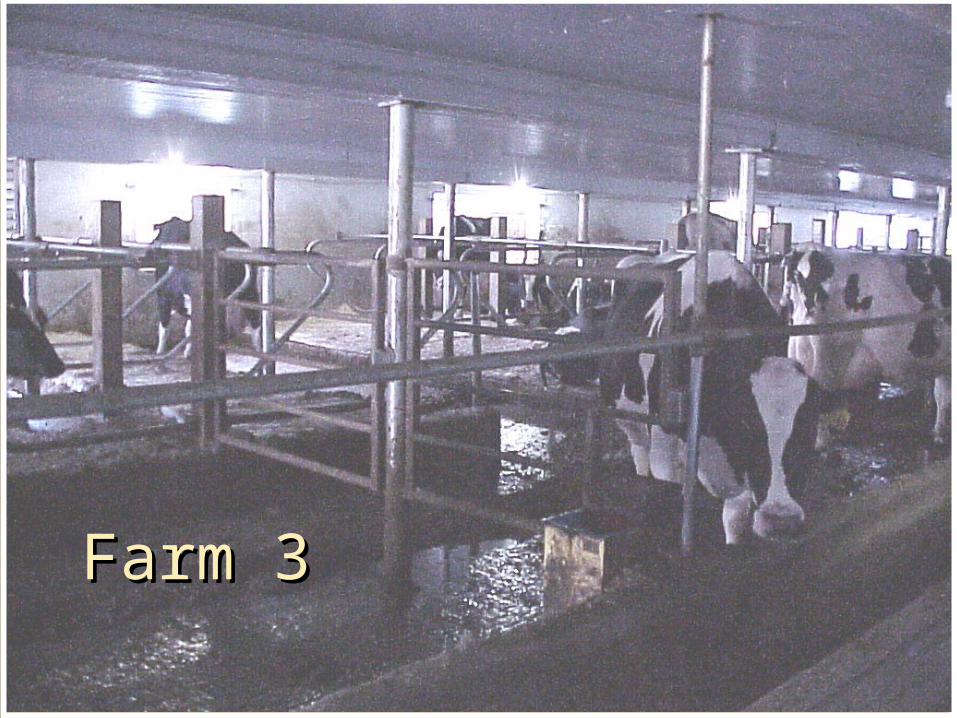
200 stalls
Milking Parlor & Holding Area
$ 37,000Swing 8
$35,000D-6 flat
$75,000 Swing 10
Feed Storage _ $11,500 $16,000
Manure Storage & Excavation
$6,000Expanded pit
$41,000 $38,000
Special Needs Area
_ _ $14,800
Miscellaneous $23,800Mixer & parlor
heating
$13,0001,500 gal.
tank
$8,000cattle lane
Total Cost $167,800 $301,500
$ 306,800
Investment/Cow $1,598 $1,675 $807
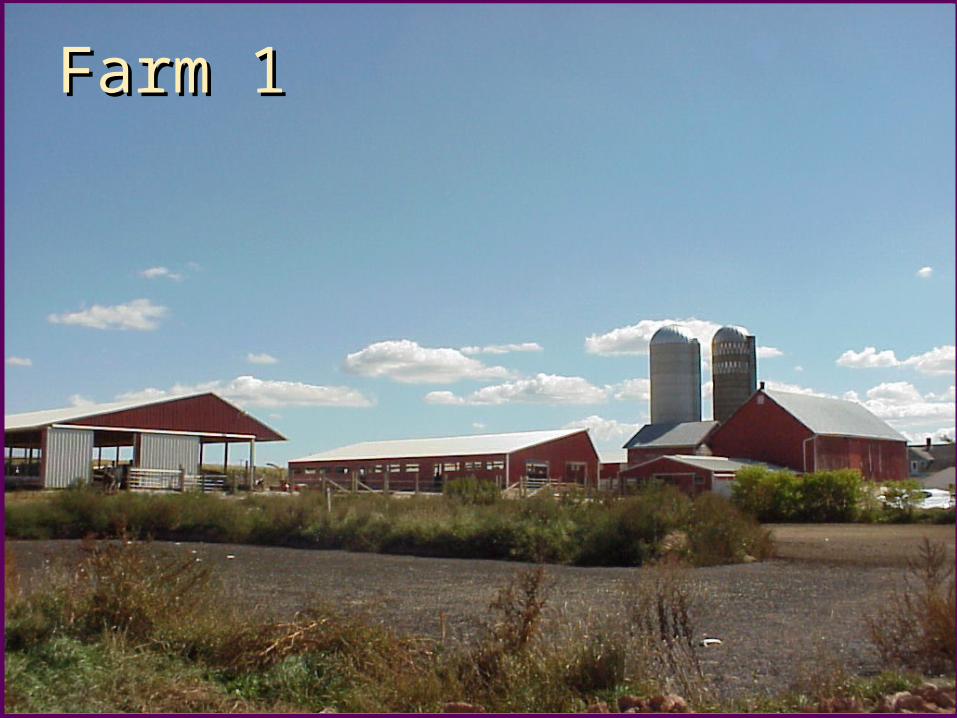
Farm 1Farm 1
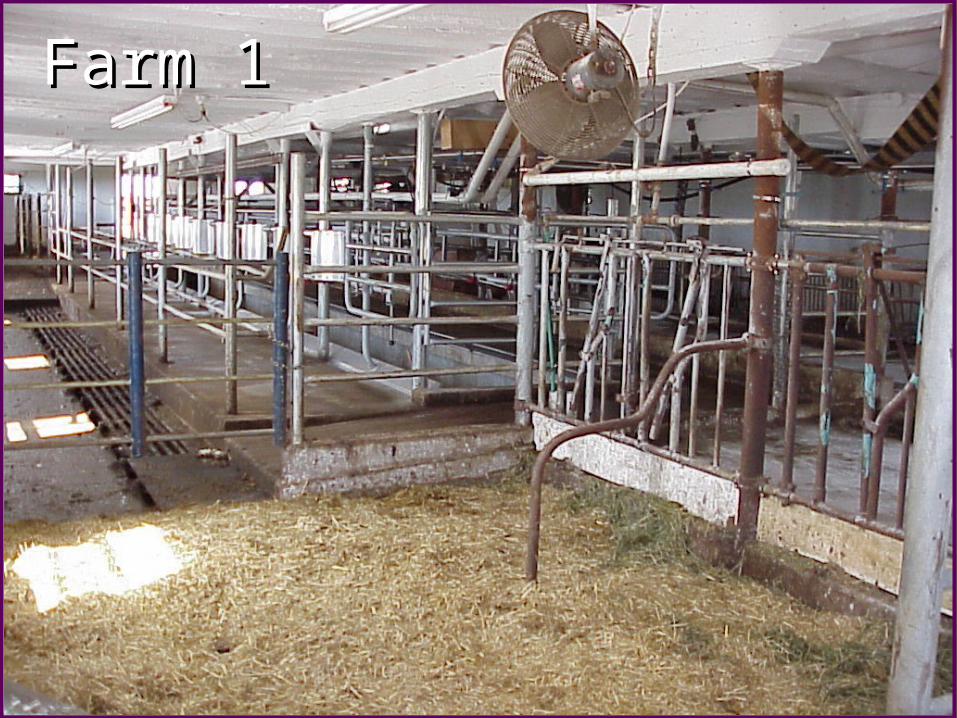
Farm 1Farm 1
Costs Associated with Staged-Growth Expansion
(Manitowoc County Dairy Farms)Farm 1From 55 to 100
cows
Farm 2From 60 to 180 cows
Farm 3From 155 to
380 cows
Freestall Barn $101,000 101 stalls
$201,000
137 stalls
$155,000
200 stalls
Milking Parlor & Holding Area
$37,000swing 8
$35,000D-6 flat
$75,000 Swing 10
Feed Storage _ $11,500 $16,000
Manure Storage & Excavation
$6,000Expanded pit
$41,000 $38,000
Special Needs Area
_ _ $14,800
Miscellaneous $23,800Mixer & parlor
heating
$13,0001,500 gal.
tank
$8,000cattle lane
Total Cost $167,800 $301,500
$306,800
Investment/Cow
$1,598 $1,675 $807
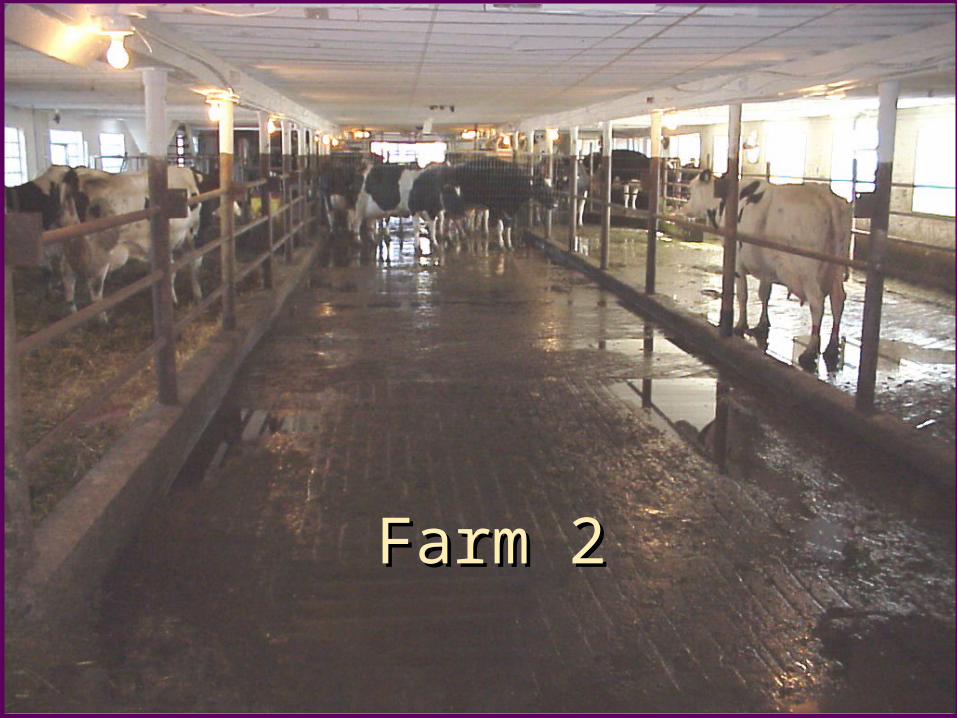
Farm 2Farm 2
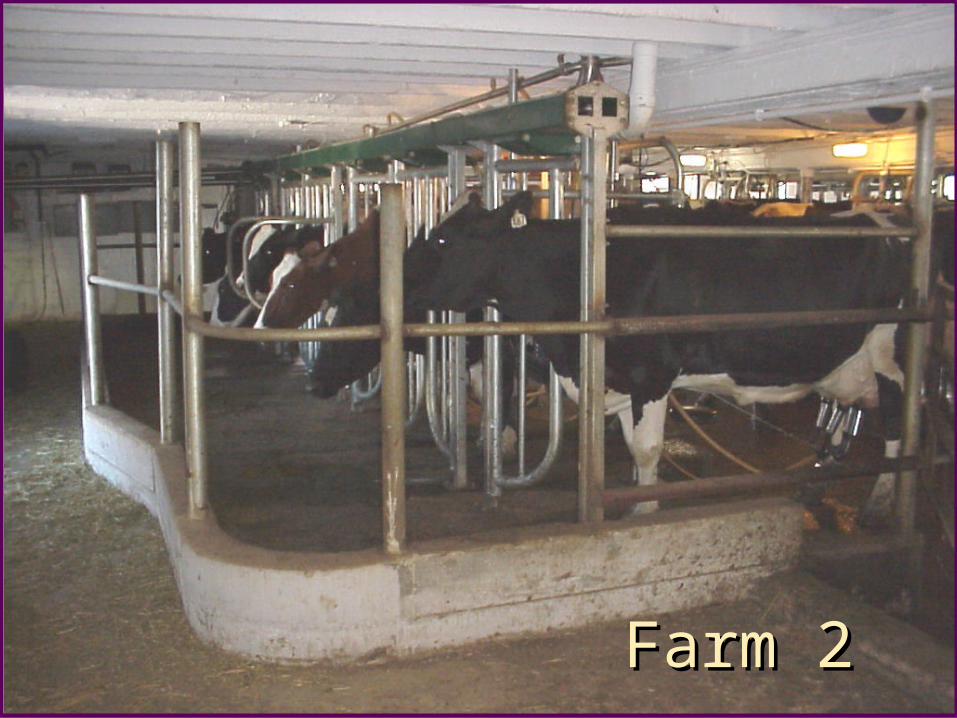
Farm 2Farm 2
Costs Associated with Staged-Growth Expansion
(Manitowoc County Dairy Farms)Farm 1From 55 to 100
cows
Farm 2From 60 to 180 cows
Farm 3From 155 to
380 cows
Freestall Barn $101,000 101 stalls
$201,000
137 stalls
$155,000
200 stalls
Milking Parlor & Holding Area
$37,000swing 8
$ 35,000D-6 flat
$75,000 Swing 10
Feed Storage _ $11,500 $16,000
Manure Storage & Excavation
$6,000Expanded pit
$41,000 $38,000
Special Needs Area
_ _ $14,800
Miscellaneous $23,800Mixer & parlor
heating
$13,0001,500 gal.
tank
$8,000cattle lane
Total Cost $167,800 $301,500
$306,800
Investment/Cow
$1,598 $1,675 $807
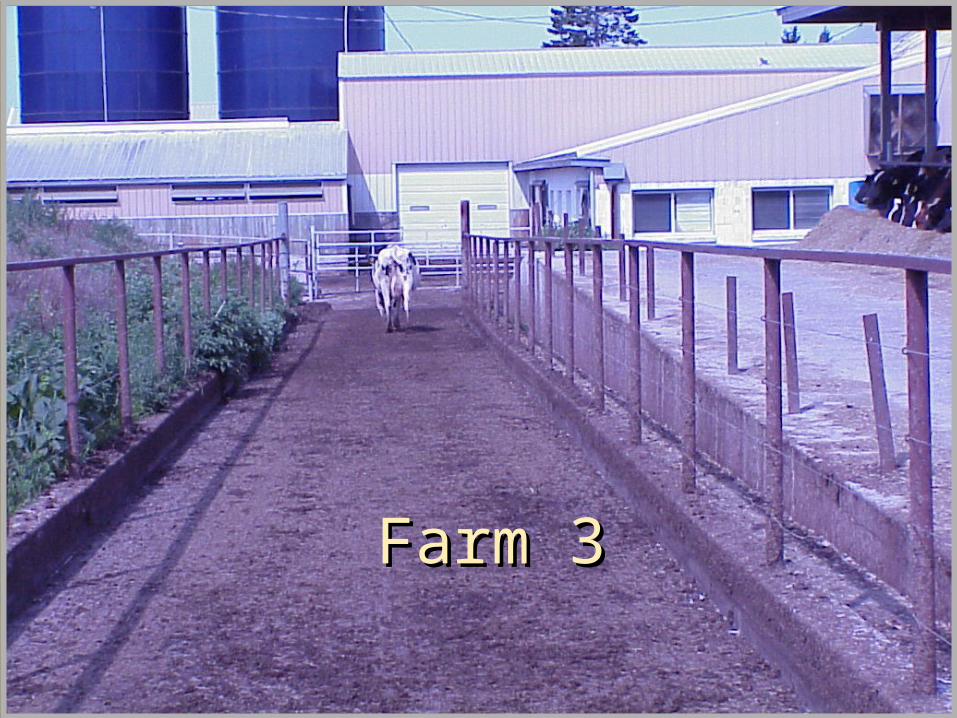
Farm 3Farm 3
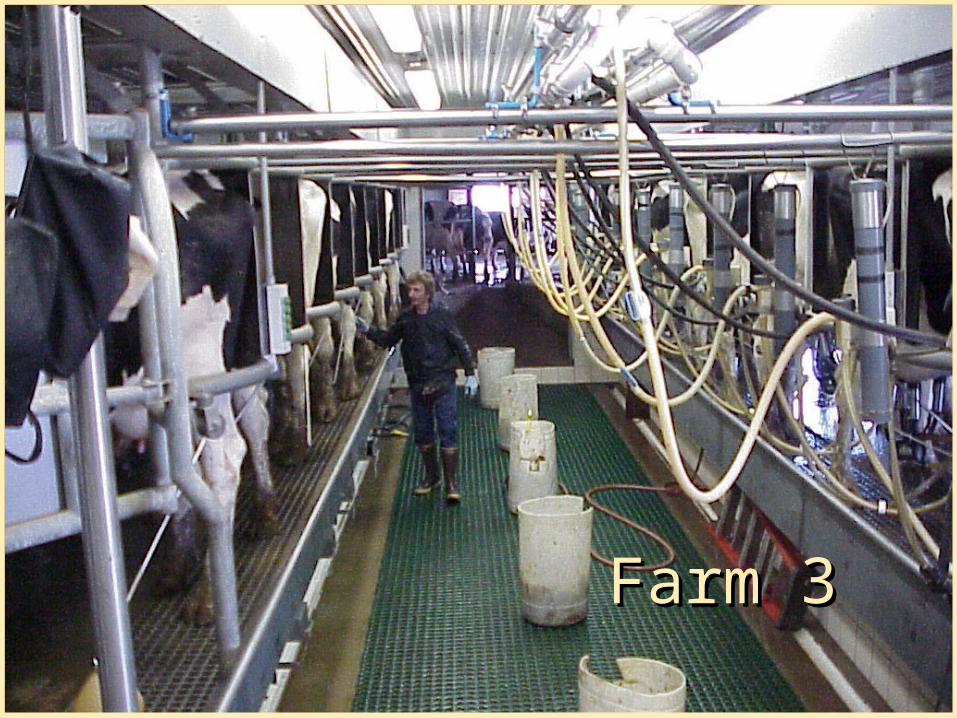
Farm 3Farm 3
Farm 3Farm 3
Farm 3Farm 3
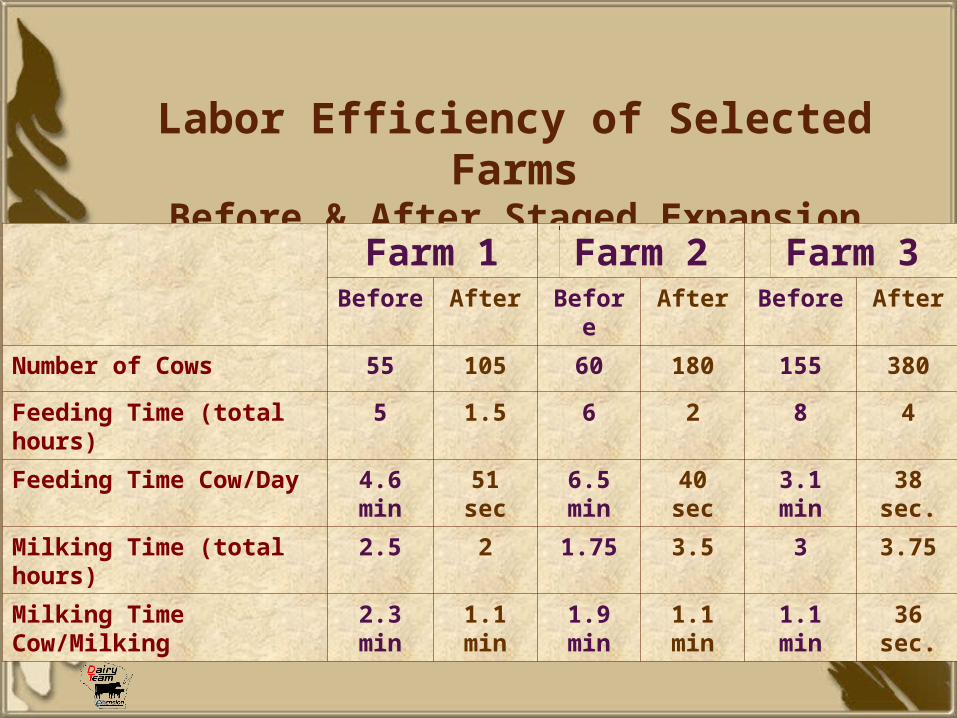
Labor Efficiency of Selected Farms
Before & After Staged ExpansionFarm 1 Farm 2 Farm 3
Before
After Before
After Before After
Number of Cows 55 105 60 180 155 380
Feeding Time (total hours)
5 1.5 6 2 8 4
Feeding Time Cow/Day
4.6 min
51 sec
6.5 min
40 sec
3.1 min
38 sec.
Milking Time (total hours)
2.5 2 1.75 3.5 3 3.75
Milking Time Cow/Milking
2.3 min
1.1 min
1.9 min
1.1 min
1.1 min
36 sec.
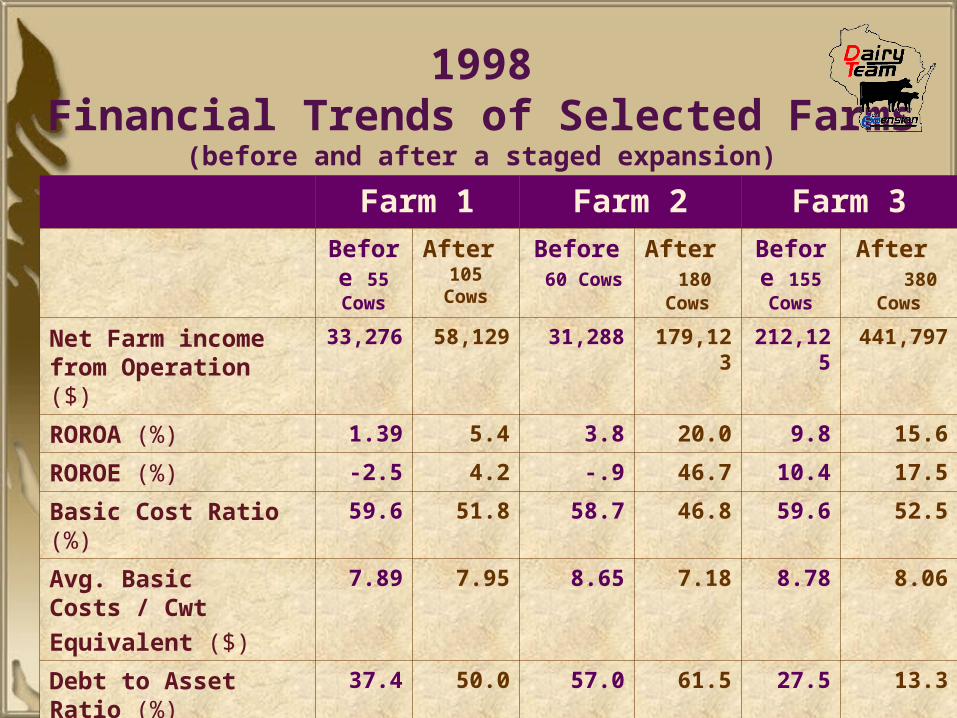
1998Financial Trends of Selected Farms
(before and after a staged expansion)
Farm 1 Farm 2 Farm 3Before 55 Cows
After 105
Cows
Before 60 Cows
After 180
Cows
Before 155 Cows
After 380 Cows
Net Farm income from Operation ($)
33,276
58,129 31,288 179,123
212,125
441,797
ROROA (%) 1.39 5.4 3.8 20.0 9.8 15.6
ROROE (%) -2.5 4.2 -.9 46.7 10.4 17.5
Basic Cost Ratio (%)
59.6 51.8 58.7 46.8 59.6 52.5
Avg. Basic Costs / Cwt Equivalent ($)
7.89 7.95 8.65 7.18 8.78 8.06
Debt to Asset Ratio (%)
37.4 50.0 57.0 61.5 27.5 13.3
Milk Sold Per Cow (lbs)
22,137
20,566 22,285 24,087 19,555
21,984
Net Worth ($) 280,357
320,810
262,282
325,687
845,442
1,283,236
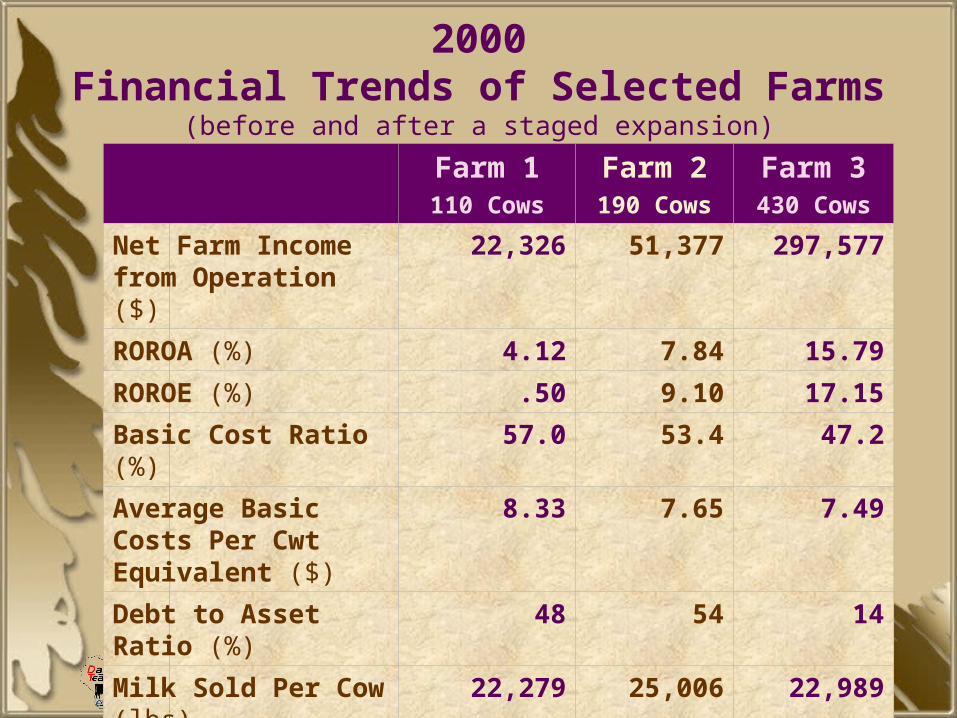
2000Financial Trends of Selected Farms
(before and after a staged expansion)
Farm 1110 Cows
Farm 2190 Cows
Farm 3430 Cows
Net Farm Income from Operation ($)
22,326 51,377 297,577
ROROA (%) 4.12 7.84 15.79
ROROE (%) .50 9.10 17.15
Basic Cost Ratio (%)
57.0 53.4 47.2
Average Basic Costs Per Cwt Equivalent ($)
8.33 7.65 7.49
Debt to Asset Ratio (%)
48 54 14
Milk Sold Per Cow (lbs)
22,279 25,006 22,989
Net Worth ($) 390,406 582,904 1,781,016
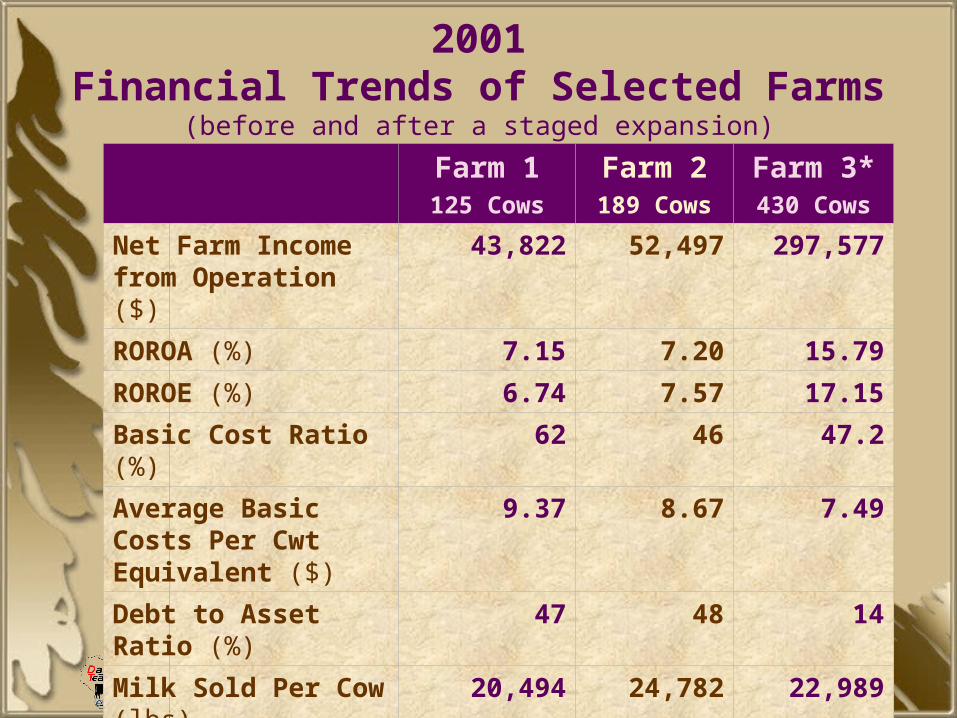
2001Financial Trends of Selected Farms
(before and after a staged expansion)
Farm 1125 Cows
Farm 2189 Cows
Farm 3*430 Cows
Net Farm Income from Operation ($)
43,822 52,497 297,577
ROROA (%) 7.15 7.20 15.79
ROROE (%) 6.74 7.57 17.15
Basic Cost Ratio (%)
62 46 47.2
Average Basic Costs Per Cwt Equivalent ($)
9.37 8.67 7.49
Debt to Asset Ratio (%)
47 48 14
Milk Sold Per Cow (lbs)
20,494 24,782 22,989
Net Worth ($) 445,931 769,456 1,781,016
*2001 figures for Farm #3 were unavailable at the time this was printed
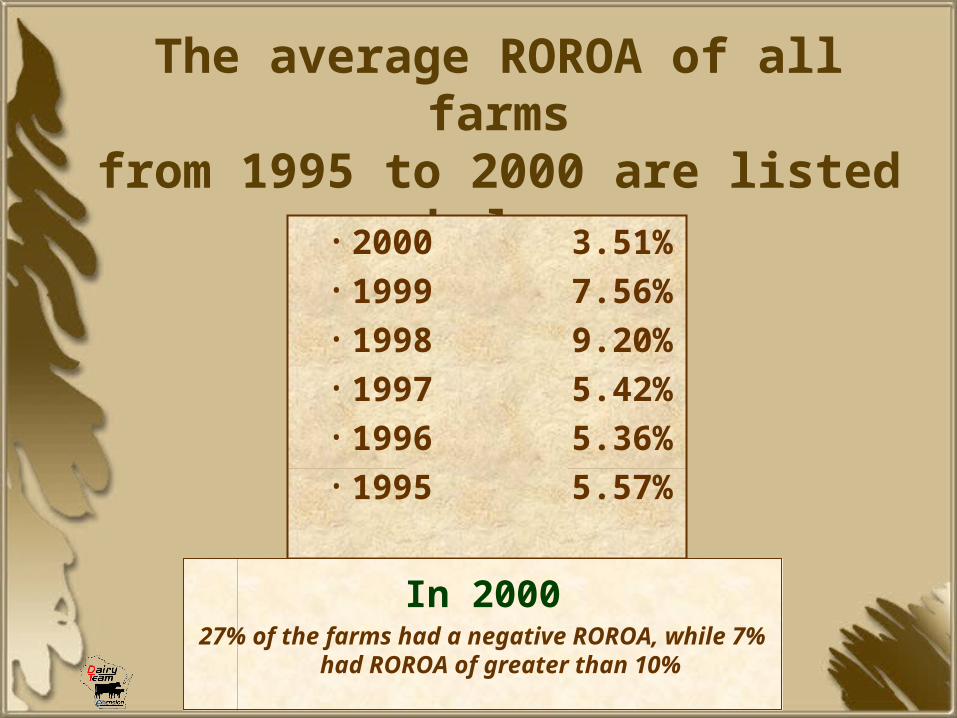
The average ROROA of all farms
from 1995 to 2000 are listed below• 2000 3.51%
• 1999 7.56%• 1998 9.20%• 1997 5.42%• 1996 5.36%• 1995 5.57%
In 200027% of the farms had a negative ROROA,
while 7% had ROROA of greater than 10%
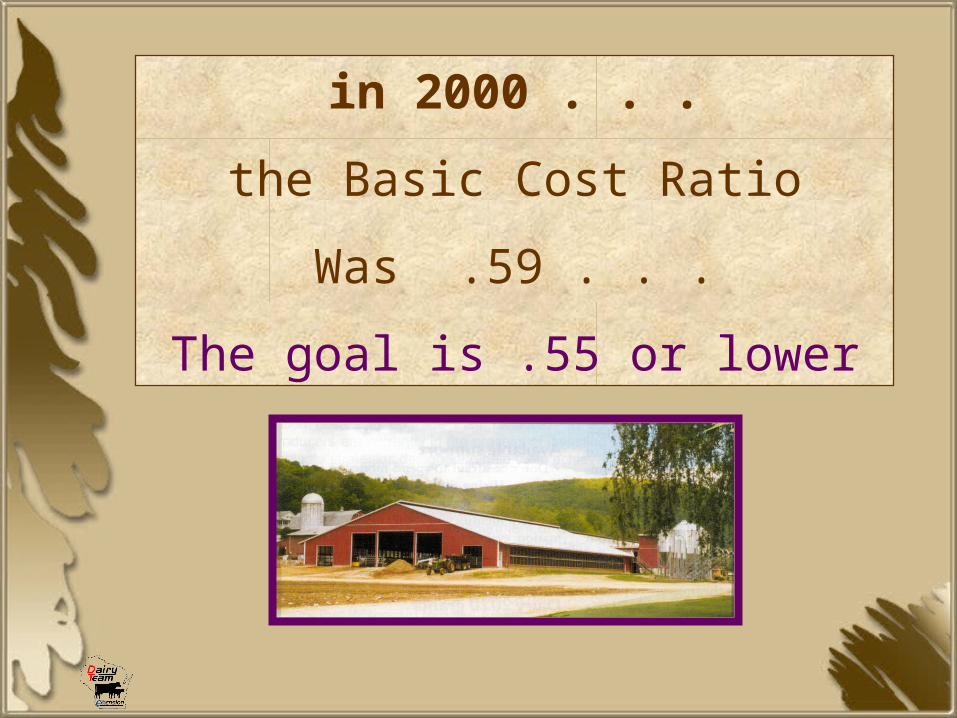
in 2000 . . .
the Basic Cost Ratio
Was .59 . . .
The goal is .55 or lower
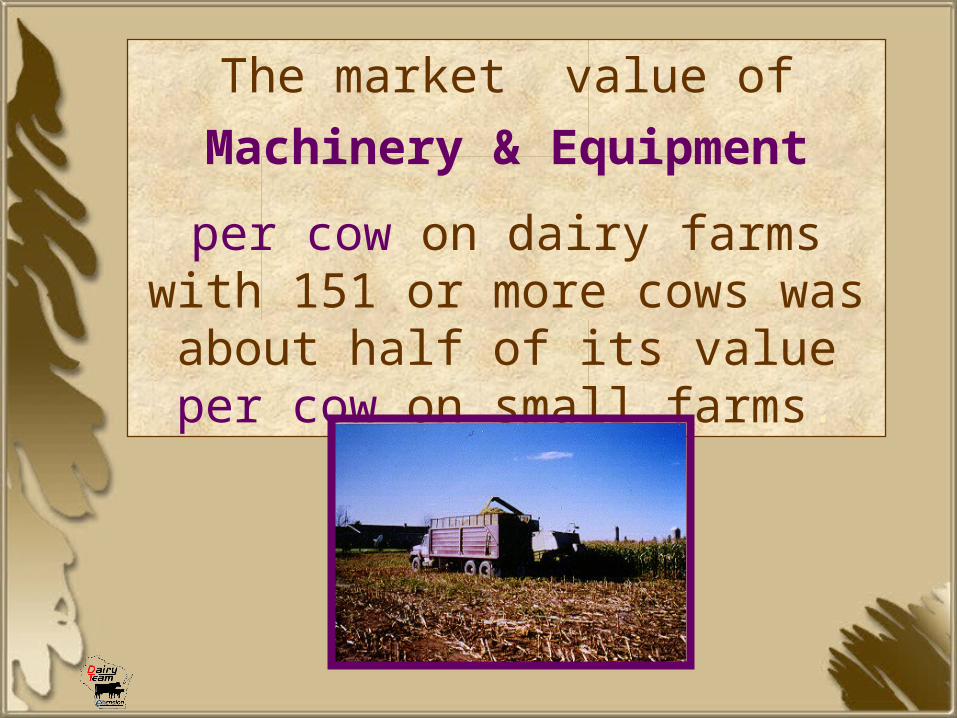
The market value of
Machinery & Equipment
per cow on dairy farms with 151 or more cows was about half of its value per cow on
small farms.
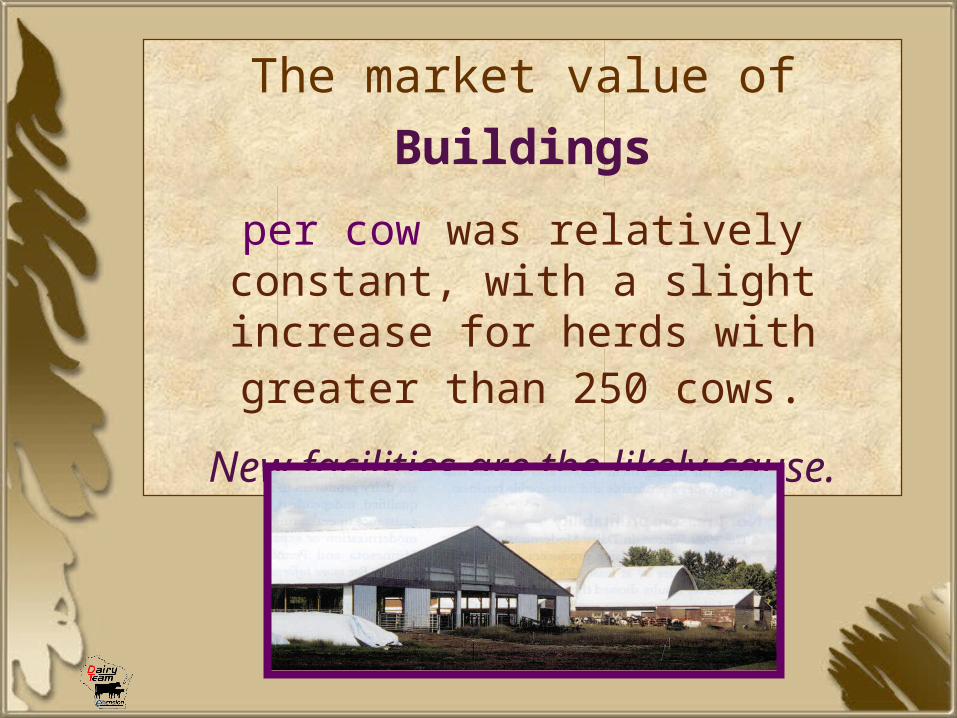
The market value of
Buildings
per cow was relatively constant, with a slight increase for herds
with greater than 250 cows.
New facilities are the likely cause.
Total
Farm Liabilities
Remained relatively constant at $2,500 per cow until herd sizes of 151 cows
or greater were reached.After that the TFL was $3,350 per cow.
Dairy Modernization may result in . . .
• Improved cow comfort• Improved labor
efficiency• Increased income• Improved quality of life
For more information on annual Wisconsin Financial Summaries go to the UW-Extension Center
for Dairy Profitability at: http://cdp.wisc.edu/