modelling of high intensity euv light sources based on … · · 2017-02-15modelling of high...
TRANSCRIPT
Modelling of high intensity EUV light sources based on
laser- & discharge- produced plasmas
Sergey V. Zakharov +, Peter Choi, Vasily S. Zakharov
NANO‐UV sasEPPRA sas
+ also with RRC Kurchatov Institute, Moscow, Russia
COPYRIGHT 2010 NANO‐UV
2010 International
Workshop on EUV
Lithography June 21-25
Maui, Hawaii, USA
OUTLINE
High energy density plasma in EUVL
ZETA→Z*→Z*BME RMHD codes
Non-equilibrium plasma radiation kineticsplasma radiance limithighly charged Xe ion EUV emission
LPP & Combined Nd:YAG-CO2 laser pulse
Nano-UV source modelling for EUV andsoft X-ray source
Modelling tool development in FIRE-project
COPYRIGHT 2010 NANO‐UV
2010 International
Workshop on EUV
Lithography June 21-25
Maui, Hawaii, USA
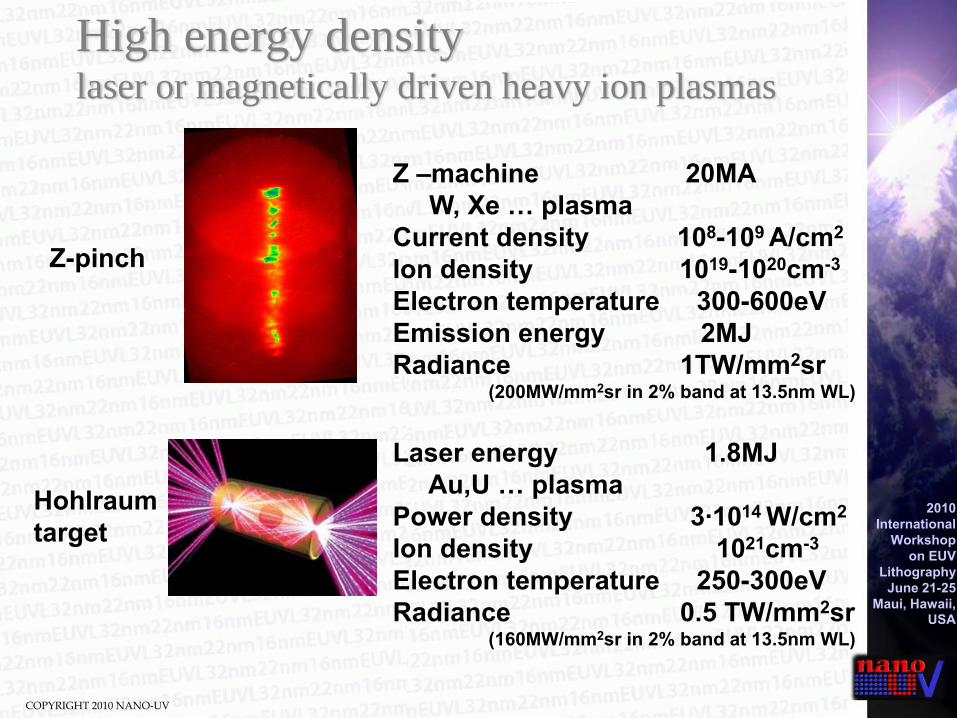
High energy densitylaser or magnetically driven heavy ion plasmas
Z-pinch
Z –machine 20MA W, Xe … plasma
Current density 108-109 A/cm2
Ion density 1019-1020cm-3
Electron temperature 300-600eVEmission energy 2MJRadiance 1TW/mm2sr
(200MW/mm2sr in 2% band at 13.5nm WL)
Hohlraum target
Laser energy 1.8MJ Au,U … plasma
Power density 3·1014 W/cm2
Ion density 1021cm-3
Electron temperature 250-300eVRadiance 0.5 TW/mm2sr
(160MW/mm2sr in 2% band at 13.5nm WL)
COPYRIGHT 2010 NANO‐UV
2010 International
Workshop on EUV
Lithography June 21-25
Maui, Hawaii, USA
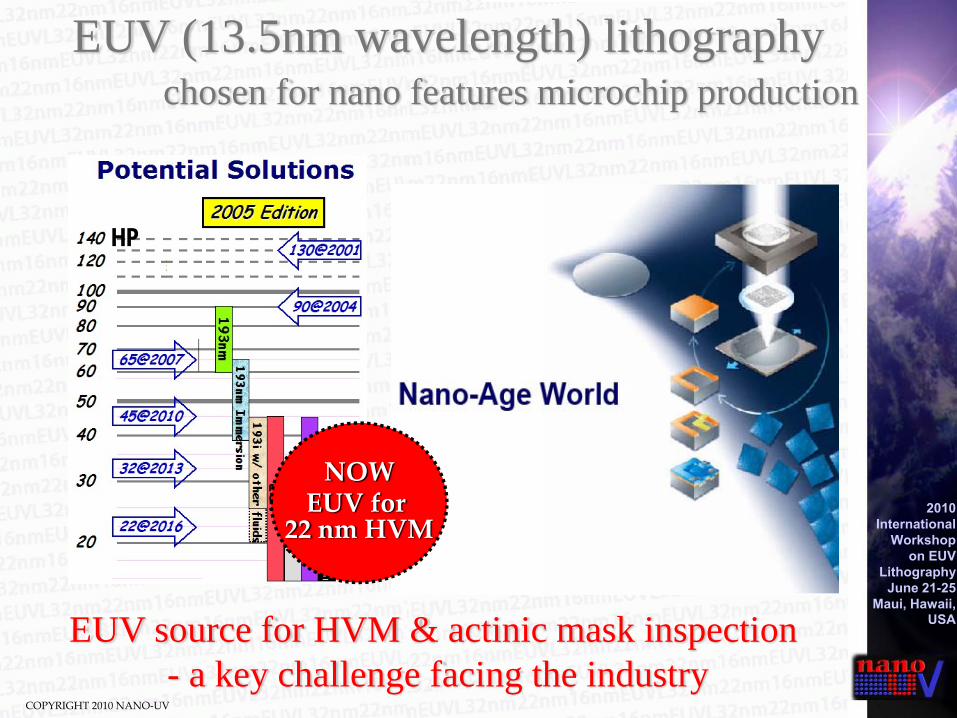
EUV (13.5nm wavelength) lithographychosen for nano features microchip production
HP
EUV source for HVM & actinic mask inspection- a key challenge facing the industry
NOWEUV for
22 nm HVM
COPYRIGHT 2010 NANO‐UV
2010 International
Workshop on EUV
Lithography June 21-25
Maui, Hawaii, USA
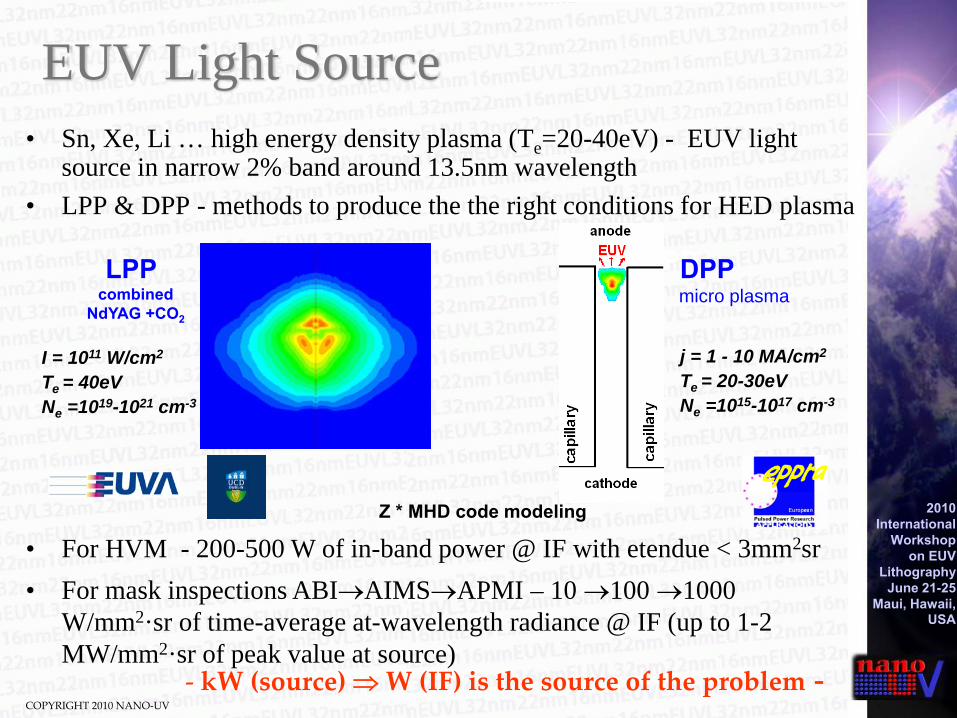
EUV Light Source• Sn, Xe, Li … high energy density plasma (Te=20-40eV) - EUV light
source in narrow 2% band around 13.5nm wavelength• LPP & DPP - methods to produce the the right conditions for HED plasma
‐ kW (source) ⇒W (IF) is the source of the problem -
combined NdYAG +CO2
• For HVM - 200-500 W of in-band power @ IF with etendue < 3mm2sr • For mask inspections ABI→AIMS→APMI – 10 →100 →1000
W/mm2·sr of time-average at-wavelength radiance @ IF (up to 1-2 MW/mm2·sr of peak value at source)
DPP
Z * MHD code modeling
LPPmicro plasmaDPP
I = 1011 W/cm2
Te = 40eVNe =1019-1021 cm-3
j = 1 - 10 MA/cm2
Te = 20-30eVNe =1015-1017 cm-3
COPYRIGHT 2010 NANO‐UV
2010 International
Workshop on EUV
Lithography June 21-25
Maui, Hawaii, USA
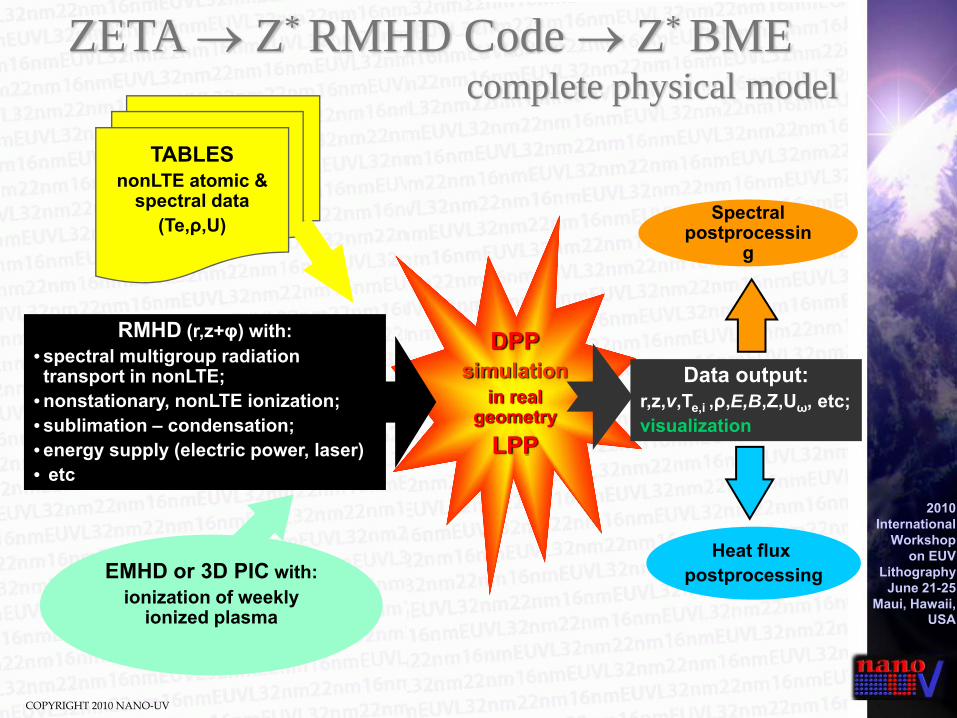
ZETA → Z* RMHD Code → Z* BMEcomplete physical model
DPPsimulation
in real geometry
LPP
Data output:r,z,v,Te,i ,ρ,E,B,Z,Uω, etc;visualization
RMHD (r,z+φ) with: • spectral multigroup radiation transport in nonLTE;
• nonstationary, nonLTE ionization; • sublimation – condensation;• energy supply (electric power, laser)• etc
TABLESnonLTE atomic &
spectral data(Te,ρ,U)
EMHD or 3D PIC with:ionization of weekly
ionized plasma
Spectral postprocessin
g
Heat flux postprocessing
COPYRIGHT 2010 NANO‐UV
2010 International
Workshop on EUV
Lithography June 21-25
Maui, Hawaii, USA
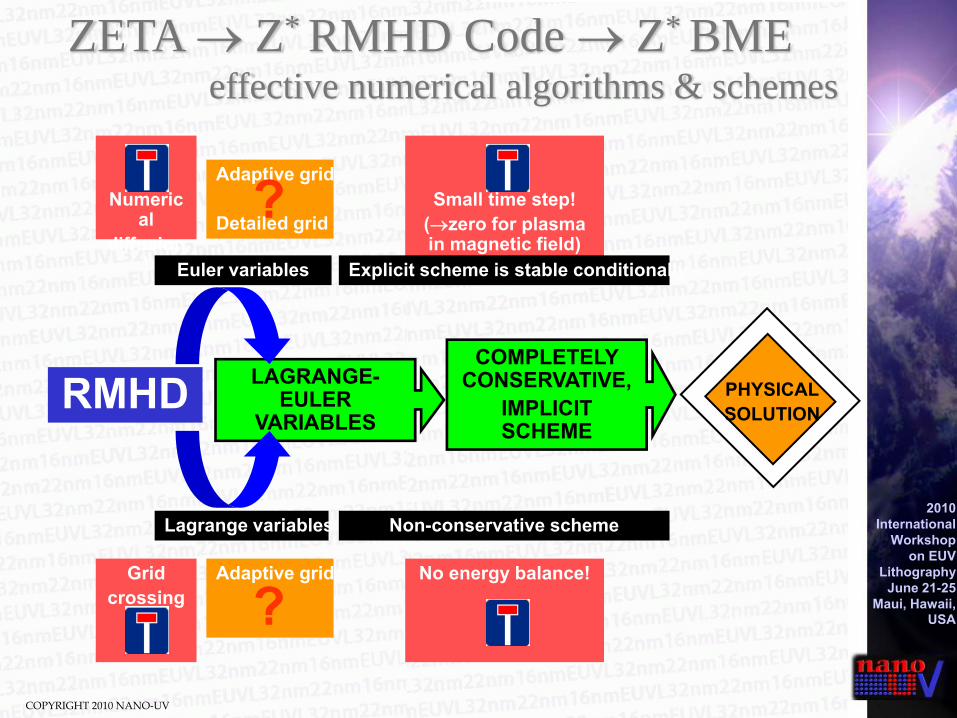
No energy balance!
Numerical
diffusion!
Adaptive grid
Detailed grid?
Adaptive grid
?
Lagrange variables
Gridcrossing
!
RMHD LAGRANGE-EULER
VARIABLES
COMPLETELY CONSERVATIVE,
IMPLICIT SCHEME
Small time step! (→zero for plasma in magnetic field)
Euler variables Explicit scheme is stable conditionally
Non-conservative scheme
PHYSICALSOLUTION
ZETA → Z* RMHD Code → Z* BMEeffective numerical algorithms & schemes
COPYRIGHT 2010 NANO‐UV
2010 International
Workshop on EUV
Lithography June 21-25
Maui, Hawaii, USA
10-5
10-4
10-3
10-2
10-1
100
101
102
10-18 10-16 10-14 10-12 10-10 10-8 10-6 10-4 10-2
R=0.04mmR=0.08mmR=0.16mmR=0.31mmR=0.625mmR=1.25mmR=2.5mmR=5mm
EUV
Rad
ianc
e, M
W/m
m2
sr
Effective Depth (rho2*r), g2/cm3
tin
tin
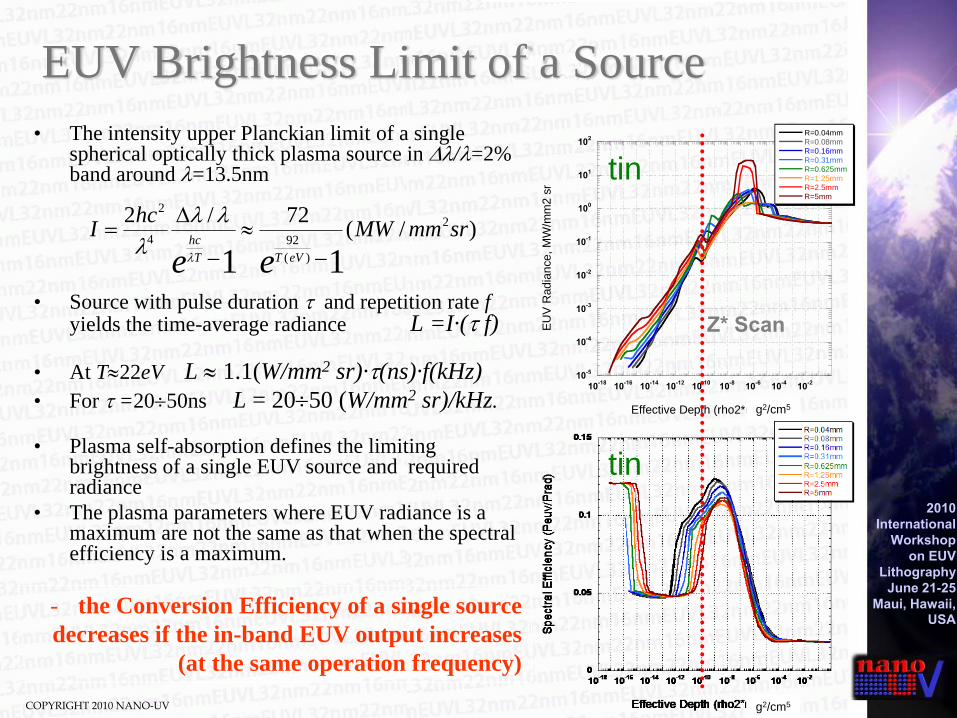
EUV Brightness Limit of a Source
.- the Conversion Efficiency of a single source decreases if the in-band EUV output increases
(at the same operation frequency)
Z* Scan
g2/cm5
g2/cm5
• The intensity upper Planckian limit of a single spherical optically thick plasma source in Δλ/λ=2% band around λ=13.5nm
• Source with pulse duration τ and repetition rate f yields the time-average radiance L =I·(τ f)
• At T≈22eV L ≈ 1.1(W/mm2 sr)·τ(ns)·f(kHz)• For τ =20÷50ns L = 20÷50 (W/mm2 sr)/kHz.
• Plasma self-absorption defines the limiting brightness of a single EUV source and required radiance
• The plasma parameters where EUV radiance is a maximum are not the same as that when the spectral efficiency is a maximum.
)/(72/2 2
)(924
2
11srmmMWhcI
ee eVTThc
−≈
−
Δ=
λ
λλλ
COPYRIGHT 2010 NANO‐UV
2010 International
Workshop on EUV
Lithography June 21-25
Maui, Hawaii, USA
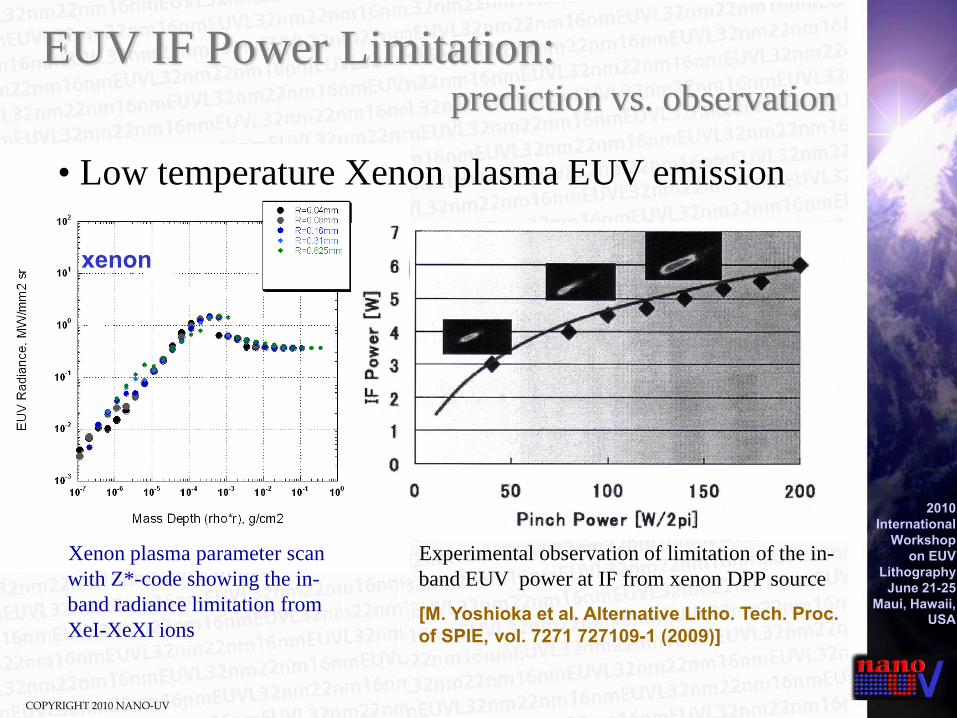
EUV IF Power Limitation: prediction vs. observation
• Low temperature Xenon plasma EUV emission
Experimental observation of limitation of the in-band EUV power at IF from xenon DPP source[M. Yoshioka et al. Alternative Litho. Tech. Proc. of SPIE, vol. 7271 727109-1 (2009)]
Xenon plasma parameter scan with Z*-code showing the in-band radiance limitation from XeI-XeXI ions
xenon
COPYRIGHT 2010 NANO‐UV
2010 International
Workshop on EUV
Lithography June 21-25
Maui, Hawaii, USA
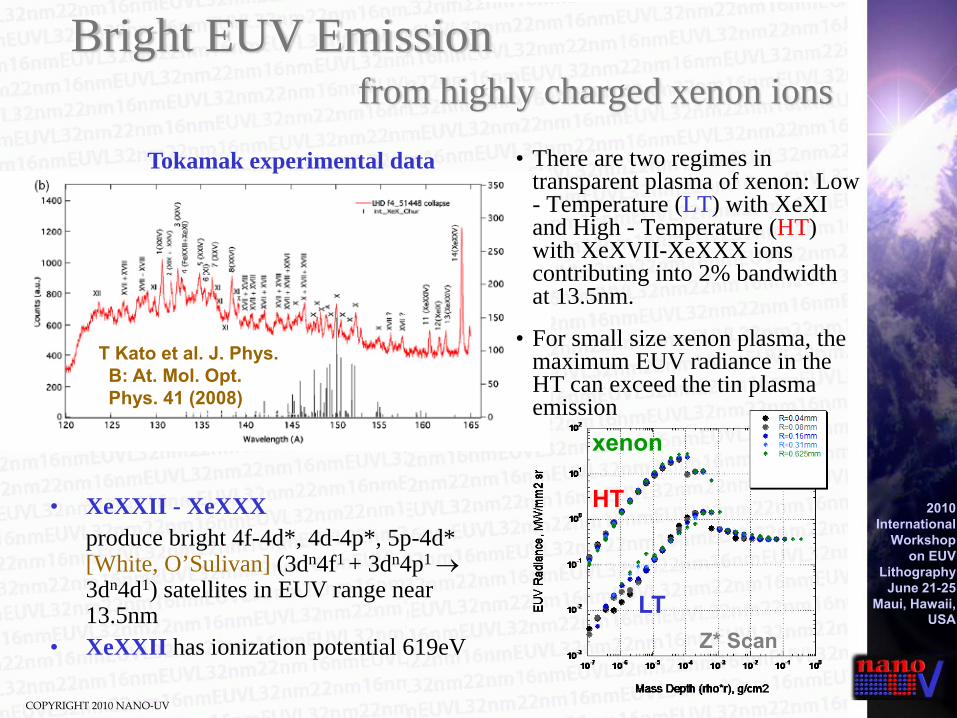
T Kato et al. J. Phys. B: At. Mol. Opt. Phys. 41 (2008)
LT
xenon
HT
Z* Scan
• XeXXII - XeXXXproduce bright 4f-4d*, 4d-4p*, 5p-4d* [White, O’Sulivan] (3dn4f1 + 3dn4p1 →3dn4d1) satellites in EUV range near 13.5nm
• XeXXII has ionization potential 619eV
Bright EUV Emission from highly charged xenon ions
Tokamak experimental data • There are two regimes in transparent plasma of xenon: Low - Temperature (LT) with XeXI and High - Temperature (HT) with XeXVII-XeXXX ions contributing into 2% bandwidth at 13.5nm.
• For small size xenon plasma, the maximum EUV radiance in the HT can exceed the tin plasma emission
COPYRIGHT 2010 NANO‐UV
2010 International
Workshop on EUV
Lithography June 21-25
Maui, Hawaii, USA
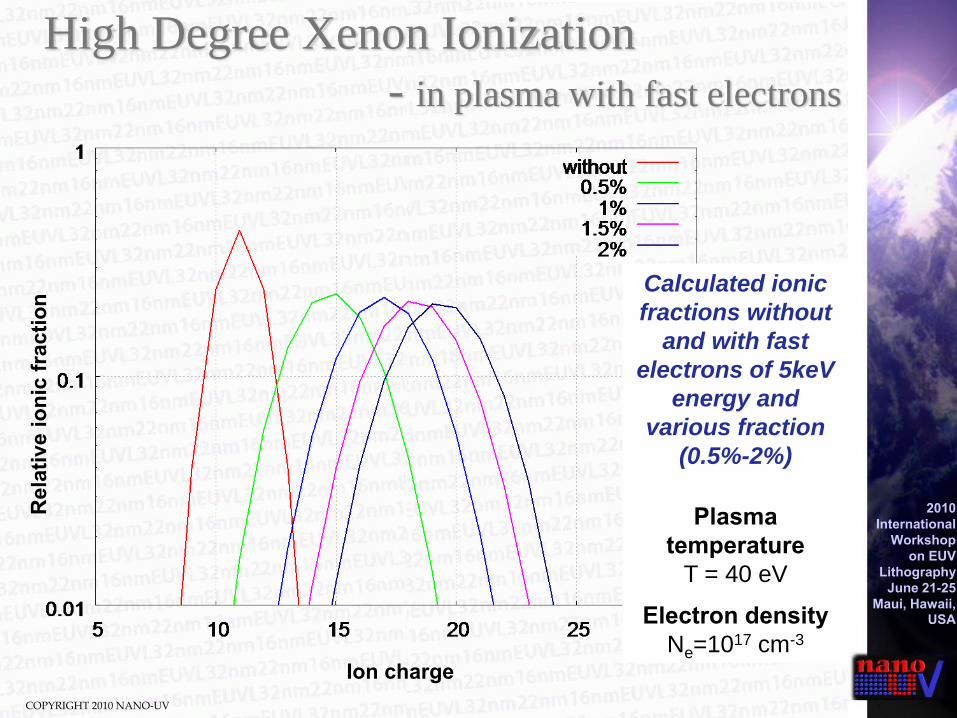
Ion charge
Calculated ionic fractions without
and with fast electrons of 5keV
energy and various fraction
(0.5%-2%)
Plasma temperature
T = 40 eV
Electron densityNe=1017 cm-3
Rel
ativ
e io
nic
frac
tion
High Degree Xenon Ionization- in plasma with fast electrons
COPYRIGHT 2010 NANO‐UV
2010 International
Workshop on EUV
Lithography June 21-25
Maui, Hawaii, USA
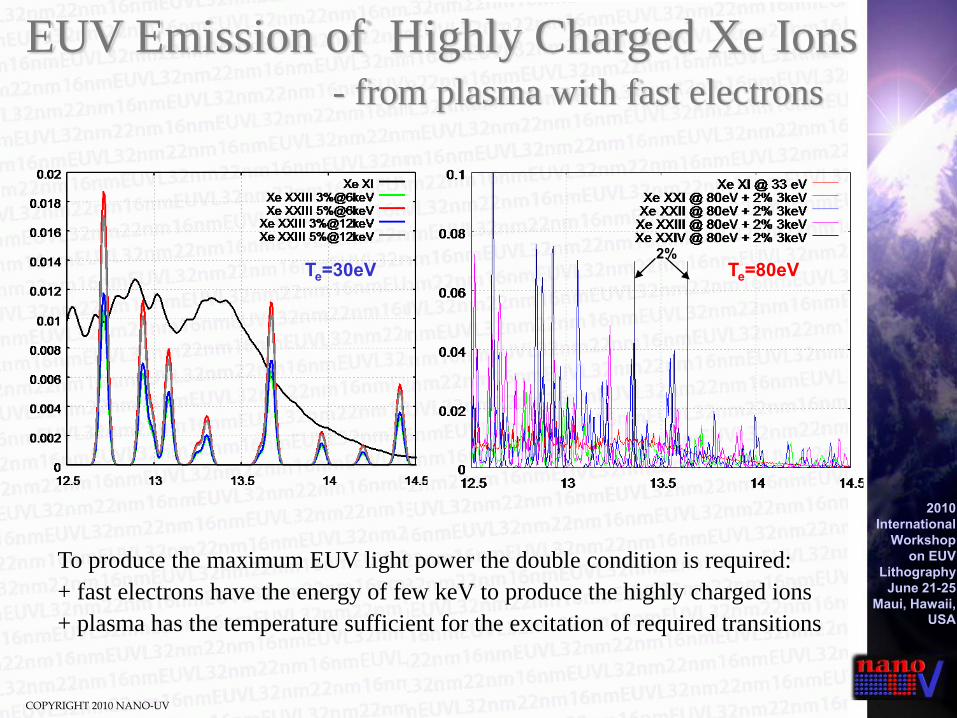
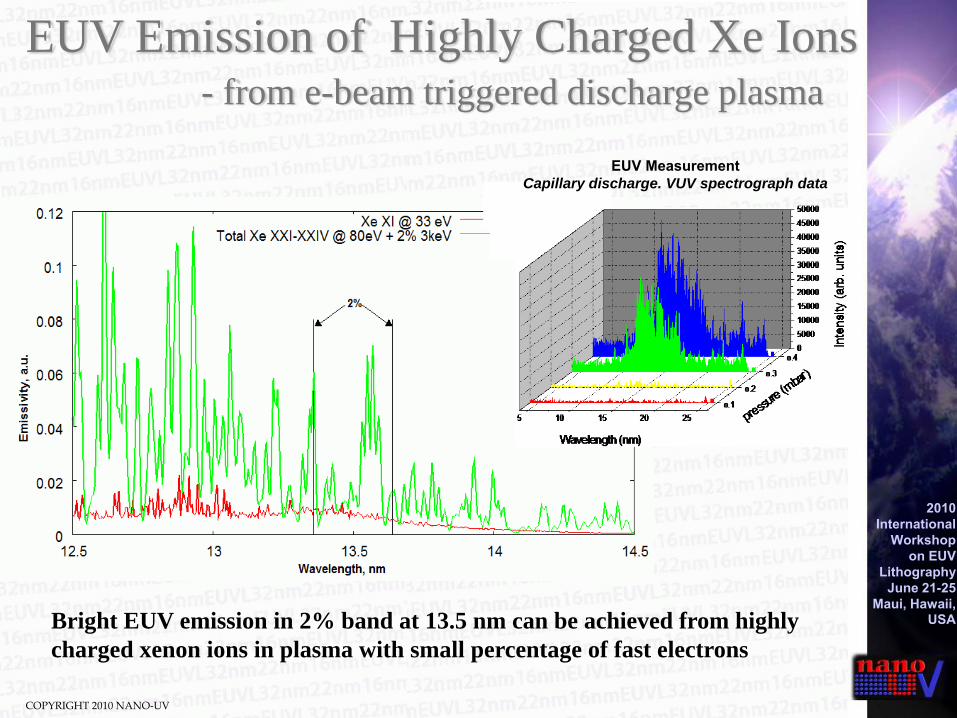
To produce the maximum EUV light power the double condition is required: + fast electrons have the energy of few keV to produce the highly charged ions + plasma has the temperature sufficient for the excitation of required transitions
EUV Emission of Highly Charged Xe Ions- from plasma with fast electrons
Te=30eV2%
Te=80eV
COPYRIGHT 2010 NANO‐UV
2010 International
Workshop on EUV
Lithography June 21-25
Maui, Hawaii, USA
EUV Emission of Highly Charged Xe Ions- from e-beam triggered discharge plasma
EUV MeasurementCapillary discharge. VUV spectrograph data
Bright EUV emission in 2% band at 13.5 nm can be achieved from highly charged xenon ions in plasma with small percentage of fast electrons
COPYRIGHT 2010 NANO‐UV
2010 International
Workshop on EUV
Lithography June 21-25
Maui, Hawaii, USAR(cm)
Z(cm
)-0.02 -0.01 0 0.01 0.02
0.1
0.11
0.12
0.13Geuv(MW/ccm)
1.9E+071.8E+071.7E+071.6E+071.6E+071.5E+071.4E+071.3E+071.3E+071.2E+071.1E+071.0E+079.7E+068.9E+068.2E+067.5E+066.7E+066.0E+065.2E+064.5E+063.7E+063.0E+062.2E+061.5E+067.5E+05
t= 18.65 ns
Frame 001 ⏐ 02 May 2007 ⏐ ZSTAR - code output, cell values
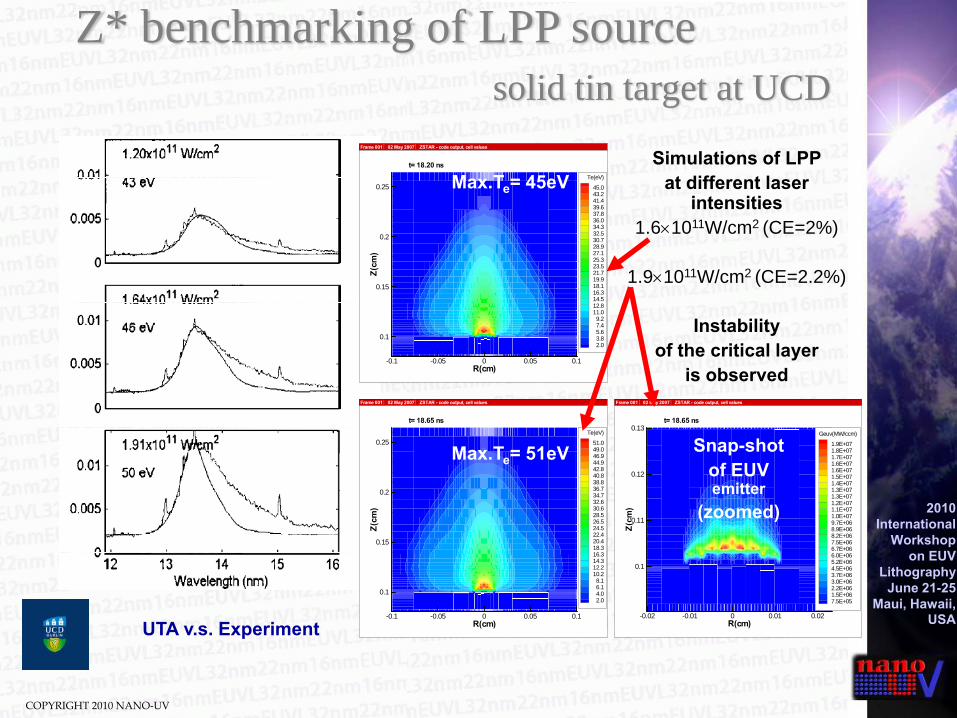
Z* benchmarking of LPP source solid tin target at UCD
UTA v.s. Experiment R(cm)
Z(cm
)
-0.1 -0.05 0 0.05 0.1
0.1
0.15
0.2
0.25Te(eV)
51.049.046.944.942.840.838.836.734.732.630.628.526.524.522.420.418.316.314.312.210.28.16.14.02.0
t= 18.65 ns
Frame 001 ⏐ 02 May 2007 ⏐ ZSTAR - code output, cell values
R(cm)Z(
cm)
-0.1 -0.05 0 0.05 0.1
0.1
0.15
0.2
0.25Te(eV)
45.043.241.439.637.836.034.332.530.728.927.125.323.521.719.918.116.314.512.811.09.27.45.63.82.0
t= 18.20 ns
Frame 001 ⏐ 02 May 2007 ⏐ ZSTAR - code output, cell values
Simulations of LPP at different laser
intensities1.6×1011W/cm2 (CE=2%)
1.9×10¹¹W/cm2 (CE=2.2%)
Instability of the critical layer
is observed
Max.Te= 45eV
Max.Te= 51eV Snap-shot of EUV emitter
(zoomed)
COPYRIGHT 2010 NANO‐UV
2010 International
Workshop on EUV
Lithography June 21-25
Maui, Hawaii, USA
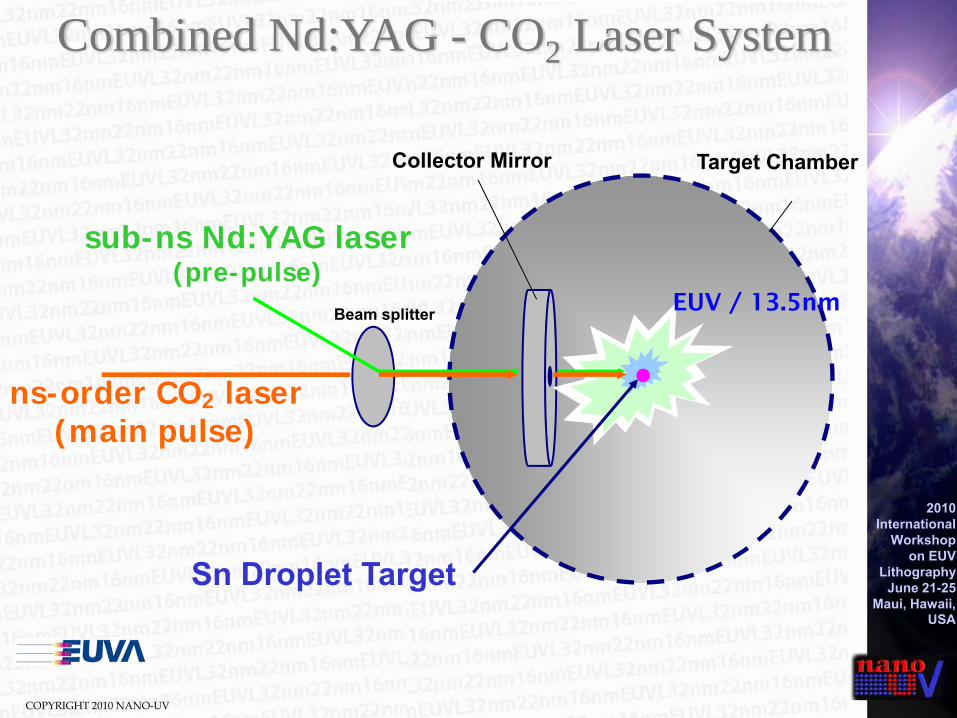
ns-order CO2 laser(main pulse)
sub-ns Nd:YAG laser(pre-pulse)
Target Chamber
Beam splitter
Collector Mirror
Sn Droplet Target
EUV / 13.5nm
Combined Nd:YAG - CO2 Laser System
COPYRIGHT 2010 NANO‐UV
2010 International
Workshop on EUV
Lithography June 21-25
Maui, Hawaii, USA
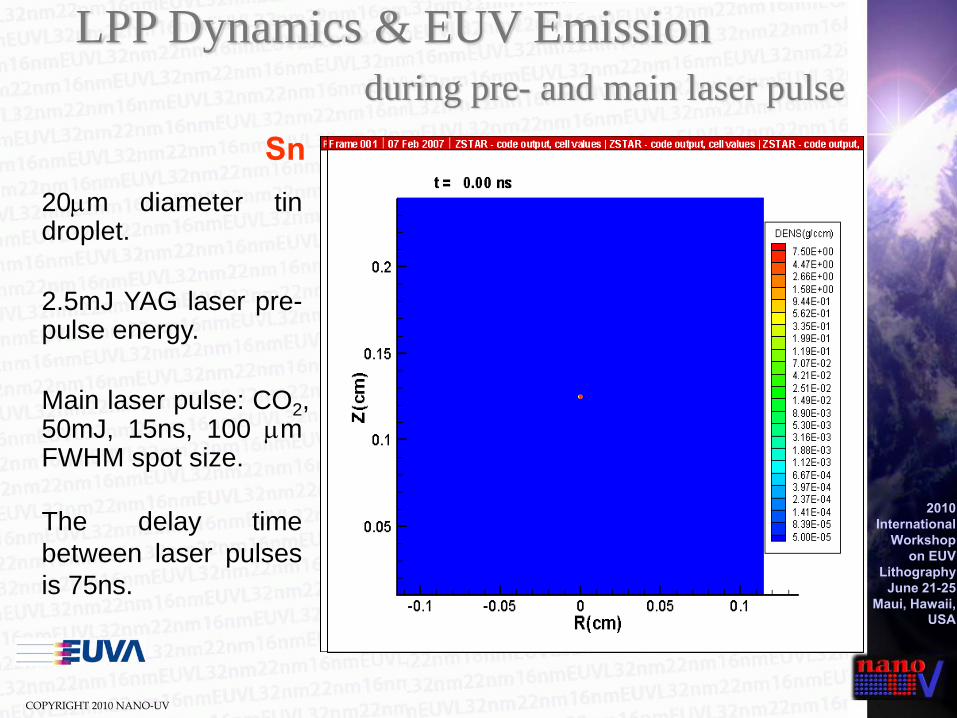
LPP Dynamics & EUV Emissionduring pre- and main laser pulse
20μm diameter tindroplet.
2.5mJ YAG laser pre-pulse energy.
Main laser pulse: CO2,50mJ, 15ns, 100 μmFWHM spot size.
The delay timebetween laser pulsesis 75ns.
Sn
COPYRIGHT 2010 NANO‐UV
2010 International
Workshop on EUV
Lithography June 21-25
Maui, Hawaii, USA
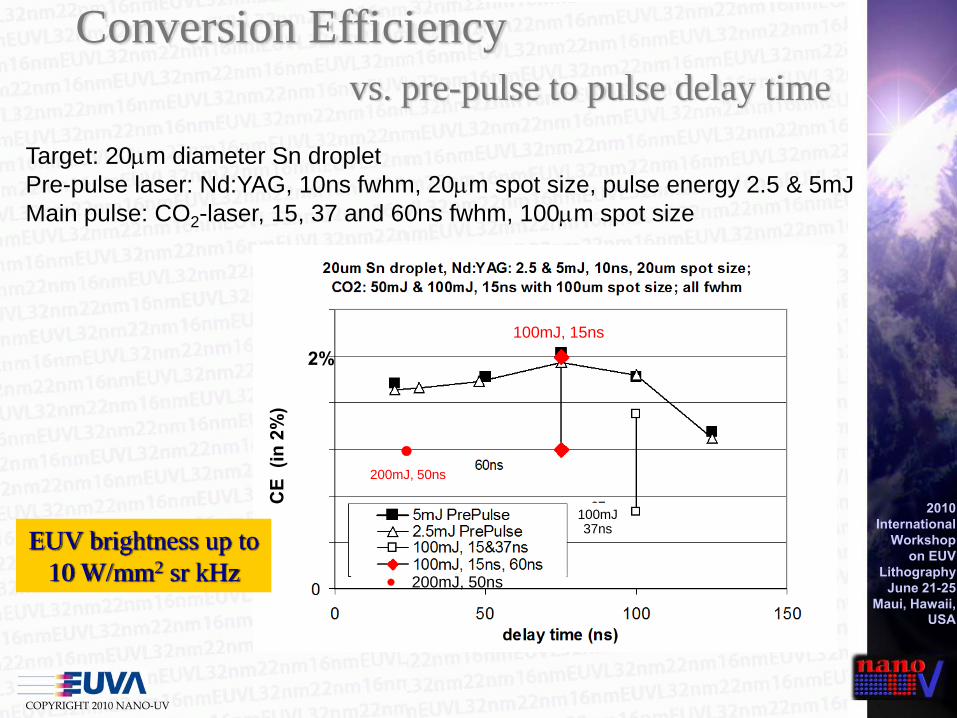
Target: 20μm diameter Sn dropletPre-pulse laser: Nd:YAG, 10ns fwhm, 20μm spot size, pulse energy 2.5 & 5mJMain pulse: CO2-laser, 15, 37 and 60ns fwhm, 100μm spot size
Conversion Efficiency vs. pre-pulse to pulse delay time
2%
CE
(in2%
)
EUV brightness up to 10 W/mm2 sr kHz
•200mJ, 50ns
100mJ, 15ns
100mJ 37ns
• 200mJ, 50ns
COPYRIGHT 2010 NANO‐UV
2010 International
Workshop on EUV
Lithography June 21-25
Maui, Hawaii, USA
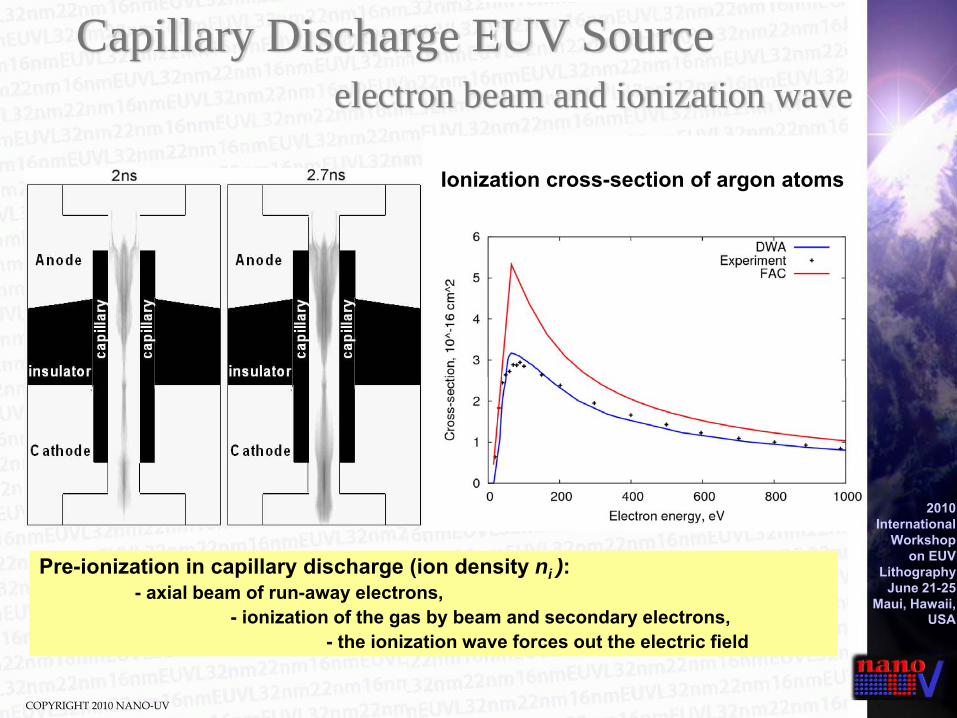
Pre-ionization in capillary discharge (ion density ni ):- axial beam of run-away electrons,
- ionization of the gas by beam and secondary electrons,- the ionization wave forces out the electric field
Ionization cross-section of argon atoms
Capillary Discharge EUV Sourceelectron beam and ionization wave
COPYRIGHT 2010 NANO‐UV
2010 International
Workshop on EUV
Lithography June 21-25
Maui, Hawaii, USA
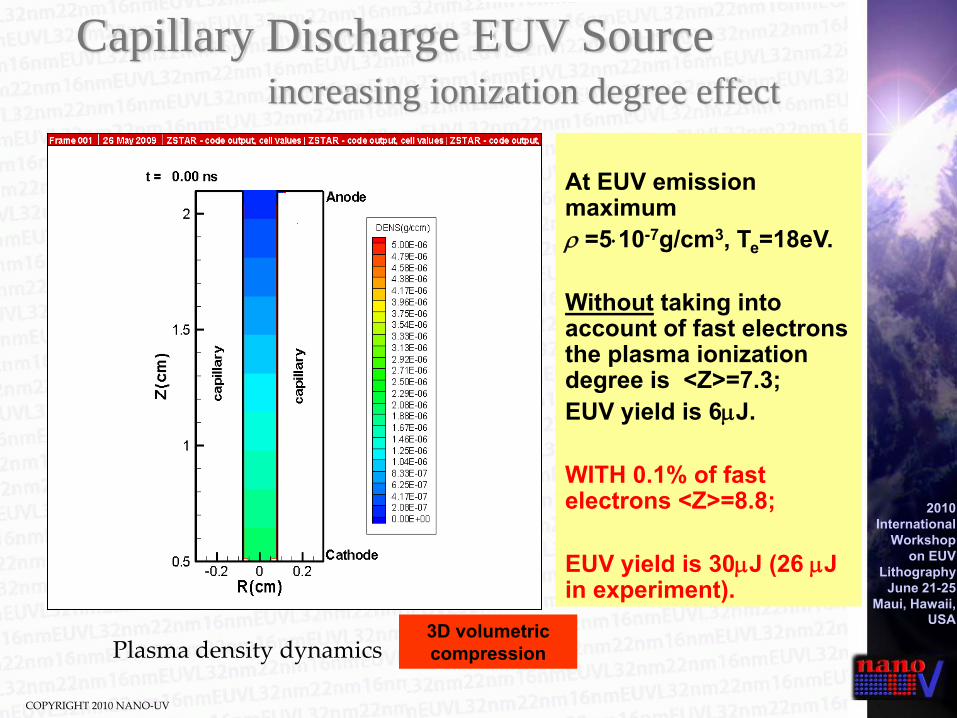
At EUV emission maximumρ =5⋅10-7g/cm3, Те=18eV.
Without taking into account of fast electrons the plasma ionization degree is <Z>=7.3;EUV yield is 6μJ.
WITH 0.1% of fast electrons <Z>=8.8;
EUV yield is 30μJ (26 μJin experiment).
Capillary Discharge EUV Sourceincreasing ionization degree effect
3D volumetric compressionPlasma density dynamics
COPYRIGHT 2010 NANO‐UV
2010 International
Workshop on EUV
Lithography June 21-25
Maui, Hawaii, USA
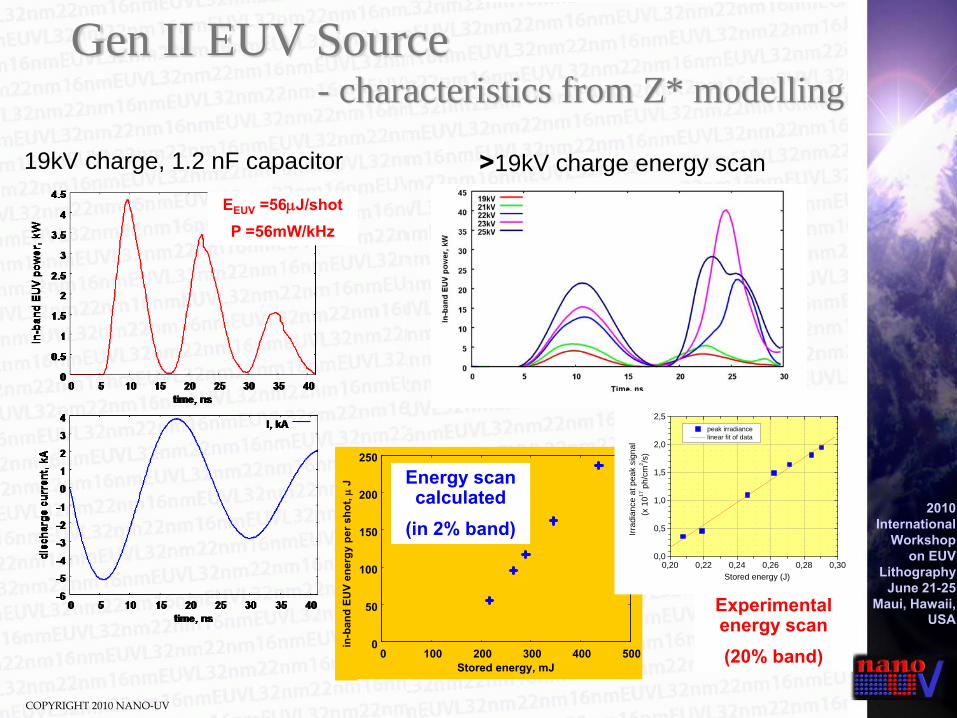
19kV charge, 1.2 nF capacitor >19kV charge energy scanEEUV =56μJ/shotP =56mW/kHz
0
50
100
150
200
250
0 100 200 300 400 500
In-b
and
EUV
ener
gy p
er s
hot,
mJ
Stored energy, mJ
in-b
and
EUV
ener
gy p
er s
hot, μ
J
Gen II EUV Source- characteristics from Z* modelling
0,20 0,22 0,24 0,26 0,28 0,300,0
0,5
1,0
1,5
2,0
2,5 peak irradiance linear fit of data
Irrad
ianc
e at
pea
k si
gnal
(x
1017
ph/
cm2 /s
)
Stored energy (J)
Energy scan calculated
(in 2% band)
Experimental energy scan(20% band)
COPYRIGHT 2010 NANO‐UV
2010 International
Workshop on EUV
Lithography June 21-25
Maui, Hawaii, USA
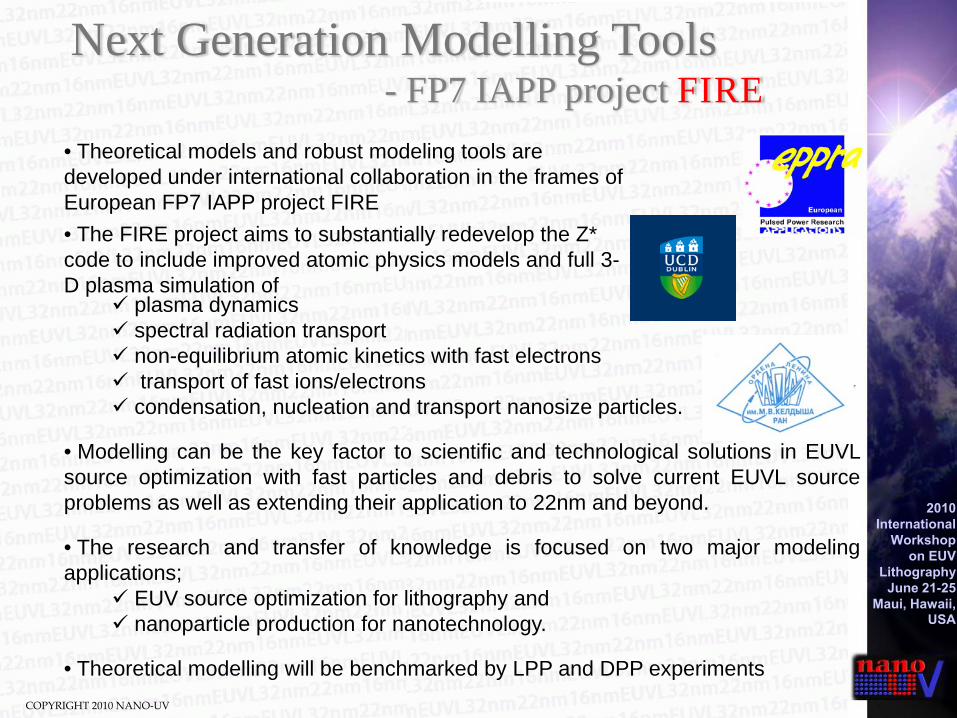
plasma dynamicsspectral radiation transportnon-equilibrium atomic kinetics with fast electronstransport of fast ions/electrons
condensation, nucleation and transport nanosize particles.
• Modelling can be the key factor to scientific and technological solutions in EUVLsource optimization with fast particles and debris to solve current EUVL sourceproblems as well as extending their application to 22nm and beyond.
• The research and transfer of knowledge is focused on two major modelingapplications;
EUV source optimization for lithography andnanoparticle production for nanotechnology.
• Theoretical modelling will be benchmarked by LPP and DPP experiments
Next Generation Modelling Tools- FP7 IAPP project FIRE
• Theoretical models and robust modeling tools are developed under international collaboration in the frames of European FP7 IAPP project FIRE• The FIRE project aims to substantially redevelop the Z* code to include improved atomic physics models and full 3-D plasma simulation of
COPYRIGHT 2010 NANO‐UV
2010 International
Workshop on EUV
Lithography June 21-25
Maui, Hawaii, USA
• R&D team & collaborators
– R&D team of EPPRA and Nano‐UV– Pontificia Universidad Catolica de Chile– RRC Kurchatov Institute, Moscow, Russia– Keldysh Institute of Applied Mathematics RAS, Moscow, Russia
– University College Dublin– King’s College London– EUVA, Manda Hiratsuka, Japan
• Sponsors - EU & French Government– ANR‐ EUVIL– FP7 IAPP– OSEO‐ANVAR
• RAKIA
• EUV LITHO, Inc.
Acknowledgement