modeling the soil water retention curve for conditions of variable porosity
TRANSCRIPT

Rep
rodu
ced
from
Vad
ose
Zon
e Jo
urna
l. P
ublis
hed
by S
oil S
cien
ce S
ocie
ty o
f Am
eric
a. A
ll co
pyrig
hts
rese
rved
.
Modeling the Soil Water Retention Curve for Conditions of Variable Porosity
C. Florian Stange and Rainer Horn*
ABSTRACT is challenging because of the complexity of the pore spaceand our incomplete understanding of the main processesTemporal changes in the pore space of unsaturated soils may resultinvolved. Development and testing models accountingfrom such processes as mechanical compaction and tillage of agricul-
tural soils. Moreover, soil pore space and soil water content are mutu- for changes in the soil PSD is further hampered by a lackally interactive. For example, porosity and pore-space geometry con- of comprehensive data about soil structural and hydrau-trol the unsaturated soil hydraulic properties such as the water lic dynamics (Leij et al., 2002). The theory of one-dimen-retention curve, while conversely soil water and hydraulic stress often sional water flow in saturated and unsaturated swellingaffects soil pore size. The experiments discussed in this paper focus on soils, and the fundamental differences between flow inboth of these two aspects and additionally consider how a previously swelling and rigid matrix systems, is reviewed by Smilesapplied mechanical stress can influence the effects of subsequent
(2000). Terzaghi (1923) already some 80 years ago de-hydraulic stresses on the soil hydraulic properties. We show the effectsscribed water flow in soils subject to volume changes.of uniaxial volume changes during drying on the water retentionMost current approaches for calculating water flow arecurves of three sandy and silty soils. Results indicate that previously
loaded soils differ in how drying affects volume changes. Uniaxial based on a mass balance equation and Darcy’s law. Thevolume changes of all soils could be described well with a model use of material coordinates, instead of fixed spatial coor-similar to van Genuchten’s soil water retention function. Four models dinates such as normally used for nonswelling soils, leadswere developed to describe soil water retention as a function of vari- to a flow equation analogous to the Richards equationable void ratio and then tested against measured data. The variably (Smiles, 2000). Darcy’s law relates the volume flux ofporosity models generally give much better descriptions of the ob- water, q, to the gradient in the hydraulic potential andserved retention data than the conventional van Genuchten function.
the soil hydraulic conductivity. Application of the Rich-Two models which express the van Genuchten shape parameters � andards equation requires knowledge of both the watern in terms of two adjustable coefficients were found to be particularlycontent, �, and the hydraulic conductivity, K, as a func-attractive. The models presented in this study permit one to consider
changes in the void ratio induced both by externally applied stress tion of the pressure head, h.and by internal (i.e., hydraulic) stress. A popular equation for describing the soil water re-
tention curve, �(h), is the van Genuchten function (vanGenuchten, 1980), which enables estimation of the un-saturated soil hydraulic conductivity if combined withWater flow and solute transport processes in
structured soils depend not only on soil porosity the model of Mualem (1976). Empirical experiments toand soil texture, but also on pore shape and pore con- determine the hydraulic functions are generally time con-tinuity or tortuosity (e.g., Horton et al., 1994). The influ- suming and expensive. An alternative to direct measure-ence of soil textural and structural properties on water ments is the use of pedotransfer functions. To predict theflow can be described approximately using the pore-size water retention curve (such as the shape parameters �distribution (PSD), which is often calculated from the cor- and n in van Genuchten’s function), as well as the hydrau-responding water retention curve. However, soil pore lic conductivity, a great number of pedotransfer func-systems (including soil structure) are generally not rigid; tions have been developed which use soil texture, bulkfor example, the PSD often changes with time as a result density, or other soil variables as inputs (e.g., Tietje andof wetting and drying processes, chemical exchange, and Tapkenhinrichs, 1993). Wosten et al. (1999) developedhuman and biological activities (Leij et al., 2002; Horn, the HYPRES database for this purpose, which provides2004). Consequently, associated water flow and solute van Genuchten parameters for a wide range of Euro-transport conditions often also vary with time. Addition- pean soils.ally, the effects of stress-induced soil structural changes While the bulk density is known to have a strong ef-on the unsaturated hydraulic properties must be consid- fect on the van Genuchten parameters (Baumgartl andered. Unfortunately, such effects are seldom analyzed in Horn, 1999), only a limited few studies have examineddetail (Horn et al., 1995), mostly because they are diffi- this effect in detail. Most of these investigated the influ-cult to predict (Horton et al., 1994). ence of increasing bulk density by rainfall-induced soil
Describing and accurately quantifying dynamic changes surface sealing (e.g., Assouline, 2004). Thus far, differ-in the PSD in response to internal and external stresses ent compression conditions of the same soil material
have been assumed to lead to different soil materials,C.F. Stange and R. Horn, Institute of Plant Nutrition and Soil Science, each with their own unique retention function; this evenUniversity of Kiel, Olshausenstr. 40, 24118 Kiel, Germany; C.F Strange, tough some functional relationship between the reten-Present address: Department of Soil Sciences, UFZ Centre for Envi-
tion parameters and the compression condition is toronmental Research, Halle, Germany. Received 7 Oct. 2004. Originalbe expected.Research Paper. *Corresponding author ([email protected]).
Interactions between hydraulic and mechanical stressesPublished in Vadose Zone Journal 4:602–613 (2005). and stress-induced changes in the soil water retentiondoi:10.2136/vzj2004.0150
and PSDs are still not well documented in the literature© Soil Science Society of America677 S. Segoe Rd., Madison, WI 53711 USA (Startsev and McNabb, 2001). Our main objectives in
602
Published online July 18, 2005

Rep
rodu
ced
from
Vad
ose
Zon
e Jo
urna
l. P
ublis
hed
by S
oil S
cien
ce S
ocie
ty o
f Am
eric
a. A
ll co
pyrig
hts
rese
rved
.
www.vadosezonejournal.org 603
this paper are to address some of these interactions by is necessary to permit direct integration if Eq. [2] iscombined with Mulaem’s hydraulic conductivity modelquantifying (i) pore volume changes caused by hydraulic
stress in sandy and silty soils, and (ii) the water retention (Mualem, 1976). If the parameters m and n are assumedto be mutually independent, much more complicatedcurves as a function of previously applied mechanical
stresses. Following (i) and (ii), we compare (iii) four expressions for K(h) arise (van Genuchten et al., 1991).The use of van Genuchten’s function is limited to a rigidnew models for describing the hydraulic properties as
a function of void ratio. These models should provide soil matrix in that swelling and shrinking are assumed notto alter the water retention curve at various pore watera better basis for predicting water, gas, and/or heat trans-
port in soils. pressures. Thus, in this paper we extend van Genuchten’sapproach by accounting for the dependence of the pa-rameters �s, �r, n, and � on the void ratio.THEORETICAL ASPECTS
The saturated water content, �s, is generally assumedTheory of Soil Shrinkage to be equal or close to total soil porosity. For our general
model we assume that �s is linearly related to total soilOr and Ghezzehei (2002) distinguished between twoporosity as followscauses for structural change in soils: capillary forces of
water menisci between soil aggregates, and externalstatic loads. They studied the combined effects of these �s(e) � (P1 � P2 e)np � (P1 � P2 e)
e1 � e
[3]two factors on samples that were subjected to repeated(transient) mechanical and hydraulic stress. Bruand and where P1 and P2 are empirical parameters, np is totalProst (1987) investigated the shrinkage of aggregated soil porosity defined as Vpore/Vtot (with Vtot � Vpore � Vmatrix),clay samples due to soil water desiccation and identified and e is the void ratio defined as Vpore/Vmatrix.four shrinkage phases in plots of the void ratio vs. mois- The residual water content �r is considered to dependture ratio: (i) structural shrinkage, (ii) normal shrink- mainly on the surface area of soil particles, and thus isage, (iii) residual shrinkage, and (iv) zero shrinkage. not affected by soil compaction if expressed on a massThe void ratio, e, is defined as the ratio of pore volume, basis (Assouline 2004). Following Assouline (2004; Eq.Vpore, to the volume of the soil matrix, Vmatrix. The void ratio [7]) the relationship between the volumetric water con-enables one to relate changes in the PSD to a constant soil tent and the void ratio can be derived:volume, rather than to bulk density which is not constantin shrinking soils. �r(e) � P3
Vmatrix
Vtot
�P3
Vmatrix � Vpore
Vmatrix
�P3
1 �Vpore
Vmatrix
�P3
1 � eIf the void ratio is plotted against the pressure head, h,the resulting plot resembles a soil water retention curve. [4]Because of this similarity, the Genuchten function couldbe used also for mathematical description of soil shrink- in which P3 is an empirical parameter.age (Baumgartl and Koeck 2004): Baumgartl and Horn (1999) found linear correlations
between the van Genuchten parameters and the voide(�/ m) �
e � er
[1 � (�s |�/ m|)ns]1�(1/ns)� er [1] ratio for a very expansive clay soil. To date, no good phys-
ical basis has been established for these correlations. Ourapproach to characterize changes in the water retentionwhere e is the void ratio, e is the reference void ratiocurve can be applied not only coarse-textured (sandy)at saturation (i.e., at a pressure head of 0 kPa), er is theand medium-textured (silty) soils, but also to fine-tex-void ratio in shrinkage phase IV (no shrinkage), and nstured (clay) soils. We fitted water retention curves inde-and �s are empirical shape parameters (with ns � 1).pendently for each compression step and each soil usingNotice that Eq. [1] contains four independent param-the RETC (version 6) nonlinear parameter optimizationeters: e, er, ns, and �s.program (van Genuchten et al., 1991; www.ussl.ars.usda.gov/models/retc.htm [verified 11 Jan. 2005]). Based onTheory of Water Retention Changesresults from Baumgartl and Horn (1999) and our presentwith Varying Void Ratiostudy, the parameter � was related to e using
Soil hydraulic properties consist of the water reten-�(e) � 10P4�P5 e [5]tion curve, which describes the relationship between the
soil pressure head, h, and the volumetric water content,in which P4 and P5 are empirical parameters.
�, and the hydraulic conductivity function, which de-Conflicting evidence exists in the literature about thescribes the influence of � on the hydraulic conductivity,
influence of soil compaction on the van Genuchten pa-K(�). According to van Genuchten (1980), the waterrameter n. Assouline et al. (1997) assumed a linear de-retention curve is given bycrease in n with a change in bulk density. Horn et al.(1995) found that n can both increase or decrease with
�(�/ m) ��s � �r
[1 � (�|�/ m|)n]m� �r [2] increased mechanical stress. Because n is limited to values
greater than one (van Genuchten, 1980), we assumed heu-where � is the volumetric water content, �s and �r are ristically an exponential function for the relationshipthe saturated and residual water contents, respectively, between n and the void ratio:and n and � are empirical shape parameters (with n �1), and m � 1 � 1/n. The restriction that m � 1 � 1/n n(e) � 1 � exp(P6 � P7 e) [6]

Rep
rodu
ced
from
Vad
ose
Zon
e Jo
urna
l. P
ublis
hed
by S
oil S
cien
ce S
ocie
ty o
f Am
eric
a. A
ll co
pyrig
hts
rese
rved
.
604 VADOSE ZONE J., VOL. 4, AUGUST 2005
Table 1. Grain-size distribution, soil organic carbon content(Corg), soil nitrogen, and pH (measured in 0.1 M CaCl2) for thedifferent soil horizons at the three study sites in Germany.
Horizon Sand Silt Clay Corg Nt pH
% ‰Stagnic Chernozem
Ap (0–30 cm) 2.9 78.8 18.3 1.4 1.75 7.6Ah (30–50 cm) 2.1 78.6 19.2 1.1 1.4 7.9
Haplic PhaeozemAp (0–25 cm) 74.5 19.5 6 1.08 0.64 5.7App (25–30 cm) 71.5 20.5 8 0.7 0.53 5.7Axh (30–48 cm) 71.5 20.5 8 0.45 0.48 5.9Bv Axh (48–70 cm) 73 20 7 0.33 0.35 6.0Bv Cv (�70 cm) 75 19 6 0.17 0.22 6.1
Dystric GleysolAh (0–5 cm) 63.0 33.4 3.6 1.15 0.81 7.5
where P6 and P7 are empirical parameters. We also testeda linear equation of the form n(e) � P6 � P7 e (results notpresented here), but this approach was found inferior tothe exponential equation in terms of fitting the data.
MATERIALS AND METHODS
Investigated Soils
Soil samples were collected at three sites in Germany: a Stag-nic Chernozem site near Hildesheim (Lower Saxony), a HaplicPhaeozem site (a fallow site at the Julius-Kuhn long-term ex-perimental field in Halle, Saxony-Anhalt), and a Dystric Gley-sol site close to Busum (Schleswig Holstein). Table 1 providessome general physical and chemical properties of the threesoils. Fig. 1. Uniaxial compression device used to obtain evenly compacted
homogenized soil samples. The equipment was installed within aframe, with the pressure of the compression pistons being trans-Stagnic Chernozemmitted via a hydraulic jack (from Grasle, 1999).
The Chernozem soil material was taken from the Hilde-sheimer Borde (Bavenstedt, near Hildesheim). The soil has identical to the outer diameter of the cores, and a height equalvery high water and nutrient storage capacities, is well struc- to the height of eight cores) as shown in Fig. 1. The soils weretured, and has pronounced biological activity in the topsoil. sieved (�2 mm) and packed into the complete cylinder. TheThe arable site was artificially drained. Samples were taken soils were subsequently compacted simultaneously from bothfrom the Ap (0–30 cm) and Ah (30–50 cm) soil horizons. sides to a predefined bulk density using a uniaxial compres-
sion device.Haplic Phaeozem Only the two soil cores in the middle of the soil column
were used for our experiments, while the other six soil coresThis site was located near a loess–chernozem area typicalwere discarded because of uneven stress–strain distributionsfor the eastern Harz mountain foreland at the research farm ofwithin the samples. This procedure minimized heterogeneitythe Martin Luther University of Halle-Wittenberg. The grain-in the pore space of the two soil cores due to friction alongsize distribution of the soils inside this area varied consider-the cylinder walls. Baumgartl et al. (1999) examined the spatialably. Soil samples were taken from the Ap (0–25 cm), the Axh distributions of the bulk density in soil cores compressed in this(30–48 cm), and the BvCv (�70 cm soil depth) soil horizonsway using computer tomography images. While some inhomo-of the grassland plot.geneities existed in the outer soil cores due to the adoptedpacking and compaction process, the two inner cylinders showed
Dystric Gleysol a very homogeneous distribution of soil particles at the definedbulk density.The Dystric Gleysol site is located in Speicherkoog along
The soil cylinders were saturated and desiccated to differentthe North Sea coast south of Busum. This site represents apressure head values (for more than �3 kPa using a sand bed,typical alluvial marsh soil in its early stage of soil development.from �6 to �65 kPa using ceramic plates, and for less than �100Dikes had been built in this area until 1978. The site is currentlykPa using air pressure). More detailed information is givenbeing used as sheep pasture. Due to the climatic conditions (an-by Hartge and Horn (1992). Gravimetric water contents andnual average precipitation of 875 mm), both aerated and com-the volumes of the samples were determined after each equili-pletely water-saturated conditions occur. Samples were takenbration to the defined pore water pressure, and then used tofrom the Ah soil horizon (0–5 cm).calculate volumetric water contents. The actual soil volume wasdetermined using vernier caliper measurements at seven de-Preparation of Soil Samples fined points at the surface. Detachment of the soil from theedge of the cores occurred in most samples only at pressureGreat care was taken to prepare homogenized soil samples.
Eight cores (each having a volume of 40 cm3) were placed on heads below �150 kPa. All experiments with the homogenizedsoils were performed using four replicates.top of each other inside a cylinder (having an inside diameter

Rep
rodu
ced
from
Vad
ose
Zon
e Jo
urna
l. P
ublis
hed
by S
oil S
cien
ce S
ocie
ty o
f Am
eric
a. A
ll co
pyrig
hts
rese
rved
.
www.vadosezonejournal.org 605
Table 2. Description of the different adjustable parameters in ratio showed the most shrinkage during drying, but didModels 1 to 4. not reach the same residual void ratios compared with
P1 P2 P3 P4 P5 P6 P7 those soil samples which were more strongly pre-com-pressed during preparation. Figure 2 shows approximatelyModel 1 estim. estim. estim. estim. 0† estim. 0†
Model 2 estim. 0† estim. estim. estim. estim. 0† the four zones of the soil shrinkage curve. For moistureModel 3 estim. 0† estim. estim. 0† estim. estim. ratios greater than 1.2, the decrease in the void ratioModel 4 estim. 0† estim. estim. estim. estim. estim.
was proportional to the decrease in the moisture ratio† Parameter was fixed to zero. (i.e., normal shrinkage). For moisture ratios between
0.6 and 1.2, the volume of extracted water was higherTo test the applicability of the models to structured soils, than the shrinking soil volume (residual shrinkage).we also used undisturbed soil cores (4 cm long, 100 mL vol-
Shrinkage was noticeable less for moisture ratios belowume) taken from six different depths of the Haplic Phaeozem0.6, although the exact crossover value to zero shrinkagesoil profile in Halle. This profile had a very homogeneous soilwas difficult to determine from the data (Fig. 2).texture (Table 1), while the bulk density varied considerably
Soil shrinkage was analyzed in terms of the van Ge-with depth. The soil samples from this site were hence idealfor testing the models and comparing results for homogenized nuchten function (Eq. [1]). Figure 3 shows measuredand undisturbed structured soil cores. and calculated values of the void ratio as a function of
the pressure head. Except for the Axh horizon of theParameter Estimation Haplic Phaezem, which was better described with two
linear curves, the observed shrinkage was described veryTo simplify the analyses, parameter estimates were ob-well with van Genuchten’s function. The estimated pa-tained for the soil shrinkage (Eq. [1]) and retention (Eq. [2])rameters and coefficients of determination, r 2, for thecurves using mean average values of four replicates at each
compression step for each soil horizon. Comparative test, with soils are listed in Table 3. For each soil horizon andand without averaging, showed only minor effects of averaging compression step, the function explained more thanon the optimization parameters. Estimates at each compres- 91% of the variation in the void ratio (r 2 � 0.91).sion step were obtained with RETC for the parameters e, er, Total shrinkage of the soil samples (e � e � er)�s, and ns in the shrinkage function (Eq. [1]) and for �s, �r, �, increased with increasing reference void ratio (Table 3).and n in van Genuchten’s function (Eq. [2]). An interesting feature of the Stagnic Chernozem AhParameter estimation for the four variable porosity models
horizon is shown by the sample with the highest reference(Eq. [2] through [6]) were performed using the complete datavoid ratio (e � 1.63) in Fig. 3. This sample was compressedset for each horizon. As shown in Table 1, specific modelsso strongly by hydraulic stress that it reached a smallerwere extracted from the general models (Eq. [2] to [6]) byresidual void ratio than the samples with reference voidrestricting the estimated parameters to 5 (Models 1 to 3) or
6 (Model 4). For example, if parameter P7 in Eq. [6] is set to ratios e of 1.53, 1.36, or 1.32. One possible explanationzero and only P6 is estimated, then the equation simplifies to a is stabilization of soil particles as a result of mechanicalconstant value for n, as in the original van Genuchten function. stress applied during sample preparation. It is possibleTable 2 indicates which parameters were estimated and which that resistance against the hydraulic attractions (i.e., me-were neglected in the four model approaches. Estimates of the nisci forces) is more pronounced when the primary soilparameters in Eq. [3] to [6] were obtained with the nonlinear
particles are blocked because of particle arrangement.parameter estimation procedure NLIN of the SAS software(SAS Institute Inc., Cary, NC). In this case, all compressionsteps for each soil horizon were used directly in one run. Water Retention CurvesTo compare the four models, we additionally calculated the
The measured retention curves for the homogenizedadjusted r 2 (AR) according to (Hector et al., 2002)Ap horizon in Fig. 4 exhibit a pattern that is typical forsoils having different void ratios. Lower reference voidAR � 1 �
n � 1n � p � 1
(1 � r 2) [7]ratios lead to fewer macropores (more than �4 kPa; defini-tion after SSSA, www.soils.org/sssagloss/pdf/table 2.pdfwhere n is the sample size, and p is the number of explanatory[verified 26 Jan. 2005]) and mesopores (�4 to �10 kPa),variables. The adjusted r 2 assesses the efficiency of the differ-which can be calculated from reductions in the corre-ent models by considering their complexity and cost in terms
of the number of degrees of freedom. sponding pores near saturation. On the other hand, ul-tramicropores (i.e., pores with diameters less than 5 m,which drain at pressure heads below �60 kPa) appearRESULTS AND DISCUSSIONto be unaffected by compression. The water contents at
Soil Shrinkage Curves �150 kPa (pF 3.2) are nearly identical for the soil sam-ples compacted to different void ratios. We hence con-The shrinkage curves for the different soil types wereclude that the ultramicropores are primarily influencedfound to be qualitatively very similar. For this reasonby soil texture and only little by the applied compressionwe present here results only for the Stagnic Chernozemstress. This is supported by the estimated residual watersoil. Figure 2 and 3 shows results for the Ap and Ah ho-contents, �r, which varied only between 0.12 and 0.15rizons, respectively. The fitted parameters for all soilsm3 m�3 for the individual compression steps.are given in Table 3. The shrinkage curves of the pre-
Although the soil texture of the Ah horizon was simi-treated samples (different initial void ratios) of the Ap
lar to that of the Ap horizon, their organic carbon (Corg)horizon all showed very similar patterns, except for theirstarting points (Fig. 2). The sample with the largest void contents were quite different (Table 2). However, the

Rep
rodu
ced
from
Vad
ose
Zon
e Jo
urna
l. P
ublis
hed
by S
oil S
cien
ce S
ocie
ty o
f Am
eric
a. A
ll co
pyrig
hts
rese
rved
.
606 VADOSE ZONE J., VOL. 4, AUGUST 2005
Fig. 2. Shrinkage curves (void ratio vs. moisture ratio) for the homogenized soil samples of the Ap Stagnic Chernozem soil horizon. The differentprecompression steps are identified by reference void ratio between 1.38 and 1.69. Two shrinkage phases are shown: normal shrinkage formoisture ratios � 1.3 and residual shrinkage for moisture ratios � 1.3.
Ah horizon was more sensitive to compaction before soils are between �6 and �65 kPa (Fig. 5). The measuredwater content of the most strongly compacted samplethe experiment than the Ap horizon. While Corg is known
to strongly influence soil stability, it seems that at least (e � 0.98) at �1500 kPa differed significantly from theother samples (two-sided t test, level of significancefor our samples, Corg influenced the water-holding capac-
ity of the Ap horizon only minimally. 0.05%), whereas the estimated residual water contents(�r) increased for the Ah soil samples with increasingSamples of the Ah horizon (Fig. 5) show a redistribu-
tion of coarse to fine pores with increasing soil compac- soil compaction from 0.17 to 0.23 (m3 m�3).Figure 6 shows relationships between the estimatedtion. Soils with low compaction can store more water
than heavily compacted soils near saturation, while at van Genuchten parameter � and the reference void ratioe for all soils. For all homogenized soil samples (Stagnicmore negative pressure heads the water content in the
more compacted soil is higher. Crossover pressure heads Chernozem, Haplic Phaeozem, and Dystric Gleysol), alinear relationship was found between the logarithm ofof the retention curves for the more or less compacted
Fig. 3. Comparison of measured and fitted shrinkage curves for homogenized soil samples from the Stagnic Chernozem Ah horizon (Hildesheimsite) involving five reference void ratios between 0.98 and 1.63 at saturation. Each point represents four replicates, with the vertical linesrepresenting the standard deviation (SD) of these replicates.

Rep
rodu
ced
from
Vad
ose
Zon
e Jo
urna
l. P
ublis
hed
by S
oil S
cien
ce S
ocie
ty o
f Am
eric
a. A
ll co
pyrig
hts
rese
rved
.
www.vadosezonejournal.org 607
Table 3. Optimized parameters in the shrinkage model (Eq. [1]) this correlation was found to be not significant (P �as fitted to hydraulic stress-induced soil volume changes for 0.05, r 2 � 0.558, n � 6). We also did not find a correlationdifferent precompressed soil samples from the different soil
between the slope of the regression line and the clayhorizons at the four sites. The total shrinkage of the soil samplescontent because of the limited number of soil horizons(�e � e � er) and coefficients of determination (r 2) are given.investigated in this study. Consistent with the results inReference void ratio e es er �e ne �e r 2
Fig. 6, Grasle (1999) found linear relationships betweenStagnic Chernozem Ah log (�) and the void ratio (r 2 values ranged from 0.644
0.98 0.98 0.83 0.175 1.398 0.153 0.993 to 0.923) for four artificial sand–silt mixtures. Stress-1.32 1.32 1.14 0.308 1.240 0.181 0.977dependent changes in the van Genuchten parameters1.36 1.36 1.23 0.075 1.350 0.131 0.961
1.53 1.53 1.22 0.215 1.400 0.304 0.997 � and n for different soils are also described by Horn1.63 1.63 1.16 0.235 1.734 0.470 0.998
et al. (1995).Stagnic Chernozem Ap Startsev and McNabb (2001) found that soil compac-
1.38 1.38 1.12 0.063 1.651 0.254 0.990 tion and changes in the water retention curves caused1.51 1.51 1.21 0.065 1.673 0.304 0.9911.53 1.53 1.20 0.088 1.606 0.333 0.991 by repeatedly applied stresses, depended on the actual1.57 1.57 1.14 0.206 1.611 0.434 0.993 hydraulic condition of the soils. Soil compaction in their1.61 1.61 1.22 0.109 1.671 0.383 0.993
study was significant for only eight soils where the pres-1.69 1.69 1.26 0.116 1.632 0.423 0.994sure head was higher than the field capacity (more thanHaplic Phaeozem Ap
�15 kPa). They found that the van Genuchten param-0.45 0.45 0.42 0.028 1.732 0.033 0.9860.49 0.49 0.46 0.013 2.565 0.031 0.992 eter � decreased significantly with increasing bulk den-0.70 0.70 0.58 0.352 1.638 0.117 0.977 sity [equivalent to a decrease in log (1/�)] and increasing0.82 0.82 0.57 0.308 1.726 0.253 0.9950.91 0.91 0.56 0.494 1.865 0.359 0.990 void ratio, which agrees with our findings.
Haplic Phaeozem BvCv The effect of water potential on changes in textural0.60 0.60 0.56 0.306 1.394 0.043 0.990 and structural porosity is described in detail by Bruand0.65 0.65 0.59 0.290 1.506 0.062 0.993 and Cousin (1995). They found that when soils are nearly0.71 0.71 0.65 0.317 1.549 0.058 0.985
water saturated (pressure head more than �1 kPa), even0.86 0.86 0.71 0.227 1.915 0.153 0.9900.95 0.95 0.71 0.230 1.995 0.239 0.995 a small load (50 kPa) can cause a decrease in structural
Dystric Gleysol Ah pores, leading to smaller � values. A moderate load of1.09 1.09 1.00 0.033 3.278 0.090 0.921 200 kPa resulted in a more pronounced decrease in struc-1.10 1.10 1.00 0.037 3.100 0.101 0.942 tural porosity, and an increase in textural porosity. Bruand1.19 1.19 1.04 0.050 2.973 0.149 0.9351.20 1.20 1.01 0.052 2.733 0.184 0.918 and Cousin (1995) explained the increase in smaller pores
as being a relic of destroyed structural pores by compac-tion. This change in the PSD could also be obtained bythe reciprocal value of � [log (1/�)] and the reference voidincreasing the parameter n. A high load (600 kPa) in aratio e. The slope of the regression lines varied betweenwet soil produced a much lower structural porosity but�0.40 (Dystric Gleysol Ah) and �3.22 (Haplic Phaeo-did not lead to changes in the textural porosity. In soilszem Axh). While Fig. 6 also suggests that with increasing
Corg content the slope of the regression line will decrease, equilibrated at pressure heads between �63 and �1000
Fig. 4. Comparison of measured and fitted water retention curves for homogenized soil samples from the Stagnic Chernozem Ap horizon(Hildesheim site) involving five reference void ratios between 1.38 and 1.69 at saturation. Each point represents four replicates, with thevertical lines representing the standard deviation (SD) of these replicates.

Rep
rodu
ced
from
Vad
ose
Zon
e Jo
urna
l. P
ublis
hed
by S
oil S
cien
ce S
ocie
ty o
f Am
eric
a. A
ll co
pyrig
hts
rese
rved
.
608 VADOSE ZONE J., VOL. 4, AUGUST 2005
Fig. 5. Comparison of measured and fitted water retention curves for homogenized soil samples from the Stagnic Chernozem Ah horizon(Hildesheim site) involving five different reference void ratios between 0.98 and 1.63 at saturation. Each point represents four replicates, withthe vertical lines representing the standard deviation (SD).
kPa, textural porosity was unaffected by compaction, van Genuchten parameter n and the reference void ratioe has been identified in the literature. The behavior ofwhile structural porosity decreased only at the higher
loads (both at 200 and 600 kPa). In another study, Baum- n differs between soils (Table 4). While n of the StagnicChernozem Ap horizon, the Haplic Phaeozem BvCv hori-gartl and Horn (1999) observed a significant linear rela-
tionship between calculated van Genuchten parameters zon, and the Dystric Gleysol Ah horizon decreased withincreasing reference void ratio e, n of the Stagnic Cher-and the void ratio for a slightly expansive soil (kaolinitic
clay). Both log (1/�) and n decreased with increasing nozem Ah horizon and the Haplic Phaeozem Axh horizonshowed no significant correlation with e, with n beingvoid ratio.
In contrast to �, no uniform relationship between the relatively constant over the range of e values. In contrast,
Fig. 6. Linear relationship between the logarithm of the reciprocal value of � [log(1/�)] and the reference void ratio e for all soils. The estimatedvan Genuchten parameter values are presented in Table 4.

Rep
rodu
ced
from
Vad
ose
Zon
e Jo
urna
l. P
ublis
hed
by S
oil S
cien
ce S
ocie
ty o
f Am
eric
a. A
ll co
pyrig
hts
rese
rved
.
www.vadosezonejournal.org 609
Table 4. van Genuchten water retention parameters estimated was significant only for pure sand. For the pure silt sam-separately for each soil horizon and each compression step ples he found n to be independent of the void ratio.using RETC. The coefficients of determination (r 2) indicate
Our results, on the other hand, appear more consistentthe goodness of fit between the van Genuchten function andwith those by Startsev and McNabb (2001) who foundthe measured retention data.an increase in n from the third to the seventh skiddingReference void ratio e �s �r � n r2
cycles, although this change was not significant.Stagnic Chernozem Ah Richard et al. (2001) published hydraulic properties
0.98 0.42 0.23 0.006 1.796 0.890 (water retention curve and the unsaturated conductiv-1.32 0.49 0.20 0.022 1.793 0.995
ity) for compacted and noncompacted soils. By using1.36 0.50 0.19 0.025 1.787 0.9871.53 0.53 0.19 0.028 1.737 0.968 water retention data only to estimate the van Genuch-1.63 0.57 0.17 0.028 1.524 0.999 ten parameters with RETC, no significant differences
Stagnic Chernozem Ap were found between n of the compacted and the non-1.38 0.58 0.14 0.018 1.503 0.989 compacted soils. This was in contrast to when n was1.51 0.58 0.12 0.023 1.461 0.995
calculated from both the water retention data and unsat-1.53 0.55 0.12 0.024 1.473 0.9911.57 0.58 0.12 0.024 1.479 0.997 urated conductivity (n was 1.10 � 0.08 SE for the non-1.61 0.58 0.13 0.026 1.477 0.996 compacted soils and 1.54 � 0.08 SE for the com-1.69 0.59 0.15 0.021 1.449 0.995
pacted soils).Haplic Phaeozem ApWe also tested possible linear relationships between
0.45 0.31 0 0.032 1.153 0.986the soil shrinkage parameters �s and ns and the van0.49 0.32 0.04 0.038 1.237 0.992
0.70 0.38 0.11 0.045 1.479 0.977 Genuchten parameters � and n. No significant correla-0.82 0.41 0.09 0.073 1.350 0.995 tions were found for each of the four tests.0.91 0.43 0.05 0.128 1.240 0.990
Haplic Phaeozem Axh
Water Retention Models at Variable Porosity0.48 0.32 0 0.033 1.192 0.9850.50 0.33 0 0.046 1.184 0.975
Stagnic Chernozem0.52 0.34 0 0.049 1.190 0.9840.56 0.36 0.004 0.062 1.203 0.981
Models 1 to 4 were first applied to the homogenized0.60 0.36 0.002 0.078 1.197 0.9870.65 0.39 0.04 0.089 1.262 0.989 soil samples of the Stagnic Chernozem Ap horizon. Mod-0.78 0.43 0.01 0.388 1.189 0.996 els 1 to 3 each contain five unknown parameters, while
Haplic Phaeozem BvCv one of the unknown retention parameters �s, �, or n is0.60 0.31 0.07 0.017 1.499 0.990 described interchangeably in terms of two coefficients.0.65 0.33 0.07 0.020 1.494 0.993
Model 4 is the most general in that six coefficients are0.71 0.35 0.07 0.028 1.512 0.9850.86 0.38 0.06 0.041 1.457 0.990 fitted. This model also includes the approaches of Mod-0.95 0.39 0.04 0.066 1.325 0.995 els 2 and 3. The general model with seven estimated
Dystric Gleysol Ah coefficients, which includes Models 1 to 3, was not tested1.09 0.44 0.10 0.009 5.19 0.987 since results for Model 1 (linear function for �s) demon-1.10 0.46 0.11 0.008 5.11 0.995
strated only a very small effect of parameter P2. For1.19 0.47 0.12 0.009 3.87 0.9971.20 0.48 0.12 0.009 3.91 0.996 most soils P2 in Model 1 was not significantly different
from zero as indicated by the high estimated standarderror. Good agreement was obtained between observedn of the Haplic Phaeozem Ap horizon varied consider-
ably without a clear trend. Our results are consistent and simulated values for all models. Except for Model 1for the Ah horizon, differences were negligible relativewith those of Horn et al. (1995) who found that n could
increase or decrease with increased mechanical stress. to the standard deviations of the measurements. Resultsof the model comparison for the Stagnic ChernozemGrasle (1999) found n to decrease with increasing void
ratio for three out of four soils, although the regression are summarized in Table 5.
Table 5. Parameter optimization results (estimated value � standard error) for the four models given by Eq. [3] through [6] (see alsoTable 2) for the two Stagnic Chernozem soil horizons. Also indicated are parameters with the highest correlation, correspondingcorrelation coefficients, coefficients of determination (r 2), and the adjusted r 2 (AR). Conventional van Genuchten parameters aregiven in the row labeled VG (i.e., P1 � �s, P3 � �r, P4 � �, and P6 � n ).
P1 P2 P3 P4 P5 P6 P7 Correlation r 2 AR
Stagnic Chernozem Ap
Model 1 1.08 � 0.05 �0.10 � 0.03 0.30 � 0.01 �1.73 � 0.03 0 �0.69 � 0.05 0 (1;2) �0.997 0.988 0.988Model 2 0.94 � 0.00 0† 0.31 � 0.01 �2.47 � 0.15 0.52 � 0.11 �0.58 � 0.05 0 (4;5) �0.990 0.989 0.989Model 3 0.93 � 0.00 0 0.29 � 0.01 �1.82 � 0.02 0 �2.12 � 0.23 1.21 � 0.19 (6;7) �0.983 0.989 0.989Model 4 0.93 � 0.00 0 0.29 � 0.01 �1.72 � 0.25 �0.07 � 0.19 �2.24 � 0.39 1.30 � 0.29 (4;5) �0.997 0.989 0.989VG 0.56 � 0.00 0.13 � 0.01 0.023 � 0.001 1.48 � 0.02 0.987 0.987
Stagnic Chernozem Ah
Model 1 1.06 � 0.03 �0.12 � 0.03 0.45 � 0.01 �1.71 � 0.04 0 �0.20 � 0.08 0 (1;2) �0.979 0.946 0.945Model 2 0.91 � 0.01 0 0.42 � 0.01 �3.33 � 0.11 1.26 � 0.08 �0.16 � 0.07 0 (4;5) �0.971 0.975 0.975Model 3 0.90 � 0.01 0 0.39 � 0.01 �1.69 � 0.03 0 �2.80 � 0.25 1.99 � 0.20 (6;7) �0.952 0.958 0.957Model 4 0.91 � 0.01 0 0.42 � 0.01 �3.36 � 0.18 1.29 � 0.15 �0.10 � 0.38 �0.04 � 0.50 (6;7) �0.991 0.975 0.974VG 0.50 � 0.01 0.19 � 0.01 0.022 � 0.003 1.64 � 0.01 0.899 0.897
† Coefficient fixed to zero.
Rep
rodu
ced
from
Vad
ose
Zon
e Jo
urna
l. P
ublis
hed
by S
oil S
cien
ce S
ocie
ty o
f Am
eric
a. A
ll co
pyrig
hts
rese
rved
.
610 VADOSE ZONE J., VOL. 4, AUGUST 2005
and void ratio for Model 2. Clearly, a single conventionalvan Genuchten function is unable to accurately describethe water retention data of this horizon for all compres-sion steps (r 2 was �0.9).
Haplic Phaeozem
All models, except Model 3 for the Axh horizon (r 2 �0.946), produced very good agreement (r 2 � 0.96) withthe water retention data of the three horizons (Ap, Axh,and BvCv) of this soil. The variable porosity models gavesignificantly better descriptions of the data than the con-ventional van Genuchten function (r 2 for the three hori-zons varied between 0.912 and 0.952), which suggeststhat the use of one more adjustable parameter for theour new modeling approach is justifiable.
As expected, the best fits for the Haplic Phaeozemsoil samples were obtained with Model 4 (Table 6).Model 4, however, showed high correlation between theoptimized parameters (Table 6). Because of this and theFig. 7. Calculated water retention surface at variable porosity for
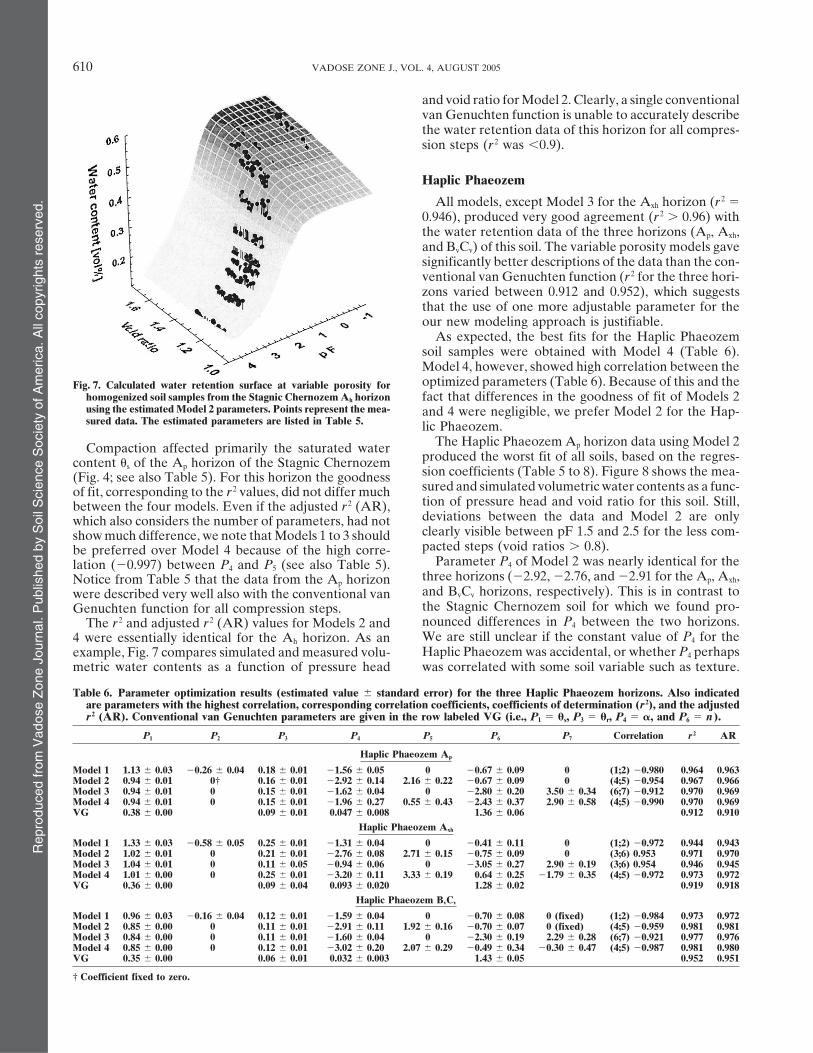
homogenized soil samples from the Stagnic Chernozem Ah horizon fact that differences in the goodness of fit of Models 2using the estimated Model 2 parameters. Points represent the mea- and 4 were negligible, we prefer Model 2 for the Hap-sured data. The estimated parameters are listed in Table 5. lic Phaeozem.
The Haplic Phaeozem Ap horizon data using Model 2Compaction affected primarily the saturated waterproduced the worst fit of all soils, based on the regres-content �s of the Ap horizon of the Stagnic Chernozemsion coefficients (Table 5 to 8). Figure 8 shows the mea-(Fig. 4; see also Table 5). For this horizon the goodnesssured and simulated volumetric water contents as a func-of fit, corresponding to the r 2 values, did not differ muchtion of pressure head and void ratio for this soil. Still,between the four models. Even if the adjusted r 2 (AR),deviations between the data and Model 2 are onlywhich also considers the number of parameters, had notclearly visible between pF 1.5 and 2.5 for the less com-show much difference, we note that Models 1 to 3 shouldpacted steps (void ratios � 0.8).be preferred over Model 4 because of the high corre-
Parameter P4 of Model 2 was nearly identical for thelation (�0.997) between P4 and P5 (see also Table 5).three horizons (�2.92, �2.76, and �2.91 for the Ap, Axh,Notice from Table 5 that the data from the Ap horizonand BvCv horizons, respectively). This is in contrast towere described very well also with the conventional vanthe Stagnic Chernozem soil for which we found pro-Genuchten function for all compression steps.nounced differences in P4 between the two horizons.The r 2 and adjusted r 2 (AR) values for Models 2 andWe are still unclear if the constant value of P4 for the4 were essentially identical for the Ah horizon. As anHaplic Phaeozem was accidental, or whether P4 perhapsexample, Fig. 7 compares simulated and measured volu-
metric water contents as a function of pressure head was correlated with some soil variable such as texture.
Table 6. Parameter optimization results (estimated value � standard error) for the three Haplic Phaeozem horizons. Also indicatedare parameters with the highest correlation, corresponding correlation coefficients, coefficients of determination (r 2), and the adjustedr 2 (AR). Conventional van Genuchten parameters are given in the row labeled VG (i.e., P1 � �s, P3 � �r, P4 � �, and P6 � n ).
P1 P2 P3 P4 P5 P6 P7 Correlation r 2 AR
Haplic Phaeozem Ap
Model 1 1.13 � 0.03 �0.26 � 0.04 0.18 � 0.01 �1.56 � 0.05 0 �0.67 � 0.09 0 (1;2) �0.980 0.964 0.963Model 2 0.94 � 0.01 0† 0.16 � 0.01 �2.92 � 0.14 2.16 � 0.22 �0.67 � 0.09 0 (4;5) �0.954 0.967 0.966Model 3 0.94 � 0.01 0 0.15 � 0.01 �1.62 � 0.04 0 �2.80 � 0.20 3.50 � 0.34 (6;7) �0.912 0.970 0.969Model 4 0.94 � 0.01 0 0.15 � 0.01 �1.96 � 0.27 0.55 � 0.43 �2.43 � 0.37 2.90 � 0.58 (4;5) �0.990 0.970 0.969VG 0.38 � 0.00 0.09 � 0.01 0.047 � 0.008 1.36 � 0.06 0.912 0.910
Haplic Phaeozem Axh
Model 1 1.33 � 0.03 �0.58 � 0.05 0.25 � 0.01 �1.31 � 0.04 0 �0.41 � 0.11 0 (1;2) �0.972 0.944 0.943Model 2 1.02 � 0.01 0 0.21 � 0.01 �2.76 � 0.08 2.71 � 0.15 �0.75 � 0.09 0 (3;6) 0.953 0.971 0.970Model 3 1.04 � 0.01 0 0.11 � 0.05 �0.94 � 0.06 0 �3.05 � 0.27 2.90 � 0.19 (3;6) 0.954 0.946 0.945Model 4 1.01 � 0.00 0 0.25 � 0.01 �3.20 � 0.11 3.33 � 0.19 0.64 � 0.25 �1.79 � 0.35 (4;5) �0.972 0.973 0.972VG 0.36 � 0.00 0.09 � 0.04 0.093 � 0.020 1.28 � 0.02 0.919 0.918
Haplic Phaeozem BvCv
Model 1 0.96 � 0.03 �0.16 � 0.04 0.12 � 0.01 �1.59 � 0.04 0 �0.70 � 0.08 0 (fixed) (1;2) �0.984 0.973 0.972Model 2 0.85 � 0.00 0 0.11 � 0.01 �2.91 � 0.11 1.92 � 0.16 �0.70 � 0.07 0 (fixed) (4;5) �0.959 0.981 0.981Model 3 0.84 � 0.00 0 0.11 � 0.01 �1.60 � 0.04 0 �2.30 � 0.19 2.29 � 0.28 (6;7) �0.921 0.977 0.976Model 4 0.85 � 0.00 0 0.12 � 0.01 �3.02 � 0.20 2.07 � 0.29 �0.49 � 0.34 �0.30 � 0.47 (4;5) �0.987 0.981 0.980VG 0.35 � 0.00 0.06 � 0.01 0.032 � 0.003 1.43 � 0.05 0.952 0.951
† Coefficient fixed to zero.

Rep
rodu
ced
from
Vad
ose
Zon
e Jo
urna
l. P
ublis
hed
by S
oil S
cien
ce S
ocie
ty o
f Am
eric
a. A
ll co
pyrig
hts
rese
rved
.
www.vadosezonejournal.org 611
Table 7. Parameter optimization results (estimated value � standard error) for the Dystric Gleysol Ah horizon. Also indicated areparameters with the highest correlation, corresponding correlation coefficients, coefficients of determination (r 2), and the adjustedr 2 (AR). Conventional van Genuchten parameters are given in the row labeled VG (i.e., P1 � �s, P3 � �r, P4 � �, and P6 � n ).
Dystric Gleysol Ah
P1 P2 P3 P4 P5 P6 P7 Correlation r2 AR
Model 1 0.80 � 0.05 0.09 � 0.05 0.22 � 0.01 �2.07 � 0.02 0 1.42 � 0.19 0 (1;2) �0.996 0.980 0.980Model 2 0.90 � 0.00 0† 0.22 � 0.01 �0.20 � 0.21 �1.99 � 0.23 1.15 � 0.09 0 (4;5) �0.998 0.984 0.984Model 3 0.89 � 0.00 0 0.23 � 0.01 �2.12 � 0.05 0 7.51 � 2.32 �6.02 � 2.09 (6;7) �0.958 0.980 0.979Model 4 0.90 � 0.00 0 0.22 � 0.01 0.04 � 0.24 �2.25 � 0.57 �4.95 � 1.52 6.72 � 1.71 (6;7) �0.998 0.986 0.986VG 0.45 � 0.00 0.11 � 0.01 0.010 � 0.001 1.36 � 0.04 0.969 0.968
† Coefficient fixed to zero.
Dystric Gleysol void ratio, and hence that the new models do allow pre-dictions of the water retention curves of the 6 horizonsBecause of the very uniform grain-size distribution ofusing only five or six parameters. Differences betweenthe Dystric Gleysol (31% coarse silt and 62% fine sand,the different models were negligibly small, with all mod-while 93% of the soil consisted of particles between 20els showing accurate descriptions of the measured waterand 200 m), only very small differences in the referenceretention curves (r 2 � 0.964). The accuracy of the mod-void ratio could be achieved. The estimated model pa-els was comparable to the accuracy obtained when therameters (Table 7) were hence limited to only a smalldata were described with horizon-specific van Genuch-range of void ratios, while differences between the waterten functions (requiring a total of 24 parameters for theretention model assuming variable porosity and the con-six horizons). The coefficients of determination for theventional van Genuchten function, which had one pa-conventional van Genuchten functions ranged fromrameter less, were relatively small. Consequently, the0.909 to 0.982 for the various horizons.question arises if the use of one additional parameter is
Figure 9 compares measured and simulated volumet-justified, or if it is better to use the original van Genuchtenric water contents as a function of both pressure headfunction for this soil. Both modeling approaches de-and void ratio for the structured Haplic Phaeozem soilscribe the data for this soil very well, with differencessamples for both Model 2 (Fig. 9a) and Model 3 (Fig. 9b).in the coefficients of determination (r 2) between theThis example can be applied to all investigated soilsfour variable porosity models being negligible smallsince the differences between Models 2 and 3 are negligi-(Table 7).ble small. The best r 2 values were found for Model 4,and the best adjusted r 2 for Model 2. The insignificanceApplication to Structured Soil Samplesof the differences is also reflected by the fact that theThe above results show that the variable porosityestimation error of parameter P5 was higher than itsmodels can be used to predict the influence of void ratiovalue (Table 8), which indicates that P5 is not signifi-changes on the water retention curves of homogenizedcantly different from zero. This shows that this param-unstructured (repacked) soil samples. However, the soileter is not really needed and that Model 4 can be simpli-hydraulic functions of field soils (the water retentionfied to Model 3. Additionally the correlation betweenand unsaturated hydraulic conductivity functions) areP4 and P5 was very high (Table 8), which means thatknow to depend strongly on soil structure. The applica-one parameter can be explained by the other.bility of the models to structured soil samples was tested
To create similar graphs for the undisturbed soil sam-on undisturbed soil samples from the Haplic Phaeozemples, at least five or six soil samples with different voidsite (Halle, Germany) with different reference void ra-ratios should be available, which are nearly impossibletios. We note here that not only the reference void ratioto obtain for in situ conditions. Instead, we tested thebut also the Corg content varied with soil depth, whileparameter optimization results using all the availablesoil texture was very uniform throughout the entire soilHaplic Phaeozem input data compared to a selected inputprofile (Table 1).data set (only two horizons). Table 9 shows results forThe parameter estimation results indicate that differ-this case, and when the input data are reduced to theences in water retention between the Haplic Phaeozem
horizons can be explained very well by changes in the least dense horizon (BvCv) and the most compacted soil
Table 8. Parameter optimization results (estimated value � standard error) for the undisturbed soil samples from the five HaplicPhaeozem horizons having reference void ratio values between 0.50 and 0.84. Also indicated are parameters with the highest correlation,corresponding correlation coefficients, coefficients of determination (r 2), and the adjusted r 2 (AR). Conventional van Genuchtenparameters are given in the row labeled VG (i.e., P1 � �s, P3 � �r, P4 � �, and P6 � n ).
Haplic Phaeozem undisturbed
P1 P2 P3 P4 P5 P6 P7 Correlation r2 AR
Model 1 1.05 � 0.03 �0.20 � 0.04 0.24 � 0.01 �1.62 � 0.03 0 0.23 � 0.11 0 (1;2) �0.966 0.931 0.930Model 2 0.91 � 0.01 0† 0.21 � 0.01 �2.52 � 0.07 1.28 � 0.10 �0.01 � 0.10 0 (4;5) �0.937 0.951 0.950Model 3 0.92 � 0.01 0 0.16 � 0.02 �1.50 � 0.03 0 �2.05 � 0.19 2.35 � 0.19 (3;6) �0.767 0.943 0.942Model 4 0.91 � 0.01 0 0.20 � 0.01 �2.46 � 0.11 1.21 � 0.15 �0.22 � 0.31 0.24 � 0.36 (4;5) �0.971 0.951 0.950VG 0.36 � 0.00 0.11 � 0.02 0.028 � 0.003 1.70 � 0.18 0.861 0.859
† Coefficient fixed to zero.

Rep
rodu
ced
from
Vad
ose
Zon
e Jo
urna
l. P
ublis
hed
by S
oil S
cien
ce S
ocie
ty o
f Am
eric
a. A
ll co
pyrig
hts
rese
rved
.
612 VADOSE ZONE J., VOL. 4, AUGUST 2005
Fig. 8. Calculated water retention surface at variable porosity forhomogenized soil samples from the Haplic Phaeozem Ap horizonusing the estimated Model 2 parameters. Points represent the mea-sured data. The estimated parameters are listed in Table 6.
horizon (App) only. Using only two different void ratiosmay define the conditions before and after tillage. The es-timated parameter values were found to be nearly iden-tical. Even parameter P6, which showed the largest dif-ference, was essentially zero because of its high standarderror. This indicates that the models are useful also tointerpolate between different compaction situations ifonly retention data for the noncompacted and mostcompacted steps are available.
CONCLUSIONSInternal and external stresses change the total soil
porosity and the PSD of soils, not only for fine-textured(clay) soils but also for medium-textured (silty) andcoarse-textured (sandy) soils. This study points out thatshrinkage during hydraulic stress will affect also thewater retention curve of sandy and silty soils. Internalstresses can change the porosity and PSD, especially ofloose soils after tillage, and consequently the soil hy-draulic functions. Human activities such as soil compac-tion by traffic or cultivation can also lead to changes.Assouline (2004) considers compaction of the soil sur-face to be a predominant factor for changing hydraulic
Fig. 9. Comparison of the calculated water retention surfaces withproperties by rainfall-induced soil surface sealing. The the observed retention data for soil samples from the differentmodels presented in this study permit one to account Haplic Phaeozem horizons. The calculated retention surfaces were
obtained with estimated (A) Model 2 and (B) Model 3 parameters.for changes in the void ratio induced both by externallyThe estimated parameters are listed in Table 8.applied stress and by internal (i.e., hydraulic) stress.
Leij et al. (2002) illustrated changes in the water re-tention curve of a soil after a sequence of wetting and equation could also be used to predict the changes in
the PSD (Leij et al., 2002) and to deduce the soil waterdrying cycles. They observed a decrease in the saturatedwater content from 0.57 to 0.51 after the first drying retention curve from the PSD. The data and the results
in this paper should improve our understanding of theand rewetting cycle, and to 0.50 after five cycles, whichconfirms our results. This shows that changes in the systematic influence of the void ratio on hydraulic pa-
rameters, which in turn could be useful for extendinghydraulic functions cannot be neglected. Our proposedsoil water retention model for variable porosity provides pedotransfer functions to conditions involving vari-
able porosity.a possible basis for considering such changes in thehydraulic functions. Alternatively, the Fokker–Planck What model is best? Our results suggest that no unique

Rep
rodu
ced
from
Vad
ose
Zon
e Jo
urna
l. P
ublis
hed
by S
oil S
cien
ce S
ocie
ty o
f Am
eric
a. A
ll co
pyrig
hts
rese
rved
.
www.vadosezonejournal.org 613
Table 9. Estimated parameters and their standard errors for Model 2 as obtained with data from all five Haplic Phaeozem horizons,and using data from only the least compressed BvCv (e � 0.84) and most compacted App (e � 0.50) horizons.
P1 P3 P4 P5 P6
Model 2 (all horizons) 0.91 � 0.01 0.21 � 0.01 �2.52 � 0.07 1.28 � 0.10 �0.01 � 0.10Model 2 (only App and BvCv) 0.88 � 0.01 0.19 � 0.02 �2.50 � 0.10 1.23 � 0.13 �0.18 � 0.15
lic stresses on hydraulic properties of swelling soils. p. 449–458. Inanswer exists. With the exception of the Haplic Phaeo-M.Th. van Genuchten, F. J. Leij, and L. Wu (ed.) Characterizationzem Axh horizon, the coefficients of determination forand measurement of the hydraulic properties of unsaturated porous
Models 2 and 3 were essentially identical. Both models media. Univ. of California, Riverside.accurately described the water retention data using vari- Baumgartl, T., and B. Koeck. 2004. Modeling volume change and
mechanical properties with hydraulic models. Soil Sci. Soc. Am. J.able void ratios, and with less correlation between fitted68(1):57–65.parameters as compared with Model 4. Additionally,
Bruand, A., and R. Prost. 1987. Effect of water content on the fabricthe relationship between the void ratio and the param- of a soil material: An experimental approach. J. Soil Sci. 38:461–472.eter � was clearer than the relationship between the Bruand, A., and I. Cousin. 1995. Variation of textural porosity of a
clay-loam soil during compaction. Eur. J. Soil Sci. 46:377–385.van Genuchten parameter n and the void ratio (see alsoGrasle, W. 1999. Numerical simulation of mechanical, hydraulic, andStartsev and McNabb 2001, Grasle 1999, Baumgartl and
linked processes in soils using Finite Elements Method (in Ger-Horn 1999). This corresponds with the view that for man). Ph.D. Diss. University of Kiel, Germany. (Schriftenreihe desPSDs derived from the water retention curve, n reflects Instituts fur Pflanzenernahrung und Bodenkunde, CAU Kiel 48).
Hartge, K.H., and R. Horn. 1992. Bodenphysikalisches Praktikum.the slope and � the location of the maximum of the3 ed. Enke Verlag, Stuttgart, Germany.distribution. On the other hand, if the maximum is not in
Hector, A., M. Loreau, B. Schmid 2002. Biodiversity manipulationnear the macropores, and the macropores are mostly experiments: Studies replicated at multiple site. p. 36–46. In M.affected by compaction (Bruand and Cousin, 1995), the Loreau, S. Naeem, and P. Inchausti (ed.) Biodiversity and ecosys-
tem functioning. Oxford University Press.parameter n should be expected to change also. Addi-Horn, R. 2004. Time dependency of soil mechanical properties andtional measurements of the influence of pore-size changes
pore functions for arable soils. Soil Sci. Soc. Am. J. 68:1131–1137.on the unsaturated hydraulic conductivity may be needed Horn, R., T. Baumgartl, W. Grasle, and B.G. Richards. 1995. Stressto further improve and validate the modeling approaches inducted changes of hydraulic properties in soils. p. 123–127. Inoutlined in this paper. Maybe such data would allow E.E. Alonso and P. Delage (ed.) Unsaturated soils. A.A. Balkema,
Rotterdam, The Netherlands.one to distinguish better between Models 2 and 3.Horton, R., M.D. Alkeny, and R.R. Allmaras. 1994. Effects of compac-In contrast, Model 1 produced lower r 2 and adjusted
tion on soil hydraulic properties. p. 141–165. In B.D. Soane andr 2 values for all experiments. The residuals (observed vs. C. van Ouwerkerk (ed.) Soil compaction in crop production. Else-predicted values) for this model were generally less ran- vier, Amsterdam.
Leij, F.J., T.A. Ghezzehei, and D. Or. 2002. Modeling the dynamicsdomly distributed that those of Models 2, 3, and 4. Also,of the soil pore-size distribution. Soil Tillage Res. 6:61–78.while four of seven optimizations with Model 4 showed
Mualem, Y. 1976. A new model for predicting the hydraulic con-the highest adjusted r 2, this model is not favored because ductivity of unsaturated porous media. Water Resour. Res. 12:of an additional parameter. This additional parameter 513–522.
Or, D., and T.A. Ghezzehei. 2002. Modeling post-tillage soil structuralis not necessary to obtain accurate results, as was dem-dynamics: A review. Soil Tillage Res. 64:41–59.onstrated with Models 2 and 4.
Richard, G., J.F. Sillon, and O. Marloie. 2001. Comparison of inverseand direct evaporation methods for estimating soil hydraulic prop-erties under different tillage practices. Soil Sci. Soc. Am. J. 65:ACKNOWLEDGMENTS215–224.
The authors thank Mrs. D. Rexilius for her technical assis- Smiles, E.D. 2000. Hydrology of swelling soils: A review. Aust. J. Soiltance in the laboratory and the reviewers not only for their Res. 38:501–521.
Startsev, A.D., and D.H. McNabb. 2001. Skidder traffic effects onvaluable comments but also for the time-consuming correc-water retention, pore-size distribution and van Genuchten param-tions of the English text. We also thank Mrs. P. Clowes for im-eters of boreal forest soils. Soil Sci. Soc. Am. J. 65:224–231.proving the English text and style. We thank the German
Terzaghi, K. 1923. Die Berechnung der Durchlassigkeitsziffer desResearch Foundation (DFG) for the financial support of thisTones aus dem Verlauf der hydrodynamischen Spannungserschei-research by the grant HO 911/24. nung. Akademie der Wissenschaften, Mathematisch-Naturwis-senschaftliche Klasse, Teil IIa. 132 (3–4):125–138.
Tietje, O., and M. Tapkenhinrichs. 1993. Evaluation of pedo-transferREFERENCESfunctions. Soil Sci. Soc. Am. J. 57:1088–1095.
Assouline, S. 2004. Rainfall-induced soil surface sealing: A critical van Genuchten, M.Th., F.J. Leij, and S.R. Yates. 1991. The RETCreview of observations, conceptual models, and solutions. Available code for quantifying the hydraulic functions of unsaturated soils.at www.vadosezonejournal.org. Vadose Zone J. 3:570–591. (Available at www.ussl.ars.usda.gov/models/retc.htm; verified 11 Jan.
Assouline, S., J. Tavares-Filho, and D. Tessier. 1997. Effect of compac- 2005). Report No. EPA/600/2–91/065. R.S. Kerr Environ. Res. Lab.,tion on soil physical and hydraulic properties: Experimental results USEPA, Ada, OK.and modeling. Soil Sci. Soc. Am. J. 61:390–398. van Genuchten, M.Th. 1980. A closed-form equation for predicting
Baumgartl, T., I. Onasch, and H. Rogasik. 1999. Homogenitat kunst- the hydraulic conductivity of unsaturated soils. Soil Sci. Soc.lich hergestellter Bodenproben—Vergleich bodenphysikalischer Am. J. 44:892–898.Kenngroßen mit CT-Analysen. Mitt. Dtsch. Bodenkde. Ges. 91: Wosten, H. M., A. Lilly, A. Nemes, and C. Le Bas. 1999. Development132–135. and use of a database of hydraulic properties of European soils.
Geoderma 90 (3–4):169–185.Baumgartl, T., and R. Horn. 1999. Influence of mechanical and hydrau-