modeling potential freshwater ecotoxicity impacts due to pesticide use in biofuel feedstock...
TRANSCRIPT
Modeling Potential Freshwater Ecotoxicity Impacts Due to PesticideUse in Biofuel Feedstock Production: The Cases of Maize, Rapeseed,Salix, Soybean, Sugar Cane, and WheatMaria Nordborg,* Christel Cederberg,* and Goran Berndes
Department of Energy and Environment, Division of Physical Resource Theory, Chalmers University of Technology, SE-412 96Gothenburg, Sweden
*S Supporting Information
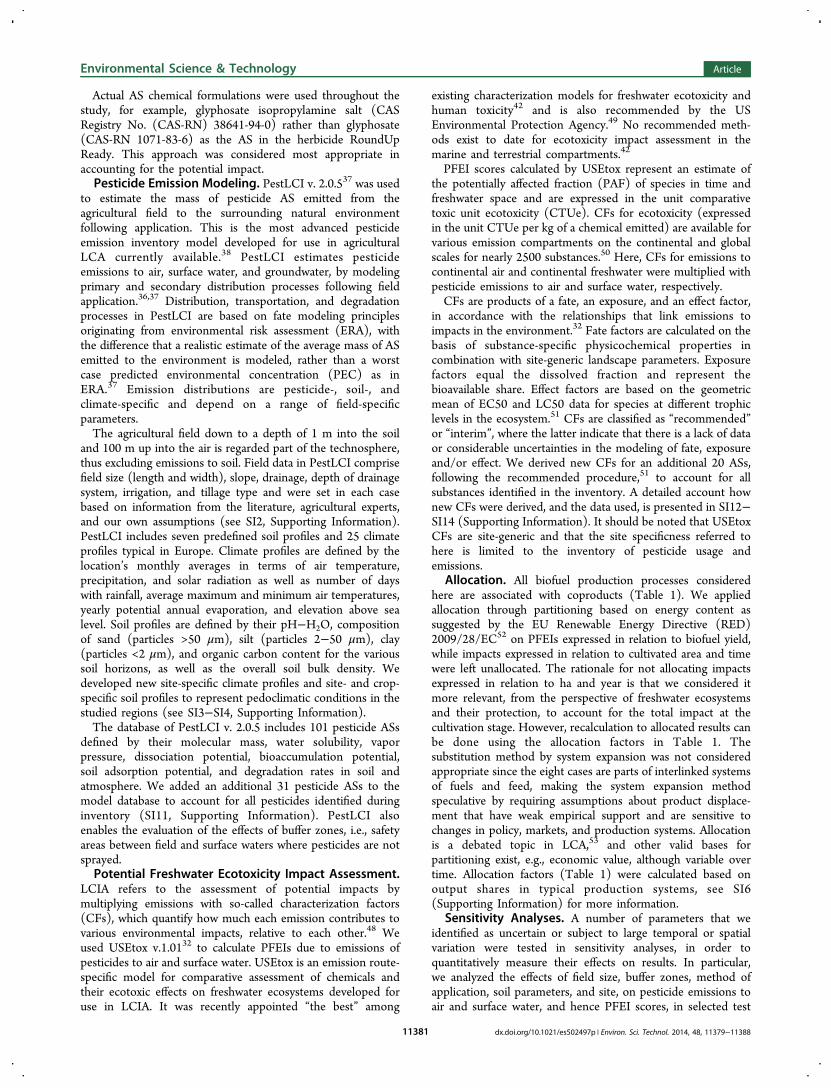
ABSTRACT: The inclusion of ecotoxicity impacts ofpesticides in environmental assessments of biobased productshas long been hampered by methodological challenges. Weexpanded the pesticide database and the regional coverage ofthe pesticide emission model PestLCI v.2.0, combined it withthe impact assessment model USEtox, and assessed potentialfreshwater ecotoxicity impacts (PFEIs) of pesticide use inselected biofuel feedstock production cases, namely: maize(Iowa, US, two cases), rapeseed (Schleswig-Holstein,Germany), Salix (South Central Sweden), soybean (MatoGrosso, Brazil, two cases), sugar cane (Sao Paulo, Brazil), andwheat (Schleswig-Holstein, Germany). We found that PFEIscaused by pesticide use in feedstock production varied greatly, up to 3 orders of magnitude. Salix has the lowest PFEI per unit ofenergy output and per unit of cultivated area. Impacts per biofuel unit were 30, 750, and 1000 times greater, respectively, for thesugar cane, wheat and rapeseed cases than for Salix. For maize genetically engineered (GE) to resist glyphosate herbicides and toproduce its own insecticidal toxin, maize GE to resist glyphosate, soybeans GE to resist glyphosate and conventional soybeans,the impacts were 110, 270, 305, and 310 times greater than for Salix, respectively. The significance of field and site-specificconditions are discussed, as well as options for reducing negative impacts in biofuel feedstock production.
■ INTRODUCTIONThe transport sector contributed an estimated 22% of globalCO2 emissions in 2011,1 and global demand for transport isexpected to grow significantly over the coming decades. TheInternational Energy Agency (IEA) projects that transport fueldemand will grow by nearly 40% between 2011 and 2035.2
Biomass-based transport fuels (biofuels) currently supplyaround 3% of global road transport fuel demand,3 a sharethat is projected to increase significantly in the future, up to27% of the total global transport fuel demand by 2050,according to one estimate by IEA.4
Most studies of the environmental performance of biofuelshave focused on greenhouse gas (GHG) balances,5,6 a criticalaspect since biofuels are promoted to reduce GHG emissions.However, several studies5,7−12 have shown that biofuels can beassociated with higher impacts than fossil fuels in terms of, e.g.,acidification, eutrophication, ecotoxicity, and human toxicity.Thus, broadening the scope to a wider range of impacts isessential to ensure that conclusions and recommendations arebased on sufficiently comprehensive assessments and to avoidenvironmental burden-shifting.6,9,11,13,14
Ecotoxicity impacts due to pesticide use in the cultivation ofbiofuel feedstocks have received relatively little attention. vonBlottnitz and Curran5 found that only one of 47 reviewedlifecycle-based studies of ethanol published between 1996 and
2004 considered ecotoxicity. Wiloso and co-workers6 foundthat only six of 31 Life Cycle Assessments (LCAs) of secondgeneration bioethanol published between 2005 and 2011considered ecotoxicity. Further, inclusion of ecotoxicity inLCA does not necessarily mean that the ecotoxic effects ofpesticide use are considered, and contrary; inclusion ofpesticides in the inventory does not necessarily mean thatecotoxicity impacts are considered.Chemical pesticides have become an integral part of
agricultural systems since the middle of the last century.15
World production of formulated pesticide product increased byapproximately a factor 50 between 1945 and 2005.16 Since thebeginning of the 21st century, global pesticide consumption hasreached a maximum, and currently show a slightly decreasingtrend.17−21 Pesticides provide many benefits but also havenegative effects, such as contamination of surface andgroundwater,22 and impacts on biodiversity,23 communitystructure and ecosystem function,24 pollination services,25 andhuman health.26 Large-scale and improper use of pesticides is
Received: May 26, 2014Revised: September 5, 2014Accepted: September 10, 2014Published: September 10, 2014
Article
pubs.acs.org/est
© 2014 American Chemical Society 11379 dx.doi.org/10.1021/es502497p | Environ. Sci. Technol. 2014, 48, 11379−11388
also increasingly linked to problems with resistant weeds,insects, and fungi.27−29
The amount of applied pesticide active substance (AS) is notan adequate indicator of the ecotoxic effect, an increasinglyacknowledged fact.30,31 Recent scientific advances, in particularthe launch of the USEtox-model32,33 for assessment of humantoxicity and freshwater ecotoxicity of chemical emissions in LifeCycle Impact Assessment (LCIA), make more sophisticatedecotoxicity impact assessments possible.The site-generic approach traditionally employed in LCA is
less applicable to products of agricultural origin since localagricultural practices and site-specific pedoclimatic factorsinfluence results,7,8,34,35 not the least concerning pesticideemissions and toxicity impacts.36,37 Pesticide emission fatemodeling is currently handled inconsistently in agriculturalLCAs, and typically builds upon simplified assumptions andgeneric fate-factors,38,39 e.g., that the pesticide dose is entirelyemitted to agricultural soil40 or other weakly supporteddistribution patterns.30,41
We combine a state-of-the-art pesticide emission inventorymodel, PestLCI 2.0,37 with the “best available”42 model forimpact assessment of freshwater ecotoxicity, USEtox,32 andassess potential freshwater ecotoxicity impacts (PFEIs) due topesticide use in cultivation of biofuel feedstocks. Seven casescomprising five conventional feedstock crops are considered(maize, rapeseed, soybean, sugar cane, and wheat), as well asone example of a possible lignocellulosic feedstock for theproduction of second generation biofuels (Salix: n.b. biofuelconversion technologies not yet commercially available).The aim of this study is to demonstrate a methodology for
PFEI assessment of pesticide use; apply it to a set of biofuelfeedstocks; highlight the importance of performing a detailedand site-specific inventory of pesticide usage and emissions;identify the pesticide ASs with highest PFEIs and proposemeasures to reduce the environmental burden in freshwaterecosystems caused by biofuel feedstock production.USEtox also allows for the impact assessment of human
toxicity,32 but the existing method only takes into account thetypically minor effects on the general public through diffuseexposure such as airborne emissions, contaminated drinking
water, and food residues. The more adverse near-field impacts,affecting primarily field workers through direct exposure, arenot taken into account. Toxic effects on humans are thereforenot included here.
■ MATERIALS AND METHODS
The eight cases included in this study are presented in Table 1along with their associated cultivation regions, fresh harvestyields, biofuel energy yields, allocation factors, and coproducts.
Functional Units. PFEI scores were determined in relationto (1) hectare (ha) and year (yr) and (2) biofuel yield (joule),i.e., the gross biofuel output per ha and year from the biofuelconversion plant (Table 1). Biofuel energy yields werecalculated based on fresh harvest yields, typical transportationpathways, and conversion efficiencies in biofuel conversionplants (SI5, Supporting Information). All biofuels studied canbe used as vehicle fuel, thus fulfilling the requirement forequivalent function in LCA.
Pesticide Application Inventory. Crop cultivationpractices in the selected regions were investigated, and pesticideapplication data were obtained from experts familiar withagricultural practices in the respective regions and/ordetermined on the basis of statistics or other literature, seeSI1 (Supporting Information) for more information. The dataobtained were complemented or modified, when appropriate,by our own assumptions. Based on this, application scenarioswere constructed aiming to represent realistic and typicalcultivation practices and pesticide management in therespective regions.The pesticide application scenarios (SI1, Supporting
Information) contain data about the pesticides applied (massAS per ha and application, i.e., dose), method of application(ground, soil incorporation, or aerial), time of application(month), crop development stage at time of application, tillagetype, and average frequency of application. Applicationfrequencies represent the share of fields treated in a year, orthe variation between years, and were used to consider majoryear-to-year fluctuations and even out the pesticide applicationand resulting PFEI over the years.
Table 1. Definitions of Studied Cases
case abbrev feedstockbiofueltype cultivation region
fresh harvest yielda
(kg ha−1 yr−1)biofuel energy yieldb
(MJfuel ha−1 yr−1)
allocationfactorc coproducts considered
MZ-I, MZ-IId maize ethanol Iowa, USA 10700 96000 0.62 DDGSe
RS winterrapeseed
biodiesel Schleswig-Holstein,Germany
4050 56800 0.61 rapeseed cake, refinedglycerol
SX Salix ethanol South CentralSweden
20000 78800 0.94 electricity
SB-I, SB-IIf soybean biodiesel Mato Grosso, Brazil 3030 19700 0.33 soy cake, refinedglycerol
SC sugar cane ethanol Sao Paulo, Brazil 84300 154000 0.98 electricityWT winter
wheatethanol Schleswig-Holstein,
Germany8740 69600 0.56 DDGS
aFresh harvest yields for maize,43 rapeseed,44 soybean,45 sugar cane,45 and wheat44 represent 2006−2011 production averages in the definedcultivation regions. The following water contents at harvest were used: maize, 14%; rapeseed, 15%; soybean, 13%; sugar cane, 72.5%; wheat, 13.5%.46
Fresh harvest yield for Salix represents a conservative estimate of the future yearly yield potential averaged over a plantation life cycle, assuming 50%water content at harvest, see SI1.3 (Supporting Information).47 Further details on yield data, see SI5 (Supporting Information). bBiofuel energyyields refer to the gross biofuel output (i.e., no deduction of energy inputs in biofuel production) per hectare and year from the biofuel conversionplant; more information is available in SI5 (Supporting Information). cAllocation factors were calculated using the partitioning method based onenergy content considering output shares in representative production systems;46 further details are available in SI6 (Supporting Information).dGenetically engineered (GE) glyphosate tolerant maize with (MZ-I) and without (MZ-II) Bt-technology, i.e., ability of the crop to produce its owninsecticidal toxin from the bacterium Bacillus thuringiensis. eDried distillers grains with solubles. fConventional soybean (SB-I) and GE glyphosatetolerant soybean (SB-II).
Environmental Science & Technology Article
dx.doi.org/10.1021/es502497p | Environ. Sci. Technol. 2014, 48, 11379−1138811380
Actual AS chemical formulations were used throughout thestudy, for example, glyphosate isopropylamine salt (CASRegistry No. (CAS-RN) 38641-94-0) rather than glyphosate(CAS-RN 1071-83-6) as the AS in the herbicide RoundUpReady. This approach was considered most appropriate inaccounting for the potential impact.Pesticide Emission Modeling. PestLCI v. 2.0.537 was used
to estimate the mass of pesticide AS emitted from theagricultural field to the surrounding natural environmentfollowing application. This is the most advanced pesticideemission inventory model developed for use in agriculturalLCA currently available.38 PestLCI estimates pesticideemissions to air, surface water, and groundwater, by modelingprimary and secondary distribution processes following fieldapplication.36,37 Distribution, transportation, and degradationprocesses in PestLCI are based on fate modeling principlesoriginating from environmental risk assessment (ERA), withthe difference that a realistic estimate of the average mass of ASemitted to the environment is modeled, rather than a worstcase predicted environmental concentration (PEC) as inERA.37 Emission distributions are pesticide-, soil-, andclimate-specific and depend on a range of field-specificparameters.The agricultural field down to a depth of 1 m into the soil
and 100 m up into the air is regarded part of the technosphere,thus excluding emissions to soil. Field data in PestLCI comprisefield size (length and width), slope, drainage, depth of drainagesystem, irrigation, and tillage type and were set in each casebased on information from the literature, agricultural experts,and our own assumptions (see SI2, Supporting Information).PestLCI includes seven predefined soil profiles and 25 climateprofiles typical in Europe. Climate profiles are defined by thelocation’s monthly averages in terms of air temperature,precipitation, and solar radiation as well as number of dayswith rainfall, average maximum and minimum air temperatures,yearly potential annual evaporation, and elevation above sealevel. Soil profiles are defined by their pH−H2O, compositionof sand (particles >50 μm), silt (particles 2−50 μm), clay(particles <2 μm), and organic carbon content for the varioussoil horizons, as well as the overall soil bulk density. Wedeveloped new site-specific climate profiles and site- and crop-specific soil profiles to represent pedoclimatic conditions in thestudied regions (see SI3−SI4, Supporting Information).The database of PestLCI v. 2.0.5 includes 101 pesticide ASs
defined by their molecular mass, water solubility, vaporpressure, dissociation potential, bioaccumulation potential,soil adsorption potential, and degradation rates in soil andatmosphere. We added an additional 31 pesticide ASs to themodel database to account for all pesticides identified duringinventory (SI11, Supporting Information). PestLCI alsoenables the evaluation of the effects of buffer zones, i.e., safetyareas between field and surface waters where pesticides are notsprayed.Potential Freshwater Ecotoxicity Impact Assessment.
LCIA refers to the assessment of potential impacts bymultiplying emissions with so-called characterization factors(CFs), which quantify how much each emission contributes tovarious environmental impacts, relative to each other.48 Weused USEtox v.1.0132 to calculate PFEIs due to emissions ofpesticides to air and surface water. USEtox is an emission route-specific model for comparative assessment of chemicals andtheir ecotoxic effects on freshwater ecosystems developed foruse in LCIA. It was recently appointed “the best” among
existing characterization models for freshwater ecotoxicity andhuman toxicity42 and is also recommended by the USEnvironmental Protection Agency.49 No recommended meth-ods exist to date for ecotoxicity impact assessment in themarine and terrestrial compartments.42
PFEI scores calculated by USEtox represent an estimate ofthe potentially affected fraction (PAF) of species in time andfreshwater space and are expressed in the unit comparativetoxic unit ecotoxicity (CTUe). CFs for ecotoxicity (expressedin the unit CTUe per kg of a chemical emitted) are available forvarious emission compartments on the continental and globalscales for nearly 2500 substances.50 Here, CFs for emissions tocontinental air and continental freshwater were multiplied withpesticide emissions to air and surface water, respectively.CFs are products of a fate, an exposure, and an effect factor,
in accordance with the relationships that link emissions toimpacts in the environment.32 Fate factors are calculated on thebasis of substance-specific physicochemical properties incombination with site-generic landscape parameters. Exposurefactors equal the dissolved fraction and represent thebioavailable share. Effect factors are based on the geometricmean of EC50 and LC50 data for species at different trophiclevels in the ecosystem.51 CFs are classified as “recommended”or “interim”, where the latter indicate that there is a lack of dataor considerable uncertainties in the modeling of fate, exposureand/or effect. We derived new CFs for an additional 20 ASs,following the recommended procedure,51 to account for allsubstances identified in the inventory. A detailed account hownew CFs were derived, and the data used, is presented in SI12−SI14 (Supporting Information). It should be noted that USEtoxCFs are site-generic and that the site specificness referred tohere is limited to the inventory of pesticide usage andemissions.
Allocation. All biofuel production processes consideredhere are associated with coproducts (Table 1). We appliedallocation through partitioning based on energy content assuggested by the EU Renewable Energy Directive (RED)2009/28/EC52 on PFEIs expressed in relation to biofuel yield,while impacts expressed in relation to cultivated area and timewere left unallocated. The rationale for not allocating impactsexpressed in relation to ha and year is that we considered itmore relevant, from the perspective of freshwater ecosystemsand their protection, to account for the total impact at thecultivation stage. However, recalculation to allocated results canbe done using the allocation factors in Table 1. Thesubstitution method by system expansion was not consideredappropriate since the eight cases are parts of interlinked systemsof fuels and feed, making the system expansion methodspeculative by requiring assumptions about product displace-ment that have weak empirical support and are sensitive tochanges in policy, markets, and production systems. Allocationis a debated topic in LCA,53 and other valid bases forpartitioning exist, e.g., economic value, although variable overtime. Allocation factors (Table 1) were calculated based onoutput shares in typical production systems, see SI6(Supporting Information) for more information.
Sensitivity Analyses. A number of parameters that weidentified as uncertain or subject to large temporal or spatialvariation were tested in sensitivity analyses, in order toquantitatively measure their effects on results. In particular,we analyzed the effects of field size, buffer zones, method ofapplication, soil parameters, and site, on pesticide emissions toair and surface water, and hence PFEI scores, in selected test
Environmental Science & Technology Article
dx.doi.org/10.1021/es502497p | Environ. Sci. Technol. 2014, 48, 11379−1138811381
cases. This was done by varying one parameter at a time whilekeeping all other parameters constant.
■ RESULTS AND DISCUSSIONPesticide Application Rates. Total average pesticide
application rates per case vary by more than a factor of 20,see SI1.7 (Supporting Information). The perennial crop Salix isassociated with substantially lower pesticide use than the othercrops; fungicides and insecticides are not used at all, andherbicides are, on average, applied only once every third year.In all annual crops except maize, all three major pesticidegroups (herbicides, fungicides, and insecticides) are used everyyear. Insecticides are not applied in MZ-I (Bt-maize) due to thecrop’s ability to produce its own insecticidal toxin.Pesticide application rates per AS vary by almost 3 orders of
magnitude, while AS-specific PFEI scores vary by 6 orders ofmagnitude, indicating that amount of pesticide AS applied is aninadequate indicator of ecotoxicity. Glyphosate isopropylaminesalt, e.g., is applied at a rate almost 300 times higher than beta-cyfluthrin in RS; despite this, beta-cyfluthrin causes a PFEImore than 500 times higher than glyphosate isopropylaminesalt per application.Potential Freshwater Ecotoxicity Impacts. PFEI scores
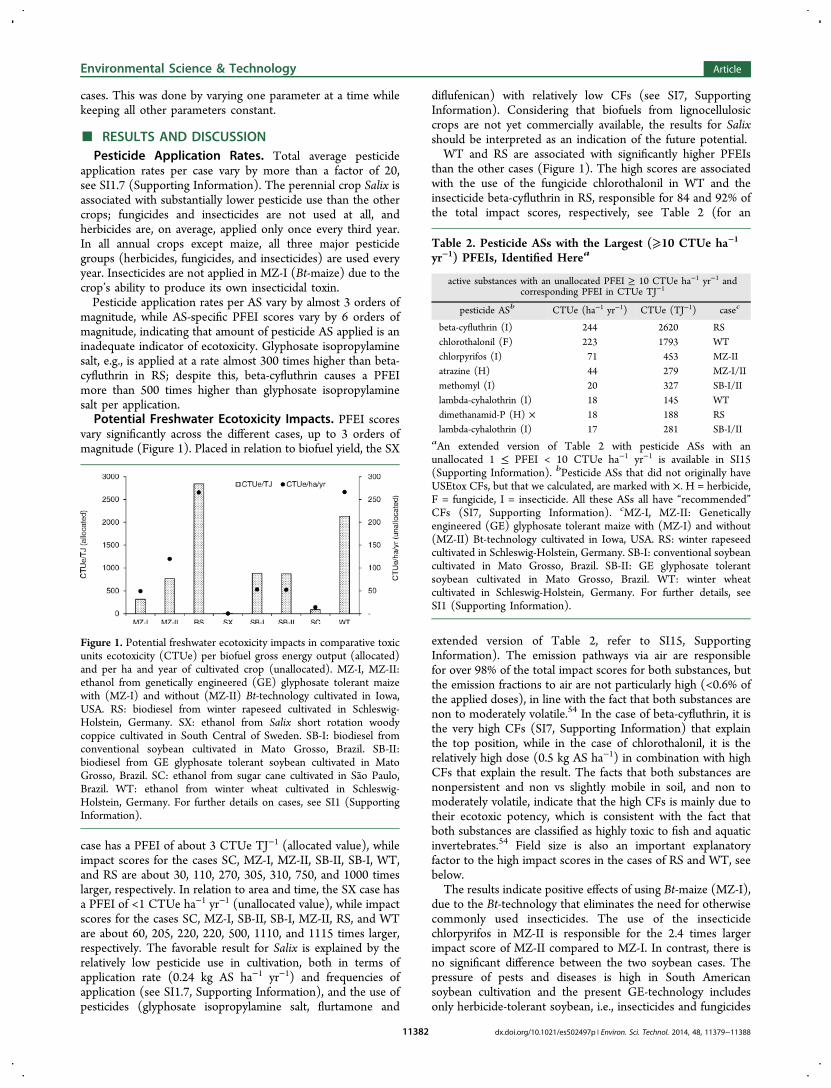
vary significantly across the different cases, up to 3 orders ofmagnitude (Figure 1). Placed in relation to biofuel yield, the SX
case has a PFEI of about 3 CTUe TJ−1 (allocated value), whileimpact scores for the cases SC, MZ-I, MZ-II, SB-II, SB-I, WT,and RS are about 30, 110, 270, 305, 310, 750, and 1000 timeslarger, respectively. In relation to area and time, the SX case hasa PFEI of <1 CTUe ha−1 yr−1 (unallocated value), while impactscores for the cases SC, MZ-I, SB-II, SB-I, MZ-II, RS, and WTare about 60, 205, 220, 220, 500, 1110, and 1115 times larger,respectively. The favorable result for Salix is explained by therelatively low pesticide use in cultivation, both in terms ofapplication rate (0.24 kg AS ha−1 yr−1) and frequencies ofapplication (see SI1.7, Supporting Information), and the use ofpesticides (glyphosate isopropylamine salt, flurtamone and
diflufenican) with relatively low CFs (see SI7, SupportingInformation). Considering that biofuels from lignocellulosiccrops are not yet commercially available, the results for Salixshould be interpreted as an indication of the future potential.WT and RS are associated with significantly higher PFEIs
than the other cases (Figure 1). The high scores are associatedwith the use of the fungicide chlorothalonil in WT and theinsecticide beta-cyfluthrin in RS, responsible for 84 and 92% ofthe total impact scores, respectively, see Table 2 (for an
extended version of Table 2, refer to SI15, SupportingInformation). The emission pathways via air are responsiblefor over 98% of the total impact scores for both substances, butthe emission fractions to air are not particularly high (<0.6% ofthe applied doses), in line with the fact that both substances arenon to moderately volatile.54 In the case of beta-cyfluthrin, it isthe very high CFs (SI7, Supporting Information) that explainthe top position, while in the case of chlorothalonil, it is therelatively high dose (0.5 kg AS ha−1) in combination with highCFs that explain the result. The facts that both substances arenonpersistent and non vs slightly mobile in soil, and non tomoderately volatile, indicate that the high CFs is mainly due totheir ecotoxic potency, which is consistent with the fact thatboth substances are classified as highly toxic to fish and aquaticinvertebrates.54 Field size is also an important explanatoryfactor to the high impact scores in the cases of RS and WT, seebelow.The results indicate positive effects of using Bt-maize (MZ-I),
due to the Bt-technology that eliminates the need for otherwisecommonly used insecticides. The use of the insecticidechlorpyrifos in MZ-II is responsible for the 2.4 times largerimpact score of MZ-II compared to MZ-I. In contrast, there isno significant difference between the two soybean cases. Thepressure of pests and diseases is high in South Americansoybean cultivation and the present GE-technology includesonly herbicide-tolerant soybean, i.e., insecticides and fungicides
Figure 1. Potential freshwater ecotoxicity impacts in comparative toxicunits ecotoxicity (CTUe) per biofuel gross energy output (allocated)and per ha and year of cultivated crop (unallocated). MZ-I, MZ-II:ethanol from genetically engineered (GE) glyphosate tolerant maizewith (MZ-I) and without (MZ-II) Bt-technology cultivated in Iowa,USA. RS: biodiesel from winter rapeseed cultivated in Schleswig-Holstein, Germany. SX: ethanol from Salix short rotation woodycoppice cultivated in South Central of Sweden. SB-I: biodiesel fromconventional soybean cultivated in Mato Grosso, Brazil. SB-II:biodiesel from GE glyphosate tolerant soybean cultivated in MatoGrosso, Brazil. SC: ethanol from sugar cane cultivated in Sao Paulo,Brazil. WT: ethanol from winter wheat cultivated in Schleswig-Holstein, Germany. For further details on cases, see SI1 (SupportingInformation).
Table 2. Pesticide ASs with the Largest (⩾10 CTUe ha−1
yr−1) PFEIs, Identified Herea
active substances with an unallocated PFEI ≥ 10 CTUe ha−1 yr−1 andcorresponding PFEI in CTUe TJ−1
pesticide ASb CTUe (ha−1 yr−1) CTUe (TJ−1) casec
beta-cyfluthrin (I) 244 2620 RSchlorothalonil (F) 223 1793 WTchlorpyrifos (I) 71 453 MZ-IIatrazine (H) 44 279 MZ-I/IImethomyl (I) 20 327 SB-I/IIlambda-cyhalothrin (I) 18 145 WTdimethanamid-P (H) × 18 188 RSlambda-cyhalothrin (I) 17 281 SB-I/II
aAn extended version of Table 2 with pesticide ASs with anunallocated 1 ≤ PFEI < 10 CTUe ha−1 yr−1 is available in SI15(Supporting Information). bPesticide ASs that did not originally haveUSEtox CFs, but that we calculated, are marked with ×. H = herbicide,F = fungicide, I = insecticide. All these ASs all have “recommended”CFs (SI7, Supporting Information). cMZ-I, MZ-II: Geneticallyengineered (GE) glyphosate tolerant maize with (MZ-I) and without(MZ-II) Bt-technology cultivated in Iowa, USA. RS: winter rapeseedcultivated in Schleswig-Holstein, Germany. SB-I: conventional soybeancultivated in Mato Grosso, Brazil. SB-II: GE glyphosate tolerantsoybean cultivated in Mato Grosso, Brazil. WT: winter wheatcultivated in Schleswig-Holstein, Germany. For further details, seeSI1 (Supporting Information).
Environmental Science & Technology Article
dx.doi.org/10.1021/es502497p | Environ. Sci. Technol. 2014, 48, 11379−1138811382
are used every year regardless of seed technology. It should alsobe noted that pesticide application in the Brazilian cases (SB-I,SB-II and SC) may be underestimated (see SI1.4 and SI1.5,Supporting Information), indicating that the associated PFEIsare in fact higher.An intuitive interpretation of the PFEI score follow from the
definition of the ecotoxicity unit: CTUe = PAF·m3·day. If wee.g. consider 1 ha of wheat (WT) and estimate the potentiallyaffected fraction of freshwater species in a 50 m3 pond over thecourse of 1 week (for simplicity assuming that all pesticides areapplied at the same time), the definition gives that 76% of thespecies are potentially affected. The same calculation for 1 ha ofsugar cane (SC) gives that only 4% of the freshwater species arepotentially affected.Uncertainty and Variation. The results depend on
hundreds of parameters of physicochemical and pedoclimaticcharacter, with varying uncertainty. It has been shown that forCFs, the most uncertain input parameters are substances’ half-lives in different environmental compartments, and ecotoxiceffect factors that are based on substance-specific ecotoxic effectdata.50 The uncertainty range of CFs has been determined to1−2 orders of magnitude;32 consequently, a substance with CF= 100 may not be (but probably is), more toxic than asubstance with CF = 1. The uncertainty in final impact scoresalso depends on the uncertainty in emissions, which has notbeen quantified previously, and is beyond the scope of thisstudy. However, pesticide emissions as given by PestLCI havebeen shown to be in “acceptable accordance” with resultsproduced by state-of-the-art pesticide risk assessment models.37
Therefore, a full-scale, quantitative, uncertainty analysis is notpossible at this time.Perhaps even more significant and probably overshadowing
uncertainty ranges is the fact that many of the input parametersdisplay large temporal and/or spatial variability due to naturalvariations in the real world. This applies especially topedoclimatic parameters, but also to some physicochemicalparameters, such as chemical substances half-lives in soil thatcan vary significantly depending on, e.g., microbial activity andpH.55 Consideration of such variations is highly data-demanding and thus impractical in most LCAs. Pesticideapplication in terms of product choices and doses can also havehigh variability in time and space and depend on a range offactors that vary between farms, regions and years, such asclimate and weather, pressure from weeds, pests and diseases,legislation, certification schemes, and commodity prices. Thepesticide application scenarios considered here are based onfairly common pesticides but not designed to represent any sortof national or regional average or to cover all possiblealternatives. This approach was considered most appropriateconsidering limitations set by data availability and quality (seebelow) and difficulties translating pesticide statistics (ifavailable) into realistic use scenarios.Site-generic pedoclimatic data are usually used in LCA, if at
all considered. We used site- and crop-specific data to improveaccuracy and reduce uncertainties compared to conventionalemission inventory approaches. However, due to existinguncertainties and model limitations, and the fact thatquantitative uncertainty ranges have yet to be determined,results should be interpreted with caution, and foremost beused for ranking, and identifying the substances associated withthe largest impacts (Table 2). It is thus not possible todetermine at this time if there is any significant differencebetween, e.g., the RS and the WT case, while the qualitative
uncertainty analysis indicate that the SX case (and possibly theSC case) offer potential benefits compared to the other cases.Further, it is clear that improvement measures should bedirected at the ASs associated with the largest PFEIs, asidentified in Table 2.
Sensitivity Analyses. Previous sensitivity analyses ofPestLCI 2.0 for the herbicide MCPA showed that the mostinfluential input parameters concerning emissions to air werefield width, solar radiation, and average temperature.37
Concerning emissions to surface water the most influentialinput parameters were soil pH, soil texture, and potentialevaporation. We performed sensitivity analyses for additionalASs and evaluated the influence of field size, buffer zones,method of application, soil parameters, and site on pesticideemissions and, hence, PFEI scores.In line with previous findings,37 we found field size (or field
width to be more precise) to be a critical parameter foremissions to air and PFEI scores, which is due to the modelingof wind drift in particular and the assumption that the windalways blows in parallel with the field width.56 The sprayequipment is modeled as moving in parallel to the field length.In effect, pesticides that are applied close to the field borderperpendicular to the wind direction are dominating the winddrift emissions.56 Hence, mass of pesticide AS emitted,averaged over the entire field area, decreases with increasingfield width (if length remains constant), whereas in absoluteterms, total emissions to air (kg) are practically invariant underfield width (if length remains constant) but increase inproportion to field length (if width remains constant). Weused field sizes ranging from 10 to 250 ha to represent typicalsite- and crop-specific conditions (SI2, Supporting Informa-tion), and kept all case fields of the same shape (the lengthtwice the width) and orientation with regard to pesticideapplication and wind direction to minimize influence due tovarying field settings.We tested the effect of changing the field size in the SB-I case
from 250 to 10 ha, while maintaining field shape andorientation; i.e., we decreased both width and length by afactor 5. This caused the PFEI to increase by a factor 2.7, due toup to 5 times larger per-ha air emissions on the smaller field(Table SI17, Supporting Information). However, emissions tosurface water were practically unaffected since emissions due torunoff are modeled as a function of the applied mass per surfaceunit.56 An intuitive interpretation is that the larger the field, thelower the emissions as a fraction of total mass applied, due todecreased ratio of circumference to area. The significance offield size partly explains why the European cases (RS and WT),where field sizes are set to 10 ha, are associated with relativelyhigher per-ha impacts than the soybean cases, where field sizesare set to 250 ha. The fact that field sizes vary greatly in realityis one of several reasons why caution should be taken beforegeneralizing the results presented here.Buffer zones are protective strips of land where pesticides are
not sprayed, located between fields and surface water to preventpesticides from reaching these water bodies.57 Fields in PestLCIare modeled to have a ditch containing surface water along oneside and a slope that results in runoff to this ditch.56 We testedthe effect of adding product-specific buffer zones for the 13highest-impact ASs in the WT, RS, and MZ-II cases, i.e.,substances with a PFEI ≥ 1 CTUe ha−1 yr−1 (Table 2). Bufferzones extended in the range from 5 to 20 m for groundapplication (0 m; one substance) to 46 m for aerial application(one substance), see Table SI18 (Supporting Information). As
Environmental Science & Technology Article
dx.doi.org/10.1021/es502497p | Environ. Sci. Technol. 2014, 48, 11379−1138811383
a result of the addition of buffer zones, PFEI scores for the WT,RS, and MZ-II cases were reduced by 68, 91, and 78%,respectively, due to air and surface water emissions associatedwith the analyzed ASs, reducing on average 76 and 86%,respectively. Experimental research in The Netherlands57 onthe effect of buffer zones of varying width showed that a 3 munsprayed strip of land reduced drift deposition in an adjacentditch by a minimum of 95%, confirming that buffer zones areindeed effective in protecting aquatic ecosystems.Method of application is an important parameter for
emissions to air. Most pesticides are applied using equipmentfor ground application; however, on tall crops in the Americas,aircraft are frequently used. We tested the effect of usingground application instead of aerial application on the ASschlorpyrifos (MZ-II) and trinexapac-ethyl (SC) and found thatit brought down air emissions by 37 and 10%, respectively.A soil sensitivity analysis for three ASs (atrazine, glyphosate,
and metazachlor), showed that texture is the most influentialparameter concerning emissions to surface water, i.e.,composition of sand, silt, and clay (SI8, SupportingInformation). Emissions to surface water were 3−4 timeslower for a sandy soil with low clay content (>55% sand and<20% clay) compared with soils with clay and sand content>20% and <45%, respectively. This may seem counterintuitivebut has been confirmed by others58,59 and is explained by thefact that soils with high clay content form macropores uponcracking, which act as shortcut transport routes for pesticides.Atrazine is the second most widely used herbicide on maize
in Iowa43 and is included in both maize cases. We evaluated the(combined) influence of pedoclimatic parameters by changingsite of the application. When the same atrazine dose wasapplied to maize cultivated in either of the two Brazilianlocations (Mato Grosso or Sao Paulo) instead of Iowa (keepingall other parameters as in the MZ-I case), the PFEI associatedwith atrazine increased by on average 70%, primarily due tofour times higher air emissions of atrazine in Brazil, comparedto Iowa. In fact, air emissions are responsible for two-thirds ofthe total impact score of atrazine in Brazil, compared to one-quarter in Iowa. The increase in air emissions is principallyassociated with climate parameters and most probably an effectof April temperatures in Brazil being significantly higher than inIowa (see SI9, Supporting Information), as increased temper-atures has been shown to increase the volatilization potential ofatrazine.60
Examples from the sensitivity analyses demonstrate theimportance of taking into account site-, crop-, and field-specificconditions in emission modeling and indicate the largeuncertainties inherent in site-generic default fate-factors.Archetypical emission fraction values with high geographicresolution do not reduce the need for comprehensive sensitivityanalyses and can give LCA practitioners a false sense ofprecision. Up to now, the influence of parameters such as soiltexture, buffer zones, and method of application have not beeneasily modeled in LCA.However, such specific inventories are difficult to develop
due to limited data availability. In fact, pesticide use statisticsare scarce and seldom disaggregated to the level of differentASs, regions, and crops; rather, they are typically given in highlyaggregated form, as in the FAOSTAT database.61 The statisticscollected regularly by the United States Department ofAgriculture (USDA) and made publicly available by theNational Agricultural Statistics Service (NASS)43 are anexception. USDA NASS data are disaggregated to the level of
states, crops, and ASs, while for, e.g., Brazil, such publiclyavailable data do not exist.62 Recently, the USDA has decreasedthe inventory frequency in response to budget cuts; now majorfield crops are surveyed only every five years,43 which seriouslylimits the potential for up-to-date analysis and monitoring. Interms of site- and crop-specific field data and agronomicpractices, availability is even more restricted.
Possibilities for Reducing Impacts in Biofuel Feed-stock Production. Choice of pesticide product significantlycontrols the PFEI, as demonstrated by the large range in CFsassociated with the ASs included here (up to 7 orders ofmagnitude, see SI7, Supporting Information). Where only oneAS dominates the impact score, as in the cases of RS and WT(Table 2), possibilities for reducing impacts are straightforward.The insecticide beta-cyfluthrin used in RS against the cabbagestem flea beetle (Psylliodes chrysocephala) could, for example,potentially be substituted to another pyrethroid, e.g., lambda-cyhalothrin, alpha-cypermethrin, tau-fluvalinate, or esfenvaler-ate.63 We tested the effect of switching to an equivalent dose oflambda-cyhalothrin64 and found that it lowered the PFEI in RSby 85%.Substitution of chlorothalonil, a broad-spectrum fungicide
with a multisite mode of action,29 is not as straightforward. Dueto recent shifts in sensitivity in Septoria leaf blotch (Septoriatritici), the most important fungal disease on wheat in Germany(SI1.6, Supporting Information), agricultural advisors acrossEurope now recommend tank mixing with multisite fungicides(e.g., chlorothalonil) to protect important fungicide groups,e.g., azoles, from losing their effect.65 Chlorothalonil isconsidered to have a low risk of causing resistance develop-ment.29 On this basis, it is likely that the use of chlorothalonilwill continue. One possible replacement option is the fungicidemancozeb.63
The sensitivity analyses indicate that ecotoxic effects could bereduced significantly if, e.g., buffer zones are used where fieldsabut surface water and aircraft application is avoided. Thesemeasures and others that aim to control pests while reducingrisks are already well-known within integrated pest manage-ment but, until now, not easily assessed within LCA.Imposition of buffer zones on agricultural lands raises issues
related to private property and economic impacts, andenforcing compliance with legislation mandating buffer zonescan be a challenge.66 Actively managed, and harvested,streamside zones are an alternative to unmanaged bufferzones.67 Studies have shown that some plants that arecultivated along waterways can simultaneously provide bothfreshwater protection and biomass.68−70
The results also indicate that impacts would be lower ifbiofuels were produced from lignocellulosic crops subject tosimilar pesticide treatment as in the SX case. As mentionedpreviously, several studies5,7−12 have shown that the productionof biofuels can be associated with environmental burdenshifting compared to fossil fuels, i.e., a net gain in GHGemissions, at the expense of other environmental impactcategories. Biofuels based on intensively cultivated crops (highinputs and yields) can have low GHG (and other) emissionsper energy output yet cause high local impacts (e.g.,acidification, eutrophication, and ecotoxicity). The cultivationof lignocellulosic perennial crops generally involves lesspesticide input than conventional biofuel crops, partly becauseit is not economically motivated and partly because pest-induced effects tend to be smaller. Studies indicate thatadvanced biofuels produced from lignocellulosic crops
Environmental Science & Technology Article
dx.doi.org/10.1021/es502497p | Environ. Sci. Technol. 2014, 48, 11379−1138811384
requiring less input in the cultivation, can perform better onboth per output and per hectare basis, and offer environmentalbenefits that go beyond GHG emissions. For example, Wilosoand co-workers6 reviewed 31 LCAs of second-generationbioethanol and found that in the nine cases where a fullcomparison was possible the overall environmental impact wasconsistently lower for ethanol than for a reference conventionalfossil oil system. The favorable performance of lignocellulosiccrops was confirmed in this study (Salix case). Favorableperformance can also be due to the use of lignocellulosicresidues and wastes as feedstocks, to which impacts are notallocated. Studies have also shown that integration oflignocellulosic crops into agricultural landscapes can reducethe eutrophication load.71,72 However, the pesticide use (andother inputs) might increase in a scenario with increasedfeedstock prices in which biofuel demand causes higherpressure on land. Higher land pressure and feedstock pricesmight indirectly cause ecotoxicity impacts due to increasedpesticide use as well as further expansion of the agriculturefrontier into natural ecosystems. Since agricultural frontiers areconcentrated in tropical habitats, a very large number of speciescan potentially be affected due to pesticide use in these areas,73
although ecotoxic effects are far from the only impactsassociated with expansion of agricultural frontiers.GE-technology can potentially bring down pesticide use
levels. In the cases of US maize and cotton, Benbrookestimated74 that the Bt-technology has reduced insecticide useby 56 million kg between 1996 and 2011, while with respect toGE herbicide tolerant crops (soybean, cotton, and maize),herbicide use, in particular glyphosate, has increased by 239million kg, causing a net total increase of 7%. However, it isuncertain if the positive development in Bt-maize will continueas documented cases of field-evolved resistance in western cornrootworm (Diabrotica virgifera virgifera) against multiple Bt-toxins have recently been reported.75,76 Also, growing problemswith spread of glyphosate resistant weeds resulting fromexcessive use seriously challenge the potentially positive effectof the GE-technology.77,78 Our findings do not indicate areduced PFEI in GE soybeans compared with conventional.Future Research. Much remains to be done before
ecotoxicity due to pesticide use is routinely included inagricultural LCAs. Of prime importance is expansion ofsubstance databases, a highly challenging task since there areapproximately 100000 chemicals in commerce today, including600 pesticide ASs, and thousands of new chemicals aresynthesized every year,15 but nonetheless critical in overcomingone of the main barriers. A site-specific approach is needed forimpact assessment of chemical emissions, since chemicalemissions typically cause local impacts. A regional pesticideemissions model, such as PestLCI, is valuable to LCApractitioners but needs to be expanded beyond Europe andvalidated against non-European soils and climates, e.g., tropicalconditions. With regard to impact assessment, regionalizationof USEtox is an active research area.79 Employing regionalizedCFs would increase the accuracy of ecotoxicity studies, but asindicated in the study by Kounina and colleagues,79 probablynot significantly change the results.Present models lack capabilities to account for trans-
formation products; a potentially serious shortcoming thatneeds further attention. This simplification is especiallytroublesome for compounds that rapidly degrade into morestable compounds, some of which are more toxic than theparent compound. A recent study showed that the inclusion of
transformation products may increase freshwater CFs by up to5 orders of magnitude.80 Also, chemical emissions seldom takeplace in isolation, and the environment is simultaneouslyexposed to a mixture of chemicals. Surfactants, a commonpesticide ingredient, have, e.g., been shown to increase toxicityof pesticides.81,82 Methods that deal with the mixture toxicity ofchemicals exist83 and have been validated for pesticidemixtures84,85 but have yet to be integrated in USEtox.The physicochemical data used as input to PestLCI and
USEtox are currently on the recommendations from therespective development teams, derived from different datasources (see SI11−SI13, Supporting Information). Thisunfortunate situation, the implications of which have yet tobe quantified, needs to be resolved to bridge the gap betweeninventory and impact assessment and increase consistencybetween models. Other potential model mismatches also needto be revealed and resolved.38
Finally, beyond pesticides and toxicity impacts, research isneeded to improve our understanding of trade-offs associatedwith bioenergy expansion and how integration of bioenergycrops into agricultural landscapes could foster multipleecosystem services and mitigate impacts from existingcrops.86,87 Implementation of beneficial integration strategiesalso requires dissemination tools88 to support the broadstakeholder processes that are needed to capture synergiesand strike a balance between socioeconomic and environmentalobjectives.
■ ASSOCIATED CONTENT*S Supporting InformationDetailed presentation of cases and data on pesticide application,fields, climate, soil, biofuel yields, physicochemical and ecotoxiceffect data, as well as allocation factors and CFs. An account ofhow CFs were derived and supporting materials for results andsensitivity analyses as described in the text. This material isavailable free of charge via the Internet at http://pubs.acs.org/.
■ AUTHOR INFORMATIONCorresponding Authors*E-mail: [email protected], [email protected]. Fax: +46 31 772 11 52.*E-mail: [email protected]. Tel: +46 73 146 5433. Fax: +46 31 772 11 52.NotesThe authors declare no competing financial interest.
■ ACKNOWLEDGMENTSWe would like to thank the following persons and organizationsfor data provision and consultation: R. Barizon, BrazilianAgricultural Research Corporation, EMBRAPA; O. Cavelettand M. Galdos, the Brazilian Bioethanol Science andTechnology Laboratory (CTBE); H. J. Gleser, the Chamberof Agriculture in Schleswig-Holstein; S. Azevedo, The MatoGrosso State Soy and Corn Producers Association (APROSO-JA); D. Meyer, Round Table of Responsible Soy; N. Yngveson,Swedish Rural Economy and Agricultural Societies Malmohus,Sweden; G. Sparovek, University of Sao Paulo and CTBE, andManoel Regis Lima Verde Leal, CTBE. A special thanks to T. J.Dijkman, Technical University of Denmark, for modelingsupport. Financial support from IEA Bioenergy Task 43 isgratefully acknowledged, as well as the valuable comments ofthree anonymous reviewers.
Environmental Science & Technology Article
dx.doi.org/10.1021/es502497p | Environ. Sci. Technol. 2014, 48, 11379−1138811385
■ REFERENCES(1) CO2 Emissions from Fuel Combustion; International EnergyAgency (IEA): Paris, 2013.(2) World energy outlook 2013; International Energy Agency (IEA):Paris, 2013.(3) Chum, H.; et al. Bioenergy. In IPCC Special Report on RenewableEnergy Sources and Climate Change Mitigation; Edenhofer, O., Pichs-Madruga, R., Sokona, Y., Seyboth, K., Matschoss, P., Kadner, S.,Zwickel, T., Eickemeier, P., Hansen, G., Schlomer, S., von Stechow, C.,Eds.; Cambridge University Press: Cambridge, 2011: pp 209−332.(4) Technology Roadmap, Biofuels for Transport; International EnergyAgency: Paris, 2011.(5) von Blottnitz, H.; Curran, M. A. A review of assessmentsconducted on bio-ethanol as a transportation fuel from a net energy,greenhouse gas and environmental life cycle perspective. J. CleanerProd. 2007, 15 (7), 607−619.(6) Wiloso, E. I.; Heijungs, R.; de Snoo, G. R. LCA of secondgeneration bioethanol: A review and some issues to be resolved forgood LCA practice. Renewable Sustainable Energy Rev. 2012, 16 (7),5295−5308.(7) Kim, S.; Dale, B. E. Life cycle assessment of various croppingsystems utilized for producing biofuels: Bioethanol and biodiesel.Biomass Bioenergy 2005, 29 (6), 426−439.(8) Kim, S.; Dale, B. E. Life cycle assessment of fuel ethanol derivedfrom corn grain via dry milling. Bioresour. Technol. 2008, 99 (12),5250−5260.(9) Bai, Y.; Luo, L.; van der Voet, E. Life cycle assessment ofswitchgrass-derived ethanol as transport fuel. Int. J. Life Cycle Assess.2010, 15 (5), 468−477.(10) Emmenegger, M. F.; Gmunder, S.; Reinhard, J.; Zah, R.;Nemecek, T.; Schnetzer, J.; Bauer, C.; Simons, A.; Doka, A.Harmonisation and extension of the bioenergy inventories and assessment;End Report; EMPA Research Institute: Dubendorf, Aug 2012.(11) Yang, Y.; Bae, J.; Kim, J.; Suh, S. Replacing gasoline with cornethanol results in significant environmental problem shifting. Environ.Sci. Technol. 2012, 46 (7), 3671−3678.(12) Yang, Y. Life cycle freshwater ecotoxicity, human health cancer,and noncancer impacts of corn ethanol and gasoline in the US. J.Cleaner Prod. 2013, 53, 149−157.(13) Guinee, J.; Heijungs, R.; Huppes, G.; Zamagni, A.; Masoni, P.;Buonamici, R.; Ekvall, T.; Rydberg, T. Life cycle assessment: past,present and future. Environ. Sci. Technol. 2011, 45 (1), 90−96.(14) Laurent, A.; Olsen, S. I.; Hauschild, M. Z. Limitations of carbonfootprint as indicator of environmental sustainability. Environ. Sci.Technol. 2012, 46 (7), 4100−4108.(15) Harrison, P.; Pearce, F. Population, waste and chemicals. InAAAS Atlas of Population and Environment [Online]; Markham, V. D.,Ed.; American Association for the Advancement of Science and theUniversity of California Press: Berkeley, 2000; pp 107−118. http://atlas.aaas.org/index.php (accessed Sep 4, 2014).(16) Carvalho, F. P. Agriculture, pesticides, food security and foodsafety. Environ. Sci. Policy 2006, 9 (7−8), 685−692.(17) Pesticides Industry Sales and Usage - 1994 and 1995 MarketEstimates; EPA-733-R-97-002; Office of Prevention, Pesticides andToxic Substances, United States Environmental Protection Agency:Washington, D.C., 1997.(18) Pesticides Industry Sales and Usage - 1996 and 1997 MarketEstimates; EPA-733-R-99-001; Office of Prevention, Pesticides andToxic Substances, United States Environmental Protection Agency:Washington, D.C., 1999.(19) Pesticides Industry Sales and Usage - 1998 and 1999 MarketEstimates; EPA-733-R-02-001; Office of Prevention, Pesticides andToxic Substances, United States Environmental Protection Agency:Washington, D.C., 2002.(20) Pesticides Industry Sales and Usage - 2000 and 2001 MarketEstimates; EPA-733-R-04-001; Office of Prevention, Pesticides andToxic Substances, United States Environmental Protection Agency:Washington, D.C., 2004.
(21) Pesticides Industry Sales and Usage - 2006 and 2007 MarketEstimates; EPA-733-R-11-001; Office of Chemical Safety and PollutionPrevention, United States Environmental Protection Agency: Wash-ington, D.C., 2011.(22) Arias-Estevez, M.; Lopez-Periago, E.; Martínez-Carballo, E.;Simal-Gandara, J.; Mejuto, J.-C.; García-Río, L. The mobility anddegradation of pesticides in soils and the pollution of groundwaterresources. Agric., Ecosyst. Environ. 2008, 123 (4), 247−60.(23) Geiger, F.; Bengtsson, J.; Berendse, F.; Weisser, W. W.;Emmerson, M.; Morales, M. B.; Ceryngier, P.; Liira, J.; Tscharntke, T.;Winqvist, C.; Eggers, S.; Bommarco, R.; Part, T.; Bretagnolle, V.;Plantegenest, M.; Clement, L. W.; Dennis, C.; Palmer, C.; Onate, J. J.;Guerrero, I.; Hawro, V.; Aavik, T.; Thies, C.; Flohre, A.; Hanke, S.;Fischer, C.; Goedhart, P. W.; Inchausti, P. Persistent negative effects ofpesticides on biodiversity and biological control potential on Europeanfarmland. Basic Appl. Ecol. 2010, 11 (2), 97−105.(24) Schafer, R. B.; Caquet, T.; Siimes, K.; Mueller, R.; Lagadic, L.;Liess, M. Effects of pesticides on community structure and ecosystemfunctions in agricultural streams of three biogeographical regions inEurope. Sci. Total Environ. 2007, 382 (2−3), 272−285.(25) van der Sluijs, J. P.; Simon-Delso, N.; Goulson, D.; Maxim, L.;Bonmatin, J. M.; Belzunces, L. P. Neonicotinoids, bee disorders andthe sustainability of pollinator services. Curr. Opin. Environ.Sustainability 2013, 5 (3−4), 293−305.(26) Mostafalou, S.; Abdollahi, M. Pesticides and human chronicdiseases: Evidences, mechanisms, and perspectives. Toxicol. Appl.Pharmacol. 2013, 268 (2), 157−177.(27) Heap, I. The International Survey of Herbicide Resistant Weeds,www.weedscience.org (accessed Sep 4, 2014).(28) Insecticide Resistance Action Committee, IRAC, Website.http://www.irac-online.org/ (accessed Sep 4, 2014).(29) Fungicide Resistance Action Committee, FRAC, Website.http://www.frac.info/ (accessed Sep 4, 2014).(30) Audsley, E.; Alber, S.; Clift, R.; Cowell, S.; Crettaz, P.; Gaillard,G.; Hausheer, J.; Jolliet, O.; Kleijn, R.; Mortensen, B.; Pearce, D.;Roger, E.; Teulon, H.; Weidema, B.; van Zeijts, H. Harmonisation ofenvironmental life cycle assessment for agriculture; Final Report concertedaction AIR3-CT94-2028, European Commission: Silsoe, 2003.(31) de Vries, S. C.; van de Ven, G. W.; van Ittersum, M. K.; Giller,K. E. Resource use efficiency and environmental performance of ninemajor biofuel crops, processed by first-generation conversiontechniques. Biomass Bioenergy 2010, 34 (5), 588−601.(32) Rosenbaum, R. K.; Bachmann, T. M.; Gold, L. S.; Huijbregts, M.A. J.; Jolliet, O.; Juraske, R.; Koehler, A.; Larsen, H. F.; MacLeod, M.;Margni, M.; McKone, T. E.; Payet, J.; Schumacher, M.; van de Meent,D.; Hauschild, M. Z. USEtox − the UNEP-SETAC toxicity model:recommended characterization factors for human toxicity andfreshwater ecotoxicity in life cycle impact assessment. Int. J. LifeCycle Assess. 2008, 13 (7), 532−546.(33) USEtox Website. http://www.usetox.org/ (accessed 7 Jan,2014).(34) Kim, S.; Dale, B. E. Regional variations in greenhouse gasemissions of biobased products in the United States − corn-basedethanol and soybean oil. Int. J. Life Cycle Assess. 2009, 14 (6), 540−546.(35) Fazi, S.; Monti, A. Life cycle assessment of different bioenergyproduction systems including perennial and annual crops. BiomassBioenergy 2011, 35 (12), 4868−4878.(36) Birkved, M.; Hauschild, M. Z. PestLCI - A model for estimatingfield emissions of pesticides in agricultural LCA. Ecol. Modell. 2006,198 (3−4), 433−451.(37) Dijkman, T. J.; Birkved, M.; Hauschild, M. Z. PestLCI 2.0: asecond generation model for estimating emissions of pesticides fromarable land in LCA. Int. J. Life Cycle Assess. 2012, 17 (8), 973−986.(38) van Zelm, R.; Larrey-Lassalle, P.; Roux, P. Bridging the gapbetween life cycle inventory and impact assessment for toxicologicalassessments of pesticides used in crop production. Chemosphere 2014,100, 175−181.
Environmental Science & Technology Article
dx.doi.org/10.1021/es502497p | Environ. Sci. Technol. 2014, 48, 11379−1138811386
(39) Rosenbaum, R. K.; Anton, A.; Bengoa, X.; Bjørn, A.; Brain, R.;Bulle, C.; Cosme, N.; Dijkman, T. J.; Fantke, P.; Felix, M.; Geoghegan,T. S.; Gottesburen, B.; Hammer, C.; Humbert, S.; Jolliet, O.; Juraske,R.; Lewis, F.; Maxime, D.; Nemecek, T.; Payet, J.; Rasanen, K.; Roux,P.; Schau, E. M.; Sourisseau, S.; van Zelm, R.; von Streit, B.; Wallman,M. The Glasgow consensus on the delineation between pesticide emissioninventory and impact assessment for LCA. Submitted for publication.(40) Nemecek, T.; Schnetzer, J. Methods of assessment of direct fieldemissions for LCIs of agricultural production systems; AgroscopeReckenholz-Tanikon Research Station ART & ecoinvent Centre:Zurich, Aug 2011.(41) Schmidt, J. H. Life assessment of rapeseed oil and palm oil. Ph.D.Thesis, Part 3: Life cycle inventory of rapeseed oil and palm oil.Aalborg University, June 2007. http://vbn.aau.dk/files/10388016/inventory_report (accessed Nov 26, 2013).(42) Hauschild, M. Z.; Goedkoop, M.; Guinee, J.; Heijungs, R.;Huijbregts, M. A. J.; Jolliet, O.; Margni, M.; de Schryver, A.; Humbert,S.; Laurent, A.; Sala, S.; Pant, R. Identifying best existing practice forcharacterization modeling in life cycle impact assessment. Int. J. LifeCycle Assess. 2013, 18 (3), 683−697.(43) USDA NASS, United States Department of Agriculture NationalAgricultural Statistics Service. http://www.nass.usda.gov/ (accessedJan 7, 2014).(44) Bodennutzung und Ernte in Schleswig-Holstein 2012; StatistikamtNord - Statistical Office of Hamburg and Schleswig-Holstein:Hamburg, 2013. https://www.statistik-nord.de/uploads/tx_standocuments/C_I_C_II_j12_SH.pdf (accessed Dec 19, 2013).(45) Sistema IBGE de Recuperacao Automatica, SIDRA. IBGE,Instituto Brasileiro de Geografia e Estatistica. Tabela 99. http://www.sidra.ibge.gov.br (accessed Jan 13, 2014).(46) Assessing GHG default emissions from biofuels in EU legislation.Review of the input database to calculate ’Default GHG emissions’,following expert consultation, 22−23 Nov 2011, Ispra (Italy); Scientificand Technical Research Report JRC-76057, Institute for Energy andTransport, Joint Research Centre (JRC), European Commission,Publications Office of the European Union: Luxembourg, 2012.(47) Short rotation coppice willow - Best practice guidelines; Task 43Technical Report; International Energy Agency (IEA) Bioenergy:Rotorua, 2012.(48) International Reference Life Cycle Data System (ILCD) Handbook- General guide for Life Cycle Assessment - Detailed guidance, 1st ed.;Institute for Environment and Sustainability, Joint Research Centre(JRC), European Commission, Publications Office of the EuropeanUnion: Luxembourg, 2010.(49) Bare, J. TRACI 2.0: the tool for the reduction and assessment ofchemical and other environmental impacts 2.0. Clean Technol. Environ.Policy 2011, 13 (5), 687−696.(50) Henderson, A. D.; Hauschild, M. Z.; van de Meent, D.;Huijbregts, M. A. J.; Larsen, H. F.; Margni, M.; McKone, T. E.; Payet,J.; Rosenbaum, R.; Jolliet, O. USEtox fate and ecotoxicity factors forcomparative assessment of toxic emissions in life cycle analysis:sensitivity to key chemical properties. Int. J. Life Cycle Assess. 2011, 16(8), 701−709.(51) Huijbregts, M. A. J.; Hauschild, M. Z.; Jolliet, O.; Margni, M.;McKone, T.; Rosenbaum, R. K.; van de Meent, D. USEtox Usermanual, 2010. http://www.usetox.org/support/tutorials-manuals (ac-cessed Sept 2, 2014).(52) Directive 2009/28/EC of the European Parliament and of theCouncil of 23 April 2009 on the promotion of the use of energy fromrenewable sources and amending and subsequently repealingDirectives 2001/77/EC and 2003/30/EC. Official J. Eur. Union,Legislation 2009, 140, 16−62.(53) Curran, M. A. Co-product and input allocation approaches forcreating life cycle inventory data: A literature review. Int. J. Life CycleAssess. 2007, 12 (1), 65−78.(54) Agriculture & Environment Research Unit, University ofHertfordshire: Herts. The Pesticide Properties DataBase (PPDB).http://sitem.herts.ac.uk/aeru/ppdb/en/index.htm (accessed Aug 12,2014).
(55) Bending, G. D.; Lincoln, S. D.; Edmondson, R. N. Spatialvariation in the degradation rate of the pesticides isoproturon,azoxystrobin and diflufenican in soil and its relationship with chemicaland microbial properties. Environ. Pollut. 2006, 139 (2), 279−287.(56) Dijkman, T. J., Ph.D., Technical University of Denmark, Kgs.Lyngby. Personal communication, 2014.(57) de Snoo, G. R.; de Wit, P. J. Buffer zones for reducing pesticidedrift to ditches and risks to aquatic organisms. Ecotoxicol. Environ. Saf.1998, 41 (1), 112−118.(58) Tiktak, A.; Hendriks, R. F. A.; Boesten, J. J. T. I.; van derLinden, A. M. A. A spatially distributed model of pesticide movementin Dutch macroporous soils. J. Hydrol. 2012, 470−471, 316−327.(59) Jarvis, N.; Larsbo, M.; Roulier, S.; Lindahl, A.; Persson, L. Therole of soil properties in regulating non−equilibrium macropore flowand solute transport in agricultural topsoils. Eur. J. Soil Sci. 2007, 58(1), 282−292.(60) Burt, G. W. Volatility of Atrazine from Plant, Soil, and GlassSurfaces. J. Environ. Qual. 1974, 3 (2), 114−7.(61) FAOSTAT, the FAO statistical database; Statistics Division of theFood and Agriculture Organization of the United Nations: Rome.http://faostat.fao.org (accessed Jan 7, 2014).(62) Meyer, D.; Cederberg, C. Pesticide use and glyphosate resistantweeds − a case study of Brazilian soybean production; Report 809; SIK,The Swedish Institute for Food and Biotechnology: Goteborg, 2010.http://www.sik.se/archive/pdf-filer-katalog/SR809.pdf (accessed Jan27, 2014).(63) Yngveson, N.Senior consultant, Swedish Rural Economy andAgricultural Societies Malmohus, Borgeby. Personal communication,2014.(64) LKSH, the Chamber of Agriculture in Schleswig-Holstein.Insektizide in Raps im Herbst − Auflagen. http://www.lksh.de/fileadmin/dokumente/Landwirtschaft/Pflanze/Pflanzenschutz/Insektizide/Raps_I_gesamtAuflagen.pdf (accessed Jan 27, 2014).(65) Septoria tritici in winter wheat; Cereals and oilseeds division(HGCA) of the Agriculture and Horticulture Development Board(AHDB): Warwickshire, 2012.(66) Sparovek, G.; Berndes, G.; Klug, I. L. F.; Barretto, A. G. O. P.Brazilian agriculture and environmental legislation: status and futurechallenges. Environ. Sci. Technol. 2010, 44 (16), 6046−6053.(67) Neary, D. G.; Smethurst, P. J.; Baillie, B.; Petrone, K. C. Waterquality, biodiversity and codes of practice in relation to harvesting forestplantations in streamside management zones; CSIRO National ResearchFlagships Sustainable Agriculture: Australia, Aug 2011.(68) Borjesson, P.; Berndes, G. The prospects for willow plantationsfor wastewater treatment in Sweden. Biomass Bioenergy 2006, 30 (5),428−438.(69) Gopalakrishnan, G.; Negri, M. C.; Salas, W. Modelingbiogeochemical impacts of bioenergy buffers with perennial grassesfor a row-crop field in Illinois. GCB Bioenergy 2012, 4 (6), 739−750.(70) Skenhall, S. A.; Berndes, G.; Woods, J. Integration of bioenergysystems into UK agriculture - new options for management of nitrogenflows. Biomass Bioenergy 2013, 54, 219−226.(71) Schmidt-Walter, P.; Lamersdorf, N. P. Biomass Production withWillow and Poplar Short Rotation Coppices on Sensitive AreastheImpact on Nitrate Leaching and Groundwater Recharge in a DrinkingWater Catchment near Hanover, Germany. BioEnergy Res. 2012, 5 (3),546−562.(72) Parish, E. S.; Hilliard, M. R.; Baskaran, L. M.; Dale, V. H.;Griffiths, N. A.; Mulholland, P. J.; Sorokine, A.; Thomas, N. A.;Downing, M. E.; Middleton, R. S. Multimetric spatial optimization ofswitchgrass plantings across a watershed. Biofuels, Bioprod. Biorefin.2012, 6 (1), 58−72.(73) Schiesari, L.; Waichman, A.; Brock, T.; Adams, C.; Grillitsch, B.Pesticide use and biodiversity conservation in the Amazonianagricultural frontier. Philos. Trans. R. Soc., B 2013, 368 (1619),20120378.(74) Benbrook, C. M. Impacts of genetically engineered crops onpesticide use in the U.S. − the first sixteen years. Environ. Sci. Eur.2012, 24 (1), 1−13.
Environmental Science & Technology Article
dx.doi.org/10.1021/es502497p | Environ. Sci. Technol. 2014, 48, 11379−1138811387
(75) Gassmann, A. J. Field-evolved resistance to Bt maize by westerncorn rootworm: predictions from the laboratory and effects in thefield. J. Invertebr. Pathol. 2012, 110 (3), 287−293.(76) Gassmann, A. J.; Petzold-Maxwell, J. L.; Clifton, E. H.; Dunbar,M. W.; Hoffmann, A. M.; Ingber, D. A.; Keweshan, R. S. Field-evolvedresistance by western corn rootworm to multiple Bacillus thuringiensistoxins in transgenic maize. Proc. Natl. Acad. Sci. U.S.A. 2014, 111 (14),5141−5146.(77) Mortensen, D. A.; Egan, J. F.; Maxwell, B. D.; Ryan, M. R.;Smith, R. G. Navigating a critical juncture for sustainable weedmanagement. BioScience 2012, 62 (1), 75−84.(78) Green, J. M. The benefits of herbicide−resistant crops. PestManag. Sci. 2012, 68 (10), 1323−31.(79) Kounina, A.; Margni, M.; Shaked, S.; Bulle, C.; Jolliet, O. Spatialanalysis of toxic emissions in LCA: A sub-continental nested USEtoxmodel with freshwater archetypes. Environ. Int. 2014, 69, 67−89.(80) van Zelm, R.; Huijbregts, M. A. J.; van de Meent, D.Transformation products in the life cycle impact assessment ofchemicals. Environ. Sci. Technol. 2010, 44 (3), 1004−1009.(81) Sharma, S. D.; Singh, M. Surfactants increase toxicity ofglyphosate and 2,4-D to Brazil Pusley. HortScience 2001, 36 (4), 726−728.(82) Lee, H. L.; Kan, C. D.; Tsai, C. L.; Liou, M. J.; Guo, H. R.Comparative effects of the formulation of glyphosate-surfactantherbicides on hemodynamics in swine. Clin. Toxicol. 2009, 47 (7),651−658.(83) Backhaus, T.; Faust, M. Predictive Environmental RiskAssessment of Chemical Mixtures: A Conceptual Framework. Environ.Sci. Technol. 2012, 46 (5), 2564−2573.(84) Belden, J. B.; Gilliom, R. J.; Lydy, M. J. How well can we predictthe toxicity of pesticide mixtures to aquatic life? Integr. Environ. Assess.Manage. 2007, 3 (3), 364−372.(85) Coors, A.; Frische, T. Predicting the aquatic toxicity ofcommercial pesticide mixtures. Environ. Sci. Eur. 2011, 23:22, 1−18.(86) Berndes, G.; Borjesson, P.; Ostwald, M.; Palm, M. Multifunc-tional biomass production systems an overview with presentation ofspecific applications in India and Sweden. Biofuels, Bioprod. Biorefin.2008, 2 (1), 16−25.(87) Meehan, T. D.; Gratton, C.; Diehl, E.; Hunt, N. D.; Mooney, D.F.; Ventura, S. J.; Barham, B. L.; Jackson, R. D. Ecosystem-ServiceTradeoffs Associated with Switching from Annual to Perennial EnergyCrops in Riparian Zones of the US Midwest. PLoS One 2013, 8 (11),e80093.(88) Busch, G. GIS-based tools for regional assessments and planningprocesses regarding potential environmental effects of poplar SRC.BioEnergy Res. 2012, 5 (3), 584−605.
Environmental Science & Technology Article
dx.doi.org/10.1021/es502497p | Environ. Sci. Technol. 2014, 48, 11379−1138811388