modeling enterprise architecture with togaf || models for phase c
TRANSCRIPT
CHAPTER
Models for Phase C: InformationSystem Architecture
9 CHAPTER OUTLINE9.1 Phase C artifacts ........................................................................................................................170
9.1.1 Nature of phase C artifacts: Information system architecture ......................................170
9.2 The “application communication diagram” artifact .......................................................................174
9.2.1 Description of the artifact ........................................................................................174
9.2.2 Modeling application architecture ............................................................................176
9.3 The “application migration diagram” artifact ................................................................................177
9.3.1 Description of the artifact ........................................................................................177
9.3.2 Building the migration strategy in accordance with the application
evolution path ........................................................................................................178
9.4 The “application and user location diagram” artifact ....................................................................179
9.4.1 Description of the artifact ........................................................................................179
9.4.2 Study of the geographical distribution of users and applications .................................180
9.5 The “system use case diagram” artifact .......................................................................................181
9.5.1 Description of the artifact ........................................................................................181
9.5.2 Application use cases: Principles .............................................................................182
9.6 The “process system realization diagram” artifact .......................................................................183
9.6.1 Description of the artifact ........................................................................................183
9.6.2 Strengthening application communication diagrams: Sequences
and synchronizations ...............................................................................................185
9.7 The “enterprise manageability diagram” artifact ..........................................................................186
9.8 Data architecture ........................................................................................................................188
9.8.1 The “logical data diagram” artifact ...........................................................................188
9.8.2 The “data dissemination diagram” artifact ................................................................188
9.8.3 The “data security diagram” artifact .........................................................................191
9.8.4 The “data migration diagram” artifact ......................................................................193
9.9 The “service data diagram” artifact .............................................................................................195
9.10 Fundamental concepts ................................................................................................................196
Business architecture has defined the way in which the enterprise must be organized and must function.
It has initiated data architecture at a conceptual level. It defines requirements on the information system
and a context enabling expected IS evolutions to be determined. Application architecture identifies IS
components and their interactions in order to meet business architecture expectations, while guarantee-
ing overall consistency and respecting the rules of an architectural framework. The application
component is the key concept for application architecture. Here, we put particular emphasis on
169
170 CHAPTER 9 Models for Phase C: Information System Architecture
an SOA-oriented architecture where application components cooperate through “services,” but we
also have to cope with the legacy system, which is often simply expressed in terms of applications
and flows.
9.1 PHASE C ARTIFACTS9.1.1 Nature of phase C artifacts: Information system architectureAs presented in Section 2.2.3, information system architecture takes into account the existing IS, which
often has to be mapped in order to be properly understood in detail, and then determines the changes
that must be made to evolve to a target IS, according to a defined path. At each identified step of the
path, we have to establish how the IS will be used in the enterprise and howmigration from the previous
step to the current step will be achieved.
The aim here is not to design software applications, but rather to provide a logical view of them.
Logical capability groups must be identified, groups that manage system data, support business func-
tions and business processes, and interact with other logical groups and with users. At this stage, no
reference is made to particular realization technologies. This subject is discussed during phase D (tech-
nological architecture), before being dealt with in detail during software design, which happens down-
stream (project progress).
We recommend an SOA-type (service-oriented architecture) approach when defining application
architectures. As far as architecture is concerned, TOGAF is independent, although it does mention the
SOA approach and takes inspiration from it in its application component concepts. We encourage this
approach and most often consider TOGAF application components as service components in an SOA
architecture. Of course, existing architecture is not often SOA-oriented, and taking this existing archi-
tecture into account imposes hybrid architecture, which mixes the traditional concepts of application
and repository with the concept of service components.
The central artifact of phase C is the application communication diagram, which presents the archi-
tecture and positioning of application components from which components and applications are iden-
tified and their interfaces and interconnections defined (Figure 9.3).
Although matrices can frequently be deduced from models and diagrams (Table 9.1), they are
useful since they often present a complete portfolio list while diagrams show partial views. Matrices
are useful for establishing and reasoning about relationships.
SOA architecture: Typology of application componentsLiterature dedicated to SOA architectures recommends that a component typology be defined, and that
components be structured into levels.a For this reason, we use the typology detailed in the “Architecture
Logique: Principes, structures et bonnes pratiques” white paper,b and distinguish four types of
aFor example, Enterprise SOA, Dirk Krafzig, Karl Banke, Dirk Slama, The Coad Series, 2005, Peter Herzum &Oliver Sims.bSOA: Architecture Logique: Principes, structure et bonnes pratiques, Gilbert Raymond, Softeam 2007, 2011,
www.softeam.fr.
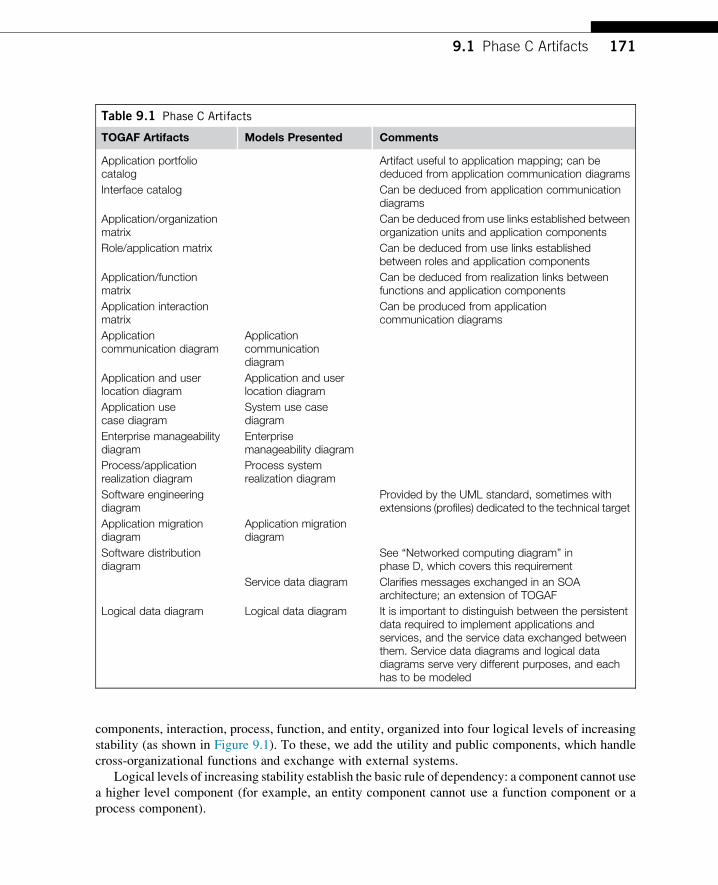
Table 9.1 Phase C Artifacts
TOGAF Artifacts Models Presented Comments
Application portfoliocatalog
Artifact useful to application mapping; can bededuced from application communication diagrams
Interface catalog Can be deduced from application communicationdiagrams
Application/organizationmatrix
Can be deduced from use links established betweenorganization units and application components
Role/application matrix Can be deduced from use links establishedbetween roles and application components
Application/functionmatrix
Can be deduced from realization links betweenfunctions and application components
Application interactionmatrix
Can be produced from applicationcommunication diagrams
Applicationcommunication diagram
Applicationcommunicationdiagram
Application and userlocation diagram
Application and userlocation diagram
Application usecase diagram
System use casediagram
Enterprise manageabilitydiagram
Enterprisemanageability diagram
Process/applicationrealization diagram
Process systemrealization diagram
Software engineeringdiagram
Provided by the UML standard, sometimes withextensions (profiles) dedicated to the technical target
Application migrationdiagram
Application migrationdiagram
Software distributiondiagram
See “Networked computing diagram” inphase D, which covers this requirement
Service data diagram Clarifies messages exchanged in an SOAarchitecture; an extension of TOGAF
Logical data diagram Logical data diagram It is important to distinguish between the persistentdata required to implement applications andservices, and the service data exchanged betweenthem. Service data diagrams and logical datadiagrams serve very different purposes, and eachhas to be modeled
1719.1 Phase C Artifacts
components, interaction, process, function, and entity, organized into four logical levels of increasing
stability (as shown in Figure 9.1). To these, we add the utility and public components, which handle
cross-organizational functions and exchange with external systems.
Logical levels of increasing stability establish the basic rule of dependency: a component cannot use
a higher level component (for example, an entity component cannot use a function component or a
process component).
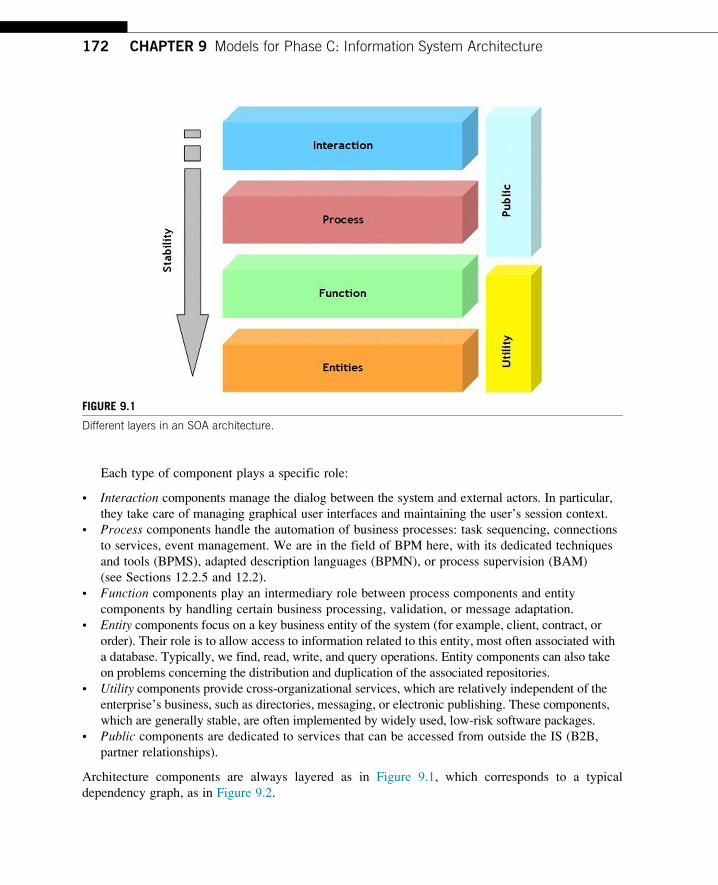
FIGURE 9.1
Different layers in an SOA architecture.
172 CHAPTER 9 Models for Phase C: Information System Architecture
Each type of component plays a specific role:
• Interaction components manage the dialog between the system and external actors. In particular,
they take care of managing graphical user interfaces and maintaining the user’s session context.
• Process components handle the automation of business processes: task sequencing, connections
to services, event management. We are in the field of BPM here, with its dedicated techniques
and tools (BPMS), adapted description languages (BPMN), or process supervision (BAM)
(see Sections 12.2.5 and 12.2).
• Function components play an intermediary role between process components and entity
components by handling certain business processing, validation, or message adaptation.
• Entity components focus on a key business entity of the system (for example, client, contract, or
order). Their role is to allow access to information related to this entity, most often associated with
a database. Typically, we find, read, write, and query operations. Entity components can also take
on problems concerning the distribution and duplication of the associated repositories.
• Utility components provide cross-organizational services, which are relatively independent of the
enterprise’s business, such as directories, messaging, or electronic publishing. These components,
which are generally stable, are often implemented by widely used, low-risk software packages.
• Public components are dedicated to services that can be accessed from outside the IS (B2B,
partner relationships).
Architecture components are always layered as in Figure 9.1, which corresponds to a typical
dependency graph, as in Figure 9.2.
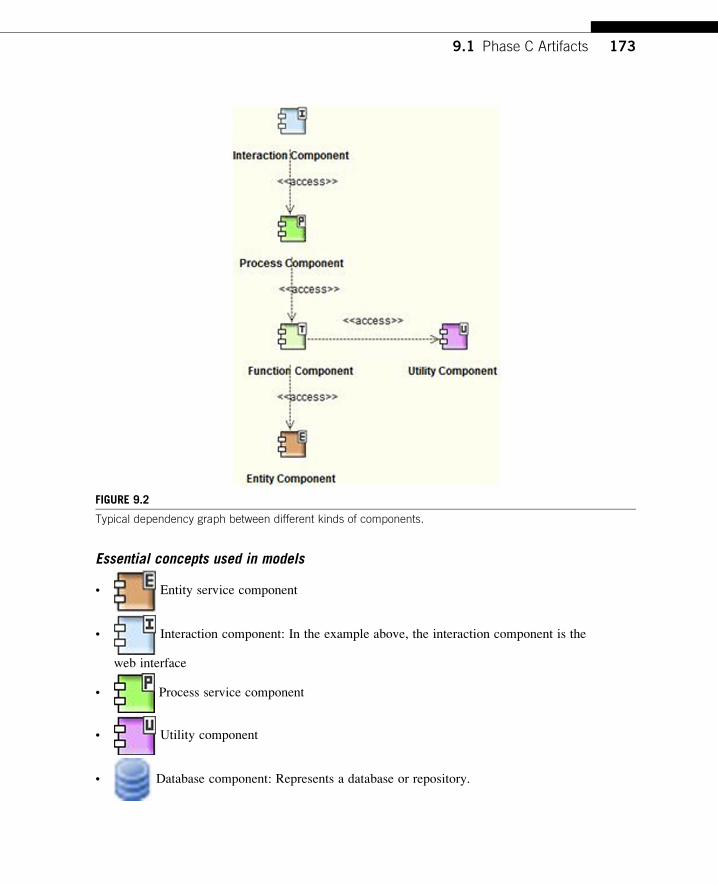
FIGURE 9.2
Typical dependency graph between different kinds of components.
1739.1 Phase C Artifacts
Essential concepts used in models
• Entity service component
• Interaction component: In the example above, the interaction component is the
web interface
• Process service component
• Utility component
• Database component: Represents a database or repository.
174 CHAPTER 9 Models for Phase C: Information System Architecture
• Application component: Represents one of the existing or target system’s applications.
• System: An organized set of application components with autonomous functioning.
This often represents the enterprise’s IS. A very large IS can be broken down into several (sub)
systems.
• System federation: Highest application level, containing all other application components.
It assembles systems in order to federate them, as in the case of cooperation between different
information systems in different enterprises.
• Provided service: Access point to service components, via services defined at this point.
• Required service: Services required by a service component. Must be connected to provided
services (other components) that have the same interface.
• Persistent entity: Entities are considered at a logical level during phase C. They are represented
as persistent entities, used by applications.
• Message: Flow of information exchanged between applications (the IS’s services in an SOA
architecture) (sometimes called data object or business data type in certain approaches).
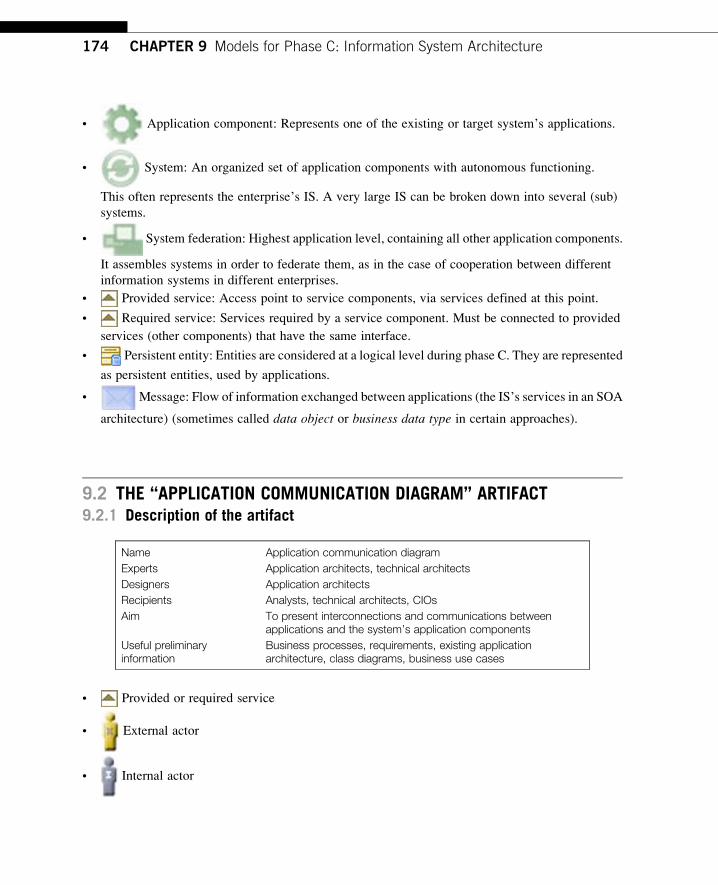
9.2 THE “APPLICATION COMMUNICATION DIAGRAM” ARTIFACT9.2.1 Description of the artifact
Name
Application communication diagramExperts
Application architects, technical architectsDesigners
Application architectsRecipients
Analysts, technical architects, CIOsAim
To present interconnections and communications betweenapplications and the system’s application componentsUseful preliminaryinformation
Business processes, requirements, existing applicationarchitecture, class diagrams, business use cases
• Provided or required service
• External actor
• Internal actor
1759.2 The “Application Communication Diagram” Artifact
• “Database” component
• Entity component
• Utility component
• System federation component
• Process
• Interaction component
• Application component
• Business process
• Connectorc: Connection link between the provided services and required services of
service components.
• Sent or received flow between data (business entity, event, product) and an
active element of the IS (business process, service).
• Link between a participant (for example, an actor) and an element of the
studied system. Expresses that the participant consumes the IS element.
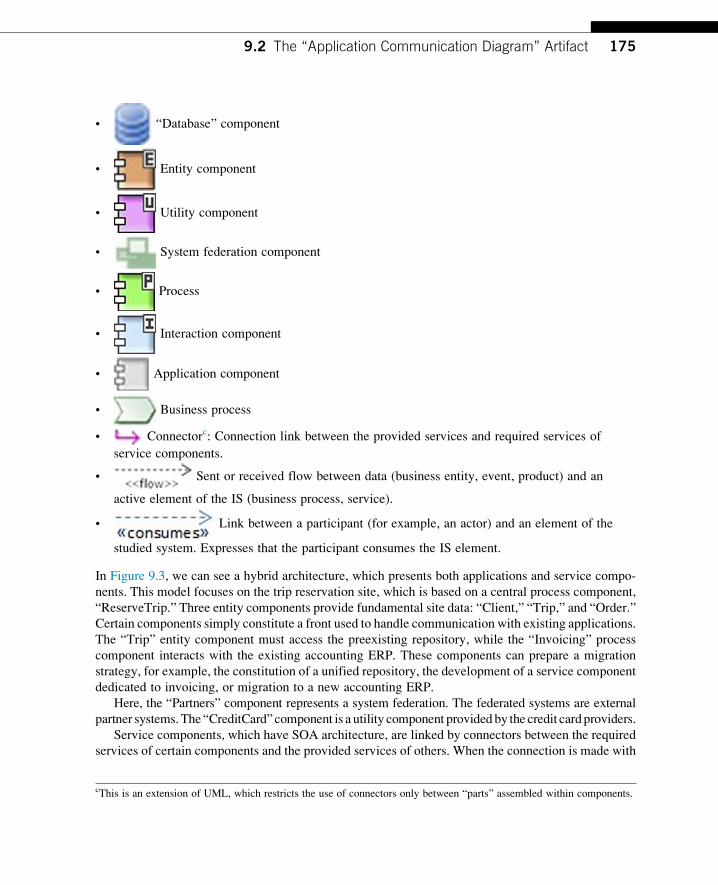
In Figure 9.3, we can see a hybrid architecture, which presents both applications and service compo-
nents. This model focuses on the trip reservation site, which is based on a central process component,
“ReserveTrip.” Three entity components provide fundamental site data: “Client,” “Trip,” and “Order.”
Certain components simply constitute a front used to handle communication with existing applications.
The “Trip” entity component must access the preexisting repository, while the “Invoicing” process
component interacts with the existing accounting ERP. These components can prepare a migration
strategy, for example, the constitution of a unified repository, the development of a service component
dedicated to invoicing, or migration to a new accounting ERP.
Here, the “Partners” component represents a system federation. The federated systems are external
partner systems.The “CreditCard”component is a utility component providedby the credit cardproviders.
Service components, which have SOA architecture, are linked by connectors between the required
services of certain components and the provided services of others. When the connection is made with
cThis is an extension of UML, which restricts the use of connectors only between “parts” assembled within components.
FIGURE 9.3
The architecture is structured in layers, with “interaction” components at the top and “entity” components at the
bottom.
176 CHAPTER 9 Models for Phase C: Information System Architecture
applications, this connection (which is less structured than the SOA approach) is represented by data
flows (flow links; for example, between “Invoicing” and “Accounting ERP”).
9.2.2 Modeling application architectureThe aim of application communication diagrams is to present the interconnections and communica-
tions that exist between the applications and application components of the system. The TOGAF con-
cept of the application component is at the heart of these models. These components will frequently
have services that enable exchanges between components. These information services can be a real-
ization of business services. They will exchange messages that contain data from business entities.
Here, we can see that business architecture elements are used heavily when constituting application
architecture.
The elements presented in application communication diagrams are defined at a logical level.
The aim is not to define software components nor to determine the means of software or physical com-
munication used (for example, web service, http, LAN). These models therefore focus on the functional
level, concentrating on the identification of components that will play a specific role in the IS and on
1779.3 The “Application Migration Diagram” Artifact
communication requirements between components. In practice, and particularly where existing archi-
tecture must be taken into account, there can be a mix of pure logical components and existing appli-
cations or off-the-shelf applications, such as ERPs. The logical level is particularly important for the
parts of the architecture that are to be reformed or for new extensions.
TOGAF recommends the use of an SOA-oriented architecture where possible. We advocate the
construction of an SOA-oriented architecture whenever the model is developed at the logical level,
notably by defining application components as service components in an SOA architecture.
We have seen that we have a service component typology enabling service components to be struc-
tured into layers, three key layers being “interaction,” “process,” and “entity.”
Application architecture will often be hybrid, through the introduction of existing or off-the-shelf
applications, or the localization of repositories. For this, certain application components will be of an
“applicationd” or “database” nature.
Service components will be interconnected via the services they require and provide. “Connectors”
are links connecting these services. In general, services are modeled in more detail in specific diagrams.
Similarly, messages, which are types of information exchanged by services, have to be modeled in
detailed elsewhere (see Figure 9.14). The services, service operations, inputs and outputs, exceptions,
and protocols need to be specified.
Application communication diagrams can be dedicated to describing current architecture, target
architecture, or intermediate architecture. Models can thus evolve from hybrid architecture (containing
many applications and few service components) into reformed, SOA-oriented architecture, which will
have reorganized applications by extracting and combining new service components.
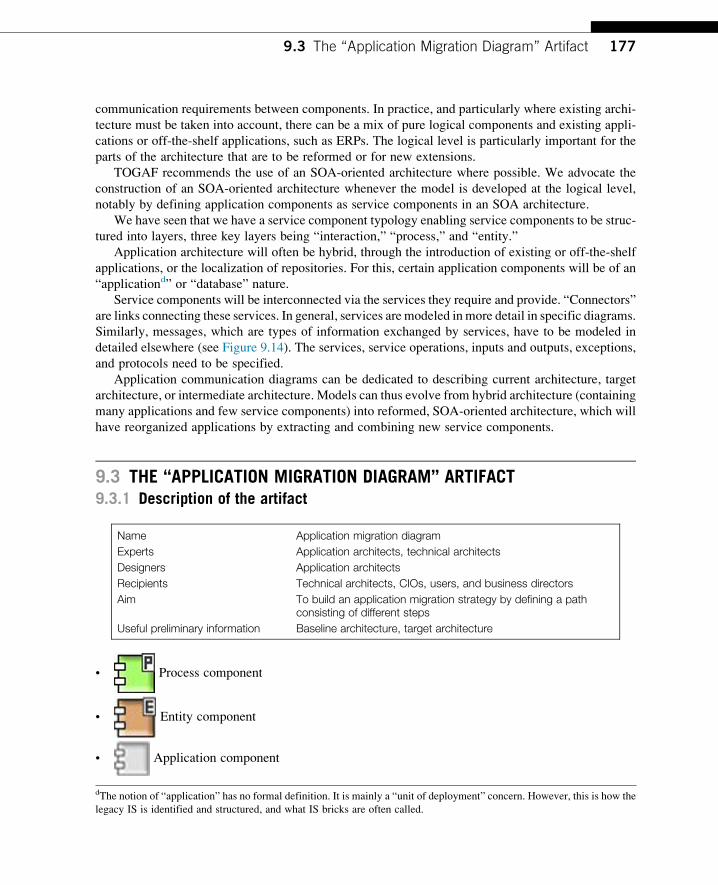
9.3 THE “APPLICATION MIGRATION DIAGRAM” ARTIFACT9.3.1 Description of the artifact
dThe
lega
Name
notion of “application” has no formal de
cy IS is identified and structured, and wh
Application migration diagram
Experts
Application architects, technical architectsDesigners
Application architectsRecipients
Technical architects, CIOs, users, and business directorsAim
To build an application migration strategy by defining a pathconsisting of different stepsUseful preliminary information
Baseline architecture, target architecture• Process component
• Entity component
• Application component
finition. It is mainly a “unit of deployment” concern. However, this is how the
at IS bricks are often called.
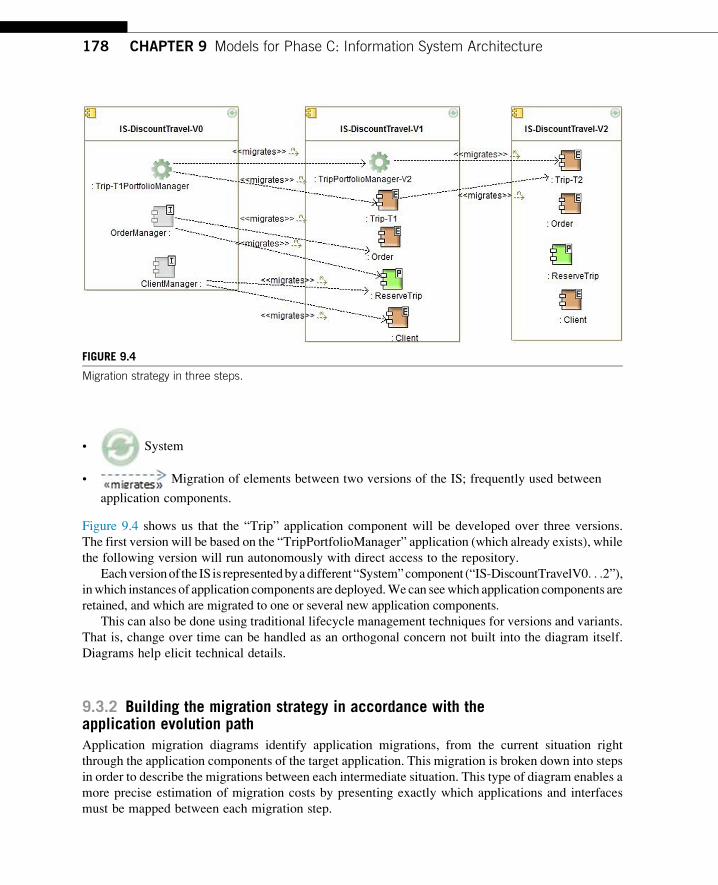
FIGURE 9.4
Migration strategy in three steps.
178 CHAPTER 9 Models for Phase C: Information System Architecture
• System
• Migration of elements between two versions of the IS; frequently used between
application components.
Figure 9.4 shows us that the “Trip” application component will be developed over three versions.
The first version will be based on the “TripPortfolioManager” application (which already exists), while
the following version will run autonomously with direct access to the repository.
Eachversionof the IS is representedbyadifferent “System”component (“IS-DiscountTravelV0. . .2”),inwhich instances of application components are deployed.Wecan seewhich application components are
retained, and which are migrated to one or several new application components.
This can also be done using traditional lifecycle management techniques for versions and variants.
That is, change over time can be handled as an orthogonal concern not built into the diagram itself.
Diagrams help elicit technical details.
9.3.2 Building the migration strategy in accordance with theapplication evolution pathApplication migration diagrams identify application migrations, from the current situation right
through the application components of the target application. This migration is broken down into steps
in order to describe the migrations between each intermediate situation. This type of diagram enables a
more precise estimation of migration costs by presenting exactly which applications and interfaces
must be mapped between each migration step.
1799.4 The “Application and User Location Diagram” Artifact
An efficient practice consists in representing the system as a component that contains all application
components. These are deployed as instances of the component they represent. Each instance can then
be specifically configured in each version of the system. Thus, an instance a1 of a component A can be
connected to an instance b of a component B in a version of the system, while an instance a2 of the same
component A can be linked to an instance c of a component C, which is different to B, in another ver-
sion of the system.
In this way, instances of identical components configured specifically for each version of the system
are presented. We indicate which components are retained, which are replaced, and which are retained
but isolated by other components that act as interfaces, and so on.
Migration links are defined between these instances of components.
It is important to make sure that continuity of service is guaranteed at every step. Furthermore, sce-
nario modeling (for example, using sequence diagrams) highlights the order in which different archi-
tecture elements are used. This often varies according to the different steps.
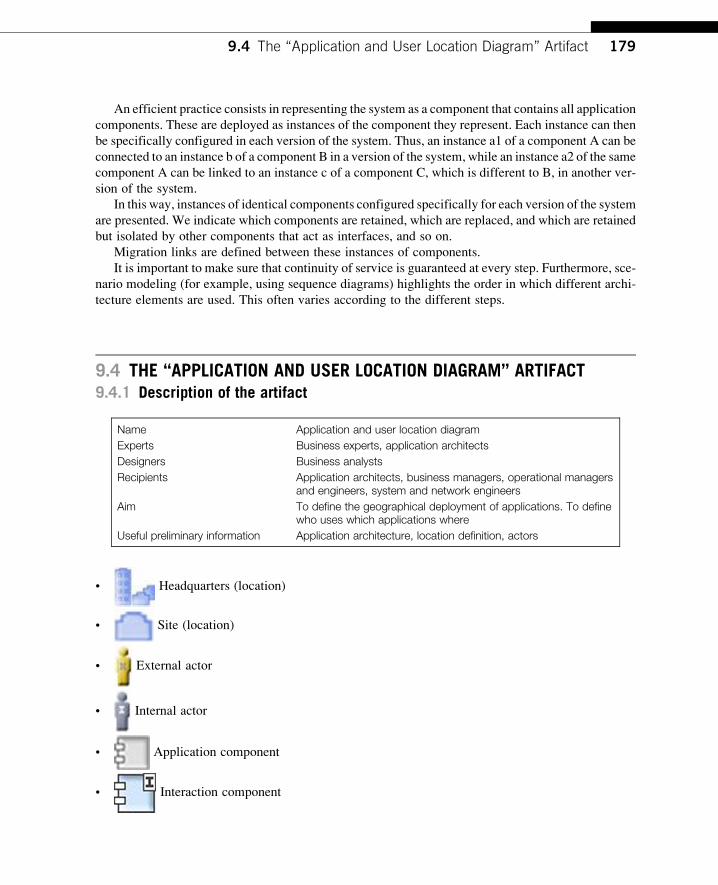
9.4 THE “APPLICATION AND USER LOCATION DIAGRAM” ARTIFACT9.4.1 Description of the artifact
Name
Application and user location diagramExperts
Business experts, application architectsDesigners
Business analystsRecipients
Application architects, business managers, operational managersand engineers, system and network engineersAim
To define the geographical deployment of applications. To definewho uses which applications whereUseful preliminary information
Application architecture, location definition, actors• Headquarters (location)
• Site (location)
• External actor
• Internal actor
• Application component
• Interaction component
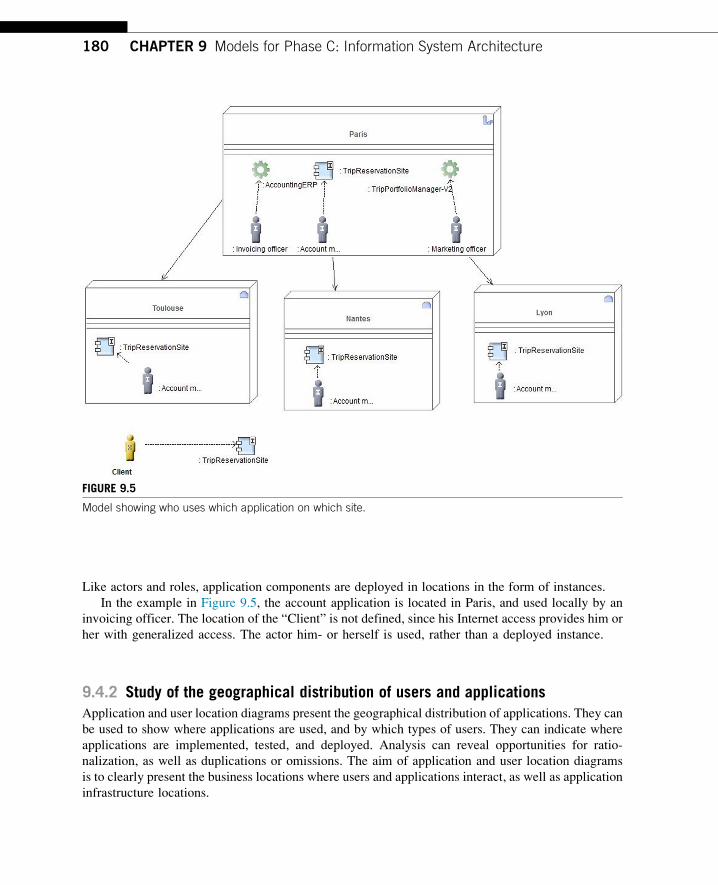
FIGURE 9.5
Model showing who uses which application on which site.
180 CHAPTER 9 Models for Phase C: Information System Architecture
Like actors and roles, application components are deployed in locations in the form of instances.
In the example in Figure 9.5, the account application is located in Paris, and used locally by an
invoicing officer. The location of the “Client” is not defined, since his Internet access provides him or
her with generalized access. The actor him- or herself is used, rather than a deployed instance.
9.4.2 Study of the geographical distribution of users and applicationsApplication and user location diagrams present the geographical distribution of applications. They can
be used to show where applications are used, and by which types of users. They can indicate where
applications are implemented, tested, and deployed. Analysis can reveal opportunities for ratio-
nalization, as well as duplications or omissions. The aim of application and user location diagrams
is to clearly present the business locations where users and applications interact, as well as application
infrastructure locations.
1819.5 The “System Use Case Diagram” Artifact
This type of diagram is used to:
• Identify the amount of hardware and software necessary to support the population of geographically
distributed users.
• Estimate the number of user licenses necessary for software purchased off-the-shelf.
• Evaluate user support needs and define the locations of support centers.
• Select the necessary system administration tools to support users, partners, and clients, both locally
and remotely.
• Define schedules for setting up technological components for the business: server sizing, network
bandwidth, storage and saving capacities, and so on.
• Obtain initial indications of performance when applications and technological architectural
solutions are implemented.
Users interact with the IS in different ways. For example:
• To support daily business operations
• To participate in the running of a business process
• To access information (consultation, update)
• To develop applications
• To administrate and maintain the application
Application and user location diagrams typically show where servers are located and where applica-
tions are run. This deployment model is developed by creating instances of application components
inside instances of IT hardware, which are themselves inside geographical locations. In cloud com-
puting systems, this type of diagram is very useful for identifying and positioning the services and
applications deployed in the cloud.
9.5 THE “SYSTEM USE CASE DIAGRAM” ARTIFACT9.5.1 Description of the artifact
Name
System use case diagramExperts
Business analysts, application architectsDesigners
Application architects or business analystsRecipients
Application architects, technical architectsAim
To define the functions expected from application components and thedifferent usage modesUseful preliminary information
Business use cases, actors, business processes, business services• Use case
• External actor (TOGAF)
182 CHAPTER 9 Models for Phase C: Information System Architecture
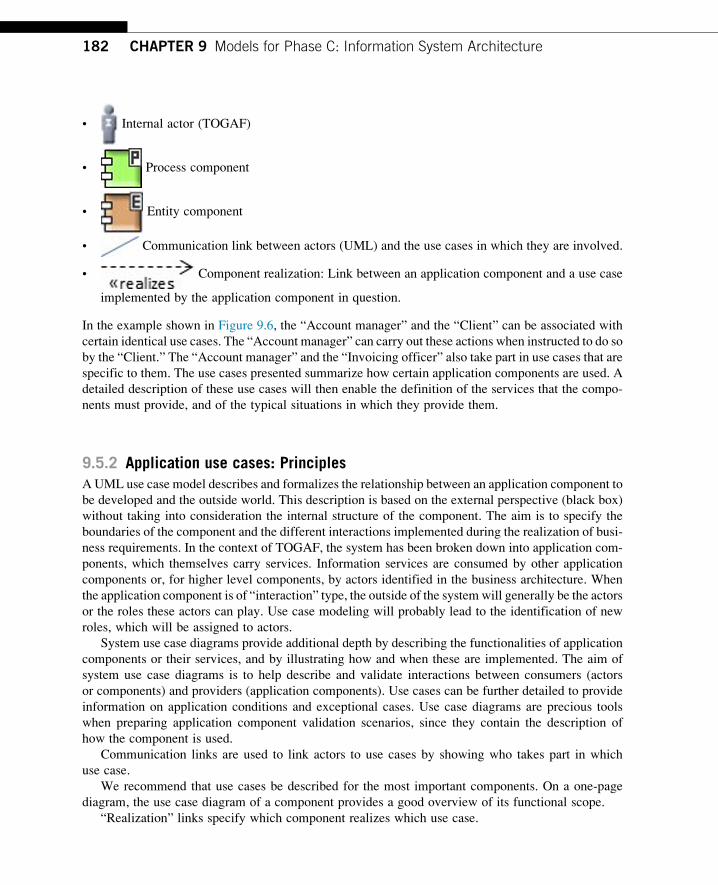
• Internal actor (TOGAF)
• Process component
• Entity component
• Communication link between actors (UML) and the use cases in which they are involved.
• Component realization: Link between an application component and a use case
implemented by the application component in question.
In the example shown in Figure 9.6, the “Account manager” and the “Client” can be associated with
certain identical use cases. The “Account manager” can carry out these actions when instructed to do so
by the “Client.” The “Account manager” and the “Invoicing officer” also take part in use cases that are
specific to them. The use cases presented summarize how certain application components are used. A
detailed description of these use cases will then enable the definition of the services that the compo-
nents must provide, and of the typical situations in which they provide them.
9.5.2 Application use cases: PrinciplesAUML use case model describes and formalizes the relationship between an application component to
be developed and the outside world. This description is based on the external perspective (black box)
without taking into consideration the internal structure of the component. The aim is to specify the
boundaries of the component and the different interactions implemented during the realization of busi-
ness requirements. In the context of TOGAF, the system has been broken down into application com-
ponents, which themselves carry services. Information services are consumed by other application
components or, for higher level components, by actors identified in the business architecture. When
the application component is of “interaction” type, the outside of the system will generally be the actors
or the roles these actors can play. Use case modeling will probably lead to the identification of new
roles, which will be assigned to actors.
System use case diagrams provide additional depth by describing the functionalities of application
components or their services, and by illustrating how and when these are implemented. The aim of
system use case diagrams is to help describe and validate interactions between consumers (actors
or components) and providers (application components). Use cases can be further detailed to provide
information on application conditions and exceptional cases. Use case diagrams are precious tools
when preparing application component validation scenarios, since they contain the description of
how the component is used.
Communication links are used to link actors to use cases by showing who takes part in which
use case.
We recommend that use cases be described for the most important components. On a one-page
diagram, the use case diagram of a component provides a good overview of its functional scope.
“Realization” links specify which component realizes which use case.
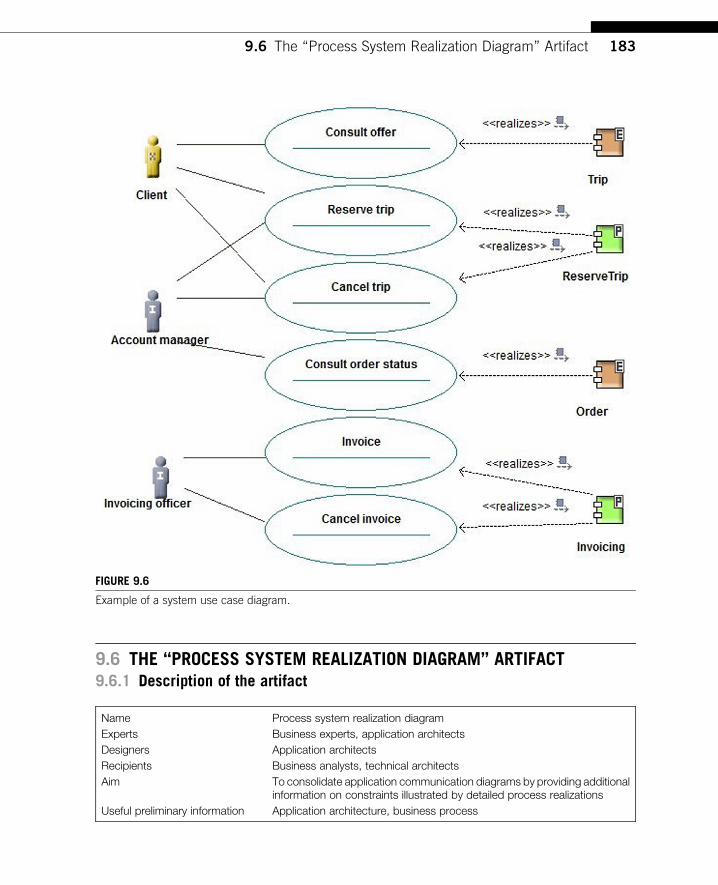
FIGURE 9.6
Example of a system use case diagram.
1839.6 The “Process System Realization Diagram” Artifact
9.6 THE “PROCESS SYSTEM REALIZATION DIAGRAM” ARTIFACT9.6.1 Description of the artifact
Name
Process system realization diagramExperts
Business experts, application architectsDesigners
Application architectsRecipients
Business analysts, technical architectsAim
To consolidate application communication diagrams by providing additionalinformation on constraints illustrated by detailed process realizationsUseful preliminary information
Application architecture, business process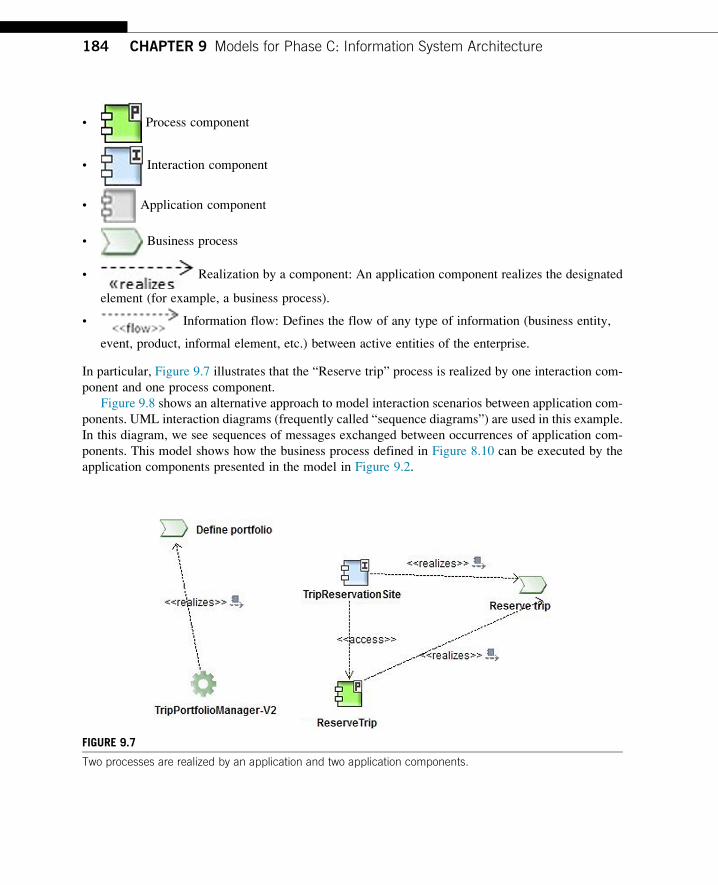
184 CHAPTER 9 Models for Phase C: Information System Architecture
• Process component
• Interaction component
• Application component
• Business process
• Realization by a component: An application component realizes the designated
element (for example, a business process).
• Information flow: Defines the flow of any type of information (business entity,
event, product, informal element, etc.) between active entities of the enterprise.
In particular, Figure 9.7 illustrates that the “Reserve trip” process is realized by one interaction com-
ponent and one process component.
Figure 9.8 shows an alternative approach to model interaction scenarios between application com-
ponents. UML interaction diagrams (frequently called “sequence diagrams”) are used in this example.
In this diagram, we see sequences of messages exchanged between occurrences of application com-
ponents. This model shows how the business process defined in Figure 8.10 can be executed by the
application components presented in the model in Figure 9.2.
FIGURE 9.7
Two processes are realized by an application and two application components.
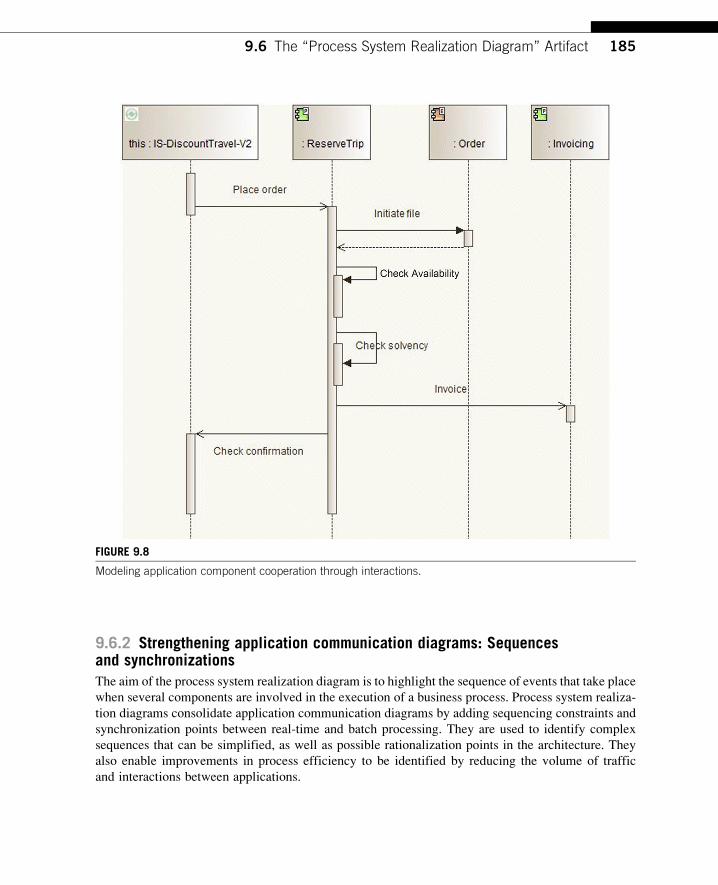
FIGURE 9.8
Modeling application component cooperation through interactions.
1859.6 The “Process System Realization Diagram” Artifact
9.6.2 Strengthening application communication diagrams: Sequencesand synchronizationsThe aim of the process system realization diagram is to highlight the sequence of events that take place
when several components are involved in the execution of a business process. Process system realiza-
tion diagrams consolidate application communication diagrams by adding sequencing constraints and
synchronization points between real-time and batch processing. They are used to identify complex
sequences that can be simplified, as well as possible rationalization points in the architecture. They
also enable improvements in process efficiency to be identified by reducing the volume of traffic
and interactions between applications.
186 CHAPTER 9 Models for Phase C: Information System Architecture
In these models, information on roles or order can be presented using information flows (as in the
example) or textual notes attached to elements. UML tools (sequence diagrams, collaboration dia-
grams) enable more detailed sequencing information to be provided.
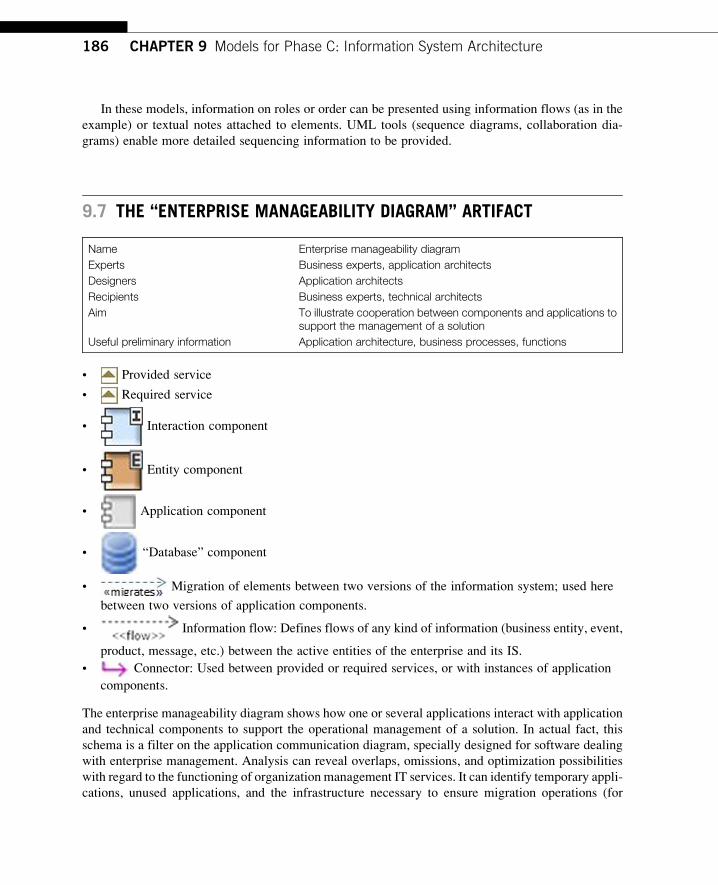
9.7 THE “ENTERPRISE MANAGEABILITY DIAGRAM” ARTIFACT
Name
Enterprise manageability diagramExperts
Business experts, application architectsDesigners
Application architectsRecipients
Business experts, technical architectsAim
To illustrate cooperation between components and applications tosupport the management of a solutionUseful preliminary information
Application architecture, business processes, functions• Provided service
• Required service
• Interaction component
• Entity component
• Application component
• “Database” component
• Migration of elements between two versions of the information system; used here
between two versions of application components.
• Information flow: Defines flows of any kind of information (business entity, event,
product, message, etc.) between the active entities of the enterprise and its IS.
• Connector: Used between provided or required services, or with instances of application
components.
The enterprise manageability diagram shows how one or several applications interact with application
and technical components to support the operational management of a solution. In actual fact, this
schema is a filter on the application communication diagram, specially designed for software dealing
with enterprise management. Analysis can reveal overlaps, omissions, and optimization possibilities
with regard to the functioning of organization management IT services. It can identify temporary appli-
cations, unused applications, and the infrastructure necessary to ensure migration operations (for
1879.7 The “Enterprise Manageability Diagram” Artifact
example, parallel execution environments). UML collaboration diagrams provide a more complete
means of expressing sequencing.
The “migrates” dependency is frequently used in this type of model.
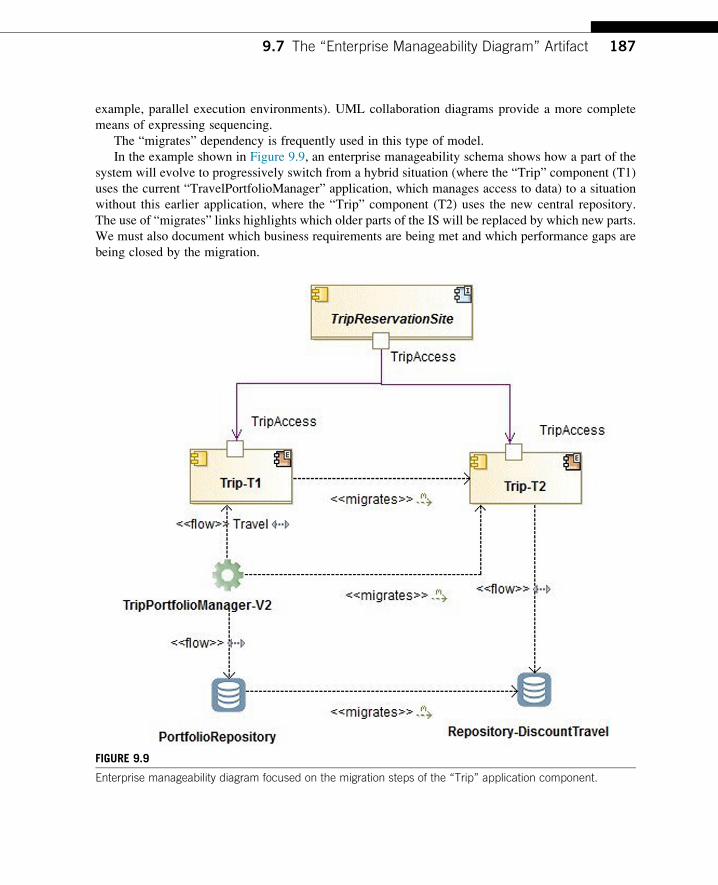
In the example shown in Figure 9.9, an enterprise manageability schema shows how a part of the
system will evolve to progressively switch from a hybrid situation (where the “Trip” component (T1)
uses the current “TravelPortfolioManager” application, which manages access to data) to a situation
without this earlier application, where the “Trip” component (T2) uses the new central repository.
The use of “migrates” links highlights which older parts of the IS will be replaced by which new parts.
We must also document which business requirements are being met and which performance gaps are
being closed by the migration.
FIGURE 9.9
Enterprise manageability diagram focused on the migration steps of the “Trip” application component.
188 CHAPTER 9 Models for Phase C: Information System Architecture
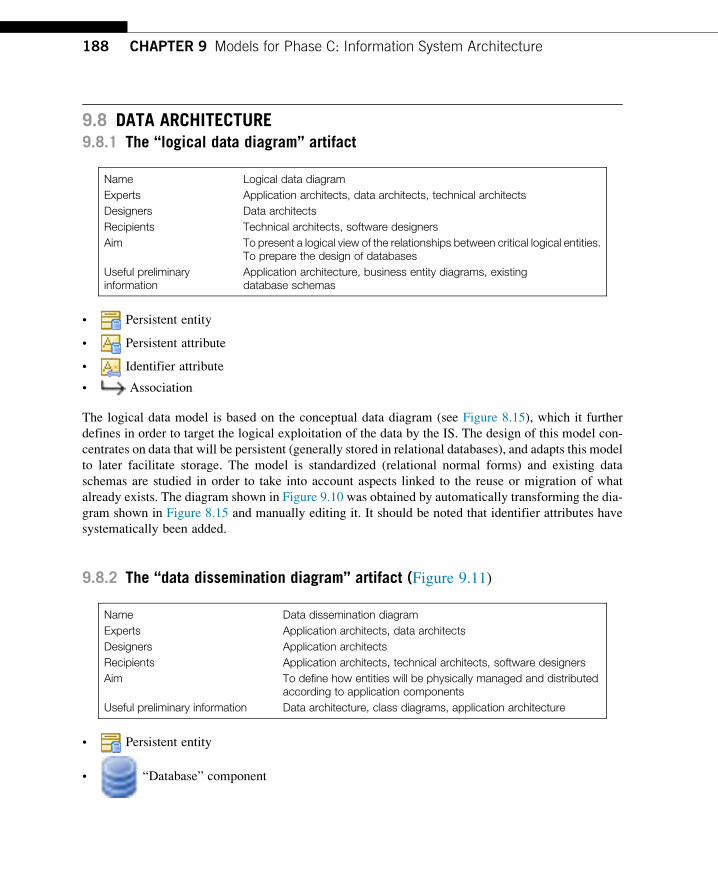
9.8 DATA ARCHITECTURE9.8.1 The “logical data diagram” artifact
Name
Logical data diagramExperts
Application architects, data architects, technical architectsDesigners
Data architectsRecipients
Technical architects, software designersAim
To present a logical view of the relationships between critical logical entities.To prepare the design of databasesUseful preliminaryinformation
Application architecture, business entity diagrams, existingdatabase schemas
• Persistent entity
• Persistent attribute
• Identifier attribute
• Association
The logical data model is based on the conceptual data diagram (see Figure 8.15), which it further
defines in order to target the logical exploitation of the data by the IS. The design of this model con-
centrates on data that will be persistent (generally stored in relational databases), and adapts this model
to later facilitate storage. The model is standardized (relational normal forms) and existing data
schemas are studied in order to take into account aspects linked to the reuse or migration of what
already exists. The diagram shown in Figure 9.10 was obtained by automatically transforming the dia-
gram shown in Figure 8.15 and manually editing it. It should be noted that identifier attributes have
systematically been added.
9.8.2 The “data dissemination diagram” artifact (Figure 9.11)
Name
Data dissemination diagramExperts
Application architects, data architectsDesigners
Application architectsRecipients
Application architects, technical architects, software designersAim
To define how entities will be physically managed and distributedaccording to application componentsUseful preliminary information
Data architecture, class diagrams, application architecture• Persistent entity
• “Database” component
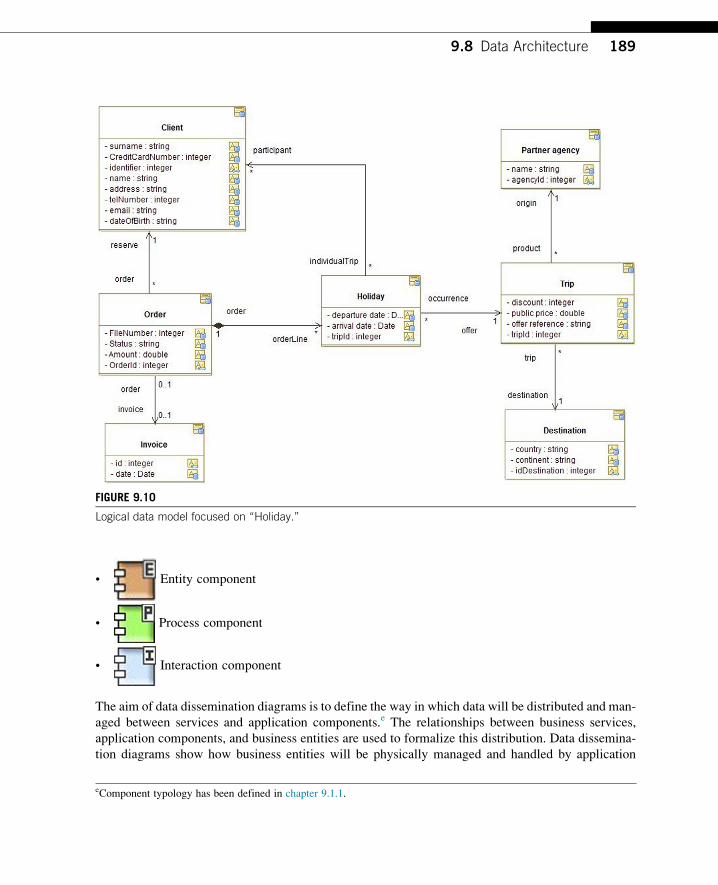
FIGURE 9.10
Logical data model focused on “Holiday.”
1899.8 Data Architecture
• Entity component
• Process component
• Interaction component
The aim of data dissemination diagrams is to define the way in which data will be distributed and man-
aged between services and application components.e The relationships between business services,
application components, and business entities are used to formalize this distribution. Data dissemina-
tion diagrams show how business entities will be physically managed and handled by application
eComponent typology has been defined in chapter 9.1.1.
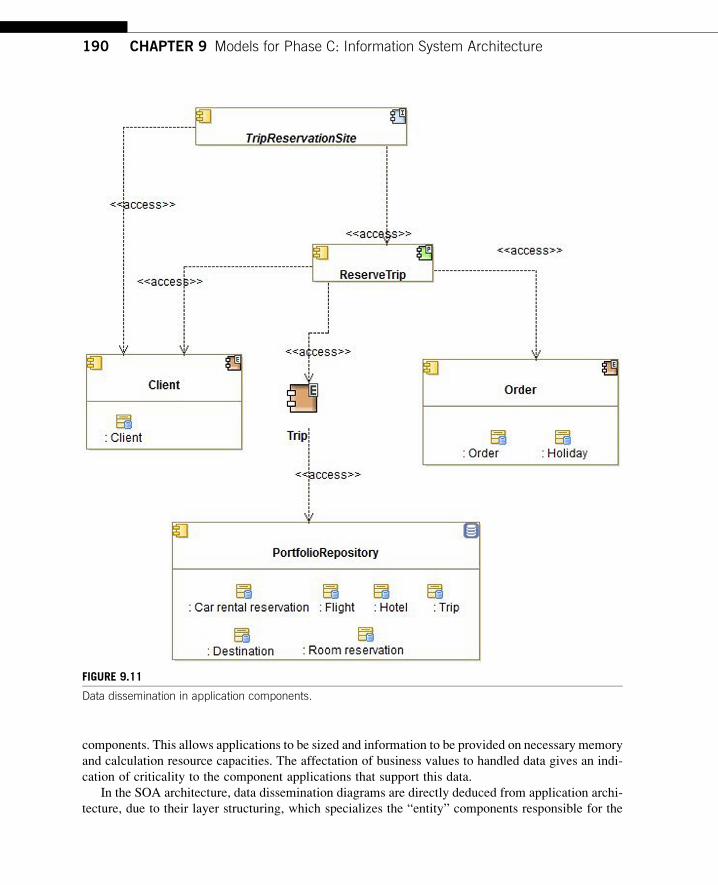
FIGURE 9.11
Data dissemination in application components.
190 CHAPTER 9 Models for Phase C: Information System Architecture
components. This allows applications to be sized and information to be provided on necessary memory
and calculation resource capacities. The affectation of business values to handled data gives an indi-
cation of criticality to the component applications that support this data.
In the SOA architecture, data dissemination diagrams are directly deduced from application archi-
tecture, due to their layer structuring, which specializes the “entity” components responsible for the
1919.8 Data Architecture
most important business entities and closely related entities. In non-SOA or hybrid architecture, data
dissemination diagrams can reveal data replication issues and problems regarding application respon-
sibility on data.
Data dissemination diagrams can include services that encapsulate data handling and are realized by
application components. Once again, in an SOA architecture, these relationships are made easier
through their systematization: an entity component manages a business entity, and presents the services
enabling other components to handle this entity. This homogeneous architecture identifies who or what
is responsible for a business entity and systematizes the way in which entities are managed.
Data dissemination diagrams reuse application architecture models, such as application communi-
cation diagrams, by connecting persistent entities (logical data model) to application components. Data
dissemination can be presented either by deploying an instance of an entity in a component, which will
be visualized as being graphically embedded (as in Figure 9.9 where the “Flight” data is embedded
inside “PortfolioRepository”), or by linking the entity to the component via a specific dependency
(flow). In the example presented, data is located either in a dedicated repository (“portfolio repository”
or “accounting repository”) or in dedicated entity components (for example, the “Client” component).
We can see that the “Trip” entity is managed in the “PortfolioRepository” repository (the hybrid nature
of the SOA architecture), while the “Order” entity is managed by the “Order” entity component.
9.8.3 The “data security diagram” artifact
Name
Data security diagramExperts
Security expertsDesigners
AnalystsRecipients
Analysts, security experts, application architectsAim
To define and control data access securityUseful preliminaryinformation
Class diagrams, business entities, business processes, organization,and actors
• External actor
• Internal actor
• Persistent entity
• Dataflow: Links an active element (actor, process, etc.) to an element
carrying data (entity, event, etc.). Habilitations can be expressed on these flows, thereby indicating
which access rights the active element has to which data.
Figure 9.12 shows who is authorized to access which data, and with which access rights. Thus, the
account manager can create (C) or delete (D) a holiday.
Data constitutes an essential element of the enterprise’s heritage. Guaranteeing data security and
understanding data access rights is a vital part of security analysis. Ensuring data security means that
data integrity will not be compromised and that access authorization will be controlled. Data security
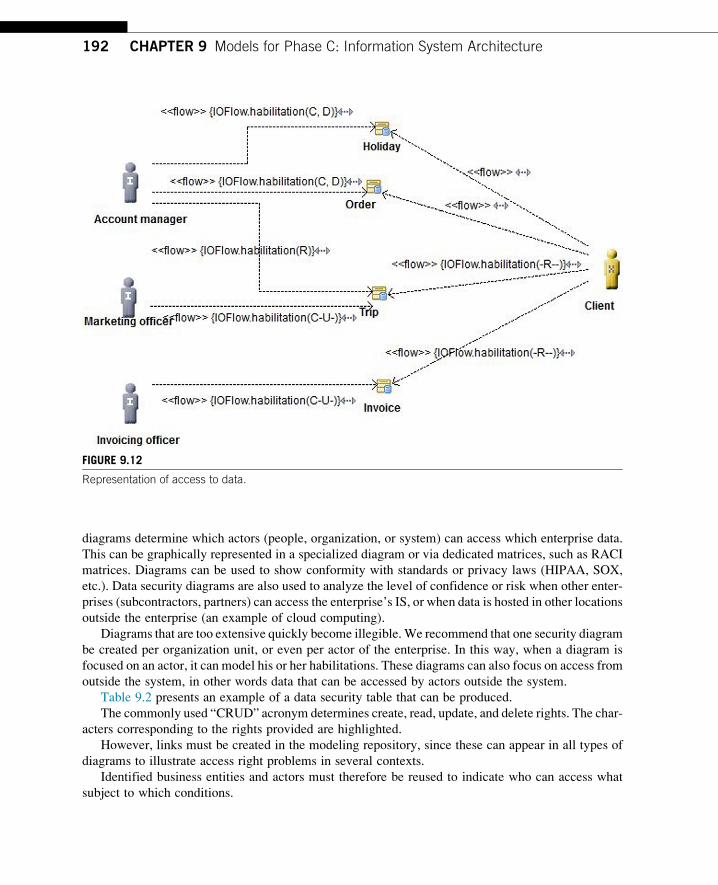
FIGURE 9.12
Representation of access to data.
192 CHAPTER 9 Models for Phase C: Information System Architecture
diagrams determine which actors (people, organization, or system) can access which enterprise data.
This can be graphically represented in a specialized diagram or via dedicated matrices, such as RACI
matrices. Diagrams can be used to show conformity with standards or privacy laws (HIPAA, SOX,
etc.). Data security diagrams are also used to analyze the level of confidence or risk when other enter-
prises (subcontractors, partners) can access the enterprise’s IS, or when data is hosted in other locations
outside the enterprise (an example of cloud computing).
Diagrams that are too extensive quickly become illegible.We recommend that one security diagram
be created per organization unit, or even per actor of the enterprise. In this way, when a diagram is
focused on an actor, it can model his or her habilitations. These diagrams can also focus on access from
outside the system, in other words data that can be accessed by actors outside the system.
Table 9.2 presents an example of a data security table that can be produced.
The commonly used “CRUD” acronym determines create, read, update, and delete rights. The char-
acters corresponding to the rights provided are highlighted.
However, links must be created in the modeling repository, since these can appear in all types of
diagrams to illustrate access right problems in several contexts.
Identified business entities and actors must therefore be reused to indicate who can access what
subject to which conditions.
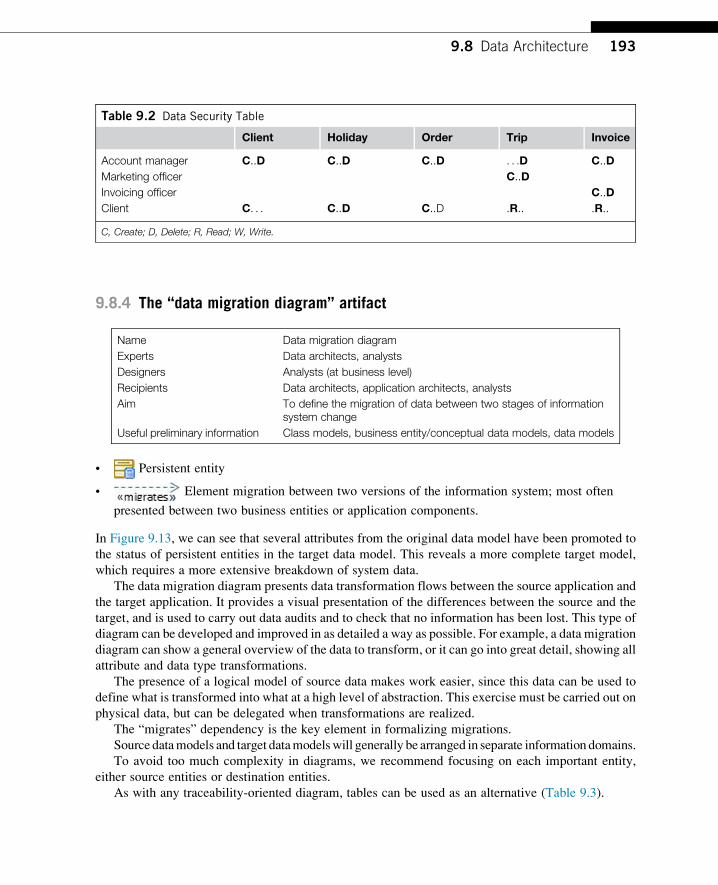
Table 9.2 Data Security Table
Client Holiday Order Trip Invoice
Account manager C..D C..D C..D . . .D C..D
Marketing officer C..D
Invoicing officer C..D
Client C. . . C..D C..D .R.. .R..
C, Create; D, Delete; R, Read; W, Write.
1939.8 Data Architecture
9.8.4 The “data migration diagram” artifact
Name
Data migration diagramExperts
Data architects, analystsDesigners
Analysts (at business level)Recipients
Data architects, application architects, analystsAim
To define the migration of data between two stages of informationsystem changeUseful preliminary information
Class models, business entity/conceptual data models, data models• Persistent entity
• Element migration between two versions of the information system; most often
presented between two business entities or application components.
In Figure 9.13, we can see that several attributes from the original data model have been promoted to
the status of persistent entities in the target data model. This reveals a more complete target model,
which requires a more extensive breakdown of system data.
The data migration diagram presents data transformation flows between the source application and
the target application. It provides a visual presentation of the differences between the source and the
target, and is used to carry out data audits and to check that no information has been lost. This type of
diagram can be developed and improved in as detailed a way as possible. For example, a data migration
diagram can show a general overview of the data to transform, or it can go into great detail, showing all
attribute and data type transformations.
The presence of a logical model of source data makes work easier, since this data can be used to
define what is transformed into what at a high level of abstraction. This exercise must be carried out on
physical data, but can be delegated when transformations are realized.
The “migrates” dependency is the key element in formalizing migrations.
Source datamodels and target datamodelswill generally be arranged in separate information domains.
To avoid too much complexity in diagrams, we recommend focusing on each important entity,
either source entities or destination entities.
As with any traceability-oriented diagram, tables can be used as an alternative (Table 9.3).
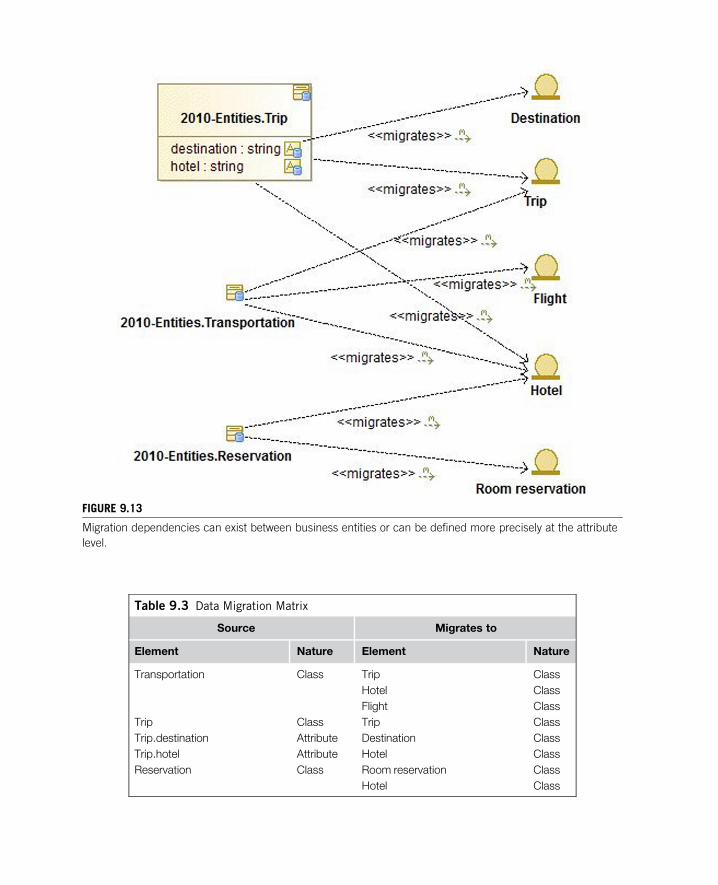
FIGURE 9.13
Migration dependencies can exist between business entities or can be defined more precisely at the attribute
level.
Table 9.3 Data Migration Matrix
Source Migrates to
Element Nature Element Nature
Transportation Class Trip Class
Hotel Class
Flight Class
Trip Class Trip Class
Trip.destination Attribute Destination Class
Trip.hotel Attribute Hotel Class
Reservation Class Room reservation Class
Hotel Class
1959.9 The “Service Data Diagram” Artifact
In this example, we see that the new model is better structured, since it groups previously dispersed
attributes into new entities. It has been normalized.
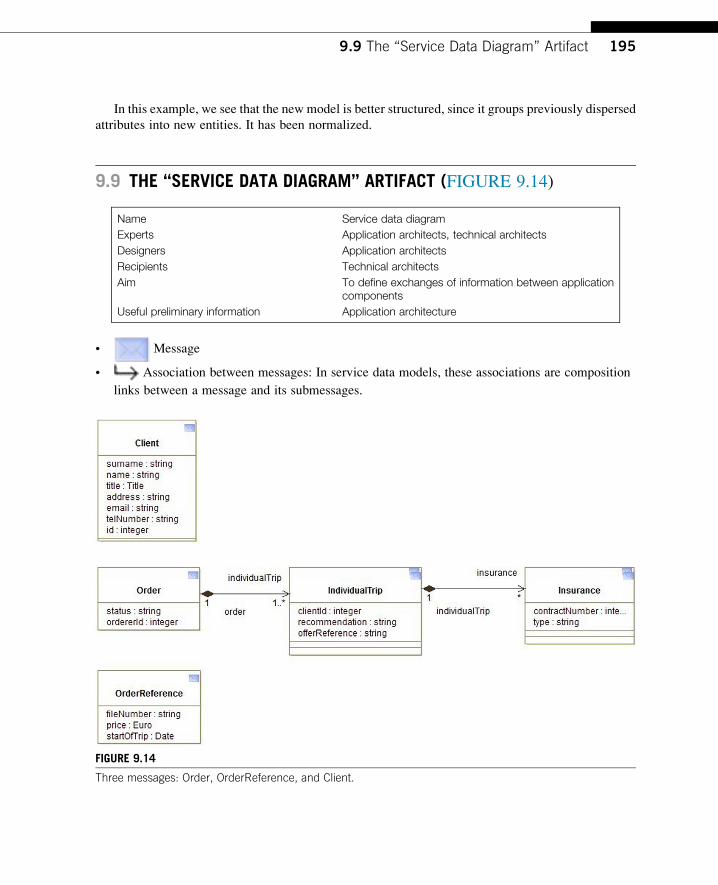
9.9 THE “SERVICE DATA DIAGRAM” ARTIFACT (FIGURE 9.14)
FIGU
Thre
Name
RE 9.14
e messages: Order, OrderReference, and Clie
Service data diagram
Experts
Application architects, technical architectsDesigners
Application architectsRecipients
Technical architectsAim
To define exchanges of information between applicationcomponentsUseful preliminary information
Application architecture• Message
• Association between messages: In service data models, these associations are composition
links between a message and its submessages.
nt.
196 CHAPTER 9 Models for Phase C: Information System Architecture
Service data or “messages” (sometimes called “business data types” or “Service Data Objects” or
“Message Types” in the SoaMLf standard) need a dedicated definition and model. The constitution
of messages is modeled in service data diagrams.
Service data is most often deduced from conceptual data diagrams and the needs of information
exchanges between services. It constitutes the parameters of service operations. The service data model
is an extract from service data information necessary for the full operation of services. Potential exten-
sibility and reusability needs must be foreseen so that the evolution of a service does not systematically
require the redefinition or creation of new service data variants. Service data is very often implemented
in the form of XML documents, where a particular message constitutes the root, which is often broken
down into message fragments. Service data models “denormalize” conceptual data models (class
models) by focusing only on the data that is necessary during exchanges. Thus, there is often a redun-
dancy of information between messages.
9.10 FUNDAMENTAL CONCEPTSThe following fundamental concepts were introduced in this chapter:
• Application architecture: Identifies IS components and their interactions in order to meet business
architecture expectations, while guaranteeing overall consistency and respecting the rules of an
architectural framework.
fSOA Modeling Language standardized by the OMG.