modeling effect of initial soil moisture on sorptivity and infiltration
TRANSCRIPT

Modeling effect of initial soil moisture on sorptivity and infiltration
Ryan D. Stewart,1 David E. Rupp,2 Majdi R. Abou Najm,3 and John S. Selker1
Received 14 February 2013; revised 23 August 2013; accepted 27 August 2013; published 28 October 2013.
[1] A soil’s capillarity, associated with the parameter sorptivity, is a dominant control oninfiltration, particularly at the onset of rainfall or irrigation. Many mathematical modelsused to estimate sorptivity are only valid for dry soils. This paper examines how sorptivityand its capillary component (as wetting front potential) change with initial degree ofsaturation. We capture these effects with a simple modification to the classic Green-Amptmodel of sorptivity. The modified model has practical applications, including (1) accuratelydescribing the relative sorptivity of a soil at various water contents and (2) allowing forquantification of a soil’s saturated hydraulic conductivity from sorptivity measurements,given estimates of the soil’s characteristic curve and initial water content. The latterapplication is particularly useful in soils of low permeability, where the time required toestimate hydraulic conductivity through steady-state methods can be impractical.
Citation: Stewart, R. D., D. E. Rupp, M. R. Abou Najm, and J. S. Selker (2013), Modeling effect of initial soil moisture on sorptivityand infiltration, Water Resour. Res., 49, 7037–7047, doi:10.1002/wrcr.20508.
1. Introduction
[2] Because infiltration affects water availability for vege-tation, groundwater recharge, overland flow, and solute trans-port, it has been the focus of considerable study over theprevious century [e.g., Green and Ampt, 1911; Philip, 1957b;Wooding, 1968; Brutsaert, 1977]. Under normal conditions,gravity and capillarity drive vertical infiltration, whereascapillarity alone drives horizontal infiltration [Philip, 1957b].
[3] Under constant head conditions, one- and three-dimensional vertical infiltration into a uniform soil hasbeen adequately described using Philip’s [1957b] two-termapproximation:
I ¼ Sffiffitpþ Ct ð1Þ
where I is cumulative infiltration over time t and S is the soilsorptivity. For one-dimensional vertical infiltration, C is pro-portional to the soil’s saturated hydraulic conductivity (Ks).The ratio C/Ks is� 1, depending on soil type and soil mois-ture [Philip, 1990], with proposed ranges of 1/3�C/Ks� 2/3[Fuentes et al., 1992] or 0.3�C/Ks� 0.4 [Philip, 1990].In the case of three-dimensional infiltration, C incorporatesboth saturated hydraulic conductivity and sorptivity [Smettemet al., 1995; Touma et al., 2007].
[4] At early times (i.e., t << S2/C2) sorptivity dominatesthe infiltration behavior, and for very early times (t! 0) thesecond term on the right hand side may be neglected [Whiteet al., 1992]. Conversely, the second term dominates as timeincreases, subject to the limit of t¼ S2/C2, when the seriesexpansion from which equation (1) was derived is no longeraccurate. Alternate expressions have been developed todescribe long-time (steady-state) infiltration behavior [Philip,1957a, 1957b; Wooding, 1968; Haverkamp et al., 1994],which lend themselves to estimations of Ks. However, thetime required to reach late-time or quasi-steady state condi-tions may be impractical, particularly for soils with low hy-draulic conductivity, and assumptions of homogeneity aretypically violated for long infiltration experiments.
[5] Infiltration typically occurs over intermediate or tran-sient timescales (neither exclusively early- nor late-time) andis three-dimensional. One such example is infiltration froman axisymmetric single ring source, which can provide arapid and low-cost measurement of soil hydraulic properties[Braud et al., 2005]. However, interpretation of these infiltra-tion tests often requires that the S and C terms both be con-sidered. Methods to differentiate between sorptivity andsaturated hydraulic conductivity for such infiltration condi-tions have been proposed [Smiles and Knight, 1976; Smettemet al., 1995; Vandervaere et al., 2000], but may be inad-equate for estimating small Ks values [Smettem et al., 1995].
[6] Sorptivity represents the soil’s ability to draw water[Philip, 1957b; Touma et al., 2007], which is a function ofthe capillarity (the driving force) and the soil’s hydraulicconductivity (the dissipation). This dual-dependence is evi-dent in Parlange [1975]’s precise solution for sorptivity (asmodified for positive ponded conditions by Haverkampet al. [1990]):
S2 ¼ 2Ks �s � �rð Þ 1��0ð Þhsurf
þ �s � �rð ÞZ0
h0
1þ�� 2�0ð ÞK hð Þdh ð2Þ
1Biological & Ecological Engineering Department, Oregon StateUniversity, Corvallis, Oregon, USA.
2Oregon Climate Change Research Institute, College of Earth, Oceanand Atmospheric Sciences, Oregon State University, Corvallis, Oregon,USA.
3Civil & Environmental Engineering Department, American Universityof Beirut, Beirut, Lebanon.
Corresponding author: R. D. Stewart, Department of Crop and SoilEnvironmental Science, Virginia Polytechnic Institute and State Univer-sity, Blacksburg, VA, USA. ([email protected])
©2013. American Geophysical Union. All Rights Reserved.0043-1397/13/10.1002/wrcr.20508
7037
WATER RESOURCES RESEARCH, VOL. 49, 7037–7047, doi:10.1002/wrcr.20508, 2013
where � is the degree of saturation
� ¼ �� �r
�s � �r; ð3Þ
[7] �0, �s, and �r are the initial, saturated, and residualvolumetric soil water contents, respectively, K(h) is the hy-draulic conductivity as a function of soil matric potential,h0 is the initial matric potential, and hsurf is the depth ofponding at the surface.
[8] Hydraulic conductivity also appears in the simpler or‘‘traditional’’ definition of sorptivity provided by the Greenand Ampt [1911] model:
S2 ¼2Ks �s � �rð Þ 1��0ð Þ hwf þ hsurf
� �’
ð4Þ
where hwf is the wetting front potential, which is also referredto as the effective capillary drive [Morel-Seytoux et al.,1996], capillary pull, or macroscopic capillary length [Whiteand Sully, 1987]. The correction factor ’ accounts for devia-tions from a sharp wetting front and/or viscous dampingeffects. For example, ’¼ 1 for a Green and Ampt [1911] so-lution, 1.1 for the White and Sully [1987] solution, and 1.1-1.7 for the Morel-Seytoux and Khanji [1974] solution.
[9] Because hydraulic conductivity is embedded in sorp-tivity, certain measurements of the latter can be used toinfer the former. One such approach is to utilize field-basedsorptivity measurements in conjunction with variations ofthe traditional sorptivity model [equation (4)] to quantifyKs [White and Perroux, 1987, 1989]. However, estimatesof initial soil moisture and the soil’s wetting front potentialare needed for this approach. Solutions exist to quantifywetting front potential in dry soils (when �0¼ 0) [Rawlset al., 1992; Morel-Seytoux et al., 1996], given that the pa-rameters of a water retention function are known. Forinstance, Morel-Seytoux et al. [1996] approximated thewetting front potential of a dry soil as
hwf ¼1
�
� �0:046 mþ 2:07 m2 þ 19:5 m3
1þ 4:7 mþ 16 m2
� �ð5Þ
where � and m are parameters of the Van Genuchten[1980] water retention curve, based on the Mualem [1976]water retention model, for �> 0 and 0 < m < 1.
[10] hwf is recognized to change with the initial moisturestate of the soil [Green and Ampt, 1911], and the aforemen-tioned solutions for estimating wetting front potential do notinclude corrections for this variation. In a different approach,Bouwer [1964] and Neuman [1976] described hwf at earlyinfiltration times as a function of soil matric potential, h, by
hwf ¼1
2
Zh0
0
1þ �� �0
�s � �0
� �Kr hð Þdh ð6Þ
where Kr(h) is the relative hydraulic conductivity functionK(h)/Ks. While it is possible to put equation (6) in terms of�0 by using a characteristic curve relationship [Brooks andCorey, 1964; Van Genuchten, 1980], the resulting equa-tions are cumbersome.
[11] In this paper, we propose an alternative formulationof wetting front potential as a function of initial degree ofsaturation. This allows for a modification to the traditional(Green and Ampt) sorptivity model so that it better approx-imates sorptivity throughout the soil moisture range,including nearly saturated soils (�< 0.96). This modifiedexpression can then be used to interpret short-term constanthead infiltration measurements, to quantify the magnitudeand variability in time and space of a soil’s saturated hy-draulic conductivity, even in wet soils.
2. Theory
2.1. Sorptivity and Wetting Front Potential
[12] The Parlange [1975] expression for sorptivity interms of soil diffusivity (D) and degree of saturation (�)is :
S2 ¼ �s � �rð Þ2Z�f
�0
�f þ�� 2�0
� �D �ð Þd� ð7Þ
where �f is the final volumetric soil water content.[13] Soil diffusivity (D) is defined as
D ¼ Kdh
d�ð8Þ
and was approximated in terms of � by Van Genuchten[1980], using the Mualem [1976] water retention model, as:
D �ð Þ ¼ 1� mð ÞKs
�m �s � �rð Þ�1=2�1=m 1��1=m
� ��mhþ 1��1=m� �m
� 2i ð9Þ
[14] It should be noted that using the Mualem [1976]model allows for estimation of the parameter m using themore commonly referenced parameter n through the rela-tionship m ¼ 1� 1=n. By combining equations (7) and (9),sorptivity can be expressed for a soil with any initial watercontent as
S2 ¼ Ks �s � �rð Þ 1� mð Þ�m
Z�f
�0
�f þ�� 2�0
� �
�1=2�1=m 1��1=m� ��m
þ 1��1=m� �m
� 2h i
d�
ð10Þ
[15] For positive (ponded) pressure head [Haverkampet al., 1990], (10) can be modified as
S2 ¼ Ks �s � �rð Þ 2hsurf 1��0ð Þ þ 1� mð Þ�m
Z1
�0
1þ�� 2�0ð Þ
8><>:
�1=2�1=m 1��1=m� ��mh
þ 1��1=m� �m
� 2id�
)
ð11Þ[16] Equations (10) and (11) allow for accurate quantifi-
cation of sorptivity throughout the soil moisture range. We
STEWART ET AL.: EFFECT OF INITIAL SOIL MOISTURE ON SORPTIVITY & INFILTRATION
7038

are now able to express the wetting front potential as afunction of initial degree of saturation by equating equa-tions (11) with (4) and then solving for hwf:
hwf ¼ hsurf ’� 1ð Þ þ 1� mð Þ’2�m 1��0ð Þ
Z1
�0
1þ�� 2�0ð Þ
0B@
�1=2�1=m 1��1=m� ��m
þ 1��1=m� �m
� 2h i
d�
! ð12Þ
[17] As an alternate approach, equations (10) and (11)can also be expressed in terms of the Van Genuchten[1980] equation based on the Burdine [1953] water reten-tion model as
S2 ¼ Ks �s � �rð Þ 1� mð Þ2�m
Z�f
�0
�f þ�� 2�0
� �
�3m�1
2 1��1=m� ��m�1
2 � 1��1=m� �m�1
2
d�
ð13Þ
or for ponded conditions as
S2 ¼ Ks �s � �rð Þ 2hsurf 1��0ð Þ þ 1� mð Þ2�m
�Z1
�0
1þ�� 2�0ð Þ�3m�12 1��1=m� ��m�1
2 � 1��1=m� �m�1
2
d�
�
ð14Þ
which is subject to the constraint m ¼ 1� 2=n.[18] The van Genuchten-Burdine model has been shown
to be more accurate for fine-textured soils (with low valuesof m) [Fuentes et al., 1992]. However, the van Genuchten-Maulem model enjoys widespread usage, serving as the ba-sis for equation (5) and for numerical simulation modelssuch as HYDRUS-1D [Simunek et al., 2005]. Thus, we willprimarily make use of the sorptivity model based on thevan Genuchten-Maulem parameters [equation (11)]throughout the remainder of our results and discussion.Analysis of the effect of water retention model choice onthe calculation of wetting front potential is included as anAppendix A.
2.2. Nondimensional (Scaled) Sorptivity
[19] Numerous sorptivity solutions exist based on ini-tially dry conditions, where �0¼ 0 [e.g., Brutsaert, 1976].This makes it advantageous to characterize soils in non-
dimensional terms, where a soil’s actual sorptivity is scaledrelative to its maximum (dry) sorptivity. Whereas the non-dimensional forms of equations (11)–(14) require numeri-cal evaluation, Haverkamp et al. [1998] provided ananalytical function for relative sorptivity:
S2
Smax2¼ �s � �0
�s
� �Ks � K0
Ks
� �ð15Þ
where K0 is the initial (unsaturated) hydraulic conductivity.Using the common assumption that �r¼ 0 [Van Genuchtenet al., 1991; Haverkamp et al., 2005; Canone et al., 2008],equation (15) can be rewritten as
S2
Smax2¼ 1��0ð Þ 1� K0
Ks
� �ð16Þ
[20] We now look to the Brooks and Corey [1964]expression for relative hydraulic conductivity
K0
Ks¼ �0
� for h < hcr ð17Þ
where � is a pore size distribution index and hcr is a param-eter commonly associated with the air entry pressure.
[21] Combining equations (16) and (17) gives us:
S2
Smax2¼ 1��0ð Þ 1��0
�ð Þ for h < hcr ð18Þ
3. Results and Discussion
[22] Equations (11) and (12) were integrated numericallyto solve for sorptivity and wetting front potential, respec-tively, over the range 0��0< 1. Table 1 lists the sevensoils analyzed, and their properties. The depth of pondinghsurf was assumed to be 0, which is a typical assumption fora single-ring infiltration test of short duration. The correc-tion factor ’ (used to account for deviations from a sharpwetting front and/or viscous damping effects) was set equalto 1, which corresponds to the Green-Ampt model. Itshould be noted the effect of ’ on sorptivity and wettingfront potential throughout the soil moisture range is beyondthe scope of this work, but merits further exploration.
3.1 The Nature of Wetting Front Potential
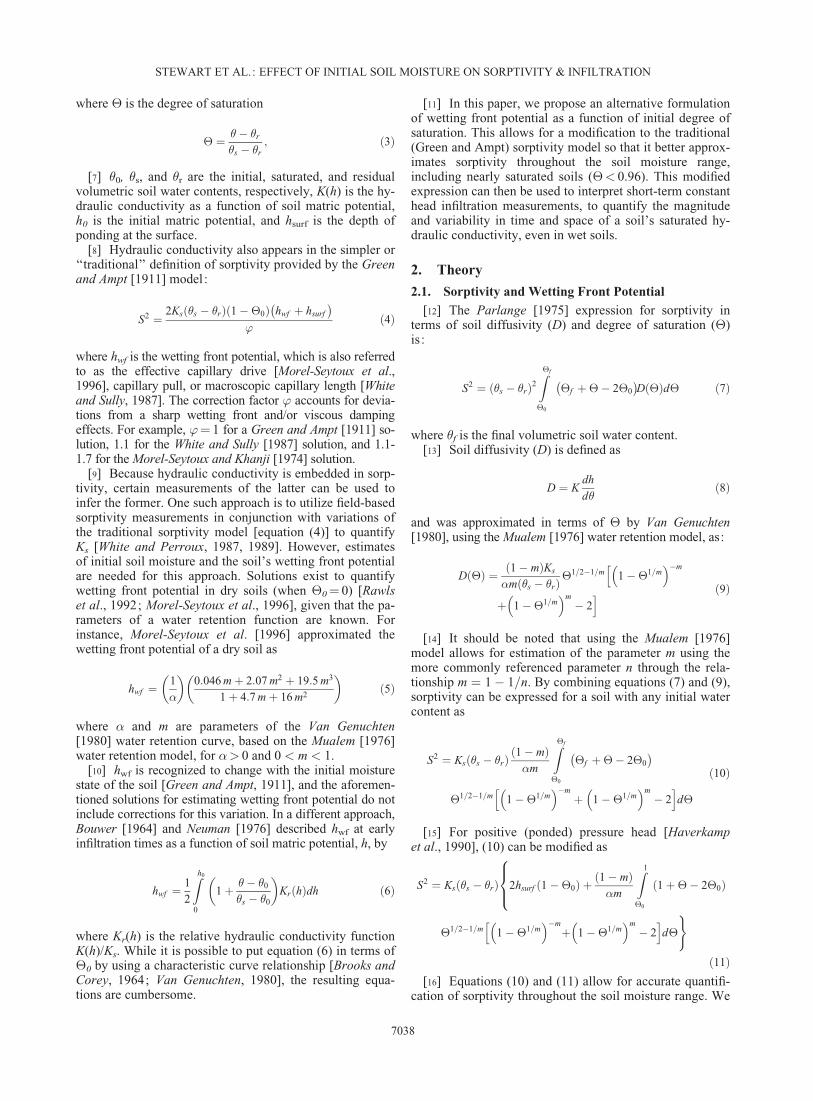
[23] A soil’s wetting front potential diminishes as itsdegree of saturation increases, with different rates ofdecrease between soil types (Figure 1). This results in a
Table 1. Parameters of the Seven Theoretical Soils Used for Comparison (From Fuentes et al. [1992])
Soil �r �s � (cm�1) m n � Ks (cm h�1)
Grenoble Sand 0 0.312 0.0432 0.5096 2.039 4.553 15.37Guelph Loam 0.2183 0.52 0.0115 0.5089 2.036 6.842 1.3167Columbia Silt 0 0.401 0.0176 0.256 1.344 10.29 0.21Yolo Light Clay 0 0.495 0.0324 0.208 1.263 12.64 0.0443Beit Netofa Clay 0.2859 0.4460 0.00202 0.3725 1.594 18.33 0.0034Touchet Silt Loam G.E.3 0.1903 0.4690 0.00505 0.8690 7.634 4.148 12.625Hygiene Sandstone 0.1531 0.2500 0.00793 0.9035 10.363 3.678 4.5
STEWART ET AL.: EFFECT OF INITIAL SOIL MOISTURE ON SORPTIVITY & INFILTRATION
7039
>50% difference in scaled wetting front potential as thesoils neared saturation (�0¼ 0.96). However, at the dryend of the curve (0<�0< 0.5), the scaled wetting frontpotential is nearly constant for the soil types, with adecrease from maximum values of <4% for all soil types.As such, the Morel-Seytoux et al. [1996] approximation(equation (5)) provides a suitable estimate of wetting frontpotential for this range (Table 2).
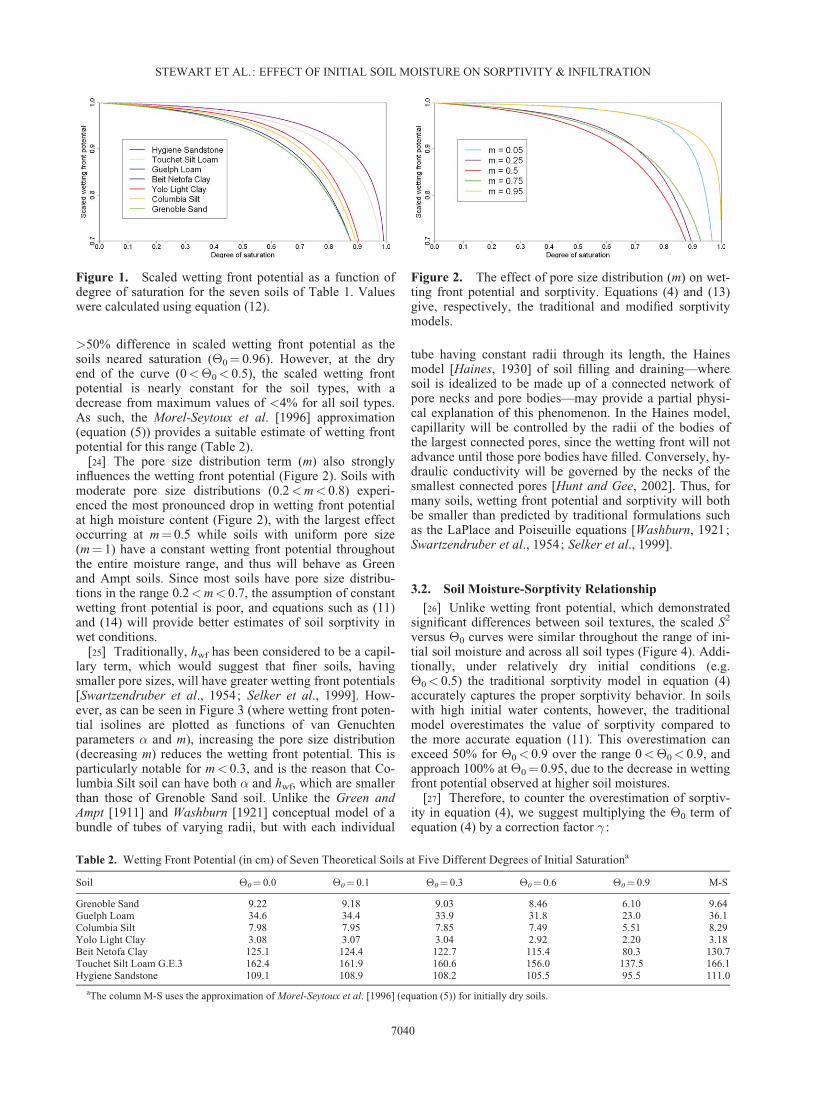
[24] The pore size distribution term (m) also stronglyinfluences the wetting front potential (Figure 2). Soils withmoderate pore size distributions (0.2<m< 0.8) experi-enced the most pronounced drop in wetting front potentialat high moisture content (Figure 2), with the largest effectoccurring at m¼ 0.5 while soils with uniform pore size(m¼ 1) have a constant wetting front potential throughoutthe entire moisture range, and thus will behave as Greenand Ampt soils. Since most soils have pore size distribu-tions in the range 0.2<m< 0.7, the assumption of constantwetting front potential is poor, and equations such as (11)and (14) will provide better estimates of soil sorptivity inwet conditions.
[25] Traditionally, hwf has been considered to be a capil-lary term, which would suggest that finer soils, havingsmaller pore sizes, will have greater wetting front potentials[Swartzendruber et al., 1954; Selker et al., 1999]. How-ever, as can be seen in Figure 3 (where wetting front poten-tial isolines are plotted as functions of van Genuchtenparameters � and m), increasing the pore size distribution(decreasing m) reduces the wetting front potential. This isparticularly notable for m< 0.3, and is the reason that Co-lumbia Silt soil can have both � and hwf, which are smallerthan those of Grenoble Sand soil. Unlike the Green andAmpt [1911] and Washburn [1921] conceptual model of abundle of tubes of varying radii, but with each individual
tube having constant radii through its length, the Hainesmodel [Haines, 1930] of soil filling and draining—wheresoil is idealized to be made up of a connected network ofpore necks and pore bodies—may provide a partial physi-cal explanation of this phenomenon. In the Haines model,capillarity will be controlled by the radii of the bodies ofthe largest connected pores, since the wetting front will notadvance until those pore bodies have filled. Conversely, hy-draulic conductivity will be governed by the necks of thesmallest connected pores [Hunt and Gee, 2002]. Thus, formany soils, wetting front potential and sorptivity will bothbe smaller than predicted by traditional formulations suchas the LaPlace and Poiseuille equations [Washburn, 1921;Swartzendruber et al., 1954; Selker et al., 1999].
3.2. Soil Moisture-Sorptivity Relationship
[26] Unlike wetting front potential, which demonstratedsignificant differences between soil textures, the scaled S2
versus �0 curves were similar throughout the range of ini-tial soil moisture and across all soil types (Figure 4). Addi-tionally, under relatively dry initial conditions (e.g.�0< 0.5) the traditional sorptivity model in equation (4)accurately captures the proper sorptivity behavior. In soilswith high initial water contents, however, the traditionalmodel overestimates the value of sorptivity compared tothe more accurate equation (11). This overestimation canexceed 50% for �0< 0.9 over the range 0<�0< 0.9, andapproach 100% at �0¼ 0.95, due to the decrease in wettingfront potential observed at higher soil moistures.
[27] Therefore, to counter the overestimation of sorptiv-ity in equation (4), we suggest multiplying the �0 term ofequation (4) by a correction factor � :
Figure 1. Scaled wetting front potential as a function ofdegree of saturation for the seven soils of Table 1. Valueswere calculated using equation (12).
Table 2. Wetting Front Potential (in cm) of Seven Theoretical Soils at Five Different Degrees of Initial Saturationa
Soil �0¼ 0.0 �0¼ 0.1 �0¼ 0.3 �0¼ 0.6 �0¼ 0.9 M-S
Grenoble Sand 9.22 9.18 9.03 8.46 6.10 9.64Guelph Loam 34.6 34.4 33.9 31.8 23.0 36.1Columbia Silt 7.98 7.95 7.85 7.49 5.51 8.29Yolo Light Clay 3.08 3.07 3.04 2.92 2.20 3.18Beit Netofa Clay 125.1 124.4 122.7 115.4 80.3 130.7Touchet Silt Loam G.E.3 162.4 161.9 160.6 156.0 137.5 166.1Hygiene Sandstone 109.1 108.9 108.2 105.5 95.5 111.0
aThe column M-S uses the approximation of Morel-Seytoux et al. [1996] (equation (5)) for initially dry soils.
Figure 2. The effect of pore size distribution (m) on wet-ting front potential and sorptivity. Equations (4) and (13)give, respectively, the traditional and modified sorptivitymodels.
STEWART ET AL.: EFFECT OF INITIAL SOIL MOISTURE ON SORPTIVITY & INFILTRATION
7040

S2 ¼ 2Ks �s � �rð Þ 1� ��0ð Þ hwf þ hsurf
� �ð19Þ
or in nondimensional form:
S2
Smax2¼ 1� ��0ð Þ ð20Þ
[28] When, for example, �¼ 1.025, sorptivity estimatesfrom equation (19) differ from those of equation (11) by<20% for all soils over the range 0<�0< 0.9. At�0¼ 0.95 the maximum deviation between equations (11)and (19) approaches 40%, although for most soil types,including the fine-textured silts and clays, the differenceremains at <20% (Figure 4 inset).
3.3. Soil Matric Potential Relationships
[29] S2 was also plotted as a function of the soil matricpotential, h, using the relationship proposed by Van Gen-uchten [1980]:
� ¼ 1
1þ �hð Þn� �m
ð21Þ
[30] The S2 versus h curves vary in scale across soiltypes (Figure 5). Further, as seen in Appendix A, the choiceof water retention model can affect the magnitude of thescaled soil matric potential. Thus, for our application it ispreferable to describe sorptivity using � rather than h.
3.4. Nondimensional (Scaled) Sorptivity
[31] Nondimensional (scaled) sorptivity was comparedfor four of the theoretical soils (Yolo Light Clay, Beit NetofaClay, Guelph Loam and Hygiene Sandstone) using equations(11), (14), (18), and (20). Each model predicted a differentbehavior in wet soil conditions (Figure 6). The vanGenuchten-Maulem [equation (11)] and van Genuchten-Burdine [equation (14)] models had similar curve shapes,
with an offset that increased as the pore size distribution pa-rameter m became smaller. In the case of the Hygiene Sand-stone soil, where m is near 1, the two curves wereindistinguishable.
[32] The modified Haverkamp model [equation (18)],conversely, demonstrated the greatest offset in soils withnear-uniform pore size distributions (high values of m),such as the Hygiene Sandstone. This is likely due to the airentry pressure (hcr) being an important term in these coarse
Figure 3. Wetting front potential isolines (in cm) for ini-tially dry soils as a function of van Genuchten parameters� and m. The seven soils of Table 1 are plotted forreference.
Figure 4. Scaled sorptivity as a function of degree of sat-uration for the seven theoretical soils. The inset highlightsthe wet end of the curve, near saturation. Equation (4)—i.e., the traditional Green-Ampt sorptivity model—andequation (11), i.e., the modified Green-Ampt sorptivitymodel, are also shown.
Figure 5. Scaled sorptivity as a function of scaled soilpotential for the seven theoretical soils. Note that theGuelph Loam and Grenoble Sand soils have nearly identi-cal curves.
STEWART ET AL.: EFFECT OF INITIAL SOIL MOISTURE ON SORPTIVITY & INFILTRATION
7041

soils, and implies that the Brooks and Corey relative hy-draulic conductivity function [equation (17)] may be a poorchoice to predict the sorptivity of coarse soils as they nearsaturation. However, as the pore size distribution becamewider (m becoming smaller), the modified Haverkampmodel predicted scaled sorptivity values which fellbetween the two van Genuchten models. Thus, equation(18) can be considered to be a suitable sorptivity approxi-mation for fine-textured soils (m> 0.4).
[33] Although a simple linear function that is independ-ent of soil type, equation (20) closely approximated thescaled sorptivity predicted by the van Genuchten modelsover the range of soils tested, including the coarse-texturedsoils. Equation (20) therefore represents a suitable approxi-mation for the scaled sorptivity of most real soils, with theadditional advantage of not requiring an estimate of thepore-size distribution index.
4. Application–Determining Saturated HydraulicConductivity From Sorptivity
[34] Sorptivity measurements can be used to quantify hy-draulic conductivity by, for instance, combining equations(5) and (19)
Ks ¼S2�’
�s � �rð Þ 1� ��0ð Þ
� �1þ 4:7mþ 16m2
0:092mþ 4:14m2 þ 39m3
� �ð22Þ
where m is subject to the constraint m ¼ 1� 1=n (i.e., thevan Genuchten-Maulem model).
[35] Equation (22) allows for early-time infiltration data,such as can be obtained with single-ring tests, to be used toestimate Ks. This was verified through numerical simula-tions of one-dimensional horizontal infiltration for five ofthe soils listed in Table 1, at five different initial water con-tents (�0 ¼ 0, 0.1, 0.3, 0.6, and 0.9) using the HYDRUS-1D model. The model domain was 5 m in length, with anode spacing of 0.01 m. The origin boundary condition wasset as �¼ �s and the far boundary was set as no flux. Forearly times, when the water content of the far boundaryvaried by <1%, sorptivity was calculated from the waterflux, i, through the origin by using S ¼ 2i (t0.5). The scalingparameter ’ was assumed to be 1 and � was assumed to be1.025.
[36] Equation (22) predicted the Ks values for all fivesoils under all five initial degrees of saturation (Table 3)with errors under 20%. The error was minimal for the drysoils, ranging from 0.6 to 4.6% for �0¼ 0.1 and 0.3. For
Figure 6. Comparison of scaled sorptivity (S2/S2max) predicted for four theoretical soils in wet condi-tions (degree of saturation �> 0.8). The four lines shown correspond to: equation (11), the vanGenuchten-Maulem model; equation (14), the van Genuchten-Burdine model; equation (18), the modi-fied Haverkamp model; and equation (20), the modified Green-Ampt model.
STEWART ET AL.: EFFECT OF INITIAL SOIL MOISTURE ON SORPTIVITY & INFILTRATION
7042

the wettest soils (�0¼ 0.9), the error increased (rangingfrom 8.1 to 17%), but nevertheless would allow rapid deter-mination of saturated hydraulic conductivity which typi-cally spans an order of magnitude for multiple samples ofthe same soil [Nielsen et al., 1973]. Using a soil specificvalue of ’ could also be used to account for deviations inthe wetting front shape between soils and improve esti-mates of Ks. It should be noted that for the Hygiene Sand-stone soil at �0¼ 0.9, equation (22) overestimated Ks bynearly a factor of two, due to the divergence of the analyti-cal sorptivity solution [equation (11)] and the HYDRUS-1D numerical solution. This can also be seen in Figure 7,which shows sorptivity values predicted by both equation(11) and HYDRUS-1D.
[37] Although equation (22) requires sorptivity and ini-tial degree of saturation to be measured, as well as knowl-edge of soil parameters �s, �r, �, and m, this represents areduction of data needed compared to other methods. Forexample, the Beerkan Method [Braud et al., 2005] requiresestimates of the initial and final volumetric water contents,bulk density, and the final depth of wetting for each infiltra-tion test.
[38] Further, Ks has been shown to exhibit greater spatialvariability than �, m, �r, or �s, with �s and m possessing theleast spatial variability [Mallants et al., 1996]. This signi-
fies that for any single location, the denominator of equa-tion (22) can be constrained using few soil samples relativeto the number of infiltration tests. This in turn makes it pos-sible to use simple infiltration tests (such as the single ringinfiltrometer) to quantify the spatial distribution of Ks in asingle soil type.
5. Application–Sorptivity Isolines
[39] A practical application of equations (11), (13), (18),and/or (20) is to generate theoretical sorptivity isolinesagainst which to compare sorptivity estimates taken at vari-ous initial soil moisture contents. Deviations from theory insoil properties under different moisture contents couldpoint to hysteresis in properties of a rigid soil, while inswelling soils this could be used to examine the variabilityof the effective hydraulic conductivity.
[40] To demonstrate the application of these methods, aset of single-ring infiltration experiments were conductedmonthly from September 2011 to March 2013 near Corval-lis, Oregon. Measurements were taken at 12 points within a2 � 3 m open field area, with native pasture cover. The soilwas identified as a Waldo silty clay loam (fine, smectitic,mesic Fluvaquentic Vertic Endoaquoll), with moderate tohigh shrink-swell potential [Knezevich, 1975]; 0.09 m di-ameter rings were installed to 0.01 m depth. The small di-ameter of the rings allowed them to be placed away fromlarge surface-connected cracks and thereby infiltratethrough the soil matrix. Up to 1 L of water (with a mini-mum of 0.4 L) was added to each ring in 0.1 L increments,and the time between the 0.1 L pours were recorded.
[41] Sorptivity was estimated using the early-timeapproximation for the first 0.4 L, where S¼ I(t�0.5) [Whiteet al., 1992], and is presented as a mean and standard devi-ation of all 12 points on a single date. Due to the short du-ration of the infiltration tests (lasting from >1 to �20 minin dry conditions and >1�4 h in wet conditions), it wasassumed that material swelling was not significant and thatthe early time approximation was valid.
[42] Mean initial degree of saturation was determinedfrom six soil cores taken within the grid on each samplingdate, and was calculated for each sample by dividing themoisture ratio, #, by the void ratio, e.
�0 ¼#
e¼ Vw=Vs
Vv=Vs
� �¼ Vw
Vv¼
m0-mdry
� �=�w
V0- mdry=�s
� � !
ð23Þ
where Vw is the volume of water; Vs the volume of solids;Vv the volume of voids; m0 the mass; mdry the mass after24 h drying at 105�C; �w the density of water; V0 the origi-nal volume; and �s the density of the solids (assumed to be2.67 g cm�3).
[43] The initial measurements were taken in relativelydry soils. It was observed that as the soils wetted the appa-rent saturated hydraulic conductivity decreased, to �50%of the original (Figure 8). As the soil redried hysteresis wasobserved, with the effective saturated hydraulic conductiv-ity 2.5 greater than the original value, even at similar initialdegrees of saturation. This was likely due to hysteretic soilshrinkage, including opening of new cracks within thesingle-ring sampling areas. While more information about
Table 3. Saturated Hydraulic Conductivities (Ks) Used as InputParameters, Versus Those Calculated by Equation (13), for FourDifferent Initial Degrees of Saturation (Units Are in cm h�1)a
Material Ks Actual
Ks Calculated–Equation (13)
�0¼ 0.1 �0¼ 0.3 �0¼ 0.6 �0¼ 0.9
Grenoble Sand 15.4 15.0 15.1 14.6 12.8Guelph Loam 1.32 1.29 1.31 1.27 1.21Columbia Silt 0.210 0.203 0.201 0.200 0.180Yolo Light Clay 0.0443 0.0439 0.0423 0.0414 0.0388Hygiene Sandstone 4.5 4.4 4.4 4.5 7.5
aAbsolute error ranged from �2% for dry soils to 17% for infiltrationinto wet sand. The solution poorly estimated the hydraulic conductivity forHygiene Sandstone at �0¼ 0.9, because of divergence in the sorptivity ascalculated by HYDRUS-1D and by equation (9).
Figure 7. Sorptivity versus initial degree of saturation forfive of the theoretical soils. The lines are calculated usingequation (9), while the points are based on HYDRUS-1Dsimulations.
STEWART ET AL.: EFFECT OF INITIAL SOIL MOISTURE ON SORPTIVITY & INFILTRATION
7043

the soil parameters would be needed to use equation (22),the isolines generated by equations (11), (14), (18), or (20)are useful for identifying qualitative shifts in soil proper-ties, and in this example demonstrated that the effectivesaturated hydraulic conductivity of a cracking soil was nei-ther constant nor unique as the soils wetted and dried.
6. Summary and Conclusions
[44] Sorptivity can be calculated by use of a diffusivityfunction, such as the Parlange [1975] formulation, or byuse of a combination of conductivity and capillarity terms,such as the Green and Ampt [1911] sorptivity model.Equating these two formulae allowed exploration of thecapillarity (as wetting front potential) term in Green andAmpt-type models as a function of initial soil moisture andthe water retention function [Van Genuchten, 1980]. It wasdetermined that a soil’s pore size distribution greatly influ-enced both the magnitude of the wetting front potentialterm, as well as the rate at which the wetting front potentialdecreased as soil moisture increased. For instance, soilswith wide pore size distributions had diminished wettingfront potentials relative to soils with more uniform poresizes, whereas soils with moderate pore size distributionsexperienced the most rapid decrease in wetting front poten-tial at higher water contents. However, the variability inwetting front potential characteristics had little influence onsorptivity, as it was determined that the relationshipbetween sorptivity and initial degree of saturation could bepredicted nearly independent of soil type. This observationallowed for calculation of sorptivity even in wet soils, and
permitted a minor linear correction to the traditional (i.e.,Green-Ampt) model of sorptivity to improve its accuracythroughout the entire range of soil moisture.
[45] The modified Green-Ampt model was comparedwith the Parlange [1975] and Haverkamp et al. [1998]expressions, where the latter was modified through inclu-sion of the Brooks and Corey [1964] relative hydraulic con-ductivity expression. Sorptivity predicted by the modifiedGreen-Ampt model was accurate for the soil moisturerange 0��< 0.96, while the modified Haverkamp expres-sion covered the entire moisture range, though with a diver-gent behavior in coarse soils such as sand (likely due tolimitations of the Brooks and Corey expression). Since thesorptivity of wet soils can be difficult to accurately mea-sure, these expressions should prove useful for modelinginfiltration and flow in such conditions.
[46] These results also allow determination of saturatedhydraulic conductivity from simple single ring infiltrationtests, requiring only an estimate of the initial degree of sat-uration and the soil’s water retention curve parameters.This represents a simplification of standard methods forinterpreting such infiltration tests, and the solution is valideven for wet soils, provided a satisfactory measurement ofthe soil sorptivity can be made in such conditions. The for-mulae proposed in this study are particularly useful forfine-textured soils due to their tendency to retain moisture(and therefore have non-zero initial water contents) and tobe restrictive to flow (making it difficult to attain thesteady-state conditions necessary to utilize many infiltra-tion models).
[47] Altogether, the findings presented here enable us tomonitor changes in soil properties such as can occur duringwetting and drying, to examine rainfall-runoff relationshipsin wet soils, and to better quantify and predict water move-ment in many soil types.
Appendix A: Water Retention Model Influence onPredicted Wetting Front Potential
[48] Van Genuchten [1980] described soil diffusivity, D,using two different water retention models. The first, basedon the work of Mualem [1976], allows for diffusivity to bewritten as:
D �ð Þ¼ 1�mð ÞKs
�m �s��rð Þ�1=2�1=m 1��1=m
� ��mþ 1��1=m� �m
�2h i
ð24Þ
which, when combined with the Parlange [1975] andGreen and Ampt [1911] sorptivity models, allows for wet-ting front potential to be expressed as:
hwf ¼ hsurf ’� 1ð Þ þ 1� mð Þ’2�m 1��0ð Þ
Z1
�0
1þ�� 2�0ð Þ
0B@
�1=2�1=m 1��1=m� ��m
þ 1��1=m� �m
� 2h i
d�� ð25Þ
where m can be related to the more commonly referencedparameter n by m ¼ 1� 1=n.
Figure 8. Sorptivity isolines based on the relationshipbetween sorptivity and initial degree of saturation (usingequation (10) and assuming hsurf¼ 0). The isolines repre-sent the expected sorptivity of a soil with a constant satu-rated hydraulic conductivity. The field data come from asoil with vertic (shrink-swell) properties, which has varyingeffective hydraulic conductivity (Keff) as macropores openand close. Sorptivity was estimated using the early timeapproximation of White et al. [1992]. The arrows indicatechronological progression of estimates sorptivity taken atdifferent times of the year (resulting in different initial soilmoisture contents).
STEWART ET AL.: EFFECT OF INITIAL SOIL MOISTURE ON SORPTIVITY & INFILTRATION
7044
[49] The second water retention model, based on the workof Burdine [1953], enables diffusivity to be expressed as:
D �ð Þ ¼ 1� mð ÞKs
2�m �s � �rð Þ�3m�1
2 1��1=m� ��m�1
2 � 1��1=m� �m�1
2
ð26Þ
which in turn provides the following expression for wettingfront potential :
hwf ¼ hsurf ’� 1ð Þ þ 1� mð Þ’4�m 1��0ð Þ
Z1
�0
1þ�� 2�0ð Þ
0B@
�3m�1
2 1��1=m� ��m�1
2 � 1��1=m� �m�1
2
d�
� ð27Þ
where m can be related to the more commonly referencedparameter n by m ¼ 1� 2=n.
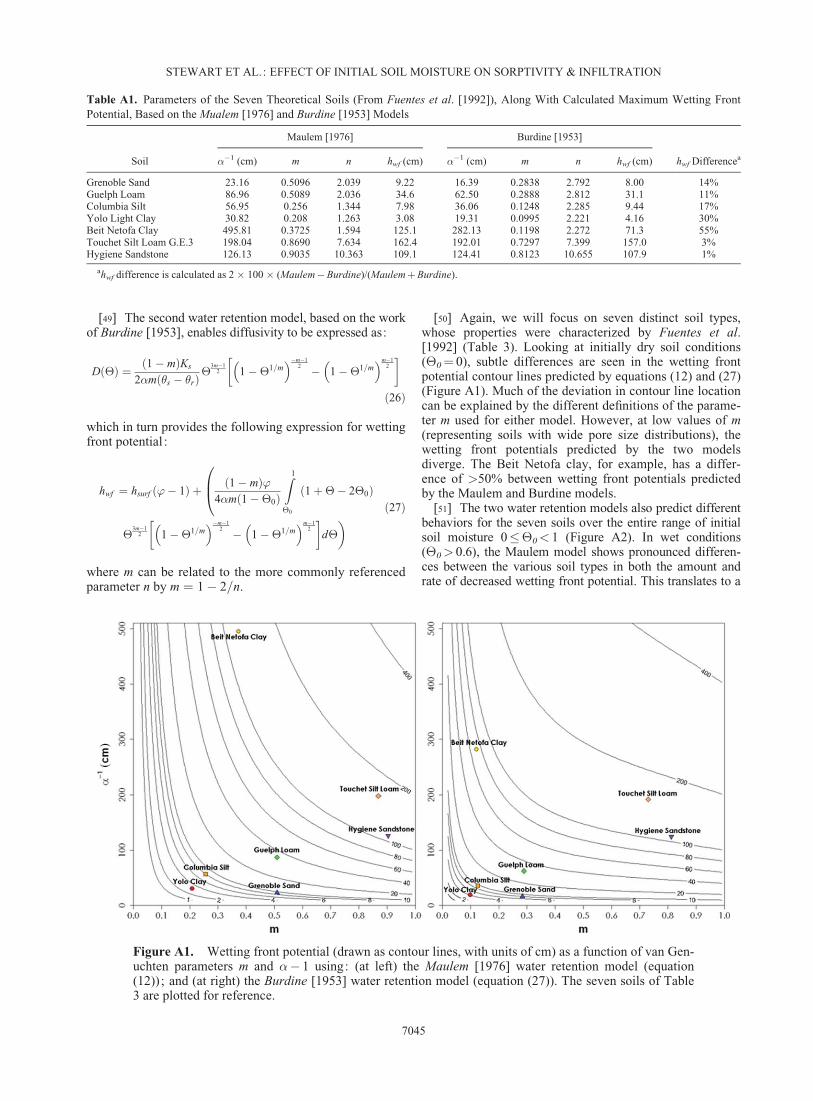
[50] Again, we will focus on seven distinct soil types,whose properties were characterized by Fuentes et al.[1992] (Table 3). Looking at initially dry soil conditions(�0¼ 0), subtle differences are seen in the wetting frontpotential contour lines predicted by equations (12) and (27)(Figure A1). Much of the deviation in contour line locationcan be explained by the different definitions of the parame-ter m used for either model. However, at low values of m(representing soils with wide pore size distributions), thewetting front potentials predicted by the two modelsdiverge. The Beit Netofa clay, for example, has a differ-ence of >50% between wetting front potentials predictedby the Maulem and Burdine models.
[51] The two water retention models also predict differentbehaviors for the seven soils over the entire range of initialsoil moisture 0��0< 1 (Figure A2). In wet conditions(�0> 0.6), the Maulem model shows pronounced differen-ces between the various soil types in both the amount andrate of decreased wetting front potential. This translates to a
Figure A1. Wetting front potential (drawn as contour lines, with units of cm) as a function of van Gen-uchten parameters m and �� 1 using: (at left) the Maulem [1976] water retention model (equation(12)) ; and (at right) the Burdine [1953] water retention model (equation (27)). The seven soils of Table3 are plotted for reference.
Table A1. Parameters of the Seven Theoretical Soils (From Fuentes et al. [1992]), Along With Calculated Maximum Wetting FrontPotential, Based on the Mualem [1976] and Burdine [1953] Models
Soil
Maulem [1976] Burdine [1953]
hwf Differencea��1 (cm) m n hwf (cm) ��1 (cm) m n hwf (cm)
Grenoble Sand 23.16 0.5096 2.039 9.22 16.39 0.2838 2.792 8.00 14%Guelph Loam 86.96 0.5089 2.036 34.6 62.50 0.2888 2.812 31.1 11%Columbia Silt 56.95 0.256 1.344 7.98 36.06 0.1248 2.285 9.44 17%Yolo Light Clay 30.82 0.208 1.263 3.08 19.31 0.0995 2.221 4.16 30%Beit Netofa Clay 495.81 0.3725 1.594 125.1 282.13 0.1198 2.272 71.3 55%Touchet Silt Loam G.E.3 198.04 0.8690 7.634 162.4 192.01 0.7297 7.399 157.0 3%Hygiene Sandstone 126.13 0.9035 10.363 109.1 124.41 0.8123 10.655 107.9 1%
ahwf difference is calculated as 2 � 100 � (Maulem�Burdine)/(MaulemþBurdine).
STEWART ET AL.: EFFECT OF INITIAL SOIL MOISTURE ON SORPTIVITY & INFILTRATION
7045

maximum difference between soil types of 30% at �0¼ 0.9and 45% at �0¼ 0.95. The Burdine model predicts a moreuniform response between soil types, with a maximum devi-ation approximately one-half that of the Maulem model(14% at �0¼ 0.9 and 24% at �0¼ 0.95). Thus, the Burdinewater retention model may be more amenable to creationand usage of a single-parameter function, which predicts thescaled wetting front potential independent of soil type.
[52] In summary, the predicted magnitude and moisture-dependent behavior of wetting front potential differbetween the Maulem and Burdine water retention models.For most soils and practical purposes, the difference will benegligible and either model should suffice. For fine-textured soils with wide pore size distributions (low valuesof m), however, the models begin to diverge, which canhave significant consequences on predicted wetting frontpotential. The van Genuchten-Burdine retention model haspreviously been demonstrated to be more accurate in soilswith low m values [Fuentes et al., 1992], while the vanGenuchten-Maulem retention model has previously beenmore widely used, resulting in a number of relevant andpractical applications. We will leave it to the reader, then,to decide which model to employ based on his/her specificintent and desired outcome.
[53] Acknowledgments. This work has been supported underNational Science Foundation award 0943682. The authors would like tothank the anonymous reviewers who provided helpful feedback andimproved the quality and scope of this manuscript.
ReferencesBouwer, H. (1964), Unsaturated flow in ground-water hydraulics, J. Hydr.
Div., Proc. Am. Soc. Civil Eng., 90(HY5), 121–144.
Braud, I., D. De Condappa, J. M. Soria, R. Haverkamp, R. Angulo-Jara-millo, S. Galle, and M. Vauclin (2005), Use of scaled forms of the
infiltration equation for the estimation of unsaturated soil hydraulic prop-erties (the Beerkan method), Eur. J. Soil Sci., 56(3), 361–374.
Brooks, R. H. and A. T. Corey (1964), Hydraulic properties of porousmedia, Hydrology Papers, Colorado State University.
Burdine, N. (1953), Relative permeability calculations from pore size distri-bution data, Trans. Am. Inst. Min. Metall. Eng., 5(3), 71–78.
Brutsaert, W. (1976), The concise formulation of diffusive sorption ofwater in a dry soil, Water Resour. Res., 12(6), 1118–1124.
Brutsaert, W. (1977), Vertical infiltration in dry soil, Water Resour. Res.,13(2), 363–368.
Canone, D., S. Ferraris, G. Sander, and R. Haverkamp (2008), Interpretationof water retention field measurements in relation to hysteresis phenomena,Water Resour. Res., 44, W00D12, doi:10.1029/2008WR007068.
Fuentes, C., R. Haverkamp, and J. Y. Parlange (1992), Parameter con-straints on closed-form soilwater relationships, J. Hydrol., 134(1), 117–142.
Green, W. H. and G. Ampt (1911), Studies on soil physics, J. Agric. Sci.,4(1), 1–24.
Haines, W. B. (1930), Studies in the physical properties of soil. V. The hys-teresis effect in capillary properties, and the modes of moisture distribu-tion associated therewith, J. Agric. Sci., 20(01), 97–116.
Haverkamp, R., J.-Y. Parlange, J. Starr, G. Schmitz, and C. Fuentes (1990),Infiltration under ponded conditions: 3. A predictive equation based onphysical parameters, Soil Sci., 149(5), 292–300.
Haverkamp, R., P. Ross, K. Smettem, and J. Parlange (1994), Three-dimen-sional analysis of infiltration from the disc infiltrometer: 2. Physicallybased infiltration equation, Water Resour. Res., 30(11), 2931–2935.
Haverkamp, R., F. Bouraoui, C. Zammit, and R. Angulo-Jaramillo (1998),Soil properties and moisture movement in the unsaturated zone, in Hand-book of Groundwater Engineering, edited by J. Delleur, CRC Press,Boca Raton, Florida.
Haverkamp, R., F. J. Leij, C. Fuentes, A. Sciortino, and P. Ross (2005), Soilwater retention I: Introduction of a shape index, Soil Sci. Soc. Am. J.,69(6), 1881–1890.
Hunt, A. G. and G. W. Gee (2002), Application of critical path analysis tofractal porous media: Comparison with examples from the Hanford site,Adv. Water Resour., 25(2), 129–146.
Knezevich, C.A. (1975), Soil Survey of Benton County Area, Oregon, USSoil Conservation Service.
Mallants, D., B. P. Mohanty, D. Jacques, and J. Feyen (1996), Spatial vari-ability of hydraulic properties in a multi-layered soil profile, Soil Sci.,161(3), 167.
Morel-Seytoux, H. J. and J. Khanji (1974), Derivation of an equation ofinfiltration, Water Resour. Res., 10(4), 795–800.
Morel-Seytoux, H. J., P. D. Meyer, M. Nachabe, J. Touma, M. T. van Gen-uchten, and R. J. Lenhard (1996), Parameter equivalence for the Brooks-Corey and van Genuchten soil characteristics: Preserving the effectivecapillary drive, Water Resour. Res., 32(5), 1251–1258.
Mualem, Y. (1976), A new model for predicting the hydraulic conductivityof unsaturated porous media, Water Resour. Res., 12(3), 513–522.
Neuman, S. P. (1976), Wetting front pressure head in the infiltration modelof Green and Ampt, Water Resour. Res., 12(3), 564–566.
Nielsen, D. R., J. W. Biggar, and K. T. Erh (1973), Spatial variability offield-measured soil-water properties, Hilgardia, 42, 215–259.
Parlange, J. Y. (1975), On solving the flow equation in unsaturated soils byoptimization: Horizontal infiltration, Soil Sci. Soc. Am. J., 39(3), 415–418.
Philip, J. R. (1957a), The theory of infiltration: 2. The profile of infinity,Soil Sci., 83(6), 435.
Philip, J. R. (1957b), The theory of infiltration: 4. Sorptivity and algebraicinfiltration equations, Soil Sci., 84(3), 257.
Philip, J. R. (1990), Inverse solution for one-dimensional infiltration, andthe ratio a/K1, Water Resour. Res., 26(9), 2023–2027.
Rawls, W. J., L. R. Ahuja, D. L. Brakensiek, A. Shirmohammadi, and D.Maidment (1992), Infiltration and Soil Water Movement, McGraw-HillInc., N. Y.
Selker, J. S., C. K. Keller, and J. T. McCord (1999), Vadose Zone Proc-esses, 339 pp., Lewis Publishers, Boca Raton, Fla.
Simunek, J., M. T. Van Genuchten, and M. Sejna (2005), The HYDRUS-1D software package for simulating the one-dimensional movement ofwater, heat, and multiple solutes in variably-saturated media, Res. Rep.240, Univ. of Calif., Riverside, Calif.
Smettem, K. R., P. Ross, R. Haverkamp, and J. Y. Parlange (1995), Three-dimensional analysis of infiltration from the disk infiltrometer: 3. Param-eter estimation using a double-disk tension infiltrometer, Water Resour.Res., 31(10), 2491–2495.
Figure A2. Scaled wetting front potential as a function ofdegree of saturation for the seven soils of Table A1.
STEWART ET AL.: EFFECT OF INITIAL SOIL MOISTURE ON SORPTIVITY & INFILTRATION
7046

Smiles, D. and J. Knight (1976), A note on the use of the Philip infiltrationequation, Soil Res., 14(1), 103–108.
Swartzendruber, D., M. F. De Boodt, and D. Kirkham (1954), Capillaryintake rate of water and soil structure, Soil Sci. Soc. Am. J., 18(1), 1–7.
Touma, J., M. Voltz, and J. Albergel (2007), Determining soil saturated hy-draulic conductivity and sorptivity from single ring infiltration tests, Eur.J. Soil Sci., 58(1), 229–238.
Van Genuchten, M. T. (1980), A closed-form equation for predicting thehydraulic conductivity of unsaturated soils, Soil Sci. Soc. Am. J., 44(5),892–898.
Van Genuchten, M. T., F. Leij, and S. Yates (1991), The RETC code forquantifying the hydraulic functions of unsaturated soils. Tech. ReportEPA/600/2–91/065, US Environment Protection Agency.
Vandervaere, J. P., M. Vauclin, and D. E. Elrick (2000), Transient flowfrom tension infiltrometers: I. The Two-Parameter Equation, Soil Sci.Soc. Am. J., 64(4), 1263–1272.
Washburn, E. W. (1921), The dynamics of capillary flow, Phys. Rev., 17(3),273–283.
White, I. and K. Perroux (1987), Use of sorptivity to determine field soil hy-draulic properties, Soil Sci. Soc. Am. J., 51(5), 1093–1101.
White, I. and K. Perroux (1989), Estimation of unsaturated hydraulic conduc-tivity from field sorptivity measurements, Soil Sci. Soc. Am. J., 53, 324–329.
White, I. and M. Sully (1987), Macroscopic and microscopic capillarylength and time scales from field infiltration, Water Resour. Res., 23(8),1514–1522.
White, I., M. Sully, and K. Perroux (1992), Measurement of surface-soil hy-draulic properties: Disk permeameters, tension infiltrometers, and othertechniques, in Advances in Measurement of Soil Physical Properties:Bringing Theory into Practice, pp. 69–103, Soil Science Society ofAmerica, Madison, Wis.
Wooding, R. (1968), Steady infiltration from a shallow circular pond, WaterResour. Res., 4, 1259–1273.
STEWART ET AL.: EFFECT OF INITIAL SOIL MOISTURE ON SORPTIVITY & INFILTRATION
7047